Embed Size (px)
Citation preview
“Assessing Costs and Benefits of Adaptation: Methods and Data”First Regional Training Workshop – Capacity Building Programme on the Economics of Adaptation
Bangkok, Thailand
11 Mar - 14 Mar 2013
Brian H. Hurd, PhD, ProfessorDept. of Agricultural Economics & Agricultural BusinessNew Mexico State University bhurd @ nmsu.edu http://agecon.nmsu.edu/bhurd
• Case #1: Colorado River• Case #2: Rio Grande
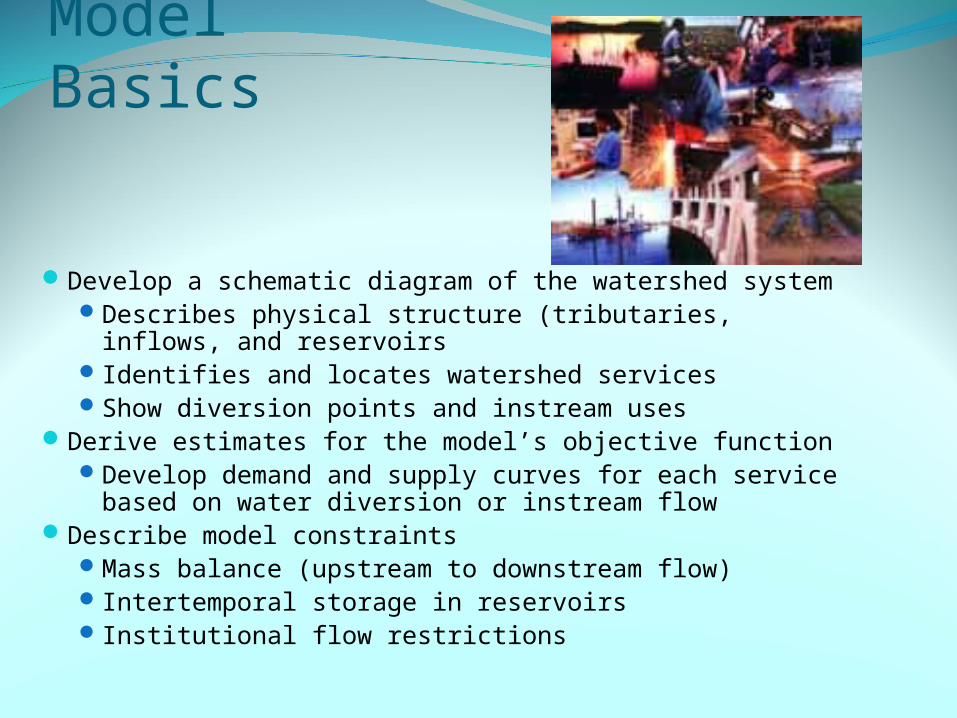
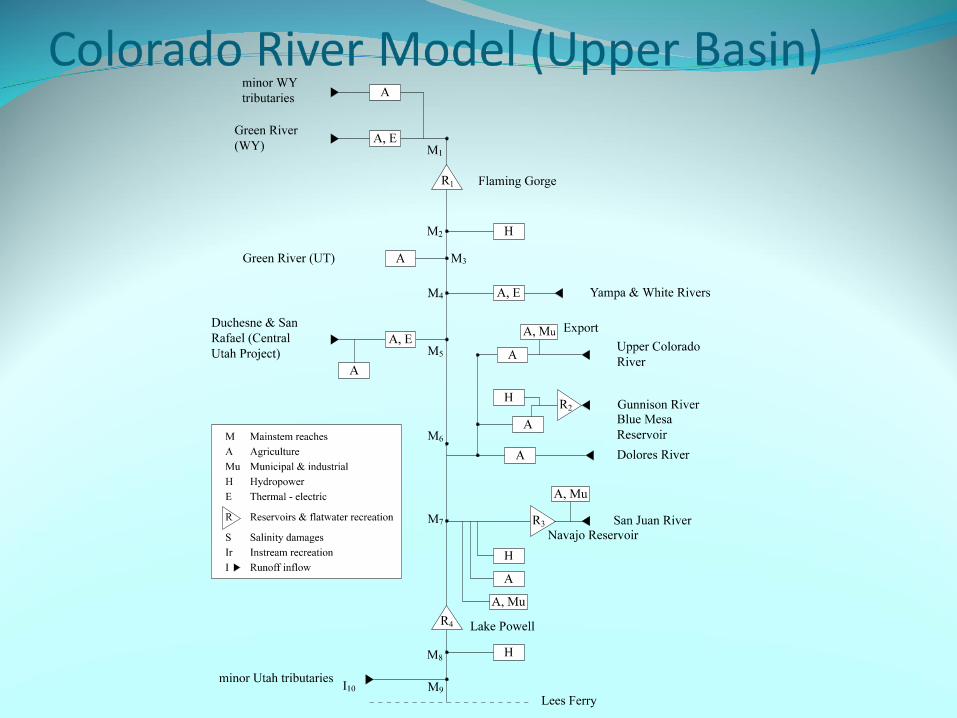
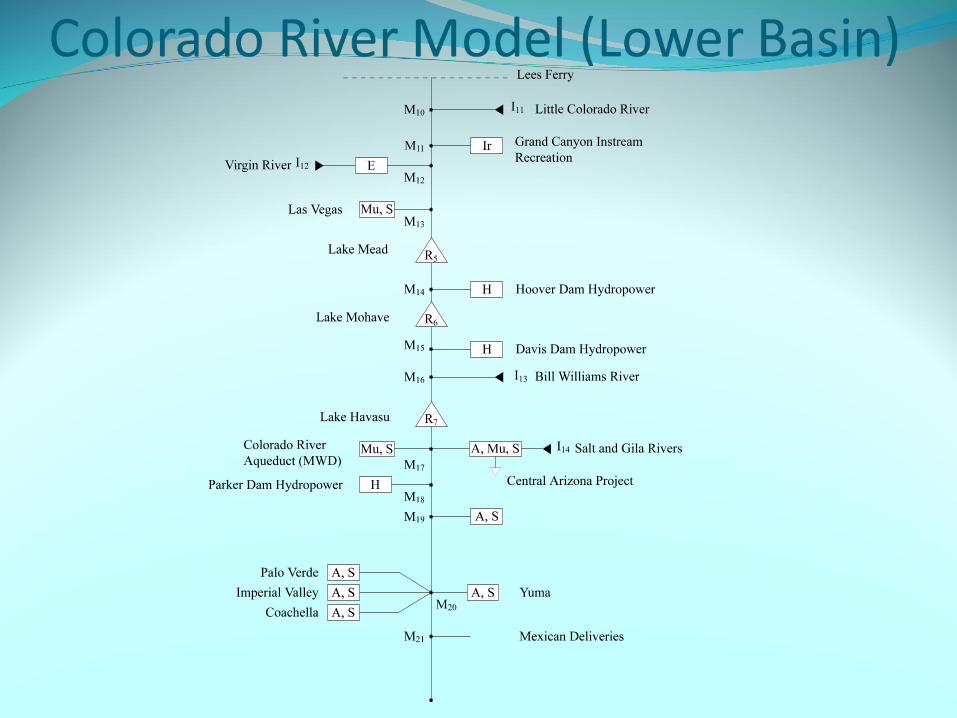
Model Basics
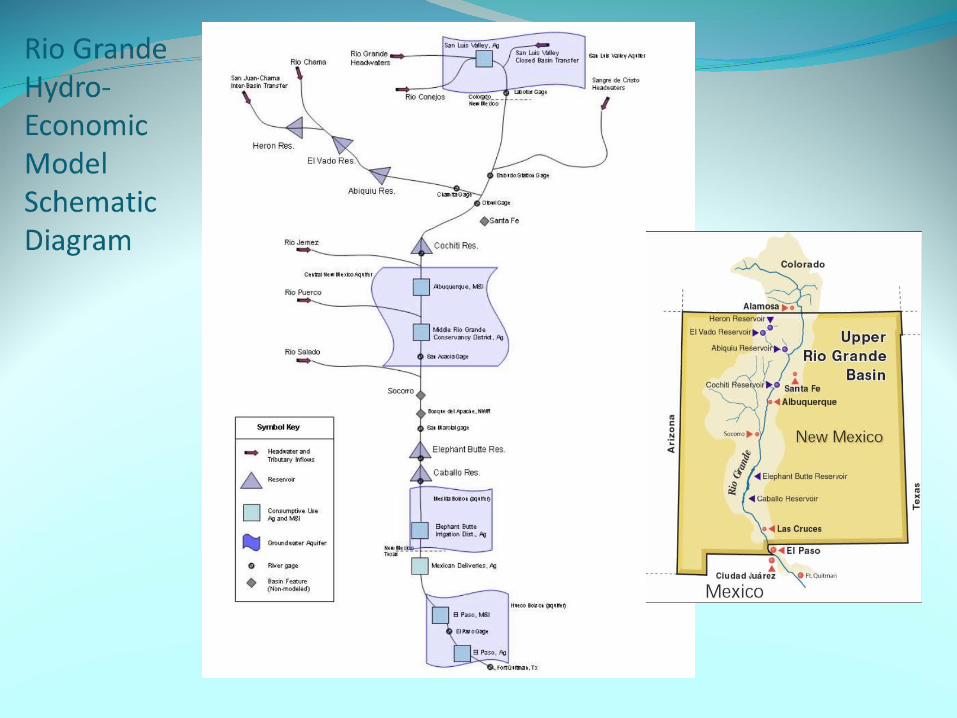
Develop a schematic diagram of the watershed systemDescribes physical structure (tributaries, inflows,
and reservoirsIdentifies and locates watershed services Show diversion points and instream uses
Derive estimates for the model’s objective functionDevelop demand and supply curves for each
service based on water diversion or instream flowDescribe model constraints
Mass balance (upstream to downstream flow)Intertemporal storage in reservoirsInstitutional flow restrictions
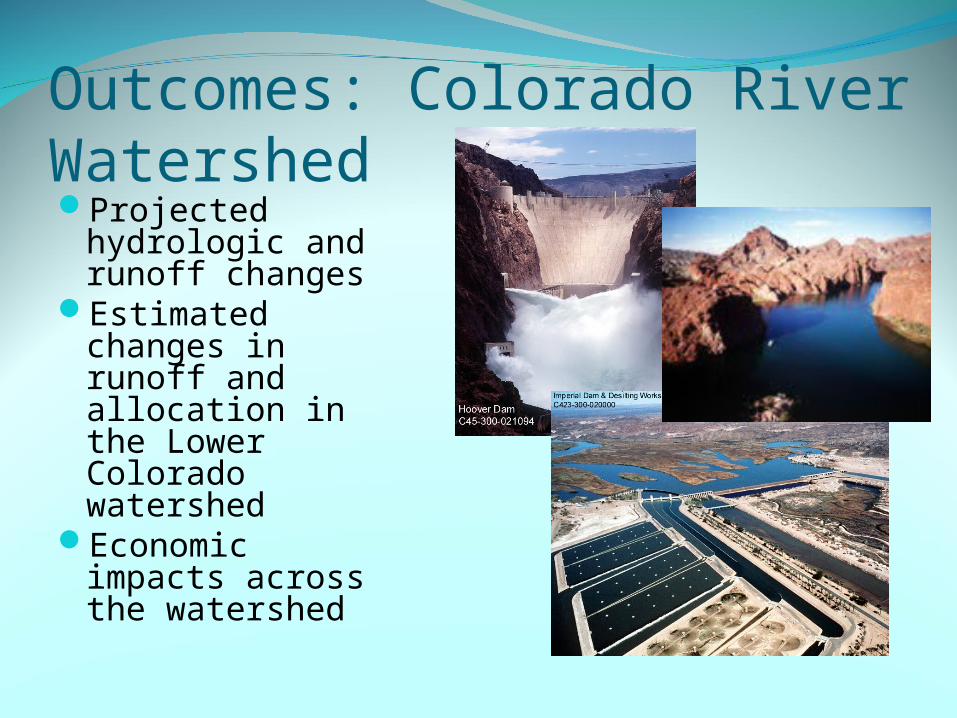
Outcomes: Colorado River WatershedProjected
hydrologic and runoff changes
Estimated changes in runoff and allocation in the Lower Colorado watershed
Economic impacts across the watershed

Runoff Agriculture M&I
0%
20%
40%
-20%
-40%
-60%
Pe
rce
nta
ge
Ch
an
ge
fro
mB
as
elin
e C
lima
te
[+1.5C +15%P]
[+2.5C +7%P]
[+5.0C]

RunoffTotal
AgricultureHydropower
Salinity Damage
0%
50%
100%
-50%
-100%
-150%
Pe
rce
nta
ge
Ch
an
ge
fro
mB
as
elin
e C
lima
te
[+1.5C +15%P]
[+2.5C +7%P]
[+5.0C]
Effect of Climate Change on Agricultural Welfare
Colorado Missouri Delaware A-F-C
Modeled Basins
0%
10%
20%
-10%
-20%
-30%
-40%
-50%
Pe
rce
nta
ge
Ch
an
ge
fro
mB
as
elin
e C
lima
te
[+1.5C +15%P]
[+2.5C +7%P]
[+5.0C]
Effect of Climate Change on Value of Hydropower Production
Colorado Missouri Delaware A-F-C
Modeled Basins
0%
20%
40%
-20%
-40%
-60%
-80%
Pe
rce
nta
ge
Ch
an
ge
fro
mB
as
elin
e C
lim
ate
[+1.5C +15%P]
[+2.5C +7%P]
[+5.0C]
Effect of Climate Change on Total Welfare
Colorado Missouri Delaware A-F-C
Modeled Basins
0%
5%
-5%
-10%
-15%
-20%
-25%
Pe
rce
nta
ge
Ch
an
ge
fro
mB
as
elin
e C
lima
te
[+1.5C +15%P]
[+2.5C +7%P]
[+5.0C]
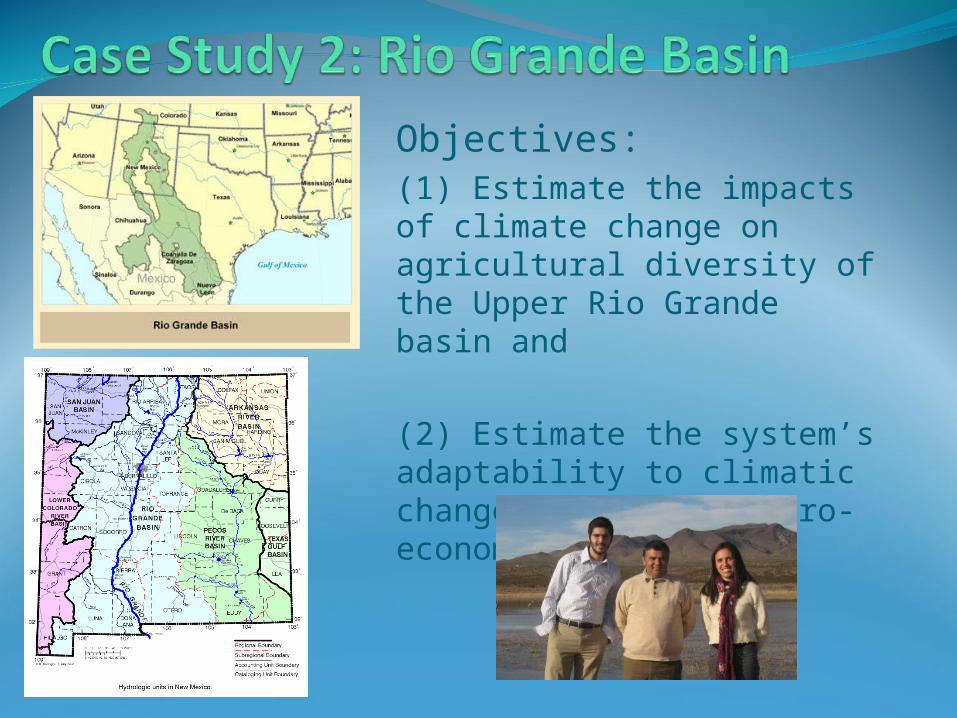
Objectives:(1) Estimate the impacts of climate change on agricultural diversity of the Upper Rio Grande basin and
(2) Estimate the system’s adaptability to climatic changes through a hydro-economic framework.
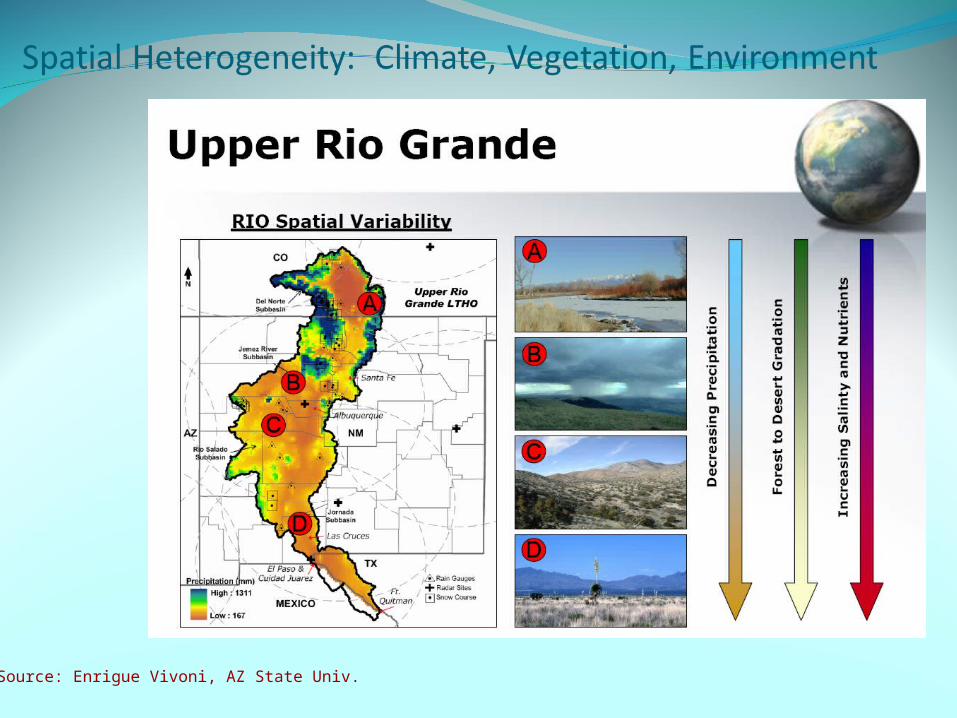
Source: Enrigue Vivoni, AZ State Univ.
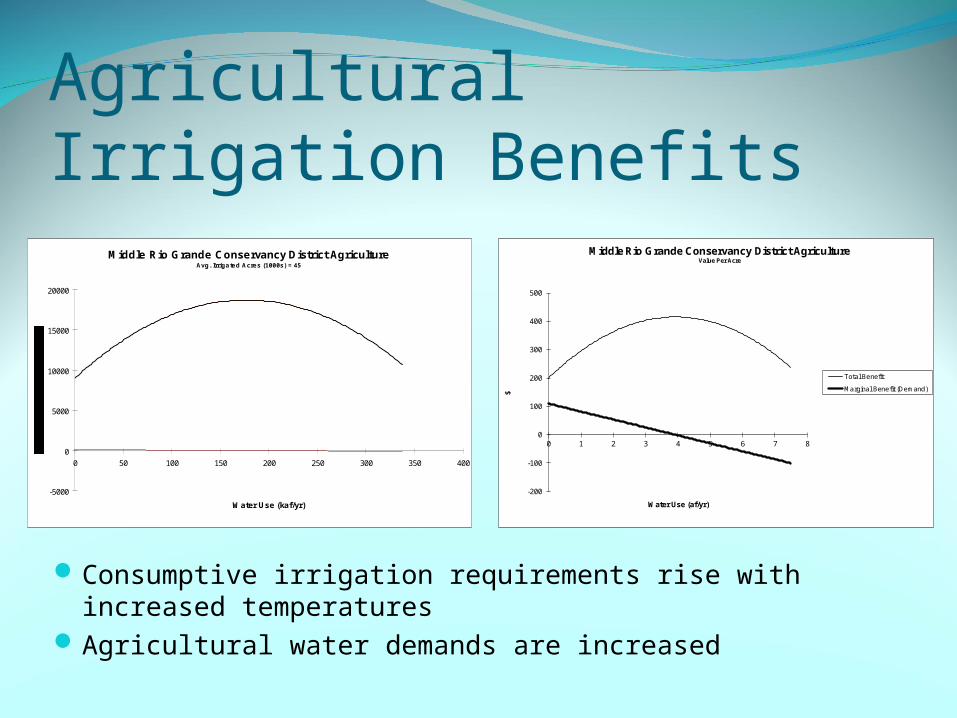
Agricultural Irrigation BenefitsMiddle Rio Grande Conservancy District Agriculture
Avg. Irrigated Acres (1000s) = 45
-5000
0
5000
10000
15000
20000
0 50 100 150 200 250 300 350 400
Water Use (kaf/yr)
-200
-100
0
100
200
300
400
500
0 1 2 3 4 5 6 7 8
$ Water Use (af/yr)
Middle Rio Grande Conservancy District AgricultureValue Per Acre
Total Benefit
Marginal Benefit (Demand)
Consumptive irrigation requirements rise with increased temperatures
Agricultural water demands are increased
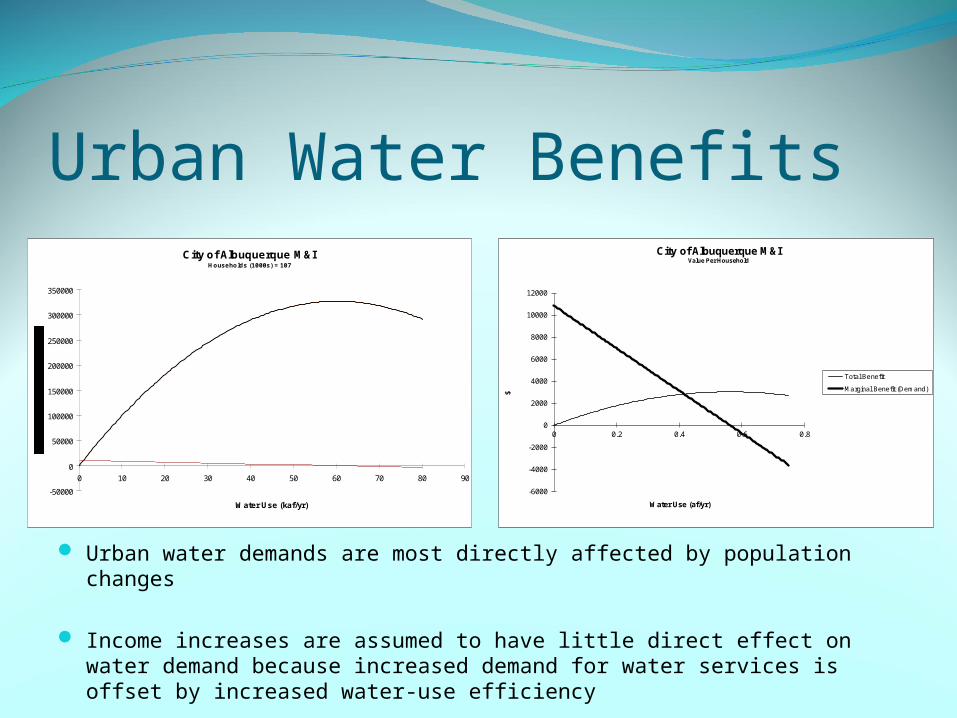
Urban Water BenefitsCity of Albuquerque M&I
Households (1000s) = 107
-50000
0
50000
100000
150000
200000
250000
300000
350000
0 10 20 30 40 50 60 70 80 90
Water Use (kaf/yr)
-6000
-4000
-2000
0
2000
4000
6000
8000
10000
12000
0 0.2 0.4 0.6 0.8
$ Water Use (af/yr)
City of Albuquerque M&IValue Per Household
Total Benefit
Marginal Benefit (Demand)
Urban water demands are most directly affected by population changes
Income increases are assumed to have little direct effect on water demand because increased demand for water services is offset by increased water-use efficiency
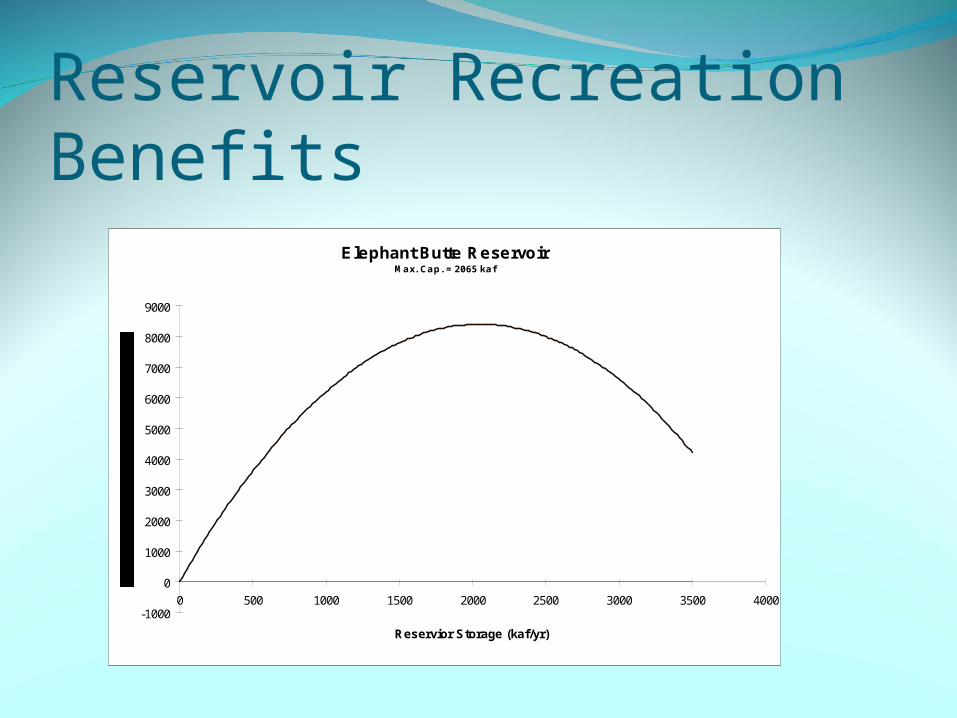
Reservoir Recreation BenefitsElephant Butte Reservoir
Max. Cap. = 2065 kaf
-1000
0
1000
2000
3000
4000
5000
6000
7000
8000
9000
0 500 1000 1500 2000 2500 3000 3500 4000
Reservior Storage (kaf/yr)
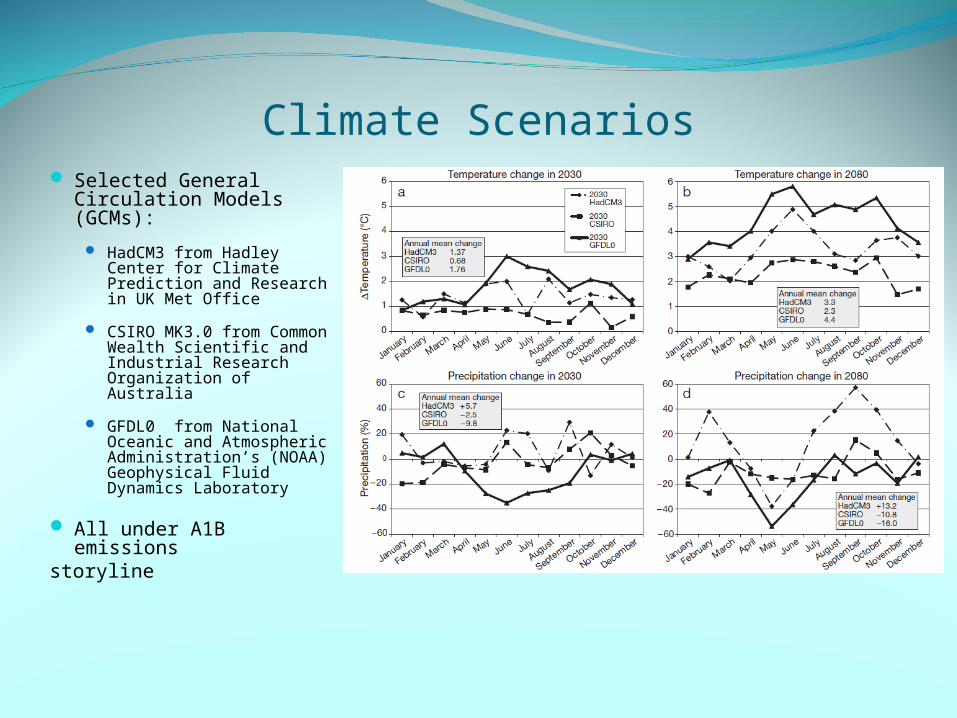
Climate Scenarios Selected General
Circulation Models (GCMs):
HadCM3 from Hadley Center for Climate Prediction and Research in UK Met Office
CSIRO MK3.0 from Common Wealth Scientific and Industrial Research Organization of Australia
GFDL0 from National Oceanic and Atmospheric Administration’s (NOAA) Geophysical Fluid Dynamics Laboratory
All under A1B emissions storyline
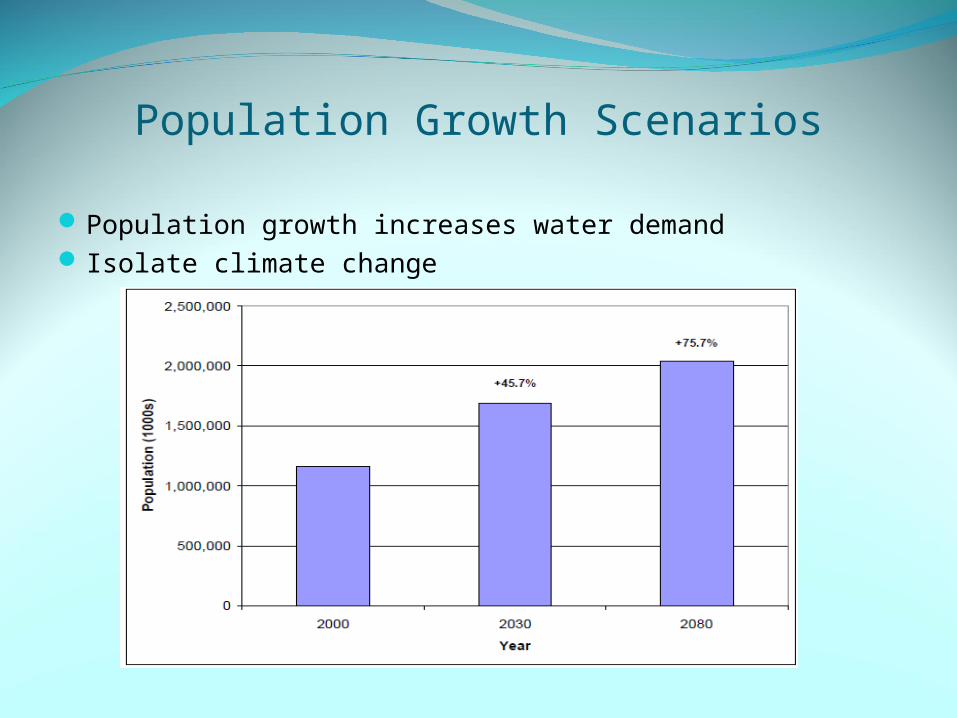
Population Growth Scenarios
Population growth increases water demand Isolate climate change
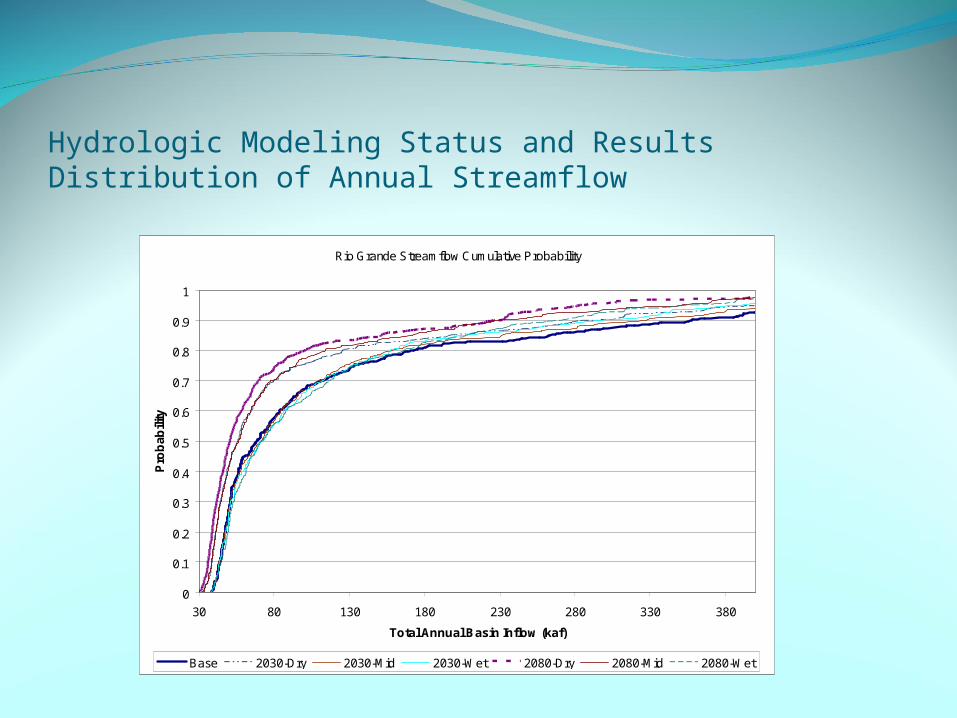
Hydrologic Modeling Status and Results Distribution of Annual Streamflow
Rio Grande Streamflow Cumulative Probability
0
0.1
0.2
0.3
0.4
0.5
0.6
0.7
0.8
0.9
1
30 80 130 180 230 280 330 380
Total Annual Basin Inflow (kaf)
Pro
ba
bili
ty
Base 2030-Dry 2030-Mid 2030-Wet 2080-Dry 2080-Mid 2080-Wet
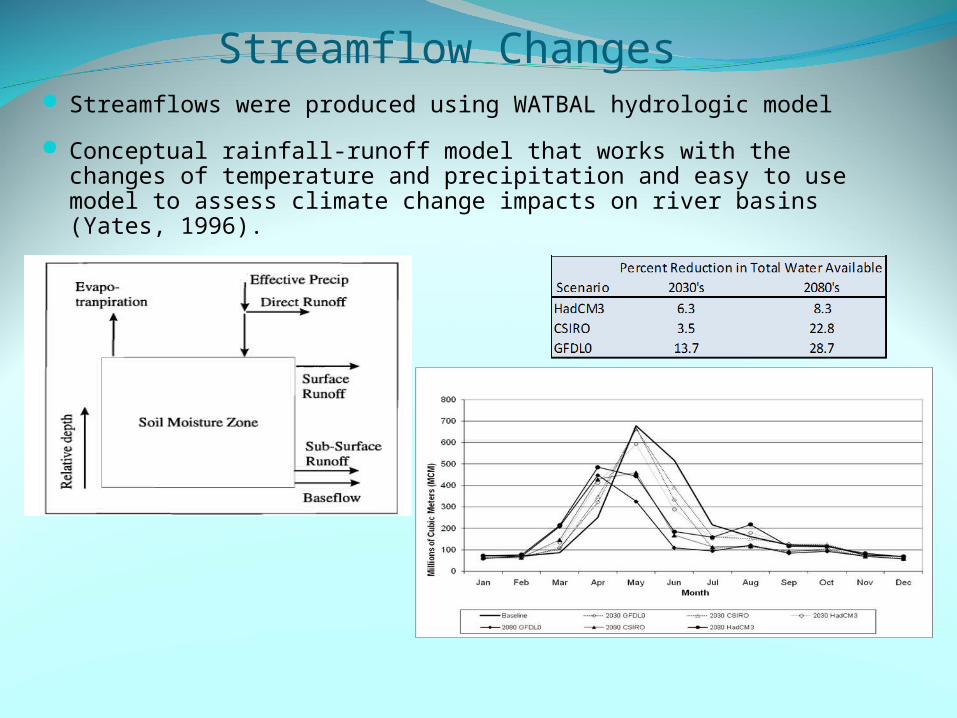
Streamflow Changes Streamflows were produced using WATBAL hydrologic model
Conceptual rainfall-runoff model that works with the changes of temperature and precipitation and easy to use model to assess climate change impacts on river basins (Yates, 1996).
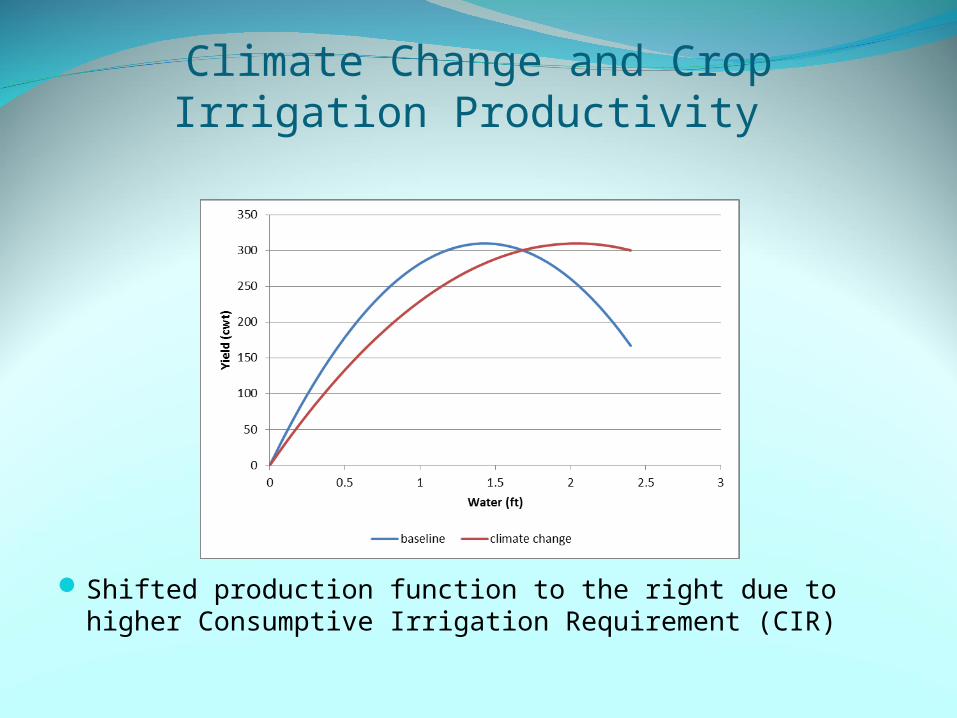
Climate Change and Crop Irrigation Productivity
Shifted production function to the right due to higher Consumptive Irrigation Requirement (CIR)
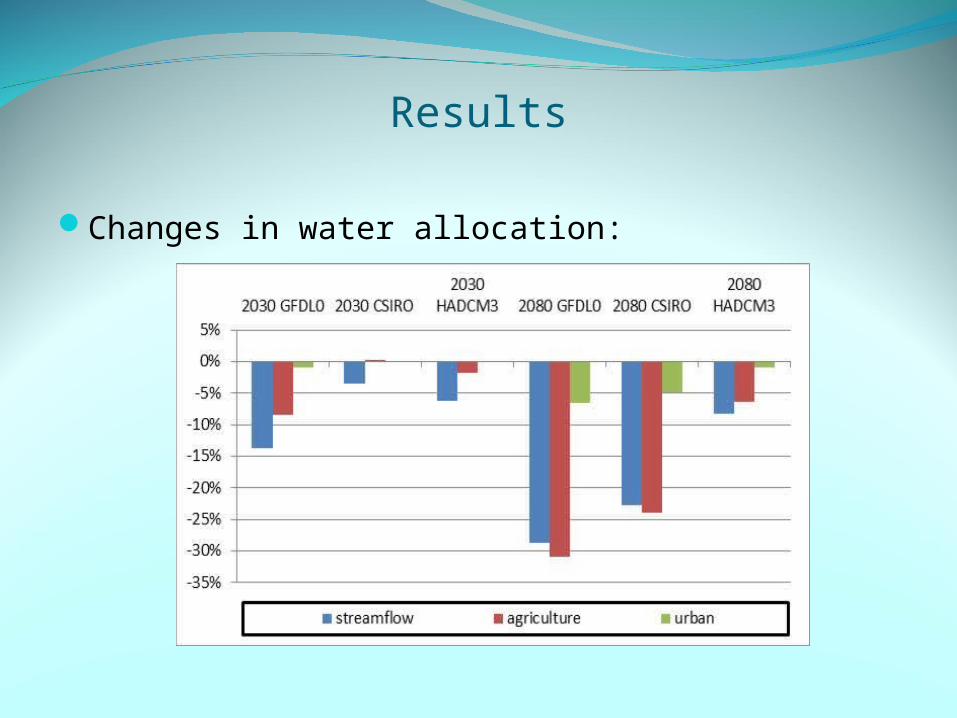
Results
Changes in water allocation:
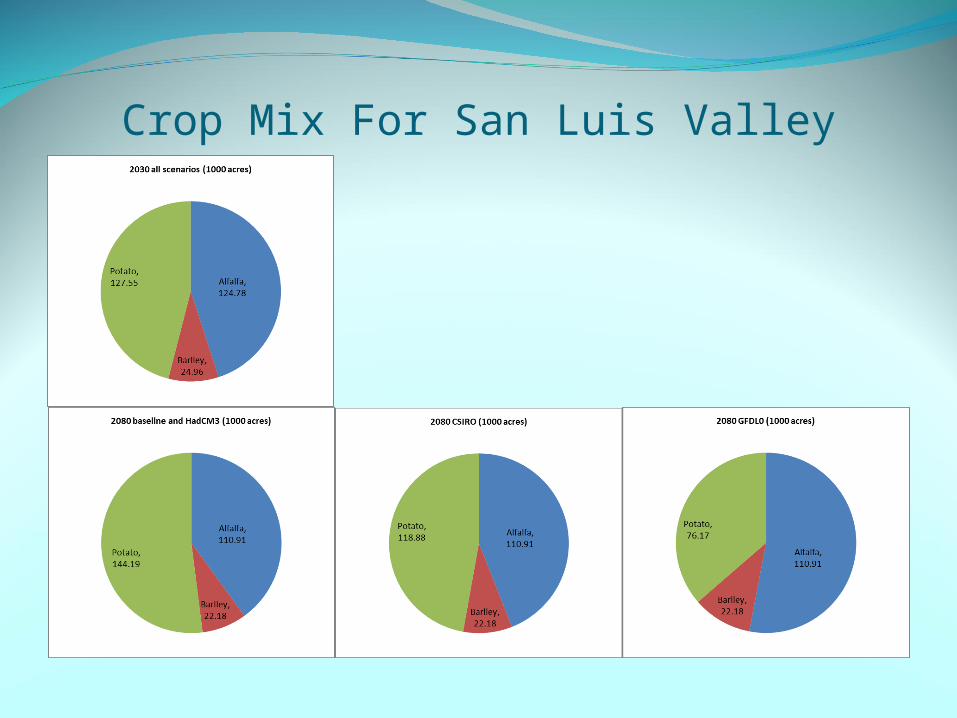
Crop Mix For San Luis Valley
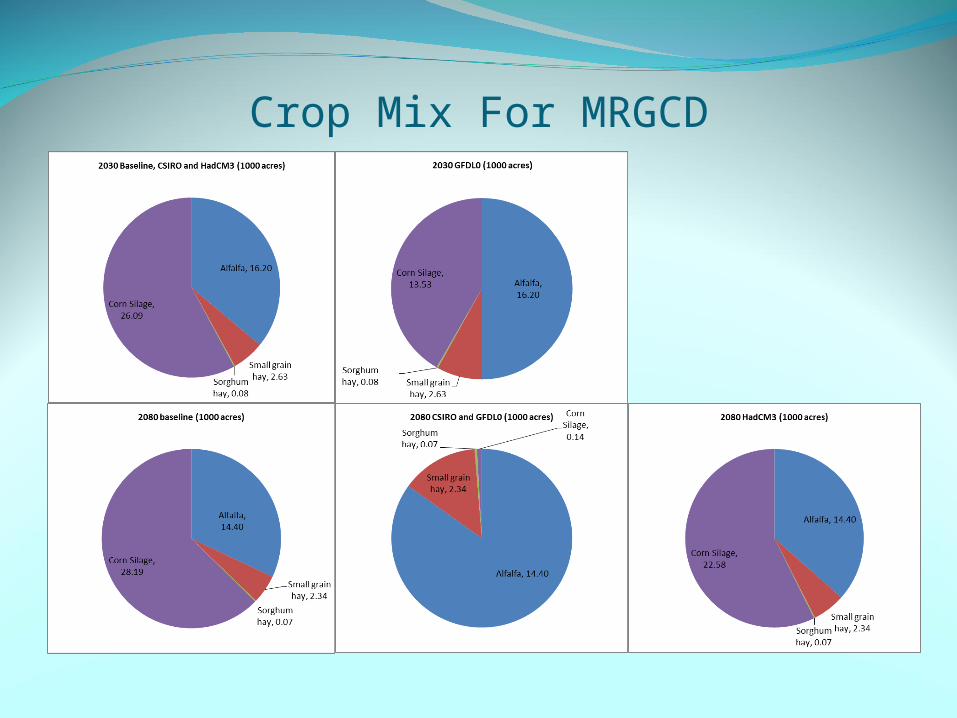
Crop Mix For MRGCD
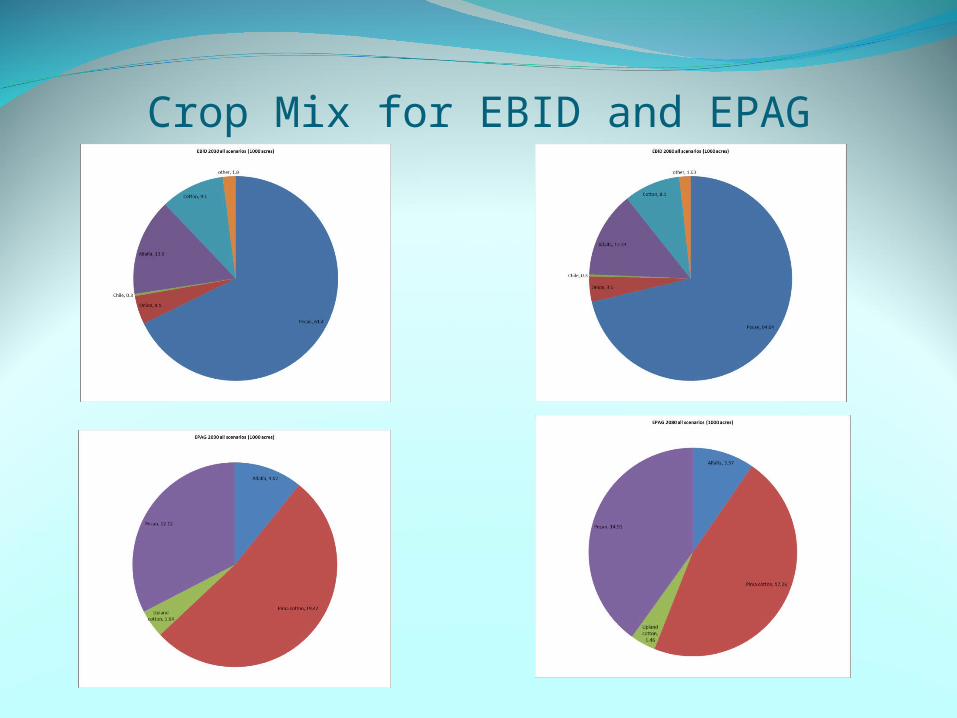
Crop Mix for EBID and EPAG
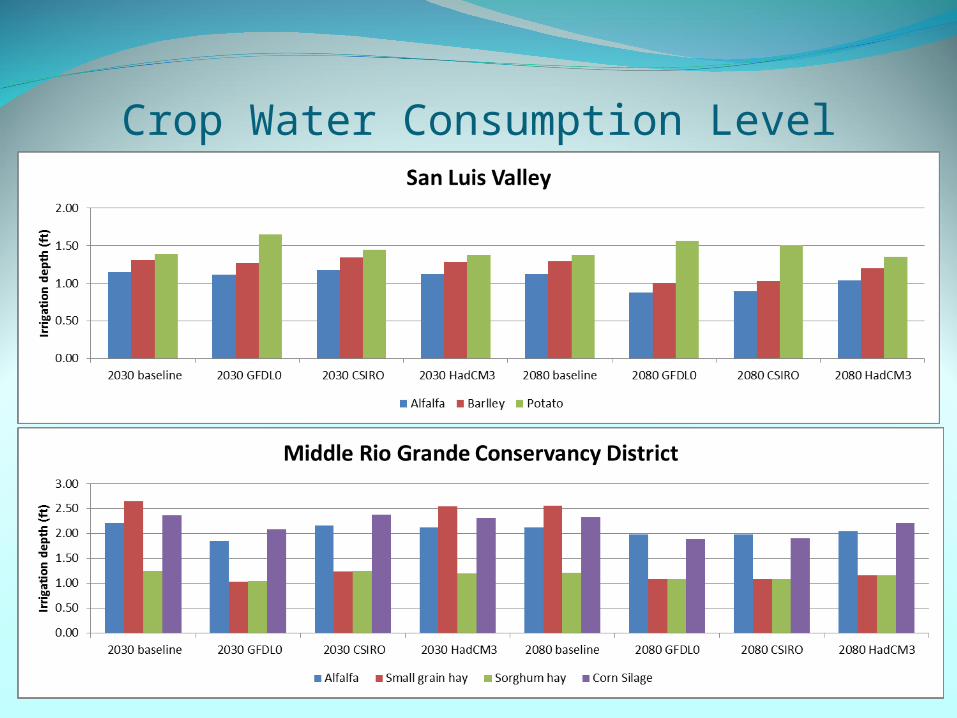
Crop Water Consumption Level
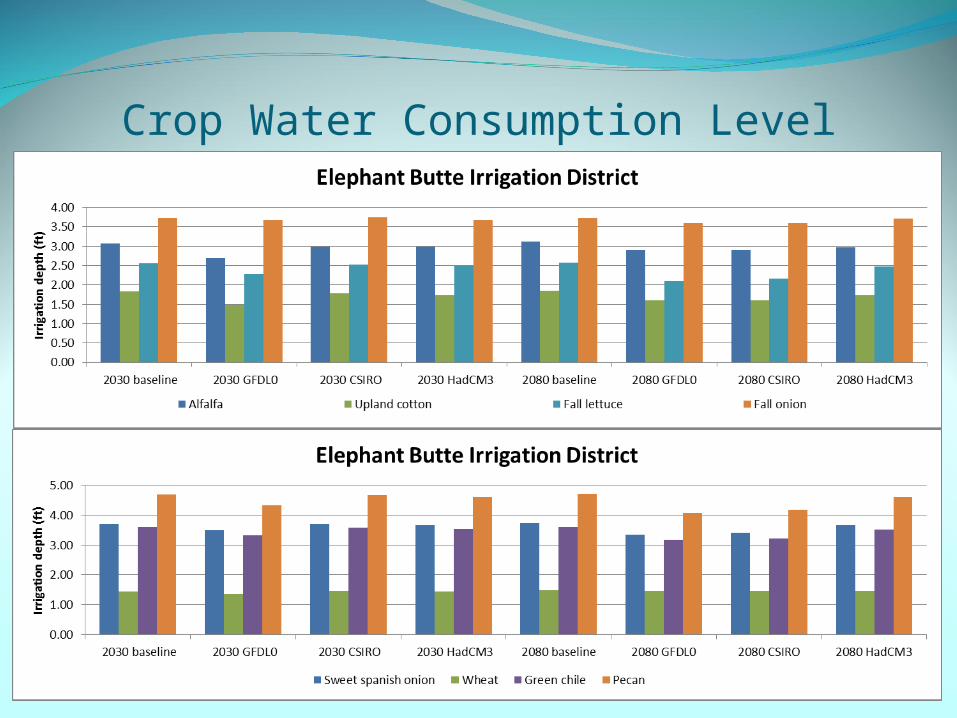
Crop Water Consumption Level
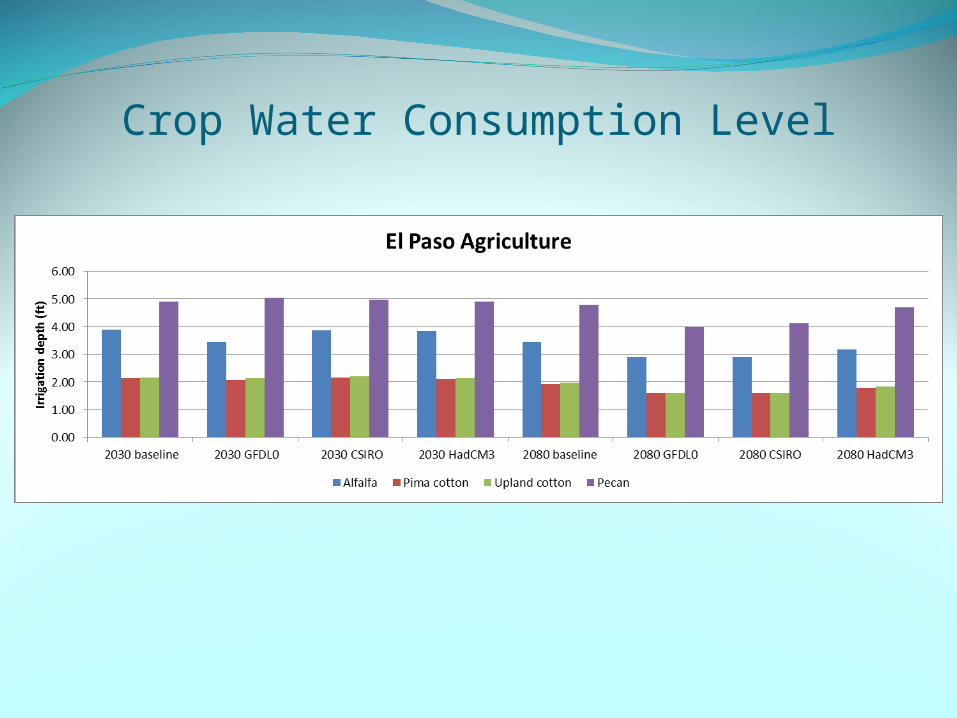
Crop Water Consumption Level
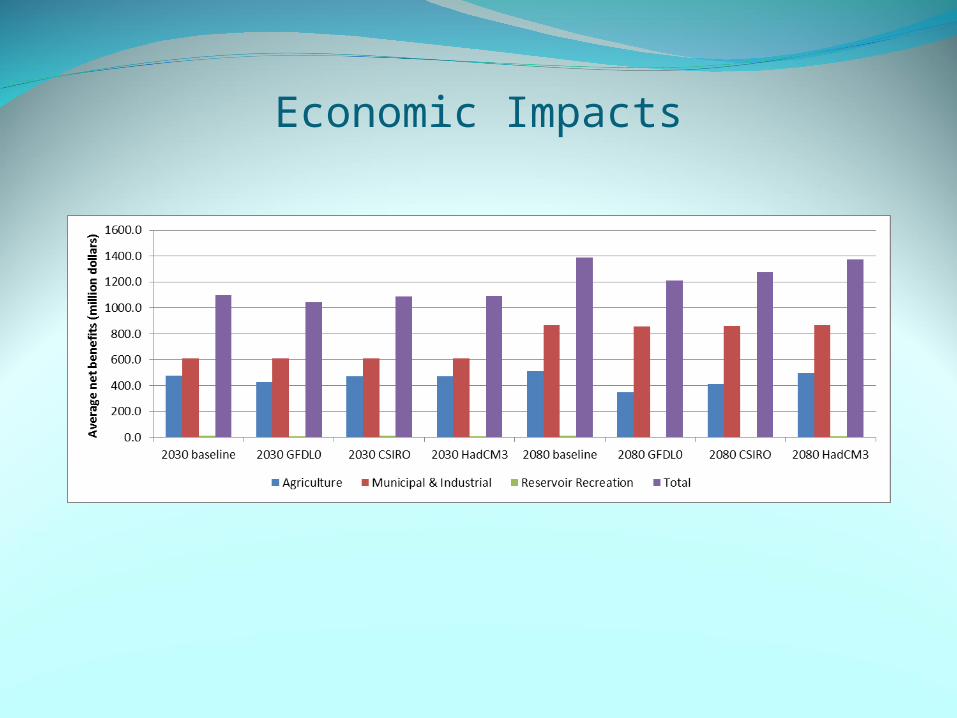
Economic Impacts
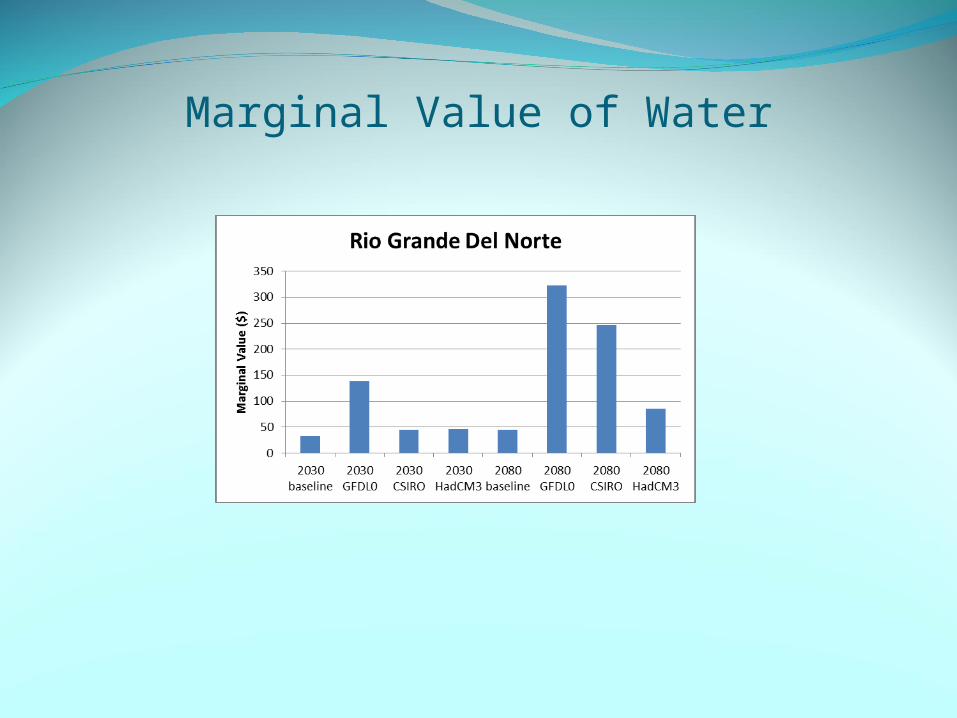
Marginal Value of Water
Conclusions
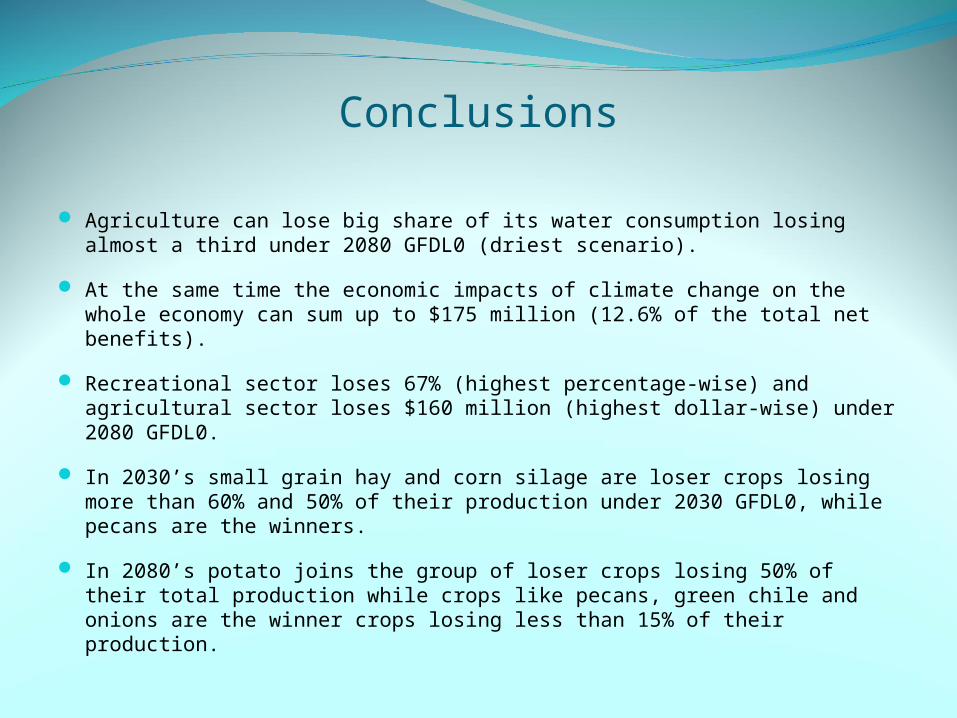
Agriculture can lose big share of its water consumption losing almost a third under 2080 GFDL0 (driest scenario).
At the same time the economic impacts of climate change on the whole economy can sum up to $175 million (12.6% of the total net benefits).
Recreational sector loses 67% (highest percentage-wise) and agricultural sector loses $160 million (highest dollar-wise) under 2080 GFDL0.
In 2030’s small grain hay and corn silage are loser crops losing more than 60% and 50% of their production under 2030 GFDL0, while pecans are the winners.
In 2080’s potato joins the group of loser crops losing 50% of their total production while crops like pecans, green chile and onions are the winner crops losing less than 15% of their production.
Merci’ Beaucoup!GrazieThank YouGracias
Brian H. Hurd, PhDDepartment of Agricultural Economics & Agricultural BusinessGerald Thomas Hall Rm. 350New Mexico State UniversityTel : (575) 646-2674Email: [email protected]: http://agecon.nmsu.edu/bhurd