Embed Size (px)
Citation preview

Assessing foods offered in the Food Distribution Program on Indian Reservations
(FDPIR) using the Healthy Eating Index 2010
Authors: Carmen Byker Shanks, Teresa Smith, Selena Ahmed, & Holley Hunts
This is a postprint of an article that originally appeared in Public Health Nutrition in August 2015.
Shanks, Carmen Byker, Teresa Smith, Selena Ahmed, and Holley Hunts. "Assessing foods offered in the Food Distribution Program on Indian Reservations (FDPIR) using the Healthy Eating Index 2010." Public Health Nutrition (August 2015): 1-12. DOI: https://dx.doi.org/10.1017/S1368980015002359
Made available through Montana State University’s ScholarWorks scholarworks.montana.edu
Assessing FDPIR Foods Using HEI-2010
Abstract 1
Objective To assess the nutritional quality of food packages offered in the Food Distribution 2
Program on Indian Reservations (FDPIR) program using Healthy Eating Index-2010 (HEI-3
2010). 4
Design Data were collected from the list of the food products provided by the United States 5
Department of Agriculture’s Food and Nutrition Handbook 501 for FDPIR. Nutritional quality 6
was measured through a cross-sectional analysis of five randomly selected food packages offered 7
through FDPIR. HEI-2010 component and total scores were calculated for each food package. 8
Analysis of variance and t-tests assessed significant differences between food packages and HEI-9
2010 maximum scores, respectively. 10
Setting This study took place in the United States. 11
Subjects Study units included food products offered through FDPIR. 12
Results The mean total HEI-2010 score for the combined FDPIR food packages was 13
significantly lower than the total HEI-2010 maximum score of 100 (66.38, SD=11.60; p<0.01). 14
Mean scores for total fruit (3.52, SD=0.73; p<0.05), total vegetables (2.58, SD=0.15; p<0.001), 15
greens and beans (0.92, SD=1.00; p<0.001), dairy (5.12, SD=0.63; p<0.001), total protein foods 16
(4.14, SD=0.56; p<0.05), and refined grains (3.04, SD=2.90; p<0.001) were all significantly 17
lower than the maximum values. 18
Conclusions The FDPIR food package HEI-2010 score was notably higher than other federal 19
food assistance and nutrition programs. Study findings highlight opportunities for the FDPIR to 20
modify its offerings to best support lifestyles towards prevention of diet-related chronic disease. 21
Keywords American Indian; Diet; Nutrition; Food assistance; FDPIR; Food access 22
23
24
25
Assessing FDPIR Foods Using HEI-2010
Introduction 26
Overweight, obesity, and nutrition-related chronic diseases are complex health conditions 27
influenced by a number of biological, behavioral, environmental, genetic, and personal factors(1). 28
Improving access to nutrient-dense foods is one key strategy to prevent nutrition-related chronic 29
disease and obesity(2,3). In the United States (US), access to nutrient-dense foods is particularly a 30
concern in communities with marked health disparities, including those that are rural, urban, 31
limited income, or have high a percentage of minorities(4–9). 32
For example, American Indians are more likely than the general US population to live in rural 33
locations with limited food access (10). At the same time, American Indian adults are 60% more 34
likely to be obese than non-Hispanic whites(11). The consequences of obesity are well 35
documented, including the risk of developing diabetes mellitus(12), which is particularly 36
concerning as American Indian and Alaska Natives have a higher age-adjusted prevalence of 37
diabetes mellitus than any other race or ethnic group in the US(13). 38
Previous research(14,15) indicates that the modern American Indian diet is poor in nutrient quality 39
and household food security is relatively low(15–17). Emerging research indicates potential 40
connections between diets poor in nutrient quality, high food insecurity rates, and high obesity 41
and chronic disease rates among American Indians(18,19). Contemporary food issues observed 42
within Native American populations have been connected to a long and storied history of 43
colonialism and historical trauma(20–22). With socio-economic, political, and environmental 44
changes including reduction in tribal land, end of nomadic lifestyles, shifts in farming policies, 45
the near extinction of buffalo, and limited rights to hunt, fish, and collect wild foods, the current 46
diet among American Indians has notably transitioned from traditional ways in post-colonial 47
times(23,24). 48
In effort to address nutrition related challenges faced by American Indian peoples, the US 49
government has supplied food to American Indians living on reservations for over 150 years as 50
well as had a series of food-related agreements(14). For example, some treaties included 51
“annuities” which granted hunting, fishing, and gathering rights for American Indians(25). During 52
the period circa 1860 – 1934, the government issued rations to supplement lost sources of wild 53
foods and failed crops(26). However, some historical documents describe the rations provided by 54
Assessing FDPIR Foods Using HEI-2010
the government as being culturally inappropriate, inadequate, not delivered as promised, and of 55
low quality(27,28). 56
The Food Distribution Program on Indian Reservations (FDPIR) was implemented by Congress 57
in 1973 as part of the Consumer Protection Act(29). The program states, “many households 58
participate in FDPIR as an alternative to the Supplemental Nutrition Assistance Program 59
(SNAP), because they do not have easy access to SNAP offices or authorized food stores”(30). 60
Through FDPIR, the United States Department of Agriculture (USDA) provides increased access 61
to nutritious foods for low-income households living on Indian reservations and to American 62
Indian families residing in designated areas near reservations(30). The FDPIR is one of 16 distinct 63
federal food assistance and nutrition programs (FANPs) administered by the Food and Nutrition 64
Service (FNS) of the USDA(31). The program provides individuals an alternative to the 65
Supplemental Nutrition Assistance Program (SNAP) enrollment by directly distributing 66
commodity packages in communities and striving to meet basic nutrient needs of program 67
participants(30). 68
69
The USDA administers the FDPIR program through either Indian Tribal Organizations (ITOs) or 70
an agency of a state government(32). The USDA purchases and ships FDPIR foods to the ITOs 71
and state agencies based on orders placed from a list of available foods(32). State agencies and 72
ITOs are responsible for determining applicant eligibility, storing and distributing the food, and 73
provide nutrition education to recipients. According to the program, “Low-income American 74
Indian and non-Indian households that reside on a reservation and households living in approved 75
areas near a reservation or in Oklahoma that contain at least one person who is a member of a 76
federally-recognized tribe, are eligible to participate in FDPIR”(30). Households may not 77
participate in the FDPIR and SNAP in the same month(32). There currently are 276 tribes through 78
100 ITOs and 5 State agencies receiving FDPIR benefits(30). Since the inception of the FDPIR, 79
participant size has increased with a total 75,608 participants in 2013(33). Each month, 80
participants select a food package based on their food preferences, household size, and foods 81
available at their particular ITO or State agency distribution site to help them maintain a 82
nutritionally balanced diet(32). 83
Assessing FDPIR Foods Using HEI-2010
In 2008, the Special Nutrition Programs Report No. FD-08-FDPIR was developed by the USDA 84
to assess the nutritional quality of FDPIR foods utilizing the Healthy Eating Index 2005 (HEI-85
2005)(34). Results from the report indicated that FDPIR had the potential to provide participants 86
with a higher nutrient quality diet than the average American or SNAP participant. 87
To the best of the authors’ knowledge, the Healthy Eating Index 2010 (HEI-2010)(35) has yet to 88
be utilized in assessing the nutritional quality of foods offered as part of FDPIR. The HEI-89
2010(35) has been developed to measure adherence to the most recently published federal dietary 90
guidelines, the 2010 Dietary Guidelines for Americans(36), whereas HEI-2005 was developed to 91
measure the previous version of the federal dietary guidelines, the 2005 Dietary Guidelines for 92
Americans(35,37). Specifically, HEI-2010 updates include: (1) emphasis on dark green vegetables 93
and beans and peas, (2) seafood and plant proteins component was introduced (3) fatty acids 94
replaces the oils and saturate fats components, and (4) refined grains (a moderation component) 95
replaced total grains (an adequacy component)(35). 96
It is important to assess the nutritional quality of FDPIR foods utilizing the HEI-2010 to 97
understand how each iteration of current dietary guidance is reflected within the offerings of the 98
food assistance program. For example, dark green vegetables and beans and peas are two 99
vegetable subgroups for which intakes are furthest from recommended levels and the category of 100
“vegetables and soup” allows for choices among many vegetables; the introduction of the 101
seafood and plant proteins within HEI-2010 allows for capturing the dietary contribution of more 102
specific protein choices within the broad “meat, poultry, fish, beans, eggs, and nuts” category of 103
FDPIR; replacing saturated fats with fatty acids within HEI-2010 allows for the more specific 104
assessment of the value of vegetable oil, light buttery spread, and butter within the “oil” 105
category of FDPIR; refined and whole grains are both offered within the FDPIR “grains, cereal, 106
rice, and pasta” category and assessing these separately with HEI-2010 is important to 107
understand their distinct dietary contributions(38,39). 108
The sum of the scores for the 12 components is the total HEI-2010 scores, which ranges from 0 109
to 100, with a higher score indicative of a more healthful diet. HEI-2010 is composed of 12 110
components, nine that focus on nutritional adequacy and three that apply nutritional 111
moderation(40). For HEI-2010, refined grains, sodium, and empty calories are all moderation 112
Assessing FDPIR Foods Using HEI-2010
components. A higher score within moderation components indicates lower availability of the 113
food in the diet. All other categories are adequacy components, where a higher score indicates 114
higher availability of food in the diet. HEI-2010 scores separate diet quality from quantity by 115
using standards that are expressed as either a percent of calories, per 1,000 calories, or ratio of 116
fatty acids(40). 117
The lack of assessment of the FDPIR with the HEI-2010 presents a knowledge gap regarding the 118
dietary quality of FDPIR foods that support American Indian households in compliance with the 119
2010 Dietary Guidelines for Americans. Current nutrition research is needed in order to develop 120
appropriate nutritional planning and policies related to food assistance, food security, and obesity 121
in tribal communities with marked health disparities. The purpose of the current research is to 122
assess the nutritional quality of foods offered in the FDPIR using HEI-2010. 123
Experimental Methods 124
Data were collected from a list of the food products, found in Exhibit O of the Food and 125
Nutrition Handbook 501 for FDPIR, which was effective as of September 2013(32). The study 126
was exempt from Institutional Review Board review since no information was collected from 127
human subjects. 128
Data Analysis 129
Each food option was entered into the USDA What's In The Foods You Eat online search tool 130
(version 5.0)(41). Matching food package components and search tool foods was based on the 131
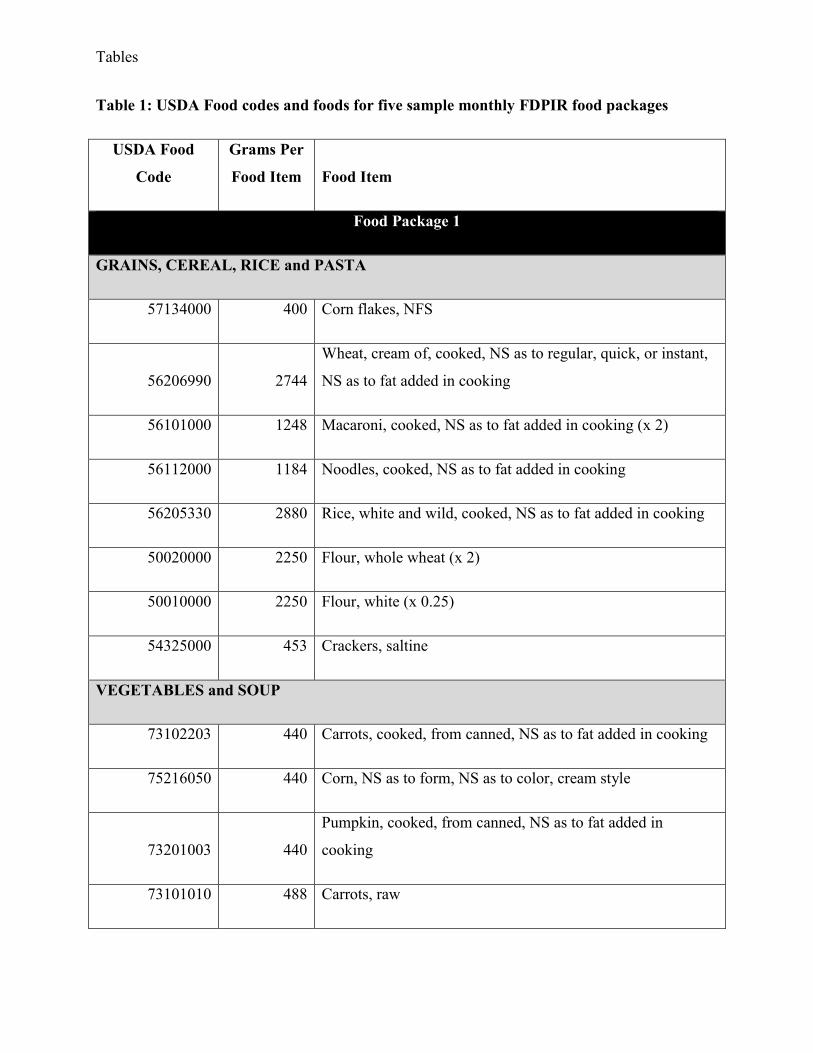
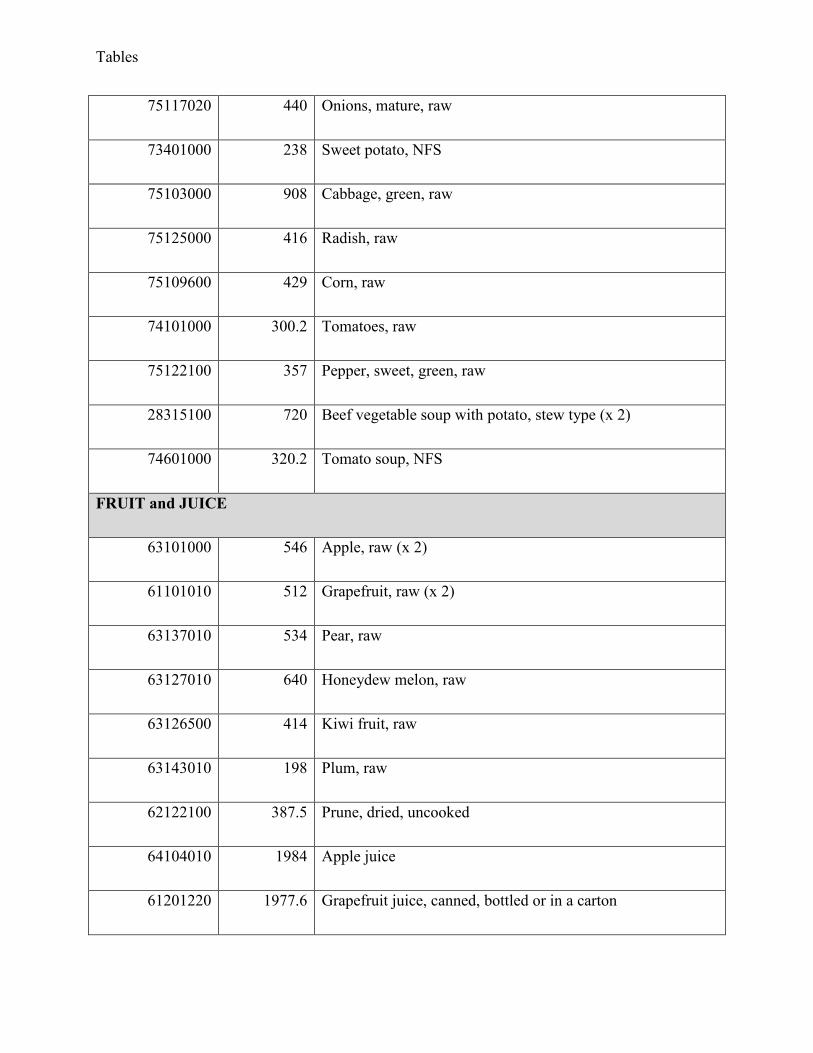
item description and nutrient profiles. Each food item was assigned a USDA food code and 132
nutrient composition was ascertained (Table 1). Food group composition was determined using 133
MyPyramid Equivalents Database for USDA Survey Food Codes, 2003-2004 Version 2. Each 134
food listed in FDPIR, including foods requiring preparation (e.g., flour) and the few available 135
ready-to-eat options, can be found in the cited database(41). 136
The researchers simulated five possible food package scenarios for analysis by: (1) using the 137
FDPIR guide to establish the maximum allowed number of items for a one-person household(39) 138
and then (2) randomly selecting the maximum allowed number of items per USDA food group 139
(grains, cereal, rice and pasta; vegetables and soup; fruit and juice; meat, poultry, fish, beans, 140
Assessing FDPIR Foods Using HEI-2010
eggs and nuts; milk and cheese; oil). The FDPIR guide outlines requirements for the number of 141
items that can be chosen based on the number of people in a household per month for each food 142
item (39). The number of items that can be chosen are often increased linearly per person (e.g., 1 143
person = 1 item, 2 persons = 2 items, 3 persons = 3 items, etc.). Analysis was based on a one-144
person household with the expectation that the dietary quality would remain consistent with 145
increasing number of persons in a household. For each food package, a random number 146
generator was utilized to randomly select from all options per USDA food group. Randomly 147
generated options were allowed to be chosen more than once when FDPIR guidelines allowed 148
for greater than one option per USDA food group. 149
Using randomly generated food packages, HEI-2010 component and total scores were calculated 150
using published SAS code (version 9.2 SAS Institute Inc., Cary, NC), modified to assess this 151
specific dataset(42). Prior to analysis, Analysis of Variance was used to detect if the criteria for 152
randomly selecting food packages used in this study could lead to significant differences in key 153
nutrient content across each of the five food packages. No significant differences were found 154
among total calories, carbohydrates (g), saturated fat (g), and sodium (mg) for each of the five 155
food packages. 156
Following the methodology outlined by Erinosho and colleagues(43), means and standard 157
deviations were calculated to generate both HEI-2010 component scores and total scores across 158
all menus. T-tests were calculated to assess whether mean HEI-2010 component scores and total 159
scores differed significantly (P<0.05) from the maximum scores. 160
Results 161
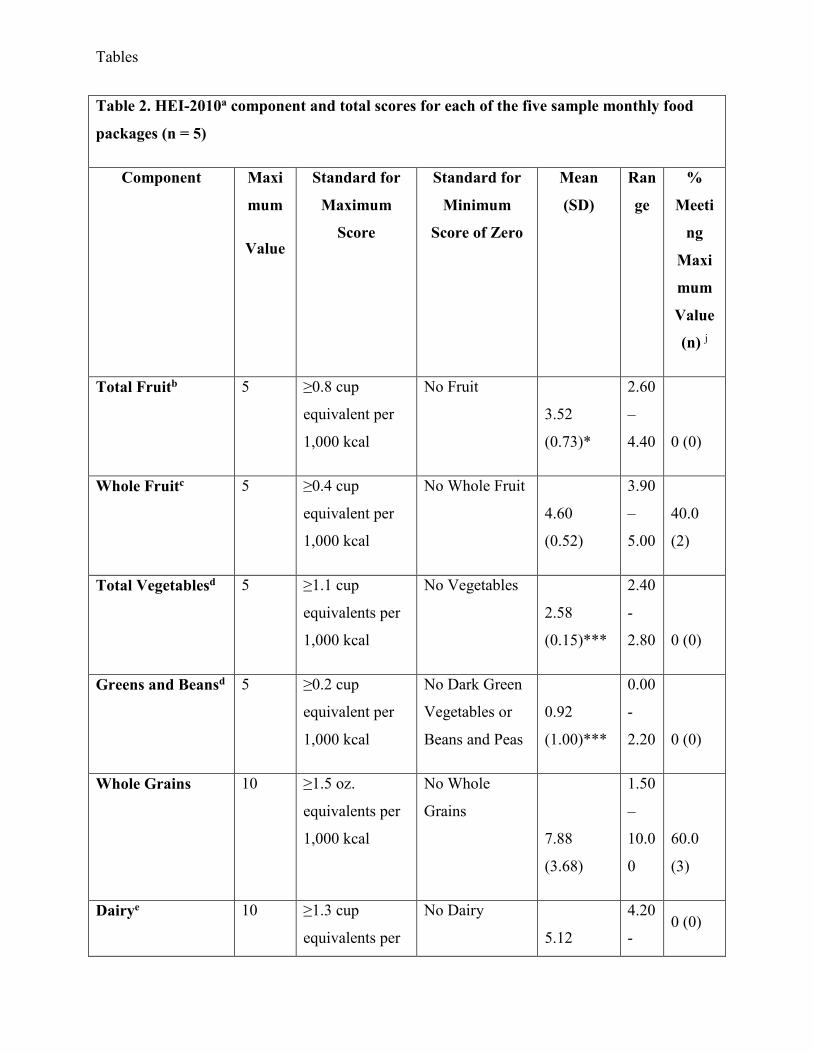
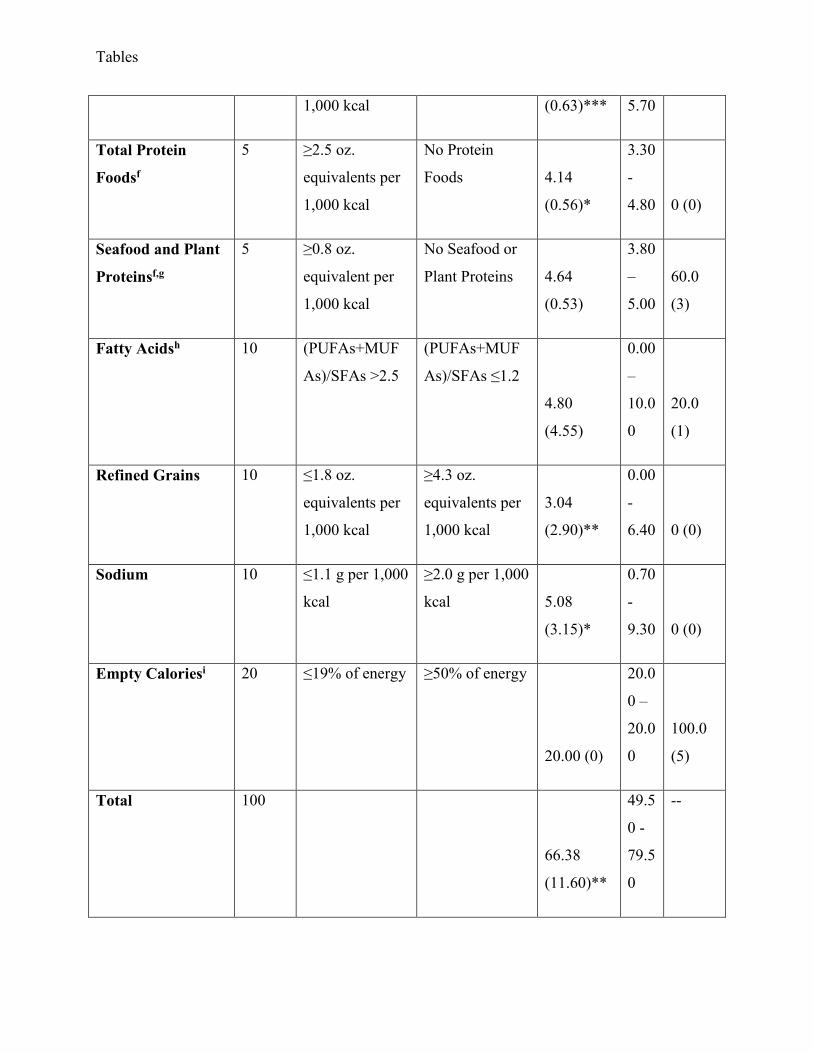
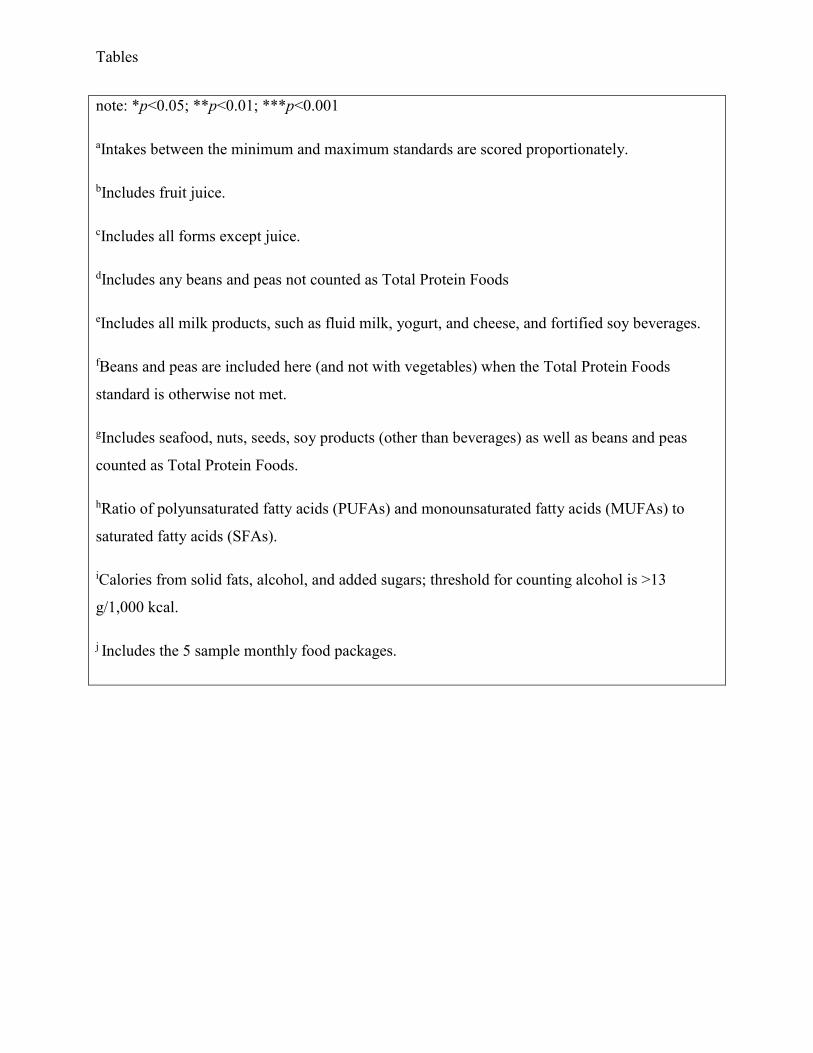
Table 2 describes HEI-2010 component scores and total scores for foods and beverages provided 162
as part of the five randomly generated FDPIR food packages. The mean total HEI-2010 score for 163
the combined FDPIR food packages was significantly lower than total HEI-2010 total maximum 164
score of 100 (66.38, SD=11.60; p<0.01), with total HEI-2010 scores ranging from 49.50 to 79.50 165
across all five FDPIR food packages. Mean scores for Total Fruit (3.52, SD=0.73; p<0.05), Total 166
Vegetables (2.58, SD=0.15; p<0.001), Greens and Beans (0.92, SD=1.00; p<0.001), Dairy (5.12, 167
SD=0.63; p<0.001), Total Protein Foods (4.14, SD=0.56; p<0.05), and Refined Grains (3.04, 168
SD=2.90; p<0.001) were all significantly lower than the maximum values (5, 5, 5, 10, 5, and 10 169
Assessing FDPIR Foods Using HEI-2010
respectively). All other components did not demonstrate significant differences from their 170
maximum values. 171
Contributing to the combined FDPIR HEI-2010 score, all five food packages (100%) met the 172
standard for a maximum value for Empty Calories, followed by three (60%) that met the 173
standard for Whole Grains, three (60%) that met the standard for Seafood and Plant Proteins, two 174
(40%) that met the standard for Whole Fruit, and one (20%) that met the standard for Fatty 175
Acids. No sample food packages met the standard for a maximum value for Total Fruit, Total 176
Vegetables, Greens and Beans, Dairy, Total Protein Foods, Refined Grains, or Sodium. 177
Discussion 178
This study addresses an important knowledge gap by characterizing the mean nutritional quality 179
of five randomly generated food packages of the FDPIR on the basis of the most recently 180
published federal dietary guidelines, the 2010 Dietary Guidelines for Americans (DGA). The 181
FDPIR packages are not meeting the diet quality recommendations outlined by the 2010 DGA, 182
as our analysis found significantly lower HEI-2010 overall score compared to the maximum 183
score. 184
Similar to our findings, Americans do not consume adequate amounts of fruits, vegetables, 185
whole grains, or dairy and significantly lower HEI-2010 component scores compared to the 186
maximum values from 2010 DGA were found for Total Fruit, Total Vegetables, Greens and 187
Beans, Dairy, Refined Grains, Total Protein Foods, and Protein(36). The current study shows that, 188
although there was no significant difference, the HEI-2010 scores for Whole Fruit, Whole 189
Grains, Seafood and Plant Proteins, and Fatty Acids also fell short of the maximum HEI-2010 190
score indicating a potential need to improve options within these categories. Although the HEI-191
2010 mean total score for FDPIR (score of 66) was slightly better than the American food supply 192
(HEI-2005 score of 55)(44), the FDPIR program should target providing more inadequately 193
consumed foods (of fruits, vegetables, whole grains, or dairy) to promote better nutrition among 194
participants in line with the needs of the American population. 195
Interestingly, HEI-2010 scores of each of the five assessed food packages show significant 196
variation in nutritional quality and thereby emphasize the role of FDPIR centers in providing 197
Assessing FDPIR Foods Using HEI-2010
more foods that are consistent with adequacy components and less foods categorized as 198
moderation components by HEI-2010(38). Secondly, consumer behavior in making dietary 199
choices from available food access should also be considered. Findings from this study highlight 200
opportunities to provide guidance to FDPIR participants about nutritionally balanced food 201
choices at FDPIR centers as well as foods that participants acquire outside of FDPIR. The 202
FDPIR should ideally provide participants with the opportunity to increase diet quality beyond 203
the average American diet as well as meet the current DGA(36). The FDPIR is positioned to 204
modify its food and education offerings to best support lifestyles towards prevention of diet-205
related chronic disease. 206
The HEI-2010 FDPIR score from this research (score of 66) resulted in lower score than a 207
previous assessment of FDPIR that utilized HEI-2005 (score of 87)(34). Though methodologies 208
between FDPIR assessments differed, it is important to explore the differences found using the 209
two versions of the Healthy Eating Index, which reflects the most up-to-date dietary guidance. 210
The current assessment offered similar scores to total fruit, whole fruit, total vegetables, greens 211
and beans (previously dark green and orange vegetables and legumes), dairy (previously milk), 212
and empty calories than the previous assessment(34). Differences in scores between the two 213
assessments can be attributed partially to foods selected in the food packages and partially to 214
updates in scoring. For example, in the previous assessment that used HEI-2005, the component 215
of total grains received a maximum score of 5, while in the current assessment the scores for 216
whole grains results in a score lower than the maximum (8 out of 10) and refined grains resulted 217
in score significantly lower than the maximum (3 out of 10) (34). Grain foods randomly selected 218
for this assessment were split into the updated categories of refined grains and whole grains. 219
Grain foods in the previous assessment were placed in the total grains category. In one additional 220
example, the component of saturated fat scored relatively close to the maximum in the HEI-2005 221
analysis (9.8 out of 10), while in the current assessment fatty acids scored relatively low (4.8 out 222
of 10) (34). This is in part due to the replacement of oils and saturated fats component with fatty 223
acids in the HEI-2010. Improvements in the refined, whole grain, and fatty acids category are 224
warranted. Although changes in national dietary guidance are usually minimal, these examples 225
demonstrate the importance of assessing nutrition quality of FDPIR foods using new iterations of 226
the Healthy Eating Index to capture important nuances in diet quality. 227
Assessing FDPIR Foods Using HEI-2010
The HEI-2010 mean total score for FDPIR cannot be compared to other HEI-2010 scores in 228
different food assistance contexts, as these analyses do not currently exist. Although there are 229
limitations to comparing HEI-2005 and 2010, the nutrient quality of the current FDPIR food 230
packages using the HEI-2010 analysis is higher than some other federal FANPs, including 231
comparison to dietary intake of SNAP(34) and Special Supplemental Nutrition Program for 232
Women, Infants, and Children (WIC)(45) participants using HEI-2005. Comparison of the FDPIR 233
nutrient quality with SNAP and non-SNAP participants dietary intake shows that the FDPIR has 234
higher scores. These findings may be in part due to the analysis of actual participant dietary 235
intake in SNAP and WIC programs, where the analysis in the current study measured nutrient 236
quality of randomized food packages. Researchers working with FDPIR programs should 237
analyze dietary intake of FDPIR participants to understand the value of what nutrients are 238
consumed in addition to the nutrient value of food package offerings. Specifically, dietary intake 239
of SNAP participants were found to have a HEI-2005 total score of 47 and non-participants were 240
found to have a total score 5146), which is considerably lower than the average HEI-2010 mean 241
score of 66 found in the present study for the nutrient quality of FDPIR packages. Furthermore, 242
dietary intake of children participants in the WIC program received a HEI-2005 total score of 58 243
compared to dietary intake of children not participating in the WIC program that received a score 244
of 60(45), which are both lower than the mean nutrient quality score for FDPIR food package 245
score. The differences in findings may also be due to greater access to processed and sugar-246
added foods of SNAP compared to the FDPIR and lack of dietary analysis of intake of FDPIR 247
participants. In contrast to SNAP that can be used by participants to purchase “foods of minimal 248
nutritional value” including soda, water ices, chewing gum, and candy, foods in the FDPIR 249
package are selected to address some nutritional need(47). Participants in the FDPIR program may 250
also supplement their diet with purchased processed and sugar-added foods or other foods (e.g., 251
hunted, grown, gathered), but the current analysis does not account for dietary intake. 252
The FDPIR program still has nutritional shortcomings that need to be addressed in order to 253
decrease the risk of diet-related chronic disease on American Indian reservations. In our current 254
study and other observational work in progress, shortcomings of the FDPIR may derive from 255
limited offerings of greens and total vegetables, nutrient profile of foods, sensory appeal of 256
individual FDPIR offerings and the physical environment of the FDPIR center, time needed to 257
prepare FDPIR foods versus convenience foods, and lack of knowledge in preparing FDPIR 258

Assessing FDPIR Foods Using HEI-2010
foods. These issues are germane to improving diet quality of program participants. 259
Increasing offerings of vegetables may require an increase in the budget allocated to the FDPIR 260
if other aspects of the program are to remain unchanged given the relatively high price of 261
produce in the US compared to non-specialty crops. Modifying the structure of the FDPIR to 262
offer greater selection of fresh fruits and vegetables may encourage produce consumption, 263
particularly if this offering was coupled with a nutrition information and cooking demonstrations 264
on preparing recipes that are culturally compatible. In recent years, the quality of FDPIR food 265
has been improved by the Fresh Fruits and Vegetables Program in which most programs now 266
participate(47). It will be important that these fresh fruit and vegetable offerings be kept fresh, or 267
that canned or frozen produce is utilized, in order to retain maximum phytonutrients to benefit 268
human health. 269
Given the variable HEI-2010 scores of different FDPIR food packages, directing food options to 270
increase nutrient diversity would likely result in improved nutrition and health outcomes of 271
participants. Healthy food choices may be encouraged through enhancing the sensory appeal of 272
individual FDPIR offerings – for example, researchers should consider studying the consumer 273
appeal components that FDPIR foods, packages, and program centers provides, as to the authors’ 274
knowledge no study has been conducted about the attractiveness of these variables to native 275
populations. Additionally, increasing availability and diversity of culturally appropriate foods in 276
specific food components that do not meet minimum recommendations would also assist in 277
increasing the HEI-2010 score, specifically for Total Fruit, Total Vegetables, Greens and Beans, 278
Dairy, Total Protein Foods, Refined Grains, or Sodium. The addition of limes would add to 279
overall availability of Total Fruit, replacing refined grains with whole grains such as wild rice, 280
barley, quinoa, blue cornmeal, sorghum, and rye has the potential to improve the Refined Grains 281
score, and adding bison to the offerings would improve access to Total Protein Foods. Recently, 282
Congress directed that a portion of FDPIR funding be used to purchase bison meat because of its 283
low fat content and cultural value for American Indians, even if this is not tribally specific(47). 284
There is promising opportunity to implement nutrition education and cooking demonstrations on 285
how to supplement FDPIR offerings with culturally appropriate, accessible, and healthy foods, 286
especially since federal grant mechanisms exist to support nutrition education related to the 287
Assessing FDPIR Foods Using HEI-2010
FDPIR through the USDA Food Distribution Program Nutrition Education (FDPNE)(48). Several 288
successful initiatives have been launched to date that serve to enhance the food choices of 289
FDPIR participants in culturally appropriate ways, including cooking demonstrations, taste tests, 290
cooking competitions, gardening demonstrations with traditional foods, health wellness 291
programs, and special events such as health fairs(47). 292
This study has several limitations that are important to address when interpreting findings and 293
examining implications. As with many other studies that utilize HEI to study nutritional 294
adequacy in various settings (e.g., foods offered to children at child-care centers, foods offered to 295
children through backpack programs, the dollar menu displayed at a fast-food restaurant)(43,44,49), 296
it is important to note that this evaluation of FDPIR involves analysis of food products and not 297
actual consumer consumption. For example, this study assessed the quality of five randomly 298
generated food packages of the FDPIR rather than actual food package selections made by 299
participants. In addition, this study does not take into consideration other foods with which 300
participants may supplement their food assistance packages such as local wild and cultivated 301
foods or purchased foods. Finally, the availability of individual products is subject to market 302
conditions, ITOs and state agency orders, and seasonal availability. The current study did not 303
limit USDA foods or options according to these factors and no published list is available to 304
reflect that information to the authors’ knowledge. Despite these limitations, this study 305
contributes to the sparse published literature assessing nutritional quality of a national food 306
commodity program geared toward a specific racial demographic. 307
There is a need for future studies to establish the linkages between FDPIR participation and 308
long-term nutrition and health outcomes. Specifically, such future studies should examine the 309
complex interplay between the FDPIR and other aspects of the food environments and food 310
access along with consumer lifestyle behavior and dietary choices, food quality, genetics, 311
epigenetics, and food sovereignty. Studies that examine the HEI-2010 on actual FDPIR packages 312
and diets of participants would further enhance the understanding of the contribution of this 313
federal assistance program to nutrition and health outcome. Research on the FDPIR is 314
particularly pressing because of the lack of available studies on the federal nutrition program that 315
serves an extremely vulnerable population in the USA that is at high risk of diet-related chronic 316
disease(31). 317
Assessing FDPIR Foods Using HEI-2010
References 318
1. Office of the Surgeon General & U.S. Department of Health and Human Services (2010) 319 The Surgeon General’s Vision for a Healthy and Fit Nation. . 320
2. White M (2007) Food access and obesity. Obes Rev 8 Suppl 1, 99–107. 321
3. Glanz K, Sallis JF, Saelens BE, et al. (2005) Healthy nutrition environments: concepts and 322 measures. Am J Health Promot 19, 330–333, ii. 323
4. Befort CA, Nazir N & Perri MG (2012) Prevalence of obesity among adults from rural and 324 urban areas of the united states: Findings from NHANES (2005-2008). The Journal of 325 Rural Health 28, 392–397. 326
5. Sharkey JR (2009) Measuring Potential Access to Food Stores and Food-Service Places in 327 Rural Areas in the US. American Journal of Preventive Medicine 36, S151–S155. 328
6. Powell LM, Slater S, Mirtcheva D, et al. (2007) Food store availability and neighborhood 329 characteristics in the United States. Prev Med 44, 189–195. 330
7. Beaulac J, Kristjansson E & Cummins S (2009) A systematic review of food deserts, 1966-331 2007. Prev Chronic Dis 6, A105. 332
8. Larson NI, Story MT & Nelson MC (2009) Neighborhood environments: disparities in 333 access to healthy foods in the U.S. Am J Prev Med 36, 74–81. 334
9. Bower KM, Thorpe Jr. RJ, Rohde C, et al. (2014) The intersection of neighborhood racial 335 segregation, poverty, and urbanicity and its impact on food store availability in the United 336 States. Preventive Medicine 58, 33–39. 337
10. Kaufman P, Dicken C & Williams R (2014) Measuring Access to Healthful, Affordable 338 Food in American Indian and Alaska Native Tribal Areas. . 339
11. Schiller J, Lucas J & Peregoy J (2012) Summary health statistics for U.S. adults: National 340 Health Interview Survey, 2011. National Center for Health Statistics. 341
12. Must A, Spadano J, Coakley EH, et al. (1999) The disease burden associated with 342 overweight and obesity. JAMA 282, 1523–1529. 343
13. American Diabetes Association American Indian/Alaska Native Programs. 344 http://www.diabetes.org/in-my-community/awareness-programs/american-indian-programs/ 345
(accessed June 2014). 346
14. Basiotis PP, Lino M & Anand R (1999) The diet quality of American Indians: Evidence 347 from the continuing survey of food intakes by individuals. US Department of Health and 348 Human Services. 349
Assessing FDPIR Foods Using HEI-2010
15. Huet C, Rosol R & Egeland GM (2012) The prevalence of food insecurity is high and the 350
diet quality poor in Inuit communities. The Journal of nutrition 142, 541–547. 351
16. Bauer KW, Widome R, Himes JH, et al. (2012) High food insecurity and its correlates 352 among families living on a rural American Indian Reservation. American Journal Of Public 353 Health 102, 1346–1352. 354
17. Mercille G, Receveur O & Potvin L (2012) Household food insecurity and Canadian 355 aboriginal women’s self-efficacy in food preparation. Canadian Journal of Dietetic 356 Practice and Research 73, 134–140. 357
18. Gordon A & Oddo V (2012) Addressing Child Hunger and Obesity in Indian Country: 358 Report to Congress. . 359
19. Jernigan VBB, Salvatore AL, Styne DM, et al. (2011) Addressing food insecurity in a 360 Native American reservation using community-based participatory research. Health Educ. 361 Res., cyr089. 362
20. Edwards K (Kay) & Patchell B (2009) State of the Science: A Cultural View of Native 363 Americans and Diabetes Prevention. J Cult Divers 16, 32–35. 364
21. Wiedman D (2012) Native American Embodiment of the Chronicities of Modernity: 365 Reservation Food, Diabetes, and the Metabolic Syndrome among the Kiowa, Comanche, 366 and Apache. Medical Anthropology Quarterly 26, 595–612. 367
22. Fleischhacker S, Byrd RR, Ramachandran G, et al. (2012) Tools for healthy tribes: 368 improving access to healthy foods in Indian country. Am J Prev Med 43, S123–129. 369
23. Kuhnlein HV & Receveur O (1996) Dietary Change and Traditional Food Systems of 370 Indigenous Peoples. Annual Review of Nutrition 16, 417–442. 371
24. Compher C (2006) The Nutrition Transition in American Indians. J Transcult Nurs 17, 372 217–223. 373
25. Kappler CJ (1856) Treay with the Blackfeet, 1855. 736–740. Washington: Covernment 374 Printing Office. 375
26. Schamel CE & others (1989) Guide to the records of the United States House of 376 Representatives at the National Archives, 1789-1989. . 377
27. Standing Bear L (2006) Chapter VII: Rations: A war-party: Wild horses. In My People the 378 Sioux. Lincoln, NE: University of Nebraska Press. 379
28. Little Hill (1991) There are a good many women and children that are naked and cannot 380 come out of their tents, Little Hill, October 3, 1865) in Winnebago oratory: Great moments 381 in the recorded speech of the Hochungra, 1742-1887. Rochester, MN: Coyote Books. 382
Assessing FDPIR Foods Using HEI-2010
29. United States Congress (1974) Commodity distribution and food stamp programs hearings, 383
Ninety-third Congress, second session, on S. 2871 .. Washington: U.S. Govt. Print. Off. 384
30. United States Department of Agriculture & Food and Nutrition Services (2014) Food 385 Distribution Program on Indian Reservations. . 386
31. Fox MK, Hamilton WL & Lin B-H (2004) Effects of food assistance and nutrition 387 programs on nutrition and health. . 388
32. United States Department of Agriculture & Food and Nutrition Services (2014) Food 389 Distribution Program on Indian Reservations (FDPIR). http://www.fns.usda.gov/fdpir/food-390 distribution-program-indian-reservations-fdpir (accessed June 2014). 391
33. United States Department of Agriculture & Food and Nutrition Services (2014) Food 392
Distribution Program Tables. http://www.fns.usda.gov/pd/food-distribution-program-tables 393 (accessed June 2014). 394
34. United States Department of Agriculture, Food and Nutrition Services & Office of Research 395 and Analysis (2008) FDPIR Food Package Nutritional Quality: Report to Congress, by 396 Edward Harper, Rebecca Orbeta, Lisa Southworth, Karen Meade, Rosalind Cleveland, 397 Sheldon Gordon, Michael Buckley, and Jay Hirschman. Alexandria, VA: . 398
35. US Department of Health & Human Services, National Institutes of Health & National 399 Cancer Institute (2013) HEI Tools for Researchers. 400 http://appliedresearch.cancer.gov/tools/hei/tools.html (accessed November 2013). 401
36. Dietary Guidelines Advisory Committee (2010) Report of the Dietary Guidelines Advisory 402
Committee on the Dietary Guidelines for Americans, 2010, to the Secretary of Agriculture 403 and the Secretary of Health and Human Services. Agricultural Research Service. 404
37. US Department of Health and Human Services and US Department of Agriculture (2005) 405 Dietary Guidelines for Americans, 2005. . 406
38. US Department of Health & Human Services, National Institutes of Health & National 407 Cancer Institute (2014) Comparing the HEI-2005 & HEI-2010. 408 http://appliedresearch.cancer.gov/hei/comparing.html. 409
39. United States Department of Agriculture & Food and Nutrition Services (2014) FNS 410
Handbook 501 for FDPIR. http://www.fns.usda.gov/fdpir/fns-handbook-501-fdpir 411 (accessed August 2014). 412
40. DHHS, NIH & NCI (2013) Developing the Healthy Eating Index–2010. 413
http://appliedresearch.cancer.gov/tools/hei/developing.html (accessed November 2013). 414
41. Ahuja J, Montville J, Omolewa-Tomobi G, et al. (2012) USDA Food and Nutrient Database 415 for Dietary Studies, 5.0. U.S. Department of Agriculture, Agricultural Research Service, 416 Food Surveys Research Group, Beltsville, MD. . 417
Assessing FDPIR Foods Using HEI-2010
42. Center for Nutrition Policy and Promotion & United States Department of Agriculture 418
Healthy Eating Index Support Files 07 08. http://www.cnpp.usda.gov/healthy-eating-index-419 support-files-07-08 (accessed April 2015). 420
43. Erinosho TO, Ball SC, Hanson PP, et al. (2013) Assessing Foods Offered to Children at 421 Child-Care Centers Using the Healthy Eating Index-2005. Journal of the Academy of 422 Nutrition and Dietetics 113, 1084–1089. 423
44. Reedy J, Krebs-Smith SM & Bosire C (2010) Evaluating the food environment: application 424 of the Healthy Eating Index-2005. Am J Prev Med 38, 465–471. 425
45. United States Department of Agriculture, Food and Nutrition Services & Office of 426 Research, Nutrition and Analysis (2008) Diet Quality of American Young Children by WIC 427 Participation Status: Data from the National Health and Nutrition Examination Survey, 428
1999-2004, by Nancy Cole and Mary Kay Fox. Alexandria, VA: . 429
46. Gregory C, Ver Ploeg M, Andrews M, et al. (2013) Supplemental Nutrition Assistance 430 Program (SNAP) Participation Leads to Modest Changes in Diet Quality. Economic 431 Research Report. 432
47. Finegold K (2009) Tribal Food Assistance: A Comparison of the Food Distribution 433 Program on Indian Reservations (FDPIR) and the Supplemental Nutrition Assistance 434 Program (SNAP). US Department of Agriculture, Economic Research Service. 435
48. Food and Nutrition Services & United States Department of Agriculture Food Distribution 436 Program on Indian Reservations Nutrition Education Grants. Alexandria, Virginia: . 437
49. Byker C & Smith T (2015) Food assistance programs for children afford mixed dietary 438 quality based on HEI-2010. Nutrition Research 35, 35–40. 439
440
Tables
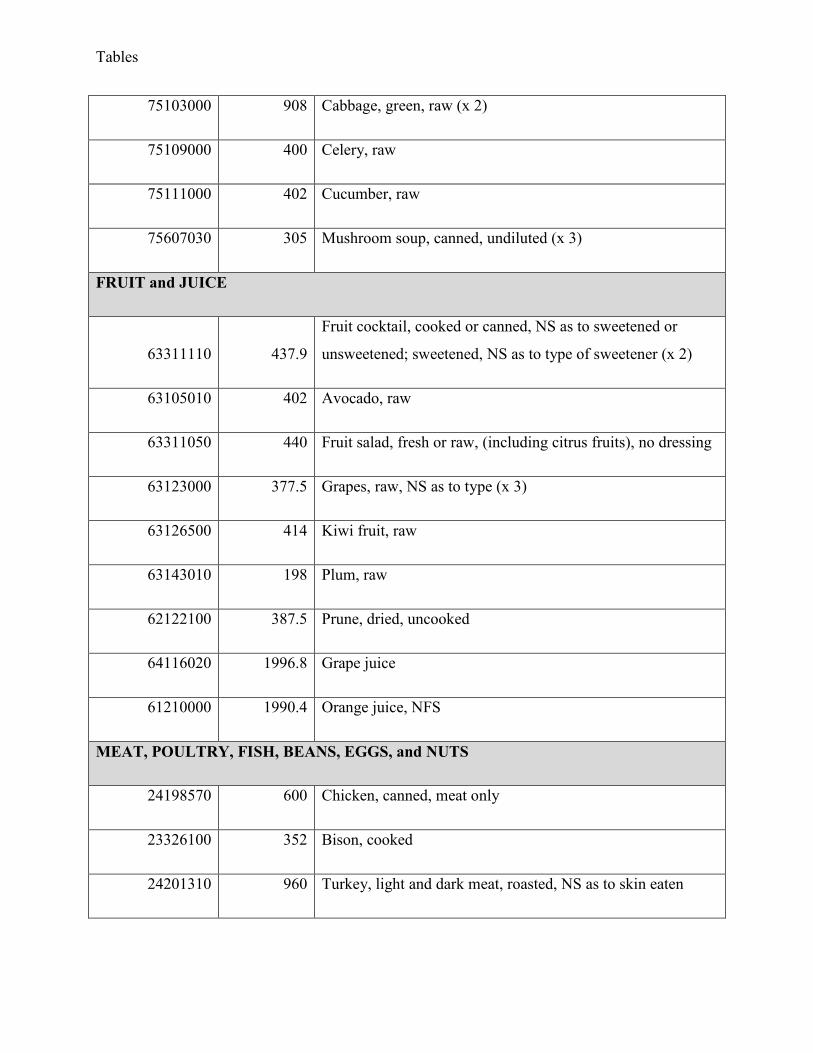
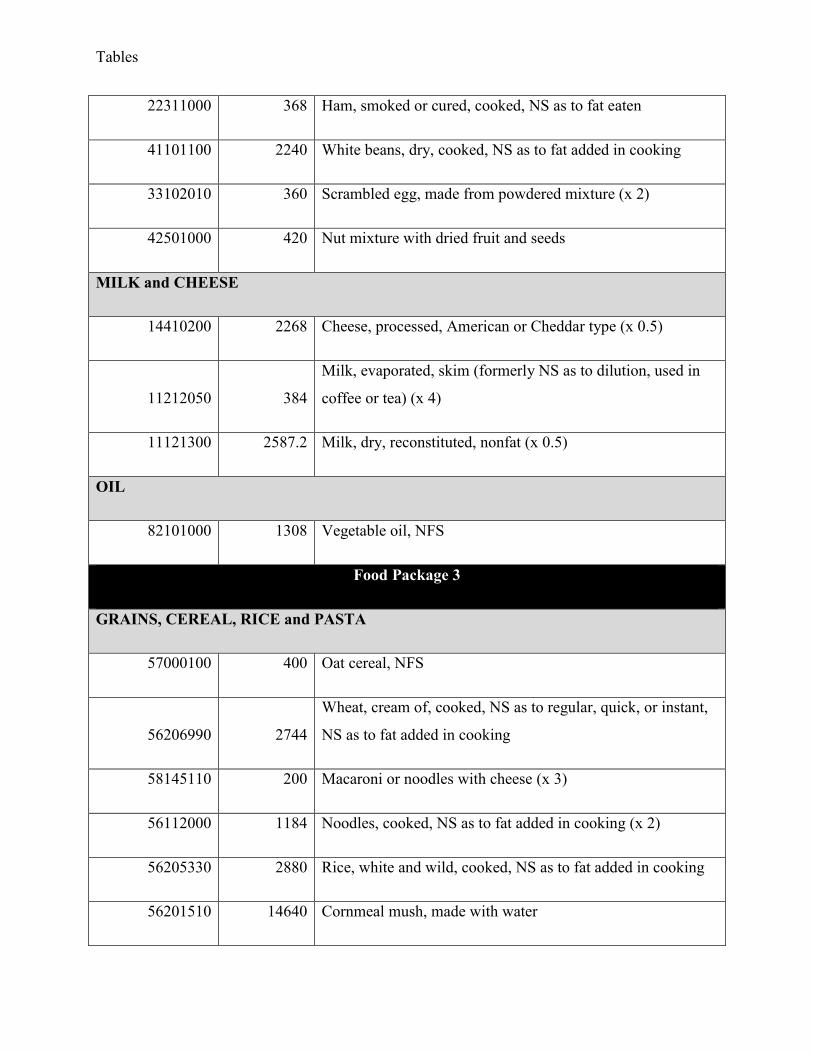
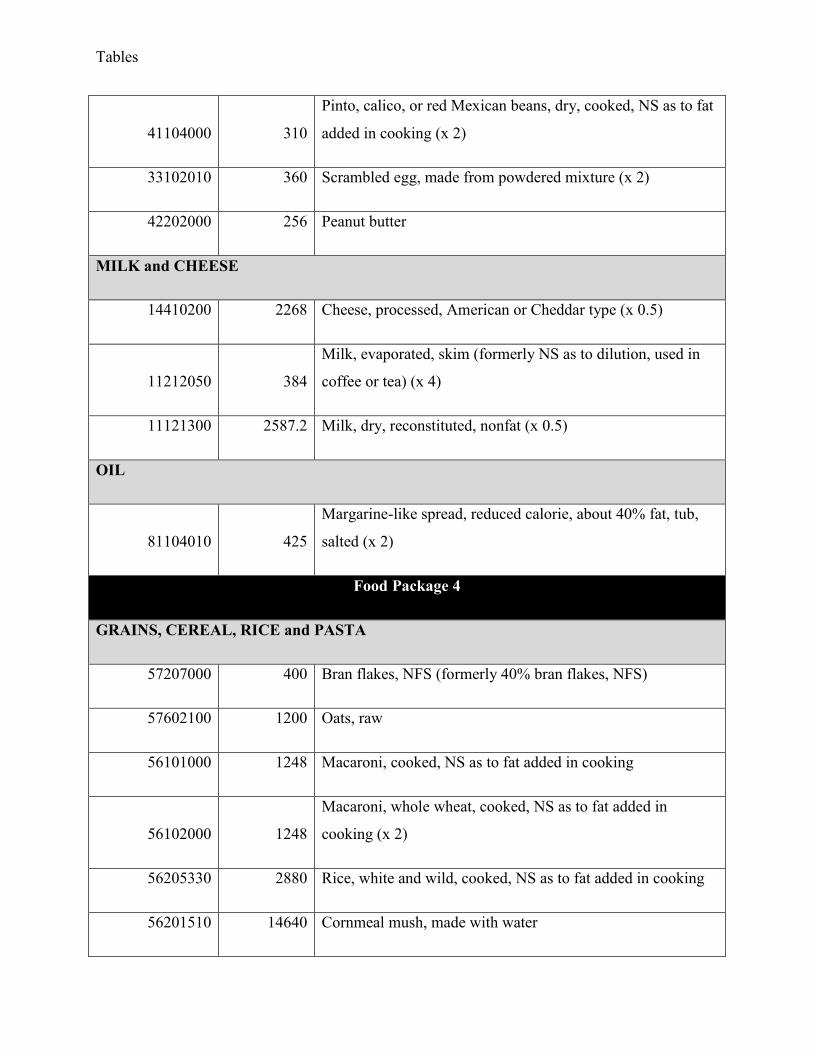
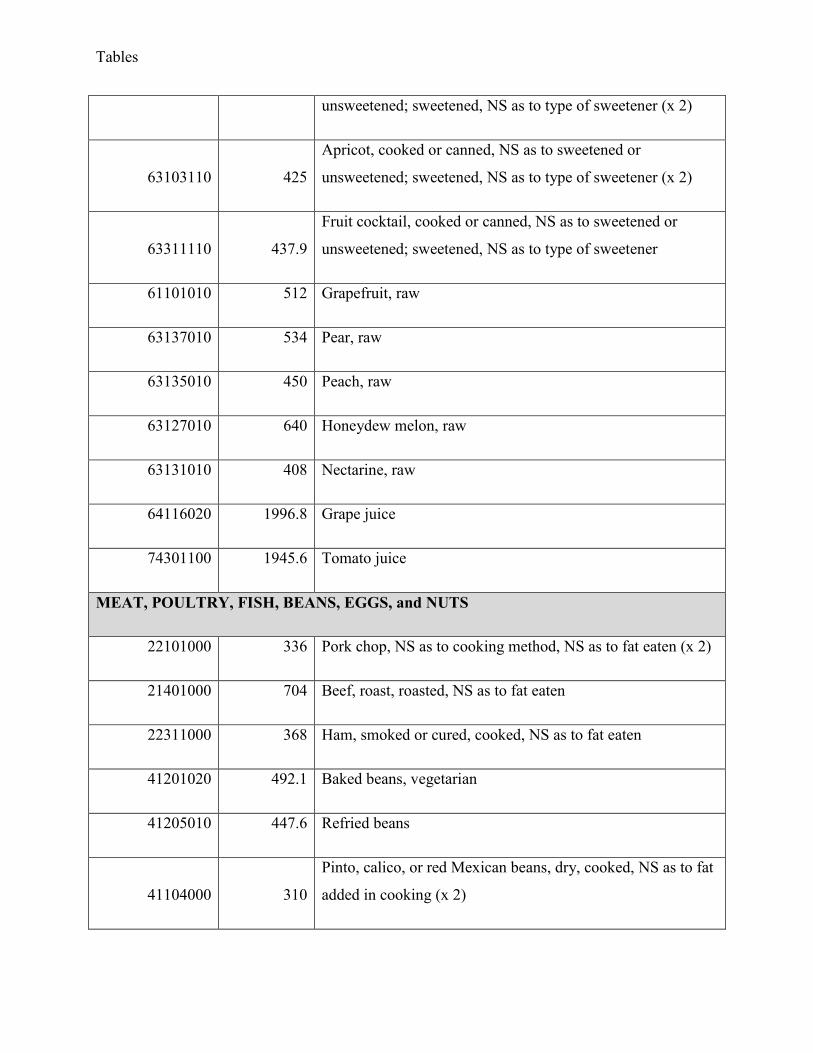
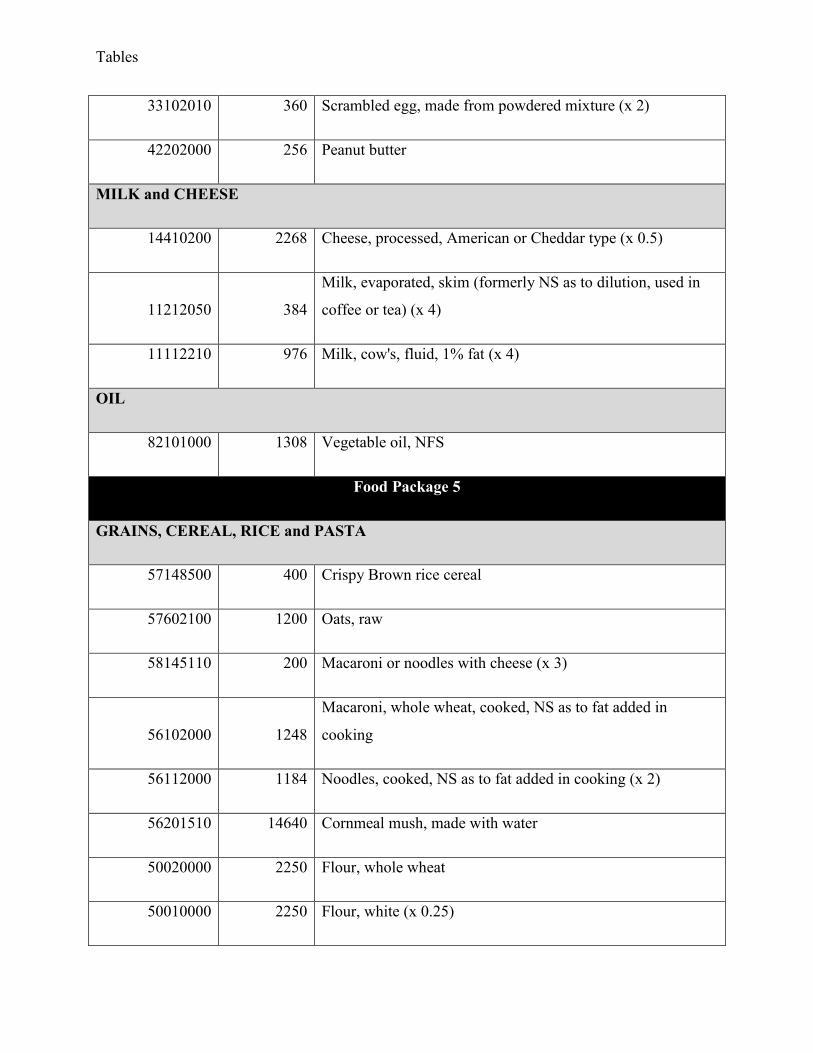
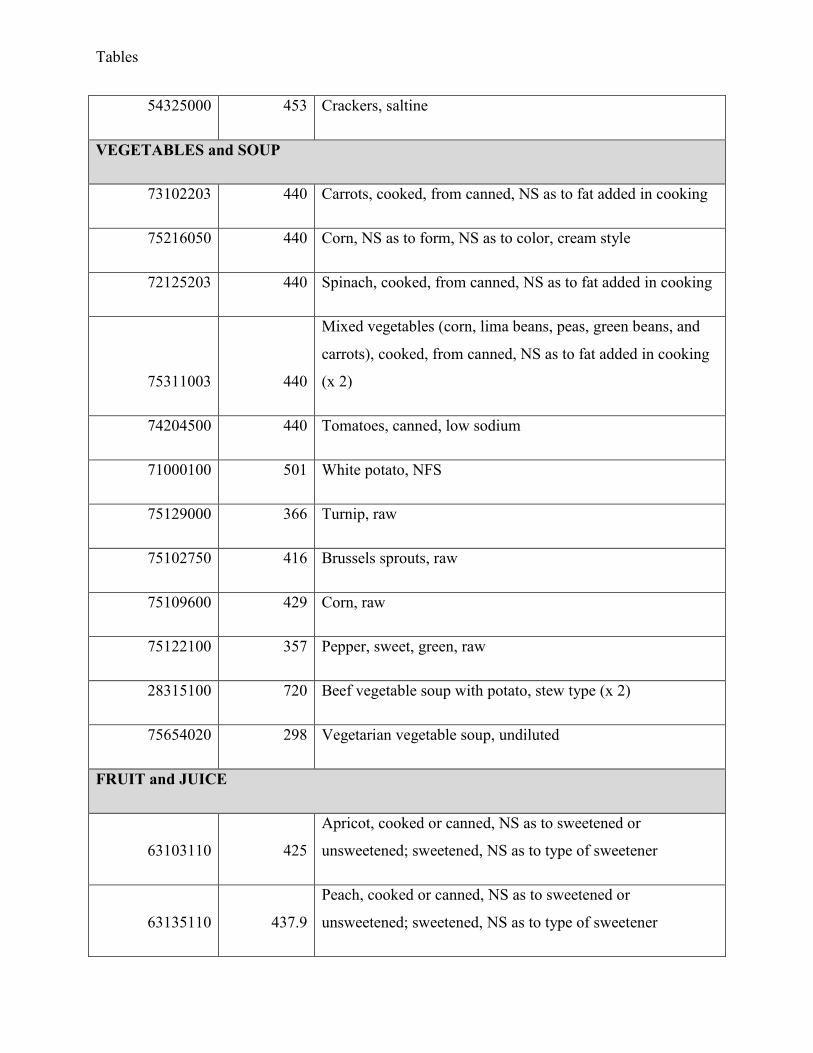
Table 1: USDA Food codes and foods for five sample monthly FDPIR food packages
USDA Food
Code
Grams Per
Food Item Food Item
Food Package 1
GRAINS, CEREAL, RICE and PASTA
57134000 400 Corn flakes, NFS
56206990 2744
Wheat, cream of, cooked, NS as to regular, quick, or instant,
NS as to fat added in cooking
56101000 1248 Macaroni, cooked, NS as to fat added in cooking (x 2)
56112000 1184 Noodles, cooked, NS as to fat added in cooking
56205330 2880 Rice, white and wild, cooked, NS as to fat added in cooking
50020000 2250 Flour, whole wheat (x 2)
50010000 2250 Flour, white (x 0.25)
54325000 453 Crackers, saltine
VEGETABLES and SOUP
73102203 440 Carrots, cooked, from canned, NS as to fat added in cooking
75216050 440 Corn, NS as to form, NS as to color, cream style
73201003 440
Pumpkin, cooked, from canned, NS as to fat added in
cooking
73101010 488 Carrots, raw
Tables
75117020 440 Onions, mature, raw
73401000 238 Sweet potato, NFS
75103000 908 Cabbage, green, raw
75125000 416 Radish, raw
75109600 429 Corn, raw
74101000 300.2 Tomatoes, raw
75122100 357 Pepper, sweet, green, raw
28315100 720 Beef vegetable soup with potato, stew type (x 2)
74601000 320.2 Tomato soup, NFS
FRUIT and JUICE
63101000 546 Apple, raw (x 2)
61101010 512 Grapefruit, raw (x 2)
63137010 534 Pear, raw
63127010 640 Honeydew melon, raw
63126500 414 Kiwi fruit, raw
63143010 198 Plum, raw
62122100 387.5 Prune, dried, uncooked
64104010 1984 Apple juice
61201220 1977.6 Grapefruit juice, canned, bottled or in a carton

Tables
MEAT, POULTRY, FISH, BEANS, EGGS, and NUTS
21500000 453.6 Ground beef, raw
23326100 352 Bison, cooked
21401000 704 Beef, roast, roasted, NS as to fat eaten
22311000 368 Ham, smoked or cured, cooked, NS as to fat eaten
41106000 279 Red kidney beans, dry, cooked, NS as to fat added in cooking
41205010 447.6 Refried beans (x 2)
41104000 310
Pinto, calico, or red Mexican beans, dry, cooked, NS as to fat
added in cooking
33102010 360 Scrambled egg, made from powdered mixture (x 2)
42501000 420 Nut mixture with dried fruit and seeds
MILK and CHEESE
14410200 2268 Cheese, processed, American or Cheddar type (x 0.5)
11212050 384
Milk, evaporated, skim (formerly NS as to dilution, used in
coffee or tea) (x 4)
11112210 976 Milk, cow's, fluid, 1% fat (x 4)
OIL
82101000 1308 Vegetable oil, NFS
Food Package 2
GRAINS, CEREAL, RICE and PASTA

Tables
57207000 400 Bran flakes, NFS (formerly 40% bran flakes, NFS)
57602100 1200 Oats, raw
58145110 200 Macaroni or noodles with cheese (x 3)
56101000 1248 Macaroni, cooked, NS as to fat added in cooking
56102000 1248
Macaroni, whole wheat, cooked, NS as to fat added in
cooking
56205330 2880 Rice, white and wild, cooked, NS as to fat added in cooking
56201510 14640 Cornmeal mush, made with water
50020000 2250 Flour, whole wheat
50010000 2250 Flour, white (x 0.25)
54325000 453 Crackers, saltine
VEGETABLES and SOUP
56200990 440
Grits, cooked, corn or hominy, NS as to regular, quick or
instant, NS as to fat added in cooking
74404010 440 Spaghetti sauce, meatless
73101010 488 Carrots, raw
71000100 334 White potato, NFS
73302010 280 Squash, winter type, raw
75128000 392 Squash, summer, yellow, raw
73401000 238 Sweet potato, NFS
Tables
75103000 908 Cabbage, green, raw (x 2)
75109000 400 Celery, raw
75111000 402 Cucumber, raw
75607030 305 Mushroom soup, canned, undiluted (x 3)
FRUIT and JUICE
63311110 437.9
Fruit cocktail, cooked or canned, NS as to sweetened or
unsweetened; sweetened, NS as to type of sweetener (x 2)
63105010 402 Avocado, raw
63311050 440 Fruit salad, fresh or raw, (including citrus fruits), no dressing
63123000 377.5 Grapes, raw, NS as to type (x 3)
63126500 414 Kiwi fruit, raw
63143010 198 Plum, raw
62122100 387.5 Prune, dried, uncooked
64116020 1996.8 Grape juice
61210000 1990.4 Orange juice, NFS
MEAT, POULTRY, FISH, BEANS, EGGS, and NUTS
24198570 600 Chicken, canned, meat only
23326100 352 Bison, cooked
24201310 960 Turkey, light and dark meat, roasted, NS as to skin eaten
Tables
22311000 368 Ham, smoked or cured, cooked, NS as to fat eaten
41101100 2240 White beans, dry, cooked, NS as to fat added in cooking
33102010 360 Scrambled egg, made from powdered mixture (x 2)
42501000 420 Nut mixture with dried fruit and seeds
MILK and CHEESE
14410200 2268 Cheese, processed, American or Cheddar type (x 0.5)
11212050 384
Milk, evaporated, skim (formerly NS as to dilution, used in
coffee or tea) (x 4)
11121300 2587.2 Milk, dry, reconstituted, nonfat (x 0.5)
OIL
82101000 1308 Vegetable oil, NFS
Food Package 3
GRAINS, CEREAL, RICE and PASTA
57000100 400 Oat cereal, NFS
56206990 2744
Wheat, cream of, cooked, NS as to regular, quick, or instant,
NS as to fat added in cooking
58145110 200 Macaroni or noodles with cheese (x 3)
56112000 1184 Noodles, cooked, NS as to fat added in cooking (x 2)
56205330 2880 Rice, white and wild, cooked, NS as to fat added in cooking
56201510 14640 Cornmeal mush, made with water
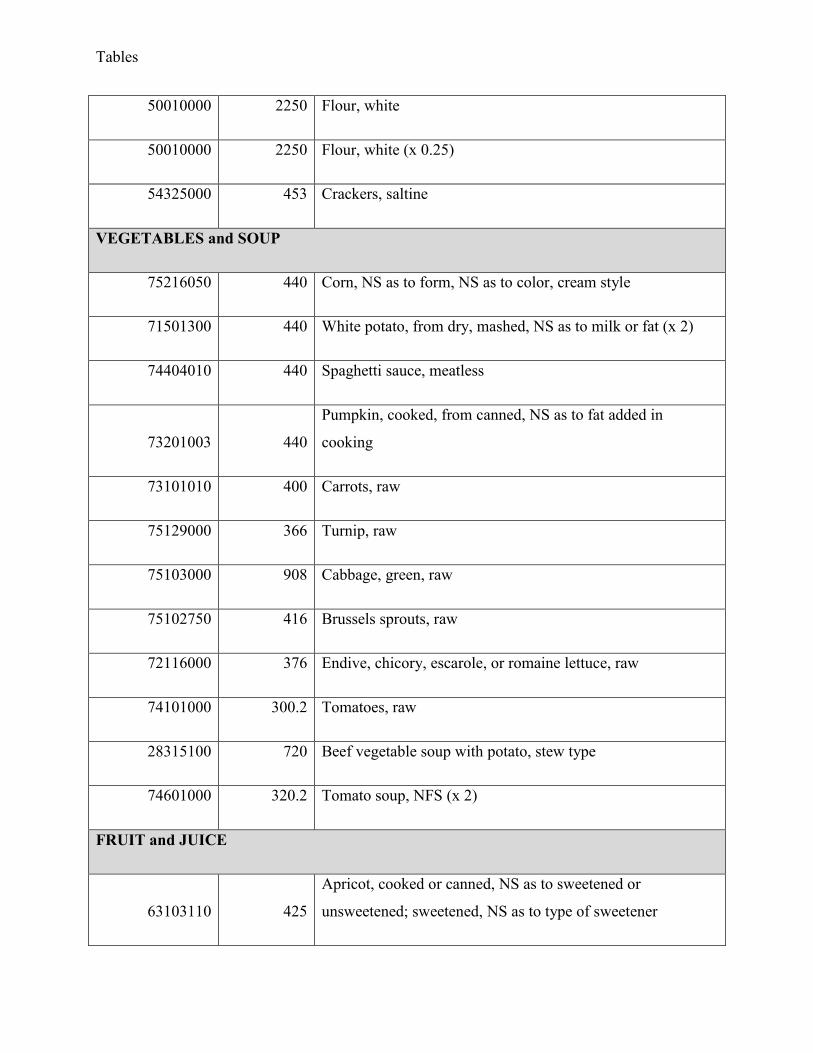
Tables
50010000 2250 Flour, white
50010000 2250 Flour, white (x 0.25)
54325000 453 Crackers, saltine
VEGETABLES and SOUP
75216050 440 Corn, NS as to form, NS as to color, cream style
71501300 440 White potato, from dry, mashed, NS as to milk or fat (x 2)
74404010 440 Spaghetti sauce, meatless
73201003 440
Pumpkin, cooked, from canned, NS as to fat added in
cooking
73101010 400 Carrots, raw
75129000 366 Turnip, raw
75103000 908 Cabbage, green, raw
75102750 416 Brussels sprouts, raw
72116000 376 Endive, chicory, escarole, or romaine lettuce, raw
74101000 300.2 Tomatoes, raw
28315100 720 Beef vegetable soup with potato, stew type
74601000 320.2 Tomato soup, NFS (x 2)
FRUIT and JUICE
63103110 425
Apricot, cooked or canned, NS as to sweetened or
unsweetened; sweetened, NS as to type of sweetener
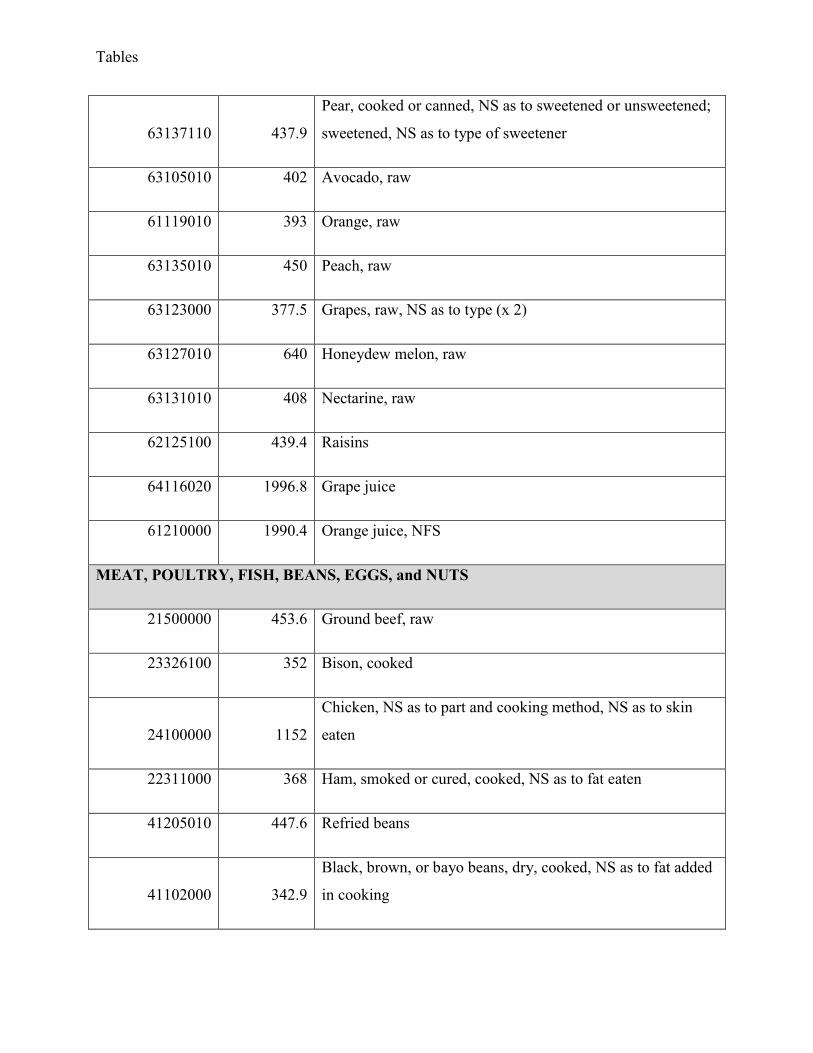
Tables
63137110 437.9
Pear, cooked or canned, NS as to sweetened or unsweetened;
sweetened, NS as to type of sweetener
63105010 402 Avocado, raw
61119010 393 Orange, raw
63135010 450 Peach, raw
63123000 377.5 Grapes, raw, NS as to type (x 2)
63127010 640 Honeydew melon, raw
63131010 408 Nectarine, raw
62125100 439.4 Raisins
64116020 1996.8 Grape juice
61210000 1990.4 Orange juice, NFS
MEAT, POULTRY, FISH, BEANS, EGGS, and NUTS
21500000 453.6 Ground beef, raw
23326100 352 Bison, cooked
24100000 1152
Chicken, NS as to part and cooking method, NS as to skin
eaten
22311000 368 Ham, smoked or cured, cooked, NS as to fat eaten
41205010 447.6 Refried beans
41102000 342.9
Black, brown, or bayo beans, dry, cooked, NS as to fat added
in cooking
Tables
41104000 310
Pinto, calico, or red Mexican beans, dry, cooked, NS as to fat
added in cooking (x 2)
33102010 360 Scrambled egg, made from powdered mixture (x 2)
42202000 256 Peanut butter
MILK and CHEESE
14410200 2268 Cheese, processed, American or Cheddar type (x 0.5)
11212050 384
Milk, evaporated, skim (formerly NS as to dilution, used in
coffee or tea) (x 4)
11121300 2587.2 Milk, dry, reconstituted, nonfat (x 0.5)
OIL
81104010 425
Margarine-like spread, reduced calorie, about 40% fat, tub,
salted (x 2)
Food Package 4
GRAINS, CEREAL, RICE and PASTA
57207000 400 Bran flakes, NFS (formerly 40% bran flakes, NFS)
57602100 1200 Oats, raw
56101000 1248 Macaroni, cooked, NS as to fat added in cooking
56102000 1248
Macaroni, whole wheat, cooked, NS as to fat added in
cooking (x 2)
56205330 2880 Rice, white and wild, cooked, NS as to fat added in cooking
56201510 14640 Cornmeal mush, made with water

Tables
50010000 2250 Flour, white
50010000 2250 Flour, white (x 0.25)
54325000 453 Crackers, saltine
VEGETABLES and SOUP
56200990 440
Grits, cooked, corn or hominy, NS as to regular, quick or
instant, NS as to fat added in cooking
75224013 440
Peas, green, cooked, from canned, NS as to fat added in
cooking
72125203 440 Spinach, cooked, from canned, NS as to fat added in cooking
71501300 440 White potato, from dry, mashed, NS as to milk or fat
73101010 400 Carrots, raw (x 2)
71000100 334 White potato, NFS
75102750 416 Brussels sprouts, raw
72116000 376 Endive, chicory, escarole, or romaine lettuce, raw
74101000 298 Tomatoes, raw
74101000 300.2 Tomatoes, raw
28315100 720 Beef vegetable soup with potato, stew type (x 2)
74601000 320.2 Tomato soup, NFS
FRUIT and JUICE
63101110 437.9 Applesauce, stewed apples, NS as to sweetened or
Tables
unsweetened; sweetened, NS as to type of sweetener (x 2)
63103110 425
Apricot, cooked or canned, NS as to sweetened or
unsweetened; sweetened, NS as to type of sweetener (x 2)
63311110 437.9
Fruit cocktail, cooked or canned, NS as to sweetened or
unsweetened; sweetened, NS as to type of sweetener
61101010 512 Grapefruit, raw
63137010 534 Pear, raw
63135010 450 Peach, raw
63127010 640 Honeydew melon, raw
63131010 408 Nectarine, raw
64116020 1996.8 Grape juice
74301100 1945.6 Tomato juice
MEAT, POULTRY, FISH, BEANS, EGGS, and NUTS
22101000 336 Pork chop, NS as to cooking method, NS as to fat eaten (x 2)
21401000 704 Beef, roast, roasted, NS as to fat eaten
22311000 368 Ham, smoked or cured, cooked, NS as to fat eaten
41201020 492.1 Baked beans, vegetarian
41205010 447.6 Refried beans
41104000 310
Pinto, calico, or red Mexican beans, dry, cooked, NS as to fat
added in cooking (x 2)
Tables
33102010 360 Scrambled egg, made from powdered mixture (x 2)
42202000 256 Peanut butter
MILK and CHEESE
14410200 2268 Cheese, processed, American or Cheddar type (x 0.5)
11212050 384
Milk, evaporated, skim (formerly NS as to dilution, used in
coffee or tea) (x 4)
11112210 976 Milk, cow's, fluid, 1% fat (x 4)
OIL
82101000 1308 Vegetable oil, NFS
Food Package 5
GRAINS, CEREAL, RICE and PASTA
57148500 400 Crispy Brown rice cereal
57602100 1200 Oats, raw
58145110 200 Macaroni or noodles with cheese (x 3)
56102000 1248
Macaroni, whole wheat, cooked, NS as to fat added in
cooking
56112000 1184 Noodles, cooked, NS as to fat added in cooking (x 2)
56201510 14640 Cornmeal mush, made with water
50020000 2250 Flour, whole wheat
50010000 2250 Flour, white (x 0.25)
Tables
54325000 453 Crackers, saltine
VEGETABLES and SOUP
73102203 440 Carrots, cooked, from canned, NS as to fat added in cooking
75216050 440 Corn, NS as to form, NS as to color, cream style
72125203 440 Spinach, cooked, from canned, NS as to fat added in cooking
75311003 440
Mixed vegetables (corn, lima beans, peas, green beans, and
carrots), cooked, from canned, NS as to fat added in cooking
(x 2)
74204500 440 Tomatoes, canned, low sodium
71000100 501 White potato, NFS
75129000 366 Turnip, raw
75102750 416 Brussels sprouts, raw
75109600 429 Corn, raw
75122100 357 Pepper, sweet, green, raw
28315100 720 Beef vegetable soup with potato, stew type (x 2)
75654020 298 Vegetarian vegetable soup, undiluted
FRUIT and JUICE
63103110 425
Apricot, cooked or canned, NS as to sweetened or
unsweetened; sweetened, NS as to type of sweetener
63135110 437.9
Peach, cooked or canned, NS as to sweetened or
unsweetened; sweetened, NS as to type of sweetener

Tables
63137110 437.9
Pear, cooked or canned, NS as to sweetened or unsweetened;
sweetened, NS as to type of sweetener
63311110 437.9
Fruit cocktail, cooked or canned, NS as to sweetened or
unsweetened; sweetened, NS as to type of sweetener
63137010 534 Pear, raw (x 2)
63135010 450 Peach, raw
63126500 414 Kiwi fruit, raw
62122100 387.5 Prune, dried, uncooked
61201220 1977.6 Grapefruit juice, canned, bottled or in a carton
74301100 1945.6 Tomato juice
MEAT, POULTRY, FISH, BEANS, EGGS, and NUTS
21500000 453.6 Ground beef, raw
24100000 1152
Chicken, NS as to part and cooking method, NS as to skin
eaten
21401000 704 Beef, roast, roasted, NS as to fat eaten
22311000 368 Ham, smoked or cured, cooked, NS as to fat eaten
41106000 279
Red kidney beans, dry, cooked, NS as to fat added in cooking
(x 2)
41102000 342.9
Black, brown, or Bayo beans, dry, cooked, NS as to fat added
in cooking
41104000 310 Pinto, calico, or red Mexican beans, dry, cooked, NS as to fat

Tables
added in cooking
33102010 360 Scrambled egg, made from powdered mixture (x 2)
42111110 453.6 Peanuts, roasted, without salt
MILK and CHEESE
14410200 2268 Cheese, processed, American or Cheddar type (x 0.5)
11212050 384
Milk, evaporated, skim (formerly NS as to dilution, used in
coffee or tea) (x 4)
11112210 976 Milk, cow's, fluid, 1% fat (x 4)
OIL
81100500 454 Butter, NFS
Tables
Table 2. HEI-2010a component and total scores for each of the five sample monthly food
packages (n = 5)
Component Maxi
mum
Value
Standard for
Maximum
Score
Standard for
Minimum
Score of Zero
Mean
(SD)
Ran
ge
%
Meeti
ng
Maxi
mum
Value
(n) j
Total Fruitb 5 ≥0.8 cup
equivalent per
1,000 kcal
No Fruit
3.52
(0.73)*
2.60
–
4.40 0 (0)
Whole Fruitc 5 ≥0.4 cup
equivalent per
1,000 kcal
No Whole Fruit
4.60
(0.52)
3.90
–
5.00
40.0
(2)
Total Vegetablesd 5 ≥1.1 cup
equivalents per
1,000 kcal
No Vegetables
2.58
(0.15)***
2.40
-
2.80 0 (0)
Greens and Beansd 5 ≥0.2 cup
equivalent per
1,000 kcal
No Dark Green
Vegetables or
Beans and Peas
0.92
(1.00)***
0.00
-
2.20 0 (0)
Whole Grains 10 ≥1.5 oz.
equivalents per
1,000 kcal
No Whole
Grains
7.88
(3.68)
1.50
–
10.0
0
60.0
(3)
Dairye 10 ≥1.3 cup
equivalents per
No Dairy
5.12
4.20
- 0 (0)
Tables
1,000 kcal (0.63)*** 5.70
Total Protein
Foodsf
5 ≥2.5 oz.
equivalents per
1,000 kcal
No Protein
Foods 4.14
(0.56)*
3.30
-
4.80 0 (0)
Seafood and Plant
Proteinsf,g
5 ≥0.8 oz.
equivalent per
1,000 kcal
No Seafood or
Plant Proteins 4.64
(0.53)
3.80
–
5.00
60.0
(3)
Fatty Acidsh 10 (PUFAs+MUF
As)/SFAs >2.5
(PUFAs+MUF
As)/SFAs ≤1.2
4.80
(4.55)
0.00
–
10.0
0
20.0
(1)
Refined Grains 10 ≤1.8 oz.
equivalents per
1,000 kcal
≥4.3 oz.
equivalents per
1,000 kcal
3.04
(2.90)**
0.00
-
6.40 0 (0)
Sodium 10 ≤1.1 g per 1,000
kcal
≥2.0 g per 1,000
kcal 5.08
(3.15)*
0.70
-
9.30 0 (0)
Empty Caloriesi 20 ≤19% of energy ≥50% of energy
20.00 (0)
20.0
0 –
20.0
0
100.0
(5)
Total 100
66.38
(11.60)**
49.5
0 -
79.5
0
--
Tables
note: *p<0.05; **p<0.01; ***p<0.001
aIntakes between the minimum and maximum standards are scored proportionately.
bIncludes fruit juice.
cIncludes all forms except juice.
dIncludes any beans and peas not counted as Total Protein Foods
eIncludes all milk products, such as fluid milk, yogurt, and cheese, and fortified soy beverages.
fBeans and peas are included here (and not with vegetables) when the Total Protein Foods
standard is otherwise not met.
gIncludes seafood, nuts, seeds, soy products (other than beverages) as well as beans and peas
counted as Total Protein Foods.
hRatio of polyunsaturated fatty acids (PUFAs) and monounsaturated fatty acids (MUFAs) to
saturated fatty acids (SFAs).
iCalories from solid fats, alcohol, and added sugars; threshold for counting alcohol is >13
g/1,000 kcal.
j Includes the 5 sample monthly food packages.