Embed Size (px)
Citation preview
International Journal of Engineering and Technical Research (IJETR)
ISSN: 2321-0869 (O) 2454-4698 (P), Volume-6, Issue-1, September 2016
40 www.erpublication.org
Abstract— Panjshir watershed plays an important role in
surface runoff potential and ground water flow in the Kabul
River Basin (KRB) in Afghanistan. Therefore, it is very
necessary to know the impact of natural resources on water
discharge and water balance in this important watershed. Also
for sustainable water resource management, the evaluation of
landuse and landcover (LULC) change on the hydrology of a
watershed is essential. This will helps and easy to understand
how each LULC class influences the hydrological components of
the river basin. In this study the objective is first want to apply
the GIS and SWAT (Soil and Water Assessment Tool) model to
estimate daily water discharge and then assess the landuse
change impacts on runoff generation in Shukhi station (Outlet
17) located within the watershed. The daily observed stream
flow data was available from 2010-2013 in this station.
Therefore, the daily simulation has carried out for the
mentioned period. The daily model calibration and validation
performed by SWAT-CUP software, which calibrated from
2010-2012 and validated in 2013 for discharge. Two scenarios
were performed in this research. The scenario 1 (Landuse/cover
1993) performed first. Subsequently using SWAT-CUP
software for calibration, NSI reached (0.76) and coefficient of
determination R2 achieved (0.81) from 2010 to 2012 in
calibration and NSI gained good level at (0.74) and R2 got (0.76)
in validation step at Shukhi Station. Then land cover in 2010
processed same like the land cover in 1993 for the scenario 2
(Landuse/cover 2010), then set up SWAT model again. After
that the second scenario also calibrated and validated. Both
scenarios were compared to analyses the difference water flow.
During landuse comparison the urban, garden, forest increased
whereas snow & water, barren land and rainfed agriculture
decreases but there is small changes in rangeland and irrigated
agriculture which is not significant. Hence as result, Average
annual surface flow decreased from by 10.24% to 7.2%,
whereas the average annual ground water flow increased by
70.07% to 73.48% in Scenario 2. The average annual total water
yield decreased from 253.37mm to 227.76mm. In this study
unfortunately because of lacking of time series observed
sediment data, the calibration not performed for sediment yield
estimation. But the effects of LULC change assessed between
two scenarios (LULC 1993 and LULC 2010).
Index Terms— Panjshir Watershed, Landuse/Landcover
Change, SWAT Model, Geographic information system.
I. INTRODUCTION
Water is finite and vulnerable resource. Water is needed
for different purposes, functions and services, therefore, water
demand for and treat to this resource. Surface runoff is usually
Tooryalay Ayoubi, Graduate School of Engineering and Science,
University of the Ryukyus, Okinawa, Japan, 050-3550-0007.
Dongshik Kang, Information Engineering, University of the Ryukyus,
Okinawa, Japan, 090-1949-9546.
management should be integrated and take account of both
affected by many natural factors, such as soil types and
texture, geomorphologic condition, temperature,
precipitation and also anthropogenic activities such as
presence of reservoirs, dams and other irrigation canal, LULC
change etc. The population growth increases demands for
water in daily lives, decreases forests and change the
agricultural fields to urbanization. Also due to development in
a catchment, the impervious area and deforestation
continuously increases which results in increasing velocity
and quantity of runoff. The increasing scarcity of water
resources, hydrological impacts of LULC change has drawn
attention among hydrological researchers, decision and policy
makers throughout the world. These problems can be
addressed by using a Geographic Information System (GIS)
that is efficient for spatial and temporal data analysis together
with Remote Sensing (RS) data that can provide widely,
regularly updated, and reliable data (Petchprayoon et al.,
2010) [1]. Based on our previous research (Ayoubi1 and
Dongshik2, 2016) [2] the monthly surface runoff investigated
by SWAT model and GIS in three gage stations namely
(Omerz, Pul-Ashawa and Shukhi) in Panjshir watershed
which the model showed good performance. Hence, in this
study the LULC change with respect to population growth is
needed to sustainably manage the water scarcity and water
resources at watershed level. Therefore, the objective of the
study is to do daily runoff modelling and evaluate the landuse
change effects on surface runoff in Panjshir watershed using
Soil and Water Assessment Tool (SWAT) and GIS.
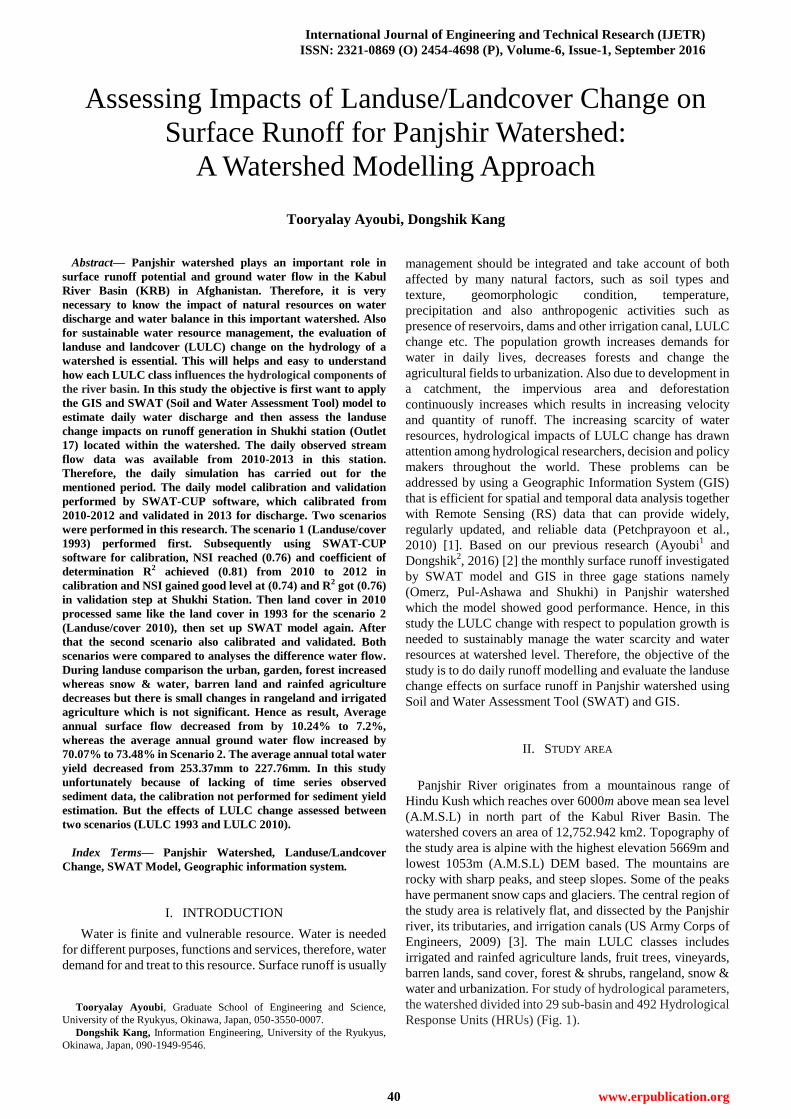
II. STUDY AREA
Panjshir River originates from a mountainous range of
Hindu Kush which reaches over 6000m above mean sea level
(A.M.S.L) in north part of the Kabul River Basin. The
watershed covers an area of 12,752.942 km2. Topography of
the study area is alpine with the highest elevation 5669m and
lowest 1053m (A.M.S.L) DEM based. The mountains are
rocky with sharp peaks, and steep slopes. Some of the peaks
have permanent snow caps and glaciers. The central region of
the study area is relatively flat, and dissected by the Panjshir
river, its tributaries, and irrigation canals (US Army Corps of
Engineers, 2009) [3]. The main LULC classes includes
irrigated and rainfed agriculture lands, fruit trees, vineyards,
barren lands, sand cover, forest & shrubs, rangeland, snow &
water and urbanization. For study of hydrological parameters,
the watershed divided into 29 sub-basin and 492 Hydrological
Response Units (HRUs) (Fig. 1).
Assessing Impacts of Landuse/Landcover Change on
Surface Runoff for Panjshir Watershed:
A Watershed Modelling Approach
Tooryalay Ayoubi, Dongshik Kang
Assessing Impacts of Landuse/Landcover Change on Surface Runoff for Panjshir Watershed: A Watershed Modelling
Approach
41 www.erpublication.org
Fig. 1: Study Area, 29 Sub-basin and 492 HRUs.
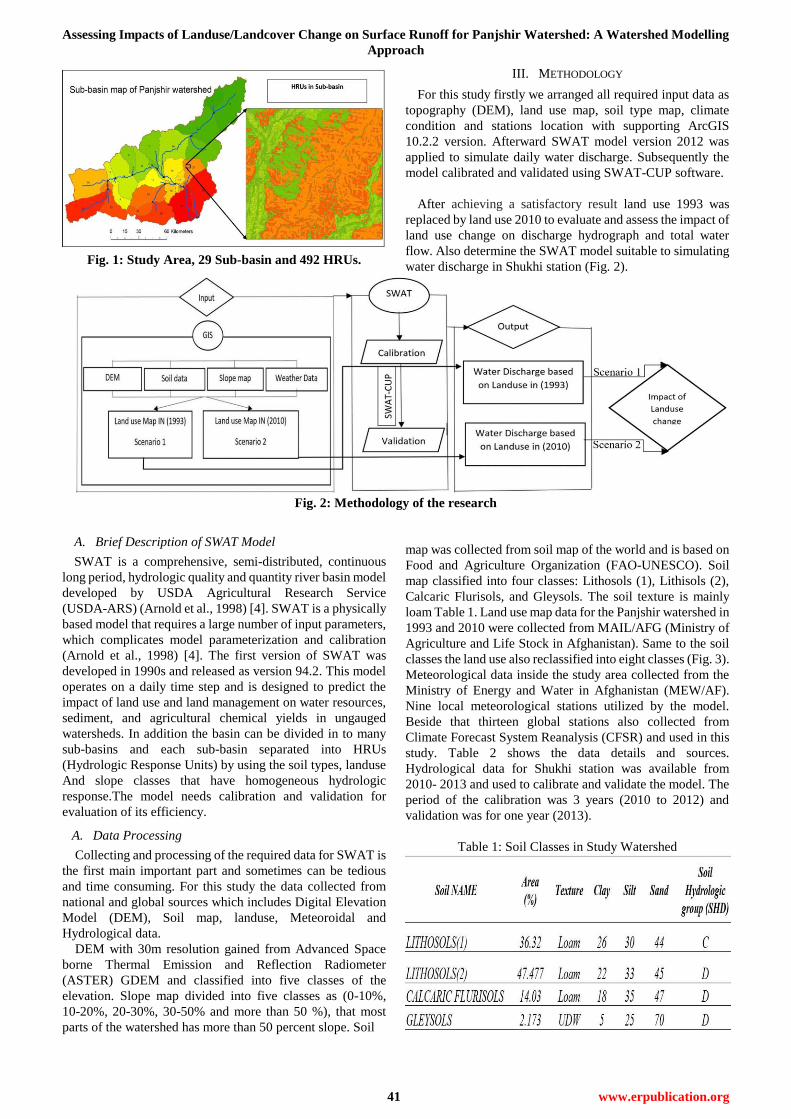
III. METHODOLOGY
For this study firstly we arranged all required input data as
topography (DEM), land use map, soil type map, climate
condition and stations location with supporting ArcGIS
10.2.2 version. Afterward SWAT model version 2012 was
applied to simulate daily water discharge. Subsequently the
model calibrated and validated using SWAT-CUP software.
After achieving a satisfactory result land use 1993 was
replaced by land use 2010 to evaluate and assess the impact of
land use change on discharge hydrograph and total water
flow. Also determine the SWAT model suitable to simulating
water discharge in Shukhi station (Fig. 2).
Fig. 2: Methodology of the research
A. Brief Description of SWAT Model
SWAT is a comprehensive, semi-distributed, continuous
long period, hydrologic quality and quantity river basin model
developed by USDA Agricultural Research Service
(USDA-ARS) (Arnold et al., 1998) [4]. SWAT is a physically
based model that requires a large number of input parameters,
which complicates model parameterization and calibration
(Arnold et al., 1998) [4]. The first version of SWAT was
developed in 1990s and released as version 94.2. This model
operates on a daily time step and is designed to predict the
impact of land use and land management on water resources,
sediment, and agricultural chemical yields in ungauged
watersheds. In addition the basin can be divided in to many
sub-basins and each sub-basin separated into HRUs
(Hydrologic Response Units) by using the soil types, landuse
And slope classes that have homogeneous hydrologic
response.The model needs calibration and validation for
evaluation of its efficiency.
A. Data Processing
Collecting and processing of the required data for SWAT is
the first main important part and sometimes can be tedious
and time consuming. For this study the data collected from
national and global sources which includes Digital Elevation
Model (DEM), Soil map, landuse, Meteoroidal and
Hydrological data.
DEM with 30m resolution gained from Advanced Space
borne Thermal Emission and Reflection Radiometer
(ASTER) GDEM and classified into five classes of the
elevation. Slope map divided into five classes as (0-10%,
10-20%, 20-30%, 30-50% and more than 50 %), that most
parts of the watershed has more than 50 percent slope. Soil
map was collected from soil map of the world and is based on
Food and Agriculture Organization (FAO-UNESCO). Soil
map classified into four classes: Lithosols (1), Lithisols (2),
Calcaric Flurisols, and Gleysols. The soil texture is mainly
loam Table 1. Land use map data for the Panjshir watershed in
1993 and 2010 were collected from MAIL/AFG (Ministry of
Agriculture and Life Stock in Afghanistan). Same to the soil
classes the land use also reclassified into eight classes (Fig. 3).
Meteorological data inside the study area collected from the
Ministry of Energy and Water in Afghanistan (MEW/AF).
Nine local meteorological stations utilized by the model.
Beside that thirteen global stations also collected from
Climate Forecast System Reanalysis (CFSR) and used in this
study. Table 2 shows the data details and sources.
Hydrological data for Shukhi station was available from
2010- 2013 and used to calibrate and validate the model. The
period of the calibration was 3 years (2010 to 2012) and
validation was for one year (2013).
Table 1: Soil Classes in Study Watershed
International Journal of Engineering and Technical Research (IJETR)
ISSN: 2321-0869 (O) 2454-4698 (P), Volume-6, Issue-1, September 2016
42 www.erpublication.org
IV. RESULTS AND DISCUSSION
A. Model Calibration in Shukhi Station
First the discharge estimated by SWAT model with Land
use 1993 (scenario 1). The model was setup for 29 sub-basin
and the measured discharge was available from 2010-2013
for Shukhi station in study area to calculate and calibrate the
runoff of the model. Because SWAT model has hundreds of
parameters where a suitable range for each parameter is
defined, it is difficult for researchers and water managers to
find out the fitted parameters which base to spatial
characteristics and suit for study area. So the fitting of
parameters implemented by automatic calibration Sufi-2
Algorithm in SWAT-CUP software. Based on sensitivity
analysis which has done on 27 parameters that affects the
discharge hydrographs and total amount of runoff, we found
11 parameters was more effective fitting the hydrograph and
estimation of water quantity in Shukhi station. SWAT-CUP
was set up to calibrate the model with four iterations. Each
iteration was 500 simulation that totally 2000 simulation done
to calibrate the model. For each parameter the fixed values
obtained during calibration. Table 3 shows the calibrated
parameters value. Then the land use in 1993 was replaced by
land use 2010 without farther changes of other inputs for
scenario 2. SWAT ran performed again for Panjshir
watershed with 29 sub-basin to estimate discharge quantity
and discharge hydrograph.
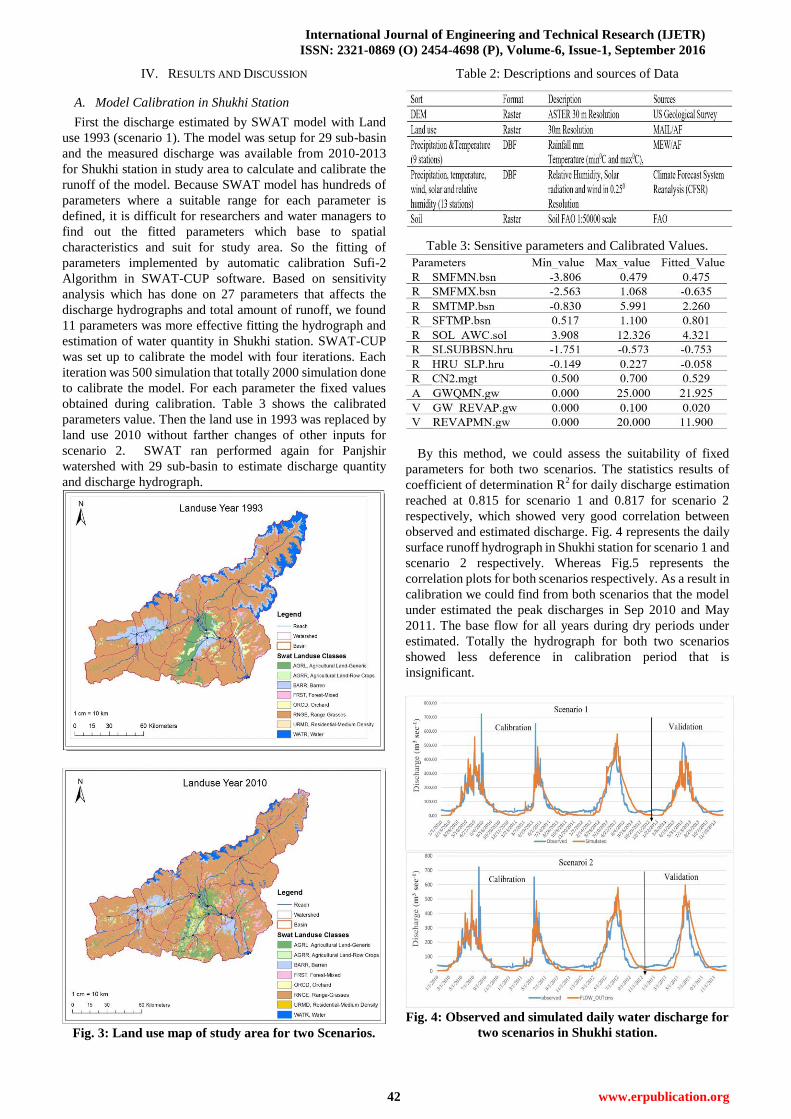
Fig. 3: Land use map of study area for two Scenarios.
Table 2: Descriptions and sources of Data
Table 3: Sensitive parameters and Calibrated Values.
By this method, we could assess the suitability of fixed
parameters for both two scenarios. The statistics results of
coefficient of determination R2 for daily discharge estimation
reached at 0.815 for scenario 1 and 0.817 for scenario 2
respectively, which showed very good correlation between
observed and estimated discharge. Fig. 4 represents the daily
surface runoff hydrograph in Shukhi station for scenario 1 and
scenario 2 respectively. Whereas Fig.5 represents the
correlation plots for both scenarios respectively. As a result in
calibration we could find from both scenarios that the model
under estimated the peak discharges in Sep 2010 and May
2011. The base flow for all years during dry periods under
estimated. Totally the hydrograph for both two scenarios
showed less deference in calibration period that is
insignificant.
Fig. 4: Observed and simulated daily water discharge for
two scenarios in Shukhi station.
Assessing Impacts of Landuse/Landcover Change on Surface Runoff for Panjshir Watershed: A Watershed Modelling
Approach
43 www.erpublication.org
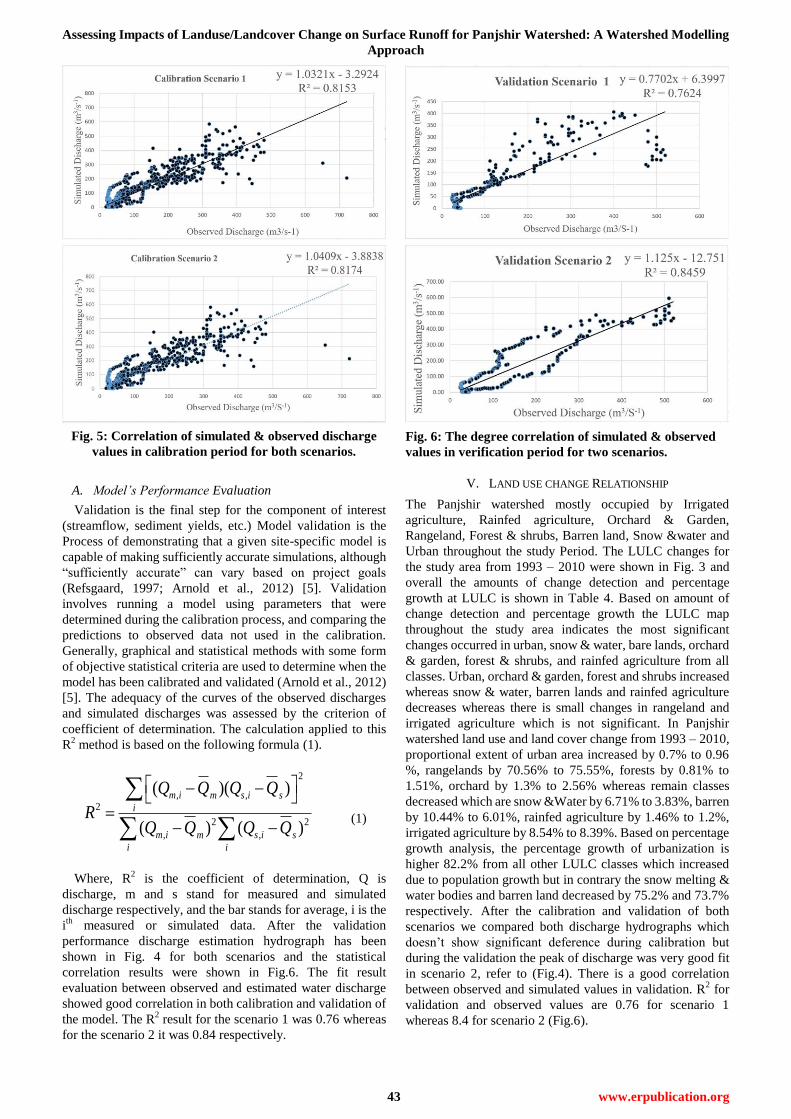
Fig. 5: Correlation of simulated & observed discharge
values in calibration period for both scenarios.
A. Model’s Performance Evaluation
Validation is the final step for the component of interest
(streamflow, sediment yields, etc.) Model validation is the
Process of demonstrating that a given site-specific model is
capable of making sufficiently accurate simulations, although
“sufficiently accurate” can vary based on project goals
(Refsgaard, 1997; Arnold et al., 2012) [5]. Validation
involves running a model using parameters that were
determined during the calibration process, and comparing the
predictions to observed data not used in the calibration.
Generally, graphical and statistical methods with some form
of objective statistical criteria are used to determine when the
model has been calibrated and validated (Arnold et al., 2012)
[5]. The adequacy of the curves of the observed discharges
and simulated discharges was assessed by the criterion of
coefficient of determination. The calculation applied to this
R2 method is based on the following formula (1).
2
, ,2
2 2
, ,
( )( )
( ) ( )
m i s im s
i
m i s im s
i i
Q Q Q Q
RQ Q Q Q
(1)
Where, R2 is the coefficient of determination, Q is
discharge, m and s stand for measured and simulated
discharge respectively, and the bar stands for average, i is the
ith
measured or simulated data. After the validation
performance discharge estimation hydrograph has been
shown in Fig. 4 for both scenarios and the statistical
correlation results were shown in Fig.6. The fit result
evaluation between observed and estimated water discharge
showed good correlation in both calibration and validation of
the model. The R2 result for the scenario 1 was 0.76 whereas
for the scenario 2 it was 0.84 respectively.
Fig. 6: The degree correlation of simulated & observed
values in verification period for two scenarios.
V. LAND USE CHANGE RELATIONSHIP
The Panjshir watershed mostly occupied by Irrigated
agriculture, Rainfed agriculture, Orchard & Garden,
Rangeland, Forest & shrubs, Barren land, Snow &water and
Urban throughout the study Period. The LULC changes for
the study area from 1993 – 2010 were shown in Fig. 3 and
overall the amounts of change detection and percentage
growth at LULC is shown in Table 4. Based on amount of
change detection and percentage growth the LULC map
throughout the study area indicates the most significant
changes occurred in urban, snow & water, bare lands, orchard
& garden, forest & shrubs, and rainfed agriculture from all
classes. Urban, orchard & garden, forest and shrubs increased
whereas snow & water, barren lands and rainfed agriculture
decreases whereas there is small changes in rangeland and
irrigated agriculture which is not significant. In Panjshir
watershed land use and land cover change from 1993 – 2010,
proportional extent of urban area increased by 0.7% to 0.96
%, rangelands by 70.56% to 75.55%, forests by 0.81% to
1.51%, orchard by 1.3% to 2.56% whereas remain classes
decreased which are snow &Water by 6.71% to 3.83%, barren
by 10.44% to 6.01%, rainfed agriculture by 1.46% to 1.2%,
irrigated agriculture by 8.54% to 8.39%. Based on percentage
growth analysis, the percentage growth of urbanization is
higher 82.2% from all other LULC classes which increased
due to population growth but in contrary the snow melting &
water bodies and barren land decreased by 75.2% and 73.7%
respectively. After the calibration and validation of both
scenarios we compared both discharge hydrographs which
doesn’t show significant deference during calibration but
during the validation the peak of discharge was very good fit
in scenario 2, refer to (Fig.4). There is a good correlation
between observed and simulated values in validation. R2 for
validation and observed values are 0.76 for scenario 1
whereas 8.4 for scenario 2 (Fig.6).

International Journal of Engineering and Technical Research (IJETR)
ISSN: 2321-0869 (O) 2454-4698 (P), Volume-6, Issue-1, September 2016
44 www.erpublication.org
Table 4: Area (Km2) and overall amount of change (%) in
LULC 1993 - 2010.
As result, simulation result of both scenarios for surface
runoff were not significant different. Because the main reason
is that this watershed located in a rural and mountainous area
and more than 70% is rangeland which doesn’t change much
during this period. Although the hydrographs doesn’t show
the difference clear, so we also considered LULC change on
the total water yield to the outlet of Shukhi sub-basin (Table
5).
From Table 5 we can see that the average annual Total
Water Flow of LULC 1993 is more than the LULC 2010.
Beside this the amount of average annual Total Water Yield
in 1993 is 253.37mm and in 2010 is 227.76mm, which shows
25.61mm decreasing of total water flow. Hence, the Surface
Flow in 2010 have 3.04% decrease, which the Ground Water
Flow have been increased by 3.41%. However, the Lateral
Flow didn’t change so much in both LCLU.
Table 5: Average annual water balance ratio for both
scenarios in Shukhi station.
In this study for sediment yield estimation analyses,
unfortunately the observed time series data in the study period
wasn’t available for Shukhi station. Hence, the calibration and
validation did not performed for sediment yield. But just we
compared the both scenarios (landuse 1993, landuse 2010)
change effects on sediment transportation, Evaporation (ET),
Potential Evapotranspiration (PET) and Total water yield in
Panjshir watershed outlet point. Fig.7 shows the all mentioned
hydrological and sediment yield changes in Panjshir
watershed. From the Fig.7 it is indicated that the total water
flow is decreased in year 2010 compared to 1993. But in
contrary Evaporation, Potential Evapotranspiration and
Sediment loadings increased. The increasing of sediment
yield is the result of population growth in recent years,
changing the agricultural Lands to urbanization and the
Erosion from Rangelands and other farm lands.
Note: The value for the total water flow, ET and PET is in mm whereas total
sediment loading is in Tons/ha.
Fig. 7: Average annual sediment and other hydrological
values
VI. CONCLUSION
This paper investigated the landuse change effects on
surface runoff in Panjshir watershed. The LULC changes for
the study area from 1993 – 2010 were shown in Fig.3 which
the proportional extent of urban area increased by 0.7% to
0.96 %, rangelands by 70.56% to 75.55%, forests by 0.81% to
1.51%, orchard by 1.3% to 2.56% whereas remain classes
decreased which are snow &Water by 6.71% to 3.83%, barren
by 10.44% to 6.01%, rainfed agriculture by 1.46% to 1.2%,
irrigated agriculture by 8.54% to 8.39%. The model simulated
average annual surface flow decreased by 10.24% to 7.2%,
whereas the average annual ground water flow increased by
70.07 percent to 73.48 percent during the study period. It is
also indicated that the average annual total water yield
decreased from 253.37mm to 227.76mm in Panjshir
watershed. Urbanization, increasing of barren lands,
deforestation and snow melting is the strongest contributor for
surface runoff which can be considered as a major
environmental stress controlling the hydrological parameters
such as runoff, water yield, Sediment yield, ET, PET for
Panjshir watershed. To conclude the SWAT model can be
used to calculate the impacts of landuse changes on runoff
generation characteristics in Panjshir watershed with
satisfactory accuracy.
ACKNOWLEDGMENT
The authors gratefully acknowledge the Graduate school of
engineering and science (University of the Ryukyus),
JICA-PEAC program and the government of Afghanistan for
supporting the necessary fund for this paper.
REFERENCES
[1] Petchprayoon Pakorn, Peter D. Blanken, Chaiwat Ekkawatpanit, and
Khalid Hussein. (2010). “Hydrological impacts of land use/land cover
change in a large river basin in central– northern Thailand”.
[INTERNATIONAL JOURNAL OF CLIMATOLOGY].Vol.30,
Issue.13, PP 1917–1930. Available: DOI: 10.1002/joc.2131 and
http://onlinelibrary.wiley.com/doi/10.1002/joc.2131/abstract.
[2] Ayoubi1 Tooryalay and Dongshik2 Kang. 2016. “PANJSHIR
WATERSHED HYDROLOGIC MODEL USING INTEGRATED GIS
AND ARCSWAT INTERFAC”. [International Journal of Geology,
Earth & Environmental Sciences]. Vol. 6 No. 1, pp 145-161.
Available:

Assessing Impacts of Landuse/Landcover Change on Surface Runoff for Panjshir Watershed: A Watershed Modelling
Approach
45 www.erpublication.org
http://www.cibtech.org/J-GEOLOGY-EARTH-ENVIRONMENT/PU
BLICATIONS/2016/VOL_6_NO_1/JGEE-06-01-Contents.htm.
[3] US Army Corps of Engineers. “Provincial water resource data
summery of Parwan/Afghanistan, UNCLASSIFIED//FOUO 1-7”,
(2009).
[4] J.G. Arnold, R. Srinivasan, R.S. Muttiah, and J.R. Williams2. (1998).
“Large area hydrologic modeling and assessment, part I: Model
development”. [Journal of the American Water Resources Association]
Vol. 34, No.1, pp 73-89. Available: DOI:
10.1111/j.1752-1688.1998.tb05961.x and
http://onlinelibrary.wiley.com/doi/10.1111/j.1752-1688.1998.tb0596
1.x/abstract.
[5] J.G. Arnold, D.N. Moriasi, P.W. Gassman, K.C. Abbaspour, M.J.
White, R. Srinivasan, C. Santhi, R.D. Van Harmel, A. Van Griensven,
M.W. Van Liew, N. Kannan, M.K. Jha. (2012). “SWAT: Model use,
Calibration, and Validation”. Transactions of the ASABE. [2012
American Society of Agricultural and Biological Engineers ISSN
2151-0032] Vol. 55(4): 1491-1508. Available:
http://swat.tamu.edu/publications/calibrationvalidation-publications/.
Tooryalay Ayoubi, Tooryalay Ayoubi is a graduate of
Geo-Science faculty from Kabul University, Afghanistan. Currently, he is
pursuing his master degree at the university of the Ryukyus, department of
information engineering, Okinawa, japan. His area of interest include
Geography, Water resource management, Geographic Information System,
Remote sensing and SWAT model applications.
Dongshig Kang, Dongshik Kang is an Associate
Professor at the Faculty of Information Engineering, University of the
Ryukyus. His previous position was as an Assistant Professor at University
of the Ryukyus (1999-2004). He received a Ph.D. in Engineering from
Osaka University, Osaka Prefecture. He is a member of the IEEJ, IEICE and
GISA. His current research interests are neural networks, geographic
information system, and intelligent systems