Embed Size (px)
Citation preview

APPLIED PSYCHOLOGY: AN INTERNATIONAL REVIEW, 1996.45 (4). 371-386
Assessing Organisational Commitment in a Belgian Context: Evidence for the Three-dimensional Model
Christian Vandenberghe Universitd Catholique de Louvain, Belgium
Cette Ctude investigua la pertinence de la conceptualisation tri-dimensionnelle de I’implication organisationnelle (Meyer & Allen, 1991) dans un contexte belge. Les trois composantes de la thkorie furent mesurkes h I’aide des Cchelles affective, de continuation, et normative de I’implication, dtveloppkes par Allen et Meyer (1990). Une analyse factorielle confirmatoire de donnCes provenant d’un Cchantillon de 277 infirmibres et aides-soignantes corrobora la structure factorielle hypothktique b a d e sur une reprksentation h trois facteurs obliques. Cependant, contrairement aux rCsultats de recherches antkrieures, la prCsence de deux sous-dimensions au sein de I’tchelle de continuation ne fut pas confirmCe. La portCe de ces rCsultats est discutCe et des suggestions pour analyser plus avant les conditions de gtnkralisation de I’implication organisationnelle dans le domaine interculturel sont avanctes.
This study investigated the usefulness of the three-dimensional conceptualisation of organisational commitment (Meyer & Allen, 1991) in a Belgian context. The three components of the theory were assessed using the Affective, Continuance, and Normative Commitment scales developed by Allen and Meyer (1990). A confirmatory factor analysis of data from a sample of 277 nurses and nursing aides yielded support for the hypothesised factorial structure of the scales, based on a three-factor, oblique representation. However, contrary to prior findings, the existence of two related subdimensions inside the continuance commitment scale was not confirmed. The scope of these results is discussed, and suggestions to further analyse the boundary conditions of organisational commitment in cross-cultural assessment are proposed.
Requests for reprints should be sent to Christian Vandenberghe, Unit6 des Sciences Hospitalihres, Universit6 Catholique de Louvain, 30 Clos Chapelle-aux-Champs, Box 30.37, B-1200 Brussels, Belgium.
I wish to thank Dr. S. Sonnentag, Deputy Editor, and two anonymous reviewers for their helpful comments on an earlier version of this article.
0 19% International Association of Applied Psychology

372 VANDENBERGHE
INTRODUCTION Organisational commitment (OC) has constituted an issue of wide interest among scholars for at least 20 years. Despite the numerous definitions and operationalisations of the concept detectable in the literature (Morrow, 1983), the so-called arrirudinaf perspective of OC (Porter, Steers, Mowday, & Boulian, 1974) has largely dominated past research efforts. Porter et al. (1974, p.604) defined OC as an attachment to the organisation characterised by an intention to remain, an identification with the values and goals of the organisation, and a willingness to exert extra effort on its behalf. Porter and his colleagues (1974; Mowday, Steers, & Porter, 1979) developed the Organisational Commitment Questionnaire (OCQ) to address this kind of linkage between the individual and the organisation. In a recent meta- analysis of the antecedents, correlates, and consequences of OC, Mathieu and Zajac (1990) reported that either the 9- or 15-item version of the OCQ was involved in 103 samples out of the 174 included in their study.
A GENERAL THEORY OF ORGANISATIONAL COMMITMENT
Despite the prevalence of the OCQ in past research, a multidimensional view on OC has progressively emerged during the last decade. In this line of inquiry, Meyer and Allen (1984) conceptualised a bidimensional commitment instrument tapping what they then called affective and continuance commitment. Later, they added a third dimension, normative commitment (Allen & Meyer, 1990). Their investigations led to the development of a 24-item three-dimensional commitment scale. Recently, evidence has been reported that Porter et al.’s OCQ captures only the affective component of commitment (Dunham, Grube, & Castaneda, 1994; Vandenberg, Self, & Seo, 1994) and is thus inadequate for testing the expanded Allen and Meyer perspective.
Consistent with the work of Porter et al. (1974) and Buchanan (1974), the affective component refers to the emotional attachment of the individual to hidher organisation. Meyer, Allen, and Gellatly (1990, p.710) theorised that individuals committed on an affective basis stay with their organisation “because they want to”.
By contrast, the second dimension of commitment, continuance commitment, is conceived of as calculative in nature, as it refers to the continuation of a course of action (membership in the organisation) based on the perceived costs of discontinuing it (Meyer & Allen, 1991). Continuance commitment traces back to Becker’s (1960) notion of side- bets. Side-bets are investments that individuals accumulate, voluntarily or not, along with ongoing membership in the organisation (e.g. pension plans, organisation-specific skills, seniority) that would be lost in the case of

COMMITMENT IN A BELGIAN CONTEXT 373
departure. This accrual phenomenon makes departure from the organisation more and more costly over time, and consequently creates “commitment by default” (Becker, 1960, p.38). So, continuance commitment is time-based (Amernic & Aranya, 1983). Similarly, job alternatives have also been studied as a commitment-inducing variable (Farrell & Rusbult, 1981; Oliver, 1990; Rusbult & Farrell, 1983). Indeed, poor employment opportunities are supposed to bind workers to their current organisation. Overall, accrued investments and poor alternatives tend to force individuals to maintain their line of action and are responsible for these individuals being committed “because they need to” (Meyer et al., 1990, p.710).
Finally, normative commitment derives from the work of Wiener (1982) and Wiener and Vardi (1980). Building on Fishbein and Ajzen’s (1975) theory of reasoned action, they consider commitment behaviour as the expression of an internalised normative pressure. The work behaviour of individuals committed on a normative basis tends to be guided by a sense of duty, obligation, and loyalty, especially directed towards their employing organisation. For example, internalised normative beliefs of duty and obligation are responsible for individuals feeling obligated to sustain membership because they “should” do so (Allen & Meyer, 1990; Meyer & Allen, 1991). .
On empirical grounds, the three-dimensional view of commitment, although not always operationalised by Allen and Meyer’s (19%) scales, has received consistent support in recent years (Allen & Meyer, 1990, 1993; Angle & Lawson, 1993; Dunham et al., 1994; Hackett, Bycio, & Hausdorf, 1994; Jaros, Jermier, Koehler, & Sincich, 1993; Meyer, Allen, & Smith, 1993; Randall, Fedor, & Longenecker, 1990). For example, submitting Allen and Meyer’s (1990) scales to a confirmatory factor analysis and collecting data from large and varied samples of employees, Dunham et al. (1994), Hackett et al. (1994), and Meyer et al. (1993) found evidence for the superiority of a three-factor, oblique model over one- or two-factor models. However, some debate exists over the dimensionality of the continuance commitment scale (CCS). Studies dedicated to this issue revealed the existence of two related subdimensions composing the scale (Dunham et al., 1994; Hackett et al., 1994; McGee & Ford, 1987; Meyer et al., 1990; Somers, 1993): one measuring the costs of leaving the organisation based on a lack of alternatives (CCS:LoAlt) and a second tapping a commitment resulting from the personal sacrifice associated with quitting (CCS:HiSac). However, the fact that the two subscales were found to be highly correlated (e.g. 0.74 in Dunham et al.’s study, the only one to examine the CCS separately) explains why the superiority of a four-factor, oblique representation, albeit actual, is controversial in terms of meaning and practical significance. In other words, despite the empirical support for a four-dimensional solution against a

374 VANDENBERGHE
three-factor model (Hackett et al., 1994), additional work is needed to ascertain its structural validity. Such effort seems all the more necessary because some authors exploring the three-component conceptualisation still consider continuance commitment as a unitary concept (Dunham et al., 1994).
Another issue still open to question concerns the boundary conditions of OC, in particular of the three-component theory, in terms of cross-cultural generalisability. As the review of Randall (1993) showed, a large majority of OC studies have been conducted in North America (USA or Canada). Not only mean scores on OC can vary across cultures, but the underlying structure of the concept may be subject to intercultural variation. Similarly, a close look into the recent studies using Allen and Meyer’s (1990) scales leads to the same observation: only North American samples of employees were used. Consequently, the cross-cultural generalisability of the three- dimension view still remains to be established.
The purpose of the present study was to explore the boundary conditions of the three-dimensional OC theory of Allen and Meyer (1990, Meyer & Allen, 1991) by examining its relevance outside North America. I examined the structural validity of the three-component measure in a Belgian context, and compared one-, two-, three- (oblique and orthogonal), and four-factor models of the commitment scales. The rationale for comparing these alternative structures can be described as follows. First, the one-factor model corresponds to the view that OC represents a single psychological state. For example, the early conceptualisation of OC developed by Porter et al. (1974) implicitly referred to commitment as to an “undifferentiated” state. Second, in the two-factor, oblique solution, the CCS items defined one factor while the ACS and NCS items defined the other. This particular pattern was the most plausible two-factor representation because the affective and normative scales were found, in previous research, to be significantly and positively correlated (e.g. Allen & Meyer, 1990, Meyer et al., 1993). Note, however, that the two factors were allowed to correlate freely (i.e. an oblique solution) so as to be strictly comparable with the alternative three-factor, oblique model. Third, the three-factor, orthogonal model of commitment corresponds to the view that each component is independent from the other two (e.g. Dunham et al., 1994). More specifically, it emphasises that the components of OC are separate constructs. Testing a three-factor, orthogonal, model against a three-factor, oblique, model permitted verification of whether this view was actually tenable.
Finally, to assess whether the CCS could be viewed as composed of two subdimensions (i.e. CC:HiSac and CC:LoAlt), a four-factor, oblique, model of the commitment scales was evaluated. To supplement this evaluation, a separate analysis of the CCS was conducted, where one- and two-

COMMITMENT IN A BELGIAN CONTEXT 375
(orthogonal and oblique) factor solutions were compared. This detailed evaluation was desirable in view of the extant controversy surrounding the dimensionality of the CCS (e.g. Hackett et al., 1994). Finally, a null-model (i.e. a model with all items constrained to be orthogonal), to be used as baseline model in the comparison process, was also evaluated.
METHOD
Subjects and Procedure
Questionnaires were delivered along with a covering letter explaining the aim of the study, and a stamped envelope bearing the address of the research centre was provided for return purposes. The study was part of a larger survey. Respondents were nurses and nursing aides working in 28 different healthcare organisations, located in the French-speaking part of Belgium. Of the 396 surveys delivered, 277 usable ones were returned (a 70% response rate). Of the participants 69% were employed on a full-time basis, 35% were married, and 85% were female. The average age was 26.5 years (SD = 6.33), and average tenure was 1.65 years (SD = 0.44).
Measures
The Affective, Continuance, and Normative Commitment scales (ACS, CCS, NCS; Allen & Meyer, 1990) comprise a set of 3 X 8 items measuring the three components of OC. For the purpose of the present study, the 24 items were first translated into French and then revised by three bilingual French-English management experts. The translation of items was guided by two considerations. First, any double negation was avoided in the labelling of items. Second, item wording was labelled so as to equilibrate positive and negative keying on factors, hence reducing acquiescence bias (Nunnally, 1967). Overall, this procedure modified the loading direction of nine items as compared with the original scales. These items are identified by an asterisk in Table 1. A preliminary study (not reported here) was conducted on an independent sample of subjects to assess the factorial structure of the questionnaire, on an exploratory basis (Vandenberghe, 1995). This investigation resulted in the elimination of four items because of their loading inferior to 0.40 on any factor or their main loading on a dimension different from that intended.’ The present study was conducted on the remaining 20 items of the original scales. Responses were elicited on 7-point Likert-type formats anchored “strongly disagree” (1) and “strongly agree” (7).
‘The items dropped were ACS4. CCS3, CCS4, and NCSI.

376 VANDENBERGHE
Data Analysis
Confirmatory factor analysis by LISREL 8 (Joreskog & Sorbom, 1993a) was used to analyse competing factor structures of the scales. Before conducting the analysis, the data were screened using PRELIS 2 (Joreskog & Sorbom, 1993b). This test revealed that the raw data departed significantly from a multinormal distribution (zero skewness and zero kurtosis). Because, in addition, all variables were ordinal, the use of polychoric correlations was desirable (e.g. see Vandenberg et al., 1994). Accordingly, I used PRELIS 2 to calculate the matrix of polychoric correlations for all variables, on which an asymptotic covariance matrix of the sample variances and covariances was then obtained. Both matrices were input into a LISREL analysis using the weighted-least-squares rather than the traditional maximum likelihood method of estimation. Thus, all models estimated in the present study were analysed using this method.
The analytic strategy followed in the present study was to compare different a priori measurement models of theoretical interest. First, the overall fit of each model was evaluated with a chi-square statistic and four other goodness-of-fit indices. Second, a statistical comparison between models was performed by chi-square difference tests (Bentler 19 Bonett, 1980) and the practical significance of the differences was further examined by comparing the other goodness-of-fit indices for the various models. Note that the difference between the chi-square values of two models also follows a chi-square distribution, with degrees of freedom equal to the difference between the degrees of freedom of the models (Bentler, 1980). The pseudo-chi-square tests were used here to compare null, one-, two-, three- (oblique and orthogonal), and four-factor, oblique models of commitment items, and null, two- (orthogonal), and two- (oblique) factor models of continuance commitment items.
Four complementary fit indices were used to assess the validity of the models: (a) the goodness-of-fit index (GFI), (b) the adjusted-goodness-of-fit index (AGFI), (c) the parsimonious normed fit index (PNFI; James, Mulaik, & Brett, 1982), and (d) the comparative fit index (CFI; Bentler, 1990). The GFI measures how well a constrained covariance matrix based on theory reproduces the observed covariance matrix. The AGFI adjusts the GFI for the degrees of freedom of the estimated model. Values of 0.90 or greater for the GFI and the AGFI are considered as indicative of acceptable model fit (Medsker, Williams, & Holahan, 1994). By contrast with the preceding overall fit measures, the PNFI and the CFI compare the fit of a model against an absolute null model where all observed variables are constrained to be orthogonal. So, they provide an indication of the amounts of variance and covariance accounted for by a model over a baseline one. The PNFI is based on the normed fit index (NFI; Bentler & Bonett, 1980) but adjusts it for the

COMMITMENT IN A BELGIAN CONTEXT 377
degrees of freedom of the two models. The PNFI outperforms the NFI because it estimates the parsimony of a model, i.e. corrects its fit for the number of parameters freed and its resulting loss in degrees of freedom (Mulaik et al., 1989). The CFI is a normed index which compares the chi-square value of a specified model against a null model, from which degrees of freedom are subtracted. Bentler (1990) showed its robustness against sampling variability.
RESULTS Table 1 presents the descriptive statistics for the commitment items used in the study. As noted earlier, only 20 items were retained for this investigation. A first measurement model based on seven ACS, six CCS, and seven NCS items was fitted to the observed matrix of polychoric correlations, using the weighted-least-squares method of estimation by LISREL 8 (Joreskog & Sorbom, 1993a). The theory-based three-factor, oblique model yielded a moderate fit to the data, x2 (167, N = 252) = 987.41, P C 0.05 (GFI = 0.88, AGFI = 0.85, PNFI = 0.73, CFI = 0.86). However, as Medsker et al. (1994) noted, acceptable model fit is typically achieved when the GFI and the AGFI reach the 0.90 level. In order to attain this threshold, a respecification of the model was thus required.
Following the recommendation of Anderson and Gerbing (1988), the most suitable approaches to respecification consist in either the exclusion of problematic items or their reassignment to a different construct. Because the commitment items are well-known a priori indicators of their latent variables, the first strategy was retained. For it to be achieved, the examination of residuals is particularly helpful in the case of measurement models with multiple indicators (Anderson & Gerbing, 1988). A close inspection of the standardised residuals and of the modification indices provided by LISREL showed that four additional items could be dropped from the analysis because of their large positive or negative residuals with other variables-i.e. residuals greater than 2.0, see Anderson and Gerbing (1988). These items were ACS1, ACS7, NCS3, and NCS7. So, they were eliminated and a revised model containing five ACS items, six CCS items, and five NCS items was analysed.
The items were analysed by comparing null, one-, two-, three- (oblique), three- (orthogonal), and four-factor models whose relative fit was assessed by chi-square difference tests. As a supplementary indication, practical significance of differences between fit indices required that GFI, AGFI, PNFI, and CFI values differed by at least 0.01-values inferior to this threshold are often considered as unimportant on practical grounds (Widaman, 1985). The results of the analysis of the remaining set of items are presented in Table 2. As can be seen, all chi-square difference tests were

TAB
LE 1
P
olyc
hori
c C
orre
latio
ns, M
eans
, an
d S
tand
ard
Dev
iatio
ns for
the
20 C
omm
itm
ent
Item
s
Item
' M
SD
I 2
3 4
5 6
7 8
9 10
I1
12
13
14
IS
16
17
18
19
20
1. A
CSI
' 2.
AC
S2
3. A
CS3
4.
AC
SY
5. A
CS6
. 6.
AC
S7'
7. A
m*
8.
CC
SI'
9. c
cs2
10
. cc
s5
11.
CC
s6'
12.
cc
s7
13.
CC
S8
14. N
CSl
15
. N
CS2'
16. N
CS3
17
. NC
S4
18.
NC
SY
19.
NC
S6
20.
NC
S7
2.20
1.
79
5.19
1.
54
3.73
1.
76
4.48
1.
93
4.42
1.89
1.99
1.
49
4.01
1.
92
5.70
1.
98
4.29
2.23
45
4 2.
35
4.02
2.0
2 3.
69
1.92
3.
88
2.11
3.
47
2.06
5.
40
1.63
5.
17
1.81
2.
83
1.85
5.
05
4.66
4.0
8 2.1
1 3.
43
1.90
-
-0.1
3 -
-0.0
6 0.2
2 -
-0.2
3 0.
30
0.39
-
-0.2
2 0.
30
0.46
0.71 -
0.40
-0.
19
-0.2
1 -0.46
-0.4
2 -
-0.3
2 0.25
0.40
0.
67
0.65
-03
9 -
-0.2
0 0.
03 -
0.02
0.0
2 0.
01
0.02
0.
11 -
-0.2
2 0.
07
0.20
0.
16
0.24
-0.
16
0.26
0.
24 -
-0.1
0 -0
.04
0.06
0.
09
0.13
-0.
05
0.16
0.
17
0.32
-
0.22
0.
18 -
0.00
-0
.04
-0.0
7 0.0
9 -0
.15
-0.2
7 -0
.21
-0.2
0 -
-0.1
2 0.
10
0.11
0.19
0.
22 -
0.06
0.
28
0.26
0.
25
0.22
-0.
43 -
-0.1
7 0.
13
0.21
0.
38
0.32
-0.2
1 0.
33
0.25
0.
19
0.10
-0.1
8 0.
30 -
-0.0
7 0.
14
0.15
0.
21
0.13
-0.
02
0.20
-0.
02
0.15
0.
12 -
0.02
0.
14
0.25
-
-0.2
0 0.2
5 0.
30
0.41
0.
38 -
0.24
0.
41
0.01
0.
16
0.12
-0.
01
0.15
0.2
2 0.
28 -
0.09
0.
08 -
0.09
-0
.18
-0.1
6 0.
14 -
0.17
-0
.05
-0.1
5 -0
.03
0.17
-0.
07
-0.1
2 -0
.13
-0.1
2 -
-0.1
6 0.
17
0.30
0.
28
0.29
-0.
15
0.37
0.
05
0.31
0.14
-0.
14
0.20
0.
23
0.19
0.3
1 -0
.19 -
0.20
-0.
06
-0.2
3 -0
.35
-0.3
7 0.
25 -
0.31
0.
09 -
0.14
0.
08
0.02
-0.
02
-0.1
7 -0
.08
-0.1
8 0.
37 -
0.25
-
-0.2
4 0.
19
0.20
0.
27
0.29
-0.
17
032
0.08
0.
16
0.07
-0.
05
0.13
0.
18
0.21
0.
44 -
0.07
0.
47 -
0.20
-
-0.2
4 -0
.03
0.20
0.
17
0.25
-0.
09
0.25
0.
10
0.30
0.
16 -
0.31
0.28
0.33
0.
43
0.23
-0.
28
0.31
-0.
20
0.22
-
N =
252
. bas
ed o
n lis
twis
e de
letio
n of
mis
sing
dat
a. A
CS
= A
ffec
tive
Com
mitm
ent S
cale
, CC
S =
Con
tinua
nce C
omm
itmen
t Sca
le, N
CS
= N
orm
ativ
e Com
mitm
ent
'Item
s no
ted
with
an
aste
risk
indi
cate
a re
vers
e w
ordi
ng b
y re
fere
nce
with
Alle
n an
d M
eyer
's or
igin
al (1
990)
scal
es.
Scal
e. T
he n
umbe
ring
of i
tem
s fo
llom
the
pres
cnta
tion
of D
unha
m e
t al.
(199
4, p
.375
).

COMMITMENT IN A BELGIAN CONTEXT 379
significant. The one-factor model, in which all items were defined as indicators of a single OC construct, was superior to a null model, where all observed variables were constrained to be independent, Ax2 (16, N = 261) = 1830, P < 0.05 (A GFI = 0.42, A AGFI = 0.46). The two-factor model, in which ACS and NCS items defined a single factor and CCS items defined another one (see Meyer et al., 1993), yielded a better fit than the one-factor model,Ax2(1,N= 261) =45,P<O.O5(AGFI =O.Ol,AAGFI =O.Ol,APNFI = 0.01, A CFI = 0.02). The three-factor, oblique solution was a significant improvement over a two- (correlated) factor pattern, Ax2 (2, N = 261) = 64, P < 0.05 (A GFI = 0.02, A AGFI = 0.02, A PNFI = 0.01, A CFI = 0.03), and over a three-factor, orthogonal structure, Ax2 (3, N = 261) = 261, P < 0.05 (A GFI = 0.06, A AGFI = 0.07, A PNFI = 0.07, A CFI = 0.12). Finally, indexes tend to show an incremental improvement when one moves from a structure with three correlated factors to a four-factor representation, Axz (3, N = 261) = 53, P < 0.05 (A GFI = 0.01, A AGFI = 0.02, A PNFI = 0.00, A CFI = 0.02).
The latter results seem to give further confirmation to prior findings (e.g. Hackett et al., 1994; Meyer et a]., 1993). However, a cursory look into the values of the PNFI and the CFI reveals that, although the CFI change was noticeable (0.02), the PNFI change was not. Remember that the PNFI and the CFI are particularly meaningful to evaluate how competing models perform over null models and that they are also less dependent on the number of parameters estimated (especially in the case of the PNFI). So, practically, the increased level of fit gained by estimating more parameters may be offset by the simultaneous loss in degrees of freedom in the model.
A more comprehensive examination of this issue would be to analyse the CCS items separately (Dunham et al., 1994). So, I conducted weighted-least- squares estimations of null, one-, two- (orthogonal), and two- (oblique) factor models of CCS items. Because of the elimination of some items from the original Allen and Meyer (1990) scales, it was not possible to reproduce
TABLE 2 Confirmatory Factor Analysis of Commitment Items: Goodness-of-fit Statistics
Model Model
xz (dfl comparison Ax2 (Mfl GFI AGFI PNFI CFI
1 . Null 2,253 (120)* - - 0.48 0.41 N A N A 2. One-factor 423(104)* 2 vs. 1 1830(16)* 0.90 0.87 0.70 0.85 3. Two-factor oblique 378(103)* 3 vs. 2 45 (1)* 0.91 0.88 0.71 0.87 4. Three-factor oblique 314(101)* 4 vs. 3 64 (2)’ 0.93 0.90 0.72 0.90 5. Three-factor orthogonal 575 (104)* 4 vs. 5 261 (3)* 0.87 0.83 0.65 0.78 6. Four-factor oblique 261 (98)* 6 vs. 4 53 (3)* 0.94 0.92 0.72 0.92
N = 261, based on listwise deletion of missing data. GFI = goodness-of-fit index; AGFI = adjusted goodness-of-fit index; PNFI = parsimonious normed-fit index; CFI = comparative fit index; N A = not applicable.
* P < 0.05.

380 VANDENBERGHE
exactly the same composition for the CCS:LoAlt and CCS:HiSac subdimensions (Meyer et al., 1990). However, the six items present in this study allowed testing of a simplified structure of two CCS:HiSac items (CCS 2 and 8) and four CCS:LoAlt items (CCS 1,5,6, and 7). Nonetheless, given this discrepancy, it is important to note that the results of this analysis will only be tentative.
The results of this assessment are shown in Table 3. These do not appear to support the theorised two-dimensionality of the scale. Indeed, the one-factor model is the most performing one and demonstrates a better fit to the data than a null model, Ax2 (6, N = 271) = 114, P < 0.05 (A GFI = 0.12, A AGFI = 0.16), a two-factor, oblique structure, Ax2 (1, N = 271) = 0, ns (A GFI = 0.00, A AGFI = 0.00, A PNFI = 0.06, A CFI = 0.01), and a two-factor, orthogonal pattern, Ax2 (0, N = 271) = 69, P < 0.05 (A GFI = 0.07, A AGFI = 0.17, APNFI = 0.34, ACFI = 0.64). Overall, the existence of two subdimensions within the CCS is not supported in the context of the present data.2 Of course, the chi-square difference between the one- and two- (oblique) factor models is nonsignificant, but the changes in both the PNFI and the CFI are substantial (0.06 and 0.01, respectively). In particular, the major drop in the PNFI (0.06) indicates that a one-factor solution fits the data more parsimoniously. In addition, the CCS:HiSac and CCS:LoAlt subdimensions were highly correlated (0.989; SD = 0.142), so that if a confidence interval is calculated around the correlation estimate (plus/minus two standard errors), 1.0 is included, thus indicating that the subdimensions
TABLE 3 Confirmatory Factor Analysis of Continuance Commitment Items: Goodness-of-fit
Statistics ~~ ~
Model Model ~ ' ( d f l comparison Ax2(Mn GFI AGFI PNFI CFI
1. Null 123 (15)' - - 0.87 0.82 NA NA 2. One-factor 9 (9) 2 vs. 1 114 (6)' 0.99 0.98 0.56 1.00 3. Two-factor oblique 9 (8) 2 vs. 3 0 (1) 0.99 0.98 0.50 0.99 4. Two-factor orthogonal' 78 (9). 2 vs. 4 69 (0)' 0.92 0.81 0.22 0.36
N = 271. based on listwise deletion of missing data. GFI = goodness-of-fit index; AGFI = adjusted goodness-of-fit index; PNFI = parsimonious normed-fit index; CFI = comparative fit index; NA = not applicable.
'The finding of a zero value for Adf in the 2 vs. 4 model comparison is due to the testing of alternative rather than nested models.
* P < 0.05.
'Note that, due to missing cases, the analyses reported in Tables 2 and 3 were conducted on slightly different sample sizes ( N = 261 vs. 271). To control for the potential influence of sample size on the current results, I reanalysed the CCS data using the same 261 cases on which the results from Table 2 were based. This yielded the same results as reported in Table 3.

COMMITMENT IN A BELGIAN CONTEXT 381
are not independent (Anderson & Gerbing, 1988). So, overall, the superiority of a model with four correlated factors over a model with three correlated ones is no longer supported if the CCS is examined separately with respect to its dimensionality.
The correlations among the latent variables for the three-factor, oblique solution, as estimated by LISREL, were as follows. The NCS and ACS correlated 0.71 (SE = 0.04), the CCS and ACS correlated 0.63 (SE = 0.04), and the NCS and CCS correlated 0.65 (SE = 0.05). Although none of the confidence intervals surrounding these correlation estimates included 1 .O, the magnitude of the correlations was unusually high, as compared with traditional values for these c0efficients-e.g. Dunham et al. (1994) report values in the range of - 0.20 to 0.24 for ACS-CCS correlations, of 0.34 to 0.50 for ACS-NCS correlations, and of -0.11 to 0.21 for NCS-CCS correlations. The reason for this may be that eight items from the original scales were dropped from the analyses.
Table 4 provides the weighted-least-squares estimates for the parameters of the three-factor, oblique model, the best one according to the preceding analyses. All parameters are significant at the 0.05 level. However, it should be noted that ACS2, ACS3, and NCSl items present rather poor loadings on their respective dimension, by comparison with the other items for these
TABLE 4 Parameter Estimates for the Three-factor, Oblique Model of Commitment
WLS estimates
Item Factor I Factor 2 Factor 3 S E r'
1. ACS2 2. ACS3 3. ACSS 4. ACS6 5. ACSS 6. CCSl 7. c c s 2 8. CCS5 9. CCS6 (R)
10. c c s 7 11. CCS8 12. NCSl 13. NCS2 14. NCS4 15. NCSS(R) 16. NCS6
0.44 0.39 0.89 0.88 0.84
0.68 0.63 0.57 0.52 0.65 0.61
0.04 0.04 0.02 0.02 0.02 0.05 0.04 0.05 0.04 0.03 0.04
0.36 0.04 0.64 0.03 0.71 0.04 0.53 0.04 0.77 0.03
10.08 9.95
41.07 43.27 41.90 13.26 16.36 12.14 11.90 18.97 17.09 8.82
19.37 20.57 13.22 23.82
N = 261, based on listwise deletion of missing data. WLS estimates = weighted-least- squares estimates; ACS = Affective Commitment Scale; CCS = Continuance Commitment Scale; NCS = Normative Commitment Scale; (R) = reverse scored.
'All I values are significant at the 0.05 level.
382 VANDENBERGHE
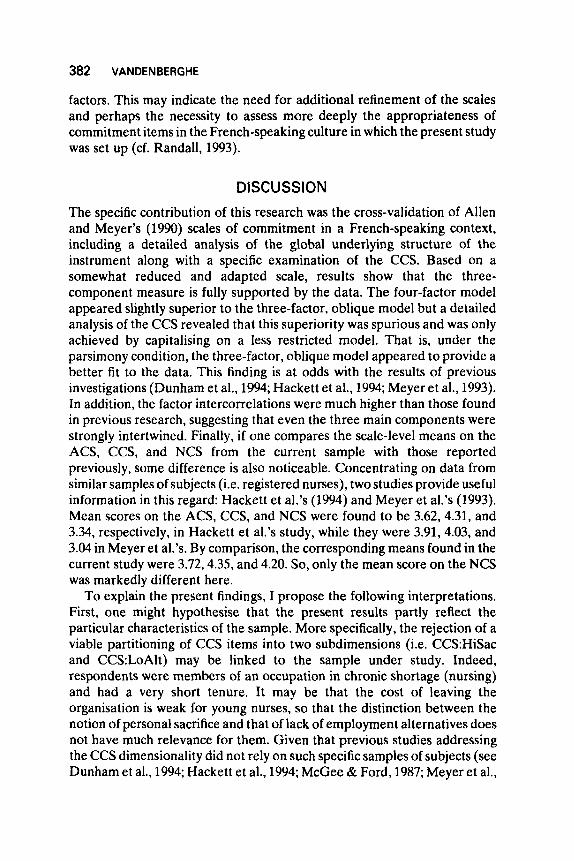
factors. This may indicate the need for additional refinement of the scales and perhaps the necessity to assess more deeply the appropriateness of commitment items in the French-speaking culture in which the present study was set up (cf. Randall, 1993).
DISCUSSION The specific contribution of this research was the cross-validation of Allen and Meyer’s (1990) scales of commitment in a French-speaking context, including a detailed analysis of the global underlying structure of the instrument along with a specific examination of the CCS. Based on a somewhat reduced and adapted scale, results show that the three- component measure is fully supported by the data. The four-factor model appeared slightly superior to the three-factor, oblique model but a detailed analysis of the CCS revealed that this superiority was spurious and was only achieved by capitalising on a less restricted model. That is, under the parsimony condition, the three-factor, oblique model appeared to provide a better fit to the data. This finding is at odds with the results of previous investigations (Dunham et al., 1994; Hackett et al., 1994; Meyer et al., 1993). In addition, the factor intercorrelations were much higher than those found in previous research, suggesting that even the three main components were strongly intertwined. Finally, if one compares the scale-level means on the ACS, CCS, and NCS from the current sample with those reported previously, some difference is also noticeable. Concentrating on data from similar samples of subjects (i.e. registered nurses), two studies provide useful information in this regard: Hackett et al.3 (1994) and Meyer et a1.k (1993). Mean scores on the ACS, CCS, and NCS were found to be 3.62,4.31, and 3.34, respectively, in Hackett et al.’s study, while they were 3.91,4.03, and 3.04 in Meyer et a1.k By comparison, the corresponding means found in the current study were 3.72,4.35, and 4.20. So, only the mean score on the NCS was markedly different here.
To explain the present findings, I propose the following interpretations. First, one might hypothesise that the present results partly reflect the particular characteristics of the sample. More specifically, the rejection of a viable partitioning of CCS items into two subdimensions (i.e. CCS:HiSac and CCS:LoAlt) may be linked to the sample under study. Indeed, respondents were members of an occupation in chronic shortage (nursing) and had a very short tenure. It may be that the cost of leaving the organisation is weak for young nurses, so that the distinction between the notion of personal sacrifice and that of lack of employment alternatives does not have much relevance for them. Given that previous studies addressing the CCS dimensionality did not rely on such specific samples of subjects (see Dunham et al., 1994; Hackett et al., 1994; McGee & Ford, 1987; Meyer et al.,
COMMITMENT IN A BELGIAN CONTEXT 383
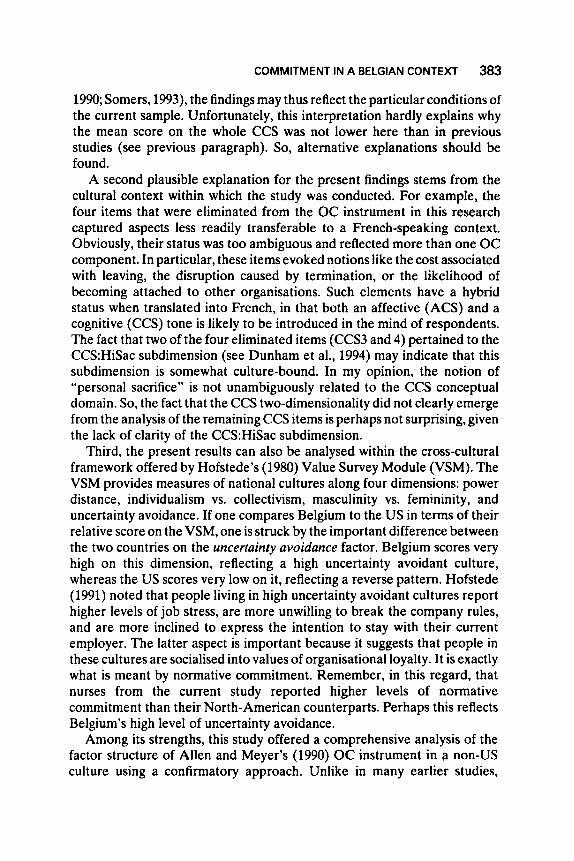
1990; Somers, 1993), the findings may thus reflect the particular conditions of the current sample. Unfortunately, this interpretation hardly explains why the mean score on the whole CCS was not lower here than in previous studies (see previous paragraph). So, alternative explanations should be found.
A second plausible explanation for the present findings stems from the cultural context within which the study was conducted. For example, the four items that were eliminated from the OC instrument in this research captured aspects less readily transferable to a French-speaking context. Obviously, their status was too ambiguous and reflected more than one OC component. In particular, these items evoked notions like the cost associated with leaving, the disruption caused by termination, or the likelihood of becoming attached to other organisations. Such elements have a hybrid status when translated into French, in that both an affective (ACS) and a cognitive (CCS) tone is likely to be introduced in the mind of respondents. The fact that two of the four eliminated items (CCS3 and 4) pertained to the CCS:HiSac subdimension (see Dunham et al., 1994) may indicate that this subdimension is somewhat culture-bound. In my opinion, the notion of “personal sacrifice” is not unambiguously related to the CCS conceptual domain. So, the fact that the CCS two-dimensionality did not clearly emerge from the analysis of the remaining CCS items is perhaps not surprising, given the lack of clarity of the CCS:HiSac subdimension.
Third, the present results can also be analysed within the cross-cultural framework offered by Hofstede’s (1980) Value Survey Module (VSM). The VSM provides measures of national cultures along four dimensions: power distance, individualism vs. collectivism, masculinity vs. femininity, and uncertainty avoidance. If one compares Belgium to the US in terms of their relative score on the VSM, one is struck by the important difference between the two countries on the uncerrainfy avoidance factor. Belgium scores very high on this dimension, reflecting a high uncertainty avoidant culture, whereas the US scores very low on it, reflecting a reverse pattern. Hofstede (1991) noted that people living in high uncertainty avoidant cultures report higher levels of job stress, are more unwilling to break the company rules, and are more inclined to express the intention to stay with their current employer. The latter aspect is important because it suggests that people in these cultures are socialised into values of organisational loyalty. It is exactly what is meant by normative commitment. Remember, in this regard, that nurses from the current study reported higher levels of normative commitment than their North-American counterparts. Perhaps this reflects Belgium’s high level of uncertainty avoidance.
Among its strengths, this study offered a comprehensive analysis of the factor structure of Allen and Meyer’s (1990) OC instrument in a non-US culture using a confirmatory approach. Unlike in many earlier studies,

384 VANDENBERGHE
measures were assumed to be ordinal, a more realistic approach in my view, and were analysed accordingly. However, this study also has some limitations. First, it does not allow definite conclusions to be drawn regarding the respective role of the national culture and of employees’ occupation on the structure and levels of OC. Additional replication is needed using varied samples of cultures and occupations to examine the boundary conditions of the three-dimensional model of commitment. Second, more work is needed on the CCS dimensionality. Indeed, the very short tenure of the employees surveyed in this study limits the generalisability of the observed results, particularly of those related to the CCS. Finally, this study did not incorporate any correlate, antecedent, or consequence of OC components. Examining relationships between OC dimensions and other variables in this cultural context would be useful to clarify their discriminant validity.
Manuscript received September 1995 Revised manuscript received January 1996
REFERENCES Allen, N.J., & Meyer, J.P. (1990). The measurement and antecedents of affective,
continuance and normative commitment to the organization. Journal of Occupational
Allen, N.J., & Meyer, J.P. (1993). Organizational commitment: Evidence of career stage effects? Journal of Business Research, 26.49-61.
Amernic. J.H., & Aranya, N. (1983). Organizational commitment: Testing two theories. Relations Industrielles, 38,319-341.
Anderson, J.C., & Gerbing, D.W. (1988). Structural equation modeling in practice: A review and recommended two-step approach. Psychological Bulletin. 103,411-423.
Angle. H.L.. & Lawson, M.B. (1993). Changes in affective and continuance commitment in times of relocation. Journal of Business Research, 26,3-15.
Becker, H.S. (1960). Notes on the concept of commitment. American Journal of Socio[ogy. 66,3242.
Bentler. P.M. (1980). Multivariate analysis with latent variables: Causal modeling. Annual Review of Psychology. 31.419-456.
Bentler, P.M. (1990). Comparative f i t indexes in structural models. Psychological Bulletin, 107.23b246.
Bentler. P.M.. & Bonett, D.G. (1980). Significance tests and goodness of fit in the analysis of covariance structures. Psychological Bulletin. 88,588406.
Buchanan. B. (1974). Building organizational commitment: The socialization of managers in work organizations. Administrative Science Quarterly. 19. 533-546.
Dunham. R.B.. Grube, J.A., & Castaneda. M.B. (1994). Organizational commitment: The utility of an integrative definition. Journal of Applied Psychology. 79. 370-380.
Farrell. D.. & Rusbult. C.E. (1981). Exchange variables as predictors of job satisfaction, job commitment. and turnover: The impact of rewards, costs, alternatives. and investments. Orgonizational Behavior and Human Performance. 28. 78-95.
Fishbein. M.. & Ajzen. 1. (1975). Belief; attitude, intention and behavior. Reading, MA: Addison- Wesley.
Hackett. R.D., Bycio, P.. & Hausdorf. P.A. (1994). Further assessments of Meyer and Allen’s
Psychology, 63,l-18.

COMMITMENT IN A BELGIAN CONTEXT 385
(1991) three-component model of organizational commitment. Journal of Applied Psychology, 79, 15-23.
Hofstede, G. (1980). Culture’s consequences. Beverly Hills, CA: Sage Publications. Hofstede. G. (1991). Cultures and organizations. London: McGraw-Hill. James, L.R., Mulaik, S.A., & Brett, J.M. (1982). Causal analysis: Assumptions, models, and
data. Beverly Hills, CA: Sage Publications. Jaros, S.J., Jermier. J.M.. Koehler, J.W., & Sincich, T. (1993). Effects of continuance,
affective. and moral commitment on the withdrawal process: An evaluation of eight structural equation models. Academy of Management Journal, 36,951-995.
Jbreskog, K.G., & Sorbom, D. (1993a). LISREL 8: Structural equation modeling with the SIMPLIS command language. Chicago, IL: Scientific Software International.
Joreskog, K.G., & Sorbom, D. (1993b). PRELIS 2. Chicago, I L Scientific Software International.
Mathieu, J.E., & Zajac, D.M. (1990). A review and meta-analysis of the antecedents, correlates, and consequences of organizational commitment. Psychological Bulletin. 108,
McGee, G.W.. & Ford, R.C. (1987). Two (or more?) dimensions of organizational commitment: Reexamination of the affective and continuance commitment scales. Journal of Applied Psychology, 7 2 , 6 3 W 2 .
Medsker, G.J., Williams, L.J., & Holahan. P.J. (1994). A review of current practices for evaluating causal models in organizational behavior and human resources management research. Journal of Management, 20,439464.
Meyer, J.P., & Allen, N.J. (1984). Testing the “side-bet theory” of organizational commitment: Some methodological considerations. Journal of Applied Psychology. 69.
Meyer, J.P.. & Allen, N.J. (1991). A three-component conceptualization of organizational commitment. Human Resource Management Review. I , 61-89.
Meyer, J.P., Allen, N.J., & Gellatly, I.R. (1990). Affective and continuance commitment to the organization: Evaluation of measures and analysis of concurrent and time-lagged relations. Journal of Applied Psychology. 7.5.710-720.
Meyer, J.P.. Allen. N.J.. & Smith. C.A. (1993). Commitment to organizations and occupations: Extension and test of a 1 hree-component conceptualization. Journal of Applied Psychology. 78.538-551.
Morrow, P.C. (1983). Concept redundancy in organizational research: The case of work commitment. Academy of Management Review, 8,486-500.
Mowday, R.T., Steers, R.M., & Porter, L.W. (1979). The measurement of organizational commitment. Journal of Vocarional Behavior. 14. 224-247.
Mulaik. S.A., James, L.R.. Van Alstine, J., Bennett, N.. Lind. S., & Stilwell, C.D. (1989). Evaluation of goodness-of-fit indices for structural equation models. Psychological Bulletin. 10s. 430445.
171-194.
372-378.
Nunnally. J.C. (1967). Psychomerric rheory. New York: McGraw-Hill. Oliver, N. (1990). Rewards, investments. alternatives and organizational commitment:
Empirical evidence and theoretical development. Journal of Occirparional Psychology. 63,
Porter. L.W.. Steers, R.M.. Mowday. R.T.. & Boulian, P.V. (1974). Organizational commitment. job satisfaction, and turnover among psychiatric technicians. Journal of Applied Psychology. 59.603-609.
Randall, D.M. (1993). Cross-cultural research on organizational commitment: A review and application of Hofstede’s Value Survey Module. Journal of Business Research, 26.91-1 10.
Randall, D.M., Fedor. D.B.. & Longenecker, C.O. (1990). The behavioral expression of organizational commitment. Journal of Vocarional Behavior. 36. 210-224.
Rusbult, C.E., & Farrell, D. (1983). A longitudinal test of the investment model: The impact
19-31.
,

386 VANDENBERGHE
on job satisfaction, job commitment, and turnover of variations in rewards. costs, alternatives, and investments. Journal of Applied Psychology, 68,429438.
Somers, M.J. (1993). A test of the relationship between I affective and continuance commitment using non-recursive models. Journal of Occupational and Organizational
Vandenberg, R.J., Self, R.M., & Seo, J.H. (1994). A critical examination of the internalization, identification, and compliance commitment measures. Journal of Management, 20,123-140.
Vandenberghe, C. (1995). Value systems among educarional insriturions: The influence of person-culture f i r on organizational commirmenr and job sarbfacrion. Unpublished manuscript.
Widaman, K.F. (1985). Hierarchically nested covariance structure models for multitrait- multimethod data. Applied Psychological Measurement, 9.1-26.
Wiener, Y . (1982). Commitment to organizations: A normative view. Academy of Management Review, 7.41W28.
Wiener, Y., & Vardi, Y. (1980). Relationships between job, organization, and career commitments and work outcomes: An integrative approach. Organizarional Behavior and Human Performance, 26,81-96.
Psychology, 66, 185-192.