Embed Size (px)
Citation preview
APPROVED: Alexandra Ponette, Committee Chair Matt Fry, Committee Member Lisa Nagaoka, Committee Member Paul Hudak, Chair of the Department of
Geography and the Environment David Holdeman, Dean of the College of Arts
and Sciences Victor Prybutok, Vice Provost of the Toulouse
Graduate School
ASSESSING RAINFALL INTERCEPTION BY URBAN TREE CANOPIES
IN DENTON, TEXAS
Patrick Edington
Thesis Prepared for the Degree of
MASTER OF SCIENCE
UNIVERSITY OF NORTH TEXAS
May 2017
Edington, Patrick. Assessing Rainfall Interception by Urban Tree Canopies in Denton,
Texas. Master of Science (Applied Geography), May 2017, 51 pp., 4 tables, 7 figures, references,
105 titles.
Rainfall interception is one mechanism by which tree canopies can reduce surface runoff
in urban areas. The objectives of this research were to: 1) quantify rainfall interception by urban
tree canopies, and 2) determine the influence of vegetation and microenvironmental factors on
rainfall interception rates. In the city of Denton, Texas, 30 mature post oak (Quercus stellata)
and blackjack oak (Quercus marilandica) trees were selected for study. Trees were assigned to
one of three categories: clusters of trees on greenspace (CG), isolated trees on greenspace (IG),
and isolated trees surrounded by pavement (IP). Throughfall (the volume of water that travels
through the canopy and reaches the soil surface) collectors were placed beneath these trees and
rainfall collectors were placed in nearby open areas. Throughfall and rainfall were collected
daily from 19 March to 4 July. Interception was calculated as the difference between throughfall
and gross rainfall. Over the study period, there were 27 days with measurable rainfall; daily
rainfall ranged from 1-51 mm. Over the sampling period, rainfall interception for individual
trees ranged from -10% to 49%, indicating high spatial variability in interception. Percent
interception was highest for the CG treatment (22.7 ± 3.8 SE), intermediate for IG (27.4 ± 2.3
SE), and lowest for IP (9.1 ± 4.9 SE). Factors like wind exposure, wind-driven rain and overall
tree health may help explain this variability. This research will contribute to our knowledge of
hydrological fluxes in urban areas and the role of urban green infrastructure in stormwater runoff
mitigation.

ii
Copyright 2017
By
Patrick Edington

iii
ACKNOWLEDGEMENTS
Many people were involved in the completion of this thesis besides myself. I would like
to thank UNT Facilities for allowing long-term sampling on university grounds. Thanks to Mike
Sakinejad, Wesley Hellman, Reed Underwood, Jen Bailey, Zac Rowen and Jenna Rindy for
donating quality advice, assistance and being stellar fellow students. Thanks to all UNT
Geography and the Environment faculty and staff for maintaining an excellent department and
learning environment. I extend special thanks to committee members Dr. Matthew Fry and Dr.
Lisa Nagaoka for their time, input and dedication to their work, to which all students and
researchers should aspire. Much gratitude goes out to my family and friends outside of
academia, whose advice and encouragement helped me see this project through to the end,
through the good times and the bad. Extra special thanks go out to my advisor, Dr. Alexandra
Ponette-González, whose skills as a scientist and mentor were a driving force behind the
completion of this research, and whose involvement in my education allowed me to realize and
reach my full potential.
iv
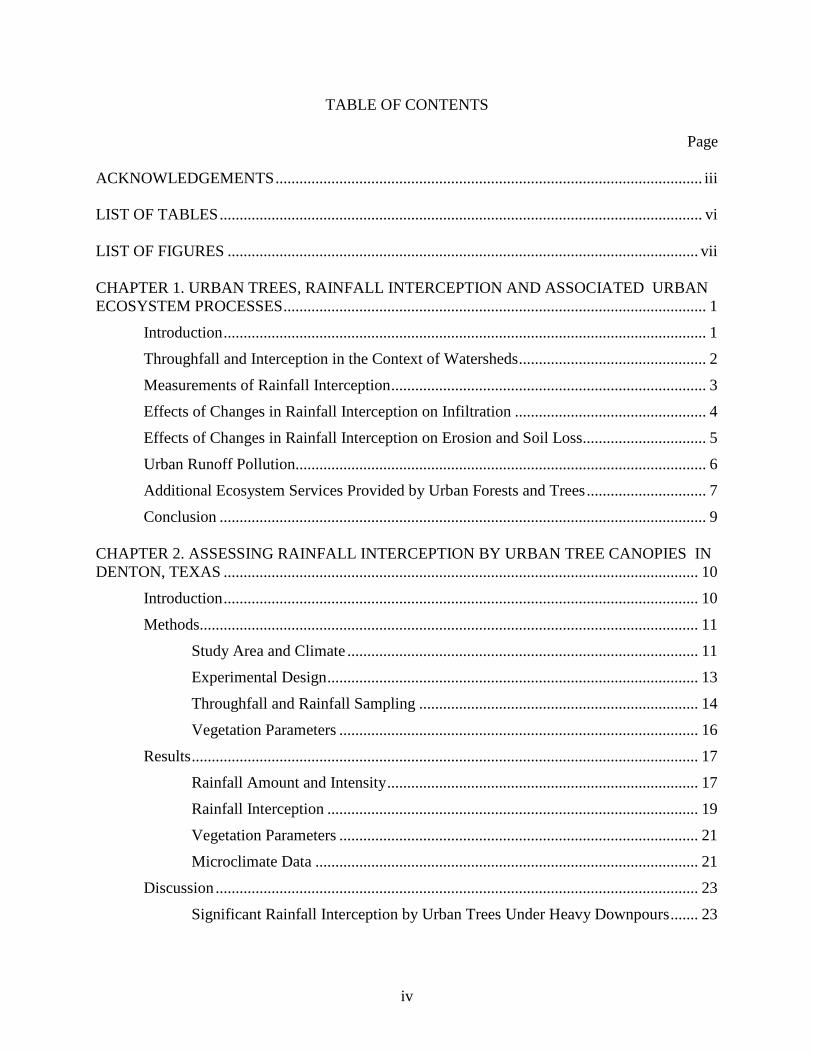
TABLE OF CONTENTS
Page
ACKNOWLEDGEMENTS ........................................................................................................... iii LIST OF TABLES ......................................................................................................................... vi LIST OF FIGURES ...................................................................................................................... vii CHAPTER 1. URBAN TREES, RAINFALL INTERCEPTION AND ASSOCIATED URBAN ECOSYSTEM PROCESSES .......................................................................................................... 1
Introduction ......................................................................................................................... 1
Throughfall and Interception in the Context of Watersheds ............................................... 2
Measurements of Rainfall Interception ............................................................................... 3
Effects of Changes in Rainfall Interception on Infiltration ................................................ 4
Effects of Changes in Rainfall Interception on Erosion and Soil Loss............................... 5
Urban Runoff Pollution....................................................................................................... 6
Additional Ecosystem Services Provided by Urban Forests and Trees .............................. 7
Conclusion .......................................................................................................................... 9 CHAPTER 2. ASSESSING RAINFALL INTERCEPTION BY URBAN TREE CANOPIES IN DENTON, TEXAS ....................................................................................................................... 10
Introduction ....................................................................................................................... 10
Methods............................................................................................................................. 11
Study Area and Climate ........................................................................................ 11
Experimental Design ............................................................................................. 13
Throughfall and Rainfall Sampling ...................................................................... 14
Vegetation Parameters .......................................................................................... 16
Results ............................................................................................................................... 17
Rainfall Amount and Intensity .............................................................................. 17
Rainfall Interception ............................................................................................. 19
Vegetation Parameters .......................................................................................... 21
Microclimate Data ................................................................................................ 21
Discussion ......................................................................................................................... 23
Significant Rainfall Interception by Urban Trees Under Heavy Downpours ....... 23
v
Parking Lot Trees Experience Warmer Temperatures but not Higher Interception Losses in an Urban Area ....................................................................................... 24
Conclusion ............................................................................................................ 26 CHAPTER 3. CONCLUSIONS ................................................................................................... 27
Climate Change Impacts on the Hydrologic Cycle........................................................... 27
Urban Hydrology .............................................................................................................. 28
Ecosystem Services ........................................................................................................... 30
Urban Forestry .................................................................................................................. 31
Policy Recommendations.................................................................................................. 31
Summary ........................................................................................................................... 32 APPENDIX A. TREE LOCATIONS FOR NORTH CAMPUS (NC), MID-CAMPUS (MC), AND SOUTH CAMPUS (SC) SAMPLING AREAS .................................................................. 33 APPENDIX B. TREE LOCATIONS FOR CONCERT HALL (CH), GOLF COURSE (GC) AND HIGHLAND PARK (HP) SAMPLING AREAS ................................................................ 35 APPENDIX C. RAINFALL AND INTERCEPTION DATASET ............................................... 37 APPENDIX D. VEGETATION PARAMETERS DATASET ..................................................... 39 APPENDIX E. CORRELATIONS OF % INTERCEPTION BY HEIGHT, DBH, LIVE CROWN RATIO, CROWN PROJECTION AREA AND CANOPY OPENNESS .................................... 41 REFERENCES ............................................................................................................................. 44

vi
LIST OF TABLES
Page
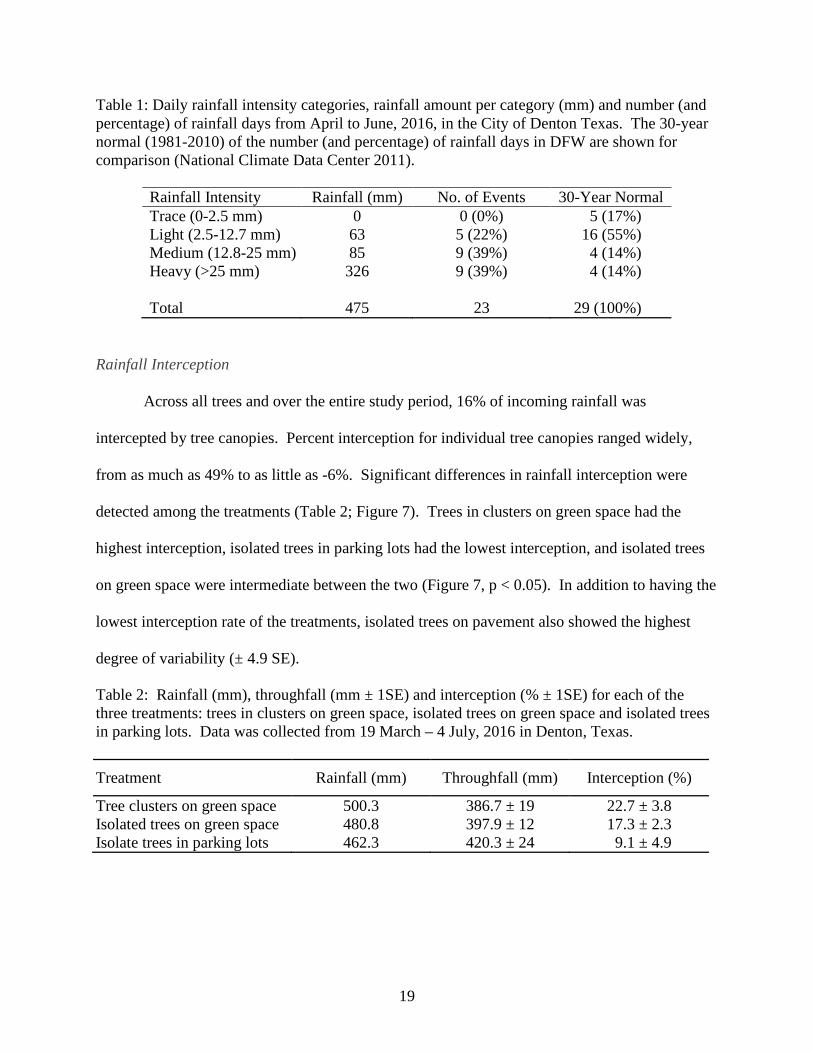
Table 1: Daily rainfall intensity categories, rainfall amount per category (mm) and number (and percentage) of rainfall days from April to June, 2016, in the City of Denton Texas. The 30-year normal (1981-2010) of the number (and percentage) of rainfall days in DFW are shown for comparison (National Climate Data Center 2011)........................................................................ 19
Table 2: Rainfall (mm), throughfall (mm ± 1SE) and interception (% ± 1SE) for each of the three treatments: trees in clusters on green space, isolated trees on green space and isolated trees in parking lots. Data was collected from 19 March – 4 July, 2016 in Denton, Texas. ................ 19
Table 3: Interception rates (%) by treatment for light, medium and heavy rainfall intensities ± SE. Trace events are not included on account of there being none from April to June, 2016. .... 20
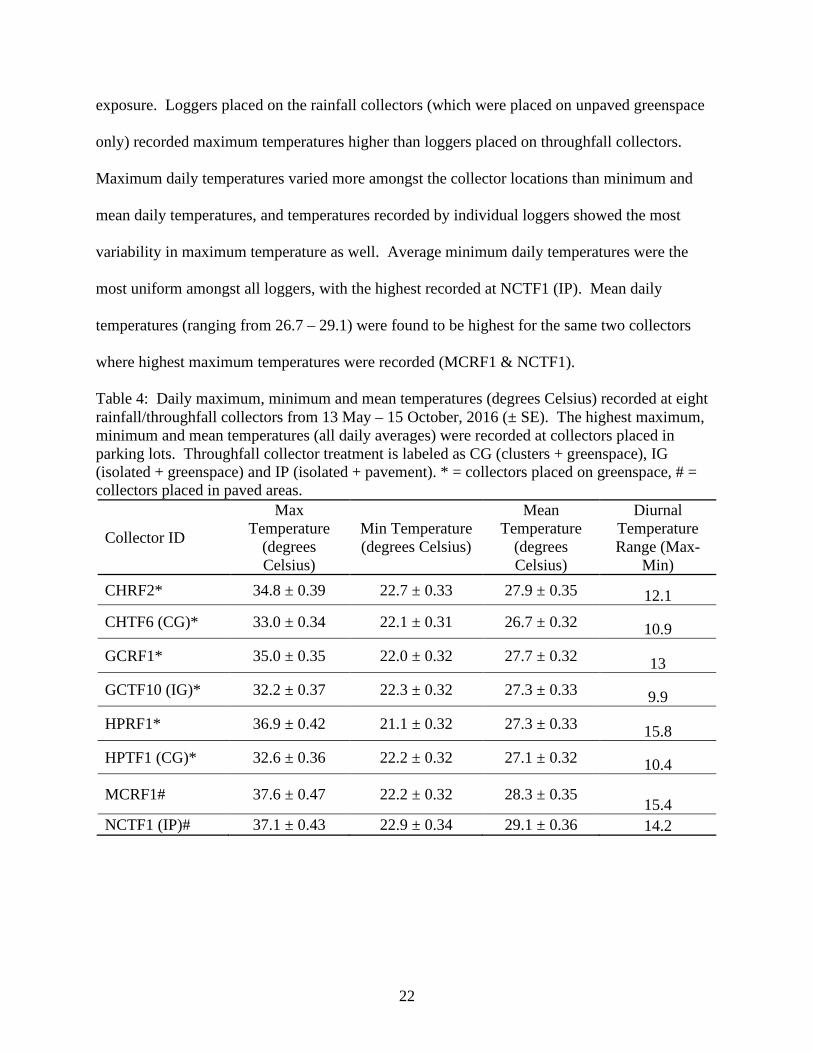
Table 4: Daily maximum, minimum and mean temperatures (degrees Celsius) recorded at eight rainfall/throughfall collectors from 13 May – 15 October, 2016 (± SE). The highest maximum, minimum and mean temperatures (all daily averages) were recorded at collectors placed in parking lots. Throughfall collector treatment is labeled as CG (clusters + greenspace), IG (isolated + greenspace) and IP (isolated + pavement). * = collectors placed on greenspace, # = collectors placed in paved areas. ................................................................................................... 22
vii
LIST OF FIGURES
Page
Figure 1: Mean monthly rainfall for Denton Municipal Airport, 1981-2010. Data from the National Oceanic and Atmospheric Administration (National Climate Data Center). ................. 12
Figure 2: Percent change in the amount of precipitation falling in very heavy events in the Great Plains South region, USA. Heavy events are defined as the heaviest 1% of daily events from 1901-2012. (Source: NOAA NCDC/CICS-NC). ......................................................................... 13
Figure 3: Three categories of trees situated along a microenvironmental gradient. Figure is read from left to right. In this conceptual diagram, heat and evaporation (E) increase from left to right, while rainfall (RF) is assumed to be similar in each environment. Due to changes in these factors, rainfall interception loss is likely to increase along the gradient, resulting in a decrease in throughfall input to the surface at the individual tree scale. ......................................................... 14
Figure 4: Throughfall collectors in a cluster of trees on green space (top), under an isolated tree on green space (middle), and under an isolated tree in a parking lot (bottom). ............................ 15
Figure 5: Rainfall (mm) measured at six sampling locations from 19 March – 4 July, 2016 within the study area in the City of Denton, Texas....................................................................... 17
Figure 6: Daily rainfall (mm) measured from 19 March 2016 to 4 July 2016 in the City of Denton, Texas. .............................................................................................................................. 18
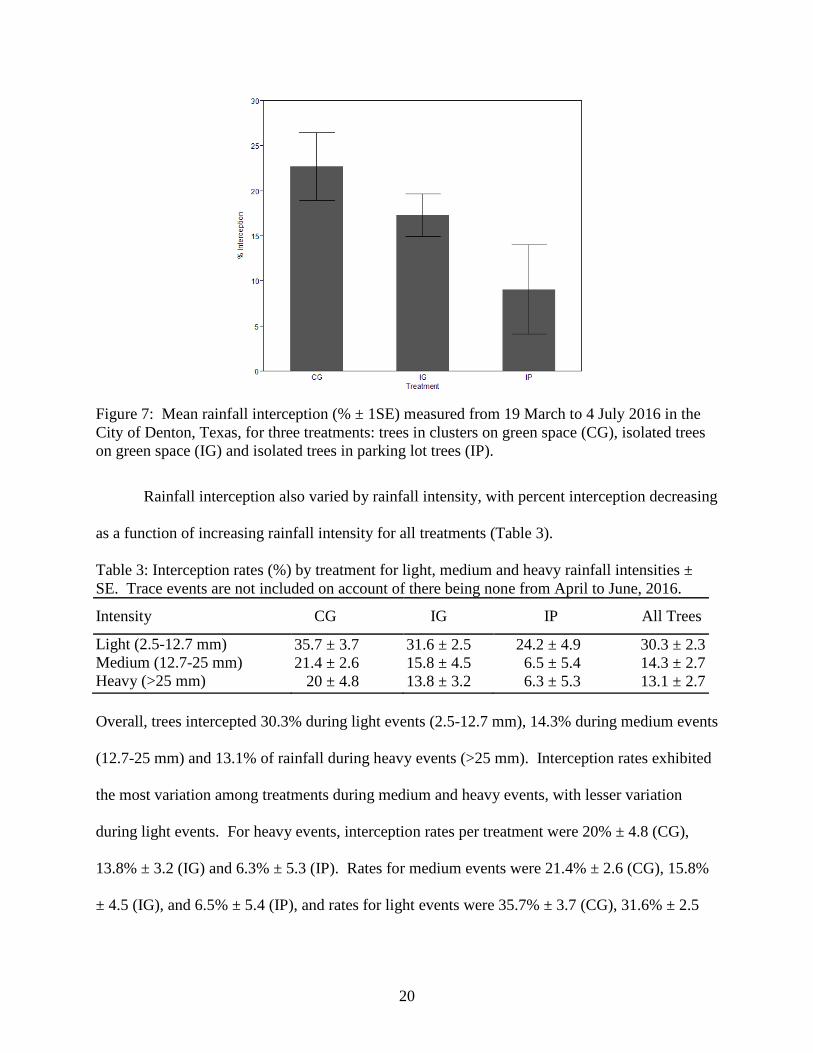
Figure 7: Mean rainfall interception (% ± 1SE) measured from 19 March to 4 July 2016 in the City of Denton, Texas, for three treatments: trees in clusters on green space (CG), isolated trees on green space (IG) and isolated trees in parking lot trees (IP). ................................................... 20

1
CHAPTER 1
URBAN TREES, RAINFALL INTERCEPTION AND ASSOCIATED
URBAN ECOSYSTEM PROCESSES
Introduction
As of 2014, the global urban population accounted for 54% of the total population, up
from 34% in 1960 (GHO 2014). Though much of this growth has been concentrated in the
Global South, urban sprawl has continued at a vigorous pace across North America as well,
resulting in land cover changes that alter interactions between precipitation and the earth’s
surface (Carlson & Arthur 2000, Booth & Jackson 1997, Booth et al. 2002). Flood pulses have
been shown to be more severe in urban centers (Paul & Meyer 2001) as well as in areas
downstream from them (Jha et al. 2012), the result of increased impermeable surface cover (Jha
et al. 2012, Brun & Band 2000). Due to the presence of these barriers, which limit possible
pathways for rainwater, surface runoff volumes tend to be greater in urban than in rural areas and
undisturbed ecosystems (Schmitt et al. 2004).
The removal of native trees and vegetation, in general, for urban development,
agriculture or other purposes, further exacerbates the problem of excessive urban runoff
(Hartanto et al. 2003, McPherson et al. 2005, Pataki et al. 2011). The presence of vegetation at
the canopy and understory level throughout watersheds can function as a buffer between the
atmosphere and surface, effectively delaying the flow of surface runoff into neighboring streams
and, in the case of cities, the local stormwater infrastructure (Kosmas et al. 1997, Nearing et al.
2005). Tree canopies provide yet another check on surface runoff levels by intercepting a
percentage of rainfall that occurs, allowing it to evaporate before it drops to the ground. When
combined with the impermeable surfaces associated with urbanization, the removal of native

2
vegetation and its associated ecosystem services can therefore have a profound impact on the
character of affected urban watersheds (Brabec et al. 2002, Paul and Meyer 2001).
This chapter provides an introduction to the complex role of rainfall interception in the
urban hydrologic cycle, and reviews additional ecosystem services provided by urban trees and
forests. Recent research on the benefits of expanding urban forests will also be considered as
part of a comprehensive description of their structure and function in an urban setting.
Throughfall and Interception in the Context of Watersheds
Throughfall refers to the portion of gross precipitation that makes contact with a plant
canopy before it ultimately drips to the soil surface (Hewlett 1982). Prolonged exposure to the
atmosphere while water is suspended in the canopy enables a portion to evaporate, thereby
reducing the amount of throughfall in areas beneath the canopy. This physical process of
evaporation from the canopy during and after incident precipitation will be termed “interception”
throughout this paper. Detailed knowledge of how rainfall interception can influence erosive and
hydrological processes is crucial to the management of watersheds (Levia and Frost 2003,
Brooks et al. 2012) and therefore this topic merits special attention where urban surface
conditions prevail.
Nevertheless, to date, the majority of studies involving rainfall interception have been
conducted in naturally forested ecosystems that are to some extent protected from urban
encroachment (e.g., Ponette-González et al. 2016). These studies date back to the early 1900s.
The diversity of tree species in undisturbed environments, the undisturbed character of drainage
basins and higher level of security for rainfall collectors and other equipment have contributed to

3
interest in studying rainfall interception in these systems (Asadian and Weiler 2009). The
inclusion of urban ecosystems in these studies is a fairly recent development in the literature.
Measurements of Rainfall Interception
Given the high temporal and spatial variability of precipitation and throughfall in urban
and forested environments, there is considerable debate regarding the optimal number, type, and
location of rainfall and throughfall collectors for interception studies (Gash 1979, Levia & Frost
2003). Funnel gauges that are fixed a certain distance above ground are cited as more reliable
than other collector types, as they minimize loss of water from splashing and therefore result in
more accurate measurements (Levia & Frost 2003, Xiao et al. 2000). Ground-based trough
gauges collect more measurable precipitation than funnels in the same location due to their
greater surface area, and are viewed as better for estimating spatial variability in throughfall
(Kostelnik et al. 1989). As individual studies accumulate, the consensus is that the number of
collectors and placement strategies are most important when measuring throughfall input. Some
results suggest that random repositioning of collectors after each measurement/storm event can
produce a more accurate data set with fewer collectors than if they remain stationary (Wang et al.
2008).
When evaluating forested areas, the distinction between dominant, co-dominant and
isolated trees is imperative when choosing locations for rainfall collectors. Dominant trees
comprise the main overstory in the plant community and are responsible for intercepting most
rainwater, while co-dominant trees fill in the gaps in vegetation and are often prevented from
reaching their full potential by the larger dominant individuals. Trees that are relatively isolated
in space should be sampled accordingly as well with the goal of cataloging data about individual

4
species and their interception capabilities, without interference from other obstructions in the
canopy (Forti and Neal, 1992). Inclusion of the different categories of trees in a forested system
is advantageous as it captures spatial variability (Asadian & Weiler 2009, Levia & Frost 2006).
In urban throughfall studies, locations are often selected based on high levels of
urbanization and dense populations, which tend to translate into limited space for urban forests
and vegetation (Sanders 1986). In these studies, differences in climate and rainfall patterns play
a large role in how precipitation and throughfall are actually measured over time. For example,
coastal Vancouver, British Columbia, is known for long periods of light, steady rainfall,
particularly in winter. This climate influenced how Asadian and Weiler (2009) recorded data
from rain collectors. Regular intervals were chosen based on differences in average precipitation
at different elevations. In contrast, a study conducted in the Raleigh Metropolitan Area
(Inkilainin et al. 2013) revolved around less frequent but more intense rainfall events. Data was
recorded after each major storm event. These studies conclude that more research is needed to
understand interactions between precipitation and vegetation.
Effects of Changes in Rainfall Interception on Infiltration
In addition to affecting the amount of water reaching the surface, the process of rainfall
interception slows the rate at which water is delivered to the surface, thus providing more time
for infiltration to take place (Brooks et al. 2012, Nearing et al. 2005). Infiltration is defined as
the process by which water enters and is absorbed by the soil (Hornberger et al. 2014). The
relationship between forest canopies and infiltration is well documented in a variety of
ecosystems and climate types (Ponette-González et al. 2014, Bhark and Small 2003, Allen 1985)
and consistently shows that infiltration is a larger percentage of gross precipitation in forested

5
ecosystems. Communities of soil biota often develop within specific soil moisture conditions
and can be sensitive to the removal of surface vegetation, which increases surface runoff at the
expense of infiltration and groundwater recharge (Pimentel et al. 1995, Huxman et al.
2005). Along with the canopy, tree roots affect infiltration as they break up compacted soils and
lower subsoils, allowing such soils to handle greater water volumes during rainfall events
(Bartens et al. 2008).
Effects of Changes in Rainfall Interception on Erosion and Soil Loss
Removal of forests and tree canopies and their precipitation-buffering and soil-stabilizing
characteristics is often accompanied by increased erosion rates and soil loss, particularly during
the conversion of land for agricultural use (Montgomery 2007, Oldeman 1994, Kosmas 1997).
Forest soils develop with regular additions of organic material while being protected by the
canopy and understory vegetation from intense fluvial and eolian erosion. Elimination of
vegetation exposes soils that are ill-equipped to withstand heavy downpours; such soils can
experience sediment loss between 15 and 90 tons/km2 per year in Mediterranean conditions
(Kosmas et al. 1997). In the same study, conducted at numerous sites under different land-use
types, the semi-natural conditions found in an olive plantation restricted soil losses to values that
were negligible (0.8 tons/km2 per year). Watersheds in the tropics that experience higher rainfall
totals and intensities are more vulnerable to accelerated erosion rates caused by deforestation
(Foley et al. 2005, Carlson et al. 2014).
Biotic and abiotic effects of excessive erosion are numerous and can impact parts of a
watershed far removed spatially from point sources of sediment (Hartanto et al. 2003, Corbett et
al. 1997, Ponette-González et al. 2010). Eutrophication of neighboring waterways as well as
6
increased turbidity can result in loss of wildlife habitat and the disruption of stream ecology
(Gray and Leiser 1989, Resh et al. 1988). The fact that forests are often cleared for agricultural
purposes implies that both of these elements will be encountered in areas downstream from these
land use changes.
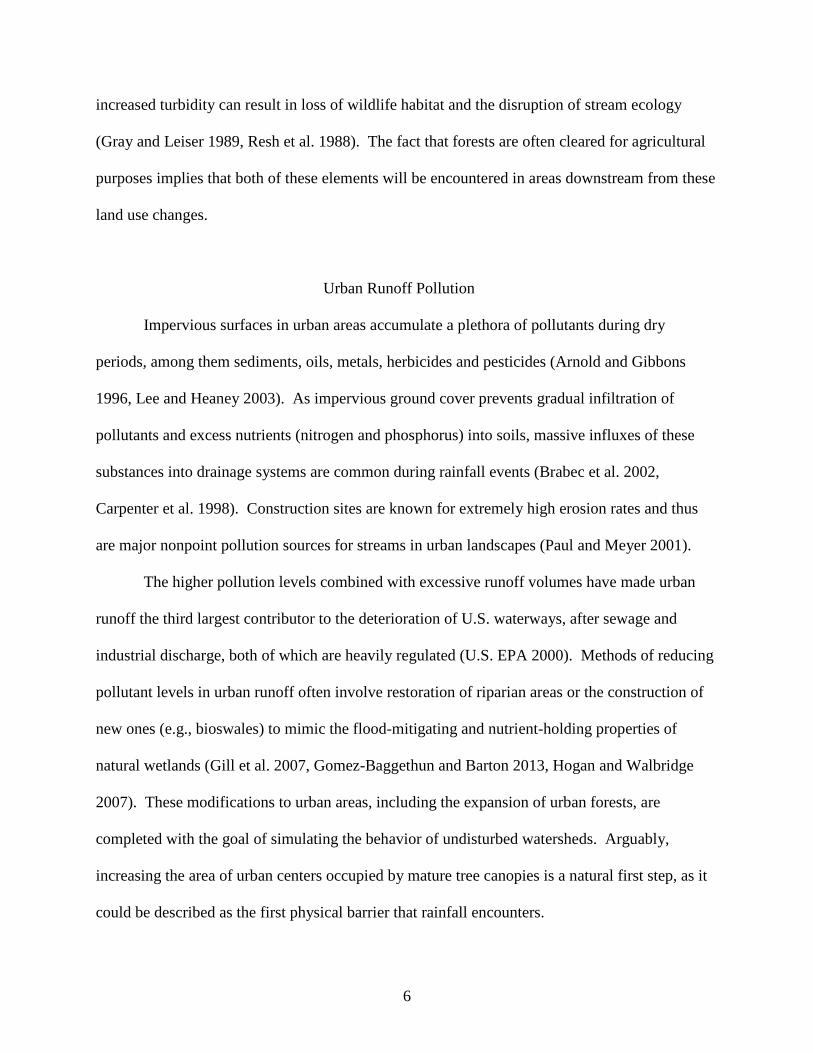
Urban Runoff Pollution
Impervious surfaces in urban areas accumulate a plethora of pollutants during dry
periods, among them sediments, oils, metals, herbicides and pesticides (Arnold and Gibbons
1996, Lee and Heaney 2003). As impervious ground cover prevents gradual infiltration of
pollutants and excess nutrients (nitrogen and phosphorus) into soils, massive influxes of these
substances into drainage systems are common during rainfall events (Brabec et al. 2002,
Carpenter et al. 1998). Construction sites are known for extremely high erosion rates and thus
are major nonpoint pollution sources for streams in urban landscapes (Paul and Meyer 2001).
The higher pollution levels combined with excessive runoff volumes have made urban
runoff the third largest contributor to the deterioration of U.S. waterways, after sewage and
industrial discharge, both of which are heavily regulated (U.S. EPA 2000). Methods of reducing
pollutant levels in urban runoff often involve restoration of riparian areas or the construction of
new ones (e.g., bioswales) to mimic the flood-mitigating and nutrient-holding properties of
natural wetlands (Gill et al. 2007, Gomez-Baggethun and Barton 2013, Hogan and Walbridge
2007). These modifications to urban areas, including the expansion of urban forests, are
completed with the goal of simulating the behavior of undisturbed watersheds. Arguably,
increasing the area of urban centers occupied by mature tree canopies is a natural first step, as it
could be described as the first physical barrier that rainfall encounters.

7
Additional Ecosystem Services Provided by Urban Forests and Trees
In addition to being a major pillar of stormwater mitigation efforts (Pataki et al. 2011,
Escobedo et al. 2011, McPherson et al. 2005, Xiao et al. 2007), urban forests and trees in general
are attracting interest for their ability to curb air pollution (Yang et al. 2005, Escobedo et al.
2008, Nowak et al. 2006), reduce the urban heat island effect (McPherson et al. 1997, Gill et al.
2007, Tyrväinen et al. 2005), improve biodiversity (Alvey 2006, Dearborn and Kark 2010,
Nowak and Dwyer 2007) and increase property values in adjacent neighborhoods (Tyrväinen and
Miettinen 2000, Irwin 2002, Mansfield et al. 2005). This variety of benefits can be studied using
the ecosystem services framework, an approach that will likely be invaluable as urban
populations continue to grow (Nowak and Walton 2005).
The development of urban forestry programs has been identified as a cost-efficient form
of “biotechnology” that, when implemented, can improve air quality and reduce greenhouse gas
emissions (Nowak 2006). Pollution removal by trees in major U.S. cities has been observed to
exceed 1500 metric tons per year, with ozone concentrations seeing the greatest reductions
(Nowak et al. 2006). In the context of urban ecosystems, research also continues on the ability
of urban trees to sequester carbon (Pataki et al. 2006, Nowak et al. 2013), although urban forests
account for only 3.2% of carbon stored by U.S. forests (Nowak et al. 2013). The removal of
airborne pollutants by trees has received significant attention in Chinese cities as well, where
sulfur dioxide, nitrogen oxides, ozone and carbon monoxide often surpass healthy levels (Jim
and Chen 2009, Liu and Li 2012, Yang et al. 2005).
The abundance of vegetation is one of the most influential factors in the severity of urban
heat islands, particularly when it replaces impervious, reflective surfaces, or when canopy cover
shields these surfaces from solar radiation (Weng et al. 2004, Rosenfeld et al. 1995). In terms of

8
parks and greenspace, the cooling potential of urban trees varies depending on species
composition, canopy intensity, size and shape of the area (Feyisa et al. 2014). By mitigating the
urban heat island effect, urban trees have been shown to influence energy consumption in city
centers, thereby reducing their carbon footprint in an effort to curb the associated climatic
changes (Akbari 2002, Jo 2002, Nowak 2002).
Preservation of undisturbed habitat is increasingly becoming a priority for urban
planners, as it aids in decelerating the rapid current rate of biodiversity loss (Alvey 2006,
Dearborn and Lark 2010, Hansen et al. 2005). Traditionally, urban centers have been overlooked
as hotspots of biodiversity, but are now embraced as an environment where conservationists can
be heavily involved restoration efforts. These reconstructed urban biomes may be deemed
artificial by some, but they are valued by others as an adaptation to the drastic habitat changes so
often seen in the current era of global environmental change (Kowarik 2011).
In addition to the environmental benefits associated with urban forests and trees,
researchers have documented a clear relationship between real estate values and proximity to
urban forests and green spaces (Tyrvainen and Miettinen 2000, Mansfield et al. 2005, Luttik
2000), a stark contrast to the general ambiguity that surrounds topics like the arbitrary aesthetic
value of urban greenery. Even still, Mansfield et al. (2005) argue that the aesthetic value of
urban trees cannot be questioned, as it is often the first addition to new, clear-cut subdivisions
after they are inhabited. While preserved urban forest parcels do not equate to undisturbed tracts
of forest, the consensus is that these parcels and greenspace have a net positive effect on property
values and quality of life in cities, as it is seen as providing an absence of development, rather
than a collection of open space amenities (Irwin 2002).

9
Conclusion
Research on the services provided by urban greenery, and urban trees, in particular, is
vital to understanding and mitigating environmental issues associated with urbanization. As
urban populations increase and exurban sprawl continues, the hydrologic cycle will increasingly
be altered by impervious surfaces and reductions in canopy cover. Such changes are expected to
have an even greater impact in the coming decades if current trends involving the accelerating
hydrologic cycle continue (Huntington 2006). By preserving and restoring canopy cover and the
process of rainfall interception in cities, areas susceptible to excess surface runoff and its
associated problems can prepare for denser populations and higher projected rainfall totals
(NOAA 2010).
10
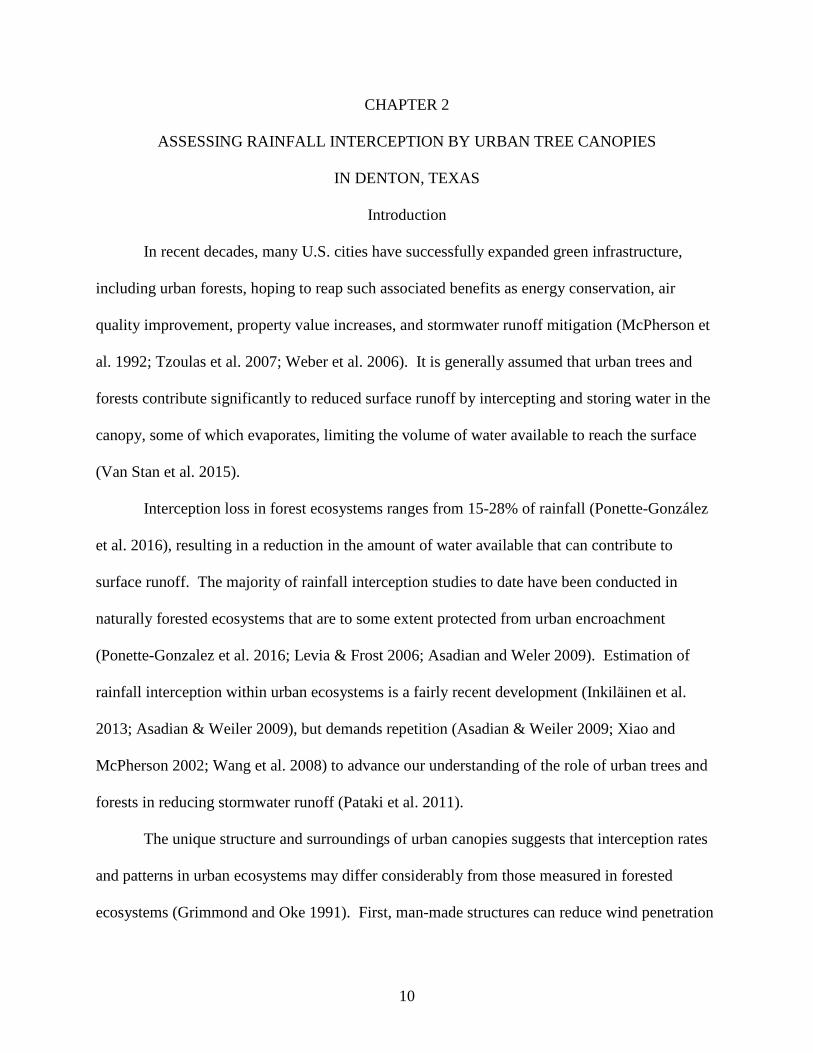
CHAPTER 2
ASSESSING RAINFALL INTERCEPTION BY URBAN TREE CANOPIES
IN DENTON, TEXAS
Introduction
In recent decades, many U.S. cities have successfully expanded green infrastructure,
including urban forests, hoping to reap such associated benefits as energy conservation, air
quality improvement, property value increases, and stormwater runoff mitigation (McPherson et
al. 1992; Tzoulas et al. 2007; Weber et al. 2006). It is generally assumed that urban trees and
forests contribute significantly to reduced surface runoff by intercepting and storing water in the
canopy, some of which evaporates, limiting the volume of water available to reach the surface
(Van Stan et al. 2015).
Interception loss in forest ecosystems ranges from 15-28% of rainfall (Ponette-González
et al. 2016), resulting in a reduction in the amount of water available that can contribute to
surface runoff. The majority of rainfall interception studies to date have been conducted in
naturally forested ecosystems that are to some extent protected from urban encroachment
(Ponette-Gonzalez et al. 2016; Levia & Frost 2006; Asadian and Weler 2009). Estimation of
rainfall interception within urban ecosystems is a fairly recent development (Inkiläinen et al.
2013; Asadian & Weiler 2009), but demands repetition (Asadian & Weiler 2009; Xiao and
McPherson 2002; Wang et al. 2008) to advance our understanding of the role of urban trees and
forests in reducing stormwater runoff (Pataki et al. 2011).
The unique structure and surroundings of urban canopies suggests that interception rates
and patterns in urban ecosystems may differ considerably from those measured in forested
ecosystems (Grimmond and Oke 1991). First, man-made structures can reduce wind penetration
11
into the canopy (Grimmond and Oke 1991), reducing canopy evaporation and hence interception
loss. Conversely, the open grown habit of many urban trees increases exposed leaf area as well
as air circulation, and may serve to increase interception loss (Asadian and Weiler 2009).
Second, in urban ecosystems, tree spacing can range from dense, mature clusters of trees in older
residential areas to younger, open grown trees in parks and parking areas, which may promote
higher spatial variability in rates of canopy interception than in forested (Nadkarni and Sumera
2004; Staelens et al. 2006). Third, the prevalence of dark, impervious surfaces in urban areas
produces warmer conditions in the lower atmosphere (part of the urban heat island effect). These
warmer temperatures may increase the rate of evaporation at the canopy level (Pataki et al.
2011), increasing interception loss. In sum, several unique characteristics of urban ecosystems
could significantly influence rainfall interception, including urban form, tree spacing, and
temperature.
Knowledge of the quantity of rainwater intercepted by urban trees and the variables
influencing interception may be helpful to determine where to plant trees, or where to conserve
existing urban trees and forested areas. Therefore, this research has two main objectives: (i)
quantify rates of canopy rainfall interception in an urban environment; and (ii) determine the
influence of rainfall intensity, vegetation, and microenvironment characteristics on rainfall
interception.
Methods
Study Area and Climate
This study was conducted in the City of Denton (33°12’53”N, 97°07’59”W), Texas,
about 65 km northwest of Dallas in the greater Dallas/Fort Worth metropolitan area. Denton has
12
a humid subtropical climate and receives approximately 958 mm of rainfall per year over an
average of only 77 wet days (NOAA 2016). Based on the most recent 30-year average (1981-
2010), 30% of rainfall events are medium to heavy, delivering >13 mm rainfall/day (NOAA
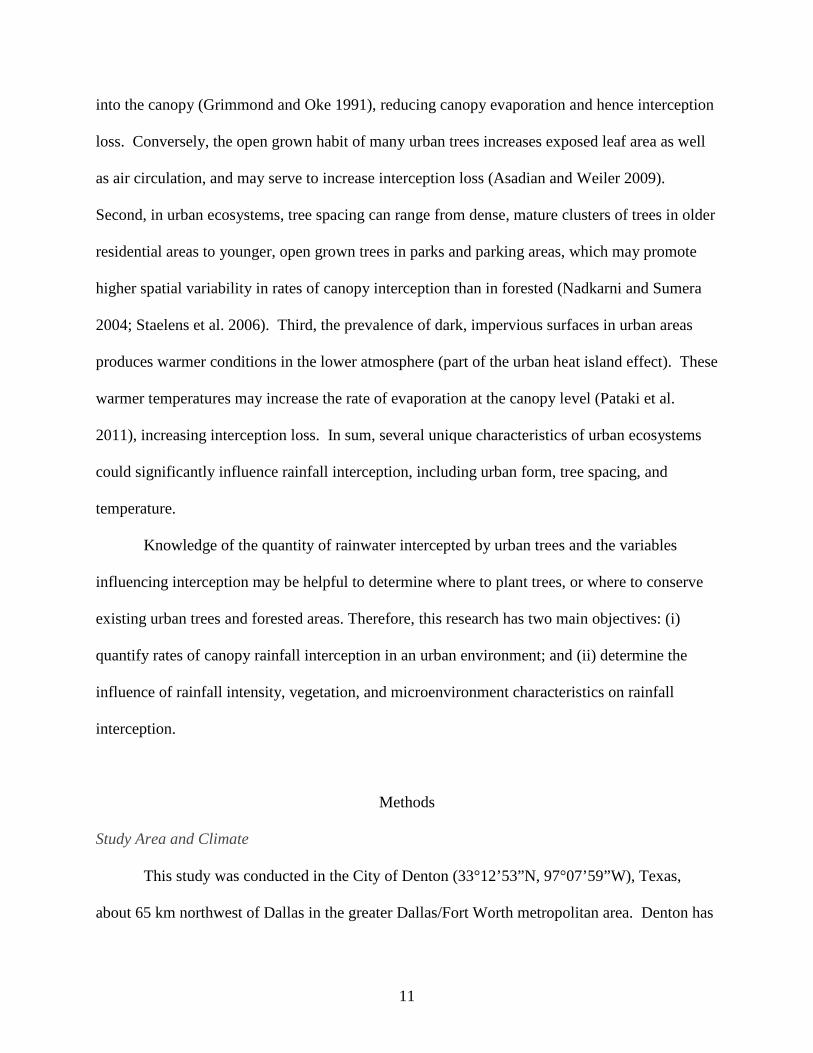
NCDC/CICS-NC). Rainfall is highest during May, with a smaller but still significant increase in
rainfall during fall, typically in October (Fig. 1). Severe thunderstorms and flash floods occur
frequently in Denton during spring, when most rainfall occurs. Dry winds affect the area during
the summer months and can result in prolonged periods with 38 degree Celsius days and little to
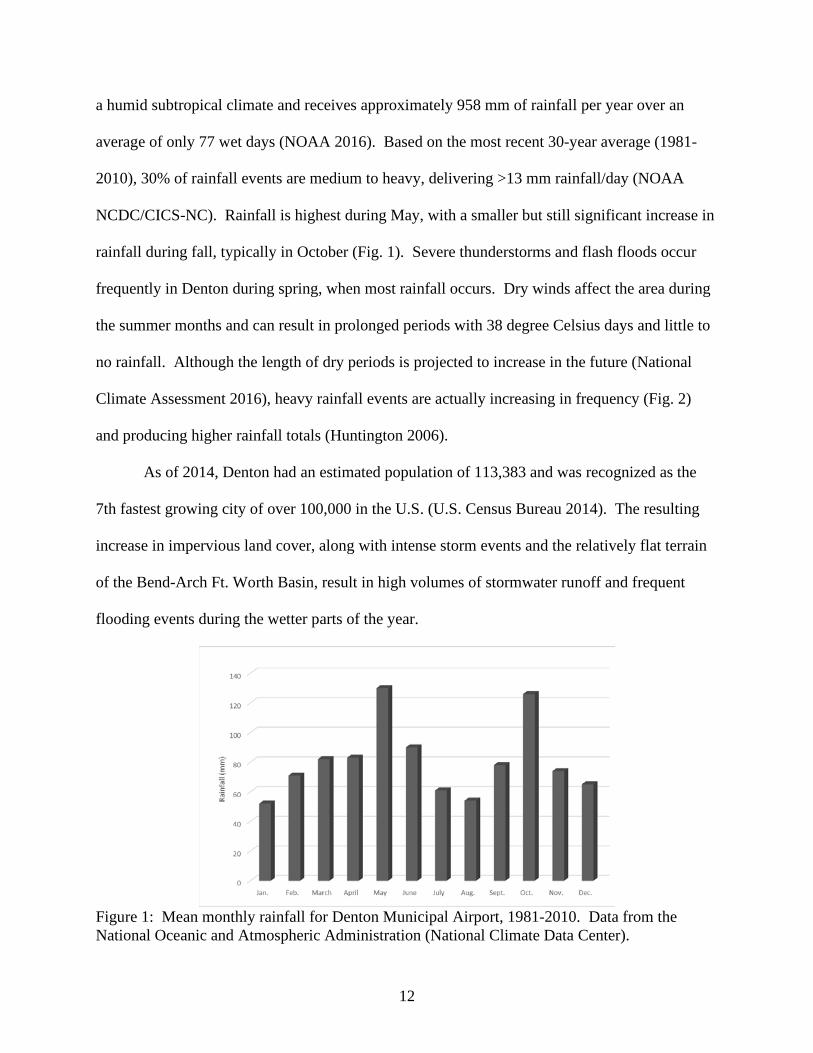
no rainfall. Although the length of dry periods is projected to increase in the future (National
Climate Assessment 2016), heavy rainfall events are actually increasing in frequency (Fig. 2)
and producing higher rainfall totals (Huntington 2006).
As of 2014, Denton had an estimated population of 113,383 and was recognized as the
7th fastest growing city of over 100,000 in the U.S. (U.S. Census Bureau 2014). The resulting
increase in impervious land cover, along with intense storm events and the relatively flat terrain
of the Bend-Arch Ft. Worth Basin, result in high volumes of stormwater runoff and frequent
flooding events during the wetter parts of the year.
Figure 1: Mean monthly rainfall for Denton Municipal Airport, 1981-2010. Data from the National Oceanic and Atmospheric Administration (National Climate Data Center).
13
Figure 2: Percent change in the amount of precipitation falling in very heavy events in the Great Plains South region, USA. Heavy events are defined as the heaviest 1% of daily events from 1901-2012. (Source: NOAA NCDC/CICS-NC).
Experimental Design
Thirty trees were selected along an urban microenvironmental gradient (Fig. 3) on the
University of North Texas campus in Denton. Trees were assigned to one of three categories:
trees in clusters on green space (CG), isolated trees on green space (IG), and isolated trees in
parking lots (IP). Tree clusters were defined as groups of three or more trees with intersecting
canopies. A tree was considered ‘isolated’ when a distance greater than or equal to the tree’s
height separated it from the edge of the nearest tree’s canopy. Tree size was controlled for by
visually selecting trees with similar diameter at breast height. In addition, only post oak
(Quercus stellata) and blackjack oak (Quercus marilandica) trees were selected. The leaf shape
and canopy structure of these species is similar, and both are dominant in the Eastern Cross
Timbers, of which Denton is a part.
14
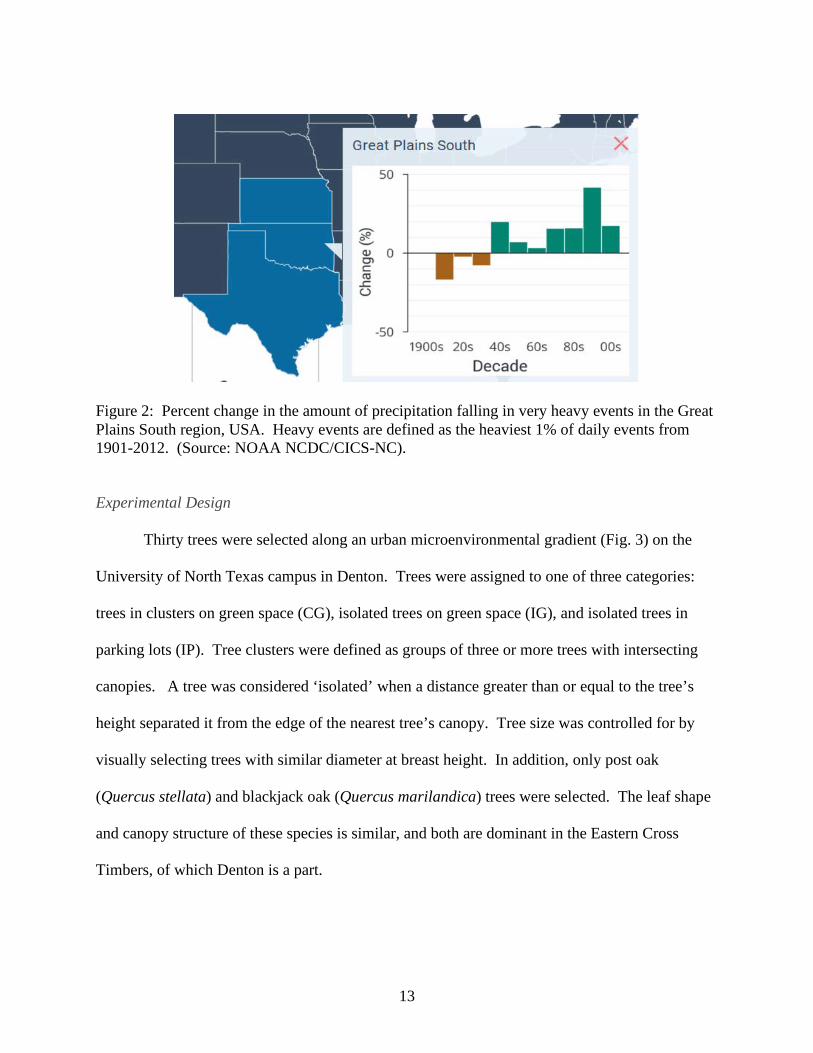
Figure 3: Three categories of trees situated along a microenvironmental gradient. Figure is read from left to right. In this conceptual diagram, heat and evaporation (E) increase from left to right, while rainfall (RF) is assumed to be similar in each environment. Due to changes in these factors, rainfall interception loss is likely to increase along the gradient, resulting in a decrease in throughfall input to the surface at the individual tree scale.
Throughfall and Rainfall Sampling
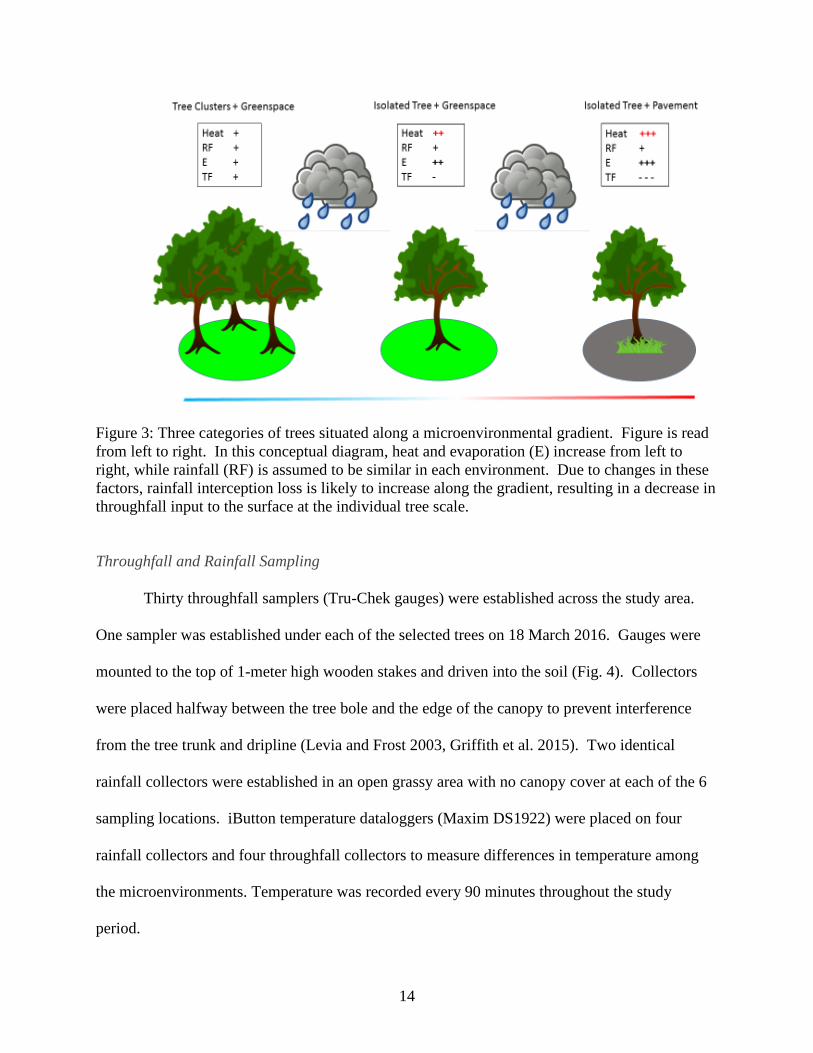
Thirty throughfall samplers (Tru-Chek gauges) were established across the study area.
One sampler was established under each of the selected trees on 18 March 2016. Gauges were
mounted to the top of 1-meter high wooden stakes and driven into the soil (Fig. 4). Collectors
were placed halfway between the tree bole and the edge of the canopy to prevent interference
from the tree trunk and dripline (Levia and Frost 2003, Griffith et al. 2015). Two identical
rainfall collectors were established in an open grassy area with no canopy cover at each of the 6
sampling locations. iButton temperature dataloggers (Maxim DS1922) were placed on four
rainfall collectors and four throughfall collectors to measure differences in temperature among
the microenvironments. Temperature was recorded every 90 minutes throughout the study
period.
15
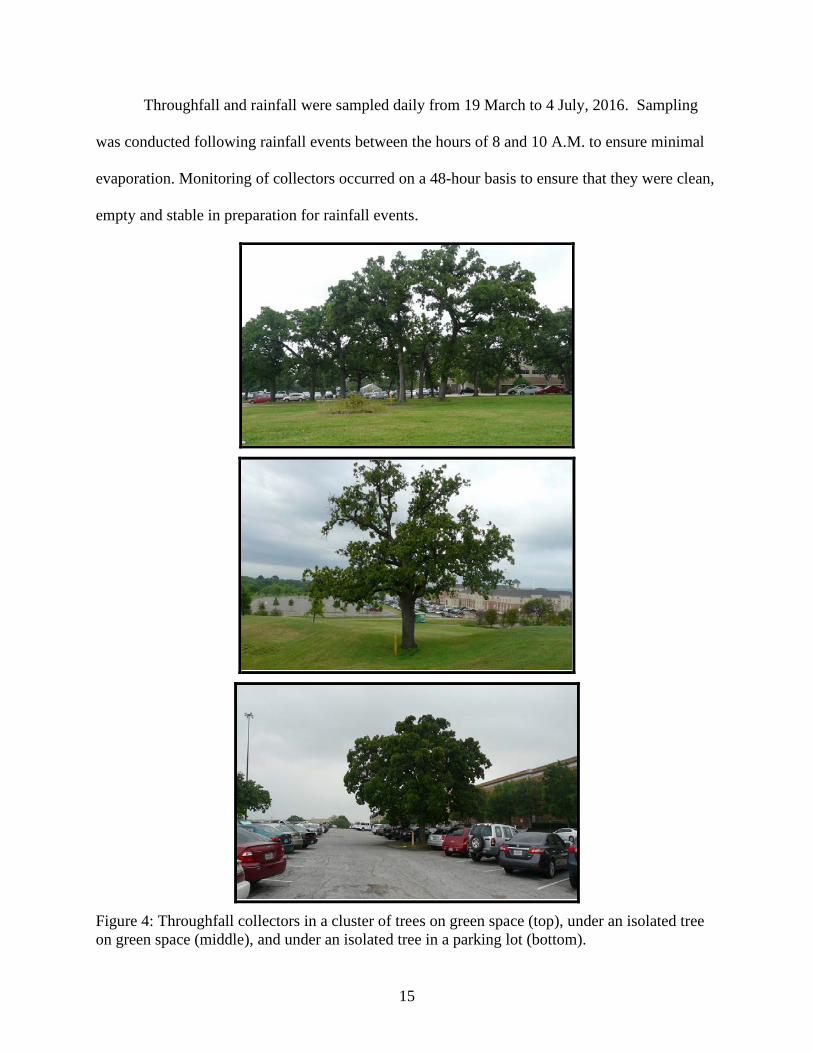
Throughfall and rainfall were sampled daily from 19 March to 4 July, 2016. Sampling
was conducted following rainfall events between the hours of 8 and 10 A.M. to ensure minimal
evaporation. Monitoring of collectors occurred on a 48-hour basis to ensure that they were clean,
empty and stable in preparation for rainfall events.
Figure 4: Throughfall collectors in a cluster of trees on green space (top), under an isolated tree on green space (middle), and under an isolated tree in a parking lot (bottom).
16
Rainfall interception (I) was calculated per tree and for each storm event using the
formula:
I = PG – TF
where I is interception, PG is gross precipitation, and TF is throughfall volume in mm (Levia &
Frost 2006). Absolute interception for the entire study period was calculated on a per tree basis
by summing rainfall and throughfall over all events and computing the difference and then
expressed as a percentage by dividing by total rainfall and multiplying by 100. Mean throughfall
and rainfall amount was calculated per treatment and differences among treatments examined
using the Kruskal-Wallis test.
The influence of different storm sizes on interception rate was evaluated. As part of its
analysis of annual normals, means, and extremes, the National Weather Service categorizes
rainfall days for the Dallas/Fort Worth area into four categories: ≤ 2.5 mm, ≥ 2.5 mm, ≥ 12.7
mm, and ≥ 25 mm. Hereafter, these categories are referred to as ‘trace’, ‘light’, ‘medium’, and
‘heavy’ rainfall days, respectively. Rainfall events were categorized into one of these four
groups and mean interception rate was calculated for each storm size category.
Vegetation Parameters
Following the collection of rainfall and throughfall data, the following measurements
were taken for all trees: height, diameter at breast height, crown projection area, live crown ratio
and canopy openness. All measurements were taken with consideration of the FIA field methods
guide (U.S. Forest Service 1999).
For each tree, diameter at breast height (DBH, 1.3 m aboveground) was measured with a
DBH tape. Crown projection area was determined by measuring the crown radius in eight
17
intercardinal directions, and using the resulting average crown radius in the formula 𝜋𝜋𝑟𝑟2 to
estimate area. Height and live crown ratio, the % of the tree’s height occupied by live foliage,
(FIA Field methods, U.S. Forest Service), were measured using a LaserPulse range finder.
Canopy cover was measured using a spherical densiometer, which calculates the percentage of
the canopy classified as branches/foliage. Percent canopy cover was then subtracted from 100 to
obtain percent canopy openness. Correlation analysis was conducted to determine the effect of
vegetation parameters on absolute and proportional rainfall interception rates.
Results
Rainfall Amount and Intensity
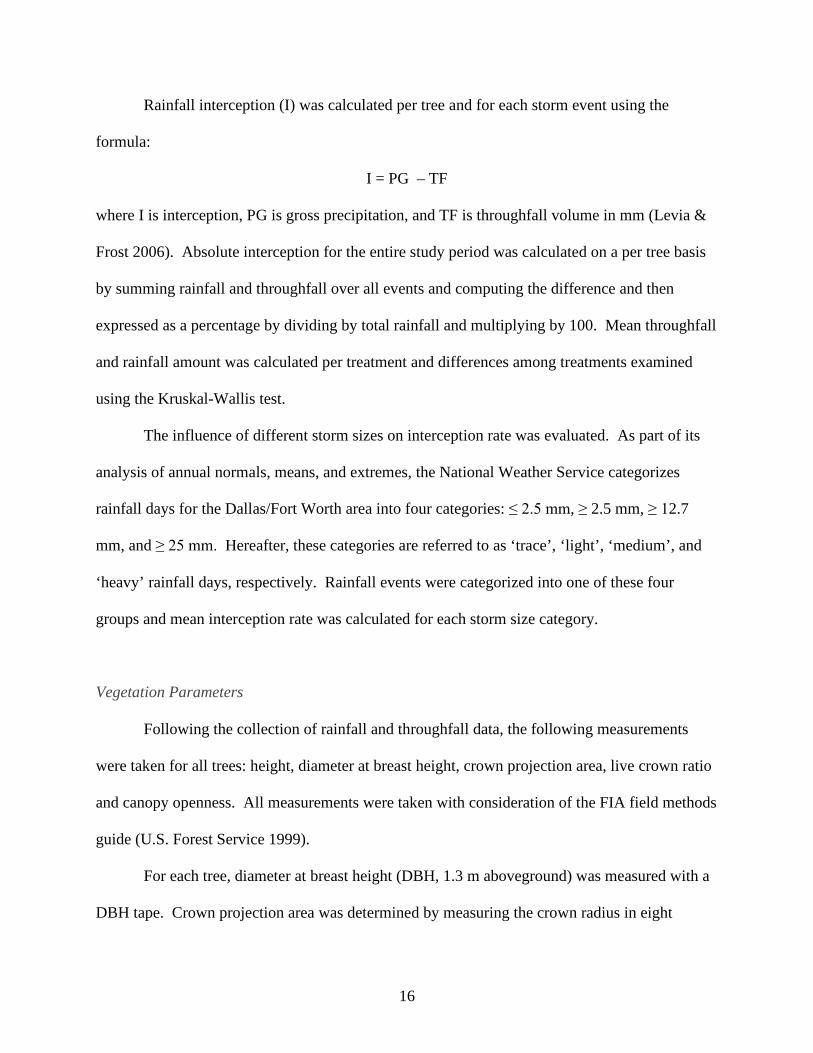
Rainfall varied little among the six sampling locations within the study area (Fig. 5).
Rainfall measured during the study period from 19 March to 4 July 2016 totaled 504 mm ± 2.8
(1SE). Compared to 30-year (1981-2010) monthly normals for Denton Municipal Airport
(National Climate Data Center 2011), April, May and June 2016 received rainfall amounts that
were 117% (72 mm), 26% (33 mm) and 72% (65 mm) higher, respectively. This study was
conducted during a second consecutive year with above average rainfall in Denton since 2015.
Figure 5: Rainfall (mm) measured at six sampling locations from 19 March – 4 July, 2016 within the study area in the City of Denton, Texas.
Rainfall (mm)
Sampling Location
18
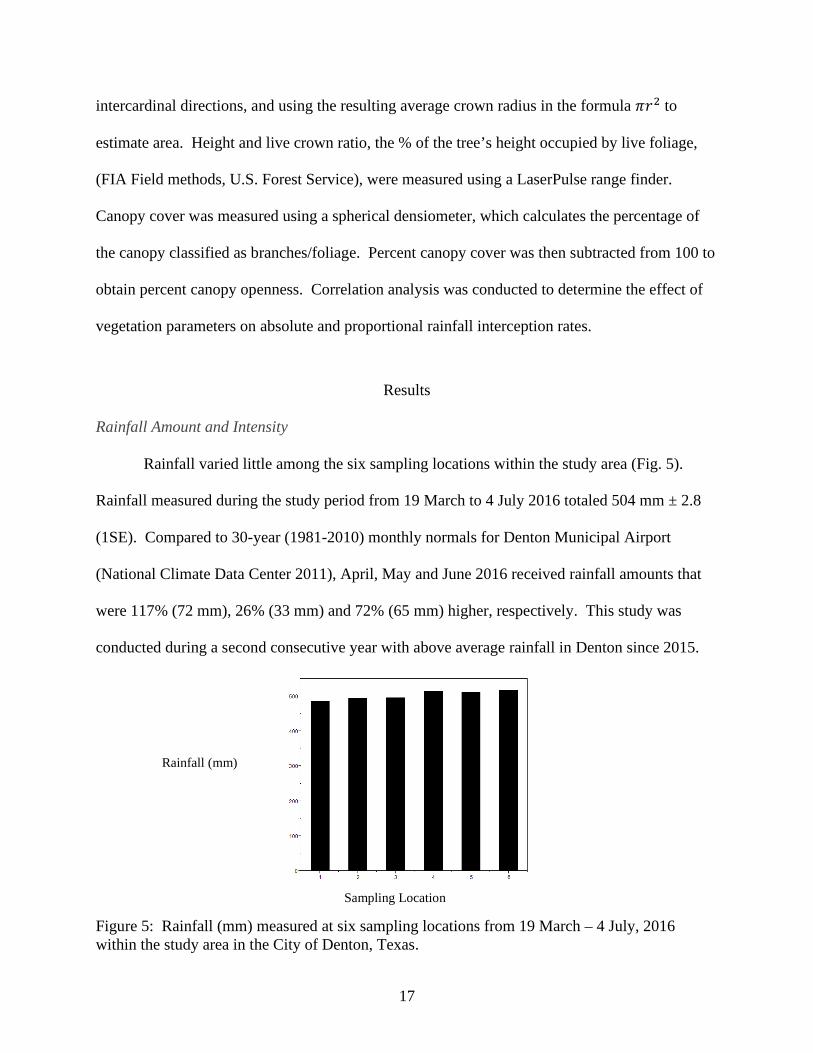
Figure 6: Daily rainfall (mm) measured from 19 March 2016 to 4 July 2016 in the City of Denton, Texas.
From 19 March to 4 July 2016, there were 27 days with measurable rainfall. Daily
rainfall ranged from a minimum of 1 mm to a maximum of 51 mm (Fig. 6), and averaged 18.7
mm ± 2.8 (SE). Although the study area experienced a similar number of rainfall days as the 30-
year normal for Dallas/Fort Worth (Table 1), there was a marked difference in rainfall intensity.
Compared to 1981-2010 Dallas/Fort Worth rainfall averages for April, May, and June, heavy
rainfall days from April to June 2016 in Denton, Texas, were more frequent while light rainfall
days were less frequent (Table 1). Of 23 rainfall days recorded, nine (39%) were heavy, whereas
an average of 3.8 (16%) rainfall days in Dallas/Fort Worth were heavy between 1981-2010.
Light events in the study area comprised 39% of observed events, a decrease from the average of
69%, while no trace events occurred during these three months.
Rainfall (mm)
19
Table 1: Daily rainfall intensity categories, rainfall amount per category (mm) and number (and percentage) of rainfall days from April to June, 2016, in the City of Denton Texas. The 30-year normal (1981-2010) of the number (and percentage) of rainfall days in DFW are shown for comparison (National Climate Data Center 2011).
Rainfall Intensity Rainfall (mm) No. of Events 30-Year Normal Trace (0-2.5 mm) 0 0 (0%) 5 (17%) Light (2.5-12.7 mm) 63 5 (22%) 16 (55%) Medium (12.8-25 mm) 85 9 (39%) 4 (14%) Heavy (>25 mm)
326 9 (39%) 4 (14%)
Total 475 23 29 (100%)
Rainfall Interception
Across all trees and over the entire study period, 16% of incoming rainfall was
intercepted by tree canopies. Percent interception for individual tree canopies ranged widely,
from as much as 49% to as little as -6%. Significant differences in rainfall interception were
detected among the treatments (Table 2; Figure 7). Trees in clusters on green space had the
highest interception, isolated trees in parking lots had the lowest interception, and isolated trees
on green space were intermediate between the two (Figure 7, p < 0.05). In addition to having the
lowest interception rate of the treatments, isolated trees on pavement also showed the highest
degree of variability (± 4.9 SE).
Table 2: Rainfall (mm), throughfall (mm ± 1SE) and interception (% ± 1SE) for each of the three treatments: trees in clusters on green space, isolated trees on green space and isolated trees in parking lots. Data was collected from 19 March – 4 July, 2016 in Denton, Texas.
Treatment Rainfall (mm) Throughfall (mm) Interception (%)
Tree clusters on green space 500.3 386.7 ± 19 22.7 ± 3.8 Isolated trees on green space 480.8 397.9 ± 12 17.3 ± 2.3 Isolate trees in parking lots 462.3 420.3 ± 24 9.1 ± 4.9
20
Figure 7: Mean rainfall interception (% ± 1SE) measured from 19 March to 4 July 2016 in the City of Denton, Texas, for three treatments: trees in clusters on green space (CG), isolated trees on green space (IG) and isolated trees in parking lot trees (IP).
Rainfall interception also varied by rainfall intensity, with percent interception decreasing
as a function of increasing rainfall intensity for all treatments (Table 3).
Table 3: Interception rates (%) by treatment for light, medium and heavy rainfall intensities ± SE. Trace events are not included on account of there being none from April to June, 2016.
Intensity CG IG IP All Trees
Light (2.5-12.7 mm) 35.7 ± 3.7 31.6 ± 2.5 24.2 ± 4.9 30.3 ± 2.3 Medium (12.7-25 mm) 21.4 ± 2.6 15.8 ± 4.5 6.5 ± 5.4 14.3 ± 2.7 Heavy (>25 mm) 20 ± 4.8 13.8 ± 3.2 6.3 ± 5.3 13.1 ± 2.7 Overall, trees intercepted 30.3% during light events (2.5-12.7 mm), 14.3% during medium events
(12.7-25 mm) and 13.1% of rainfall during heavy events (>25 mm). Interception rates exhibited
the most variation among treatments during medium and heavy events, with lesser variation
during light events. For heavy events, interception rates per treatment were 20% ± 4.8 (CG),
13.8% ± 3.2 (IG) and 6.3% ± 5.3 (IP). Rates for medium events were 21.4% ± 2.6 (CG), 15.8%
± 4.5 (IG), and 6.5% ± 5.4 (IP), and rates for light events were 35.7% ± 3.7 (CG), 31.6% ± 2.5
21
(IG), and 24.2% ± 4.9 (IP). Isolated parking lot trees exhibited the most variation in interception
for all three rainfall intensity categories.
Vegetation Parameters
On average, mean tree height was 12.6 m ± 1.4 for trees in clusters on green space, 9.5 m
± 1.6 for isolated trees on greenspace and 11.3 ± 1.7 for isolated trees in parking lots. Isolated
trees on green space were somewhat smaller than trees in parking lots (11.3 m) and in clusters
(12.6 m) despite similar diameters at breast height (9.5 m ± 1.58). Mean diameter at breast
height of 60 cm ranged 58 – 63 cm for the treatments, with isolated trees on greenspace showing
the most variability (± 47). Live crown ratio was similar among treatments: measurements were
67% ± 11.9, 71% ± 6.5 and 76% ± 6.9 for clusters on green space, isolated trees on greenspace
and parking lot trees, respectively. There was a high degree of variability in crown projection
area and canopy openness within treatments. Crown projection area (m2) was 87 ± 43 (CG), 67
± 20 (IG), and 105 ± 32 (IP). Canopy openness was highest for isolated trees in parking lots
(20%), followed by isolated trees on green space (18%) and lowest for clusters of trees on green
space (12%). Of the five vegetation parameters, only canopy openness was found to have a
notable correlation with interception rates (correlation coefficient = -4.5, p = .05).
Microclimate Data
Mean maximum temperature (degrees Celsius) for the rainfall and throughfall collectors
ranged from 32.2-37.6 dgrees (Table 4). Data loggers mounted to collectors in parking lots
(MCRF1 & NCTF1) recorded the highest maximum temperatures on average. Of these two
loggers, MCRF1 logged slightly higher temperatures, presumably the result of more sun
22
exposure. Loggers placed on the rainfall collectors (which were placed on unpaved greenspace
only) recorded maximum temperatures higher than loggers placed on throughfall collectors.
Maximum daily temperatures varied more amongst the collector locations than minimum and
mean daily temperatures, and temperatures recorded by individual loggers showed the most
variability in maximum temperature as well. Average minimum daily temperatures were the
most uniform amongst all loggers, with the highest recorded at NCTF1 (IP). Mean daily
temperatures (ranging from 26.7 – 29.1) were found to be highest for the same two collectors
where highest maximum temperatures were recorded (MCRF1 & NCTF1).
Table 4: Daily maximum, minimum and mean temperatures (degrees Celsius) recorded at eight rainfall/throughfall collectors from 13 May – 15 October, 2016 (± SE). The highest maximum, minimum and mean temperatures (all daily averages) were recorded at collectors placed in parking lots. Throughfall collector treatment is labeled as CG (clusters + greenspace), IG (isolated + greenspace) and IP (isolated + pavement). * = collectors placed on greenspace, # = collectors placed in paved areas.
Collector ID
Max Temperature
(degrees Celsius)
Min Temperature (degrees Celsius)
Mean Temperature
(degrees Celsius)
Diurnal Temperature Range (Max-
Min) CHRF2* 34.8 ± 0.39 22.7 ± 0.33 27.9 ± 0.35 12.1 CHTF6 (CG)* 33.0 ± 0.34 22.1 ± 0.31 26.7 ± 0.32 10.9
GCRF1* 35.0 ± 0.35 22.0 ± 0.32 27.7 ± 0.32 13 GCTF10 (IG)* 32.2 ± 0.37 22.3 ± 0.32 27.3 ± 0.33 9.9
HPRF1* 36.9 ± 0.42 21.1 ± 0.32 27.3 ± 0.33 15.8 HPTF1 (CG)* 32.6 ± 0.36 22.2 ± 0.32 27.1 ± 0.32 10.4
MCRF1# 37.6 ± 0.47 22.2 ± 0.32 28.3 ± 0.35 15.4
NCTF1 (IP)# 37.1 ± 0.43 22.9 ± 0.34 29.1 ± 0.36 14.2
23
Discussion
Significant Rainfall Interception by Urban Trees Under Heavy Downpours
When comparing measurements during the sampling period to 30-year averages (1981-
2010), rainfall amounts were greater than average over the 19 March - 4 July timespan.
Typically, rainfall amounts during the month of May tend to be substantially greater than in
April and June, a pattern also observed during years where rainfall patterns in the region are
influenced heavily by the El Niño Southern Oscillation (ENSO). May 2015 was affected by
ENSO and a prime example when over 380 mm of rainfall were recorded at Denton Municipal
Airport. Despite 2016 not being an ENSO year, rainfall amounts were nonetheless elevated to
levels commonly seen when the local climate is under its influence. While total rainfall was still
highest in May and was still above average, April and June saw more drastic increases in rainfall
(117% and 72%, respectively), the result of a higher frequency of heavy rainfall events. This
increase in the length and intensity of the spring wet season could be a preview of a “new
normal” for the entire Southern Plains region, a probable consequence of the intensifying
hydrologic cycle (Katz et al. 2002; Kunkel et al. 2013).
In humid subtropical climates, precipitation in the form of heavy downpours tends to
reduce the impact of canopy cover and other vegetation on the local hydrologic cycle (Ponette-
González et al. 2010, 2014). Nonetheless, this study showed significant interception loss, 16%
on average, during months known for severe weather. As might be expected, interception
decreased with increasing rainfall intensity. Results showed a ~50% decrease in interception rate
when rainfall events exceeded 13 mm. However, the fact that interception was still ~15% of
incoming rainfall even under the most extreme conditions indicates that urban tree canopies can
24
contribute to a considerable reduction in water flux to soil and thus impact associated infiltration
and erosional processes.
Parking Lot Trees Experience Warmer Temperatures but not Higher Interception Losses in an Urban Area
Microenvironment had an unexpected influence on interception rates throughout the
study period. Due to increased air circulation, a warmer microenvironment, and hence greater
evaporation, parking lot trees were predicted to have the highest interception losses of the three
treatments. This would be consistent with findings from other studies conducted in urban
environments. For example, one study conducted in Vancouver, British Columbia, found
exceptionally high interception values (e.g., as much as 83%; Asadian & Weiler 2009) that may
be toward the high end of the range of what is possible due to the greater surface area of
coniferous tree canopies and frequent but mild rainfall events (Xiao et al. 1998). They suggested
that warmer urban microclimates and increased air circulation contributed to abnormally high
interception rates. In this study, the mean interception rate of 9% for the most “urban” of the
three treatments (i.e., parking lot trees), compared to 17% and 23% for isolated and clusters of
trees on greenspace, calls into question the notion that urban trees can intercept unusually large
amounts of rainfall not observed in undisturbed areas. While both maximum and minimum
temperatures were higher under parking lot trees, interception was lowest not highest. Thus, it
appears that other variables have a stronger influence on interception rate than wind and heat.
This is not to say that warmer temperatures did not have any effect on the results of this study,
merely that, when crown condition is inconsistent, it may make temperature irrelevant. It may
have been beneficial to collect finer resolution temperature data so that temperatures during and
after rainfall events could be considered.
25
In addition to meteorological conditions, urban microenvironments may affect certain
vegetation parameters that impact rainfall interception. The extreme surface conditions
experienced by some urban tree stands (e.g., pavement, xeric landscaping) can affect tree health
by exposing trees to pronounced temperature changes, reducing soil infiltration, hampering root
growth and limiting additions of organic material (Adams et al. 2009, Voelker et al. 2003).
Crown conditions, specifically crown density, may be reduced as a result. Many of the selected
parking lot trees have been in such an environment for decades and may finally be showing these
signs of stress brought on by atypical urban environments. Mean canopy openness for the
parking lot trees was 20% and was the highest and the most variable of the three treatments,
which was mirrored by high variability in interception rates.
While open crown conditions may have contributed to low interception rates for the
parking lot trees, wind-driven rain may also play a role in affecting interception. Collectors
placed beneath isolated tree canopies can be exposed to direct rainfall when precipitation
approaches the surface at angle, bypassing the canopy. This in effect leads to under-sampling of
rainfall, which interferes with the ratio of throughfall to gross precipitation. In contrast,
collectors placed beneath tree clusters with greater surface area are likely to intercept more of
this wind-driven rain, which could explain the high interception rates by individuals in tree
clusters. In other words, the sheltering effect of clustered canopies is more important than
increased evaporation in determining interception loss by urban trees. Specific drip points,
scattered across all tree canopies to some extent, may have played a role in the negative
interception rates measured for some trees. These drip points increase in severity as rainfall
intensity increases and may help explain some of the more eccentric interception rates for
individual storms throughout the study period.
26
Conclusion
This study assessed rainfall interception rates for urban trees in a variety of urban
microenvironments and found an average interception rate of 16% for all trees, with notable
differences between treatments. We found that, even under intense rainfall conditions where
over 25 mm were recorded, interception rates were 13.1% on average for all trees. Given the
differences in canopy structure and density, we hypothesize that urban environments can produce
conditions that reduce interception rates, a contrast from previous studies.
When evaluating the benefits of trees as a component of green infrastructure, some argue
that it is imperative to focus on species that will thrive in the native soil and local climate. This
allows them to reach their maximum potential lifespan there, as opposed to non-native species
with shorter lifespans that tend to be established in recently urbanized areas (Nowak and Dwyer
2007). The oak species selected for this study meet this criteria. However, the development of
the tree’s immediate surroundings may have long term negative effects on tree health and should
be minimized if preserving urban trees stands is a priority.
27
CHAPTER 3
CONCLUSIONS
This research examined rainfall interception rates for Quercus stellata and Quercus
marilandica individuals in the City of Denton, Texas, and found measurable differences in both
the rate and the variability of interception among trees located in disparate urban
microenvironments. Conducting studies on canopy interception in an urban context is important
considering the indefinite expansion of many urban centers and associated land use changes.
The numerous changes watersheds undergo during urbanization suggest that these environments
each have a unique character and must be studied individually in regard to the local hydrologic
cycle. This study contributes to several areas of research within geography, including
climatology, hydrology, ecosystem services and urban forestry. A multitude of researchers
studying urban trees and their associated services highlight the ability of trees to restore some
degree of normalcy to urbanized watersheds (Xiao and McPherson 1998, Wang et al. 2008,
Nowak 2007, Asadian and Weiler 2009, Armson et al. 2013). This study builds upon previous
research and improves understanding of interception patterns in urban ecosystems.
Climate Change Impacts on the Hydrologic Cycle
This study contributes to climatological research by measuring rainfall and interception
in a humid subtropical climate (Cfa), which produces conditions not often present in these types
of studies (Inkiläinen et al. 2013). Climatology, the study of meteorological conditions occurring
over a period of time can be utilized to understand dynamic global weather patterns and to
develop projections of future climate. The climate in which rainfall interception studies are
conducted is a main point of interest for researchers, and is often credited in part with producing
28
interception rates unique to a specific location (Asadian and Weiler 2009, Link et al. 2004, Xiao
et al. 2000, Ponette-González et al. 2010).
One objective of this study was to measure rainfall and interception in a region that
experiences high rainfall intensities, conditions that contrast sharply with those measured in
oceanic climates (Asadian and Weiler 2009, Link et al. 2004, Pypker et al. 2006). The rainfall
data that was collected paints a clear picture of the heavy rainfall expected in the southern plains
region of the U.S. during the spring months. Furthermore, the chosen sampling period happened
to be an opportunity to measure rainfall totals well above 30-year averages (NCDC 2010) for
Denton County. In the wake of the strong 2015 ENSO event that led to flooding in the Denton
area, 2016 could have easily produced “normal” rainfall totals. We were fortunate to measure
and document precipitation patterns more typical of years when ENSO is a major influence.
This is a concrete example of the higher rainfall totals that are expected in this region in coming
decades (NCDC), which may be symptomatic of an accelerating hydrologic cycle (Oki and
Kanae 2006, Huntington 2006, Held and Soden 2000, Loaiciga et al. 1996). One modeling study
suggested that for every increase of one degree Kelvin in global average temperature,
precipitation would increase 3.4% (Allen and Ingram 2002). The opportunity to sample during
what are presumed to be future conditions will add significance to these findings.
Urban Hydrology
This study contributes to urban hydrology by providing rainfall interception data for an
urbanized watershed that experiences quick flood pulses and lacks information on the impact of
local canopy cover on overland flow. Hydrology is the study of the occurrence and movement of
water on and beneath the earth’s surface, its properties and its relationships with living and
29
nonliving materials in the environment (Hornberger et al. 2014). Key areas of interest within
urban hydrology are the effect of trees and other vegetation on the urban water balance, channel
morphology and overall relationships between watershed conditions and stream conditions
(Wang et al. 2008, Armson et al. 2013, Paul and Meyer 2001, Booth et al. 2002, Rose and Peters
2001). There is consensus in the literature that reductions in canopy cover coupled with
impervious surfaces routes overland flow directly to streams. Given that these two landscape
changes both exacerbate the same issue for urban catchments, many researchers have designed
studies that measure canopy interception in the environments where it is needed most.
The experimental plots used by Armson et al. (2013) were designed as replicas of parking
lot - landscape combinations commonly installed in the Manchester, UK area. The findings of
this study suggest that, in addition to reducing runoff through rainfall interception, the mere
presence of tree pits in the paved area contributed to runoff reductions of 170% in summer and
145% in winter, relative to canopy crown area. Studies conducted in Raleigh, North Carolina,
(Inkiläinen et al. 2013) and Sacramento, California (Xiao et al. 1998), incorporated
suburban/residential tree environments and found notable interception rates, also noting that
interception rates decline sharply with higher rainfall intensities, findings this study corroborates.
Also noted in these studies and by Asadian and Weiler (2009) are the higher interception rates
produced by coniferous trees. If we utilize urban trees as a way to normalize proportions of
runoff and infiltration, factors such as meteorological conditions, tree type and health determine
their performance. This research, while it only utilized two similar tree species, supports the
notion that meteorological conditions and tree health are significant controls on interception.
30
Ecosystem Services
This research contributes to the relatively broad subject of ecosystem services by
approaching urban trees as part of a larger network of green infrastructure components.
Ecosystem services in an urban context can be defined as the benefits human populations derive,
directly or indirectly, from ecosystem functions (Costanza et al. 1997). This approach involves
improving urban sustainability by using these services to remediate environmental issues, among
them the pollution and erosion associated with urban runoff. All ecosystem services are the
result of measurable biogeochemical processes, many of which are replicated with the
installation of urban forests, parks and greenspace in general (Pataki 2011). There is substantial
literature involving the evaluation of the benefits of urban greenery, otherwise known as “green
infrastructure” (Tratalos et al. 2007, Gómez-Baggethun et al. 2013, Escobedo et al. 2011, Chen
and Jim 2008, Tzoulas et al. 2007). However, there is consensus that more empirical data is
needed on the effectiveness of individual green infrastructure components (Nowak et al. 2001,
Nowak et al. 2002, Tyrväinen et al. 2005, Xiao et al. 1998).
This study makes a unique contribution to this small but growing body of literature on
measurements of rainfall interception in urban areas, where data can be readily applied to urban
greening initiatives and infrastructure improvements. Studies like this are needed to properly
assess the environmental benefits of urban greenery in all contexts, from preserved old-growth
forest to recently installed street trees. Once removed, the environmental capital from green
spaces is difficult to replace, and must be a priority for planners as well as citizens themselves.
With accurate information on the interception potential for native tree species, cities can hope to
address the effects of climate change on location.
31
Urban Forestry
Within the study of ecosystem services, urban forestry, known also as arboriculture,
involves the management of trees and associated resources in urbanized areas (Nowak et al.
2002). Increasing perceived value of trees coupled with threats to tree growth and survival have
fueled significant advances in this field, among them improvements in tree selection, growth,
planting, maintenance and preservation (Nowak et al. 2002).
The results of this study highlight how urban growing conditions can have implications
for the health and longevity of native species, and how their associated ecosystem services can
be inhibited by less than optimal conditions. Other researchers have documented the adverse
effects that urban surroundings can have on trees, among them extreme temperatures (Bassuk
and Whitlow 1987) and reduced soil moisture availability (Cregg and Dix 2001). The
comparative lack of foliage measured on the parking lot trees in this study suggests that this
immediate environment may not be ideal for Quercus stellata and Quercus marilandica. The
daytime high temperatures measured in parking lots in close proximity to trees may be partially
to blame for the lower canopy densities. Also, the presence of impervious surfaces, an
underlying influence on many processes discussed in this paper, limits infiltration to the area
directly under the trees, reducing the total amount available for uptake. This issue of soil
moisture under paved surfaces may be particularly problematic in Denton, where such a large
percentage of rainfall occurs during heavy events, conditions that already encourage high runoff
volumes and delay infiltration and soil saturation.
Policy Recommendations
In light of these finding which suggest that paved environments adversely affect canopy
32
condition, and thus limit interception rates, the following approaches are recommended for the
city of Denton:
• Efforts to increase urban canopy cover should focus on installing trees in clusters of
three or more to maximize interception rates
• Increase continuity of urban forest patches, where high tree density creates optimal
conditions for high interception rates
• Installation of parking lot trees should be limited to species that are unaffected by the
higher temperatures and lower soil moisture
• Development around mature trees should be accompanied by companion trees to
reduce the impact on interception rates and improve growing conditions
Summary
In summary, the species used in this study are native to the Eastern Cross Timbers forest
and would be ideal options if forest remediation efforts are undertaken in the Denton area.
Knowledge of the effectiveness of urban trees as stormwater mitigators will hopefully increase
interest in urban forest renewal. This study showed high spatial and temporal variability in
interception rates, which was to be expected, and more research is needed to understand every
aspect of this hydrological process. This study and others like it will be crucial as urban societies
attempt to curb environmental degradation by restoring ecosystem processes.

33
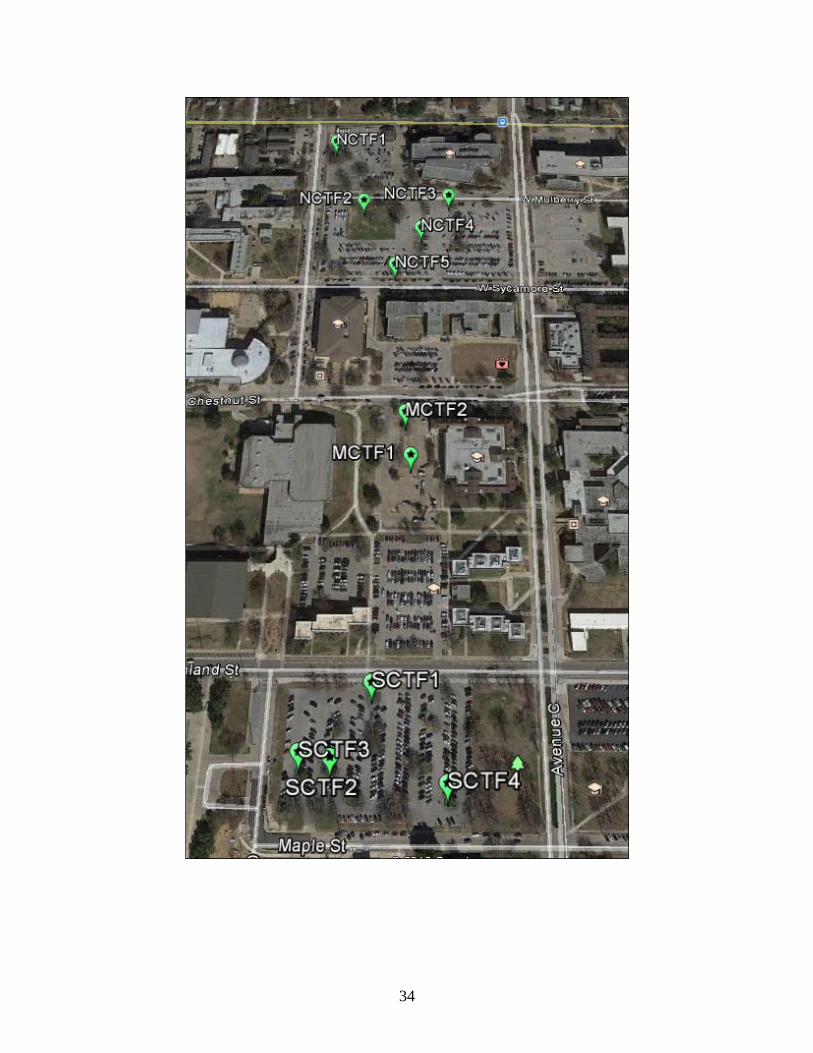
APPENDIX A
TREE LOCATIONS FOR NORTH CAMPUS (NC), MID-CAMPUS (MC), AND SOUTH
CAMPUS (SC) SAMPLING AREAS
34
35
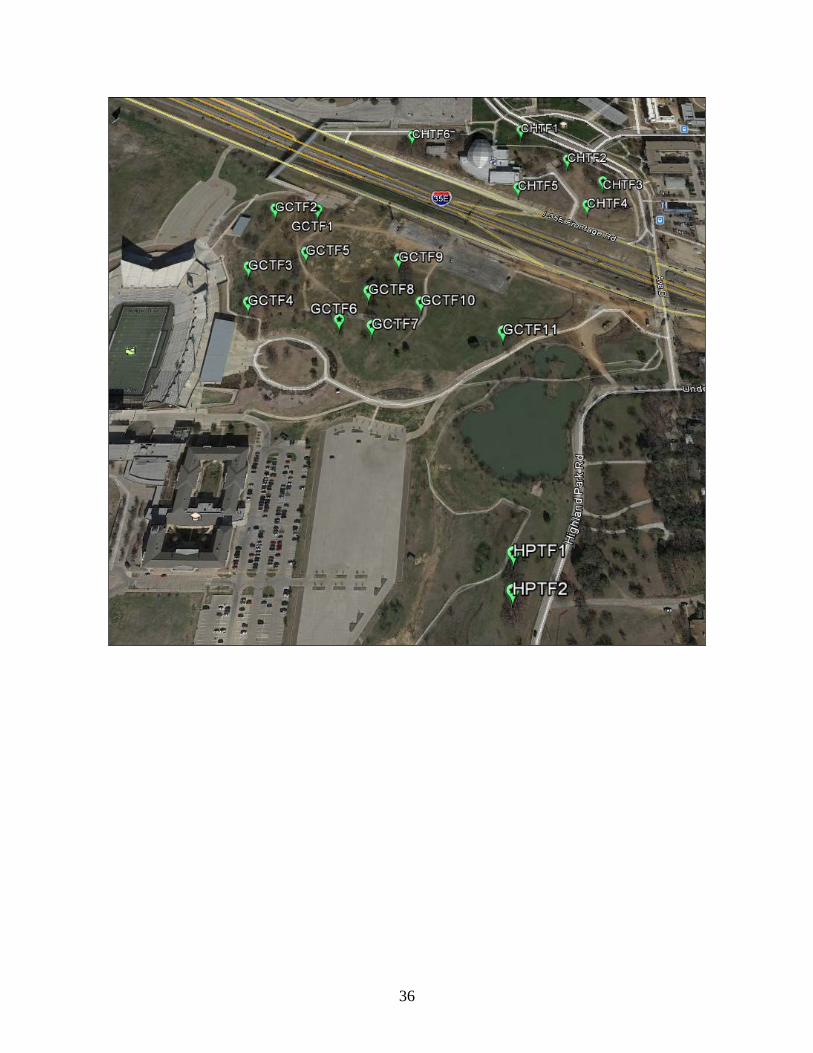
APPENDIX B
TREE LOCATIONS FOR CONCERT HALL (CH), GOLF COURSE (GC) AND HIGHLAND
PARK (HP) SAMPLING AREAS
36

37
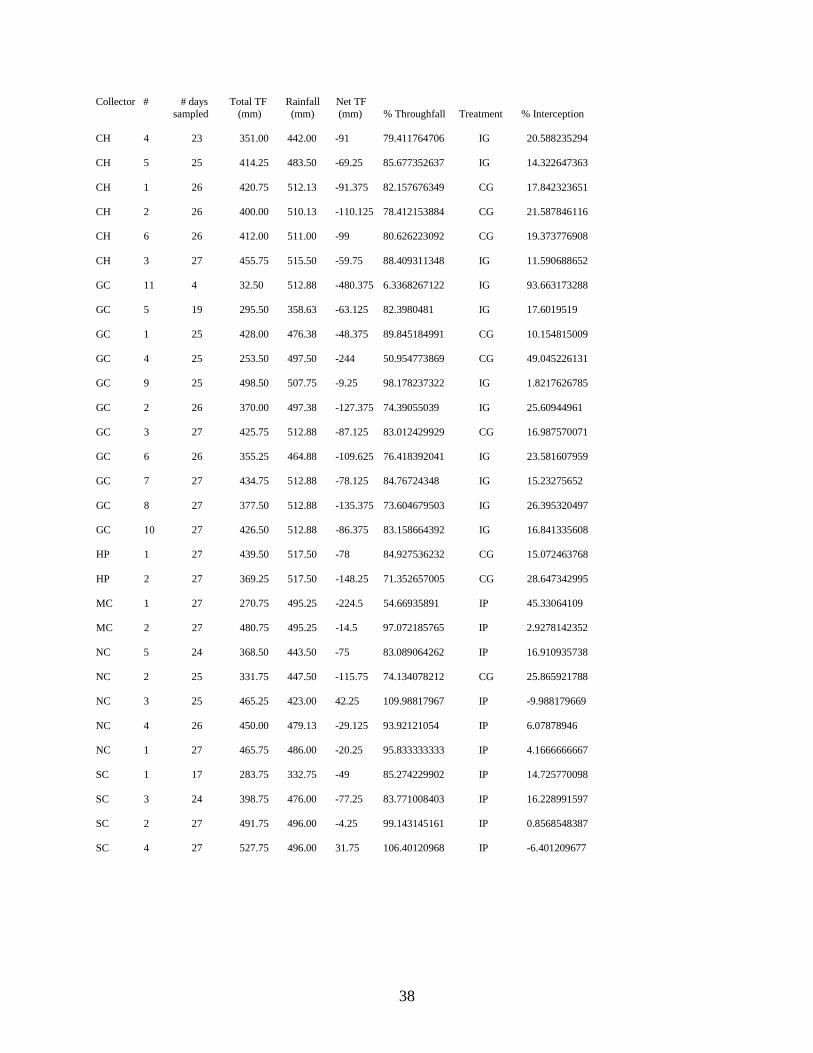
APPENDIX C
RAINFALL AND INTERCEPTION DATASET
38
Collector # # days Total TF Rainfall Net TF sampled (mm) (mm) (mm) % Throughfall Treatment % Interception
CH 4 23 351.00 442.00 -91 79.411764706 IG 20.588235294
CH 5 25 414.25 483.50 -69.25 85.677352637 IG 14.322647363
CH 1 26 420.75 512.13 -91.375 82.157676349 CG 17.842323651
CH 2 26 400.00 510.13 -110.125 78.412153884 CG 21.587846116
CH 6 26 412.00 511.00 -99 80.626223092 CG 19.373776908
CH 3 27 455.75 515.50 -59.75 88.409311348 IG 11.590688652
GC 11 4 32.50 512.88 -480.375 6.3368267122 IG 93.663173288
GC 5 19 295.50 358.63 -63.125 82.3980481 IG 17.6019519
GC 1 25 428.00 476.38 -48.375 89.845184991 CG 10.154815009
GC 4 25 253.50 497.50 -244 50.954773869 CG 49.045226131
GC 9 25 498.50 507.75 -9.25 98.178237322 IG 1.8217626785
GC 2 26 370.00 497.38 -127.375 74.39055039 IG 25.60944961
GC 3 27 425.75 512.88 -87.125 83.012429929 CG 16.987570071
GC 6 26 355.25 464.88 -109.625 76.418392041 IG 23.581607959
GC 7 27 434.75 512.88 -78.125 84.76724348 IG 15.23275652
GC 8 27 377.50 512.88 -135.375 73.604679503 IG 26.395320497
GC 10 27 426.50 512.88 -86.375 83.158664392 IG 16.841335608
HP 1 27 439.50 517.50 -78 84.927536232 CG 15.072463768
HP 2 27 369.25 517.50 -148.25 71.352657005 CG 28.647342995
MC 1 27 270.75 495.25 -224.5 54.66935891 IP 45.33064109
MC 2 27 480.75 495.25 -14.5 97.072185765 IP 2.9278142352
NC 5 24 368.50 443.50 -75 83.089064262 IP 16.910935738
NC 2 25 331.75 447.50 -115.75 74.134078212 CG 25.865921788
NC 3 25 465.25 423.00 42.25 109.98817967 IP -9.988179669
NC 4 26 450.00 479.13 -29.125 93.92121054 IP 6.07878946
NC 1 27 465.75 486.00 -20.25 95.833333333 IP 4.1666666667
SC 1 17 283.75 332.75 -49 85.274229902 IP 14.725770098
SC 3 24 398.75 476.00 -77.25 83.771008403 IP 16.228991597
SC 2 27 491.75 496.00 -4.25 99.143145161 IP 0.8568548387
SC 4 27 527.75 496.00 31.75 106.40120968 IP -6.401209677

39
APPENDIX D
VEGETATION PARAMETERS DATASET

40
(* - indicates that data was not collected due to tree removal during sampling or sparse interception data due to collector interference)
Collecto
r
Number Height (m) DBH
(cm)
Live Crown Ratio
(%)
Crown Projection Area (square meters) Canopy Openness
(%)
CH 4 11.5 282 77 90 19
CH 5 9 177 80 83 26.6
CH 1 12.1 206 73 138 3.6
CH 2 11.7 179 72 119 7
CH 6 12.6 159 41 65 6
CH 3 11.3 156 79 84 6.8
GC 11 * * * * *
GC 5 9.9 168 62 41 31.7
GC 1 10.8 175 71 73 17
GC 4 11.9 169 67 61 10.9
GC 9 8.2 138 65 31 11.7
GC 2 7.3 148 64 58 9.9
GC 3 11.2 180 75 53 22.6
GC 6 8.3 195 68 58 20.8
GC 7 10.2 236 76 86 21.6
GC 8 7.9 165 70 71 16.9
GC 10 11.5 242 69 71 11.1
HP 1 14.4 207 68 168 8.8
HP 2 14.4 193 82 53 13
MC 1 9.5 177 73 80 7.3
MC 2 11.9 235 80 95 27.8
NC 5 11.3 198 77 110 7
NC 2 14.3 168 57 55 17.2
NC 3 14.3 215 86 109 30.8
NC 4 12.1 213 72 126 32
NC 1 12.5 235 80 167 9.4
SC 1 12 145 64 47 15.3
SC 3 9.6 181 68 110 13.3
SC 2 8.9 173 81 104 35
SC 4 * * * * *

41
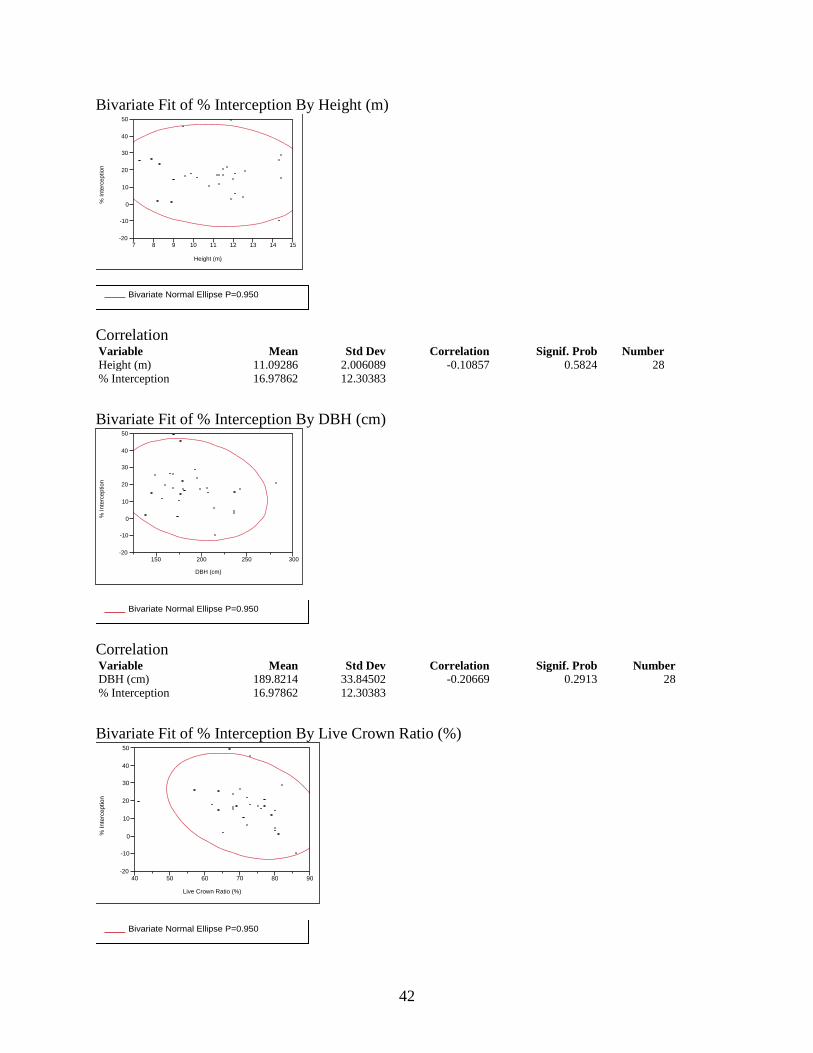
APPENDIX E
CORRELATIONS OF % INTERCEPTION BY HEIGHT, DBH, LIVE CROWN RATIO,
CROWN PROJECTION AREA AND CANOPY OPENNESS
42
Bivariate Fit of % Interception By Height (m)
Correlation Variable Mean Std Dev Correlation Signif. Prob Number Height (m) 11.09286 2.006089 -0.10857 0.5824 28 % Interception 16.97862 12.30383
Bivariate Fit of % Interception By DBH (cm)
Correlation Variable Mean Std Dev Correlation Signif. Prob Number DBH (cm) 189.8214 33.84502 -0.20669 0.2913 28 % Interception 16.97862 12.30383
Bivariate Fit of % Interception By Live Crown Ratio (%)
-20
-10
0
10
20
30
40
50
% In
terc
eptio
n
7 8 9 10 11 12 13 14 15
Height (m)
Bivariate Normal Ellipse P=0.950
-20
-10
0
10
20
30
40
50
% In
terc
eptio
n
150 200 250 300
DBH (cm)
Bivariate Normal Ellipse P=0.950
-20
-10
0
10
20
30
40
50
% In
terc
eptio
n
40 50 60 70 80 90
Live Crown Ratio (%)
Bivariate Normal Ellipse P=0.950
43
Correlation Variable Mean Std Dev Correlation Signif. Prob Number Live Crown Ratio (%) 71.32143 9.092339 -0.32653 0.0899 28 % Interception 16.97862 12.30383
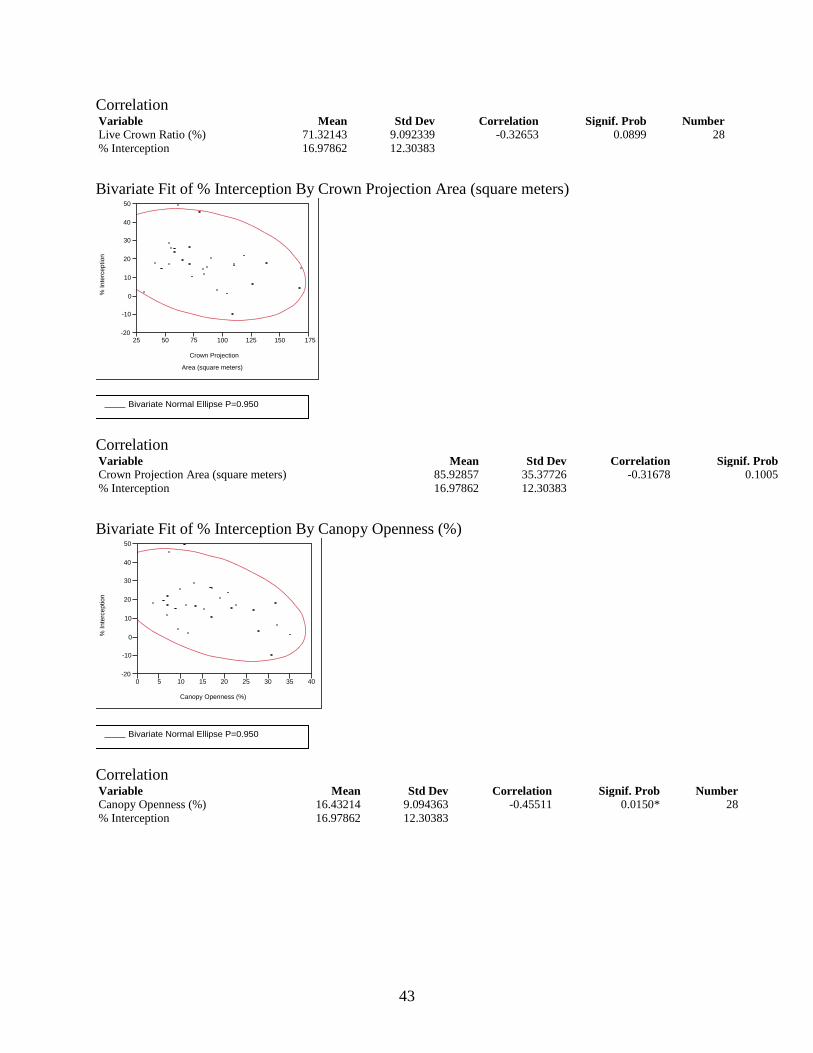
Bivariate Fit of % Interception By Crown Projection Area (square meters)
Correlation Variable Mean Std Dev Correlation Signif. Prob N Crown Projection Area (square meters) 85.92857 35.37726 -0.31678 0.1005 % Interception 16.97862 12.30383
Bivariate Fit of % Interception By Canopy Openness (%)
Correlation Variable Mean Std Dev Correlation Signif. Prob Number Canopy Openness (%) 16.43214 9.094363 -0.45511 0.0150* 28 % Interception 16.97862 12.30383
-20
-10
0
10
20
30
40
50
% In
terc
eptio
n
25 50 75 100 125 150 175
Crown Projection
Area (square meters)
Bivariate Normal Ellipse P=0.950
-20
-10
0
10
20
30
40
50
% In
terc
eptio
n
0 5 10 15 20 25 30 35 40
Canopy Openness (%)
Bivariate Normal Ellipse P=0.950
44
REFERENCES
Adams, H. D., Guardiola-Claramonte, M., Barron-Gafford, G. A., Villegas, J. C., Breshears, D. D., Zou, C. B., et al. (2009). Temperature sensitivity of drought-induced tree mortality portends increased regional die-off under global-change-type drought. Proceedings of the National Academy of Sciences of the United States of America, 106(17), 7063-7066. doi:10.1073/pnas.0901438106 [doi]
Akbari, H. (2002). Shade trees reduce building energy use and CO 2 emissions from power plants. Environmental Pollution, 116, S119-S126.
Allen, J. C. (1985). Soil response to forest clearing in the united states and the tropics: Geological and biological factors. Biotropica, , 15-27.
Allen, M. R., & Ingram, W. J. (2002). Constraints on future changes in climate and the hydrologic cycle. Nature, 419(6903), 224-232.
Alvey, A. A. (2006). Promoting and preserving biodiversity in the urban forest. Urban Forestry & Urban Greening, 5(4), 195-201.
Armson, D., Stringer, P., & Ennos, A. (2013). The effect of street trees and amenity grass on urban surface water runoff in manchester, UK. Urban Forestry & Urban Greening, 12(3), 282-286.
Arnold Jr, C. L., & Gibbons, C. J. (1996). Impervious surface coverage: The emergence of a key environmental indicator. Journal of the American Planning Association, 62(2), 243-258.
Asadian, Y., & Weiler, M. (2009). A new approach in measuring rainfall interception by urban trees in coastal british columbia. Water Quality Research Journal of Canada, 44(1), 16.
Bartens, J., Day, S. D., Harris, J. R., Dove, J. E., & Wynn, T. M. (2008). Can urban tree roots improve infiltration through compacted subsoils for stormwater management? Journal of Environmental Quality, 37(6), 2048-2057.
Bhark, E. W., & Small, E. E. (2003). Association between plant canopies and the spatial patterns of infiltration in shrubland and grassland of the chihuahuan desert, new mexico. Ecosystems, 6(2), 0185-0196.
Booth, D. B., Hartley, D., & Jackson, R. (2002). Forest cover, impervious‐surface area, and the mitigation of stormwater impacts. JAWRA Journal of the American Water Resources Association, 38(3), 835-845.
Booth, D. B., & Jackson, C. R. (1997). Urbanization of aquatic systems: Degradation thresholds, stormwater detection, and the limits of mitigation. JAWRA Journal of the American Water Resources Association, 33(5), 1077-1090.
45
Brabec, E., Schulte, S., & Richards, P. L. (2002). Impervious surfaces and water quality: A review of current literature and its implications for watershed planning. CPL Bibliography, 16(4), 499-514.
Brooks, K. N., Ffolliott, P. F., & Magner, J. A. (2012). Hydrology and the management of watersheds John Wiley & Sons.
Brun, S., & Band, L. E. (2000). Simulating runoff behavior in an urbanizing watershed. Computers, Environment and Urban Systems, 24(1), 5-22.
Carlson, K. M., Curran, L. M., Ponette‐González, A. G., Ratnasari, D., Lisnawati, N., Purwanto, Y., et al. (2014). Influence of watershed‐climate interactions on stream temperature, sediment yield, and metabolism along a land use intensity gradient in indonesian borneo. Journal of Geophysical Research: Biogeosciences, 119(6), 1110-1128.
Carlson, T. N., & Arthur, S. T. (2000). The impact of land use—land cover changes due to urbanization on surface microclimate and hydrology: A satellite perspective. Global and Planetary Change, 25(1), 49-65.
Carpenter, S. R., Caraco, N. F., Correll, D. L., Howarth, R. W., Sharpley, A. N., & Smith, V. H. (1998). Nonpoint pollution of surface waters with phosphorus and nitrogen. Ecological Applications, 8(3), 559-568.
Chen, W. Y., & Jim, C. (2008). Assessment and valuation of the ecosystem services provided by urban forests. Ecology, planning, and management of urban forests (pp. 53-83) Springer.
Corbett, C. W., Wahl, M., Porter, D. E., Edwards, D., & Moise, C. (1997). Nonpoint source runoff modeling A comparison of a forested watershed and an urban watershed on the south carolina coast. Journal of Experimental Marine Biology and Ecology, 213(1), 133-149.
Costanza, R., d’Arge, R., De Groot, R., Farber, S., Grasso, M., Hannon, B., et al. (2016). The value of the World’s ecosystem services and natural capital (1997). The Globalization and Environment Reader, , 117.
Cregg, B. M., & Dix, M. E. (2001). Tree moisture stress and insect damage in urban areas in relation to heat island effects. Journal of Arboriculture, 27(1), 8-17.
Dearborn, D. C., & Kark, S. (2010). Motivations for conserving urban biodiversity. Conservation Biology, 24(2), 432-440.
Dwyer, J. F., McPherson, E. G., Schroeder, H. W., & Rowntree, R. A. (1992). Assessing the benefits and costs of the urban forest. Journal of Arboriculture, 18, 227-227.
Escobedo, F. J., Kroeger, T., & Wagner, J. E. (2011). Urban forests and pollution mitigation: Analyzing ecosystem services and disservices. Environmental Pollution, 159(8), 2078-2087.
46
Escobedo, F. J., Wagner, J. E., Nowak, D. J., De la Maza, Carmen Luz, Rodriguez, M., & Crane, D. E. (2008). Analyzing the cost effectiveness of santiago, chile's policy of using urban forests to improve air quality. Journal of Environmental Management, 86(1), 148-157.
Feyisa, G. L., Dons, K., & Meilby, H. (2014). Efficiency of parks in mitigating urban heat island effect: An example from addis ababa. Landscape and Urban Planning, 123, 87-95.
Foley, J. A., Defries, R., Asner, G. P., Barford, C., Bonan, G., Carpenter, S. R., et al. (2005). Global consequences of land use. Science (New York, N.Y.), 309(5734), 570-574. doi:309/5734/570 [pii]
Forti, M. C., & Neal, C. (1992). Spatial variability of throughfall chemistry in a tropical rainforest (central amazonia, brazil). Science of the Total Environment, 120(3), 245-259.
Gash, J. (1979). An analytical model of rainfall interception by forests. Quarterly Journal of the Royal Meteorological Society, 105(443), 43-55.
Gill, S. E., Handley, J. F., Ennos, A. R., & Pauleit, S. (2007). Adapting cities for climate change: The role of the green infrastructure. Built Environment, 33(1), 115-133.
Gómez-Baggethun, E., & Barton, D. N. (2013). Classifying and valuing ecosystem services for urban planning. Ecological Economics, 86, 235-245.
Gómez-Baggethun, E., & Barton, D. N. (2013). Classifying and valuing ecosystem services for urban planning. Ecological Economics, 86, 235-245.
Gray, D., & Leiser, A. (1989). Soil erosion and mass-movement. Biotechnical Slope
Griffith, K., Ponette-González, A., Curran, L., & Weathers, K. (2015). Assessing the influence of topography and canopy structure on douglas fir throughfall with LiDAR and empirical data in the santa cruz mountains, USA. Environmental Monitoring and Assessment, 187(5), 270.
Grimmond, C. S. B., & Oke, T. R. (1991). An evapotranspiration‐interception model for urban areas. Water Resources Research, 27(7), 1739-1755.
Hansen, A. J., Knight, R. L., Marzluff, J. M., Powell, S., Brown, K., Gude, P. H., et al. (2005). Effects of exurban development on biodiversity: Patterns, mechanisms, and research needs. Ecological Applications, 15(6), 1893-1905.
Hartanto, H., Prabhu, R., Widayat, A. S., & Asdak, C. (2003). Factors affecting runoff and soil erosion: Plot-level soil loss monitoring for assessing sustainability of forest management. Forest Ecology and Management, 180(1), 361-374.
Held, I. M., & Soden, B. J. (2000). Water vapor feedback and global warming 1. Annual Review of Energy and the Environment, 25(1), 441-475.
Protection and Erosion Control. Krieger Publishing Company, Malabar, Florida.
47
Hewlett, J. D. (1982). Principles of forest hydrology University of Georgia Press.
Hogan, D. M., & Walbridge, M. R. (2007). Best management practices for nutrient and sediment retention in urban stormwater runoff. Journal of Environmental Quality, 36(2), 386-395.
Hornberger, G. M., Wiberg, P. L., Raffensperger, J. P., & D'Odorico, P. (2014). Elements of physical hydrology.
Huntington, T. G. (2006). Evidence for intensification of the global water cycle: Review and synthesis. Journal of Hydrology, 319(1), 83-95.
Huxman, T. E., Wilcox, B. P., Breshears, D. D., Scott, R. L., Snyder, K. A., Small, E. E., et al. (2005). Ecohydrological implications of woody plant encroachment. Ecology, 86(2), 308-319.
Inkiläinen, E. N., McHale, M. R., Blank, G. B., James, A. L., & Nikinmaa, E. (2013). The role of the residential urban forest in regulating throughfall: A case study in raleigh, north carolina, USA. Landscape and Urban Planning, 119, 91-103.
Irwin, E. G. (2002). The effects of open space on residential property values. Land Economics, 78(4), 465-480.
Jha, A. K., Bloch, R., & Lamond, J. (2012). Cities and flooding: A guide to integrated urban flood risk management for the 21st century World Bank Publications.
Jim, C., & Chen, W. Y. (2009). Ecosystem services and valuation of urban forests in china. Cities, 26(4), 187-194.
Jo, H. (2002). Impacts of urban greenspace on offsetting carbon emissions for middle korea. Journal of Environmental Management, 64(2), 115-126.
Katz, R. W., Parlange, M. B., & Naveau, P. (2002). Statistics of extremes in hydrology. Advances in Water Resources, 25(8), 1287-1304.
Kosmas, C., Danalatos, N., Cammeraat, L. H., Chabart, M., Diamantopoulos, J., Farand, R., et al. (1997). The effect of land use on runoff and soil erosion rates under mediterranean conditions. Catena, 29(1), 45-59.
Kowarik, I. (2011). Novel urban ecosystems, biodiversity, and conservation. Environmental Pollution, 159(8), 1974-1983.
Kunkel, K. E., Karl, T. R., Easterling, D. R., Redmond, K., Young, J., Yin, X., et al. (2013). Probable maximum precipitation and climate change. Geophysical Research Letters, 40(7), 1402-1408.
Lee, J. G., & Heaney, J. P. (2003). Estimation of urban imperviousness and its impacts on storm water systems. Journal of Water Resources Planning and Management, 129(5), 419-426.
48
Levia, D. F., & Frost, E. E. (2003). A review and evaluation of stemflow literature in the hydrologic and biogeochemical cycles of forested and agricultural ecosystems. Journal of Hydrology, 274(1), 1-29.
Link, T. E., Unsworth, M., & Marks, D. (2004). The dynamics of rainfall interception by a seasonal temperate rainforest. Agricultural and Forest Meteorology, 124(3), 171-191.
Liu, C., & Li, X. (2012). Carbon storage and sequestration by urban forests in shenyang, china. Urban Forestry & Urban Greening, 11(2), 121-128.
Loaiciga, H. A., Valdes, J. B., Vogel, R., Garvey, J., & Schwarz, H. (1996). Global warming and the hydrologic cycle. Journal of Hydrology, 174(1-2), 83-127.
Luttik, J. (2000). The value of trees, water and open space as reflected by house prices in the netherlands. Landscape and Urban Planning, 48(3), 161-167.
Mansfield, C., Pattanayak, S. K., McDow, W., McDonald, R., & Halpin, P. (2005). Shades of green: Measuring the value of urban forests in the housing market. Journal of Forest Economics, 11(3), 177-199.
McPherson, E. G., Nowak, D., Heisler, G., Grimmond, S., Souch, C., Grant, R., et al. (1997). Quantifying urban forest structure, function, and value: The chicago urban forest climate project. Urban Ecosystems, 1(1), 49-61.
McPherson, G., Simpson, J. R., Peper, P. J., Maco, S. E., & Xiao, Q. (2005). Municipal forest benefits and costs in five US cities. Journal of Forestry, 103(8), 411-416.
Montgomery, D. R. (2007). Soil erosion and agricultural sustainability. Proceedings of the National Academy of Sciences of the United States of America, 104(33), 13268-13272. doi:0611508104 [pii]
Nadkarni, N. M., & Sumera, M. M. (2004). Old-growth forest canopy structure and its relationship to throughfall interception. Forest Science, 50(3), 290-298.
Nearing, M., Jetten, V., Baffaut, C., Cerdan, O., Couturier, A., Hernandez, M., et al. (2005). Modeling response of soil erosion and runoff to changes in precipitation and cover. Catena, 61(2), 131-154.
Nowak, D. J. (2006). Institutionalizing urban forestry as a “biotechnology” to improve environmental quality. Urban Forestry & Urban Greening, 5(2), 93-100.
Nowak, D. J., & Crane, D. E. (2002). Carbon storage and sequestration by urban trees in the USA. Environmental Pollution, 116(3), 381-389.
Nowak, D. J., Crane, D. E., & Stevens, J. C. (2006). Air pollution removal by urban trees and shrubs in the united states. Urban Forestry & Urban Greening, 4(3), 115-123.
49
Nowak, D. J., Crane, D. E., & Stevens, J. C. (2006). Air pollution removal by urban trees and shrubs in the united states. Urban Forestry & Urban Greening, 4(3), 115-123.
Nowak, D. J., & Dwyer, J. F. (2007). Understanding the benefits and costs of urban forest ecosystems. Urban and community forestry in the northeast (pp. 25-46) Springer.
Nowak, D. J., Greenfield, E. J., Hoehn, R. E., & Lapoint, E. (2013). Carbon storage and sequestration by trees in urban and community areas of the united states. Environmental Pollution, 178, 229-236.
Nowak, D. J., Noble, M. H., Sisinni, S. M., & Dwyer, J. F. (2001). People and trees: Assessing the US urban forest resource. Journal of Forestry, 99(3), 37-42.
Nowak, D. J., & Walton, J. T. (2005). Projected urban growth (2000–2050) and its estimated impact on the US forest resource. Journal of Forestry, 103(8), 383-389.
Oki, T., & Kanae, S. (2006). Global hydrological cycles and world water resources. Science (New York, N.Y.), 313(5790), 1068-1072. doi:313/5790/1068 [pii]
Oldeman, L. (1994). The global extent of soil degradation. Soil Resilience and Sustainable Land use, 9
Pataki, D. E., Alig, R., Fung, A., Golubiewski, N., Kennedy, C., McPherson, E., et al. (2006). Urban ecosystems and the north american carbon cycle. Global Change Biology, 12(11), 2092-2102.
Pataki, D. E., Carreiro, M. M., Cherrier, J., Grulke, N. E., Jennings, V., Pincetl, S., et al. (2011). Coupling biogeochemical cycles in urban environments: Ecosystem services, green solutions, and misconceptions. Frontiers in Ecology and the Environment, 9(1), 27-36.
Paul, M. J., & Meyer, J. L. (2001). Streams in the urban landscape. Annual Review of Ecology and Systematics, 32(1), 333-365.
Pimentel, D., Harvey, C., Resosudarmo, P., & Sinclair, K. (1995). Environmental and economic costs of soil erosion and conservation benefits. Science, 267(5201), 1117.
Ponette-González, A. G., Ewing, H. A., & Weathers, K. C. (2016). Interactions between precipitation and vegetation canopies. A Biogeoscience Approach to Ecosystems, , 215.
Ponette‐González, A. G., Weathers, K. C., & Curran, L. M. (2010). Water inputs across a tropical montane landscape in veracruz, mexico: Synergistic effects of land cover, rain and fog seasonality, and interannual precipitation variability. Global Change Biology, 16(3), 946-963.
Pypker, T. G., Unsworth, M. H., & Bond, B. J. (2006). The role of epiphytes in rainfall interception by forests in the pacific northwest. II. field measurements at the branch and canopy scale. Canadian Journal of Forest Research, 36(4), 819-832.

50
Resh, V. H., Brown, A. V., Covich, A. P., Gurtz, M. E., Li, H. W., Minshall, G. W., et al. (1988). The role of disturbance in stream ecology. Journal of the North American Benthological Society, 7(4), 433-455.
Rose, S., & Peters, N. E. (2001). Effects of urbanization on streamflow in the atlanta area (georgia, USA): A comparative hydrological approach. Hydrological Processes, 15(8), 1441-1457.
Rosenfeld, A. H., Akbari, H., Bretz, S., Fishman, B. L., Kurn, D. M., Sailor, D., et al. (1995). Mitigation of urban heat islands: Materials, utility programs, updates. Energy and Buildings, 22(3), 255-265.
Sanders, R. A. (1986). Urban vegetation impacts on the hydrology of dayton, ohio. Urban Ecology, 9(3-4), 361-376.
Schmitt, T. G., Thomas, M., & Ettrich, N. (2004). Analysis and modeling of flooding in urban drainage systems. Journal of Hydrology, 299(3), 300-311.
Staelens, J., De Schrijver, A., Verheyen, K., & Verhoest, N. E. (2006). Spatial variability and temporal stability of throughfall water under a dominant beech (fagus sylvatica L.) tree in relationship to canopy cover. Journal of Hydrology, 330(3), 651-662.
Tratalos, J., Fuller, R. A., Warren, P. H., Davies, R. G., & Gaston, K. J. (2007). Urban form, biodiversity potential and ecosystem services. Landscape and Urban Planning, 83(4), 308-317.
Tyrväinen, L., & Miettinen, A. (2000). Property prices and urban forest amenities. Journal of Environmental Economics and Management, 39(2), 205-223.
Tyrväinen, L., Pauleit, S., Seeland, K., & de Vries, S. (2005). Benefits and uses of urban forests and trees. Urban forests and trees (pp. 81-114) Springer.
Tzoulas, K., Korpela, K., Venn, S., Yli-Pelkonen, V., Kaźmierczak, A., Niemela, J., et al. (2007). Promoting ecosystem and human health in urban areas using green infrastructure: A literature review. Landscape and Urban Planning, 81(3), 167-178.
Van Stan, J. T., Levia Jr, D. F., & Jenkins, R. B. (2015). Forest canopy interception loss across temporal scales: Implications for urban greening initiatives. The Professional Geographer, 67(1), 41-51.
Voelker, S. L., Muzika, R., & Guyette, R. P. (2008). Individual tree and stand level influences on the growth, vigor, and decline of red oaks in the ozarks. Forest Science, 54(1), 8-20.
Wang, J., Endreny, T. A., & Nowak, D. J. (2008). Mechanistic Simulation of Tree Effects in an Urban Water Balance Model1,
51
Weber, T., Sloan, A., & Wolf, J. (2006). Maryland's green infrastructure assessment: Development of a comprehensive approach to land conservation. Landscape and Urban Planning, 77(1), 94-110.
Weng, Q., Lu, D., & Schubring, J. (2004). Estimation of land surface temperature–vegetation abundance relationship for urban heat island studies. Remote Sensing of Environment, 89(4), 467-483.
Whitlow, T. H., & Bassuk, N. L. (1987). Trees in difficult sites. Journal of Arboriculture, 13(1), 10-17.
Xiao, Q., McPherson, E., Simpson, J., & Ustin, S. (2007). Hydrologic processes at the urban residential scale. Hydrological Processes, 21(16), 2174-2188.
Xiao, Q., & McPherson, E. G. (2002). Rainfall interception by santa monica's municipal urban forest. Urban Ecosystems, 6(4), 291-302.
Xiao, Q., & McPherson, E. G. (2002). Rainfall interception by santa monica's municipal urban forest. Urban Ecosystems, 6(4), 291-302.
Xiao, Q., McPherson, E. G., Simpson, J. R., & Ustin, S. L. (1998). Rainfall interception by sacramento's urban forest. Journal of Arboriculture, 24, 235-244.
Xiao, Q., McPherson, E. G., Ustin, S. L., & Grismer, M. E. (2000). A new approach to modeling tree rainfall interception. Journal of Geophysical Research, 105(D23), 29,173-129,188.
Yang, J., McBride, J., Zhou, J., & Sun, Z. (2005). The urban forest in beijing and its role in air pollution reduction. Urban Forestry & Urban Greening, 3(2), 65-78