Embed Size (px)
Citation preview
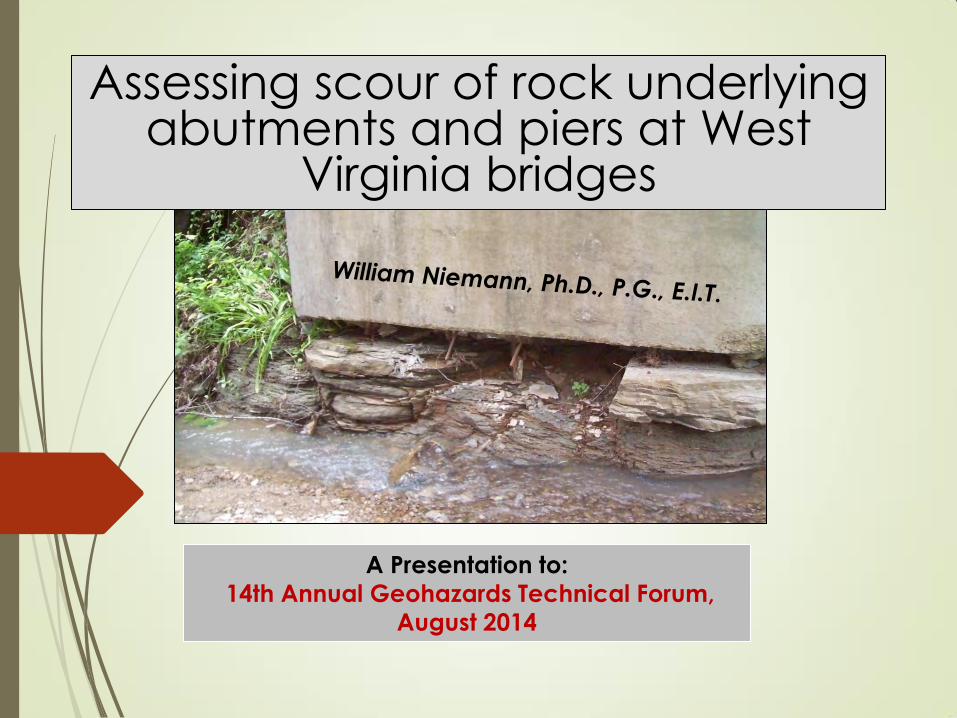
Assessing scour of rock underlying abutments and piers at West
Virginia bridges
A Presentation to:
14th Annual Geohazards Technical Forum,
August 2014

Assessing scour of rock underlying abutments and piers at West
Virginia bridges
Background
Project Objectives and Tasks
Research Methods
Results
Application & Implementation

Assessing scour of rock underlying abutments and piers at West
Virginia bridges
Background
Project Objectives and Tasks
Research Methods
Results
Application & Implementation
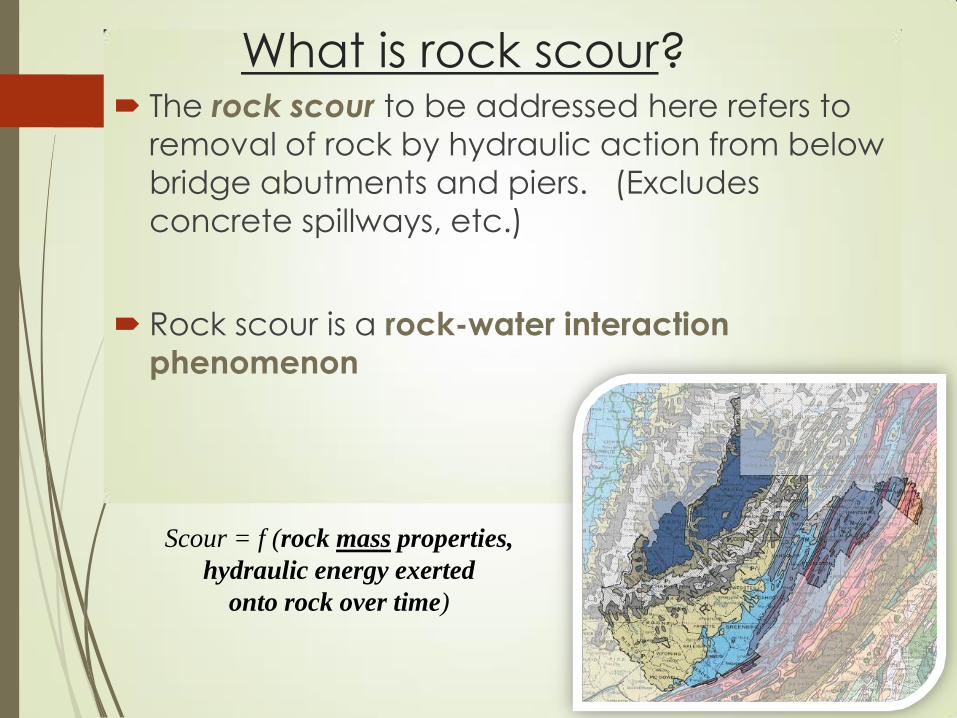
The rock scour to be addressed here refers to
removal of rock by hydraulic action from below
bridge abutments and piers. (Excludes
concrete spillways, etc.)
Rock scour is a rock-water interaction
phenomenon
What is rock scour?
Scour = f (rock mass properties,
hydraulic energy exerted
onto rock over time)
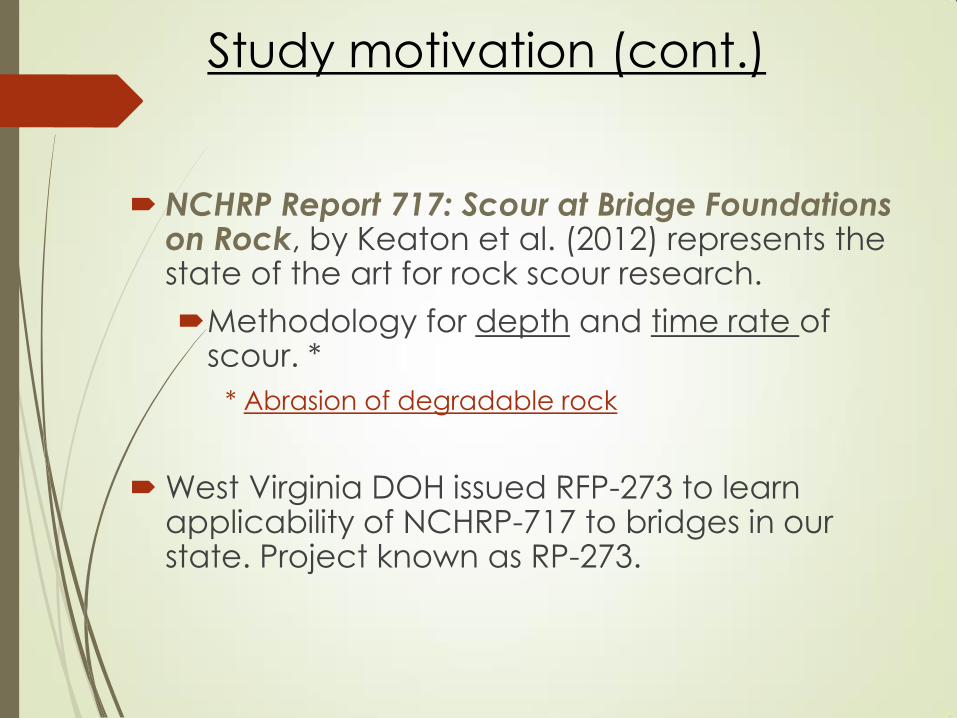
NCHRP Report 717: Scour at Bridge Foundations on Rock, by Keaton et al. (2012) represents the state of the art for rock scour research.
Methodology for depth and time rate of scour. *
* Abrasion of degradable rock
West Virginia DOH issued RFP-273 to learn applicability of NCHRP-717 to bridges in our state. Project known as RP-273.
Study motivation (cont.)
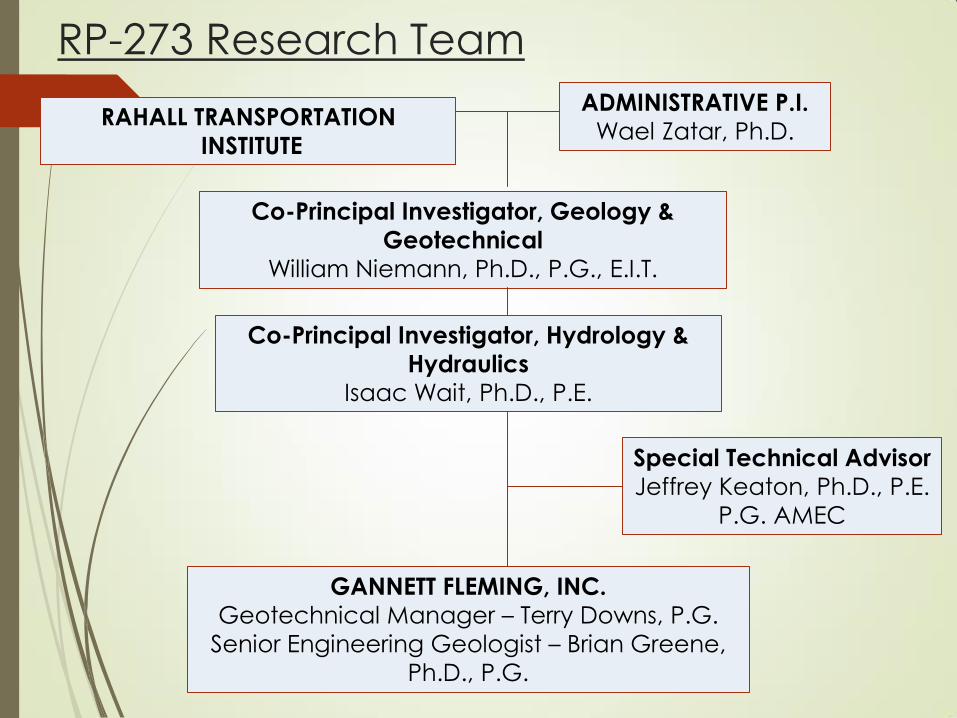
RP-273 Research Team
RAHALL TRANSPORTATION
INSTITUTE
ADMINISTRATIVE P.I.
Wael Zatar, Ph.D.
Co-Principal Investigator, Geology &
Geotechnical
William Niemann, Ph.D., P.G., E.I.T.
Special Technical Advisor
Jeffrey Keaton, Ph.D., P.E.
P.G. AMEC
GANNETT FLEMING, INC.
Geotechnical Manager – Terry Downs, P.G.
Senior Engineering Geologist – Brian Greene,
Ph.D., P.G.
Co-Principal Investigator, Hydrology &
Hydraulics
Isaac Wait, Ph.D., P.E.
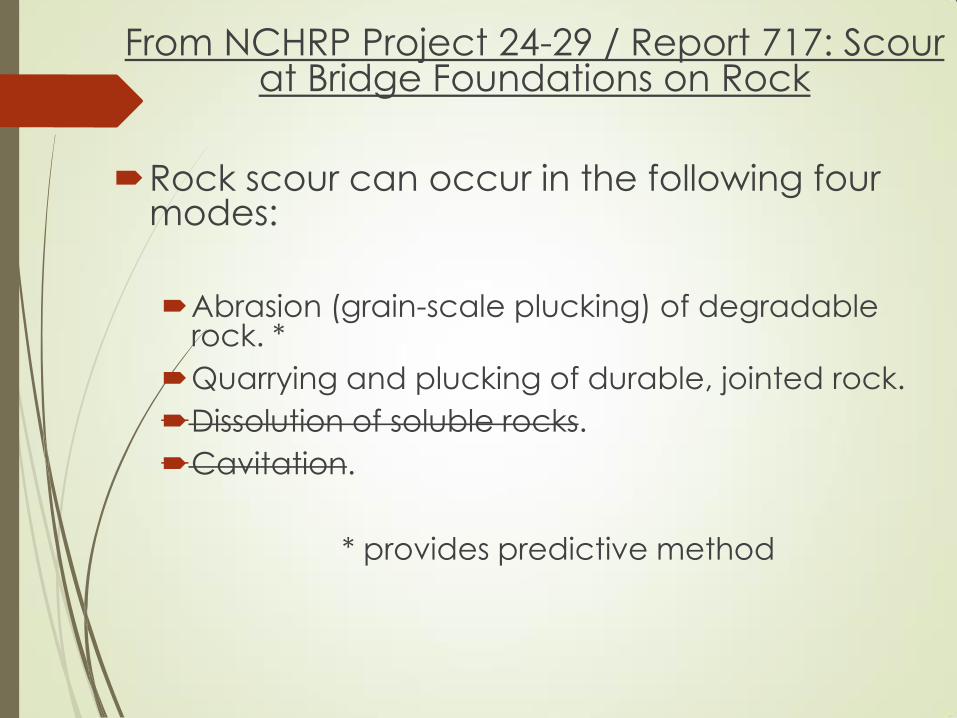
From NCHRP Project 24-29 / Report 717: Scour at Bridge Foundations on Rock
Rock scour can occur in the following four modes:
Abrasion (grain-scale plucking) of degradable rock. *
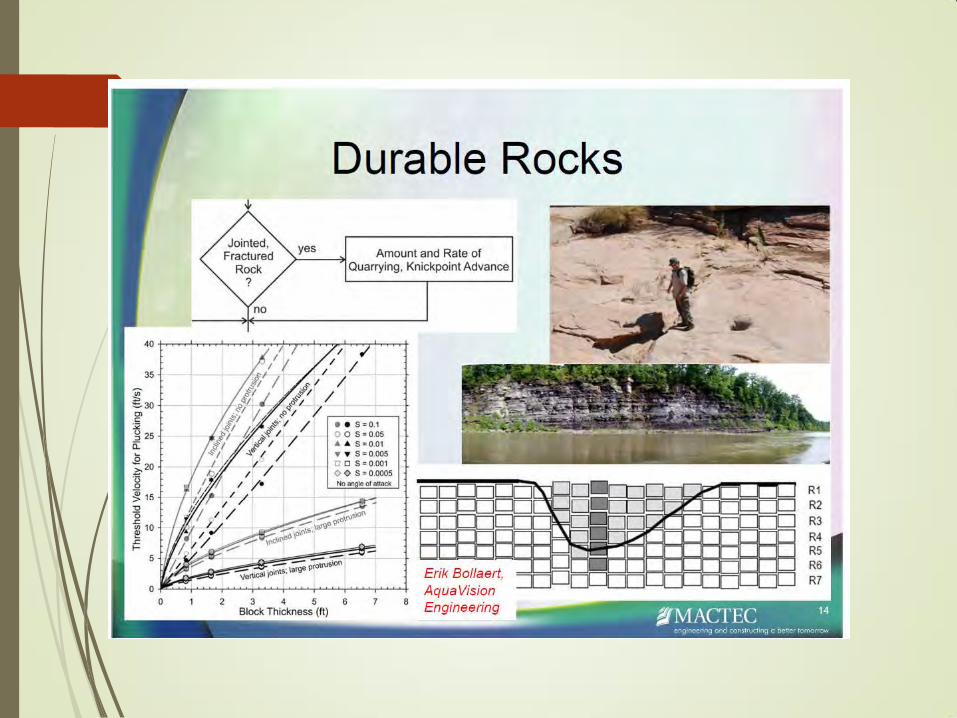
Quarrying and plucking of durable, jointed rock.
Dissolution of soluble rocks.
Cavitation.
* provides predictive method
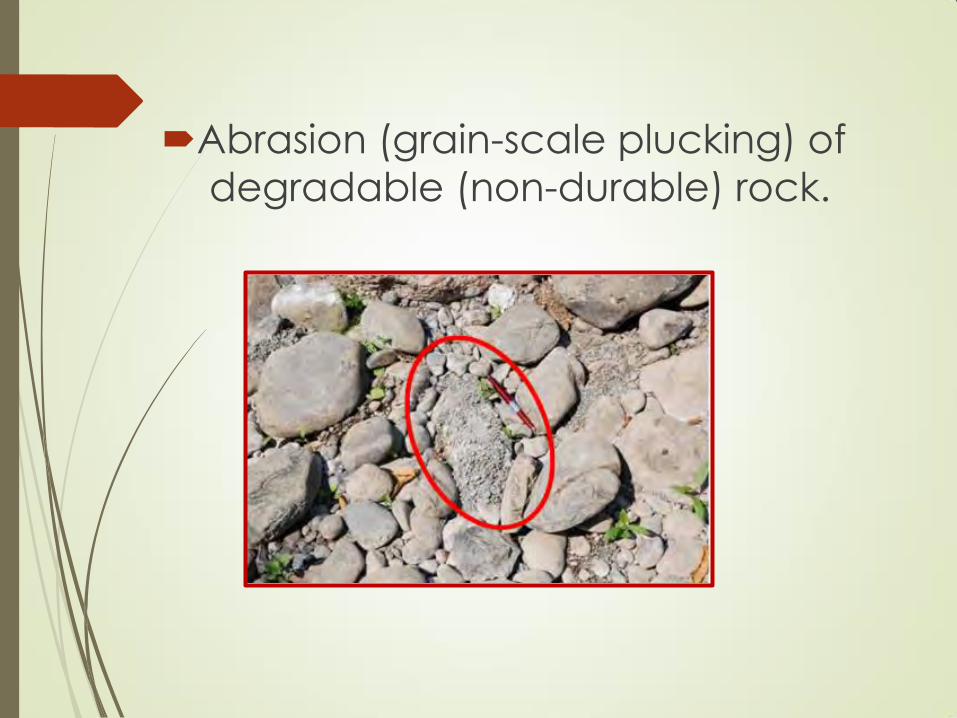
Abrasion (grain-scale plucking) of
degradable (non-durable) rock.
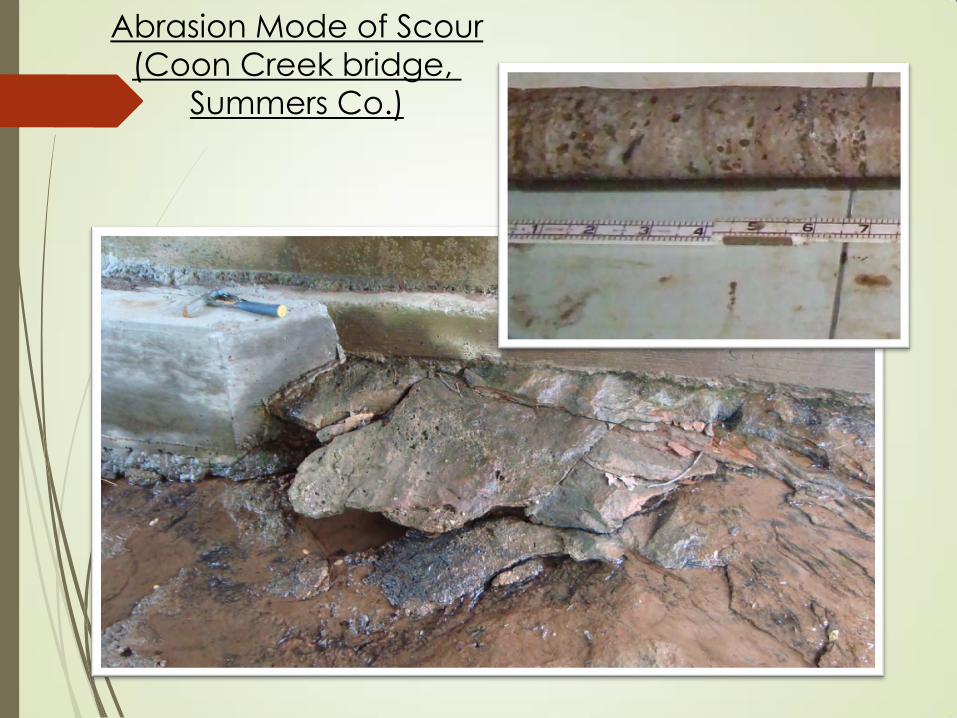
Abrasion Mode of Scour
(Coon Creek bridge,
Summers Co.)
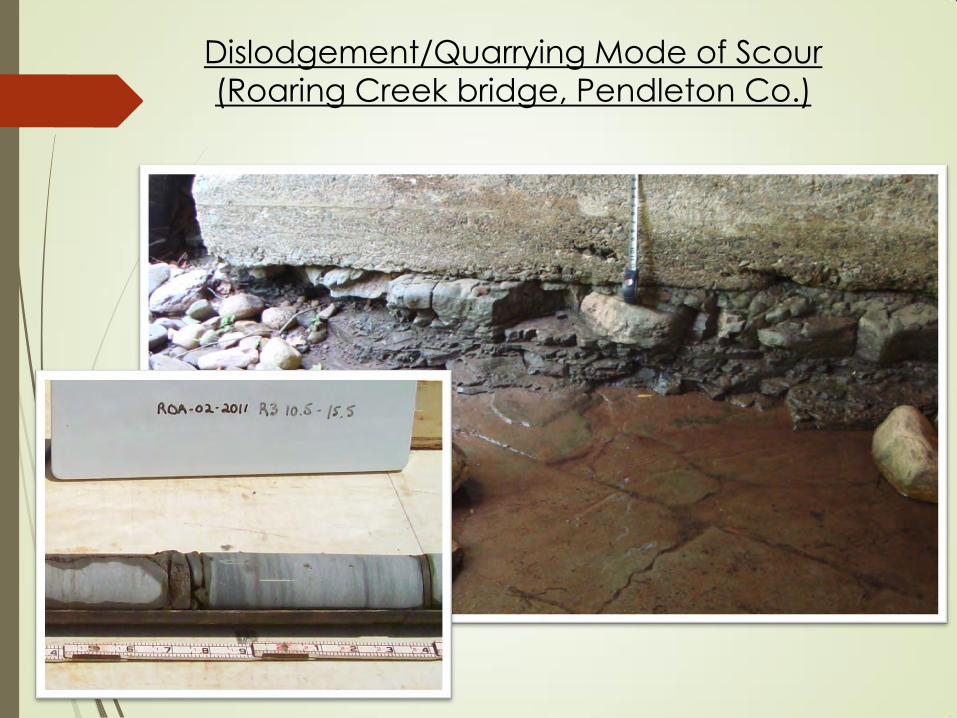
Dislodgement/Quarrying Mode of Scour
(Roaring Creek bridge, Pendleton Co.)
Project Objectives
How erodible are rocks in
West Virginia?
What are the stream energy
conditions at bridges in West
Virginia?

Assessing scour of rock underlying abutments and piers at West
Virginia bridges
Background
Project Objectives and Tasks
Research Methods
Results
Application & Implementation
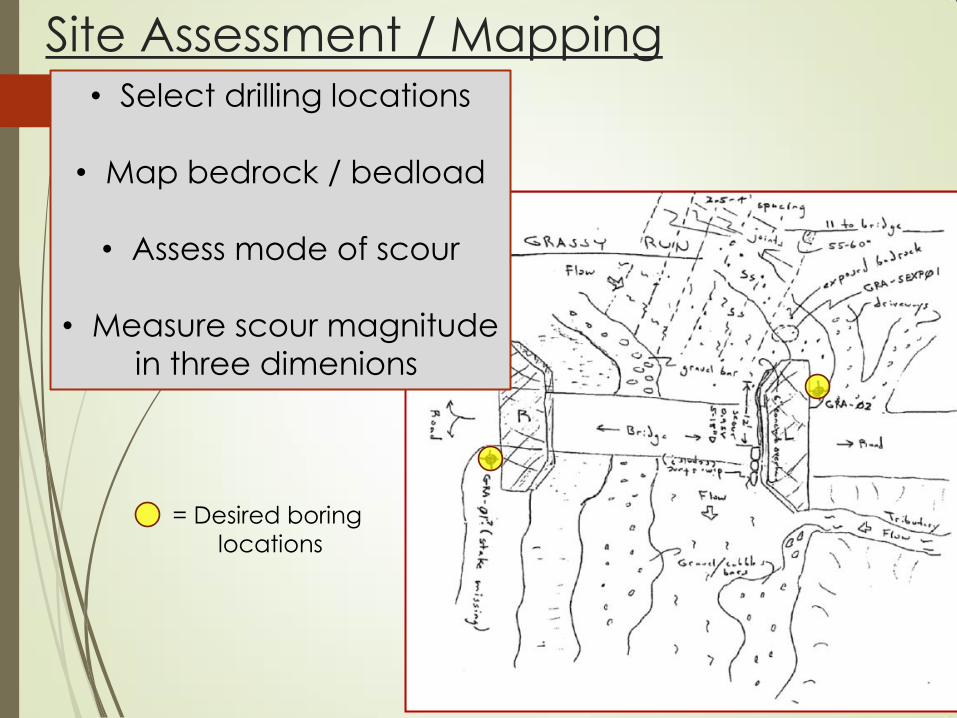
Site Assessment / Mapping • Select drilling locations
• Map bedrock / bedload
• Assess mode of scour
• Measure scour magnitude
in three dimenions
= Desired boring
locations
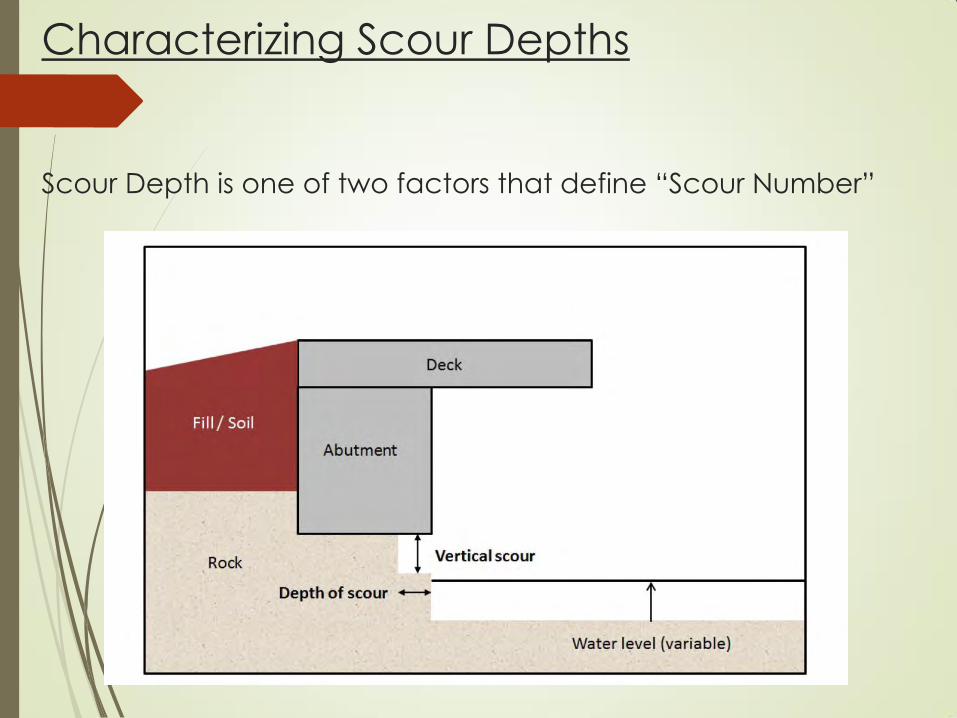
Characterizing Scour Depths
Scour Depth is one of two factors that define “Scour Number”
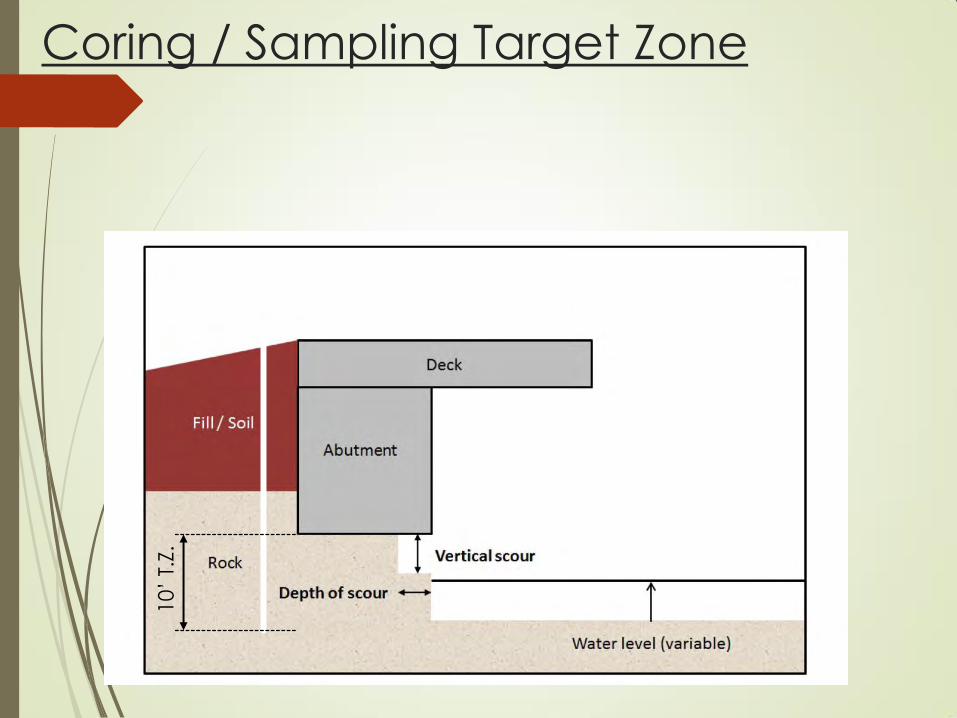
Coring / Sampling Target Zone
10
’ T.
Z.
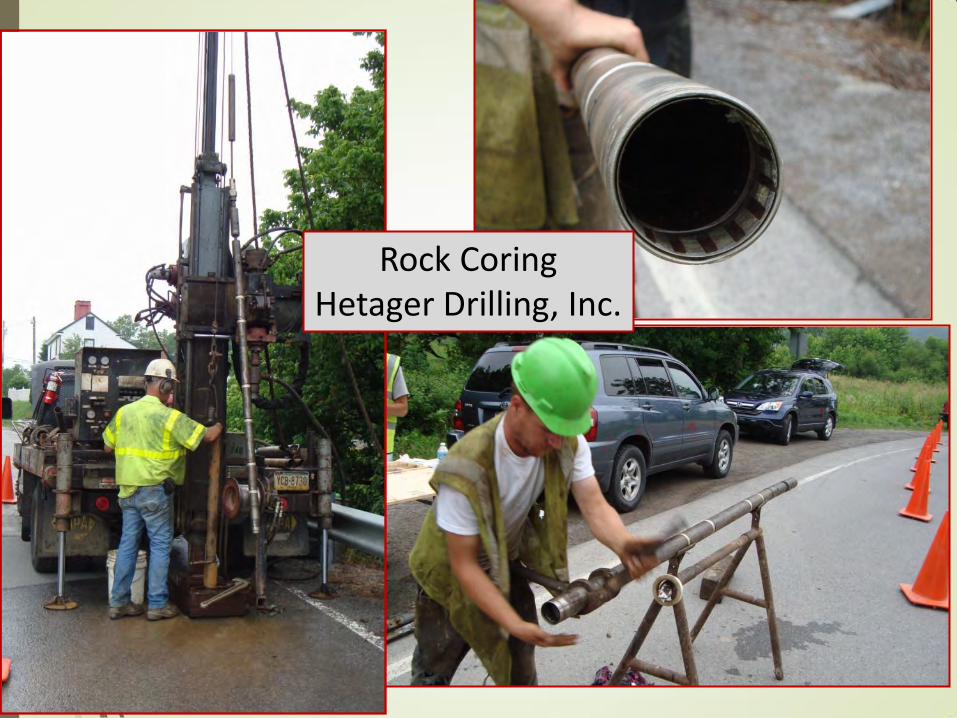
Rock Coring Hetager Drilling, Inc.
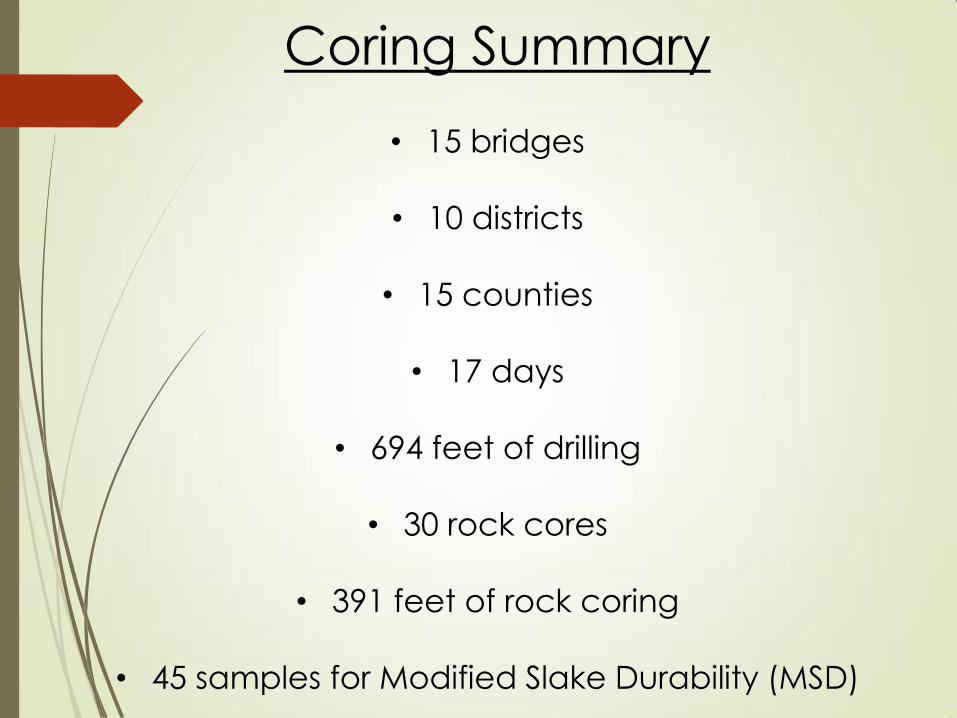
Coring Summary
• 15 bridges
• 10 districts
• 15 counties
• 17 days
• 694 feet of drilling
• 30 rock cores
• 391 feet of rock coring
• 45 samples for Modified Slake Durability (MSD)
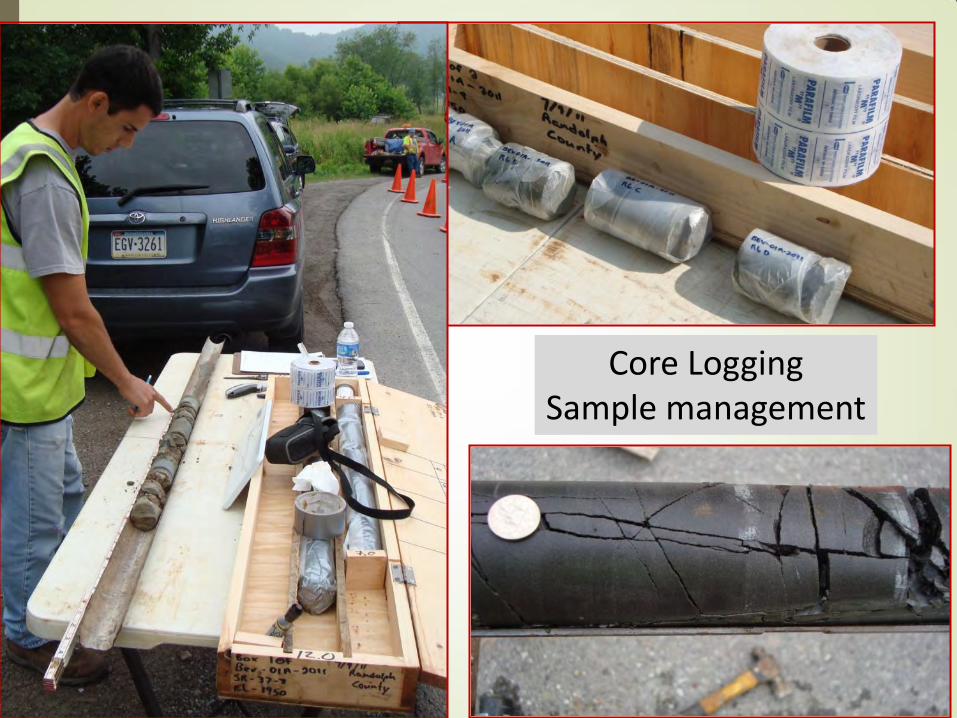
Core Logging Sample management
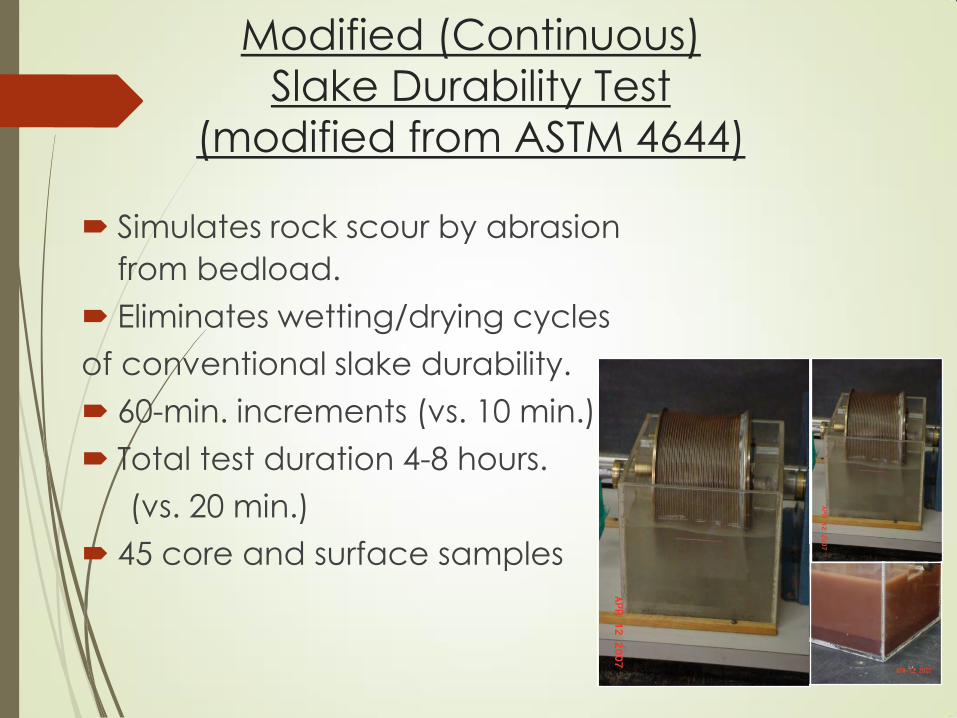
Modified (Continuous)
Slake Durability Test
(modified from ASTM 4644)
Simulates rock scour by abrasion
from bedload.
Eliminates wetting/drying cycles
of conventional slake durability.
60-min. increments (vs. 10 min.)
Total test duration 4-8 hours.
(vs. 20 min.)
45 core and surface samples
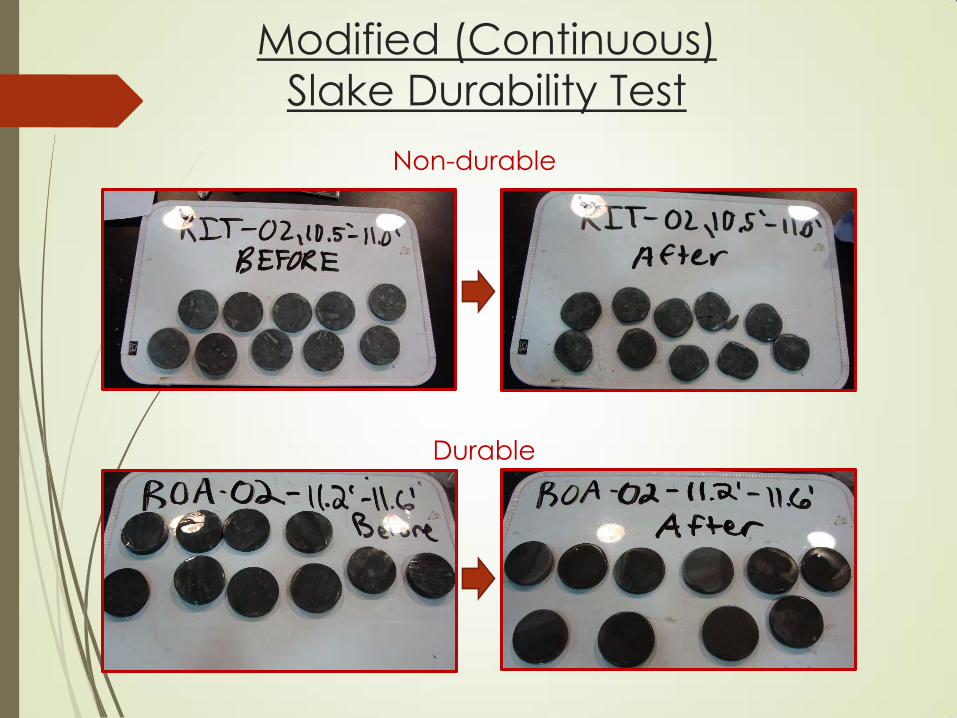
Modified (Continuous)
Slake Durability Test
Non-durable
Durable
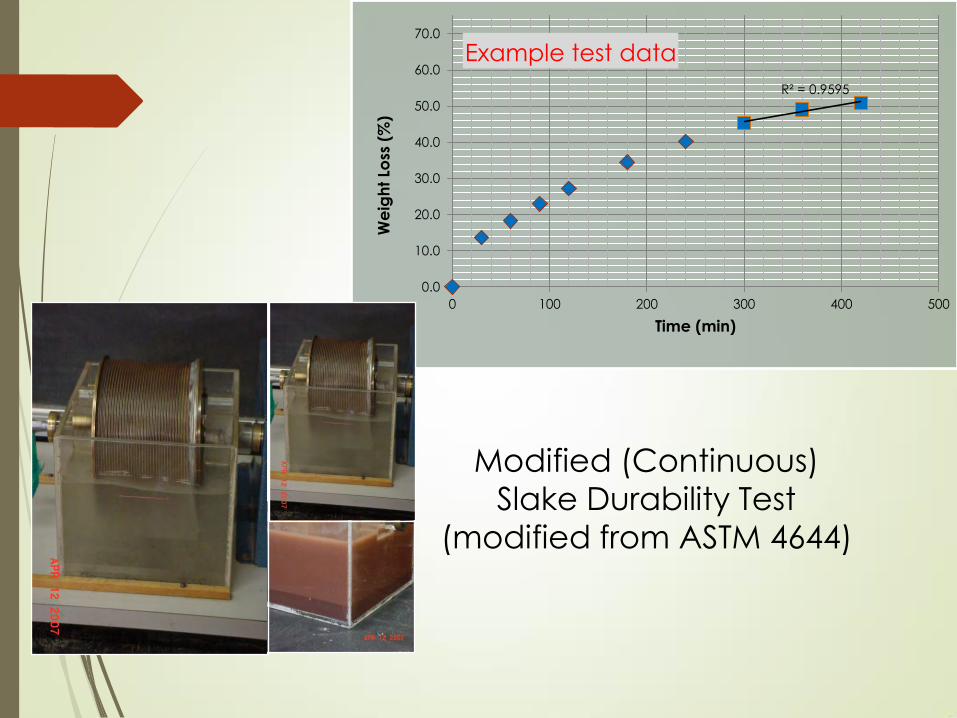
R² = 0.9595
0.0
10.0
20.0
30.0
40.0
50.0
60.0
70.0
0 100 200 300 400 500
We
igh
t Lo
ss (
%)
Time (min)
Example test data
Modified (Continuous)
Slake Durability Test
(modified from ASTM 4644)
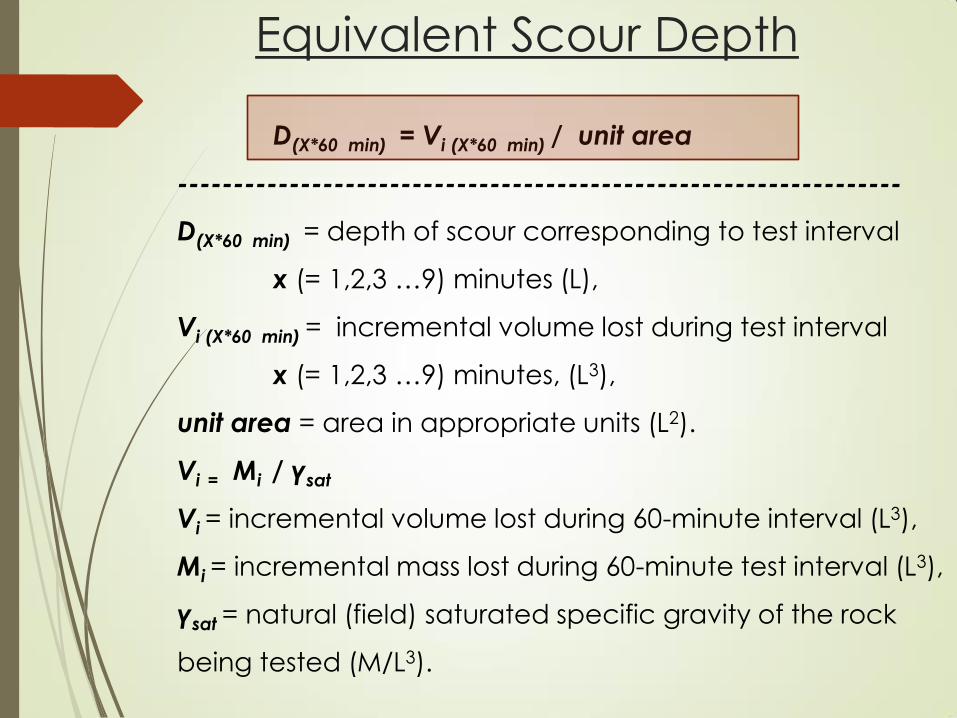
Equivalent Scour Depth
D(X*60 min) = Vi (X*60 min) / unit area
-----------------------------------------------------------------
D(X*60 min) = depth of scour corresponding to test interval
x (= 1,2,3 …9) minutes (L),
Vi (X*60 min) = incremental volume lost during test interval
x (= 1,2,3 …9) minutes, (L3),
unit area = area in appropriate units (L2).
Vi = Mi / γsat
Vi = incremental volume lost during 60-minute interval (L3),
Mi = incremental mass lost during 60-minute test interval (L3),
γsat = natural (field) saturated specific gravity of the rock
being tested (M/L3).
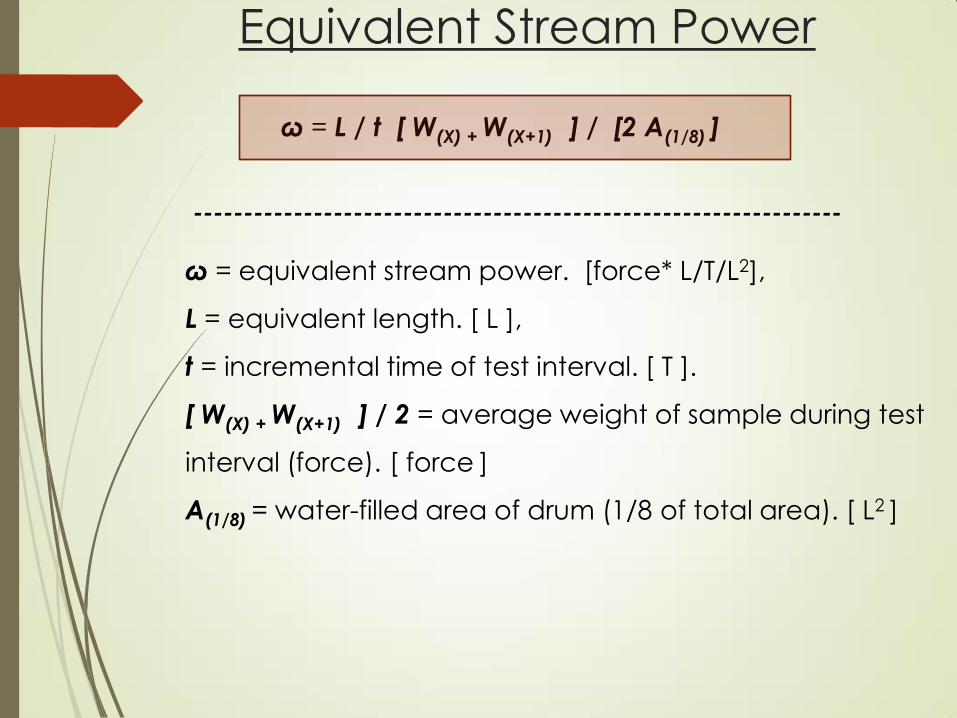
Equivalent Stream Power
ω = L / t [ W(X) + W(X+1) ] / [2 A(1/8) ]
ω = equivalent stream power. [force* L/T/L2],
L = equivalent length. [ L ],
t = incremental time of test interval. [ T ].
[ W(X) + W(X+1) ] / 2 = average weight of sample during test
interval (force). [ force ]
A(1/8) = water-filled area of drum (1/8 of total area). [ L2 ]
-----------------------------------------------------------------
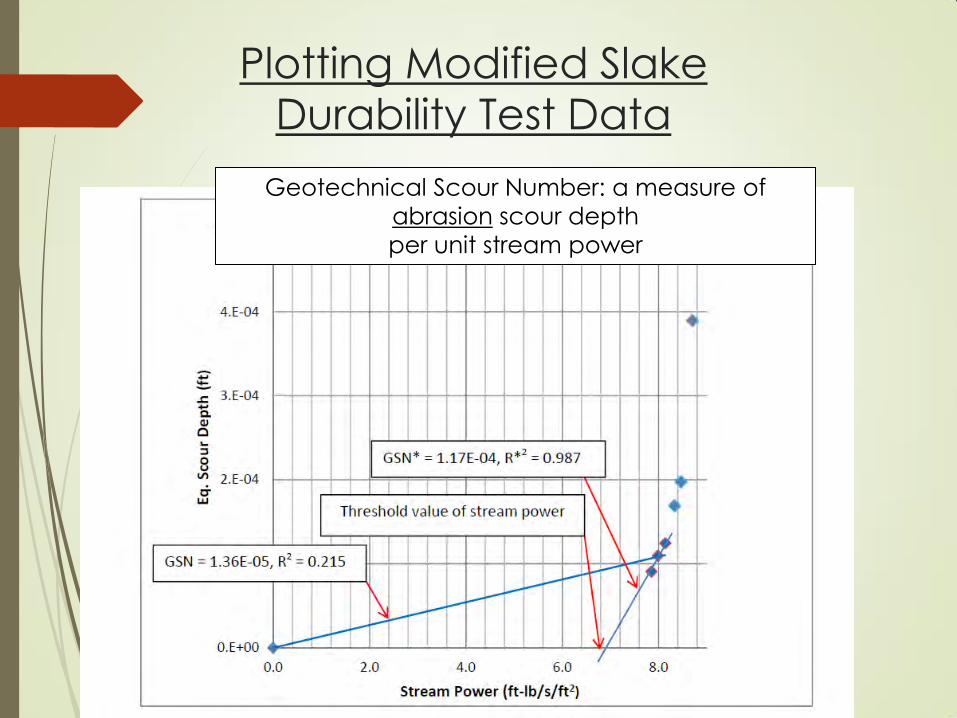
Plotting Modified Slake
Durability Test Data
Geotechnical Scour Number: a measure of
abrasion scour depth
per unit stream power
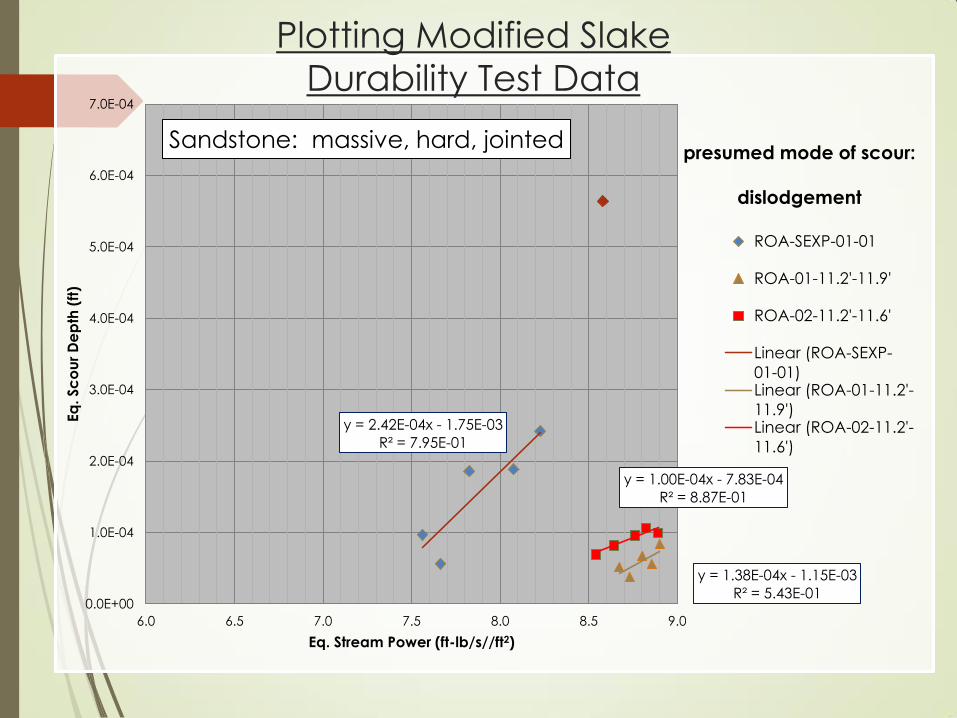
y = 2.42E-04x - 1.75E-03
R² = 7.95E-01
y = 1.38E-04x - 1.15E-03
R² = 5.43E-01
y = 1.00E-04x - 7.83E-04
R² = 8.87E-01
0.0E+00
1.0E-04
2.0E-04
3.0E-04
4.0E-04
5.0E-04
6.0E-04
7.0E-04
6.0 6.5 7.0 7.5 8.0 8.5 9.0
Eq
. Sc
ou
r D
ep
th (
ft)
Eq. Stream Power (ft-lb/s//ft2)
ROA-SEXP-01-01
ROA-01-11.2'-11.9'
ROA-02-11.2'-11.6'
Linear (ROA-SEXP-
01-01)Linear (ROA-01-11.2'-
11.9')Linear (ROA-02-11.2'-
11.6')
presumed mode of scour:
dislodgement
Sandstone: massive, hard, jointed
Plotting Modified Slake
Durability Test Data
Assessing scour of rock underlying abutments and piers at West
Virginia bridges
Background
Project Objectives and Tasks
Research Methods
Results
Application & Implementation
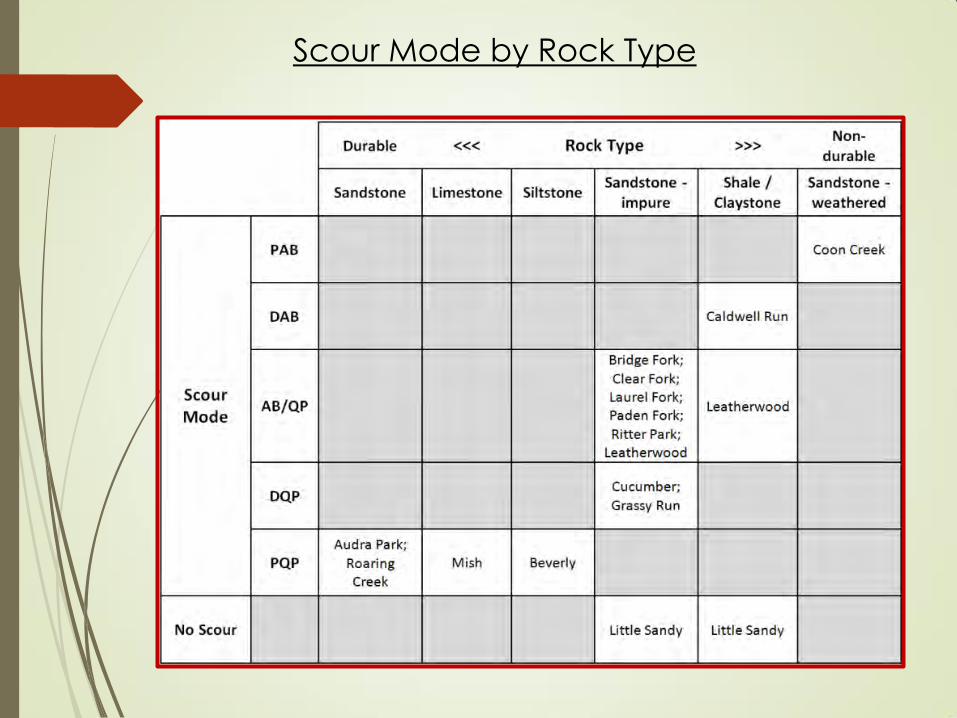
Scour Mode by Rock Type
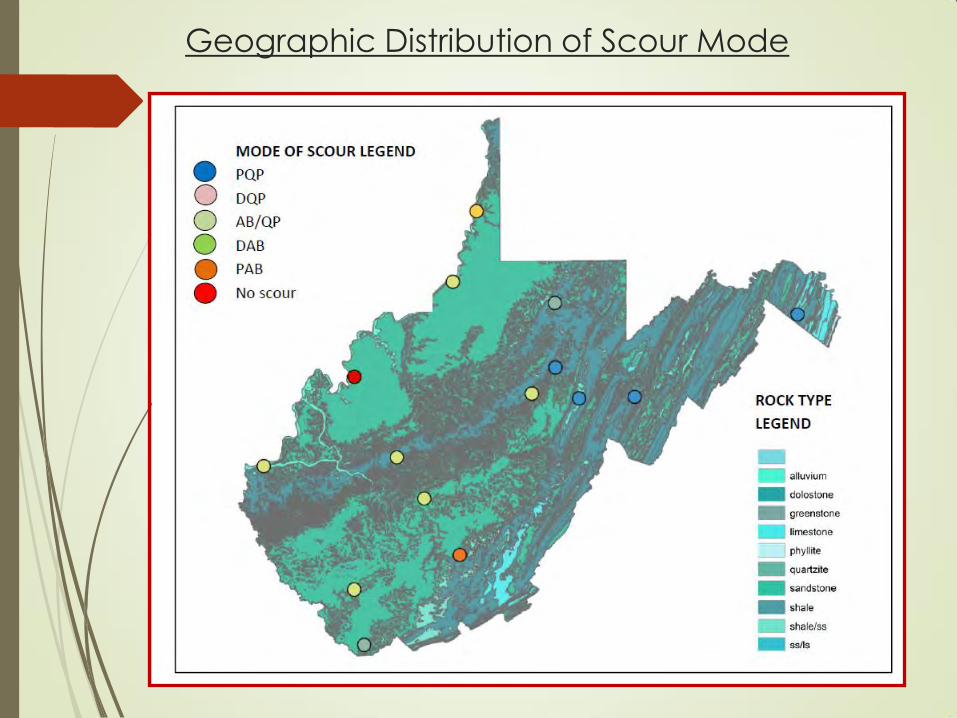
Geographic Distribution of Scour Mode
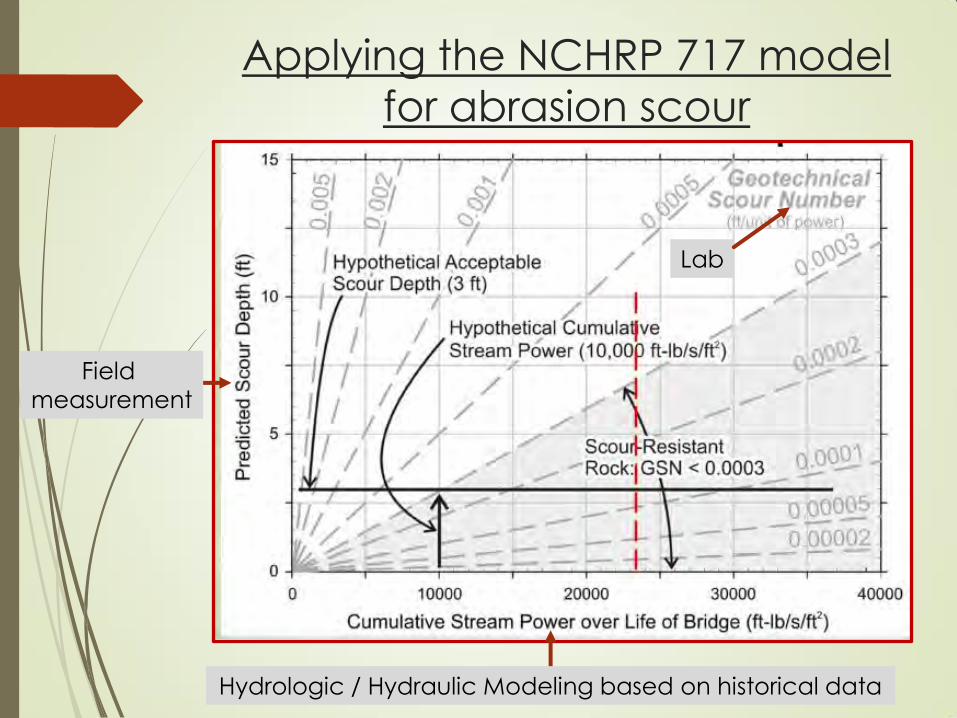
Applying the NCHRP 717 model
for abrasion scour
Field
measurement
Hydrologic / Hydraulic Modeling based on historical data
Lab
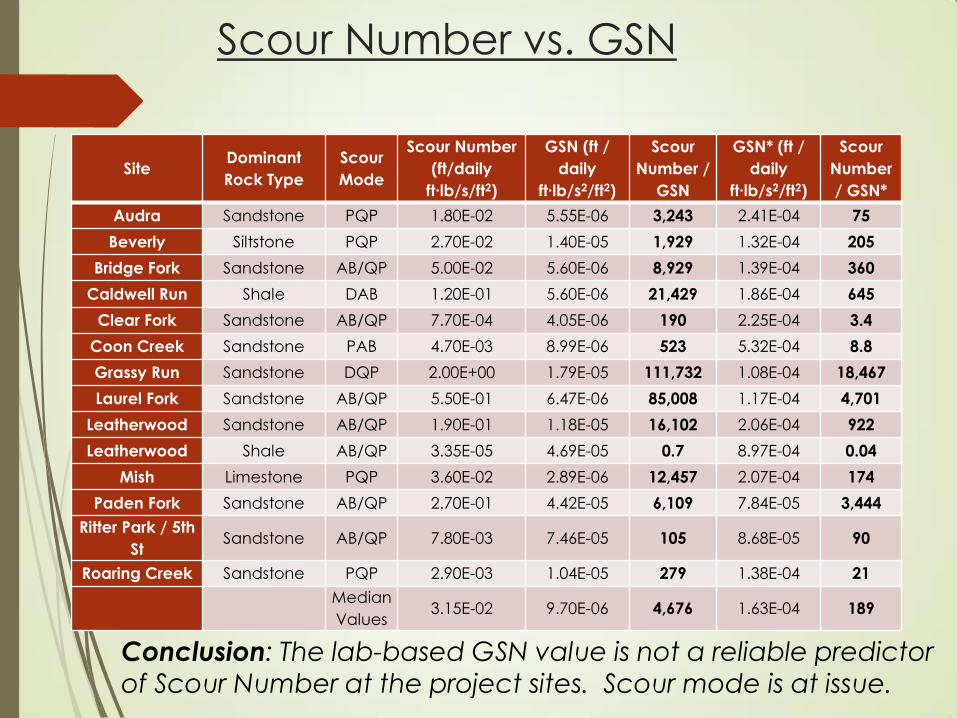
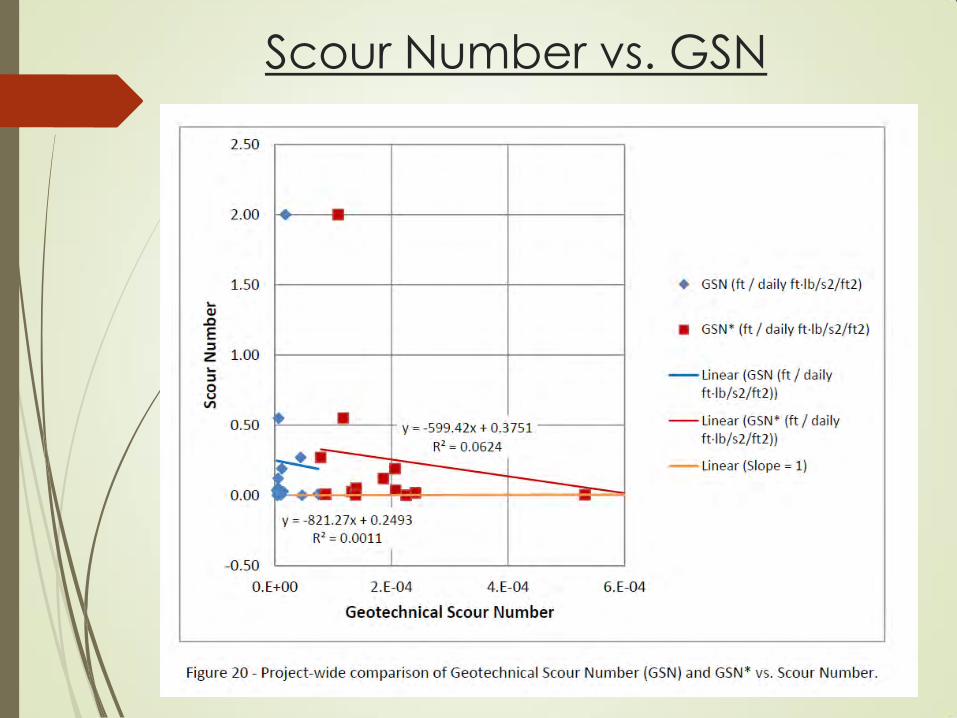
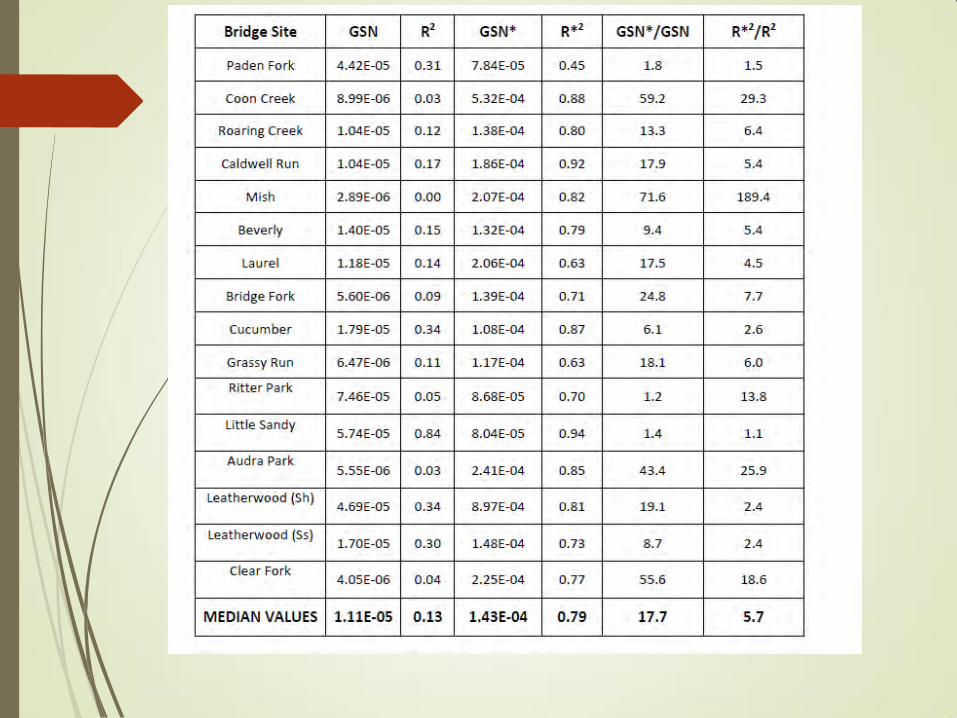
Scour Number vs. GSN
Site Dominant
Rock Type
Scour
Mode
Scour Number
(ft/daily
ft∙lb/s/ft2)
GSN (ft /
daily
ft∙lb/s2/ft2)
Scour
Number /
GSN
GSN* (ft /
daily
ft∙lb/s2/ft2)
Scour
Number
/ GSN*
Audra Sandstone PQP 1.80E-02 5.55E-06 3,243 2.41E-04 75
Beverly Siltstone PQP 2.70E-02 1.40E-05 1,929 1.32E-04 205
Bridge Fork Sandstone AB/QP 5.00E-02 5.60E-06 8,929 1.39E-04 360
Caldwell Run Shale DAB 1.20E-01 5.60E-06 21,429 1.86E-04 645
Clear Fork Sandstone AB/QP 7.70E-04 4.05E-06 190 2.25E-04 3.4
Coon Creek Sandstone PAB 4.70E-03 8.99E-06 523 5.32E-04 8.8
Grassy Run Sandstone DQP 2.00E+00 1.79E-05 111,732 1.08E-04 18,467
Laurel Fork Sandstone AB/QP 5.50E-01 6.47E-06 85,008 1.17E-04 4,701
Leatherwood Sandstone AB/QP 1.90E-01 1.18E-05 16,102 2.06E-04 922
Leatherwood Shale AB/QP 3.35E-05 4.69E-05 0.7 8.97E-04 0.04
Mish Limestone PQP 3.60E-02 2.89E-06 12,457 2.07E-04 174
Paden Fork Sandstone AB/QP 2.70E-01 4.42E-05 6,109 7.84E-05 3,444
Ritter Park / 5th
St Sandstone AB/QP 7.80E-03 7.46E-05 105 8.68E-05 90
Roaring Creek Sandstone PQP 2.90E-03 1.04E-05 279 1.38E-04 21
Median
Values 3.15E-02 9.70E-06 4,676 1.63E-04 189
Conclusion: The lab-based GSN value is not a reliable predictor
of Scour Number at the project sites. Scour mode is at issue.
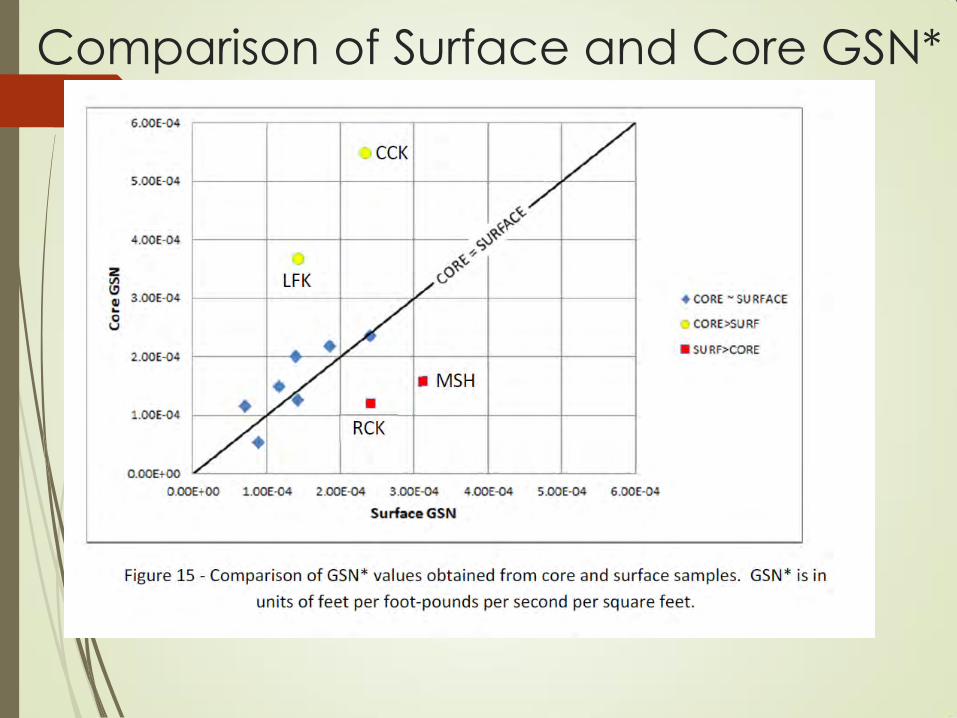
Comparison of Surface and Core GSN*

Assessing scour of rock underlying abutments and piers at West
Virginia bridges
Background
Project Objectives and Tasks
Research Methods
Results
Application & Implementation
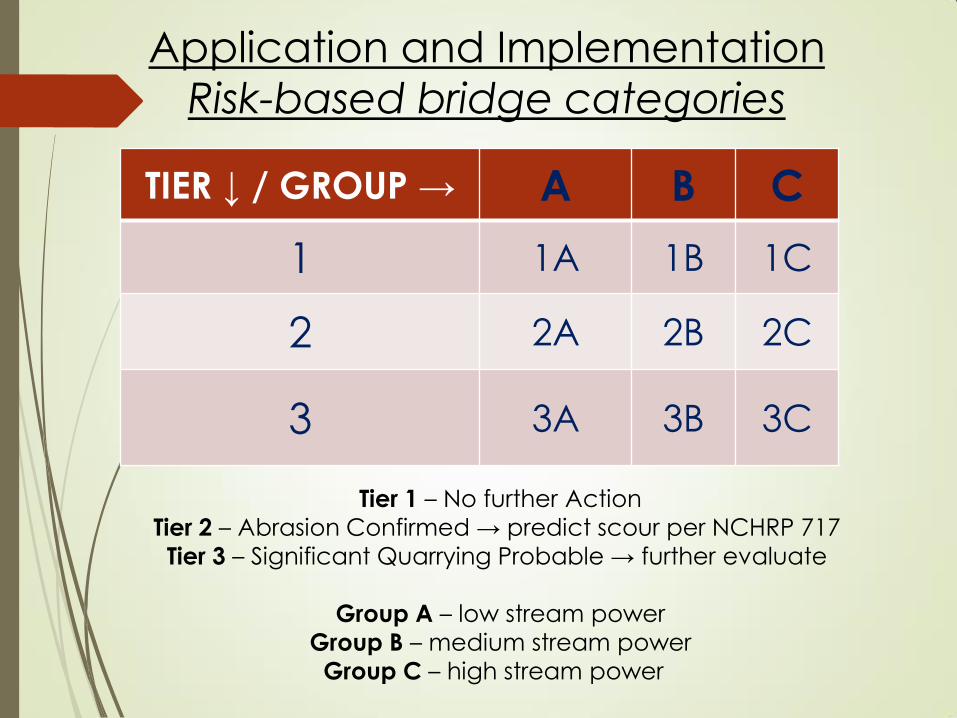
Application and Implementation
Risk-based bridge categories
TIER ↓ / GROUP → A B C
1 1A 1B 1C
2 2A 2B 2C
3 3A 3B 3C
Tier 1 – No further Action
Tier 2 – Abrasion Confirmed → predict scour per NCHRP 717
Tier 3 – Significant Quarrying Probable → further evaluate
Group A – low stream power
Group B – medium stream power
Group C – high stream power
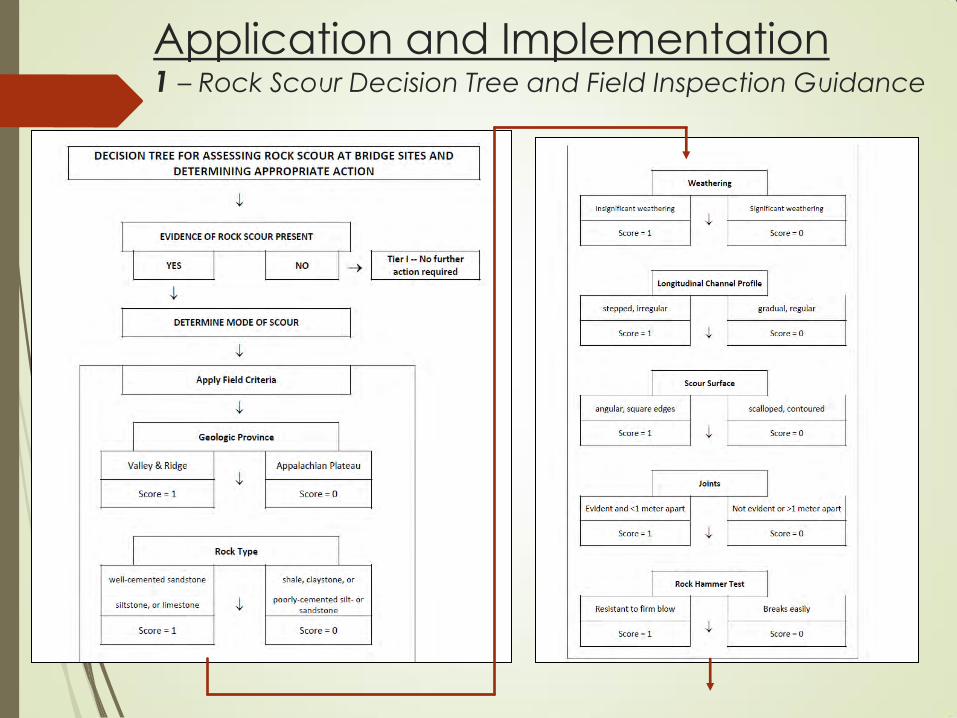
Application and Implementation 1 – Rock Scour Decision Tree and Field Inspection Guidance
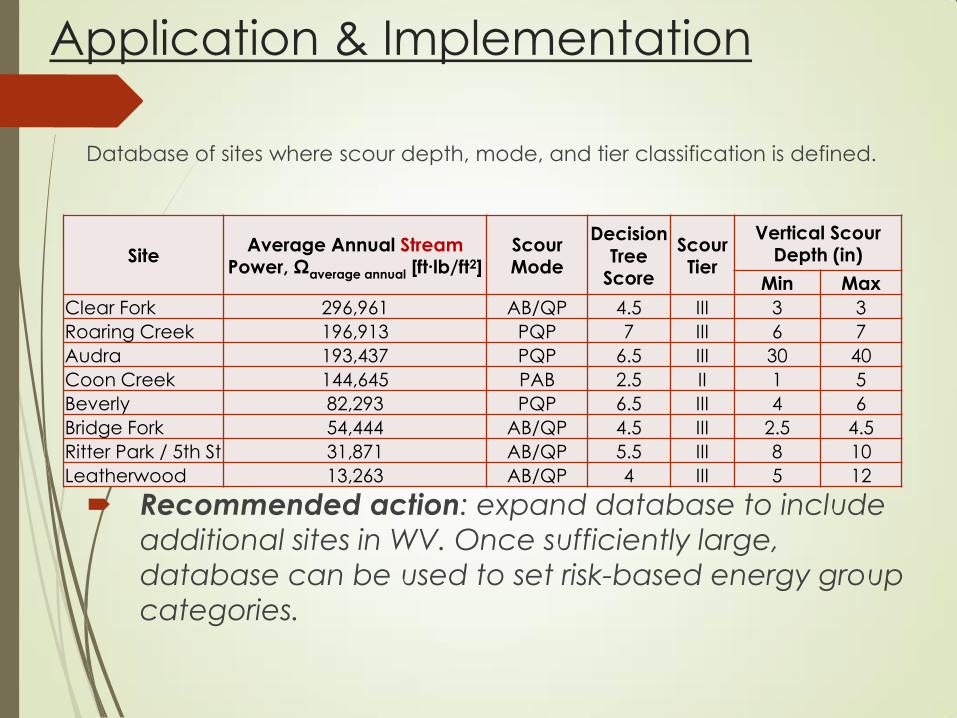
Application & Implementation
Database of sites where scour depth, mode, and tier classification is defined.
Recommended action: expand database to include
additional sites in WV. Once sufficiently large,
database can be used to set risk-based energy group
categories.
Site Average Annual Stream
Power, Ωaverage annual [ft∙lb/ft2] Scour Mode
Decision Tree
Score
Scour Tier
Vertical Scour Depth (in)
Min Max
Clear Fork 296,961 AB/QP 4.5 III 3 3
Roaring Creek 196,913 PQP 7 III 6 7
Audra 193,437 PQP 6.5 III 30 40
Coon Creek 144,645 PAB 2.5 II 1 5
Beverly 82,293 PQP 6.5 III 4 6
Bridge Fork 54,444 AB/QP 4.5 III 2.5 4.5
Ritter Park / 5th St 31,871 AB/QP 5.5 III 8 10
Leatherwood 13,263 AB/QP 4 III 5 12
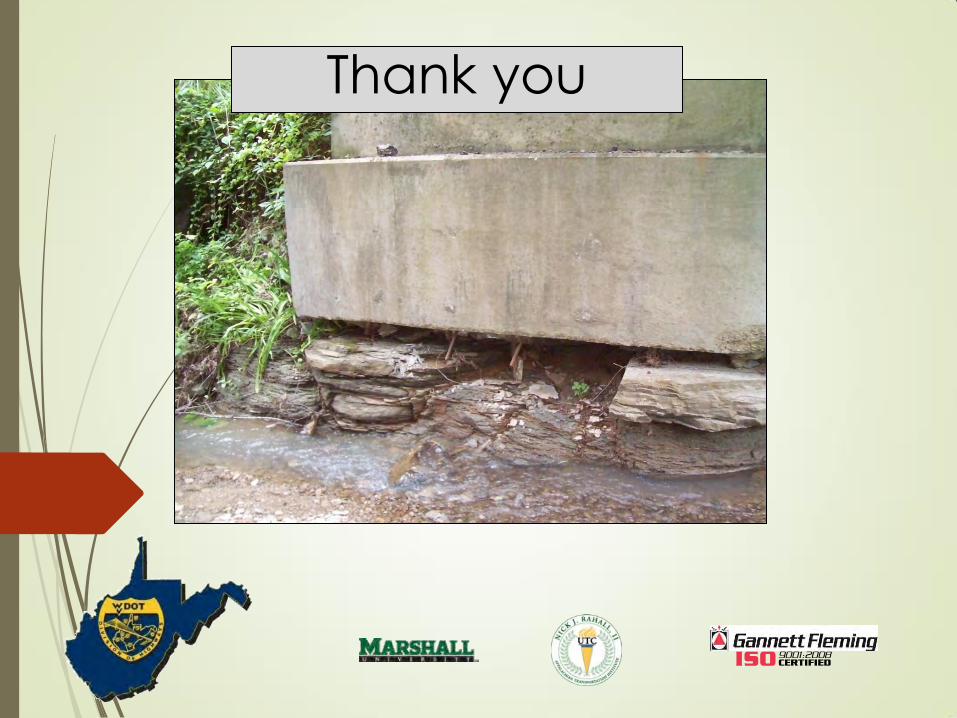
Thank you

The following slides were
not used in the presentation
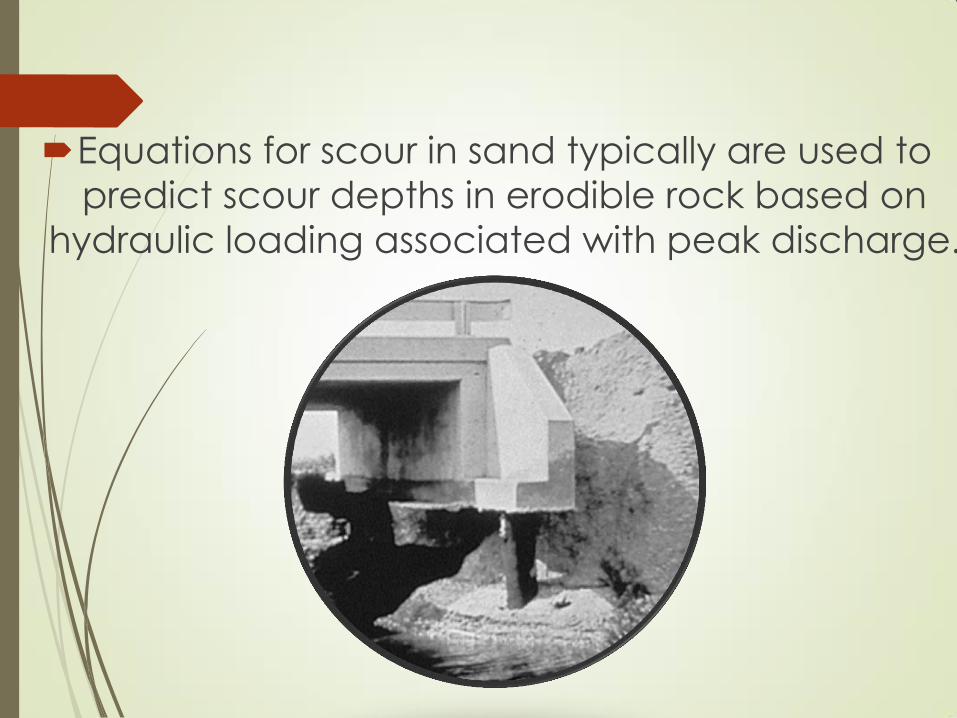
Equations for scour in sand typically are used to
predict scour depths in erodible rock based on
hydraulic loading associated with peak discharge.
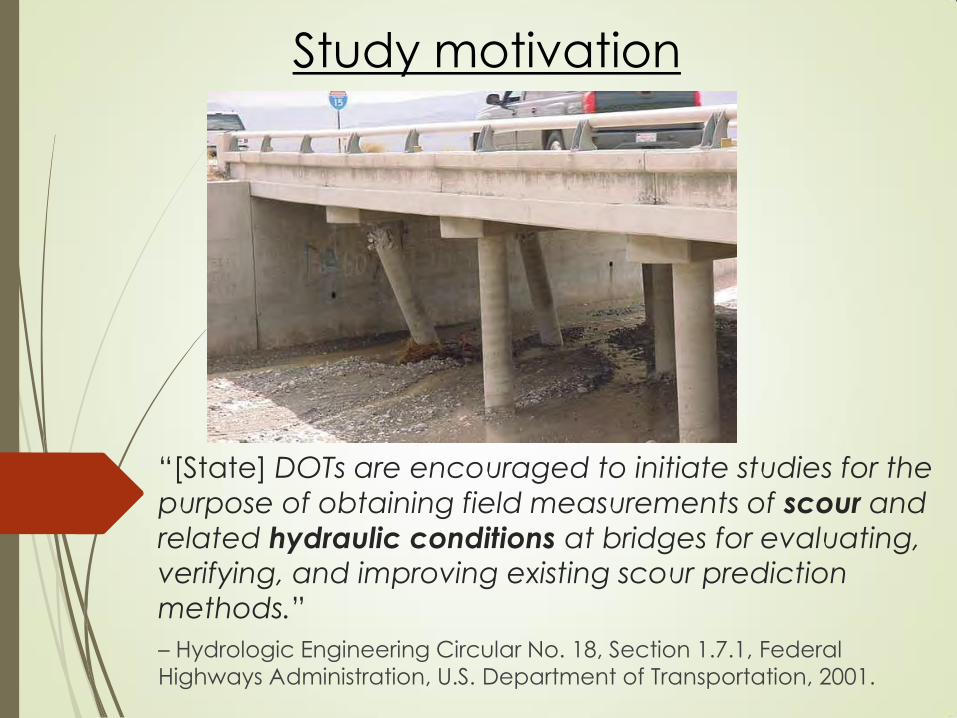
“[State] DOTs are encouraged to initiate studies for the
purpose of obtaining field measurements of scour and
related hydraulic conditions at bridges for evaluating, verifying, and improving existing scour prediction
methods.”
– Hydrologic Engineering Circular No. 18, Section 1.7.1, Federal Highways Administration, U.S. Department of Transportation, 2001.
Study motivation
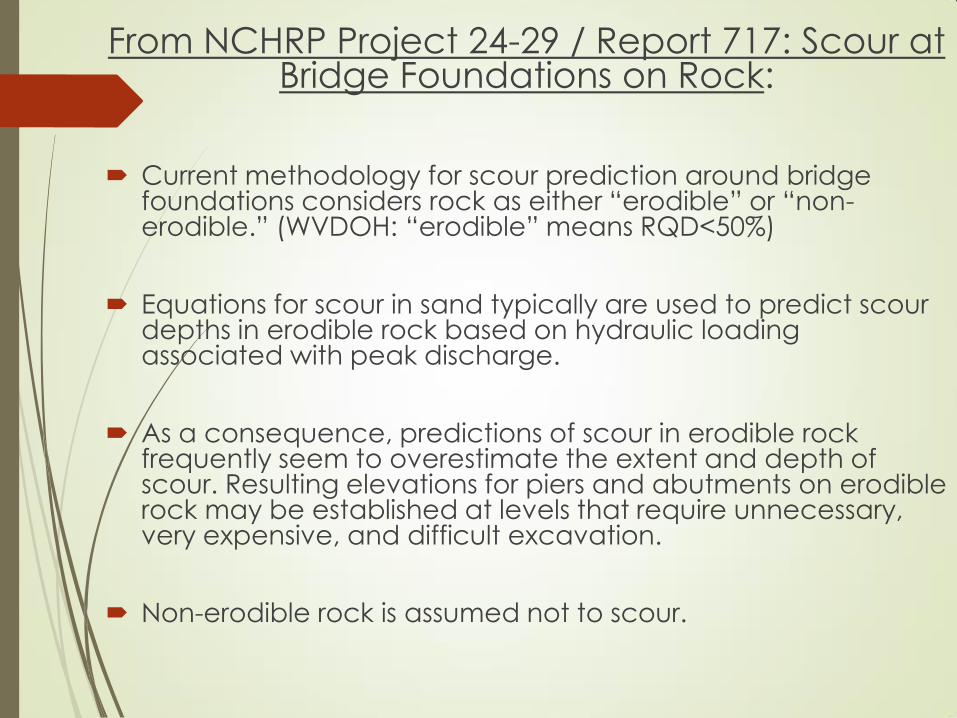
From NCHRP Project 24-29 / Report 717: Scour at Bridge Foundations on Rock:
Current methodology for scour prediction around bridge foundations considers rock as either “erodible” or “non-erodible.” (WVDOH: “erodible” means RQD<50%)
Equations for scour in sand typically are used to predict scour depths in erodible rock based on hydraulic loading associated with peak discharge.
As a consequence, predictions of scour in erodible rock frequently seem to overestimate the extent and depth of scour. Resulting elevations for piers and abutments on erodible rock may be established at levels that require unnecessary, very expensive, and difficult excavation.
Non-erodible rock is assumed not to scour.
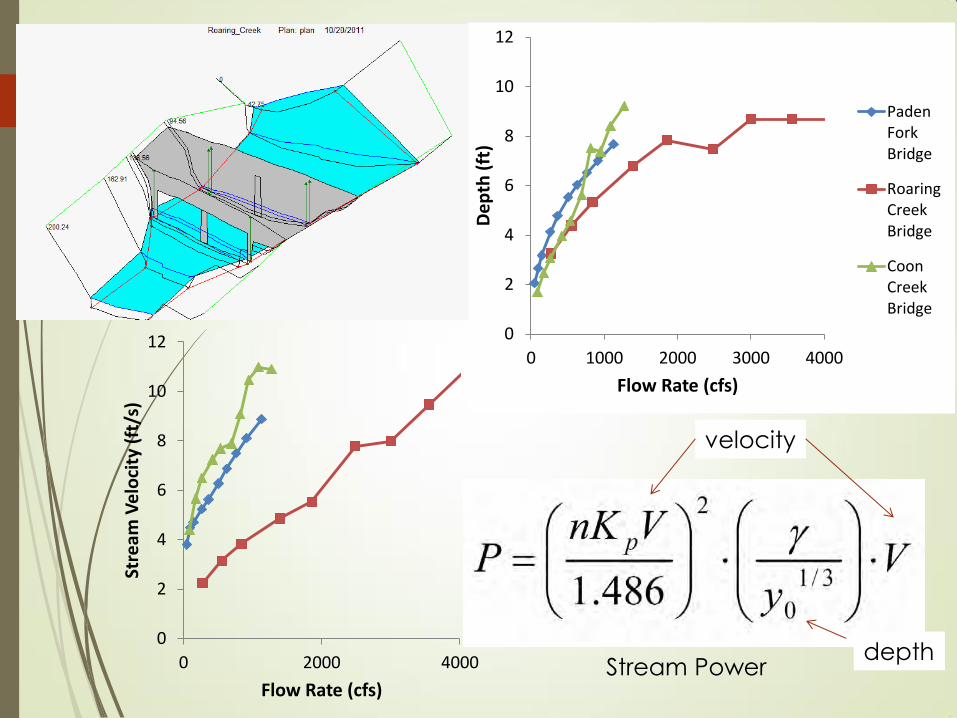
0
2
4
6
8
10
12
0 2000 4000
Stre
am V
elo
city
(ft
/s)
Flow Rate (cfs)
0
2
4
6
8
10
12
0 1000 2000 3000 4000
De
pth
(ft
)
Flow Rate (cfs)
PadenForkBridge
RoaringCreekBridge
CoonCreekBridge
Stream Power depth
velocity
Scour Number vs. GSN
Assessing scour of rock underlying abutments and piers at West
Virginia bridges
Background
Project Objectives and Tasks
Research Methods
Results
Application & Implementation
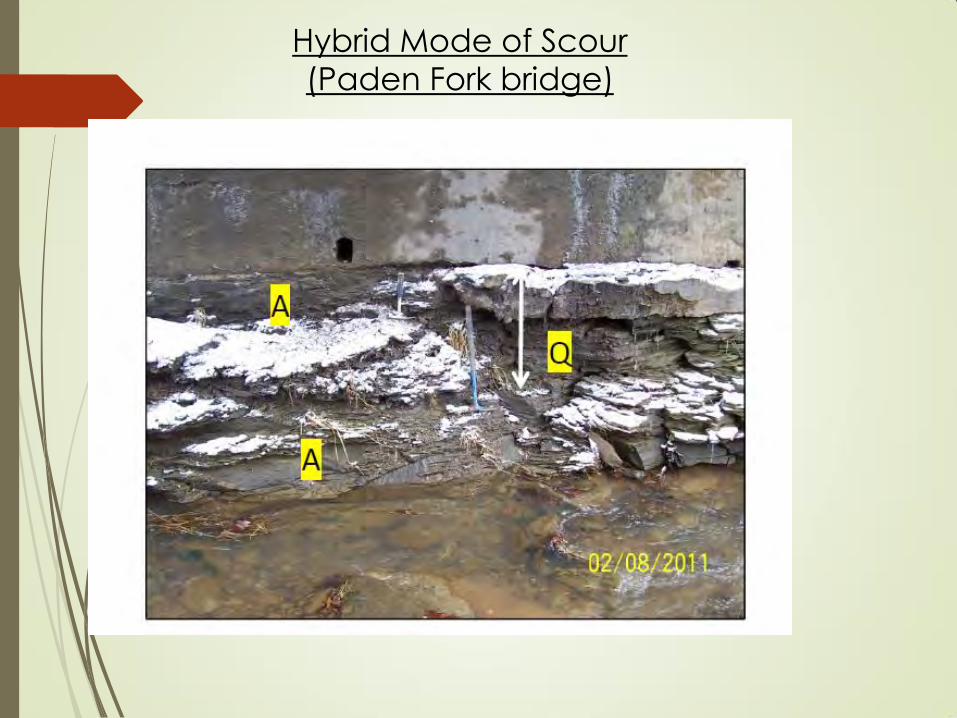
Hybrid Mode of Scour
(Paden Fork bridge)
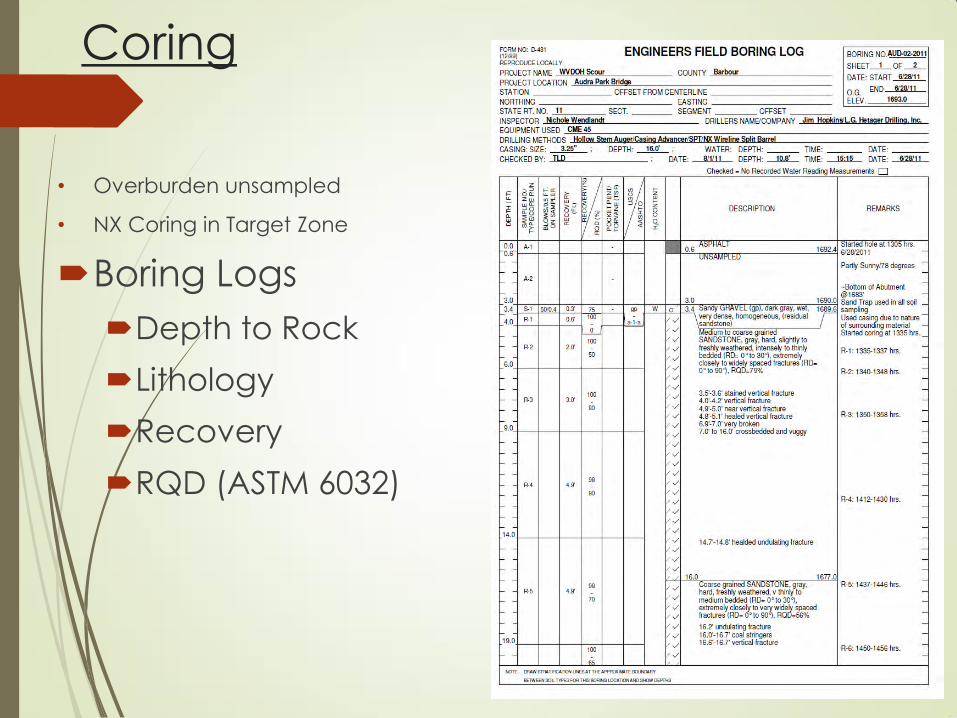
Coring
• Overburden unsampled
• NX Coring in Target Zone
Boring Logs
Depth to Rock
Lithology
Recovery
RQD (ASTM 6032)

Project Tasks
RP-273
1. Literature Review
2. Site Selection
3. Field and Lab Testing
4. Data Analysis
5. Reporting
Additional:
1. State Survey
2. Contract for Core Drilling
3. Best Management Practices
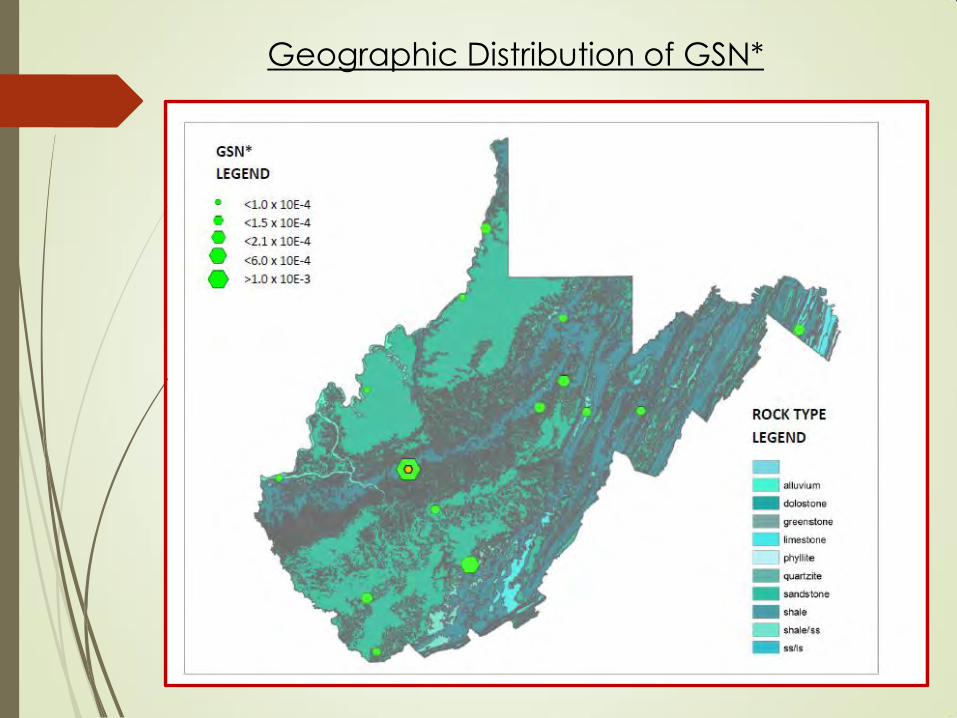
Geographic Distribution of GSN*
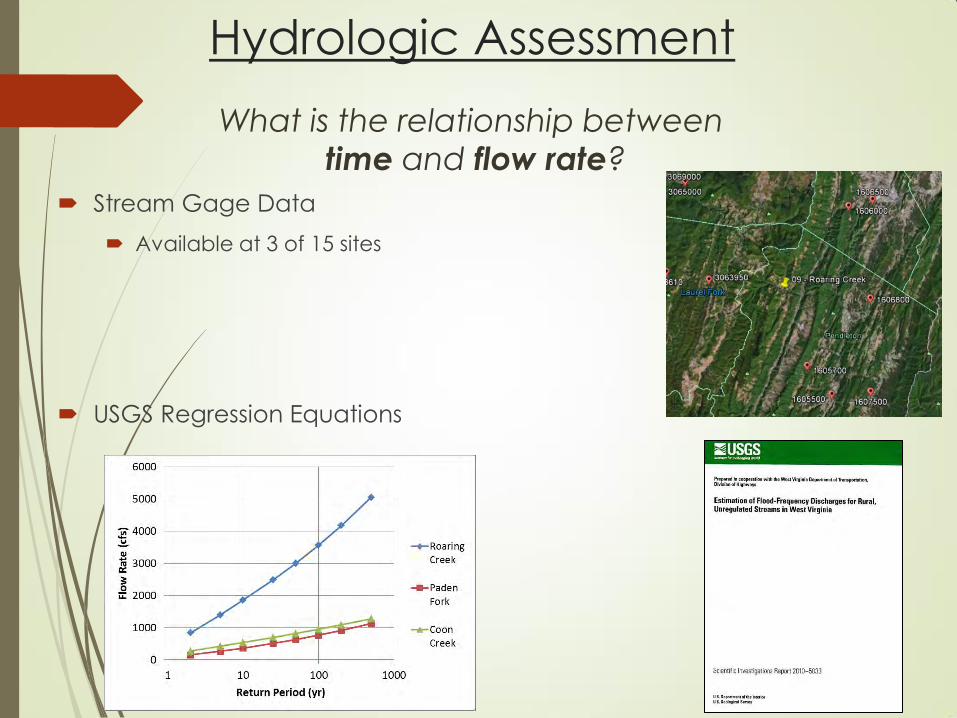
Hydrologic Assessment
Stream Gage Data
Available at 3 of 15 sites
USGS Regression Equations
What is the relationship between
time and flow rate?
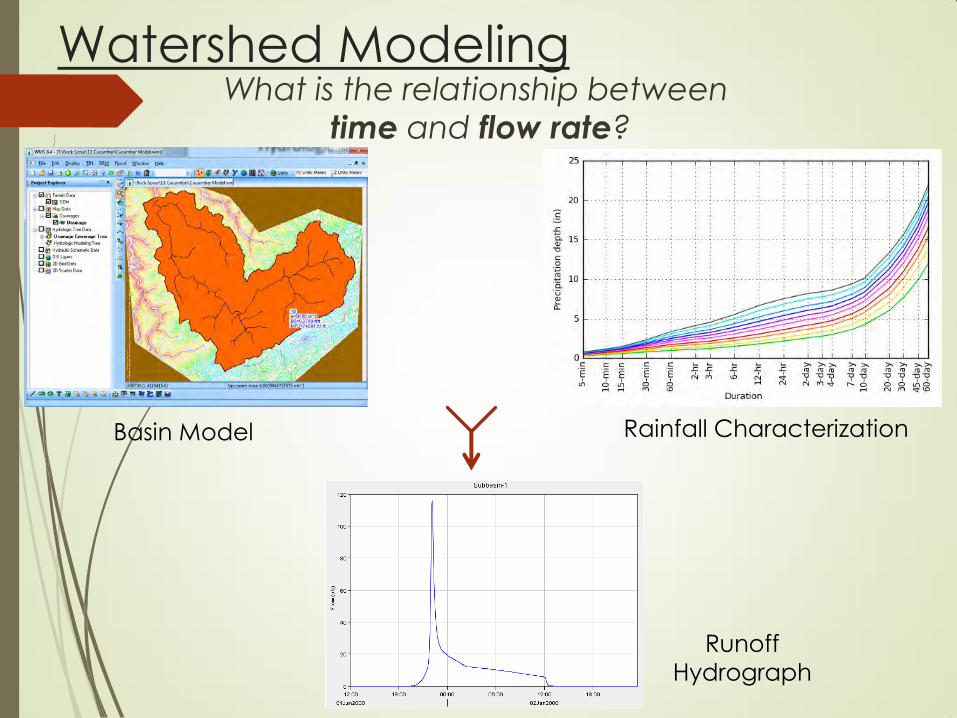
Watershed Modeling
Basin Model Rainfall Characterization
Runoff
Hydrograph
What is the relationship between
time and flow rate?
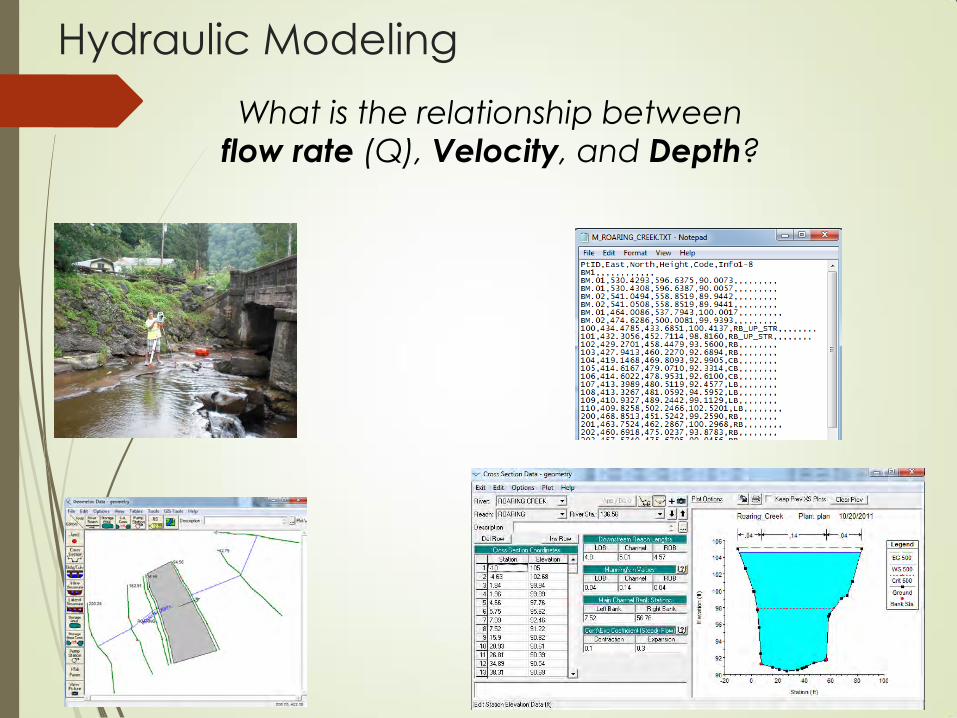
Hydraulic Modeling
What is the relationship between
flow rate (Q), Velocity, and Depth?
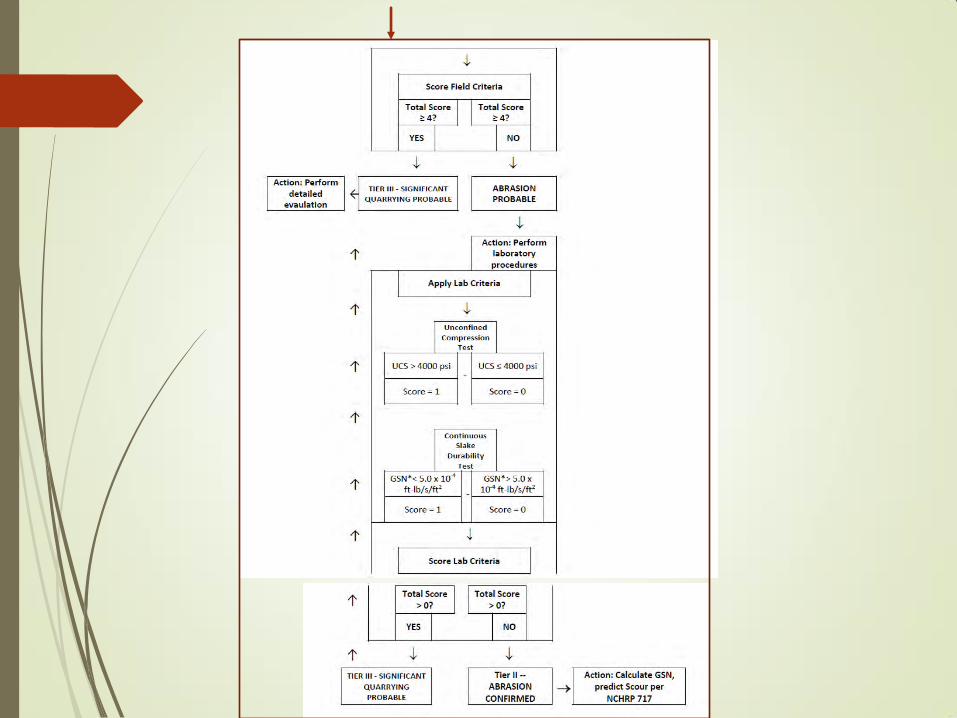
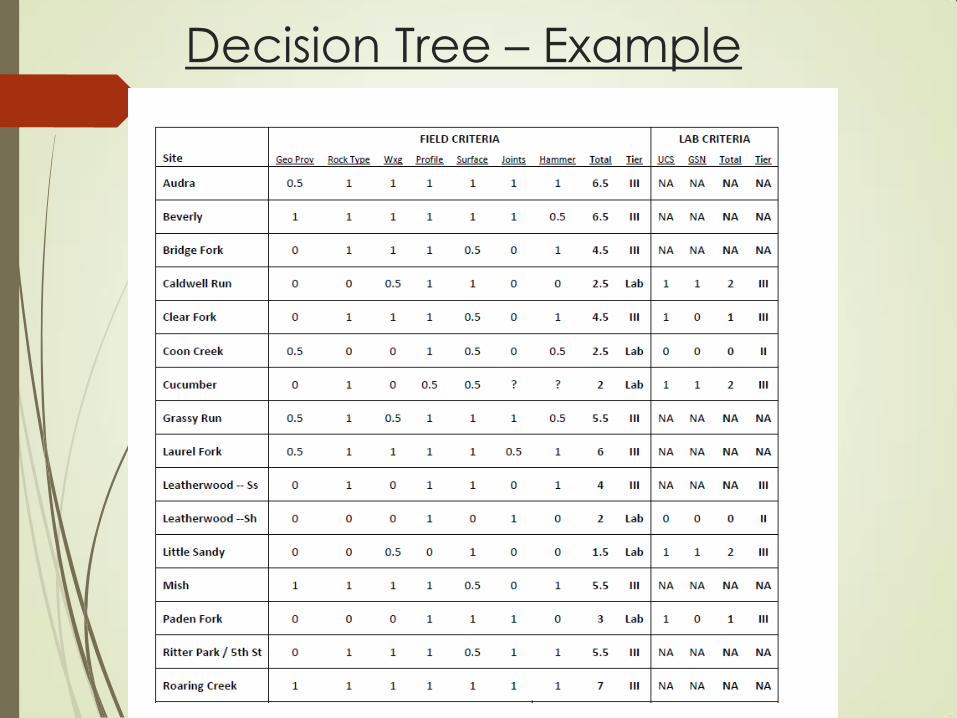
Decision Tree – Example
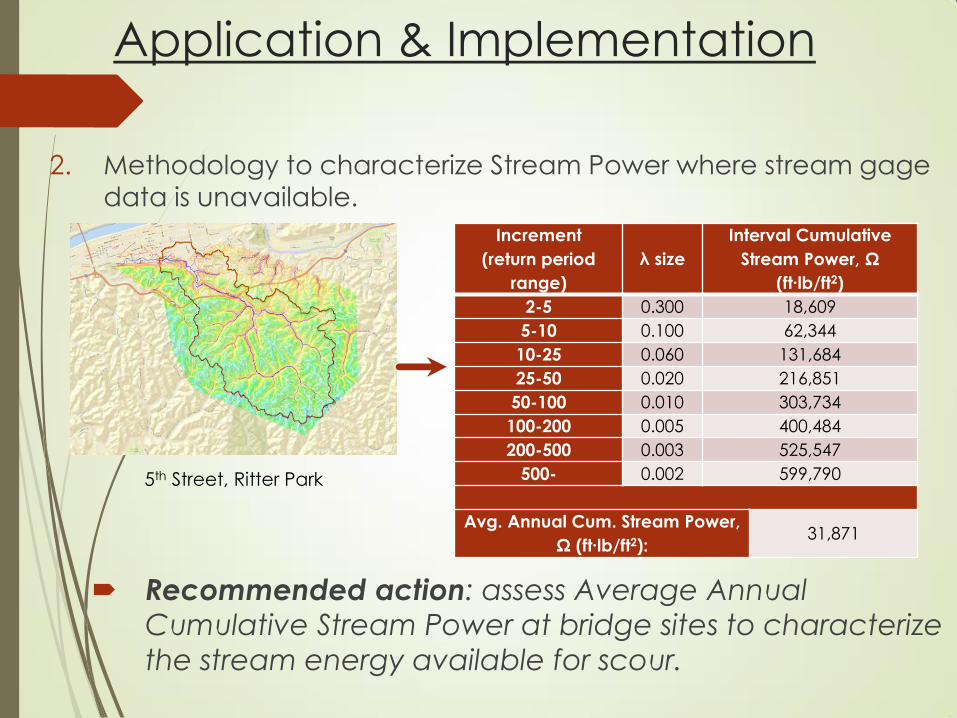
Application & Implementation
2. Methodology to characterize Stream Power where stream gage
data is unavailable.
Recommended action: assess Average Annual Cumulative Stream Power at bridge sites to characterize
the stream energy available for scour.
Increment
(return period
range)
λ size
Interval Cumulative
Stream Power, Ω
(ft∙lb/ft2)
2-5 0.300 18,609
5-10 0.100 62,344
10-25 0.060 131,684
25-50 0.020 216,851
50-100 0.010 303,734
100-200 0.005 400,484
200-500 0.003 525,547
500- 0.002 599,790
Avg. Annual Cum. Stream Power,
Ω (ft∙lb/ft2): 31,871
5th Street, Ritter Park
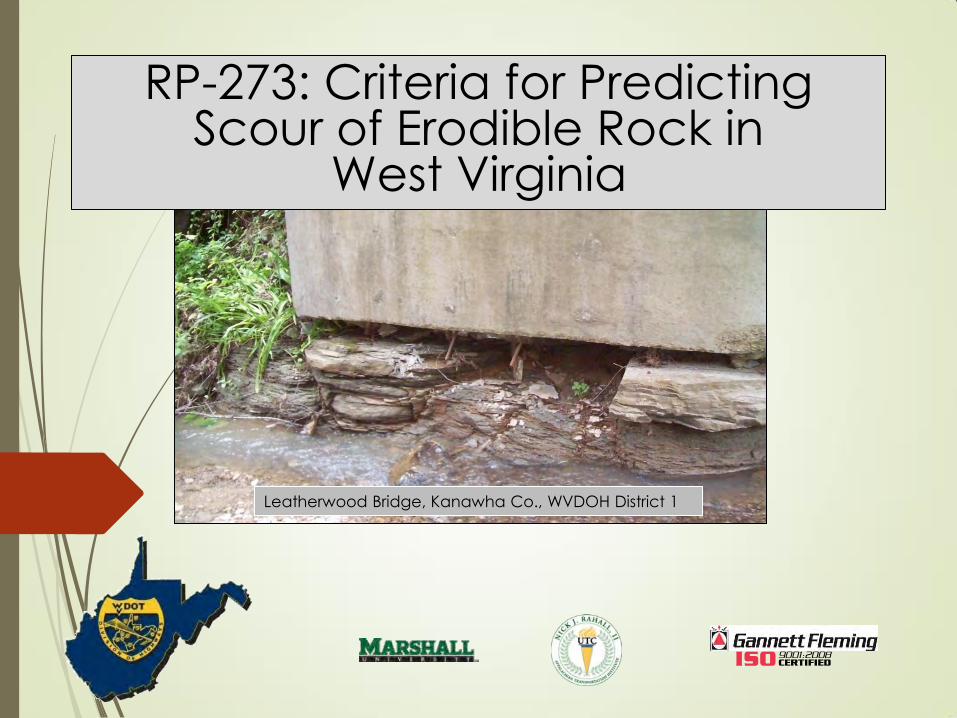
RP-273: Criteria for Predicting Scour of Erodible Rock in
West Virginia
Leatherwood Bridge, Kanawha Co., WVDOH District 1
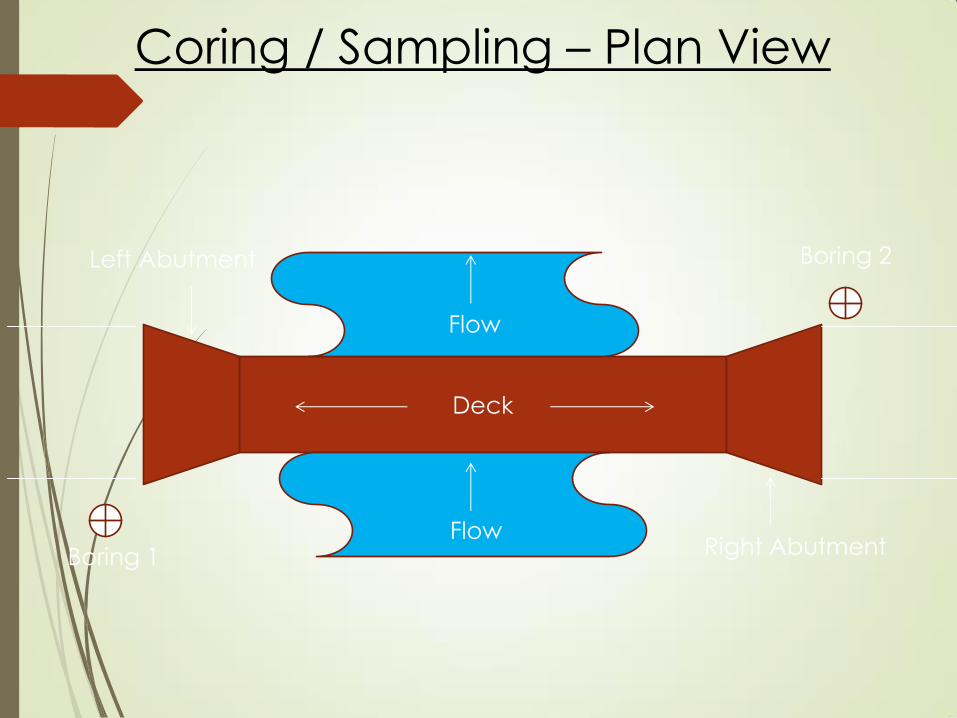
Deck
Left Abutment
Right Abutment Flow
Flow
Boring 1
Boring 2
Coring / Sampling – Plan View