Embed Size (px)
Citation preview
Florida International UniversityFIU Digital Commons
FIU Electronic Theses and Dissertations University Graduate School
7-10-2012
Assessing Sustainability of Sanitation TechnologiesRecommended for Rural Settings: A Case Study ofMorogoro District, TanzaniaAmour SelemanFlorida International University, [email protected]
DOI: 10.25148/etd.FI12080612Follow this and additional works at: http://digitalcommons.fiu.edu/etd
This work is brought to you for free and open access by the University Graduate School at FIU Digital Commons. It has been accepted for inclusion inFIU Electronic Theses and Dissertations by an authorized administrator of FIU Digital Commons. For more information, please contact [email protected].
Recommended CitationSeleman, Amour, "Assessing Sustainability of Sanitation Technologies Recommended for Rural Settings: A Case Study of MorogoroDistrict, Tanzania" (2012). FIU Electronic Theses and Dissertations. 690.http://digitalcommons.fiu.edu/etd/690

i
FLORIDA INTERNATIONAL UNIVERSITY
Miami, Florida
ASSESSING SUSTAINABILITY OF SANITATION TECHNOLOGIES
RECOMMENDED FOR RURAL SETTINGS: A CASE STUDY OF MOROGORO
DISTRICT, TANZANIA.
A thesis submitted in partial fulfillment of the
requirements for the degree of
MASTER OF SCIENCE
in
ENVIRONMENTAL STUDIES
by
Amour Seleman
2012
ii
To: Dean Kenneth Furton College of Arts and Sciences This thesis, written by Amour Seleman, and entitled Assessing Sustainability of Sanitation Technologies Recommended for Rural Settings: A Case Study of Morogoro District, Tanzania having been approved in respect to style and intellectual content is referred to you for judgment. We have read this thesis and recommend that it be approved.
______________________________________________
Raymond Scattone
_____________________________________________
Krishnaswamy Jayachandran
______________________________________________
Mahadev Bhat, Major Professor
Date of Defense: July 10, 2012 The thesis of Amour Seleman is approved.
______________________________________________ Dean Kenneth Furton
College of Arts and Sciences
_____________________________________________ Dean Lakshmi N. Reddi University Graduate School
Florida International University, 2012

iii
DEDICATION
I dedicate this thesis to my wife Shamila Mwanga and my children Sheila, Fadhila and
Fadhili in appreciation for all of their love, encouragement and patience.
iv
ACKNOWLEDGMENTS
I sincerely would like to thank my major professor, Dr. Mahadev Bhat, for his
guidance, advice and direction for the development of this work, and for my entire
academic program. I am very grateful to Dr. Krishnaswamy Jayachandran who in
addition to serving on my thesis committee provided me with valuable support
throughout my graduate program. I am also grateful to my committee member, Dr.
Raymond Scattone, for his insight and helpful advice.
I also acknowledge the United States Agency for International Development
(USAID) for granting me the scholarship and funding of this research. I’m indebted to
Kimberlee LeBlanc and Specioza Machume, the coordinators of the USAID Leadership
and Innovation Training Program. I am grateful to Dr. Maria Donoso, Dr. Elizabeth
Anderson, Vivienne Abbott, Dolores Dominguez and Ana Lemos for their assistance
through the Global Water for Sustainability Program (GLOWS) of the Florida
International University.
I would also like to thank all those who participated in this study either as sources
of information or data collection assistant, national sanitation and hygiene experts, staff at
Morogoro District, and the people of Changa, Fulwe, Kalundwa, Kinole and Mkuyuni
villages. Special thanks goes to Ally Msopa who helped with organizing the data
collection activity in the district.
Finally, I sincerely appreciate my parents Ahmad Seleman and Tusekile Matipula
for their love and prayers. I also extend my appreciation to the faculty, staff and all my
friends at FIU, who have been a source of inspiration throughout my stay here in Miami.
v
ABSTRACT OF THE THESIS
ASSESSING SUSTAINABILITY OF SANITATION TECHNOLOGIES
RECOMMENDED FOR RURAL SETTINGS: A CASE STUDY OF MOROGORO
DISTRICT, TANZANIA.
by
Amour Seleman
Florida International University, 2012
Miami, Florida
Professor Mahadev Bhat, Major Professor
The objectives of this study were to: assess the sanitation conditions and
sustainability of sanitation technologies, using a comprehensive framework of
sustainability indicators. A survey of 500 households and focus group discussions of 40
key informants were conducted in five villages. Ninety-six percent of the households had
toilets, with only 9.4% having improved toilets. A strong relationship existed between the
percent of sanitation coverage and the diarrhea incidence rates. Education and family
wealth were the two significant determinants of sanitation coverage. On the basis of the
sustainable development index, SanPlat and VIP latrine were the top two probable
sustainable technologies. Variation did exist in the rankings of sanitation technologies
across the study villages. Improvement in sanitation in rural Tanzania requires education
of people about its health benefits, proper training, and extension of rural health workers.
vi
TABLE OF CONTENTS CHAPTER PAGE
1.0 INTRODUCTION ................................................................................................... 1 1.1 Brief Background ................................................................................................. 1 1.2 Sanitation in Tanzania .......................................................................................... 1 1.3 Statement of the Problem ..................................................................................... 3 1.4 Objectives ............................................................................................................. 5 1.5 Significance of the Study ..................................................................................... 5
2.0 LITERATURE REVIEW ........................................................................................ 7
2.1 Introduction .......................................................................................................... 7 2.2 Foundation of Sanitation Practices ....................................................................... 7 2.3 Sanitation Systems ............................................................................................... 8 2.4 Demand for Sanitation Facilities .......................................................................... 9 2.5 Importance of Improving Sanitation .................................................................. 10 2.6 Interaction Between Sanitation, Hygiene and Water Supply ............................. 11 2.7 Monitoring Access to Improved sanitation ........................................................ 11 2.8 Access to Safe Drinking Water .......................................................................... 12 2.9 Theoretical Framework ...................................................................................... 12 2.9.1 Adoption of Appropriate Technology ................................................................ 12 2.9.2 Sustainability of Technology ............................................................................. 14 2.9.3 Sustainability of Sanitation Technologies .......................................................... 14 2.9.4 Sustainability of Sanitation Technologies in Tanzania ...................................... 16 2.9.5 Selection of Sustainable Sanitation Technologies ............................................. 16
3.0 METHODOLOGY ................................................................................................ 18
3.1 Introduction ........................................................................................................ 18 3.2 Research Questions ............................................................................................. 18 3.3 Hypotheses ......................................................................................................... 18 3.4 Study Area .......................................................................................................... 19 3.5 Chosen Sanitation Systems for Evaluation ........................................................ 20 3.6 Sampling Criteria ............................................................................................... 21 3.7 Subject Recruitment and Sample Size ............................................................... 22 3.8 Ethical Issues ...................................................................................................... 22 3.9 Study Design ...................................................................................................... 23 3.10 Household Survey .............................................................................................. 23 3.11 Assessing Socioeconomic Characteristics ......................................................... 25 3.12 Sustainability Assessment and Ranking of Technologies .................................. 25 3.12.1 Selecting and Grouping of Sustainability Criteria and Indicators...................... 26 3.12.2 Ascertaining Impact of Indicators ...................................................................... 27 3.12.3 Indicator Values ................................................................................................. 28 3.12.4 Weights of Indicators ......................................................................................... 28 3.12.5 Weights of Sustainability Criteria ...................................................................... 30 3.12.6 Checking Consistency of the Pair-Wise Matrix ................................................. 32
vii
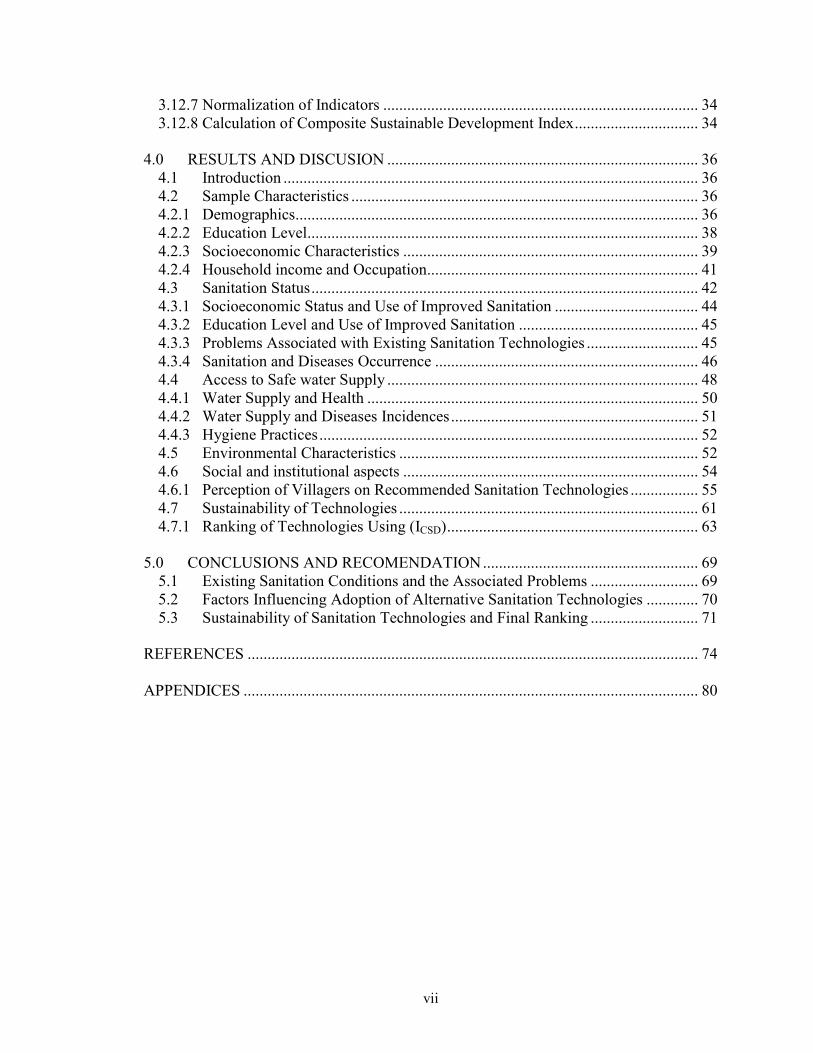
3.12.7 Normalization of Indicators ............................................................................... 34 3.12.8 Calculation of Composite Sustainable Development Index ............................... 34
4.0 RESULTS AND DISCUSION .............................................................................. 36
4.1 Introduction ........................................................................................................ 36 4.2 Sample Characteristics ....................................................................................... 36 4.2.1 Demographics..................................................................................................... 36 4.2.2 Education Level.................................................................................................. 38 4.2.3 Socioeconomic Characteristics .......................................................................... 39 4.2.4 Household income and Occupation.................................................................... 41 4.3 Sanitation Status ................................................................................................. 42 4.3.1 Socioeconomic Status and Use of Improved Sanitation .................................... 44 4.3.2 Education Level and Use of Improved Sanitation ............................................. 45 4.3.3 Problems Associated with Existing Sanitation Technologies ............................ 45 4.3.4 Sanitation and Diseases Occurrence .................................................................. 46 4.4 Access to Safe water Supply .............................................................................. 48 4.4.1 Water Supply and Health ................................................................................... 50 4.4.2 Water Supply and Diseases Incidences .............................................................. 51 4.4.3 Hygiene Practices ............................................................................................... 52 4.5 Environmental Characteristics ........................................................................... 52 4.6 Social and institutional aspects .......................................................................... 54 4.6.1 Perception of Villagers on Recommended Sanitation Technologies ................. 55 4.7 Sustainability of Technologies ........................................................................... 61 4.7.1 Ranking of Technologies Using (ICSD) ............................................................... 63
5.0 CONCLUSIONS AND RECOMENDATION ...................................................... 69
5.1 Existing Sanitation Conditions and the Associated Problems ........................... 69 5.2 Factors Influencing Adoption of Alternative Sanitation Technologies ............. 70 5.3 Sustainability of Sanitation Technologies and Final Ranking ........................... 71
REFERENCES ................................................................................................................. 74 APPENDICES .................................................................................................................. 80
viii
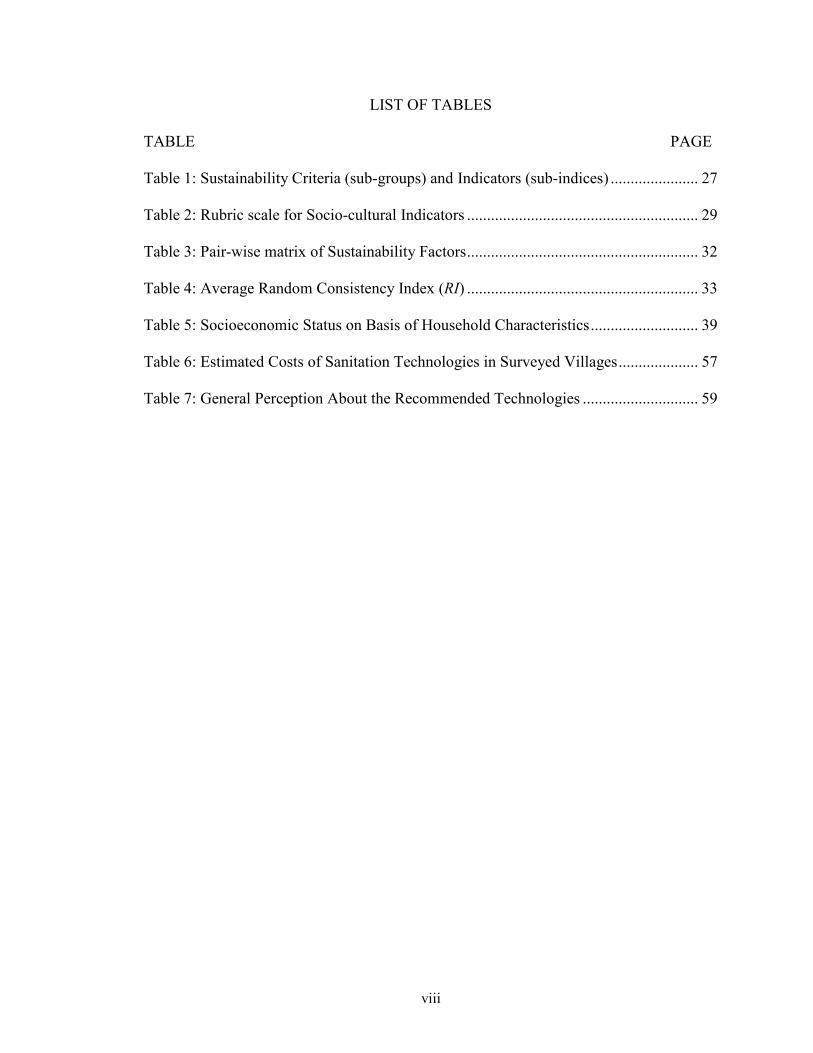
LIST OF TABLES
TABLE PAGE
Table 1: Sustainability Criteria (sub-groups) and Indicators (sub-indices) ...................... 27
Table 2: Rubric scale for Socio-cultural Indicators .......................................................... 29
Table 3: Pair-wise matrix of Sustainability Factors .......................................................... 32
Table 4: Average Random Consistency Index (RI) .......................................................... 33
Table 5: Socioeconomic Status on Basis of Household Characteristics ........................... 39
Table 6: Estimated Costs of Sanitation Technologies in Surveyed Villages .................... 57
Table 7: General Perception About the Recommended Technologies ............................. 59

ix
LIST OF FIGURES
FIGURE PAGE
Figure 1: Gender distribution in sampled villages ............................................................ 37
Figure 2: Distribution of education level of participants in surveyed villages ................. 38
Figure 3: Distribution of socioeconomic characteristics .................................................. 40
Figure 4: Sanitation coverage in sampled villages ........................................................... 43
Figure 5: Diarrhea incidence rates and coverage of improved sanitation ......................... 47
Figure 6: Diarrhea incidence and coverage of improved sanitation in study villages. ..... 48
Figure 7: Access to safe drinking water in surveyed villages ........................................... 49
Figure 8: Distribution of sources of safe drinking water in surveyed villages ................. 49
Figure 9: Access to safe drinking water and diarrhea incidence rates .............................. 52
Figure 10: People's preference on recommended sanitation technologies........................ 57
Figure 11: Willingness to pay and cost of sanitation technologies in surveyed villages .. 58
Figure 12: Ranking of sustainability factors using average weights ................................ 62
Figure 13: Ranking of sanitation technologies by ICSD in surveyed villages .................... 63
Figure 14: Ranking of sanitation technologies according to perception and ICSD ............ 64
Figure 15: Distribution of Is values among technologies in Kinole/Tandai village ......... 65
Figure 16: Distribution of Is values among sanitation technologies in Mkuyuni village . 67
Figure 17: Distribution of Is values among sanitation technologies in Kalundwa village 67
Figure 18: Distribution of Is values among sanitation technologies in Kinole village ..... 68
1
1.0 INTRODUCTION
1.1 Brief background
A sustainable sanitation technology protects human health and does not contribute
to environmental degradation or depletion of resource base (Kvarnstrom et al., 2004).
Such a sanitation method must be technically feasible, economically viable and socially
acceptable. The World Health Organization and United Nations Children’s Fund called
for promoting improved sanitation instead of simple latrines in 2004 (UN WWAP, 2006).
By 2010, many developing countries had large populations with limited access to
improved sanitation technologies (UN 2010). In Tanzania for example, only 22% of
urban population and 9% of rural population adopted improved sanitation facilities by
2010 (NBS, 2010). Health officials and planners often grapple with the question why the
adoption of improved and sustainable sanitation technologies has been slow in the
developing world. There is no clear understanding whether and under what
circumstances improved sanitation technologies receive public acceptance. The present
study is an attempt to assess the feasibility and sustainability of alternative sanitation
technologies in the context of Tanzania, using a comprehensive framework of
sustainability indicators, representing environmental, health and socio-economic
elements.
1.2 Sanitation in Tanzania
The popularity of sanitation in Tanzania traces its history back to the 1970s
during the famous health campaign, Mtu ni Afya (Man is Health), or simply cleanliness
campaign (Hall, 1978). The campaign involved the most common activity of digging of
2
toilets, along with other measures such as the use of mosquito nets and destruction of
mosquito breeding sites. The success of this campaign was in part the result of the
freedom given to households to choose whether to build a toilet or not. People were only
informed of the importance of having a toilet (“uchaguzi ni wako”- it is your choice)
without being forced to adopt one. Behind the success of the campaign was the control
of diseases, which was one of the three national priorities among other ignorance and
poverty reduction. The proportion of population with access to sanitation facilities
increased significantly during the campaign, although the standard set for toilets were not
reached by the majority of users (Hall, 1978).
Under the Health Policy of 2007, the government of Tanzania formulated
guidelines, laws and standards for improved sanitation systems which are implemented
through health education and enforcement of the public health laws. Although these
regulations were passed, it was at a time when the sanitation sub sector still faced a
number of challenges. Sanitation and hygiene still receive a low priority by potential
users and decision makers (MoHSW, 2009). In many cases this challenge is associated
with income and the expenditure pattern of households. More emphasis has been placed
on public education and healthcare rather than improving sanitation infrastructure
throughout the country. The lack of emphasis on the latter has been further exacerbated
by blurred demarcation of roles and mandates by key public sectors. Furthermore, the
number of people in need of improved sanitation is large; by 2010 about 90% of rural and
78% of urban residents still used unimproved sanitation technologies (NBS, 2010).
The government of Tanzania has adopted the Joint Monitoring Program (JMP) of
the WHO and UNICEF proposed alternative types of improved sanitation technologies.
3
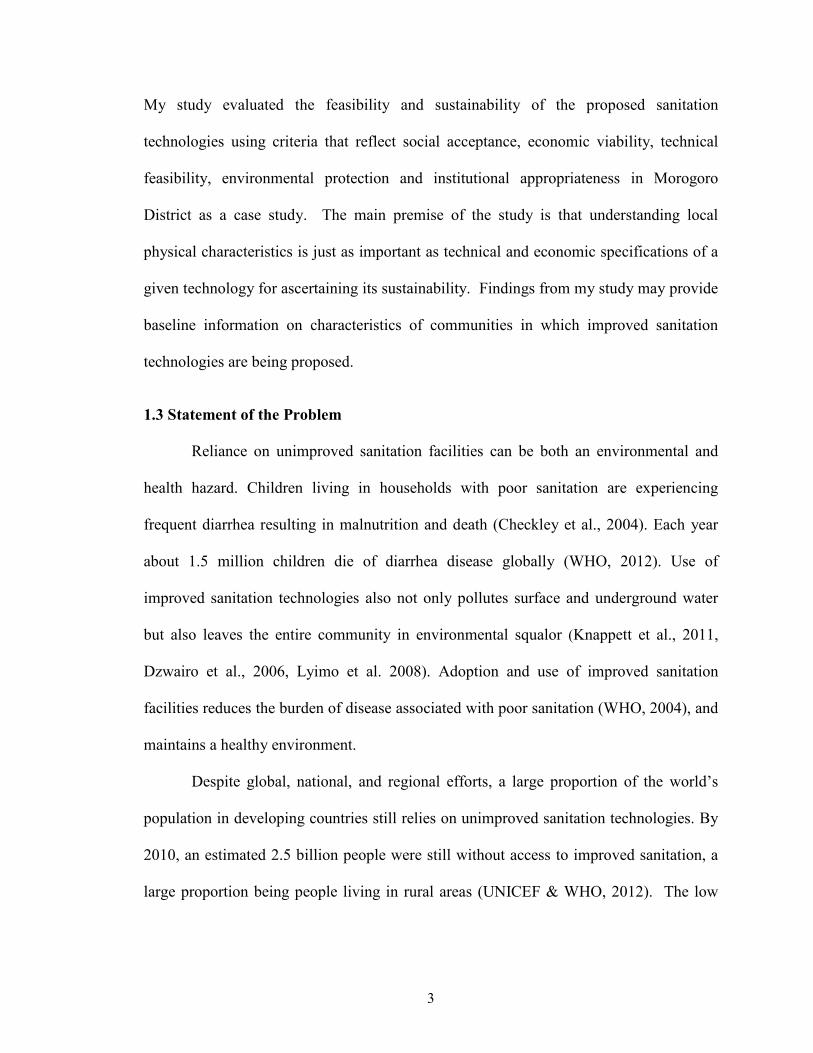
My study evaluated the feasibility and sustainability of the proposed sanitation
technologies using criteria that reflect social acceptance, economic viability, technical
feasibility, environmental protection and institutional appropriateness in Morogoro
District as a case study. The main premise of the study is that understanding local
physical characteristics is just as important as technical and economic specifications of a
given technology for ascertaining its sustainability. Findings from my study may provide
baseline information on characteristics of communities in which improved sanitation
technologies are being proposed.
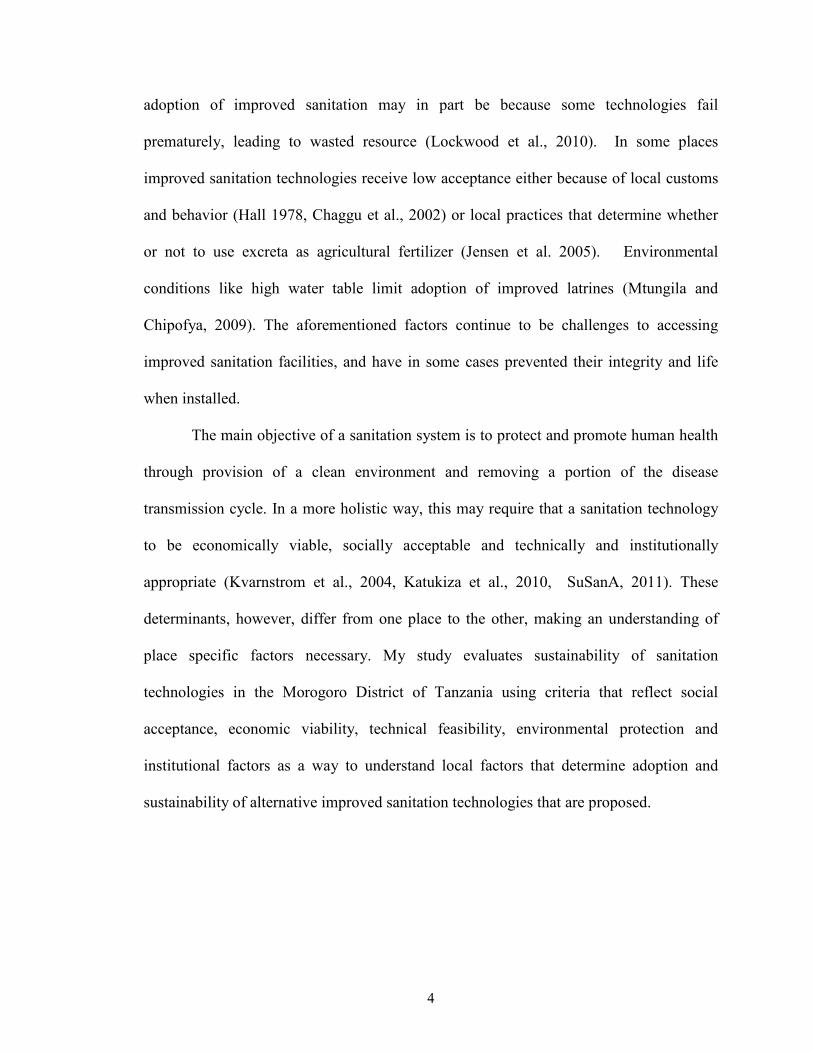
1.3 Statement of the Problem
Reliance on unimproved sanitation facilities can be both an environmental and
health hazard. Children living in households with poor sanitation are experiencing
frequent diarrhea resulting in malnutrition and death (Checkley et al., 2004). Each year
about 1.5 million children die of diarrhea disease globally (WHO, 2012). Use of
improved sanitation technologies also not only pollutes surface and underground water
but also leaves the entire community in environmental squalor (Knappett et al., 2011,
Dzwairo et al., 2006, Lyimo et al. 2008). Adoption and use of improved sanitation
facilities reduces the burden of disease associated with poor sanitation (WHO, 2004), and
maintains a healthy environment.
Despite global, national, and regional efforts, a large proportion of the world’s
population in developing countries still relies on unimproved sanitation technologies. By
2010, an estimated 2.5 billion people were still without access to improved sanitation, a
large proportion being people living in rural areas (UNICEF & WHO, 2012). The low
4
adoption of improved sanitation may in part be because some technologies fail
prematurely, leading to wasted resource (Lockwood et al., 2010). In some places
improved sanitation technologies receive low acceptance either because of local customs
and behavior (Hall 1978, Chaggu et al., 2002) or local practices that determine whether
or not to use excreta as agricultural fertilizer (Jensen et al. 2005). Environmental
conditions like high water table limit adoption of improved latrines (Mtungila and
Chipofya, 2009). The aforementioned factors continue to be challenges to accessing
improved sanitation facilities, and have in some cases prevented their integrity and life
when installed.
The main objective of a sanitation system is to protect and promote human health
through provision of a clean environment and removing a portion of the disease
transmission cycle. In a more holistic way, this may require that a sanitation technology
to be economically viable, socially acceptable and technically and institutionally
appropriate (Kvarnstrom et al., 2004, Katukiza et al., 2010, SuSanA, 2011). These
determinants, however, differ from one place to the other, making an understanding of
place specific factors necessary. My study evaluates sustainability of sanitation
technologies in the Morogoro District of Tanzania using criteria that reflect social
acceptance, economic viability, technical feasibility, environmental protection and
institutional factors as a way to understand local factors that determine adoption and
sustainability of alternative improved sanitation technologies that are proposed.

5
1.4 Objectives
The overall goal of my study was to assess sustainability of sanitation technologies as
recommended for rural areas based on a case study of Morogoro District specifically:
• To assess the existing sanitation conditions and the associated health,
environmental and socio-economic problems in the study area;
• To determine the physical, environmental, and socio-economic characteristics
as well as institutional factors influencing the adoption of alternative
sanitation technologies; and
• To rank sanitation technologies based on composite sustainable development
index values.
1.5 Significance of the study
In order for a sanitation technology program to be successful both locally and
nationally, it is important for one to understand the inter-play of various physical and
socio-economic factors, which ultimately determine the degree of technology adoption.
The real challenge is that these factors vary widely across different parts of the country.
The sustainability indicator framework developed in my study will serve as an objective
tool for systematically comparing a range of technology options for areas with diverse
environmental and socio-economic characteristics. Policy makers can rank available
sanitation options for each district or village and then target their monetary and technical
efforts to promoting only those technologies that are most likely to succeed in each and
every district.
6
The results of this study may have significant contribution to countries like Tanzania
that implement nationwide sanitation program. With a case study of the Morogoro
District, the findings will provide baseline information on characteristics of rural
communities and feasible sanitation facilities suitable for rural settings.
7
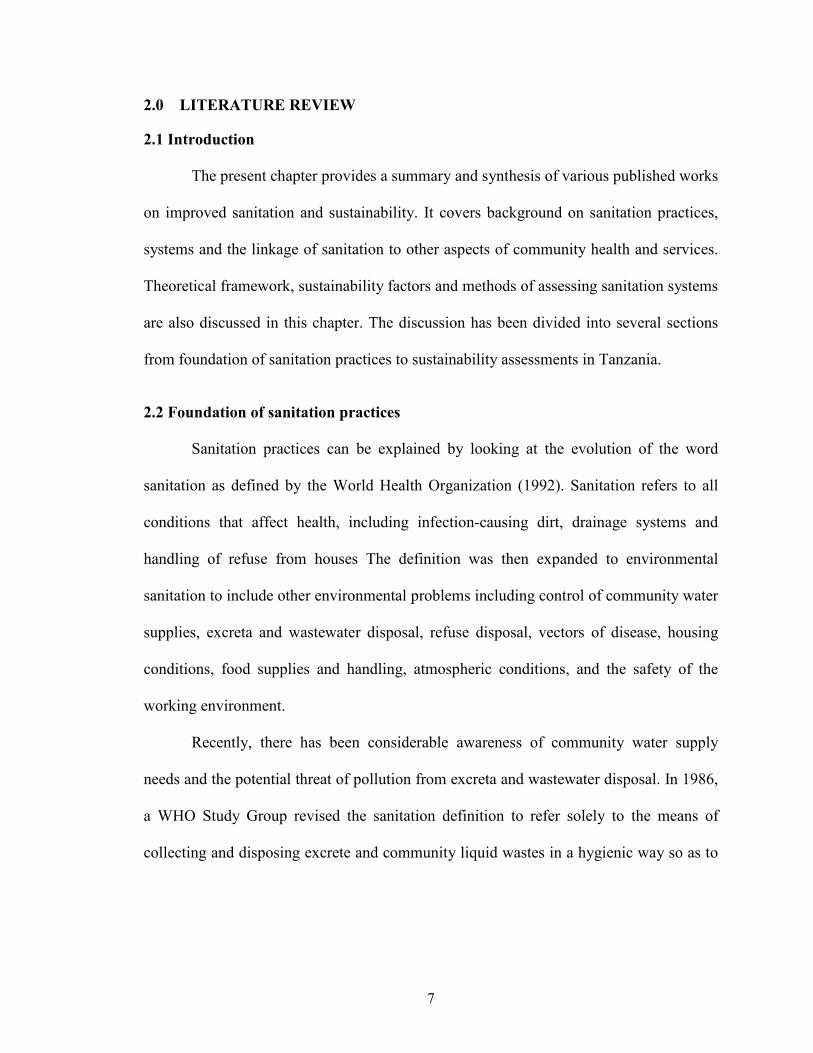
2.0 LITERATURE REVIEW
2.1 Introduction
The present chapter provides a summary and synthesis of various published works
on improved sanitation and sustainability. It covers background on sanitation practices,
systems and the linkage of sanitation to other aspects of community health and services.
Theoretical framework, sustainability factors and methods of assessing sanitation systems
are also discussed in this chapter. The discussion has been divided into several sections
from foundation of sanitation practices to sustainability assessments in Tanzania.
2.2 Foundation of sanitation practices
Sanitation practices can be explained by looking at the evolution of the word
sanitation as defined by the World Health Organization (1992). Sanitation refers to all
conditions that affect health, including infection-causing dirt, drainage systems and
handling of refuse from houses The definition was then expanded to environmental
sanitation to include other environmental problems including control of community water
supplies, excreta and wastewater disposal, refuse disposal, vectors of disease, housing
conditions, food supplies and handling, atmospheric conditions, and the safety of the
working environment.
Recently, there has been considerable awareness of community water supply
needs and the potential threat of pollution from excreta and wastewater disposal. In 1986,
a WHO Study Group revised the sanitation definition to refer solely to the means of
collecting and disposing excrete and community liquid wastes in a hygienic way so as to
8
protect health of individuals and the community as a whole (WHO, 1992). The later
definition of sanitation is adopted in this study.
2.3 Sanitation systems
Sanitation systems can be divided into two categories, ‘onsite’ and ‘offsite’
systems. Onsite sanitation systems deal with human excreta at the point of generation
(e.g., the household level). Onsite sanitation can further be classified into two main
categories: wet system which requires water for flushing and dry system which does not
require water for flushing. Onsite sanitation systems include pit latrines, septic tanks and
other household level technologies that do not involve sewerage (IRC, 2012).
Offsite sanitation systems transport human excreta to another location for
treatment, disposal or use. Offsite sanitation can also be further classified into two main
categories of ‘decentralized’ and ‘centralized’ systems. Decentralized systems include
systems in which groups of two or more houses are linked to a (small bore sewer)
network leading to a communal treatment system whereas centralized systems consist of
wastewater systems serving one or several communities. In most cases, decentralized
systems represent an appropriate technological option for urban areas that face problems
with high population density, but where financing capability limits acquisition of larger
centralized treatment systems (IRC, 2012). In the developing world, for example,
sewerage sanitation systems are impractical because of high investment and operation
costs (Mara et al., 2007). On-site sanitation options with low operation and maintenance
costs remain the most appropriate particularly for rural and unplanned settlements
(Nelson and Murray, 2008).
9
2.4 Demand for sanitation facilities
There is an equal demand for hygienic disposal of excreta and the promotion of
health in both rural and urban areas of the developed and developing world. The rural
parts of developing countries however, present high demands for improved sanitation
(Hoko & Hertle, 2006., UN, 2010). High demand of sanitation in rural areas of
developing countries may be a result of a majority of the population (75%) living in rural
areas (Hoko and Hertle, 2006). Furthermore access to healthcare in rural areas is always
limited as such impact of poor sanitation on community health may be higher (Global
Alliance for Community Development, 2012).
Disparity in access to improved sanitation between urban and rural settings is still
daunting at international and national levels; by 2010 about half of the developing
world’s populations were using improved sanitation yet only 40% of rural populations
had access to improved sanitation technology (UN, 2010). In mainland Tanzania, in the
same year - 2010 - access to improved sanitation was 35% in urban and 23% in rural
areas. The coverage of improved sanitation in rural area might continue to be behind
urban coverage for national targets to improve sanitation in rural - in a period of five
years (2010 to 2015) – is set lower than urban targets. In the National Strategy for
Growth and Poverty Reduction II 2010, the plan is to increase coverage in rural from
23% in 2010 to 35% in 2015, where as in urban, the target to reach is 45% from 27% in
the same period.
10
2.5 Importance of improving sanitation
Human excreta is associated with various diseases, especially gastrointestinal
diseases and helminth infections. The overall objective of improving sanitation is to
hygienically separate humans from contact with feces. Inadequate and insanitary
handling of human feces can lead to ground pollution, contamination of water sources,
and contamination of surfaces that come in contact with humans. Insanitary disposal of
human feces also provides habitat for disease transmitting vectors like flies and
mosquitoes. Intolerable nuisances of both odor and sight may also be experienced when
excreta are insanitary disposed of.
Inadequate and insanitary handling of human feces leads to pollution of the
ground, contamination of water sources and other surfaces that human come into contact
with, and exposure to disease causing organisms. Insanitary disposal of human feces also
provides habitat for disease transmitting vectors like flies and mosquitoes. Intolerable
nuisances of both odor and sight may also be experienced when excreta are insanitary
disposed of.
Fecal-oral related diseases often manifest in diarrhea (Thomas & Weber, 2001).
As such, diarrhea is an indicator of poor sanitation and a measure used to ascertain the
impact of using proper sanitation facilities. Access to improved sanitation can reduce
diarrhea morbidity by 32% (WHO, 2004). As hygiene is part of proper sanitation,
washing hands may lead to reduction of diarrhea disease by 45% (WHO, 2004). Many of
the fecal -related diseases affect children in particular, it is estimated that each year,
diarrheal disease kills 1.5 million children (WHO, 2012).
11
2.6 Interaction between sanitation, hygiene and water supply
In achieving the goal of protecting humans from contact with excreta, sanitation
technology offers a means for proper disposal of human excreta. Hygiene practices like
hand washing with running water and soap ensure breakage of transmission routes of
excreta related diseases. Even though the three components namely, sanitation, hygiene
and water supply can be taken as individual packages of interventions, public health
benefit is realized when the three are integrated (Eisenberg et al., 2007). In principle,
benefits of water quality intervention are masked if sanitation conditions and hygiene
practices are poor (Eisenberg et al., 2007).
The relationship between sanitation, hygiene and water supply, nonetheless,
remains to be an area of further research (Howard and Bartram, 2003). Quantity of water
adequate to achieve proper hygiene per capita per day has not been determined. The
volume of water used by households depends on accessibility defined in terms of service
level which is determined primarily by distance, time, reliability and potentially cost
(Howard and Bartram, 2003). Requirements for water supply service levels can thus be
categorized as no access, basic access, intermediate access and optima access.
2.7 Monitoring access to improved sanitation
The Joint Monitoring Program (JMP) of the WHO/UNICEF defines access to
sanitation as proportion of people with access to either of the following improved
sanitation technologies: flush/pour flush toilet connected to piped sewer system or septic
tank or pit (latrine), ventilated improved pit latrine, pit latrine with slab or composting
12
toilet. The above technologies hygienically separate human excreta from human contact
(WHO/UNICEF-JMP, 2010).
Access to sanitation is expressed in terms of proportional of people with access to
proper sanitation. The data on access is a representative of number of households that use
improved sanitation systems. The definition of households however varies (Leone et al.,
2010). My study adopted a the Tanzania National Bureau of Statistics (NBS) definition
that define household as a person or group of persons, related or unrelated who live
together and share a common source of food.
2.8 Access to safe drinking water
A community is regarded as having access to safe drinking water if it obtains water
from improved sources, a source that, by nature of its construction or through active
intervention, is protected from outside contamination, in particular from contamination
with fecal matter (WHO/UNICEF-JMP, 2010). As such traditional sources like rivers,
ponds, and unprotected springs are excluded from the list of sources of a supply of safe
water.
2.9 Theoretical framework
2.9.1 Adoption of appropriate technology
Planners often grapple with the question why the adoption of sanitation
technologies is slow especially in the developing world. There exists a vast literature on
the concept and practice of ‘appropriate technology’ that would shed some light on this
question. Diwan et al., (1979) notes that the appropriate technology sometimes refers to
an entire social movement that leads to the adoption of a collection of hardware (such as
13
machines, products, infrastructures-roads, water distribution system) and/or to the design
alternatives presumably responsive to the ideology of that movement. For instance, the
Gandhian movement of promoting small-scale, cottage industries in India was an
example of appropriate technology. According to Jequier and Gerard (1993), appropriate
technologies are generally characterized by one or more of the following features: (i) low
investment cost per work place; (ii) low capital investment per unit of output; (iii)
organizational simplicity; (iv) high adaptability to a particular social cultural
environment, (v) sparing use of natural resources; and (vi) low cost of final product or
high potential for employment. Therefore, the improved sanitation technologies to be
appropriate and successful in rural Tanzania will first have to meet the above broad
characteristics.
When a new technology is introduced into an area, the adoption will be slow until
that region reaches a level of development that can take advantage of the technology
being introduced (Basu and Weil, 1998). Further, slow adoption of technology is brought
about by the barriers that lead to increased cost of technology adoption. Consequently, a
technology will diffuse in an area only when barriers to adoption are reduced (Parente
and Prescott, 1994).
One way to facilitate technology transfer is through identifying barriers for its
adoption. Understanding local constrains on introduction of a technology through trial
and error technique and devising of a mechanism that facilitates a two way exchange of
information between user and designer of the technology are essential. In such a system,
users provide feedback on the performance of introduced technology. Such feedback is
used to redesign or in other ways to improve the technology in order to increase users’
14
satisfaction (Murphy et al., 2009). This study is an attempt to understand local problem
and ascertaining the most probable technology that can be introduced. Assessing a
technology appropriate to an area is not a straightforward process; one must consider
available resources, local preference, time, and place (Murphy et al., 2009).
2.9.2 Sustainability of technology
Increased concern about availability of resources in the future shapes the way a
technology is regarded as an appropriate. Van der Vleuten-Balkema (2003) in Malisie A.
(2008) considers sustainable technology as technology that does not threat the quantity
and quality of the resources and have the lowest cost with respect to the physical,
sociocultural and economic environments. Equally important is to recognize the
importance of sustainability of services provided by the technology itself otherwise an
appropriate technology may turn to be environmental and health hazard to present and
future generations (Malisie A, 2008).
2.9.3 Sustainability of sanitation technologies
The sustainability of sanitation technology has two meanings: environmentally
sustainability and locally sustainability (Murphy et al., 2009). The first implies the
system that does not cause significant harm to the environment and allows current needs
to be met without compromising the needs of the future generations. Local sustainability
of technology implies ability of local users to maintain, reproduce and repair the newly
introduced sanitation technology after outside designers have left the community
(Murphy et al., 2009).
15
Assessment of sustainability of sanitation technology takes into consideration
both meanings of sustainability. Environmental sustainability and local sustainability as a
result become part of the four fundamental principles of sustainable sanitation
technology. The four fundamental principles of sustainability are human health
protection, affordability, environmental sustainability and institutional appropriateness
(Mara et al., (2007).
Sustainability criteria are the set of criteria that facilitate evaluation of
technologies to ascertain their sustainability. The four principles of sustainability lay a
foundation for developing sustainability criteria. Thus sustainable sanitation technology
can be defined as the technology that protects and promotes human health, protects the
environment from degradation or depletion of the resource base, is technically and
institutionally appropriate, economically viable and socially acceptable (Kvarnstrom et
al., 2004, Katukiza et al., 2010, SuSanA, 2011). The characteristics of sustainable
sanitation included in the definition forms set of criteria upon which sanitation
technologies are assessed.
It is considered that, sanitation arrangements, if properly designed, implemented,
operated and maintained, can improve community health (Feachem et al.., 1983), as a
result during assessment the health aspect criterion is either imbedded in environmental
protection criteria (Katukiza, et al. 2007) or is left un mentioned (Mara et el, 2007). The
assessment is then done using four criteria of affordability, socio-cultural acceptability,
technical feasibility and environmental impact and reuse potential (Mara et al., 2007). I
use the same categorization in my research.
16
2.9.4 Sustainability of sanitation technologies in Tanzania
There are few published works on sustainability of sanitation technologies in
Tanzania. Chaggu et al. (2002) assessed socio-cultural and socioeconomic situations with
regard to excreta disposal in the most urbanized city of Tanzania, Dar es Salaam. The
study revealed that habitual behavior hinders the use of new technologies like ecological
sanitation. A study conducted by Lyimo et al. (2007) on community awareness on
microbial water pollution and its effects on health development in urban Tanzania, found
that fecal contamination of wells is high which is largely the result of the use of pit
latrines. Igulu (2010) found that advocacy for proper sanitation will have significant
impact in reduction of diarrhea in children less than five years old. A majority of
sanitation-related studies were conducted only in urban areas (e.g., Dar es Salaam). Also,
these studies did not address whether alternative sanitation technologies are likely to
solve existing problems sustainably. In 2003, WaterAid-Tanzania in collaboration with
London School of Hygiene studied determinants of sustainable sanitation in Dodoma
district; the study assessed factors affecting sustained adoption of any type of toilets
(McCubbin N.C., 2007). My study in hand assessed sustainability of alternative types of
improved toilets recommended for rural setting and came up with a rank of sanitation
technologies according to sustainability index.
2.9.5 Selection of sustainable sanitation technologies
Selection of sustainable sanitation technology especially in developing countries
is a complex process for communities are socio-economically inhomogenous (Loetscher
and Keller, 2002). In such environment, technology selection may require consideration

17
of several criteria in an algorithms or any other decision aids approach until the most
feasible technology is identified (Loetscher and Keller, 2002., Mara et al. 2007).
Whichever method is employed its useful to understand the extent to which each criteria
is met in any given situation in scale (Mara et al. 2007).
In ground of so many indicators it may be difficult to evaluate performance and
that integration of indicators is one of the ways out. Krajnc and Glavic (2004) proposed a
model that indicates how to integrate indicators in order to determine sustainable
development in a manner that facilitates decision making process. The method focus on
integrated assessment on the company level, in this study the same model has been used
to evaluate sustainability of alternative sanitation technologies.
18
3.0 METHODOLOGY
3.1 Introduction
Chapter three begins with a list of research questions and the study hypotheses. I
will then present an overview of the study area. The subsequent section will describe the
methodology used to test the hypothesis. There are also sections on data collection, data
analysis, ethical clearance and assessment of sustainability of sanitation technologies and
final ranking.
3.2 Research Questions
The current research attempts to address the following research questions:
• What are the current sanitation practices and conditions in the study area?
• What are the problems associated with the current sanitation technologies used in
the area, including diseases, pollution, pests (e.g., rats, insects), aesthetics (e.g.,
smell, appearance, etc.)?
• What are the social, economic, institutional and physical determinants for
adopting sanitation technologies?
• What sanitation technology is suitable for each study village?
3.3 Hypotheses
Hypothesis 1: Sociocultural lifestyle of people compounded with habitual
behavior and low education level is expected to lead to the existing sanitation
condition.
Hypothesis 2: Low economic wellbeing brought about by high level of poverty
leads to poor sanitation.
19
Hypothesis 3: Limited access to adequate quantities of water affect adoption of
water-based sanitation technologies.
Hypothesis 4: Geologic soil structure of the physical environment that has hard
rock, a high water table and loose soil leads to adoption of poor sanitation
technologies.
Hypothesis 5: Physical, socio-cultural, economic and institutional characteristics
of the area favor introduction and adaptation of recommended new sanitation
technologies.
Hypothesis 6: Technical complexities of technology determine the extent of their
adoption and people’s ability to sustain their use.
3.4 Study area
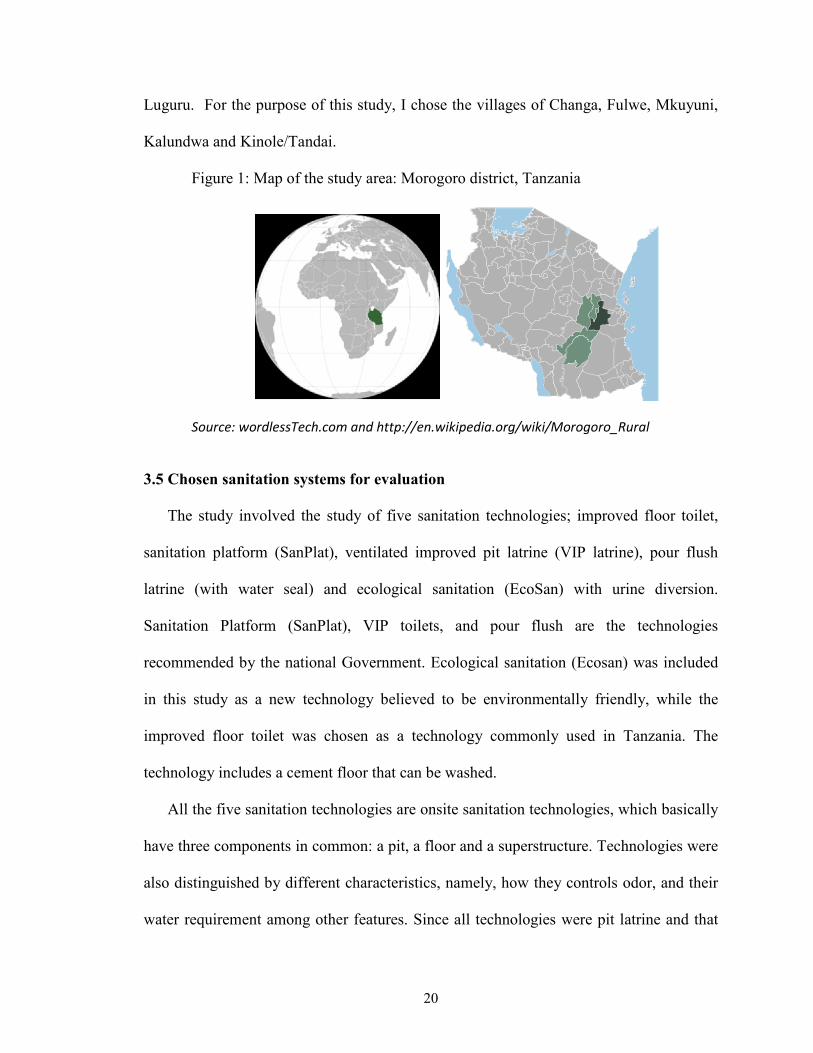
My study took place in Morogoro district, Tanzania (Figure 1). The district is
located northeast of the Morogoro Region between Latitude 8°00' and 6°45' south of
equator and between Longitude 37°00' and 38°30' east. It borders the Pwani region in the
east, the Kilombero district in the south, and the Mvomero district in the south, west and
north. It covers an area of 11,925 Km2 and 60% of its area is covered by vegetation,
forest, and the Selous Game Reserve. On the basis of 2002 National Census, the district is
estimated to have a population of about 283,858 of which about 90% are
farmers/peasants.
Administratively the Morogoro District is divided into six Divisions, 29 Wards,
141 villages, and 56,723 households. The district is dominated by one ethnic group, the
20
Luguru. For the purpose of this study, I chose the villages of Changa, Fulwe, Mkuyuni,
Kalundwa and Kinole/Tandai.
Figure 1: Map of the study area: Morogoro district, Tanzania
Source: wordlessTech.com and http://en.wikipedia.org/wiki/Morogoro_Rural
3.5 Chosen sanitation systems for evaluation
The study involved the study of five sanitation technologies; improved floor toilet,
sanitation platform (SanPlat), ventilated improved pit latrine (VIP latrine), pour flush
latrine (with water seal) and ecological sanitation (EcoSan) with urine diversion.
Sanitation Platform (SanPlat), VIP toilets, and pour flush are the technologies
recommended by the national Government. Ecological sanitation (Ecosan) was included
in this study as a new technology believed to be environmentally friendly, while the
improved floor toilet was chosen as a technology commonly used in Tanzania. The
technology includes a cement floor that can be washed.
All the five sanitation technologies are onsite sanitation technologies, which basically
have three components in common: a pit, a floor and a superstructure. Technologies were
also distinguished by different characteristics, namely, how they controls odor, and their
water requirement among other features. Since all technologies were pit latrine and that
21
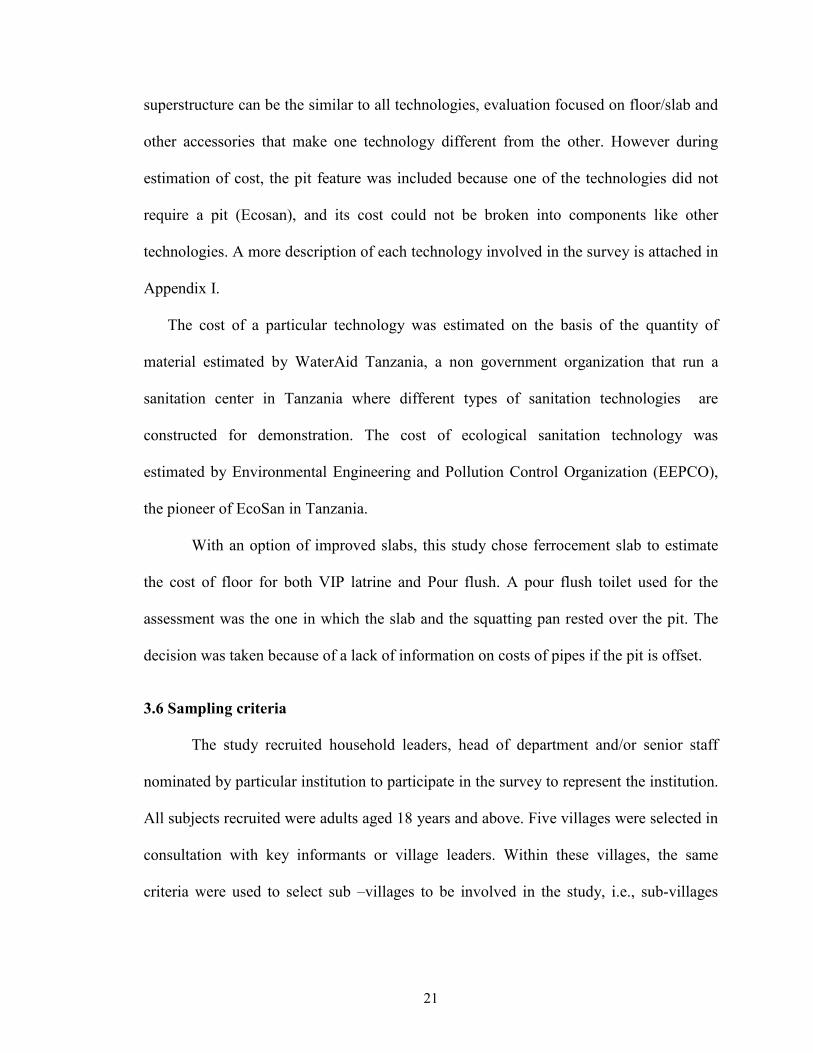
superstructure can be the similar to all technologies, evaluation focused on floor/slab and
other accessories that make one technology different from the other. However during
estimation of cost, the pit feature was included because one of the technologies did not
require a pit (Ecosan), and its cost could not be broken into components like other
technologies. A more description of each technology involved in the survey is attached in
Appendix I.
The cost of a particular technology was estimated on the basis of the quantity of
material estimated by WaterAid Tanzania, a non government organization that run a
sanitation center in Tanzania where different types of sanitation technologies are
constructed for demonstration. The cost of ecological sanitation technology was
estimated by Environmental Engineering and Pollution Control Organization (EEPCO),
the pioneer of EcoSan in Tanzania.
With an option of improved slabs, this study chose ferrocement slab to estimate
the cost of floor for both VIP latrine and Pour flush. A pour flush toilet used for the
assessment was the one in which the slab and the squatting pan rested over the pit. The
decision was taken because of a lack of information on costs of pipes if the pit is offset.
3.6 Sampling criteria
The study recruited household leaders, head of department and/or senior staff
nominated by particular institution to participate in the survey to represent the institution.
All subjects recruited were adults aged 18 years and above. Five villages were selected in
consultation with key informants or village leaders. Within these villages, the same
criteria were used to select sub –villages to be involved in the study, i.e., sub-villages

22
were chosen randomly from the list of villages to represent others. In sub villages,
households were selected randomly, making sure that at least one household was skipped
between two interviewed households.
In Focus Group Discussion (FGD), participants were identified with consultation
with village leaders. Participants were then visited to their homes or informed using
mobile phones for those who had cell phone.
3.7 Subject recruitment and sample size
A total of 540 participants were recruited in this study of whom 500 participated
in the household survey and 40 participated in FGDs, eight individuals in each village.
Focus group discussion participants were diverse and included village artisans, women,
senior people, and village elders who were familiar with local customs. Also included
were individual with houses without toilet and individual with improved sanitation
technology. Participants were selected in consultation with sub-village leaders – village
executive officers.
3.8 Ethical issues
Ethical clearance to use human subjects was obtained from the Institutional
Review Board (IRB) of the Florida International University (FIU – IRB Exemption
number 062911-00) Ethical clearance was also sought from Tanzania where the study
was conducted. The ethical clearance in Tanzania was issued by the National Institute for
Medical Research and the Ministry of Health and Social Welfare. Ethical clearance in
Tanzania gave the study eligibility to use indigenous people as source of information for
a research conducted by foreign institution.
23
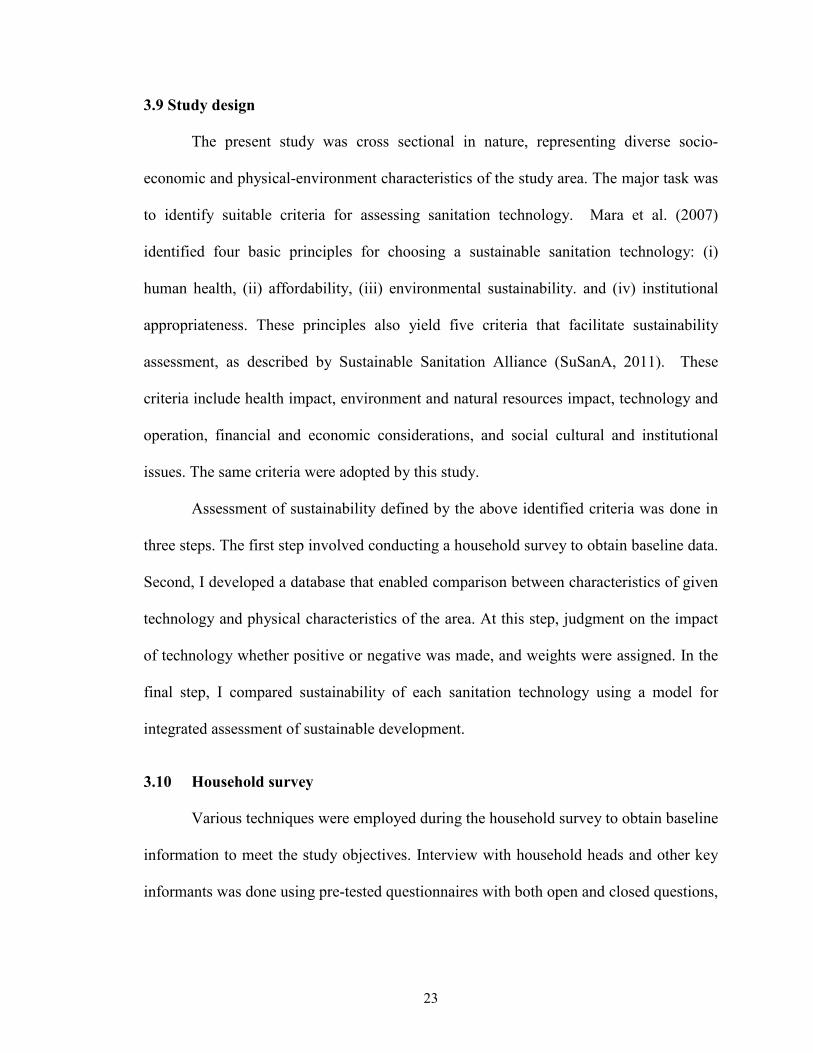
3.9 Study design
The present study was cross sectional in nature, representing diverse socio-
economic and physical-environment characteristics of the study area. The major task was
to identify suitable criteria for assessing sanitation technology. Mara et al. (2007)
identified four basic principles for choosing a sustainable sanitation technology: (i)
human health, (ii) affordability, (iii) environmental sustainability. and (iv) institutional
appropriateness. These principles also yield five criteria that facilitate sustainability
assessment, as described by Sustainable Sanitation Alliance (SuSanA, 2011). These
criteria include health impact, environment and natural resources impact, technology and
operation, financial and economic considerations, and social cultural and institutional
issues. The same criteria were adopted by this study.
Assessment of sustainability defined by the above identified criteria was done in
three steps. The first step involved conducting a household survey to obtain baseline data.
Second, I developed a database that enabled comparison between characteristics of given
technology and physical characteristics of the area. At this step, judgment on the impact
of technology whether positive or negative was made, and weights were assigned. In the
final step, I compared sustainability of each sanitation technology using a model for
integrated assessment of sustainable development.
3.10 Household survey
Various techniques were employed during the household survey to obtain baseline
information to meet the study objectives. Interview with household heads and other key
informants was done using pre-tested questionnaires with both open and closed questions,
24
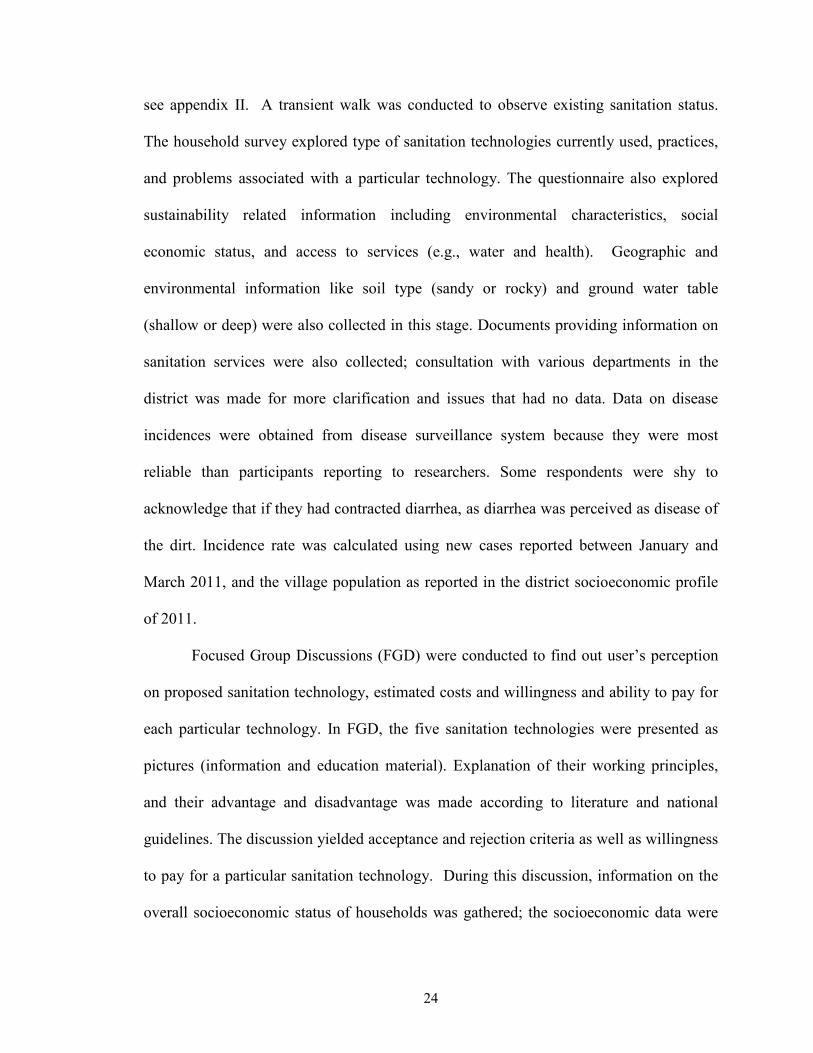
see appendix II. A transient walk was conducted to observe existing sanitation status.
The household survey explored type of sanitation technologies currently used, practices,
and problems associated with a particular technology. The questionnaire also explored
sustainability related information including environmental characteristics, social
economic status, and access to services (e.g., water and health). Geographic and
environmental information like soil type (sandy or rocky) and ground water table
(shallow or deep) were also collected in this stage. Documents providing information on
sanitation services were also collected; consultation with various departments in the
district was made for more clarification and issues that had no data. Data on disease
incidences were obtained from disease surveillance system because they were most
reliable than participants reporting to researchers. Some respondents were shy to
acknowledge that if they had contracted diarrhea, as diarrhea was perceived as disease of
the dirt. Incidence rate was calculated using new cases reported between January and
March 2011, and the village population as reported in the district socioeconomic profile
of 2011.
Focused Group Discussions (FGD) were conducted to find out user’s perception
on proposed sanitation technology, estimated costs and willingness and ability to pay for
each particular technology. In FGD, the five sanitation technologies were presented as
pictures (information and education material). Explanation of their working principles,
and their advantage and disadvantage was made according to literature and national
guidelines. The discussion yielded acceptance and rejection criteria as well as willingness
to pay for a particular sanitation technology. During this discussion, information on the
overall socioeconomic status of households was gathered; the socioeconomic data were
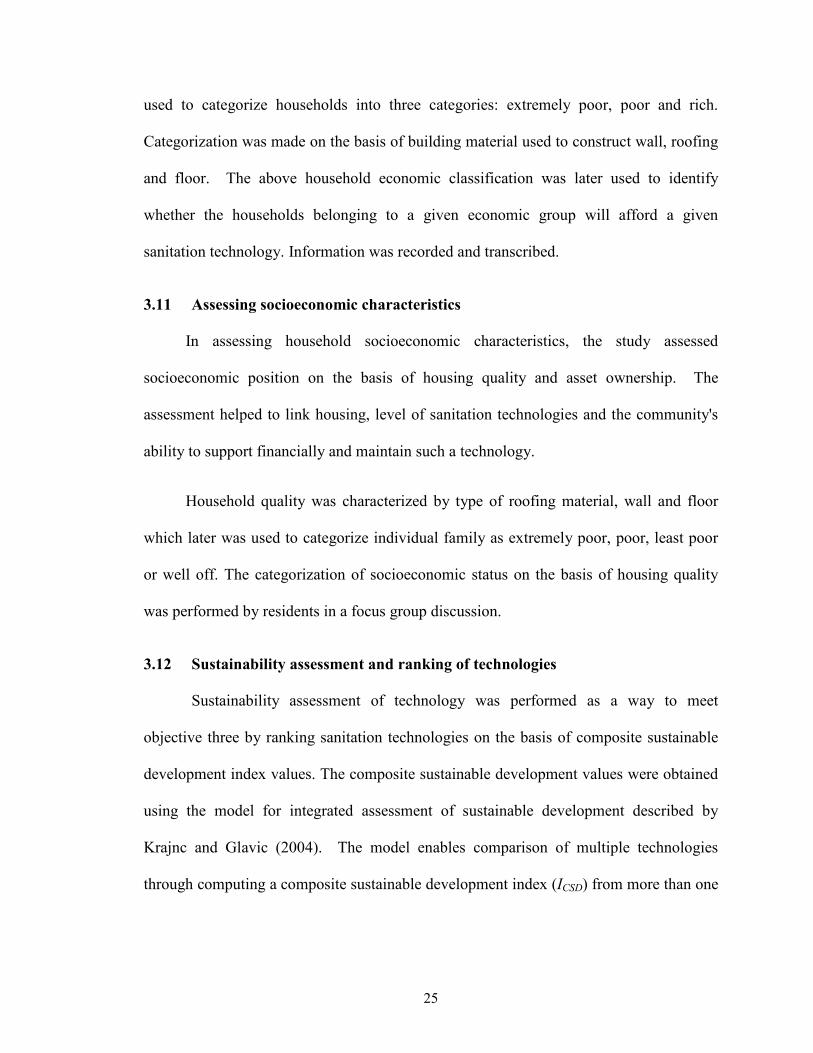
25
used to categorize households into three categories: extremely poor, poor and rich.
Categorization was made on the basis of building material used to construct wall, roofing
and floor. The above household economic classification was later used to identify
whether the households belonging to a given economic group will afford a given
sanitation technology. Information was recorded and transcribed.
3.11 Assessing socioeconomic characteristics
In assessing household socioeconomic characteristics, the study assessed
socioeconomic position on the basis of housing quality and asset ownership. The
assessment helped to link housing, level of sanitation technologies and the community's
ability to support financially and maintain such a technology.
Household quality was characterized by type of roofing material, wall and floor
which later was used to categorize individual family as extremely poor, poor, least poor
or well off. The categorization of socioeconomic status on the basis of housing quality
was performed by residents in a focus group discussion.
3.12 Sustainability assessment and ranking of technologies
Sustainability assessment of technology was performed as a way to meet
objective three by ranking sanitation technologies on the basis of composite sustainable
development index values. The composite sustainable development values were obtained
using the model for integrated assessment of sustainable development described by
Krajnc and Glavic (2004). The model enables comparison of multiple technologies
through computing a composite sustainable development index (ICSD) from more than one

26
sustainability dimension. Each dimension/criterion has multiple indicators which are to
be identified and grouped as sustainability sub-index (IS).
The overall assessment of sustainability, using the above model for integrated
assessment of sustainable development, is a stepwise process that starts with grouping of
criteria, followed by selecting indicators and judging their impact whether positive or
negative. Finally, the composite sustainability index (ICSD) is calculated through
aggregation of sustainability sub-indices (IS) using the following formulae:
∑= n
j jSjCSD IWI ,. (1)
Where Wj = a weight of sub-group j; IS,j = sustainable index for sub-group j; j = 1,…4 are
the sustainability sub groups, namely health, environment, technical aspect, economic
and social.
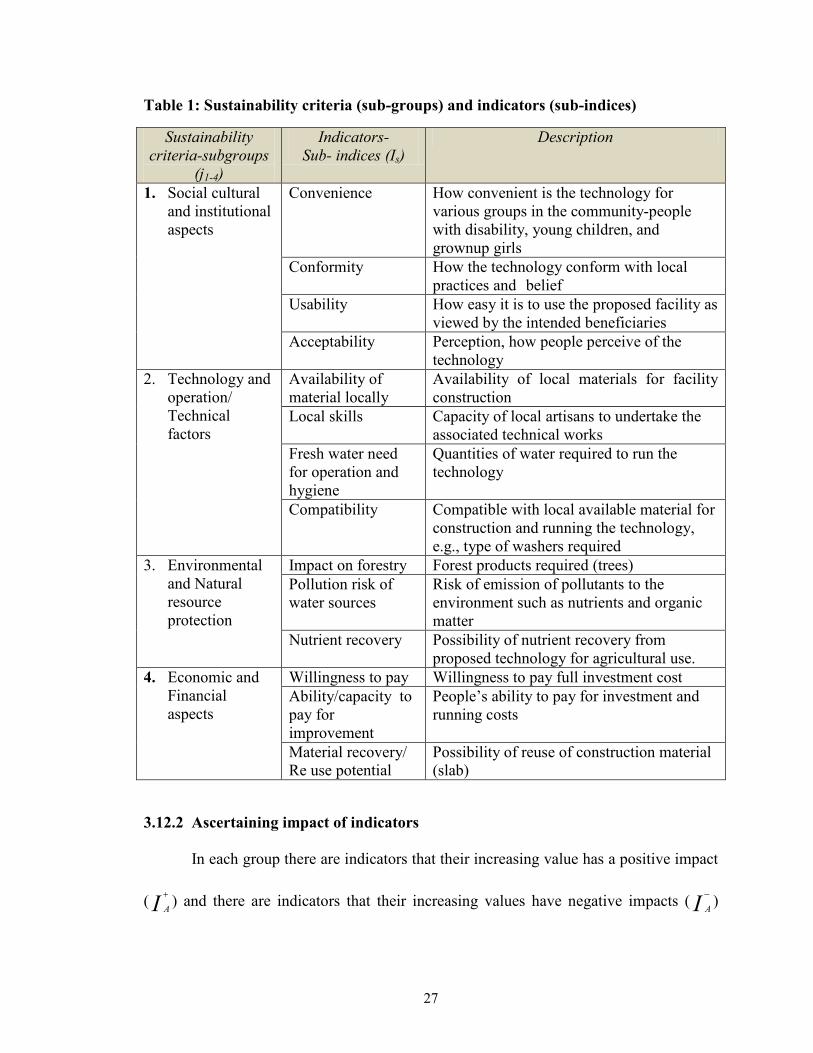
3.12.1 Selecting and grouping of sustainability criteria and indicators
Four groups of sustainability criteria of social cultural and institutional issues,
technical factors, economic, and environment and natural resource protection were
selected on basis of the literature mainly from the Sustainable Sanitation Alliance
(SuSanA) website, Katukiza et al., (2010), and Mara et al. (2007). The criteria had more
than one indicator however, only those that were easy to assess with given time and
financial resources were selected and included in this study. There were four socio
cultural indicators, 4 technical feasibility indicators, 3 environmental indicators and 3
economic indicators (see table 1).
27
Table 1: Sustainability criteria (sub-groups) and indicators (sub-indices)
Sustainability criteria-subgroups
(j1-4)
Indicators- Sub- indices (Is)
Description
1. Social cultural and institutional aspects
Convenience How convenient is the technology for various groups in the community-people with disability, young children, and grownup girls
Conformity How the technology conform with local practices and belief
Usability How easy it is to use the proposed facility as viewed by the intended beneficiaries
Acceptability Perception, how people perceive of the technology
2. Technology and operation/ Technical factors
Availability of material locally
Availability of local materials for facility construction
Local skills Capacity of local artisans to undertake the associated technical works
Fresh water need for operation and hygiene
Quantities of water required to run the technology
Compatibility Compatible with local available material for construction and running the technology, e.g., type of washers required
3. Environmental and Natural resource protection
Impact on forestry Forest products required (trees) Pollution risk of water sources
Risk of emission of pollutants to the environment such as nutrients and organic matter
Nutrient recovery Possibility of nutrient recovery from proposed technology for agricultural use.
4. Economic and Financial aspects
Willingness to pay Willingness to pay full investment cost Ability/capacity to pay for improvement
People’s ability to pay for investment and running costs
Material recovery/ Re use potential
Possibility of reuse of construction material (slab)
3.12.2 Ascertaining impact of indicators
In each group there are indicators that their increasing value has a positive impact
( I A+ ) and there are indicators that their increasing values have negative impacts ( I A
− )
28
from the perspective of sustainability. For example under environmental and natural
resource protection, demand for forestry product has negative impact while nutrient
recovery has positive impact.
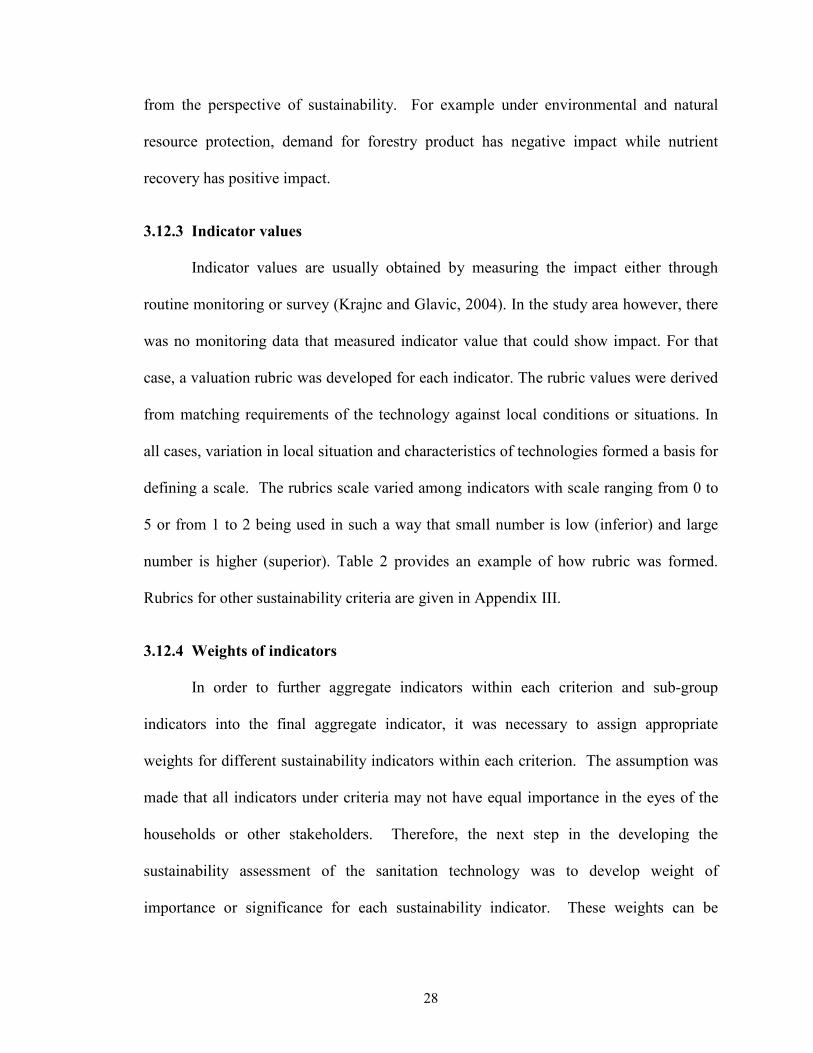
3.12.3 Indicator values
Indicator values are usually obtained by measuring the impact either through
routine monitoring or survey (Krajnc and Glavic, 2004). In the study area however, there
was no monitoring data that measured indicator value that could show impact. For that
case, a valuation rubric was developed for each indicator. The rubric values were derived
from matching requirements of the technology against local conditions or situations. In
all cases, variation in local situation and characteristics of technologies formed a basis for
defining a scale. The rubrics scale varied among indicators with scale ranging from 0 to
5 or from 1 to 2 being used in such a way that small number is low (inferior) and large
number is higher (superior). Table 2 provides an example of how rubric was formed.
Rubrics for other sustainability criteria are given in Appendix III.
3.12.4 Weights of indicators
In order to further aggregate indicators within each criterion and sub-group
indicators into the final aggregate indicator, it was necessary to assign appropriate
weights for different sustainability indicators within each criterion. The assumption was
made that all indicators under criteria may not have equal importance in the eyes of the
households or other stakeholders. Therefore, the next step in the developing the
sustainability assessment of the sanitation technology was to develop weight of
importance or significance for each sustainability indicator. These weights can be
29
obtained through pair-wise comparison of factor in Analytical Hierachy Process (AHP)
(Saaty, 1980). For the purpose of this study, weights of indicators under each criterion
(social, environmental or technical) were assumed to be equal and their sum total of
weights was set to be one. In this way the weight 1 was distributed equally among
indicators in criteria except for acceptability indicator that had higher value (40%) of the
total weight. This is because accepting a technology was taken as very important step in
adopting new sanitation technology.
Table 2: Rubric scale for socio-cultural indicators
Indicators Explanation Description for rating Unit Convenience Technology easy to be
used by all family members especially growing children and people with disability
Technology features may limit young children, people with disability
0 (low)
Residents accept the technology with its limitation
1
All members in family/ Society can access with or without slight modification of a technology
2(high)
Conformity
Conform with local perception on material used to construct a technology
Number of HH with cement floor are 50% and above, highly conform with housing condition
4
HH with cement floor 30-49%, conform with housing condition
3
HH with cement floor 20-29, conformity with housing condition is low
2
HH with cement floor 10-19%, conformity is very low
1
HH with cement floor 0-9% conformity is extremely low
0
Acceptability Acceptance Acceptance 81- 100% 5 Acceptance 71- 80% 4 Acceptance 51 - 70% 3 Acceptance 0-50% 1
Usability Similarity to common practice (anal cleansing practices)
Anal cleansing practices on new technology is similar to current anal cleansing practice
2
Anal cleansing practices on new technology is different from common practice however the existing practice is due to limitation of existing technology than customs (User friendly)
1
Technology introduce new practices on anal cleansing never practices before in locality (Not user friendly)
0
30
3.12.5 Weights of sustainability criteria
The sustainability sub-index (IS) is obtained by multiplying the weight of criteria
and the normalized value of indicators. Normalization of indicators is discussed in the
next sub-section. Weights of criteria can be obtained from environmental impact
assessment or through pair-wise comparison of factors/criteria through the analytical
hierarchy process (Saaty, 1980; Krajnc and Glavic, 2004). In the study area however,
environmental impact of sanitation technologies is yet to be determined, and therefore,
weights were obtained through pair-wise comparison of criteria. Eight national sanitation
stakeholders working in the areas of environment, health and water supply were used to
perform ranking of criteria in a pair-wise fashion.
In a pair-wise comparison, two factors are compared at once by answering the
question that which of the two criteria, i and j, is more important than the other with
respect to the sustainability of sanitation technologies. Krajnc and Glavic (2004) used a
factor scale from 1 to 9 in order to express the judges’ preference intensity. That is, a
value of 1 indicated the equal preference between i and j. A value of 9 indicated that the
preference for criterion i is nine times greater than the preference for criterion j. With
this comparison method, if criterion i is, say, 5 times less preferred to j, then the judges
would have to assign a reciprocal value of 1/5. Such a pair-wise comparison results in an
(n X n) matrix. In our study, the judges found the above factor scale confusing, and
therefore, we were forced to first use a linear and simpler factor scale of -10 to +10. On
this scale, the value 0 indicates equal importance between two criteria while a preference
of 10 indicates one factor is 10 times more important than the other. This scale was
chosen to make it easier for judges to rank factors the same below and above the diagonal
31
without having to invert the value. After we obtained the initial comparison, we retained
only the positive numbers and re-scaled the factor scale of 0 – 10 to 1 – 11. The re-
scaling does not affect the original order of preference. This operation left all the
diagonal cells with number 1 (meaning equal preference between each i and j). Also, it
left each cell with a negative value on the original comparison empty. For each empty
cell (i,j), we used the reciprocal value of its diagonal cell (j,i). The end result of the above
operation is a pair-wise matrix with appropriate properties necessary for further matrix-
manipulation as explained below. For instance, if we had kept the original linear factor
scale, mathematically it would have been impossible to keep the order of the hierarchical
process. When we added the values of the cells of each column, the positive and negative
numbers would have canceled each other out fully or partially.
Each judge performed ranking independently. Personal judgment by experts
would result into inconsistency of comparison. A mathematical test was conducted to
check the consistency, which is explained in the next section. A consistency ratio of 0.1
was considered as acceptable upper limit (Saaty and Vargas, 2001., Krajnc and Glavic,
2004). The ranks given by eight judges were combined by finding the average of each
rank in a cell (Table 3).
In table 3 the factor “social” represents social cultural and institutional factors;
“technical” stands for technical feasibility of a technology; “environmental” stands for
environmental and natural resource protection; and, “affordability” means economic and
financial aspects of the technology.
32
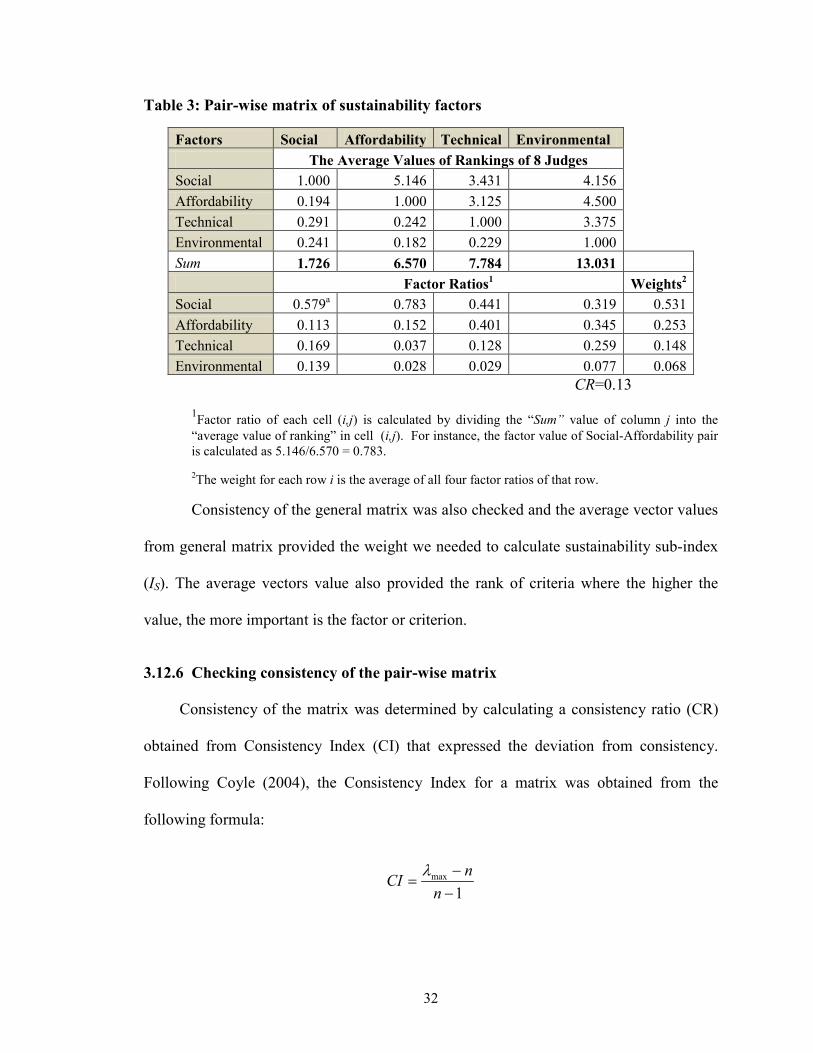
Table 3: Pair-wise matrix of sustainability factors
Factors Social Affordability Technical Environmental The Average Values of Rankings of 8 Judges Social 1.000 5.146 3.431 4.156 Affordability 0.194 1.000 3.125 4.500 Technical 0.291 0.242 1.000 3.375 Environmental 0.241 0.182 0.229 1.000 Sum 1.726 6.570 7.784 13.031 Factor Ratios1 Weights2
Social 0.579a 0.783 0.441 0.319 0.531 Affordability 0.113 0.152 0.401 0.345 0.253 Technical 0.169 0.037 0.128 0.259 0.148 Environmental 0.139 0.028 0.029 0.077 0.068
CR=0.13
1Factor ratio of each cell (i,j) is calculated by dividing the “Sum” value of column j into the “average value of ranking” in cell (i,j). For instance, the factor value of Social-Affordability pair is calculated as 5.146/6.570 = 0.783.
2The weight for each row i is the average of all four factor ratios of that row.
Consistency of the general matrix was also checked and the average vector values
from general matrix provided the weight we needed to calculate sustainability sub-index
(IS). The average vectors value also provided the rank of criteria where the higher the
value, the more important is the factor or criterion.
3.12.6 Checking consistency of the pair-wise matrix
Consistency of the matrix was determined by calculating a consistency ratio (CR)
obtained from Consistency Index (CI) that expressed the deviation from consistency.
Following Coyle (2004), the Consistency Index for a matrix was obtained from the
following formula:
1max
−−
=n
nCI λ
33
Where n is the number of criteria in the comparison matrix, and maxλ is an estimate of the
Eigen value of the comparison matrix. If the comparison matrix is not perfectly
consistent, maxλ will be greater than the order of the matrix, n (Saaty and Vargas, 2001).
In order to compute maxλ , first the Eigenvector needed to obtain by multiplying together
the entries in each row of the matrix and then taking the nth root of that product. The nth
roots of all four rows were summed and that sum was used to normalize the eigenvector
elements to add to 1.00. The new eigenvector was obtained by multiplying on the matrix
of judgments by the eigenvector. The above computation yielded a CI value of 0.12.
The CI was then compared to the corresponding random consistency indices (RI)
described by Saaty and Vargas (2001) in which the upper row is the order of the random
matrix, and the lower is the corresponding index of consistency for random judgments
(see table 4).
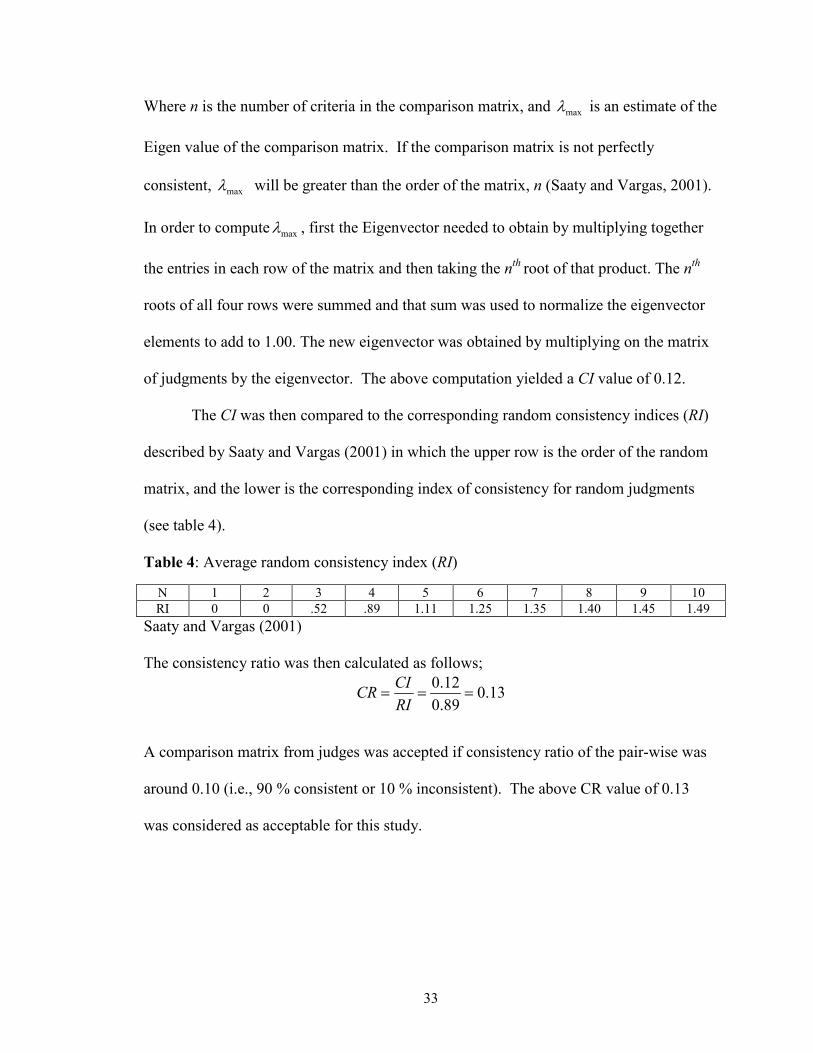
Table 4: Average random consistency index (RI)
N 1 2 3 4 5 6 7 8 9 10 RI 0 0 .52 .89 1.11 1.25 1.35 1.40 1.45 1.49
Saaty and Vargas (2001) The consistency ratio was then calculated as follows;
13.089.012.0
===RICICR
A comparison matrix from judges was accepted if consistency ratio of the pair-wise was
around 0.10 (i.e., 90 % consistent or 10 % inconsistent). The above CR value of 0.13
was considered as acceptable for this study.
34
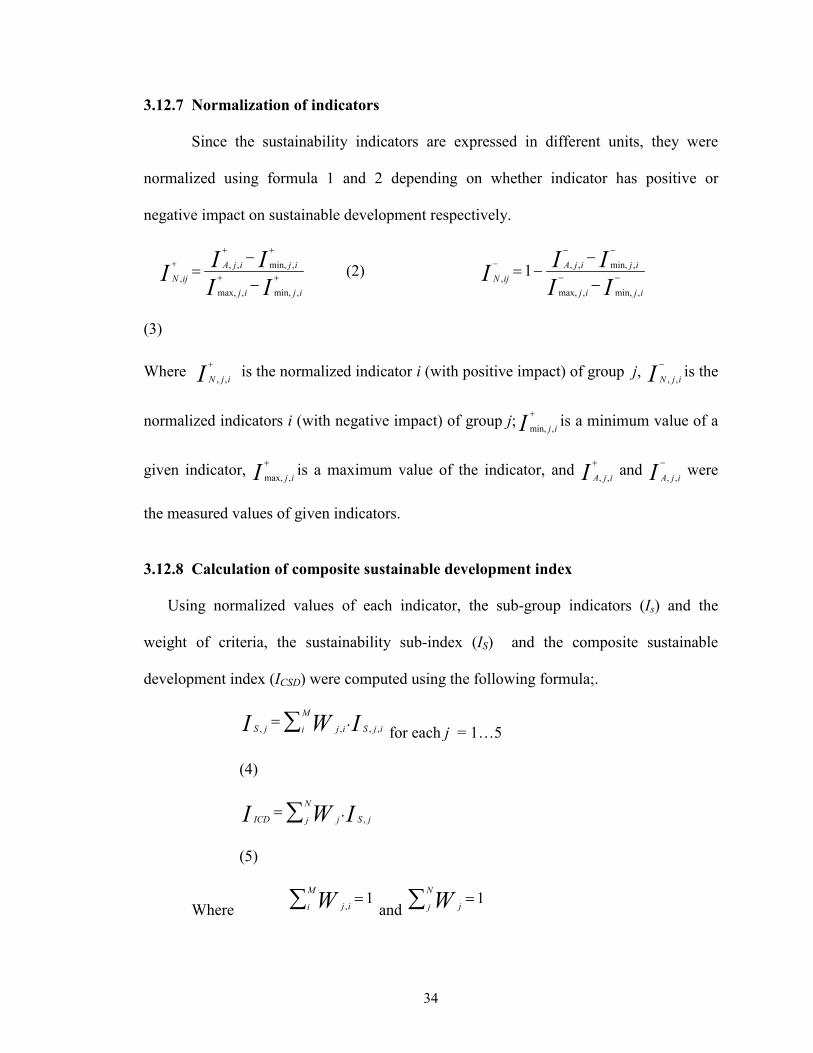
3.12.7 Normalization of indicators
Since the sustainability indicators are expressed in different units, they were
normalized using formula 1 and 2 depending on whether indicator has positive or
negative impact on sustainable development respectively.
IIIII
ijij
ijijAijN ++
+++
−
−=
,min,,max,
,min,,,, (2)
IIIII
ijij
ijijAijN −−
−−−
−
−−=
,min,,max,
,min,,,, 1
(3)
Where I ijN+
,, is the normalized indicator i (with positive impact) of group j, I ijN−
,, is the
normalized indicators i (with negative impact) of group j; I ij+
,min, is a minimum value of a
given indicator, I ij+
,max, is a maximum value of the indicator, and I ijA+
,, and I ijA
−
,, were
the measured values of given indicators.
3.12.8 Calculation of composite sustainable development index
Using normalized values of each indicator, the sub-group indicators (Is) and the
weight of criteria, the sustainability sub-index (IS) and the composite sustainable
development index (ICSD) were computed using the following formula;.
∑= M
i ijSijjS IWI ,,,, . for each j = 1…5
(4)
∑= N
j jSjICD IWI ,.
(5)
Where ∑ =M
i ijW 1, and ∑ =N
j jW 1
35
The composite sustainability index (5) was computed for each technology, in each
village, the value of which was used to rank technologies from most sustainable to the
least. The higher the value of (ICSD) the more sustainable is the particular technology in a
study area. This process was accomplished using Excel.
36
4.0 RESULTS AND DISCUSION
4.1 Introduction
This chapter presents observations and interpretation of the data that were
collected using the above described methodology. The section summarizes results
according to the objectives of the study. Divided into sections, the chapter describes
existing sanitation situation in the area, explores local characteristics of the area that
influence adoption of a given sanitation method and lastly describes the ranking of
sanitation technologies on the basis of the composite sustainable development index. The
chapter begins with description of the sample characteristics including demographics,
education level and social economic characteristics of sampled household.
4.2 Sample Characteristics
4.2.1 Demographics
A total of 500 households were visited in five villages, with approximately 100
households in each village. The age of the sample respondents ranged between 18 to 91
years, with a mean age of 44 years. The numbers of male and female were almost equally
distributed, 54% men and 46% female. In each village however, the number of males and
females varied depending on household head that was available at home during the
survey. During household surveys, wives preferred that their husbands be interviewed
while in other places women would not allow their house be skipped because the husband
was not at home. Fig.1 shows gender distribution in each village visited.
37
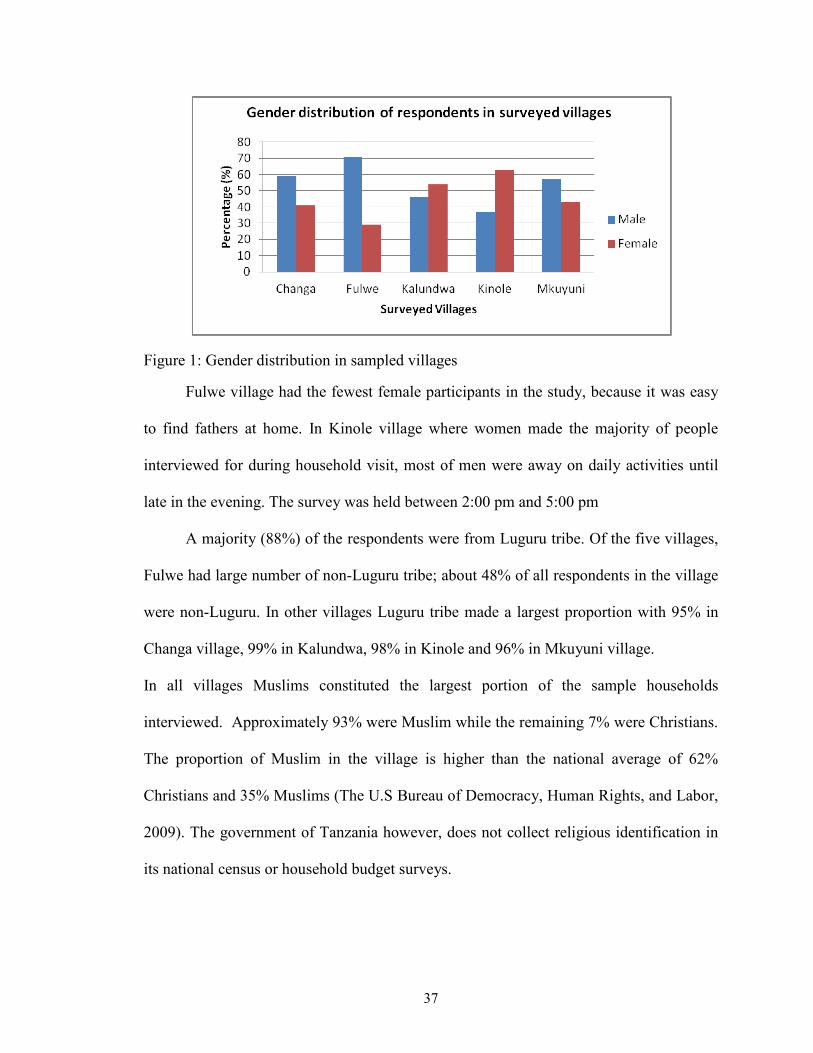
Figure 1: Gender distribution in sampled villages
Fulwe village had the fewest female participants in the study, because it was easy
to find fathers at home. In Kinole village where women made the majority of people
interviewed for during household visit, most of men were away on daily activities until
late in the evening. The survey was held between 2:00 pm and 5:00 pm
A majority (88%) of the respondents were from Luguru tribe. Of the five villages,
Fulwe had large number of non-Luguru tribe; about 48% of all respondents in the village
were non-Luguru. In other villages Luguru tribe made a largest proportion with 95% in
Changa village, 99% in Kalundwa, 98% in Kinole and 96% in Mkuyuni village.
In all villages Muslims constituted the largest portion of the sample households
interviewed. Approximately 93% were Muslim while the remaining 7% were Christians.
The proportion of Muslim in the village is higher than the national average of 62%
Christians and 35% Muslims (The U.S Bureau of Democracy, Human Rights, and Labor,
2009). The government of Tanzania however, does not collect religious identification in
its national census or household budget surveys.
38
4.2.2 Education level
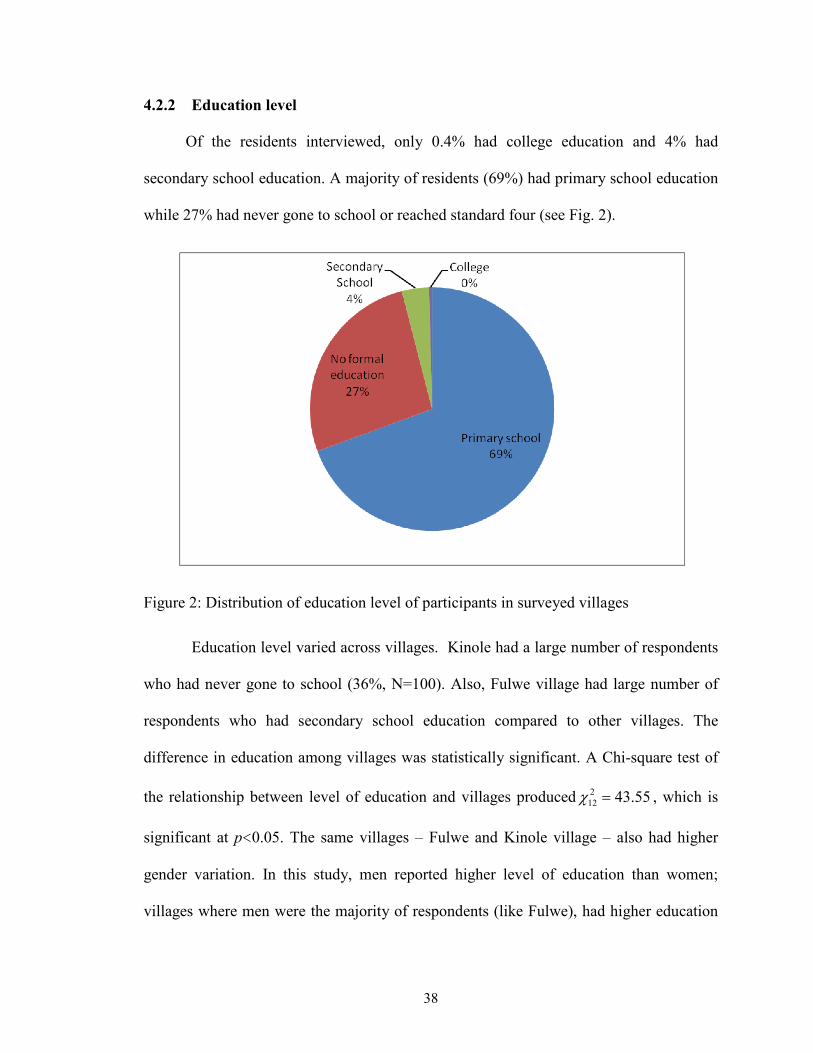
Of the residents interviewed, only 0.4% had college education and 4% had
secondary school education. A majority of residents (69%) had primary school education
while 27% had never gone to school or reached standard four (see Fig. 2).
Figure 2: Distribution of education level of participants in surveyed villages
Education level varied across villages. Kinole had a large number of respondents
who had never gone to school (36%, N=100). Also, Fulwe village had large number of
respondents who had secondary school education compared to other villages. The
difference in education among villages was statistically significant. A Chi-square test of
the relationship between level of education and villages produced 55.43212 =χ , which is
significant at p˂0.05. The same villages – Fulwe and Kinole village – also had higher
gender variation. In this study, men reported higher level of education than women;
villages where men were the majority of respondents (like Fulwe), had higher education
39
level than villages in which a majority of respondents were women, like Kinole. Thus,
the sample may have been biased toward men with higher education.
4.2.3 Socioeconomic characteristics
In the Focus Group Discussions (FGS) participants defined social economic status
of a family on the basis of the quality of house one family lives in. Extremely poor
families were those that lived in a house constructed with poles with mud walls, mud
floors and thatch roof. A well-off family was described as the one that live in a house
constructed with block (cement sand bricks) wall, cement floor/tiles, and iron sheet roof.
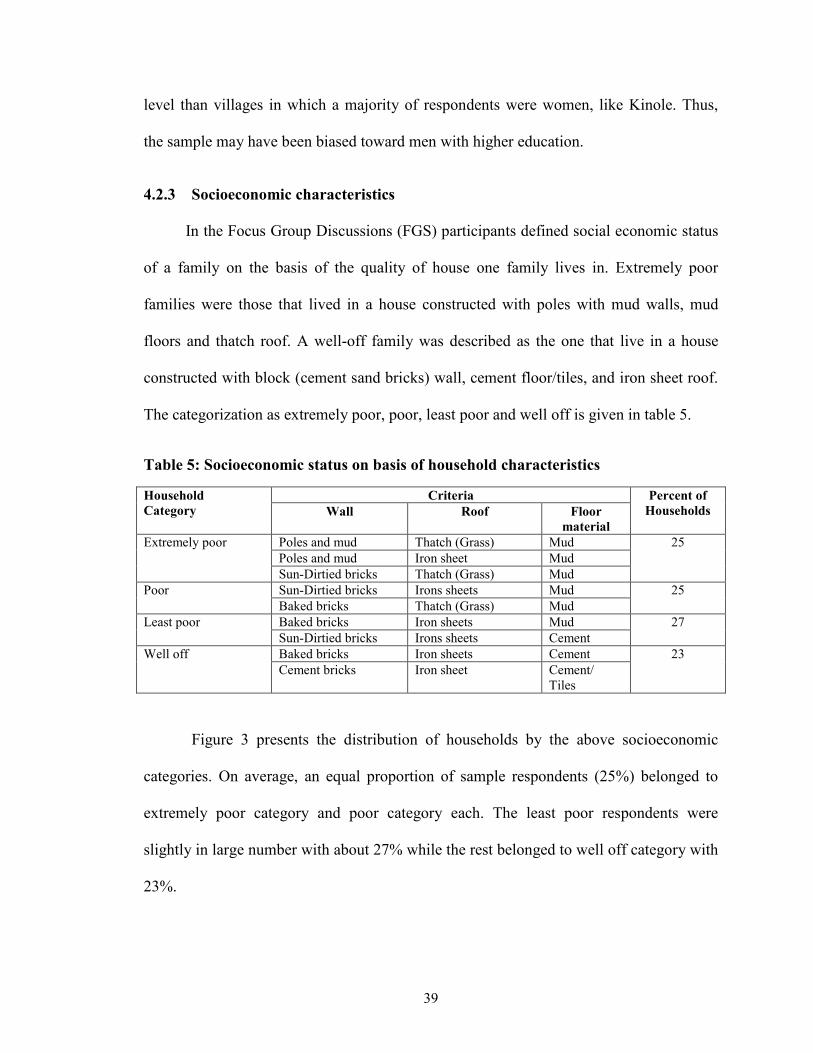
The categorization as extremely poor, poor, least poor and well off is given in table 5.
Table 5: Socioeconomic status on basis of household characteristics
Household Category
Criteria Percent of Households Wall Roof Floor
material Extremely poor
Poles and mud Thatch (Grass) Mud 25 Poles and mud Iron sheet Mud Sun-Dirtied bricks Thatch (Grass) Mud
Poor
Sun-Dirtied bricks Irons sheets Mud 25 Baked bricks Thatch (Grass) Mud
Least poor Baked bricks Iron sheets Mud 27 Sun-Dirtied bricks Irons sheets Cement
Well off Baked bricks Iron sheets Cement 23 Cement bricks Iron sheet Cement/
Tiles
Figure 3 presents the distribution of households by the above socioeconomic
categories. On average, an equal proportion of sample respondents (25%) belonged to
extremely poor category and poor category each. The least poor respondents were
slightly in large number with about 27% while the rest belonged to well off category with
23%.
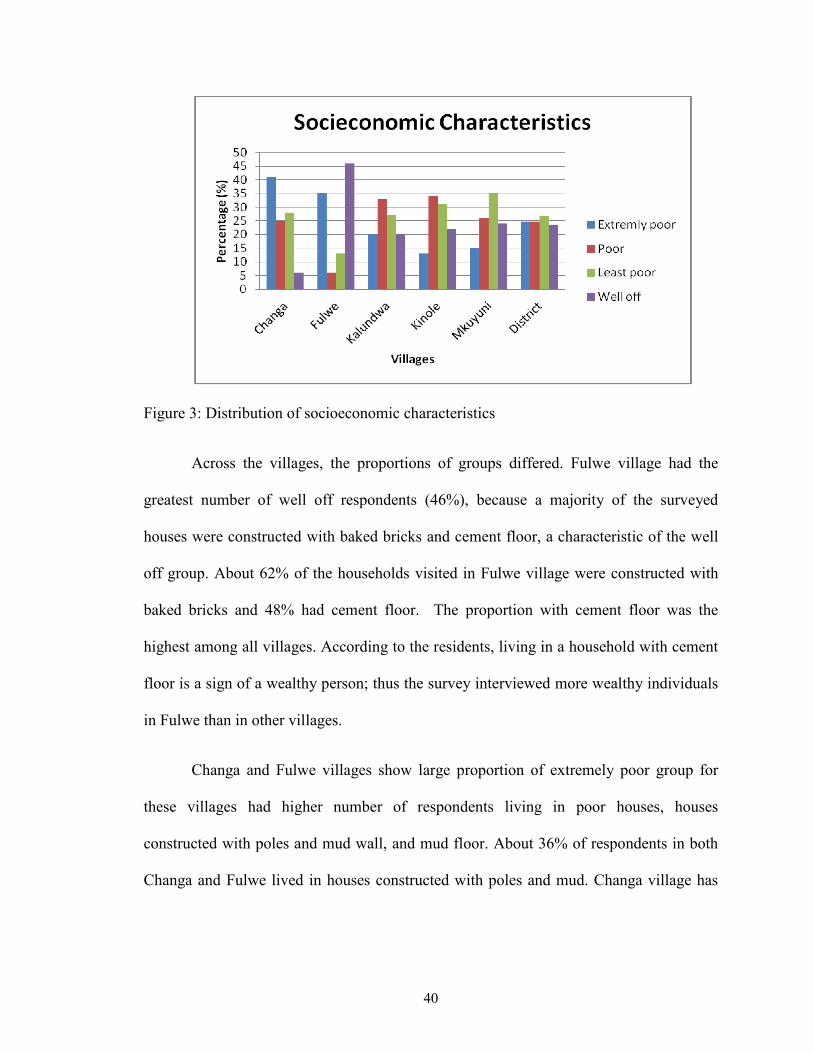
40
Figure 3: Distribution of socioeconomic characteristics
Across the villages, the proportions of groups differed. Fulwe village had the
greatest number of well off respondents (46%), because a majority of the surveyed
houses were constructed with baked bricks and cement floor, a characteristic of the well
off group. About 62% of the households visited in Fulwe village were constructed with
baked bricks and 48% had cement floor. The proportion with cement floor was the
highest among all villages. According to the residents, living in a household with cement
floor is a sign of a wealthy person; thus the survey interviewed more wealthy individuals
in Fulwe than in other villages.
Changa and Fulwe villages show large proportion of extremely poor group for
these villages had higher number of respondents living in poor houses, houses
constructed with poles and mud wall, and mud floor. About 36% of respondents in both
Changa and Fulwe lived in houses constructed with poles and mud. Changa village has

41
the large proportion of respondents who live in a house with mud floor (89%) followed
by Fulwe 48%.
My study aimed at studying rural characteristics, and therefore, the data collection
had to take place in remote areas than around village centers. Reaching more remote
houses was only possible in Fulwe and Changa villages where houses were easily
accessible by roads. The rest of the villages were at the mountain ridges and valleys
which made it hard to reach large number of individuals living away from village centers
given limited amount of time. In mountainous villages, data were collected from
households that were around the village centers where a large number of houses were
constructed with sun-dried bricks/baked brick and roofed with iron sheet, a characteristic
of least poor and well off households.
4.2.4 Household Income and Occupation
Individuals in rural Morogoro earn approximately Tanzanian Shillings (TZS) 250
per day an income derived mainly through farming (MDC, 2011). In surveyed villages
90% of all the people were farmers cultivating a variety of crops mainly maize, rice and
fruits for subsidence. While maize and rice were common in all villages, other crops were
cultivated in large quantity in one village than the other. Villagers in Fulwe cultivate
sunflowers from which oil was extracted while Kalundwa and Kinole villagers cultivate
spices to supplement income from rice, maize and fruits (i.e. banana, pineapples and
oranges).
Most of interviewees reported to own cell phones (60%) and very few had
television set (9%) or motorcycle (5%). An average value of these assets was estimated at
42
TZS 35,000, TZS 150,000 and TZS 1,200,000 for mobile phone, Television set and
motorcycle, respectively. Lack of electricity makes ownership of televisions difficult.
Most of the people with motorcycles used it as a source of income because the
motorcycle is used as means of transport. Motorcycles are common in all villages, though
the majority were seen at Fulwe village (10%) while in Kalundwa and Kinole, 5%
reported to have one.
4.3 Sanitation status
Sanitation status in the surveyed villages is poor; toilets are constructed with
temporary materials and lack roofing and door which compromise privacy. Lack of roof
cover exposes floor and logs to rains, leading to frequent pit collapse. Other reasons that
contribute to pit collapse may include lack of pit lining and poor location of toilets.
Toilets are located in a sloppy land as such they are vulnerable to speedy runoff and
soil/land slides.
In this survey, about 96% of households had toilets and 4% had none. Of those
who had toilets only 9.4% had improved toilets, such as the improved floor toilets (5%),
VIP latrines (2%), and pour flush (2%). The proportion of household with improved
toilets corresponds to the national estimates of improved sanitation coverage in rural
areas of 9% as reported by the National Bureau of Statistics (NBS) in the Demographic
and Health Survey report of 2010. However, coverage of 9.4% is very low compared to
the 2010 national target of improved sanitation from 23% to 35% the 2015 (MoFEA,
2010). Thus the coverage of sanitation in these villages is below national estimates.
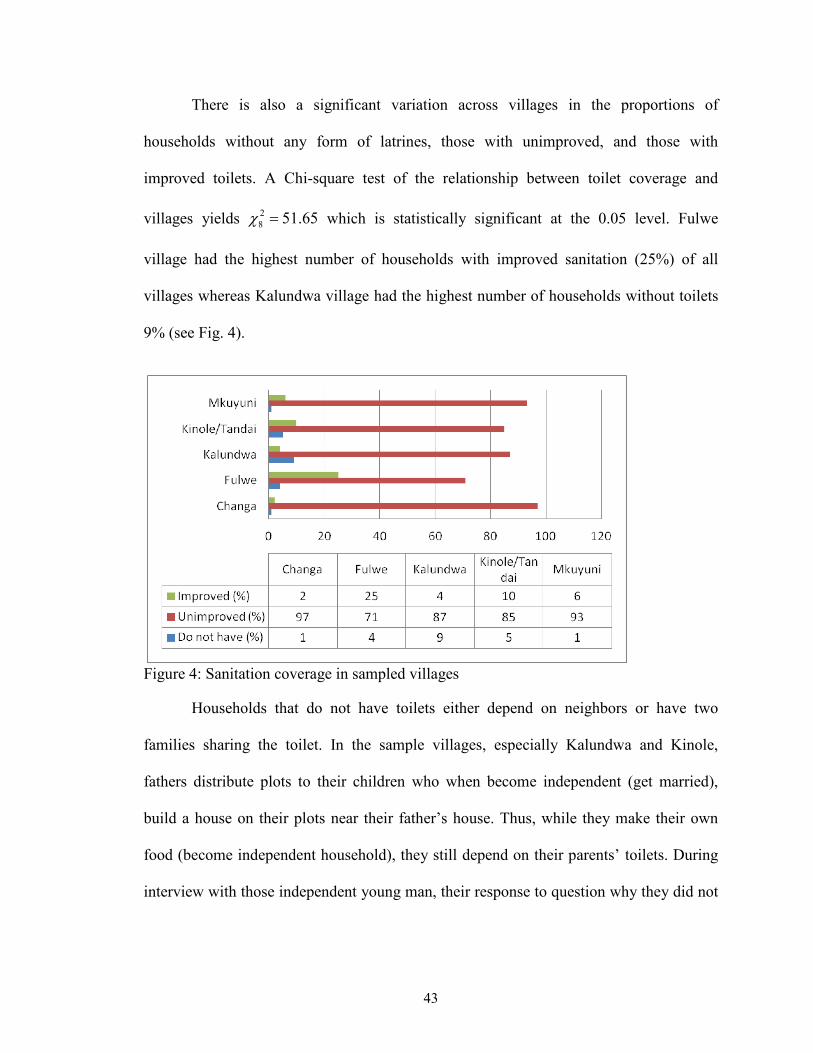
43
There is also a significant variation across villages in the proportions of
households without any form of latrines, those with unimproved, and those with
improved toilets. A Chi-square test of the relationship between toilet coverage and
villages yields 65.5128 =χ which is statistically significant at the 0.05 level. Fulwe
village had the highest number of households with improved sanitation (25%) of all
villages whereas Kalundwa village had the highest number of households without toilets
9% (see Fig. 4).
Figure 4: Sanitation coverage in sampled villages
Households that do not have toilets either depend on neighbors or have two
families sharing the toilet. In the sample villages, especially Kalundwa and Kinole,
fathers distribute plots to their children who when become independent (get married),
build a house on their plots near their father’s house. Thus, while they make their own
food (become independent household), they still depend on their parents’ toilets. During
interview with those independent young man, their response to question why they did not
44
have toilets differed from their parents. Parents acknowledged that their sons use their
toilets on a temporary basis. The sons however, responded that they had one before, but it
collapsed during the rainy season. Other households without toilets could have just
moved to a new house that lacked toilet. This means that one can start living in a house
before digging a toilet. However, some did agree that a toilet had to be constructed first,
which was consistent with the observations made in Kikuyu in Kenya (Jackson, 2004).
In some families plots are small and the land is mountainous to have each and
every son surrounding their father to have their own toilets. However, this behavior was
seen to contribute to having poor type and poor maintenance. Those who have just
returned to the village from town also contribute to the number of households without
toilets for most of them use their neighbor’s toilet before they construct their own.
4.3.1 Socioeconomic status and use of improved sanitation
In the sample villages most of improved toilets are seen in families with higher
socioeconomic status. The analysis of data shows that improved sanitation technologies
are common among well off families (57.4%, N=47) followed by least poor families
19%, the difference which is statistically significant. A chi-square test of the relationship
between socioeconomic status of the family and type of sanitation technology used gives
8.3526 =χ (p < 0.05), which is statistically significant, suggesting strong association
between socioeconomic status and type of sanitation technology.
Having a cement floor in the house is a sign of wealth. The households with a
cement floor are most likely to use improved sanitation technologies than households
with a mud floor. A Chi-square test of the relationship between households with cement
45
floor and type of sanitation technology provided 2.2422 =χ which is again statistically
significant at the 0.05 level, suggesting a strong relationship between cement floors in the
house and improved sanitation technologies.
4.3.2 Education level and use of improved sanitation
Importance of proper sanitation is taught at least from primary schools level.
Household heads who missed the opportunity to attend at least primary school were the
majority whom their households had no toilets. The analysis of data shows that 55% of
households that were found to lack toilets did not have any formal education. About 45%
of those did not have toilets however had primary school education level; none of the
secondary school headed family was found to have a toilet in or near the house. Improved
toilets were also found in some households headed with individual who had not gone to
school but the proportion was small (7.5%) where for those with secondary education
28% had improved toilets. A Chi-square test of this relationship between level of
education and type of sanitation technology provide 4.1626 =χ which is statistically
significant, suggesting that education level does have an effect on the adoption of
improved sanitation technology.
4.3.3 Problems associated with existing sanitation technologies
Households with unimproved toilets have bathroom and toilet sharing the same
structure i.e. a toilet and bathroom share same entrance and room. Only those with
improved types had a bathroom separated from toilet room. Yet in both types of toilets
(i.e., improved and unimproved toilets), grey water from bathroom and from a place used
for anal cleansing are drained outside. Anal cleansing is performed aside the drop hole to

46
avoid wetting a floor/slab or collapsing pit. As a result, grey water is seen scattered
outside yet only few reported it as nuisance (37%).The only nuisances they see is odor
(reported by 84%), and flies and cockroaches (reported by 85% of respondents).
Nuisance is reported mostly by individuals who use unimproved sanitation
technologies. For instance, of the 437 individuals who reported bad odor as a problem,
91% used unimproved sanitation. Bad odor was also reported by 8% of individuals who
use improved sanitation technology. Bad odor from improved toilets may be the result
of the fact that a majority use improved floor toilets which lack a vent pipe or water seal
that could control odor and flies. Individuals who use those improved technologies with
a vent pipe and water seal nevertheless, still report odor and flies problem. About 2% of
individual reported bad odor and smell using improved technology. These problems may
be caused by construction problem because in some places/household vent pipes were
bent to avoid making a hole on a roof. The vent pipe works better when it is straight
(Mara, 1985a). Some pour flush toilets have a squatting pan that are without a water seal.
During the survey these types of technologies were grouped under VIP latrine for they
had a vent pipe although requires water for flushing.
4.3.4 Sanitation and diseases occurrence
In a list of top ten diseases that lead to morbidity in Morogoro district, diarrhea is
number 5 across all ages (MDC, 2011). In surveyed villages, incidence of diarrhea in all
age groups varied, from relatively a high incidence rate in Changa of 37/1000 to a low
incidence rate in Fulwe of 3.4/1000. These incidence rates were based on the 2011
population numbers obtained from the 2011 district social economic profile (MDC, 2011)
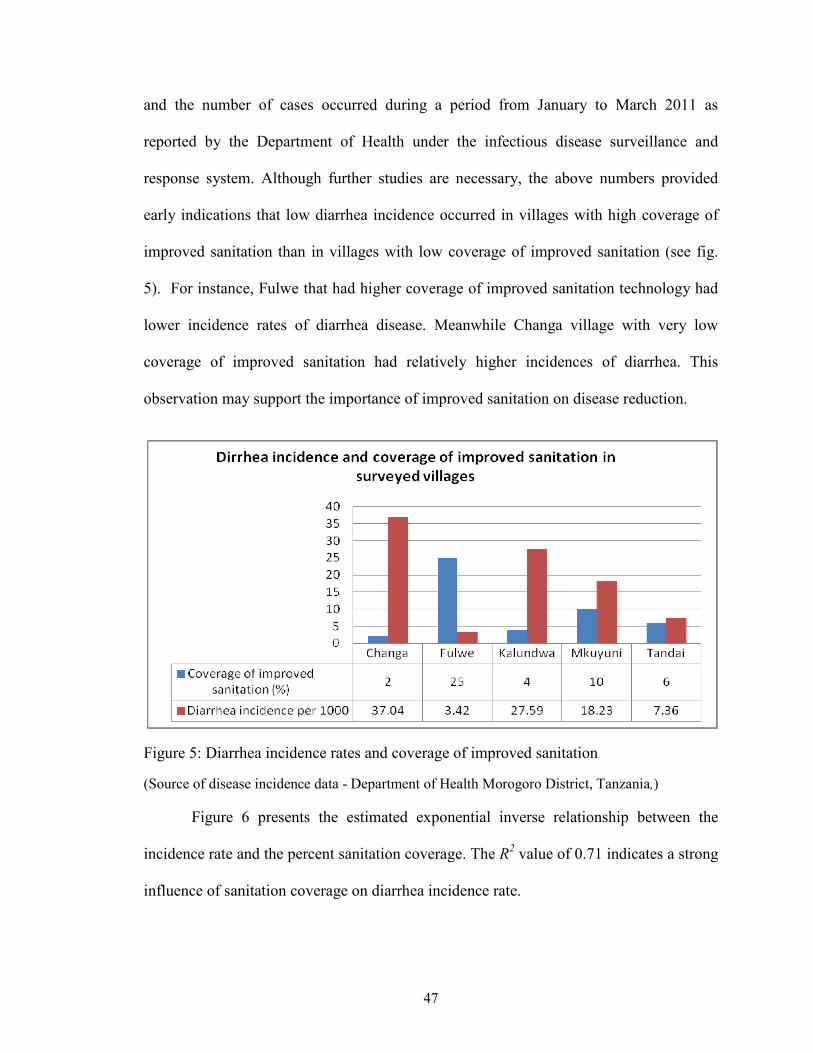
47
and the number of cases occurred during a period from January to March 2011 as
reported by the Department of Health under the infectious disease surveillance and
response system. Although further studies are necessary, the above numbers provided
early indications that low diarrhea incidence occurred in villages with high coverage of
improved sanitation than in villages with low coverage of improved sanitation (see fig.
5). For instance, Fulwe that had higher coverage of improved sanitation technology had
lower incidence rates of diarrhea disease. Meanwhile Changa village with very low
coverage of improved sanitation had relatively higher incidences of diarrhea. This
observation may support the importance of improved sanitation on disease reduction.
Figure 5: Diarrhea incidence rates and coverage of improved sanitation
(Source of disease incidence data - Department of Health Morogoro District, Tanzania,)
Figure 6 presents the estimated exponential inverse relationship between the
incidence rate and the percent sanitation coverage. The R2 value of 0.71 indicates a strong
influence of sanitation coverage on diarrhea incidence rate.
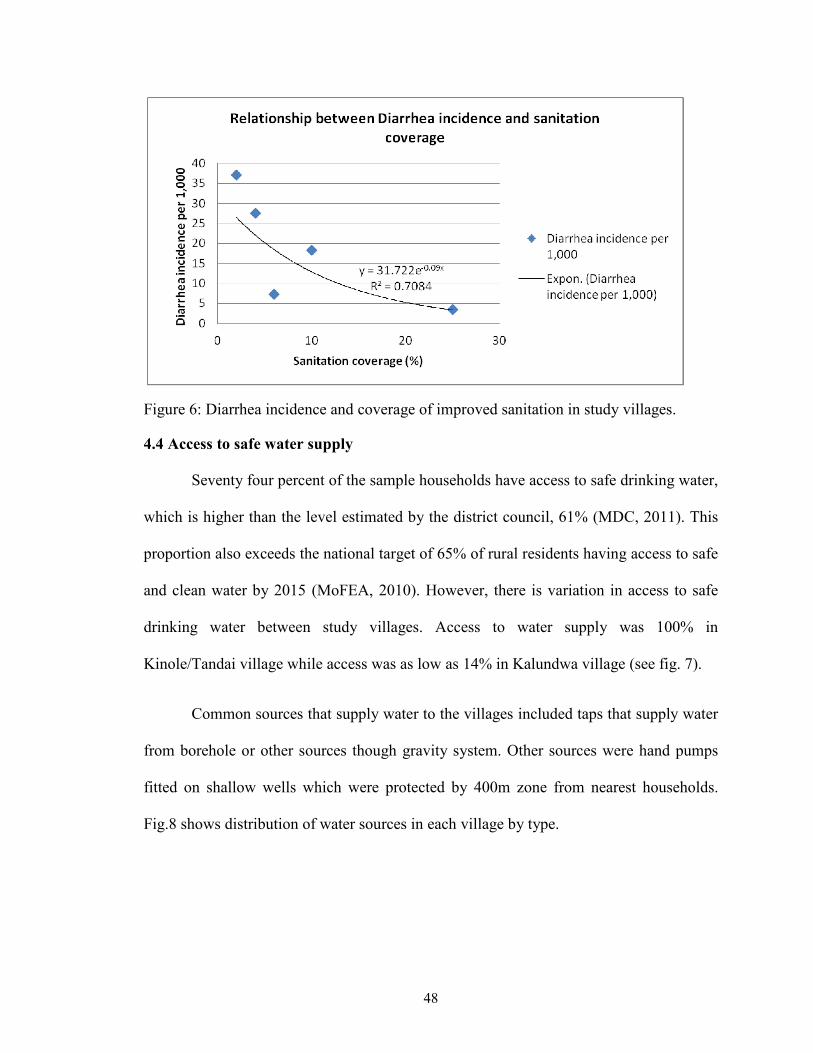
48
Figure 6: Diarrhea incidence and coverage of improved sanitation in study villages.
4.4 Access to safe water supply
Seventy four percent of the sample households have access to safe drinking water,
which is higher than the level estimated by the district council, 61% (MDC, 2011). This
proportion also exceeds the national target of 65% of rural residents having access to safe
and clean water by 2015 (MoFEA, 2010). However, there is variation in access to safe
drinking water between study villages. Access to water supply was 100% in
Kinole/Tandai village while access was as low as 14% in Kalundwa village (see fig. 7).
Common sources that supply water to the villages included taps that supply water
from borehole or other sources though gravity system. Other sources were hand pumps
fitted on shallow wells which were protected by 400m zone from nearest households.
Fig.8 shows distribution of water sources in each village by type.
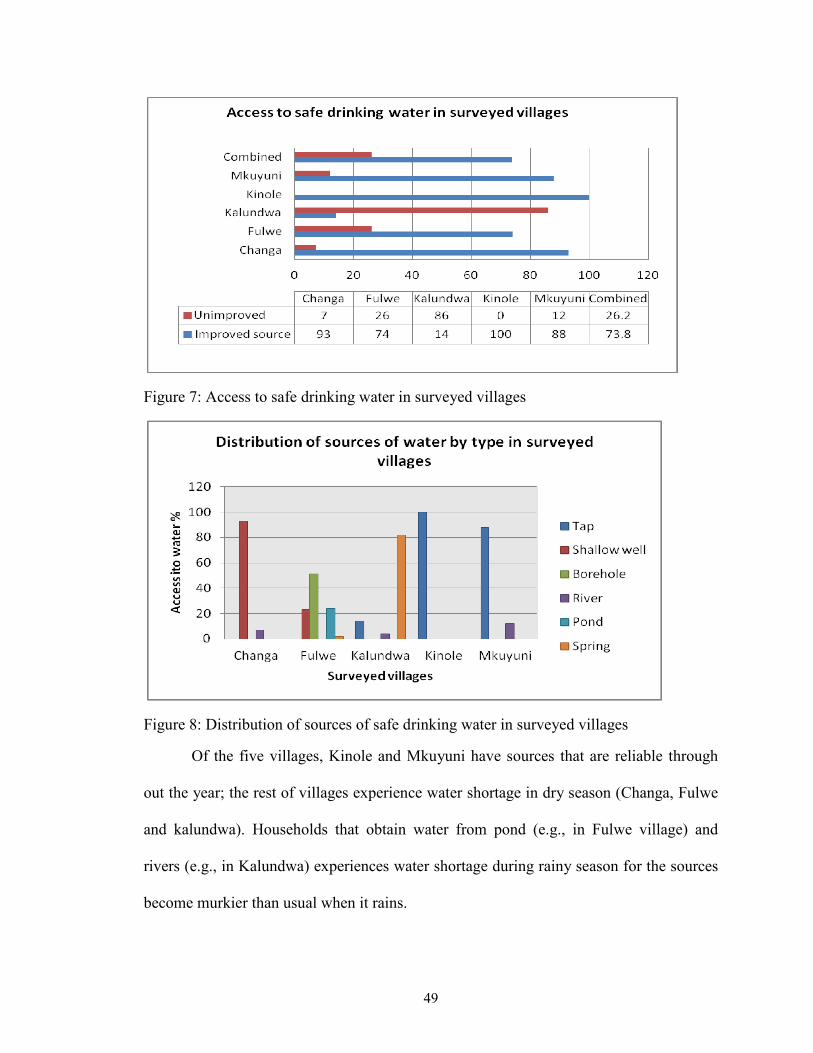
49
Figure 7: Access to safe drinking water in surveyed villages
Figure 8: Distribution of sources of safe drinking water in surveyed villages
Of the five villages, Kinole and Mkuyuni have sources that are reliable through
out the year; the rest of villages experience water shortage in dry season (Changa, Fulwe
and kalundwa). Households that obtain water from pond (e.g., in Fulwe village) and
rivers (e.g., in Kalundwa) experiences water shortage during rainy season for the sources
become murkier than usual when it rains.
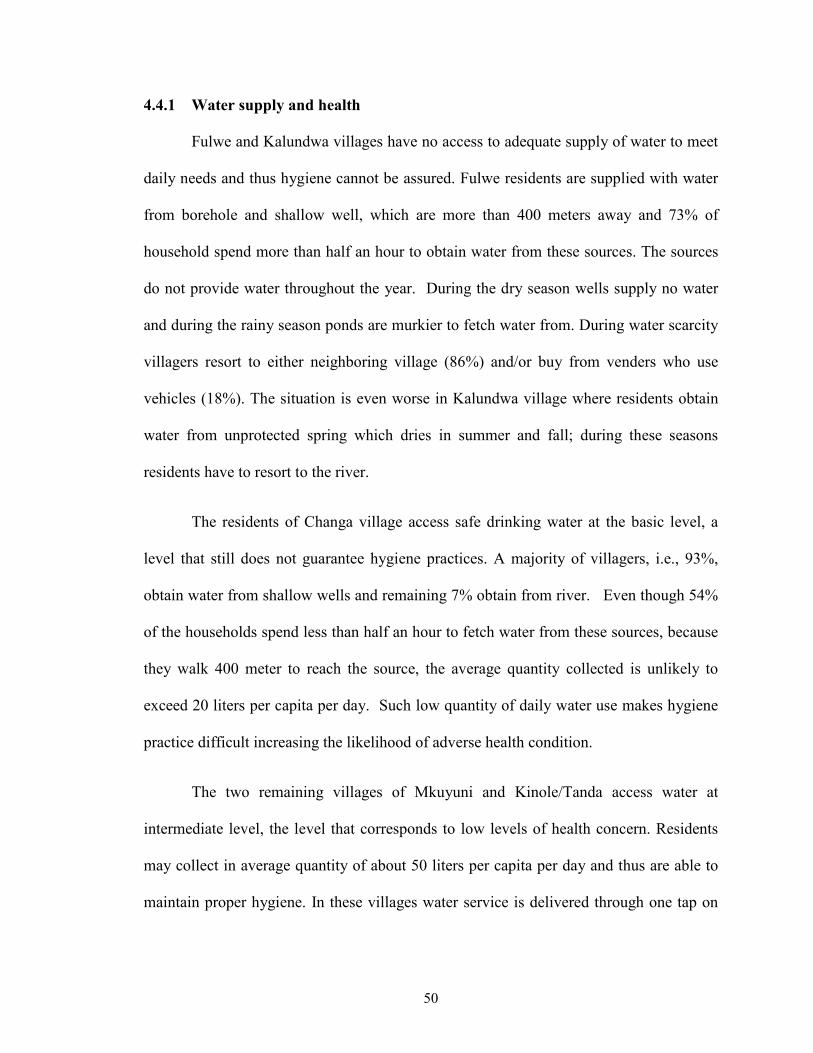
50
4.4.1 Water supply and health
Fulwe and Kalundwa villages have no access to adequate supply of water to meet
daily needs and thus hygiene cannot be assured. Fulwe residents are supplied with water
from borehole and shallow well, which are more than 400 meters away and 73% of
household spend more than half an hour to obtain water from these sources. The sources
do not provide water throughout the year. During the dry season wells supply no water
and during the rainy season ponds are murkier to fetch water from. During water scarcity
villagers resort to either neighboring village (86%) and/or buy from venders who use
vehicles (18%). The situation is even worse in Kalundwa village where residents obtain
water from unprotected spring which dries in summer and fall; during these seasons
residents have to resort to the river.
The residents of Changa village access safe drinking water at the basic level, a
level that still does not guarantee hygiene practices. A majority of villagers, i.e., 93%,
obtain water from shallow wells and remaining 7% obtain from river. Even though 54%
of the households spend less than half an hour to fetch water from these sources, because
they walk 400 meter to reach the source, the average quantity collected is unlikely to
exceed 20 liters per capita per day. Such low quantity of daily water use makes hygiene
practice difficult increasing the likelihood of adverse health condition.
The two remaining villages of Mkuyuni and Kinole/Tanda access water at
intermediate level, the level that corresponds to low levels of health concern. Residents
may collect in average quantity of about 50 liters per capita per day and thus are able to
maintain proper hygiene. In these villages water service is delivered through one tap on

51
plot or at a communal place within 100 meters, and residents spends less than 30 minutes
in total collection time. In Mkuyuni, 96% of residents reported to have spent less than 30
minutes in total collection time, and 97% of the respondents said the sources were able to
supply water throughout the year. The situation is similar in Kinole/Tandai village, in
which all households visited receive water supply though a tap at the plot or at a
communal place, with furthest household located within 100 meter, and the service is
available all year long.
4.4.2 Water supply and diseases incidences
Incidence of diarrhea is expected to be lower in villages with adequate supply of
water as compared to those with limited access to safe water supply. The data obtained in
this surveyed is insufficient to support the relationship between diarrhea disease
incidence and access to water. For instance Mkuyuni and Kinole/Tandai villages have
higher access to water (intermediate level), and the incidence of diarhoea is lower.
However, Changa village has basic access to water yet its diarrhea incidence is higher
than villages with limited access, Fulwe and Kalundwa (see Fig. 9). Therefore, we fail to
find a clearance evidence for support for the association between diarrheas incidence and
access to basic water supply in the study villages.
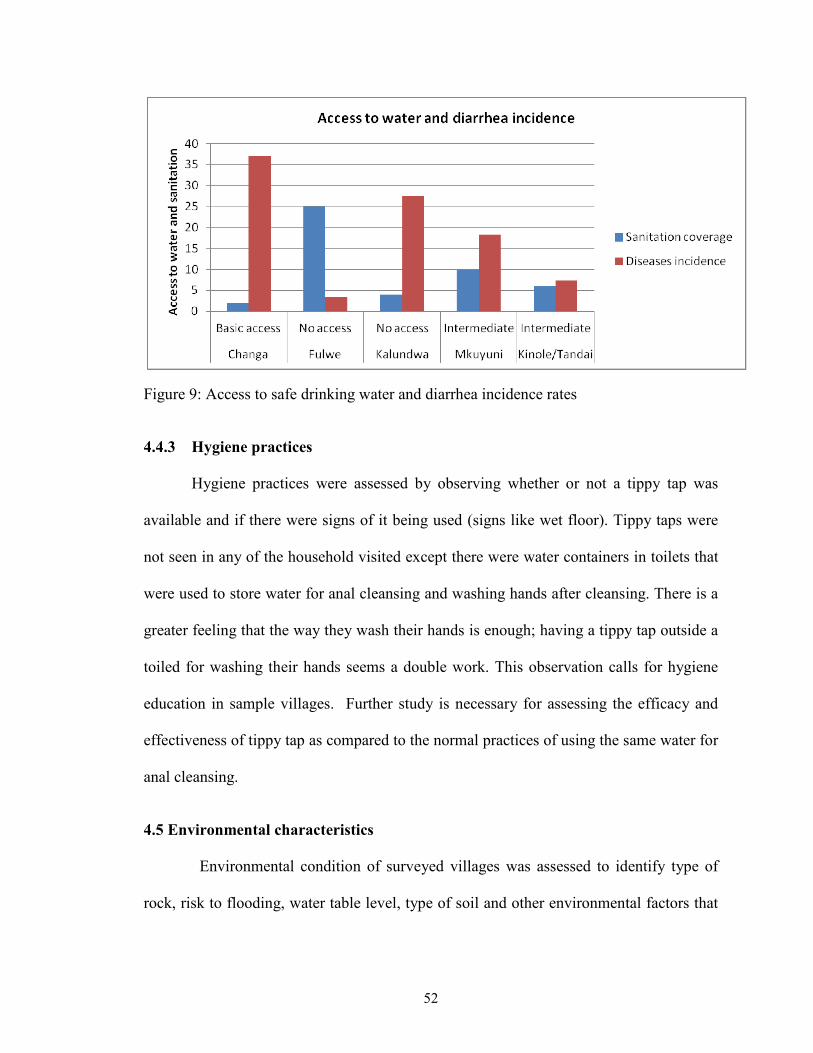
52
Figure 9: Access to safe drinking water and diarrhea incidence rates
4.4.3 Hygiene practices
Hygiene practices were assessed by observing whether or not a tippy tap was
available and if there were signs of it being used (signs like wet floor). Tippy taps were
not seen in any of the household visited except there were water containers in toilets that
were used to store water for anal cleansing and washing hands after cleansing. There is a
greater feeling that the way they wash their hands is enough; having a tippy tap outside a
toiled for washing their hands seems a double work. This observation calls for hygiene
education in sample villages. Further study is necessary for assessing the efficacy and
effectiveness of tippy tap as compared to the normal practices of using the same water for
anal cleansing.
4.5 Environmental characteristics
Environmental condition of surveyed villages was assessed to identify type of
rock, risk to flooding, water table level, type of soil and other environmental factors that
53
affects strength of a toilet pits or local availability of material for construction of toilets.
The aim is to ascertain feasibility of proposed new technologies.
Except Fulwe village which is at the foot or low land, the rest of villages are
located high up the Uluguru mountain. Mkuyuni village is higher in elevation than Fulwe
whereas Kinole is at the highest level compared to all villages. The soil type in Fulwe is
reddish/brownish clay soil, and the water table is about 6 meter – 30 meter deep. Other
villages which are in mountainous area have soil type that contains a mixture of alluvium
deposits clay, sand and gravel. The water table is as high as 5 meter – 10 meter deep.
Some residents in Mkuyuni A and Mkuyuni B find water while excavating pits which
suggests a high water table. The rock is hard to excavate in Fulwe village and some parts
of Mkuyuni and Changa villages. During excavating pit stones are found, and villagers
hammer or end up excavating a shallow pit of about six feet or less. This depth is not
adequate if compared to the Ministry of Health guidelines which recommend a pit depth
of 12 ft (MoHSW, 2010). Nevertheless, a pit depth of 6 – 9 feet may be enough provided
a 6 feet height is left above water table level (Mara, 1985).
Generally, the geological characteristic of the area is such that the soil is loose
and collapses easily. A common complaint that the households has is that mice are a
major cause of pit collapse in their villages. Mice destroy toilet pits by burrowing under
lateral logs used to construct a floor/slab. Burrowing animals fall standing wall; for
example, rabbits can fall a huge cliff along the ocean (Bird, 1994; Griggs, 1994).
Some parts of Fulwe and Changa village experience floods. For instance, the sub
villages of Dindili and Nungu, both from Fulwe village, experienced flooding one year
ago and two years ago, respectively. In 2009 flood hit Misala sub village before hitting
54
Mkuyuni B the next year. All 20 respondents in Mkuyuni B still remember the flooding
event while only 2% (N=20) of people in Misala could remember a flooding event. This
may be due to the fact that the floods affected few in Misala, but also there is a tendency
for people to forget hazards within short time.
Toilet pits are covered by logs derived from natural and exotic trees. The
commonly used tree as source of logs/wood is Spyrostachys africana or Mcharaka in
Swahili. Other trees used are Bridelia micrantha, known by indigenous people as Mwiza
in Luguru or Mkarati in Swahili, Artocarpus heterophyllus called Mfenesi in Swahili and
Cedrella odorata or Msederela. These are common trees in this area. All five villages
have natural forests that rage in size between 2.12 KM2 in Kalundwa to 3.95 KM2 in
Kinole/Tanda. The abundance of these trees however is not known since the inventory
was yet to be established.
4.6 Social and institutional aspects
One single important determinant of sustainable sanitation system is the
availability of a system at a lower administrative level that oversees the proper
application of the sanitation system proposed (Mara, 2007). The system to oversee
sanitation system is blurred at lower level. The capacity, roles and responsibilities of key
institutional players in sanitation at lower levels are yet to form.
At the district level, sanitation services are overseen by two departments, namely,
Water and Health Departments. At the village level, however, sanitation services are
overseen by Health Department through a Health Officer who operates at the entire ward.
Some wards do not have health officers; Kinole Ward for example had no health officer
55
when this study was carried out. At the local level, health officers have to work with
village health workers. However, due to lack of incentives, most of these village workers
work in an ad hoc manner. In surveyed villages the workers were not even found.
Households in villages are scattered with some of them being in very remote and
difficult-to-access areas especially during rain seasons. It takes days for one health officer
to reach all households for inspection. In addition to that the officer lack guidelines that
could assist him or her in the delivery of hygiene education.
The Water Supply and Sanitation Act of 2010 requires that every village with
water supply system form a water users association. The water users association is then
charged with the mandate to oversee water supply and sanitation issues in the area. At the
community meetings, members discuss water supply issues, but rarely do they mention
sanitation issues.
4.6.1 Perception of villagers on recommended sanitation technologies
Sanitation status in surveyed villages is generally poor. While villagers realize
the importance of improving sanitation; they feel that improvement is impossible because
their income is low. One respondent was quoted saying, “hali yetu ndiyo hii kijana,”
meaning “this is all we can do, boy.” Others are concerned about constructing permanent
latrine due to frequent collapse of pits. They feel that the construction of permanent toilet
is a wasteful investment. Pit collapse and tilting may in part be due to poor construction
(sizing of logs), heavy rain, topography and weak pit walls, which are unlined thus easily
attacked by mice.
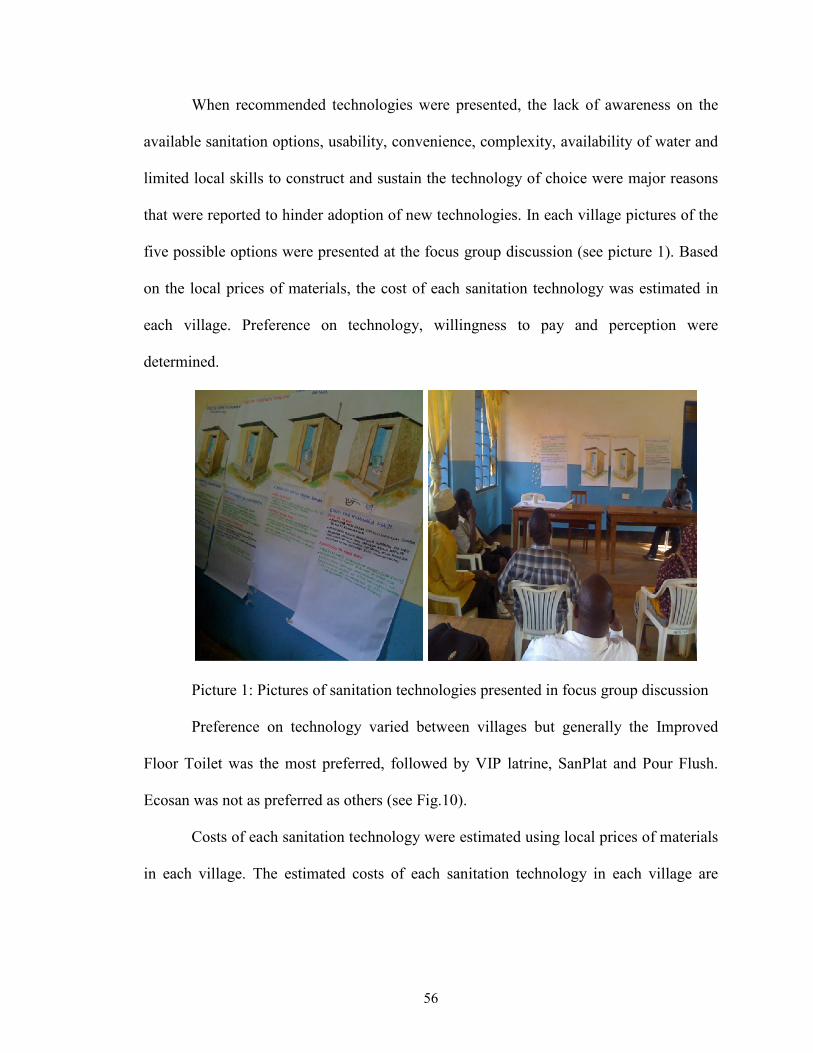
56
When recommended technologies were presented, the lack of awareness on the
available sanitation options, usability, convenience, complexity, availability of water and
limited local skills to construct and sustain the technology of choice were major reasons
that were reported to hinder adoption of new technologies. In each village pictures of the
five possible options were presented at the focus group discussion (see picture 1). Based
on the local prices of materials, the cost of each sanitation technology was estimated in
each village. Preference on technology, willingness to pay and perception were
determined.
Picture 1: Pictures of sanitation technologies presented in focus group discussion
Preference on technology varied between villages but generally the Improved
Floor Toilet was the most preferred, followed by VIP latrine, SanPlat and Pour Flush.
Ecosan was not as preferred as others (see Fig.10).
Costs of each sanitation technology were estimated using local prices of materials
in each village. The estimated costs of each sanitation technology in each village are
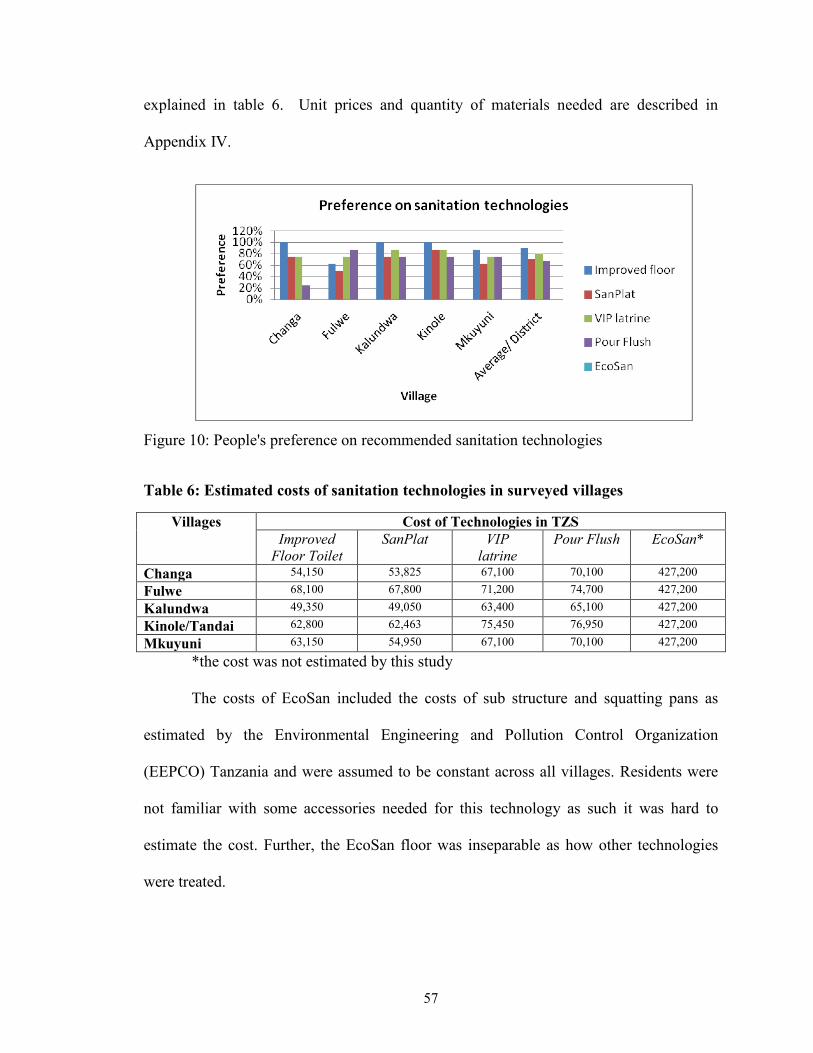
57
explained in table 6. Unit prices and quantity of materials needed are described in
Appendix IV.
Figure 10: People's preference on recommended sanitation technologies
Table 6: Estimated costs of sanitation technologies in surveyed villages
Villages Cost of Technologies in TZS Improved
Floor Toilet SanPlat VIP
latrine Pour Flush EcoSan*
Changa 54,150 53,825 67,100 70,100 427,200 Fulwe 68,100 67,800 71,200 74,700 427,200 Kalundwa 49,350 49,050 63,400 65,100 427,200 Kinole/Tandai 62,800 62,463 75,450 76,950 427,200 Mkuyuni 63,150 54,950 67,100 70,100 427,200
*the cost was not estimated by this study
The costs of EcoSan included the costs of sub structure and squatting pans as
estimated by the Environmental Engineering and Pollution Control Organization
(EEPCO) Tanzania and were assumed to be constant across all villages. Residents were
not familiar with some accessories needed for this technology as such it was hard to
estimate the cost. Further, the EcoSan floor was inseparable as how other technologies
were treated.
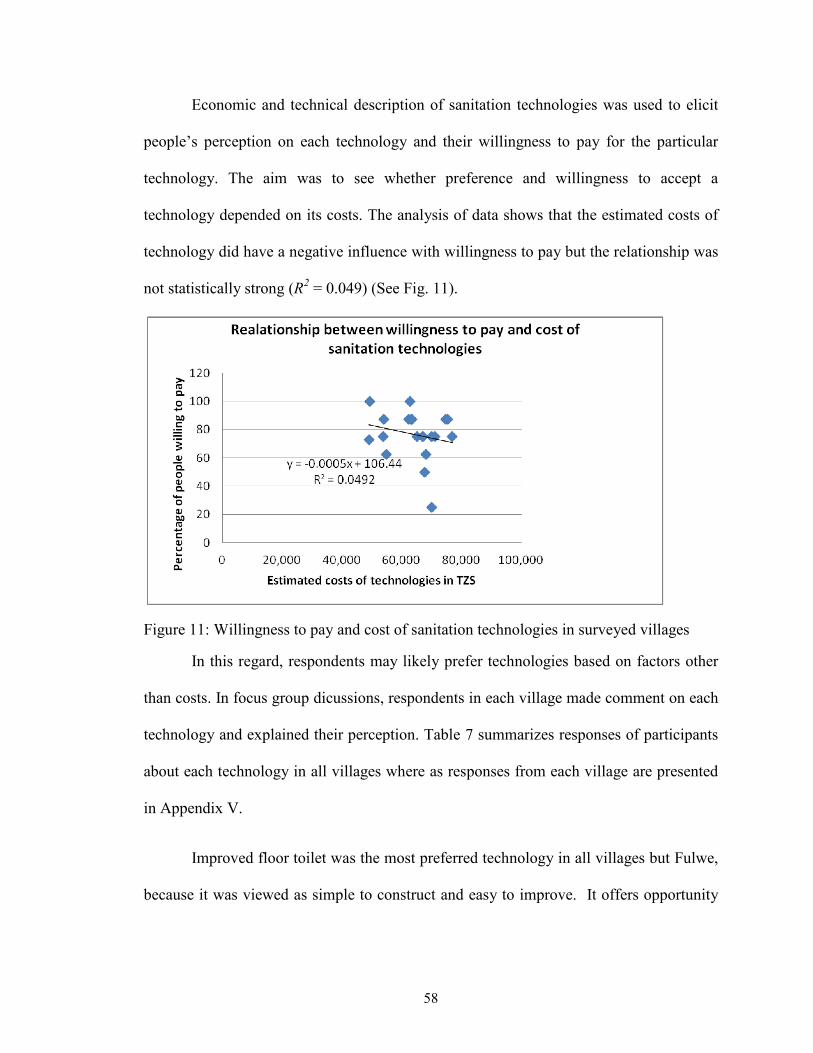
58
Economic and technical description of sanitation technologies was used to elicit
people’s perception on each technology and their willingness to pay for the particular
technology. The aim was to see whether preference and willingness to accept a
technology depended on its costs. The analysis of data shows that the estimated costs of
technology did have a negative influence with willingness to pay but the relationship was
not statistically strong (R2 = 0.049) (See Fig. 11).
Figure 11: Willingness to pay and cost of sanitation technologies in surveyed villages
In this regard, respondents may likely prefer technologies based on factors other
than costs. In focus group dicussions, respondents in each village made comment on each
technology and explained their perception. Table 7 summarizes responses of participants
about each technology in all villages where as responses from each village are presented
in Appendix V.
Improved floor toilet was the most preferred technology in all villages but Fulwe,
because it was viewed as simple to construct and easy to improve. It offers opportunity
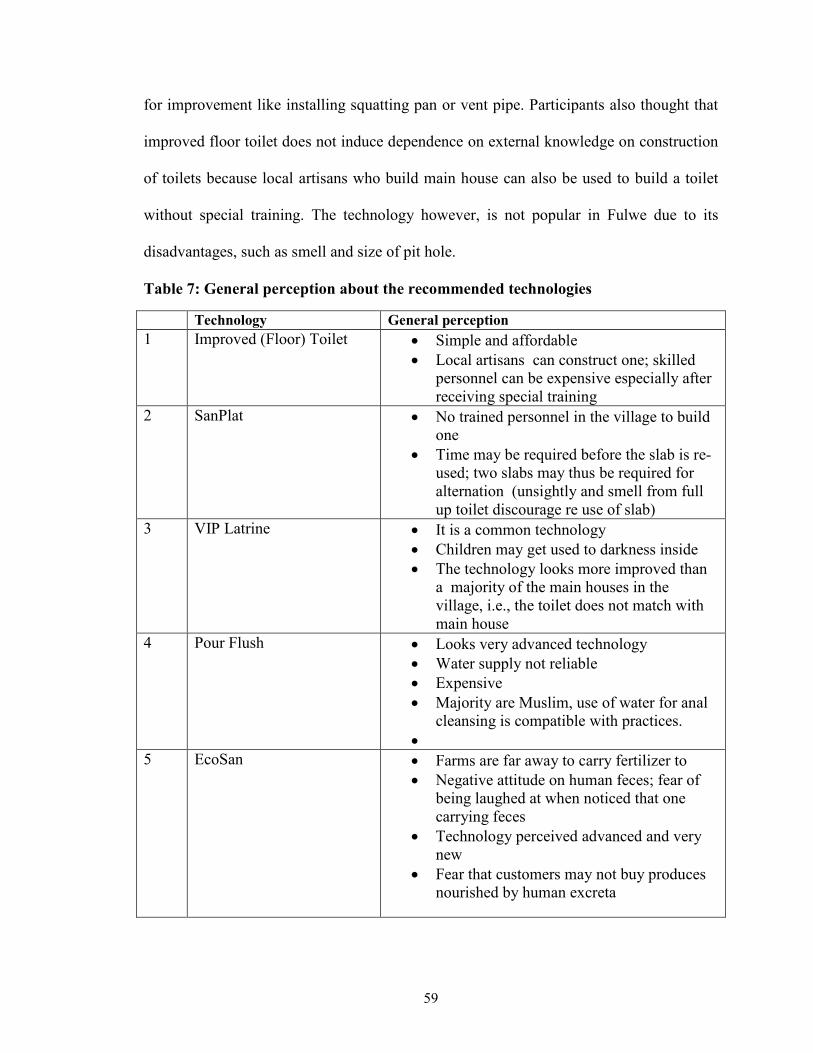
59
for improvement like installing squatting pan or vent pipe. Participants also thought that
improved floor toilet does not induce dependence on external knowledge on construction
of toilets because local artisans who build main house can also be used to build a toilet
without special training. The technology however, is not popular in Fulwe due to its
disadvantages, such as smell and size of pit hole.
Table 7: General perception about the recommended technologies
Technology General perception 1 Improved (Floor) Toilet • Simple and affordable
• Local artisans can construct one; skilled personnel can be expensive especially after receiving special training
2 SanPlat • No trained personnel in the village to build one
• Time may be required before the slab is re-used; two slabs may thus be required for alternation (unsightly and smell from full up toilet discourage re use of slab)
3 VIP Latrine • It is a common technology • Children may get used to darkness inside • The technology looks more improved than
a majority of the main houses in the village, i.e., the toilet does not match with main house
4 Pour Flush • Looks very advanced technology • Water supply not reliable • Expensive • Majority are Muslim, use of water for anal
cleansing is compatible with practices. •
5 EcoSan • Farms are far away to carry fertilizer to • Negative attitude on human feces; fear of
being laughed at when noticed that one carrying feces
• Technology perceived advanced and very new
• Fear that customers may not buy produces nourished by human excreta
60
Kalundwa village has limited access to water supply yet residents preferred pour
flush toilet. The main reasons were that residents viewed other technologies as inferior
and that they did not want to opt for an inferior technology. Further the village has
limited access to safe water supply, and therefore, choosing a technology that requires
water supply was seen as a way to pressurize government to supply more and safer
drinking water to their village.
SanPlat technology was simple and was the cheapest technology among all
technologies in all villages. The technology however wasn’t much preferred for it
required trained artisans. Their experience was that trained artisan frequently left their
villages or had standardized cost that may be hard to bargain by the majority of people in
the village. Local artisans were trained at Fulwe village in 2005. During this survey
however none of the trained artisan was found. The trained artisans either left the village
or changed carrier. Residents were hesitant to accept the idea of re-using the Sanplat
slab. Several of the households expressed that they would need more time before they
uninstalled a full pit and installed a new one. The smell and unsightly situation of a full
pit may be discouraging.
Villagers did not prefer ecological sanitation or EcoSan. The technology was seen
as a complex and expensive, and the fertilizer it provided was not required at the time
being. While residents planted banana trees in abandoned toilet pits, they did not want to
eat those bananas themselves but sold them. Another limitation of adopting EcoSan was
that farms are very far away from the villages they live and as such carrying
excreta/fertilizer may be required, an idea that didn’t sound socially acceptable to them.

61
4.7 Sustainability of technologies
Residents have preference on certain types of sanitation options. The physical
environment and other factors however may limit the use of the sanitation technology of
their choice. For instance, the pour flush toilet may be preferred by villagers, but the fact
that water may be in short supply in that particular village may limit its adoption. Some
residents may also like to construct an Ecosan but the unavailability of material locally or
skills may hinder its feasibility. The villagers nevertheless have to use one of the
improved sanitation technologies in order to improve their health and social well being. A
balance has to be sought to assist communities to choose ‘appropriate’ sanitation
technology that is compatible with their financial ability and willingness to pay, social
compatibility, physical environmental characteristics, and the characteristics of
technology. The following sustainability assessment is one of the ways to determine
what that appropriate technology would be for each village.
This study assessed sustainability of technologies by calculating composite
sustainable development index (ICSD). The calculation was accomplished on an excel
spread sheet as illustrated in Appendix VI. The calculation of ICSD took into consideration
the weights of the four criteria: social factor, affordability, technical feasibility, and
environmental factor. Experts working in the area of sanitation, hygiene and water supply
ranked the factors in a pair-wise comparison.
Using average weights from the pair-wise comparison matrix, (refer table 3), the
factors can be ranked as seen in Fig. 12. Social factors were ranked the highest while
environmental factors were ranked the least.
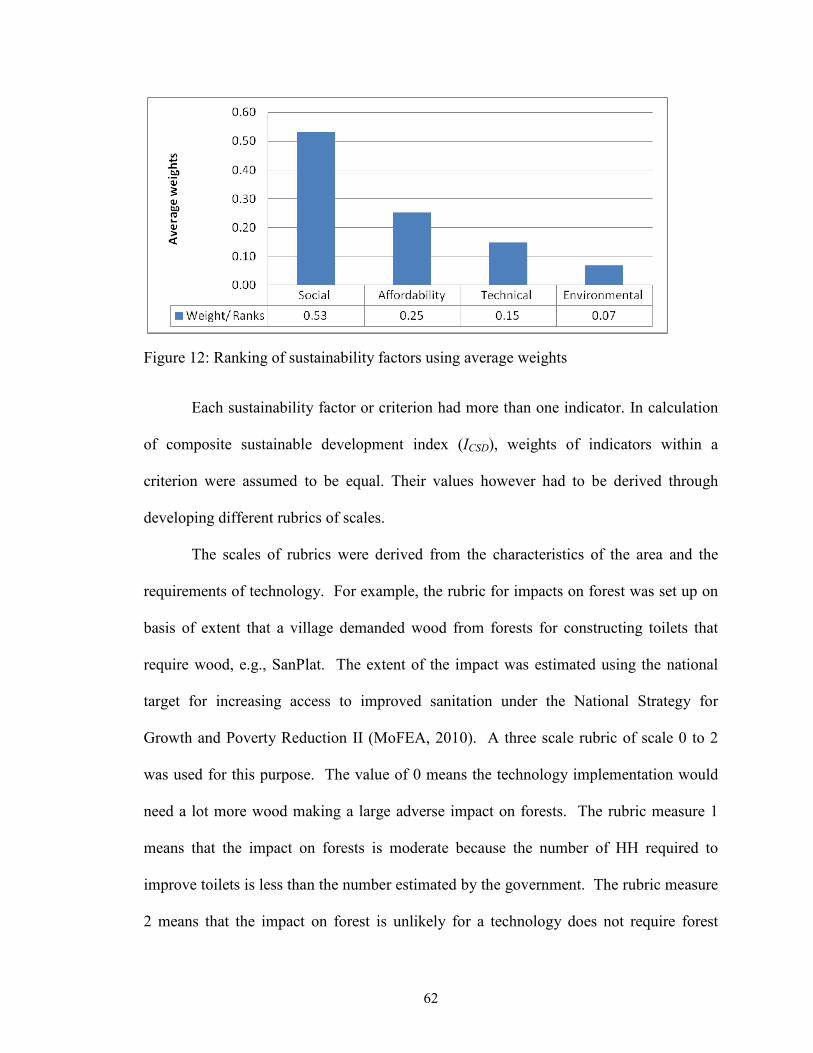
62
Figure 12: Ranking of sustainability factors using average weights
Each sustainability factor or criterion had more than one indicator. In calculation
of composite sustainable development index (ICSD), weights of indicators within a
criterion were assumed to be equal. Their values however had to be derived through
developing different rubrics of scales.
The scales of rubrics were derived from the characteristics of the area and the
requirements of technology. For example, the rubric for impacts on forest was set up on
basis of extent that a village demanded wood from forests for constructing toilets that
require wood, e.g., SanPlat. The extent of the impact was estimated using the national
target for increasing access to improved sanitation under the National Strategy for
Growth and Poverty Reduction II (MoFEA, 2010). A three scale rubric of scale 0 to 2
was used for this purpose. The value of 0 means the technology implementation would
need a lot more wood making a large adverse impact on forests. The rubric measure 1
means that the impact on forests is moderate because the number of HH required to
improve toilets is less than the number estimated by the government. The rubric measure
2 means that the impact on forest is unlikely for a technology does not require forest
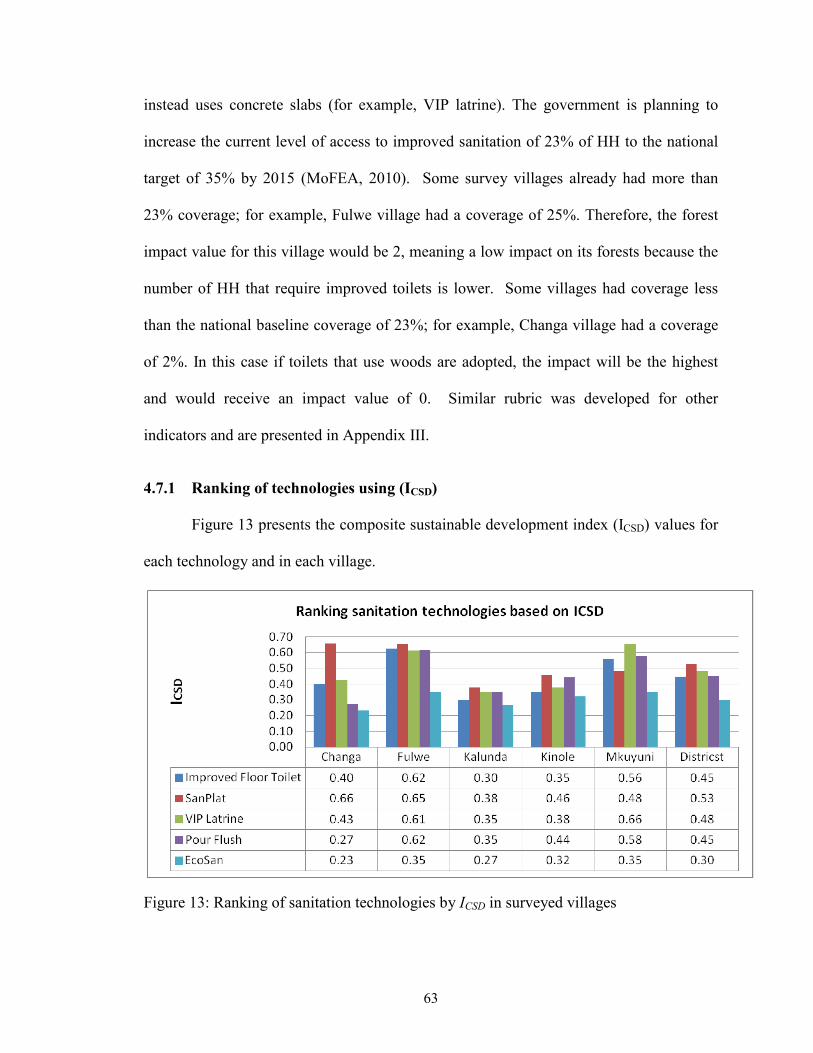
63
instead uses concrete slabs (for example, VIP latrine). The government is planning to
increase the current level of access to improved sanitation of 23% of HH to the national
target of 35% by 2015 (MoFEA, 2010). Some survey villages already had more than
23% coverage; for example, Fulwe village had a coverage of 25%. Therefore, the forest
impact value for this village would be 2, meaning a low impact on its forests because the
number of HH that require improved toilets is lower. Some villages had coverage less
than the national baseline coverage of 23%; for example, Changa village had a coverage
of 2%. In this case if toilets that use woods are adopted, the impact will be the highest
and would receive an impact value of 0. Similar rubric was developed for other
indicators and are presented in Appendix III.
4.7.1 Ranking of technologies using (ICSD)
Figure 13 presents the composite sustainable development index (ICSD) values for
each technology and in each village.
Figure 13: Ranking of sanitation technologies by ICSD in surveyed villages
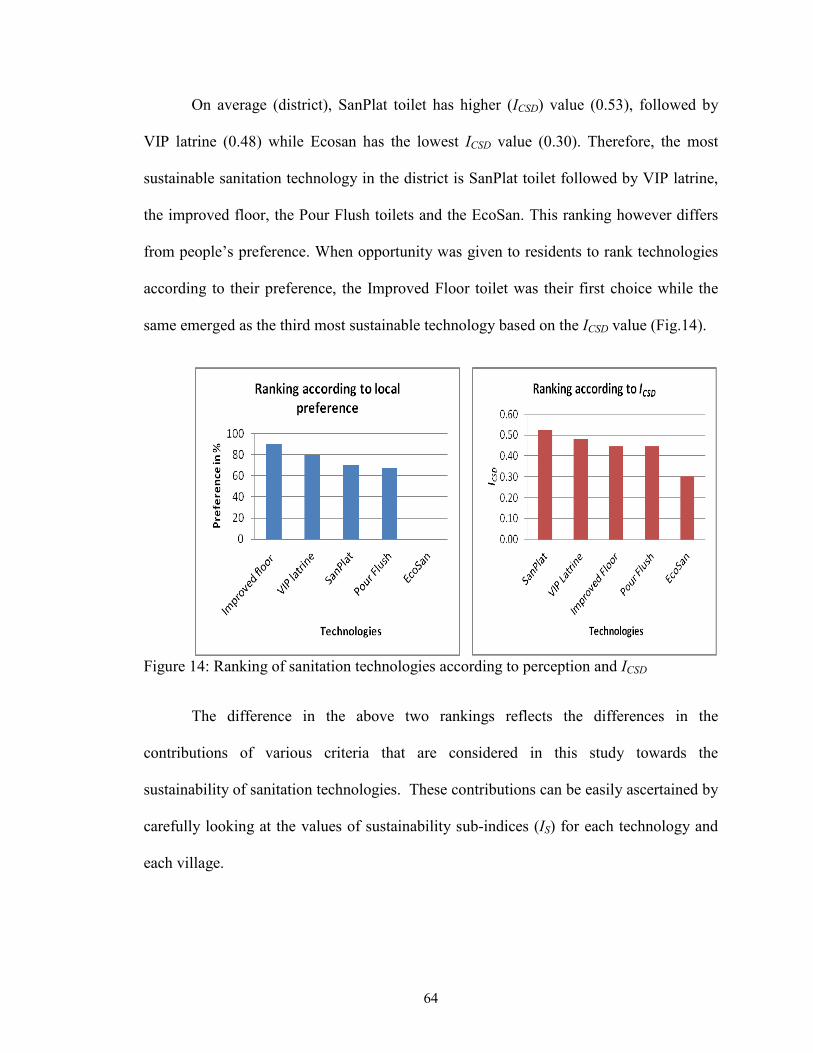
64
On average (district), SanPlat toilet has higher (ICSD) value (0.53), followed by
VIP latrine (0.48) while Ecosan has the lowest ICSD value (0.30). Therefore, the most
sustainable sanitation technology in the district is SanPlat toilet followed by VIP latrine,
the improved floor, the Pour Flush toilets and the EcoSan. This ranking however differs
from people’s preference. When opportunity was given to residents to rank technologies
according to their preference, the Improved Floor toilet was their first choice while the
same emerged as the third most sustainable technology based on the ICSD value (Fig.14).
Figure 14: Ranking of sanitation technologies according to perception and ICSD
The difference in the above two rankings reflects the differences in the
contributions of various criteria that are considered in this study towards the
sustainability of sanitation technologies. These contributions can be easily ascertained by
carefully looking at the values of sustainability sub-indices (IS) for each technology and
each village.
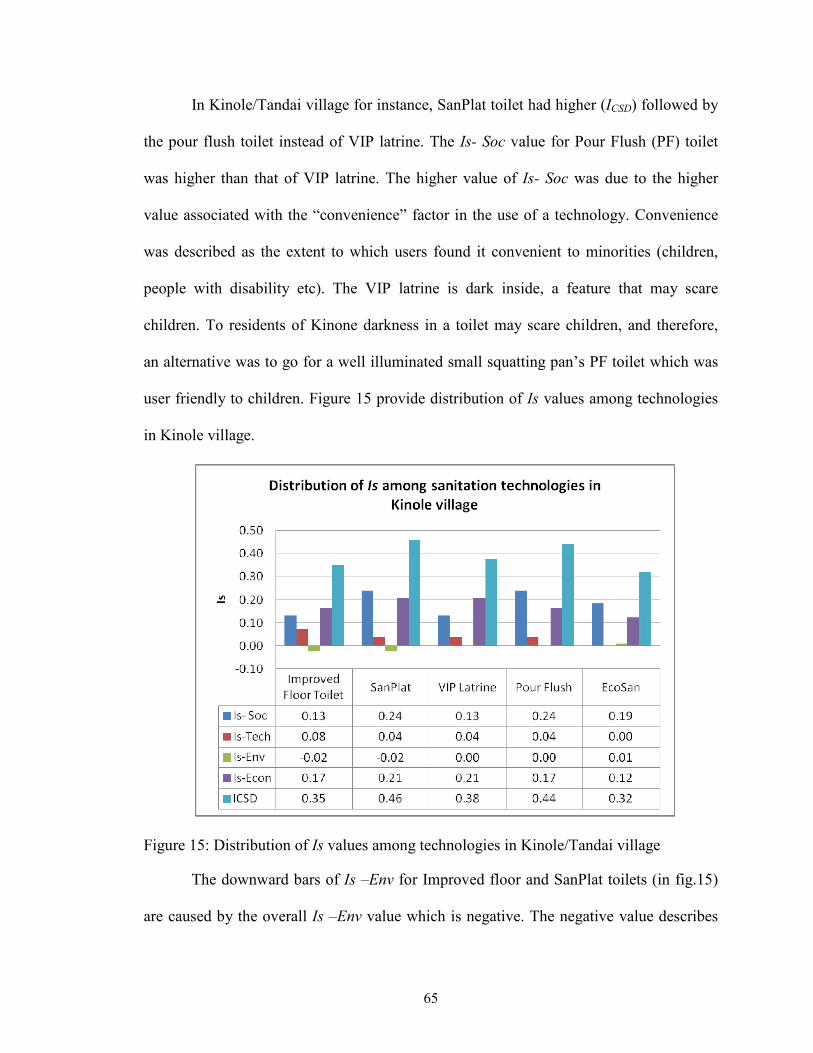
65
In Kinole/Tandai village for instance, SanPlat toilet had higher (ICSD) followed by
the pour flush toilet instead of VIP latrine. The Is- Soc value for Pour Flush (PF) toilet
was higher than that of VIP latrine. The higher value of Is- Soc was due to the higher
value associated with the “convenience” factor in the use of a technology. Convenience
was described as the extent to which users found it convenient to minorities (children,
people with disability etc). The VIP latrine is dark inside, a feature that may scare
children. To residents of Kinone darkness in a toilet may scare children, and therefore,
an alternative was to go for a well illuminated small squatting pan’s PF toilet which was
user friendly to children. Figure 15 provide distribution of Is values among technologies
in Kinole village.
Figure 15: Distribution of Is values among technologies in Kinole/Tandai village
The downward bars of Is –Env for Improved floor and SanPlat toilets (in fig.15)
are caused by the overall Is –Env value which is negative. The negative value describes
66
negative impact the two technologies might have on forests. The two technologies use
logs from forests for construction of slabs. The VIP latrine and the PF latrine has an
overall zero Is –Env value meaning that the technologies might unlikely impact forests
because they use ferrocement slab which replaces the logs.
The ecological sanitation technology is the only technology with overall positive
Is –Env value over the other technologies. This is because the technology offers the
opportunity to use the nutrients from the technology, a feature that was regarded as
environmentally benign in this study.
In Mkuyuni village, VIP Latrine had higher ICSD value than the rest of
technologies, which was contrary to the district average. Socially, the two technologies
VIP Latrine and SanPlat toilet technologies are equally convenient and user friendly. To
Mkuyuni residents however, VIP latrine was their first preference (75%) than SanPlat
toilet (62.5%). In this case the Is- Soc for SanPlat was lower than that of VIP latrine.
The Is- Env for SanPlat was also lower than that of VIP latrine; this is due to the
probable impact SanPlat toilet might have on Mkuyuni village natural forests. The VIP
latrine utilizes no forest products. Also, Is-Econ value was higher for this technology,
which was due to higher willingness to pay for VIP latrine than SanPlat toilet.
In Kalundwa village the ranking of sanitation technologies was almost the same
as that of the district. In Fig.17, the value of ICSD for SanPlat was higher than both VIP
and PF latrine, followed by Improved Floor toilet and Ecosan.

67
Figure 16: Distribution of Is values among sanitation technologies in Mkuyuni village
Figure 17: Distribution of Is values among sanitation technologies in Kalundwa village
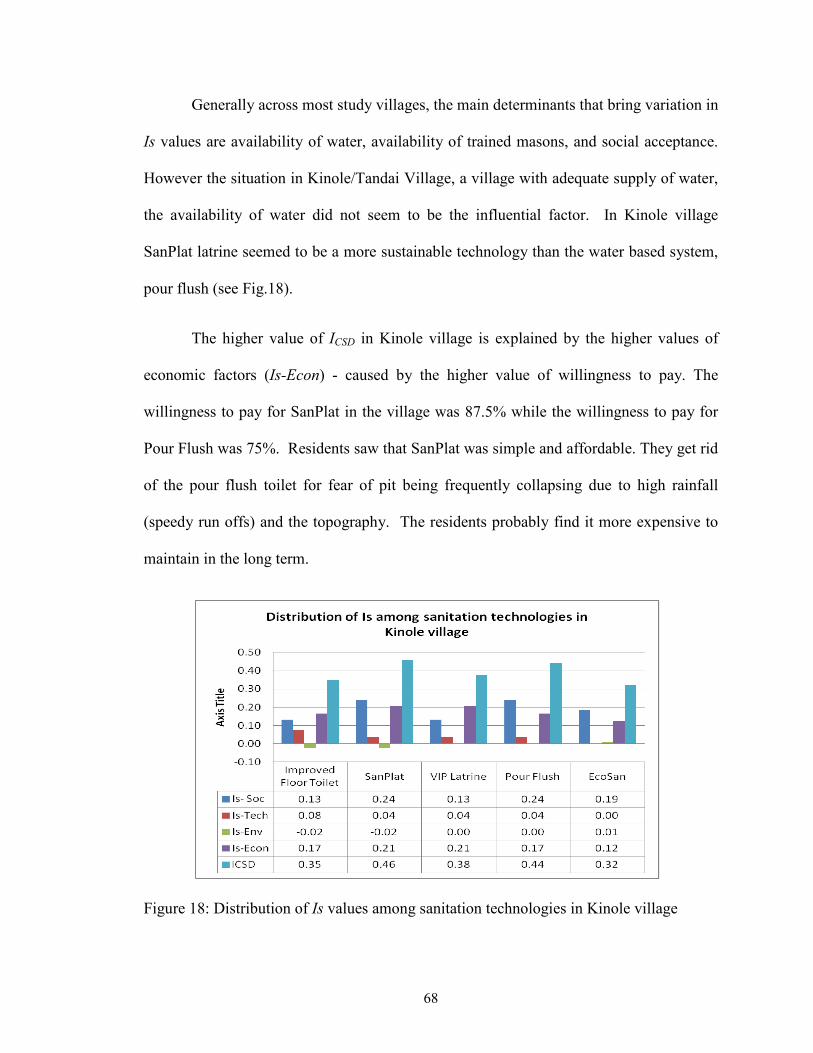
68
Generally across most study villages, the main determinants that bring variation in
Is values are availability of water, availability of trained masons, and social acceptance.
However the situation in Kinole/Tandai Village, a village with adequate supply of water,
the availability of water did not seem to be the influential factor. In Kinole village
SanPlat latrine seemed to be a more sustainable technology than the water based system,
pour flush (see Fig.18).
The higher value of ICSD in Kinole village is explained by the higher values of
economic factors (Is-Econ) - caused by the higher value of willingness to pay. The
willingness to pay for SanPlat in the village was 87.5% while the willingness to pay for
Pour Flush was 75%. Residents saw that SanPlat was simple and affordable. They get rid
of the pour flush toilet for fear of pit being frequently collapsing due to high rainfall
(speedy run offs) and the topography. The residents probably find it more expensive to
maintain in the long term.
Figure 18: Distribution of Is values among sanitation technologies in Kinole village
69
5.0 CONCLUSIONS AND RECOMENDATION
The Rural Tanzania is known for reliance on poor sanitation technologies. Past
studies have found strong relationship between poor sanitation and high morbidity and
mortality, especially sanitation-related diseases like diarrhea. The national strategy for
growth and poverty reduction has set targets for increasing improved sanitation services,
but these targets remain far from being achieved. There has been no systematic study to
understand the technical and socio-economic reasons people are slow to adopt improved
sanitation technologies. The aim of this study was to assess the sustainability of
sanitation technologies in rural Tanzania, based on a case study of Morogoro District.
Specifically, the research assessed the existing sanitation conditions and the associated
health, environmental and socio-economic problems in the study area. The study then
made an attempt to determine the physical-environmental characteristics and socio-
economic and institutional factors influencing the adoption of alternative sanitation
technologies. Further, the study applied a comprehensive framework of sustainability
indicators to rank sanitation technologies based on established sustainability criteria.
5.1 Existing sanitation conditions and the associated problems
Sanitation status in the study area is generally poor; toilets are constructed with
temporary materials. They have a mud floor, lack hand washing facilities and a
mechanism for controlling odor and flies thus compromising environmental health.
Incidence of diarrhea is high in villages with low coverage of improved sanitation.
Socio-cultural lifestyle of people compounded with habitual behavior and low education
level result into reliance on poor sanitation facilities and hygiene practices. In a study
70
conducted in Dar es salaam, Tanzania, habitual behavior was also seen as a barrier to
adoption of improved sanitation technologies (Chaggu et al., 2002).
Proportion of households with improved toilets (9.4%) is lower than national level
(23%). Since the national estimate is used to set target, these villages are likely to remain
behind other villages by 2015. Further, sanitation coverage in the rural area is likely to
lag behind coverage in urban areas in general because the initial sanitation target itself is
set lower in rural areas than in urban areas. As documented in the National Strategy for
Growth and Reduction of Poverty (NSGRP II), 2010 to 2015, the target is to increase the
number of households using improved toilets from 23 percent in rural areas and 27
percent in urban areas in 2010 to 35 percent rural areas and 45 percent urban areas in
2015 (MoFEA, 2010). Demand for sanitation are even higher in rural areas given their
higher number and limited access to health services, more effort are needed to improve
access to sanitation in rural areas.
5.2 Factors influencing adoption of alternative sanitation technologies
Limited access to adequate quantities of water may not limit the adoption of water
based technologies. There is adequate supply of water in Kinole than in Fulwe village,
yet residents in Kinole prefer SanPlat than Pour Flush due to other reasons. Access to
water was limited at Fulwe village yet PF toilet was a most preferred technology and as
well a sustainable technology than non water based technology like VIP latrine. This
indicate that selection of technology appropriate to an area has to consider social
characteristics of the locality especially preferences.
71
This study finds that in places where water table is higher, soil is loose and
gravelly, and burrowing animals are dominant, residents excavate shallow pits, which
provide poor sanitation service. Toilets in these villages lack cement floor and exposed to
outside weather (speedy run of, heavy rain and sloppy land) leading to their frequent
collapse. This calls for education on pit strengthening techniques and proper location in
order to protect both public health and the environment.
5.3 Sustainability of sanitation technologies and final ranking
The study results indicate that physical, socio-cultural, economic and institutional
characteristics of the area favor introduction and adoption of recommended new
sanitation technologies to a certain extent. Local characteristics determined the extent to
which one technology could be regarded most sustainable than the other. Factors like lack
of trained personnel, water table level, awareness about the available technology,
institutional framework at lower level are some of the area that determine sustainability
of a sanitation technology in a given locality.
On basis of composite sustainable development index (ICSD), the proposed
sanitation technologies may be sustainable in the order of most sustainable to least
sustainable: (1) SanPlat toilet, (2) VIP latrine, (3) Improved/cement mortar floor, (4)
Pour flush toilet, and (5) EcoSan. The ranking differs from people’s preferences, the
observation that signifies the importance of community participation in decision making.
Identification of most appropriate and sustainable sanitation technology paves a
way for technology improvement in rural Tanzania. The most sustainable technology
may be first introduced on a pilot basis and ensuring effective local participation. The
72
two way feedback mechanism that will facilitate redesign and improvement of the
technology to a level that meets demands of users is critical. Based on the study results,
we draw the following policy recommendations:
1. Residents have to be educated on health benefits of impervious floor. Impervious
floor is important even though main house does not have one (cement floor).
2. Education on low cost techniques for pit lining has to be provided to avoid
frequent pit collapse.
3. People have to be educated on risk and benefit associated with reuse of squatting
slab and nutrients from toilets. When one knows the benefit, he or she may find a
way to achieve it. For instance, during this study, we observed many local
modifications of pour flush system, which aimed at reducing the amount of water
for flushing.
4. Residents have to be informed of the available sanitation options given the
physical environment characteristics of their area.
5. Hand washing facilities were rare but people use water stored as washers to wash
their hands without soap. Further research may be required to assess whether
washing hand with soap using water stored as washer may render hands free from
fecal contamination.
6. The system that oversees sanitation need to be strengthened to ensure adequate
consultation for villagers on proper sanitation technologies and hygiene practices.
This goes together with continuous monitoring of progress in access to improved
sanitation, sanitation-related communication and training. Such progress must be
documented in important district and national reports.

73
7. The model for assessing sustainability of sanitation technologies by aggregating
different criteria (socio, economic, environmental and health) and indicators is
effective in assessing sustainability of sanitation technologies.
8. While village or district level comprehensive (aggregate) indicators may be useful
in ranking multiple technologies, it is important to look into constituent or sub-
component indicator values for specific village or technology in order to
understand the effect or significance of extreme factors. Such extreme factors
shed light on the need for specific policies promoting sanitation improvement
(e.g., education, government incentives, etc.).
9. Ward health officer and other staff working in the area of sanitation and hygiene
should be exposed to available low cost improved sanitation technologies and
innovative community participatory approaches. This is an important strategic
area in human and institution capacity development and may help rural Tanzania
meet its national targets for sanitation and hygiene in a timely fashion.
74
REFERENCES
Basu, S. and Weil, D.N. (1998). Appropriate technology and growth. Quarterly Journal of Economics 113 (4), 1025–1054. Bird, C.F.E (1994. Cliff Hazard and Coastal Management. In Coastal Hazards, Perception, Susceptibility and Mitigation, Finkl W.C. Jr. (Editor). The coastal Education and Research Foundation (CERF). Charlottesville, Virginia, and Fortd Lauderdale, Florida pp. 299-309 Brandberg, B. (1996). New Strategies for Community-based Sustainable Sanitation Programmes Using SanPlats and the New SanPlat Moulds, revised edition. SBI Consulting and Supplies, Mbabane, Swaziland (SanPlat details are given at www. sanplat.com). Chaggu, E., Mashauri, D., Buuren, J., Sanders, W. and Lettinga, G. (2002). Excreta Disposal in Dar-es Salaam. Environmental management, 30(5), 0609-0620 Checkley, W., Gilman, R.H., Black, R.E., Epstein, L.D., Cabrera, L., Sterling, C.R. and Moulton, L.H. (2004). Effect of water and sanitation on childhood health in a poor Peruvian peri-urban community. The Lancet, 363(9403), pp. 112-118. Cleavan, F. and Toner, A. (2006).The evolution of community water governance in Uchira, Tanzania: The implications for equality of access, sustainability and effectiveness. Natural Resources Forum; . 30(3). p207-218, DOI: 10.1111/j.1477-8947.2006.00115.x Crang, M. and Cook, I. (2007). Doing ethnographies, Sage Diwan, R and Livingston, D. (1979). Alternative Development Strategies and Appropriate Technology: Science Policy for an Equitable World Order, Pergamon Press. New York. Dzwairo, B., Hoko, Z., Love, D. and Guzha, E. (2006). Assessment of the impacts of pit latrines on groundwater quality in rural areas: A case study from Marondera district, Zimbabwe. Physics and Chemistry of the Earth, Parts A/B/C, 31(15-16), 779-788 Eisenberg, J. N., Scott, J. C., Porco, T. (2007). Integrating disease control strategies: Balancing water sanitation and hygiene interventions to reduce diarrheal disease burden (plus letter and reply). Am. J. Public Health, 97 (5), 846–852. Global Alliance for Community Development; Accessed on 4/30/2012 shttp://www.thegacd.org/Our%20Programs/Health/Health.html
75
Geoff, C. (2004). The Analytic Hierarchy Process (AHP). Practical Strategy. Open Access Material. AHP. Pearson Education Limited Griggs B.G. (1994). California’s Coastal hazards. In Coastal Hazards, Perception, Susceptibility and Mitigation. Finkl W.C Jr. (Editor). The coastal Education and Research Foundation (CERF). Charlottesville, Virginia, and Fortd Lauderdale, Florida pp. 1- 15 Hall, B. (1978). Mtu ni Afya. Tanzania's Health Campaign. Clearinghouse, Washington, DC, USA. Harvey, P.A., Baghri, S. and Reed, R.A. (2002). Emergency Sanitation: Assessment and programme design. WEDC, Loughborough University, UK. Hoko, Z. and Hertle, J. (2006). An evaluation of the sustainability of a rural water rehabilitation project in Zimbabwe. Phys. Chem. Earth, 31. 699-706 Howard, G. and Bartram, J. (2003). Domestic water quantity, service level and health. World Health Organisation, Geneva International water and sanitation centre (IRC). (2012). http://washhelpdesk.wordpress.com /2010/11/25/ differences-between-on-site-sanitation-and-off-site-sanitaton-zimbabwe/. Accessed on 5/6/2012 Igulu, S.B. (2010). Household factors contributing to recurrent episodes of acute diarrhoea in children under the age of five years in Kinondoni- Tanzania. Master’s Thesis. Lund University Jensen, P.K., Phuc, D.P., Dalsgaard, A., Konradsen, F. (2005). Successful sanitation promotion must recognize the use of latrine wastes in agriculture – the example of Vietnam. Bull. WHO 83, 873–874. Jequier, N. and Blanc, G. (1983). The World of Appropriate Technologv A Qualitative Analysis. Development Centre of the Organization for Economic Co-operation and Development, Paris. P. 6. Kabongo, I. and Charles, K., (2008). Pit Latrines & their Impact on Groundwater in Small Towns in Uganda A case of Bugiri Town Council Katukiza, A. Y., Ronteltap, M., Oleja, A., Niwagaba, C. B., Kansiime, F. & Lens, P. N. L. (2010). Selection of sustainable sanitation technologies for urban slums -- A case of Bwaise III in Kampala, Uganda. Science of The Total Environment, 409, 52-62. Knappett P.S.K., Escamilla, V., Layton, A., McKay, L.D., Emch, M., Williams, D.E., Huq, R., Alam, J., Farhana,L., Mailloux, B.J., Ferguson, A., Sayler, G.S., Ahmed, K.M.,
76
van Geen, A., (2011). Impact of population and latrines on fecal contamination of ponds in rural Bangladesh. Science of The Total Environment, 409(17), 3174-3182 Krajnc, D. and Glavič, P. (2005). A model for integrated assessment of sustainable development. Resources, Conservation and Recycling, 43(2), 189-208 Kvarnström E., Bracken, P., Ysunza, A., Kärrman, E., Finsson, A. and Saywell, D. (2004). Sustainability Criteria in Sanitation Planning, 30th WEDC International Conference, Vientiane, Lao PDR. Lahiri, S. and Chanthaphone, S. ( 2003). Water, sanitation and hygiene, a situation analysis paper for Lao PDR. Int. J. Environ. Health Res., S110-S117. http://www.who.int/mediacentre/factsheets/fs330/en/index.html accessed on 2/25/2012 Leone, T., Coast, E., Randall, S., (2009). Did you sleep here last night? The impact of the household definition in sample surveys: A Tanzanian case study. Presentation at British Society for Population Studies annual conference, September 9–11, Brighton, England. Lockwood, H., Smits, S., Schouten, T., Moriarty, P. (2010). Providing Sustainable Water Services at Scale. International Symposium on Rural Water Services, Kampala 13th to 15th April, 2010 Loetscher, T. and J. Keller. (2002). A decision support system for selecting sanitation systems in developing countries. Socio-economic planning sciences, 36(4), 267-290 Lyimo, C.W, Shayo, R, Lyimo T.J, (2008). Community Awareness on Microbial Water Pollution and Its Effects on Health Development in Urban Tanzania: A Case Study of Tabata and Kiwalani Wards in Ilala District in Dar es Salaam Region. Tanzania Journal of Development Studies 8(2) Lynch, J. and Kaplan, G.A. (2000). Socioeconomic position. In: Berkman LF, Kawachi I, eds. Social Epidemiology. New York: Oxford University Press. Pp 13–35 Los, B. and Timmer, P. (2005). The ‘appropriate technology’ explanation of productivity growth: An empirical approach. Journal of Development Economics 77, 517–531. Mara, D., Drangert, J., Anh N., Tonderski, A., Gulyas, H., Tonderski, K. (2007). Selection of sustainable sanitation arrangements. Water Policy 9:305–18 MDC (Morogoro Distric Council) 2011. District Socio-economic Profile, 2011. Malisie, F. A. (2008). Sustainability Assessment on Sanitation Systems for Low Income Urban Areas in Indonesia. PhD Dissertation, Hamburg University of Technology (TUHH)
77
Mara, D. D. (1985). The Design of Ventilated Improved Pit Latrines. TAG Technical Note No. 13. The World Bank, Washington, DC (available at www.leeds.ac.uk/civil/ceri/ water/tphe/ publicat/watsan/watsan.html). Mara, D. D. (1985b). The Design of Pour-Flush Latrines. TAG Technical Note No. 15. The World Bank, Washington, DC (available at www.personal.leeds.ac.uk /~cen6ddm/ wbreports.html). McCubbin, N. C., (2007). Determinants of sustainability in rural sanitation: Village level factors influencing sustained latrine uptake. March 2007 progress report, prepared for WaterAid Tanzania Ministry of Health and Social Welfare (2009). Sanitation and hygiene Policy - Draft. Dar es salaam Ministry of Health and Social Welfare (2010). Latrine Options And Construction Guide-Draft Ministry of Finance and Economic Affairs (MoFEA) [Tanzania]. (2010). National Strategy for Growth and Reduction of Poverty ( NSGRP) II. ISBN: 978-9987-08101-1. Available online at Website: www.povertymonitoring.go.tz; www.mof.go.tz; www.tanzania.go.tz Morgan, P. R. & Mara, D. D. (1982). Ventilated Improved Pit Latrines: Recent Developments in Zimbabwe. Technical Paper No. 3. The World Bank, Washington, DC (available at www-wds.worldbank.org/servlet/WDSContentServer/WDSP/IB/ 2000/09/14/000178830_98101904151810/Rendered/PDF/multi_page.pdf). Mtungila, J. and Chipofya, V. (2009). Issues and challenges of providing adequate sanitation to people living on the shore of Lake Malawi: Case of Monkey Bay, Malawi. Desal, 248(1-3), 338-343 Murphy, H. M., McBean, E. A., and Farahbakhsh, K. (2009). Appropriate technology – A comprehensive approach for water and sanitation in the developing world. Technology in Society, 31(2), 158-167. National Bureau of Statistics (NBS), 2010. Tanzania Demographic and Health Survey (TDHS). Dar es Salaam, Tanzania: NBS and ICF Macro. Nelson, K. L., and Murray, A. (2008). Sanitation for unserved populations: Technologies, implementation challenges, and opportunities. Annual Review of Environment and Resources, 33, 119-119-151. Parente, S.L., Prescott, E.C. (1994). Barriers to technology adoption and development. Journal of Political Economy 102 (2), 298–321.
78
Practical Action, 2012. Types Of Toilet And Their Suitability. The Schumacher Centre for Technology and Development, Bourton on Dunsmore, Rugby, Warwickshire, CV23 9QZ, UK www.practicalaction.org Roy, A. K., Chatterjee, P. K., Gupta, K. N., Khare, S. T., Rau, B. B. & Singh, R. S. (1984). Manual on the Design, Construction and Maintenance of Low-cost Pour-flush Waterseal Latrines. TAG Technical Note No. 10. The World Bank, Washington, DC (available at http://www wds.worldbank.org/servlet/ WDSContentServer/ WDSP/IB/ 2000/03/03/000178830_ 98101903445485/Rendered/PDF/multi0page.pdf). Saaty, T.L. (1980). Analytical Hierarchy Process: Planning, Priority Setting, Resource Allocation. NewYork: McGraw-Hill; Saaty, T. L. and Vargas G. L. (2001). Models, Methods, Concepts & Applications of the Analytic Hierarchy Process. Boston: Kluwer Academic Publishers Sustainable Sanitation Alliance (2011). What is sustainable sanitation? . Sustainable Sanitation Alliance. http://www.susana.org/lang-en/intro. Accessed on October 21, 2011. Thomas J.C, Weber, D.J. (2001). Epidemiologic Methods for the Study of Infectious Diseases. New York, NY: Oxford University Press, 2001. ISBN 0-19-512112-0 UN (United Nations). (2010). The Millennium Development Goals Report. United Nations, New York UN-WWAP (United Nations World Water Development Programme). (2006). The United Nations World Water Development Report 2: 'Water, a shared responsibility'. Paris and France, UNESCO and Berghahn Books UN (United Nations). (2010). The Millennium Development Goals Report. United Nations, New York Whittington, D., 2011. Pricing Water and Sanitation Services., 79-95 The U.S Bureau of Democracy, Human Rights, and Labor, (2009). International Religious Freedom, 2009 report. Accessed on 07/24/2012 at http://www.state.gov/j/drl/rls/irf/2009/127259.htm. Van der Vleuten-Balkema, A. (2003). Sustainable Wastewater Treatment – Developing a Methodology and Selecting Promising Systems. PhD Thesis. The Netherlands WHO (World Health Organization). (2012). Diarrhoeal disease. Facts And Figures updated on August 2009. Available at http:// www.who. int/ mediacentre /factsheets /fs330/ en/ index.html
79
WHO (World Health Organization). (2004). Water, Sanitation and Hygiene Links to Health . Facts And Figures updated on November WHO (World Health Organization). (1992). A Guide to the Development of on-Site Sanitation WHO/UNICEF (World Health Organization/United Nations, Children’s Fund). (2012). Progress on Drinking Water and Sanitation: 2012 Update. WHO/UNICEF Joint Monitoring Programme for Water Supply and Sanitation. ISBN: 978-92-806-4632-0 (NLM classification: WA 670) WHO/UNICEF-JMP (World Health Organization/United Nations Children’s Fund Joint Monitoring Programme). (2010). http://www.wssinfo.org/definitions-methods/introduction/. Accessed on October 21, 2011.
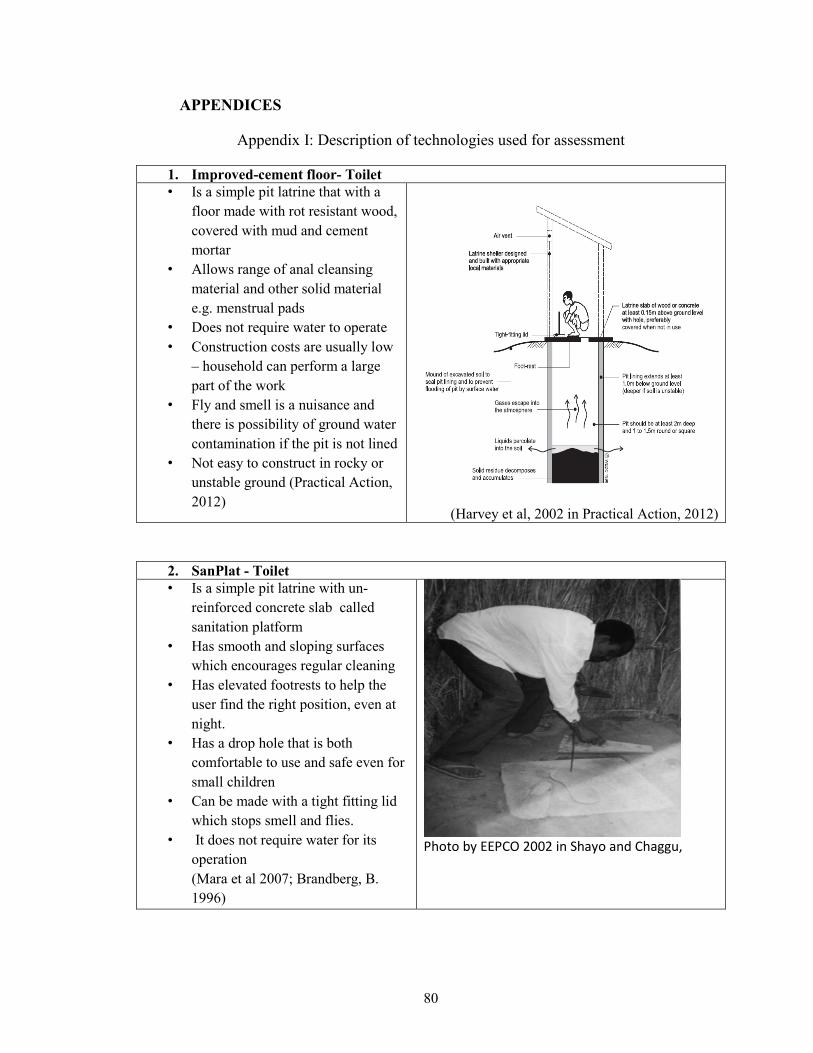
80
APPENDICES
Appendix I: Description of technologies used for assessment
1. Improved-cement floor- Toilet • Is a simple pit latrine that with a
floor made with rot resistant wood, covered with mud and cement mortar
• Allows range of anal cleansing material and other solid material e.g. menstrual pads
• Does not require water to operate • Construction costs are usually low
– household can perform a large part of the work
• Fly and smell is a nuisance and there is possibility of ground water contamination if the pit is not lined
• Not easy to construct in rocky or unstable ground (Practical Action, 2012)
(Harvey et al, 2002 in Practical Action, 2012)
2. SanPlat - Toilet • Is a simple pit latrine with un-
reinforced concrete slab called sanitation platform
• Has smooth and sloping surfaces which encourages regular cleaning
• Has elevated footrests to help the user find the right position, even at night.
• Has a drop hole that is both comfortable to use and safe even for small children
• Can be made with a tight fitting lid which stops smell and flies.
• It does not require water for its operation (Mara et al 2007; Brandberg, B. 1996)
Photo by EEPCO 2002 in Shayo and Chaggu,
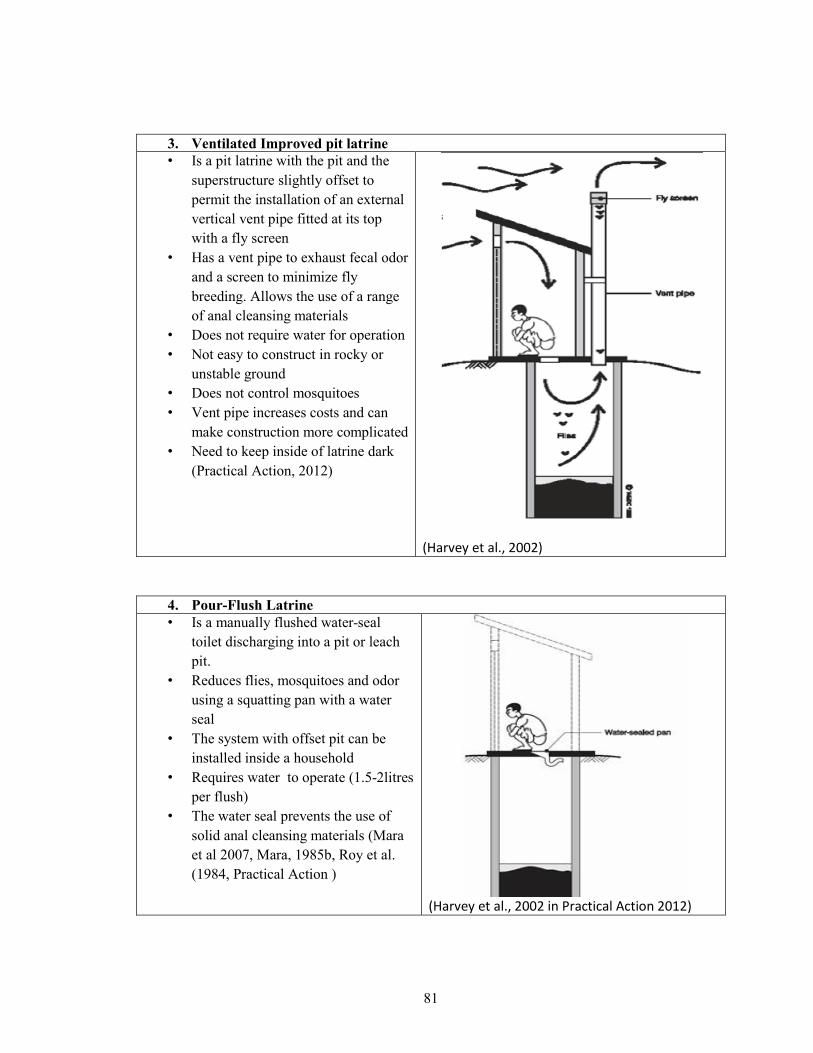
81
3. Ventilated Improved pit latrine • Is a pit latrine with the pit and the
superstructure slightly offset to permit the installation of an external vertical vent pipe fitted at its top with a fly screen
• Has a vent pipe to exhaust fecal odor and a screen to minimize fly breeding. Allows the use of a range of anal cleansing materials
• Does not require water for operation • Not easy to construct in rocky or
unstable ground • Does not control mosquitoes • Vent pipe increases costs and can
make construction more complicated • Need to keep inside of latrine dark
(Practical Action, 2012)
(Harvey et al., 2002)
4. Pour-Flush Latrine • Is a manually flushed water-seal
toilet discharging into a pit or leach pit.
• Reduces flies, mosquitoes and odor using a squatting pan with a water seal
• The system with offset pit can be installed inside a household
• Requires water to operate (1.5-2litres per flush)
• The water seal prevents the use of solid anal cleansing materials (Mara et al 2007, Mara, 1985b, Roy et al. (1984, Practical Action )
(Harvey et al., 2002 in Practical Action 2012)

82
5. EcoSan -Urine diversion dehydration toilet technology (UDDT) • Recycles nutrients in human excreta
(urine and feces) to be used as fertilizer and soil conditioner
• Reduces pollution problems associated with wastewater disposal
• Requires appropriate training of users to ensure the systems are operated correctly and people are not put at risk
• The systems does not accept a wide variety of anal cleansing materials
• May be more expensive than simpler types of latrine (Practical Action, 2012, Mara 2007)
EEPCO, 2010
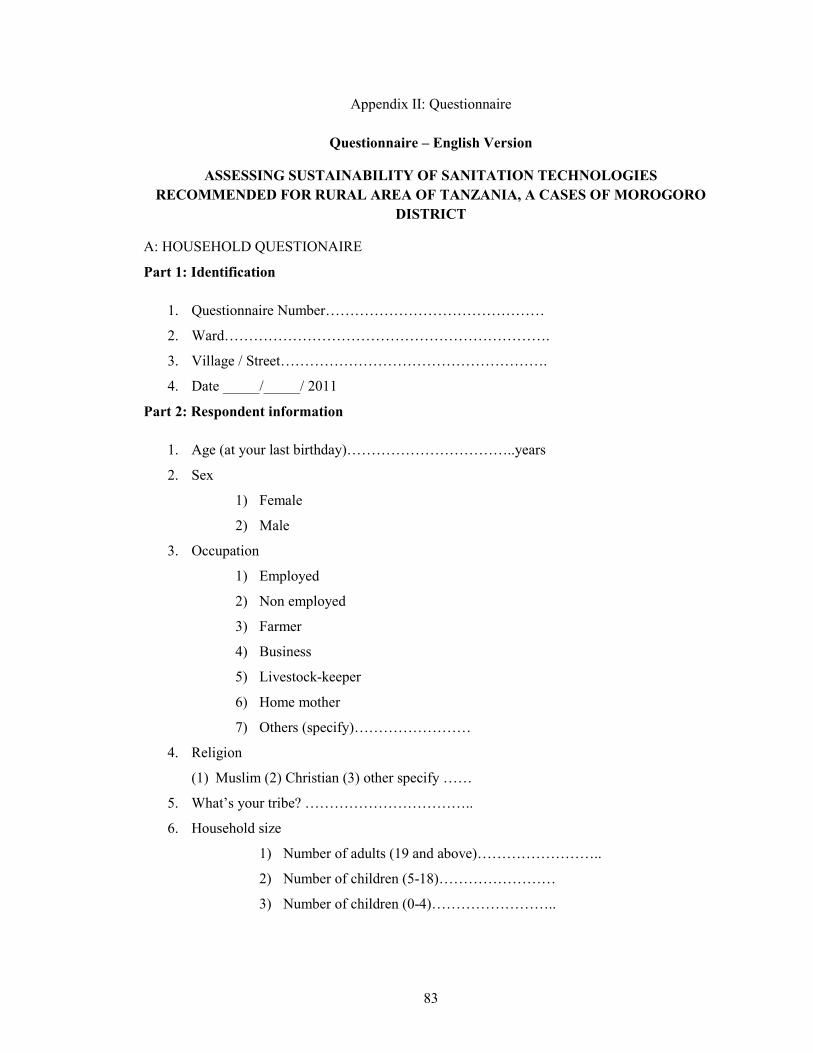
83
Appendix II: Questionnaire
Questionnaire – English Version
ASSESSING SUSTAINABILITY OF SANITATION TECHNOLOGIES RECOMMENDED FOR RURAL AREA OF TANZANIA, A CASES OF MOROGORO
DISTRICT
A: HOUSEHOLD QUESTIONAIRE
Part 1: Identification
1. Questionnaire Number………………………………………
2. Ward………………………………………………………….
3. Village / Street……………………………………………….
4. Date _____/_____/ 2011
Part 2: Respondent information
1. Age (at your last birthday)……………………………..years
2. Sex
1) Female
2) Male
3. Occupation
1) Employed
2) Non employed
3) Farmer
4) Business
5) Livestock-keeper
6) Home mother
7) Others (specify)……………………
4. Religion
(1) Muslim (2) Christian (3) other specify ……
5. What’s your tribe? ……………………………..
6. Household size
1) Number of adults (19 and above)……………………..
2) Number of children (5-18)……………………
3) Number of children (0-4)……………………..
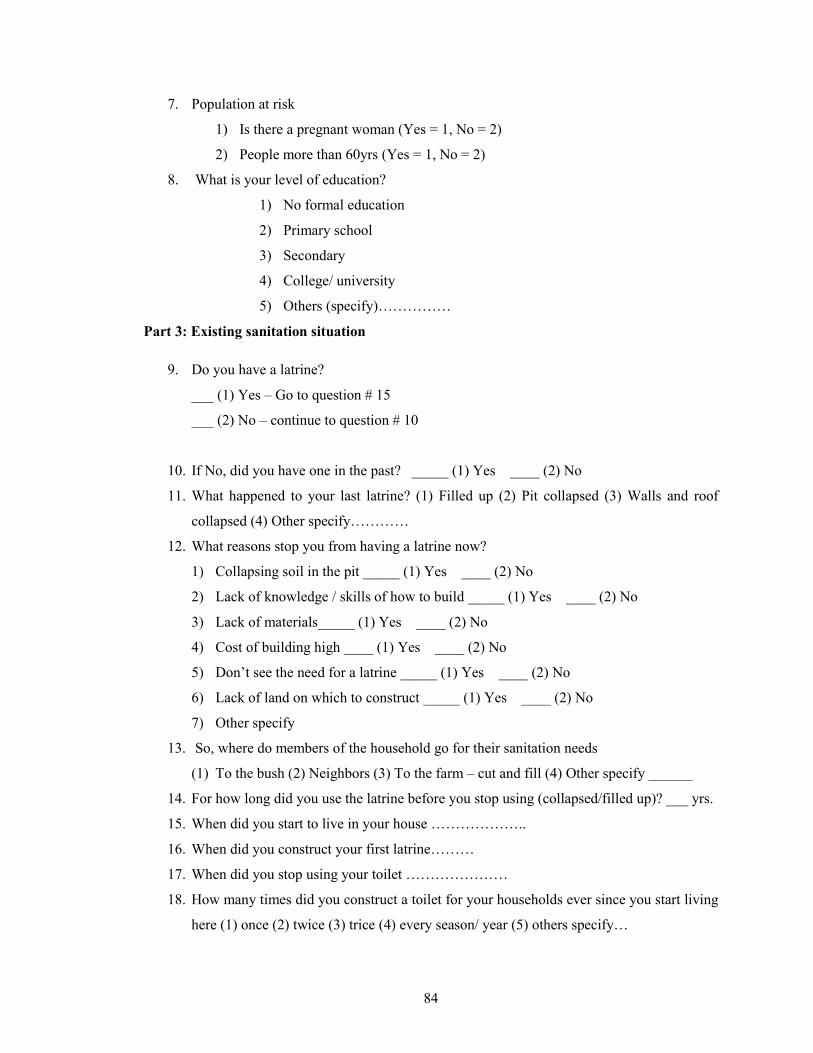
84
7. Population at risk
1) Is there a pregnant woman (Yes = 1, No = 2)
2) People more than 60yrs (Yes = 1, No = 2)
8. What is your level of education?
1) No formal education
2) Primary school
3) Secondary
4) College/ university
5) Others (specify)……………
Part 3: Existing sanitation situation
9. Do you have a latrine?
___ (1) Yes – Go to question # 15
___ (2) No – continue to question # 10
10. If No, did you have one in the past? _____ (1) Yes ____ (2) No
11. What happened to your last latrine? (1) Filled up (2) Pit collapsed (3) Walls and roof
collapsed (4) Other specify…………
12. What reasons stop you from having a latrine now?
1) Collapsing soil in the pit _____ (1) Yes ____ (2) No
2) Lack of knowledge / skills of how to build _____ (1) Yes ____ (2) No
3) Lack of materials_____ (1) Yes ____ (2) No
4) Cost of building high ____ (1) Yes ____ (2) No
5) Don’t see the need for a latrine _____ (1) Yes ____ (2) No
6) Lack of land on which to construct _____ (1) Yes ____ (2) No
7) Other specify
13. So, where do members of the household go for their sanitation needs
(1) To the bush (2) Neighbors (3) To the farm – cut and fill (4) Other specify ______
14. For how long did you use the latrine before you stop using (collapsed/filled up)? ___ yrs.
15. When did you start to live in your house ………………..
16. When did you construct your first latrine………
17. When did you stop using your toilet …………………
18. How many times did you construct a toilet for your households ever since you start living
here (1) once (2) twice (3) trice (4) every season/ year (5) others specify…
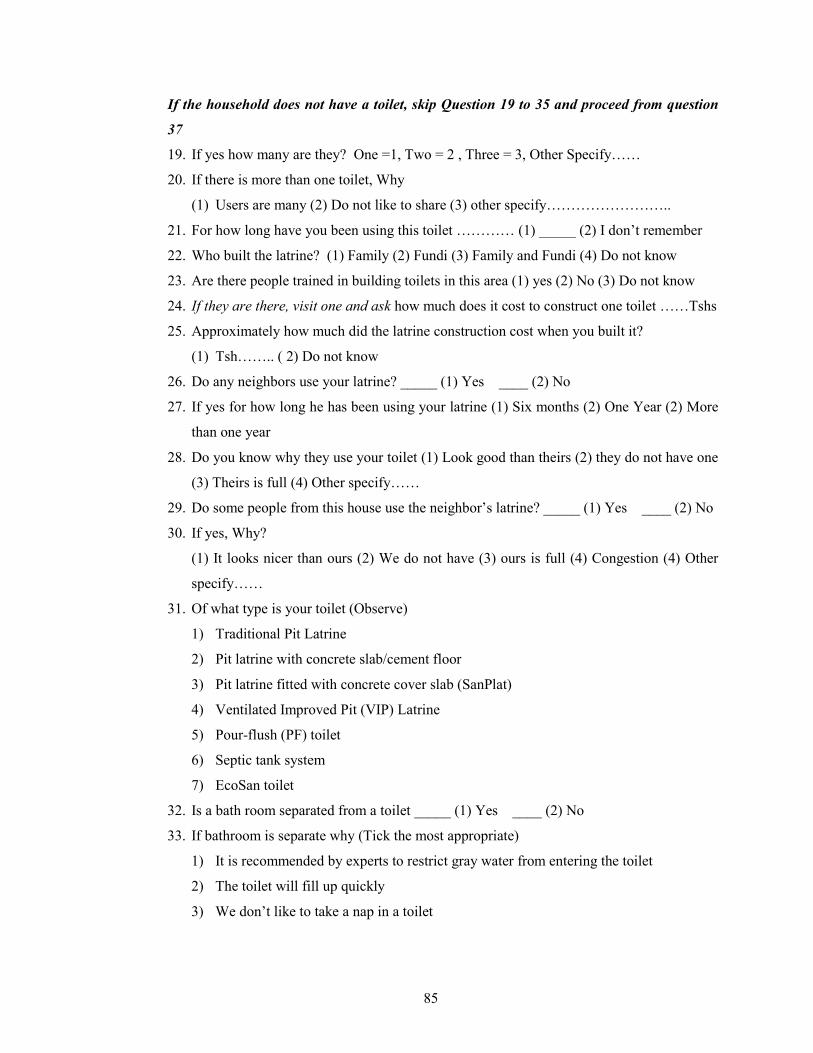
85
If the household does not have a toilet, skip Question 19 to 35 and proceed from question
37
19. If yes how many are they? One =1, Two = 2 , Three = 3, Other Specify……
20. If there is more than one toilet, Why
(1) Users are many (2) Do not like to share (3) other specify……………………..
21. For how long have you been using this toilet ………… (1) _____ (2) I don’t remember
22. Who built the latrine? (1) Family (2) Fundi (3) Family and Fundi (4) Do not know
23. Are there people trained in building toilets in this area (1) yes (2) No (3) Do not know
24. If they are there, visit one and ask how much does it cost to construct one toilet ……Tshs
25. Approximately how much did the latrine construction cost when you built it?
(1) Tsh…….. ( 2) Do not know
26. Do any neighbors use your latrine? _____ (1) Yes ____ (2) No
27. If yes for how long he has been using your latrine (1) Six months (2) One Year (2) More
than one year
28. Do you know why they use your toilet (1) Look good than theirs (2) they do not have one
(3) Theirs is full (4) Other specify……
29. Do some people from this house use the neighbor’s latrine? _____ (1) Yes ____ (2) No
30. If yes, Why?
(1) It looks nicer than ours (2) We do not have (3) ours is full (4) Congestion (4) Other
specify……
31. Of what type is your toilet (Observe)
1) Traditional Pit Latrine
2) Pit latrine with concrete slab/cement floor
3) Pit latrine fitted with concrete cover slab (SanPlat)
4) Ventilated Improved Pit (VIP) Latrine
5) Pour-flush (PF) toilet
6) Septic tank system
7) EcoSan toilet
32. Is a bath room separated from a toilet _____ (1) Yes ____ (2) No
33. If bathroom is separate why (Tick the most appropriate)
1) It is recommended by experts to restrict gray water from entering the toilet
2) The toilet will fill up quickly
3) We don’t like to take a nap in a toilet

86
4) Cultural believes
34. Observe the direction of gray water (Tick the most appropriate)
1) Channeled to the toilet pit
2) Directed outside the bathroom to soak away pit
3) Directed outside to the ground
35. If gray water is directed outside the toilet pit, why (tick appropriate)
Toilet pit will fill up quickly
The toilet will produce foul smell
It was restricted by experts
Others specify ……………
36. Is there a hand washing facility outside the toilet (1) yes (2) No
Part 4: Environmental characteristics of the area
37. What problem do you face when excavating pit
1) Hard soil
2) Hard rock close to the ground
3) Water table high
4) Collapsible soil
5) No problem
6) Do not know
7) Others specify
38. If encountered any problem while constructing your toilet facility, how did you address it
1) Line the pit
2) Excavate shallow pit
3) Elevate the pit
4) Other specify………..
39. How deep do you excavate a pit before you get water (reach water table level) …… ft
40. Do you experience any disaster e.g. flooding in this area (1) Yes (2) No
41. If yes, when did the last flooding happened (1) One year ago (2) More than two years ago
(3) Other specify
42. Does anyone in your community use latrine products for any of the following uses
1) As fertilizer _____ (1) Yes ____ (2) No
2) Generate energy _____ (1) Yes ____ (2) No
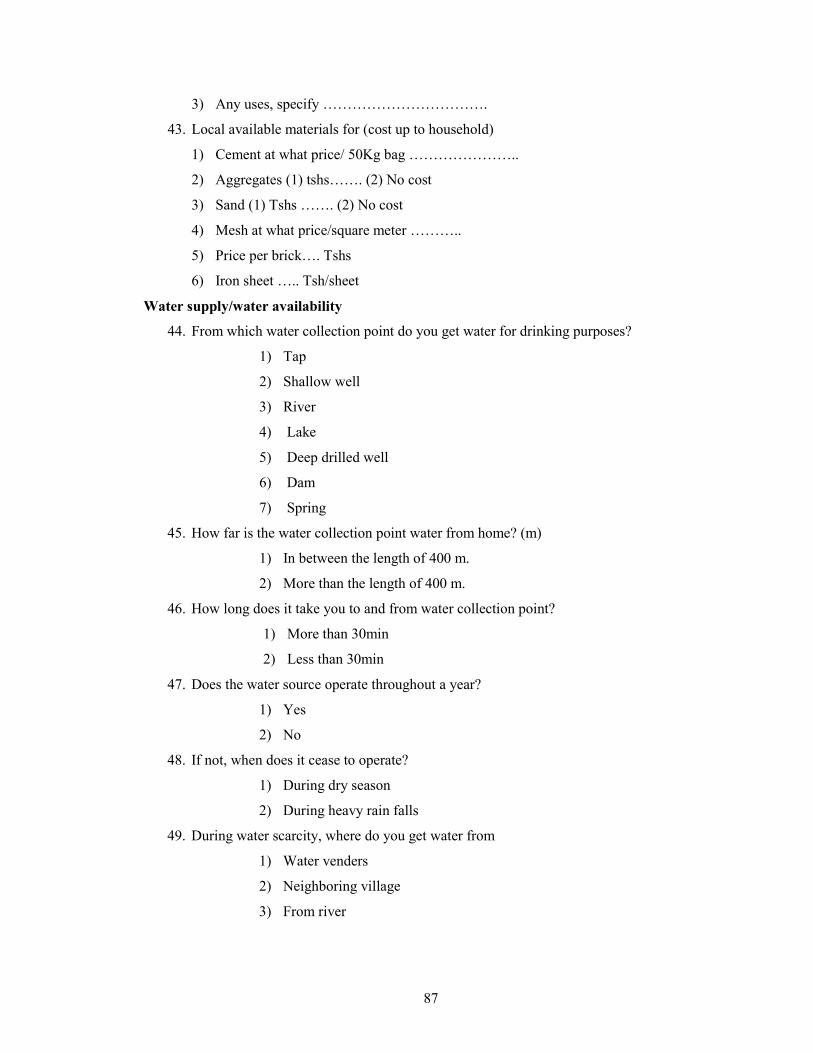
87
3) Any uses, specify …………………………….
43. Local available materials for (cost up to household)
1) Cement at what price/ 50Kg bag …………………..
2) Aggregates (1) tshs……. (2) No cost
3) Sand (1) Tshs ……. (2) No cost
4) Mesh at what price/square meter ………..
5) Price per brick…. Tshs
6) Iron sheet ….. Tsh/sheet
Water supply/water availability
44. From which water collection point do you get water for drinking purposes?
1) Tap
2) Shallow well
3) River
4) Lake
5) Deep drilled well
6) Dam
7) Spring
45. How far is the water collection point water from home? (m)
1) In between the length of 400 m.
2) More than the length of 400 m.
46. How long does it take you to and from water collection point?
1) More than 30min
2) Less than 30min
47. Does the water source operate throughout a year?
1) Yes
2) No
48. If not, when does it cease to operate?
1) During dry season
2) During heavy rain falls
49. During water scarcity, where do you get water from
1) Water venders
2) Neighboring village
3) From river
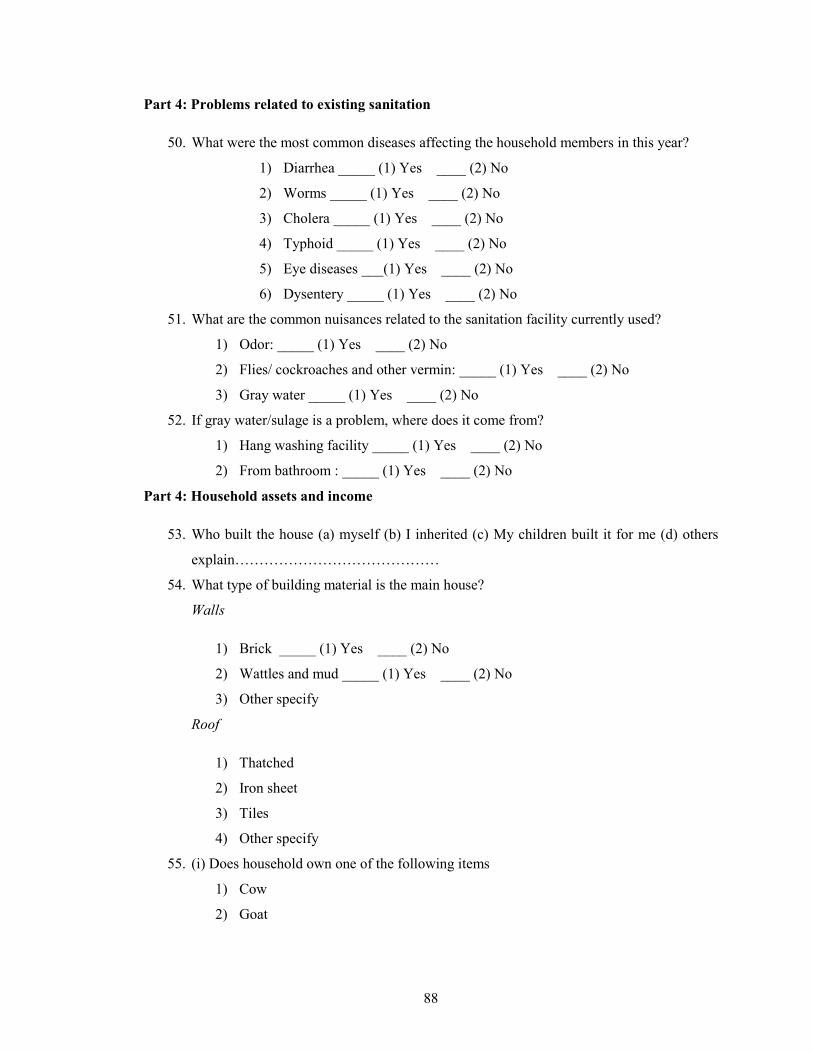
88
Part 4: Problems related to existing sanitation
50. What were the most common diseases affecting the household members in this year?
1) Diarrhea _____ (1) Yes ____ (2) No
2) Worms _____ (1) Yes ____ (2) No
3) Cholera _____ (1) Yes ____ (2) No
4) Typhoid _____ (1) Yes ____ (2) No
5) Eye diseases ___(1) Yes ____ (2) No
6) Dysentery _____ (1) Yes ____ (2) No
51. What are the common nuisances related to the sanitation facility currently used?
1) Odor: _____ (1) Yes ____ (2) No
2) Flies/ cockroaches and other vermin: _____ (1) Yes ____ (2) No
3) Gray water _____ (1) Yes ____ (2) No
52. If gray water/sulage is a problem, where does it come from?
1) Hang washing facility _____ (1) Yes ____ (2) No
2) From bathroom : _____ (1) Yes ____ (2) No
Part 4: Household assets and income
53. Who built the house (a) myself (b) I inherited (c) My children built it for me (d) others
explain……………………………………
54. What type of building material is the main house?
Walls
1) Brick _____ (1) Yes ____ (2) No
2) Wattles and mud _____ (1) Yes ____ (2) No
3) Other specify
Roof
1) Thatched
2) Iron sheet
3) Tiles
4) Other specify
55. (i) Does household own one of the following items
1) Cow
2) Goat
89
3) Poetry
(ii) Cash crops
1) Coconut trees
2) Orange trees
3) Banana tree
4) Others explain……………….
(iii) Processions/assets
1. Mobile phone _____ (1) Yes ____ (2) No
2. TV _____ (1) Yes ____ (2) No
3. Motorcycle _____ (1) Yes ____ (2) No
4. Vehicle _____ (1) Yes ____ (2) No
5. Others (specify)……………
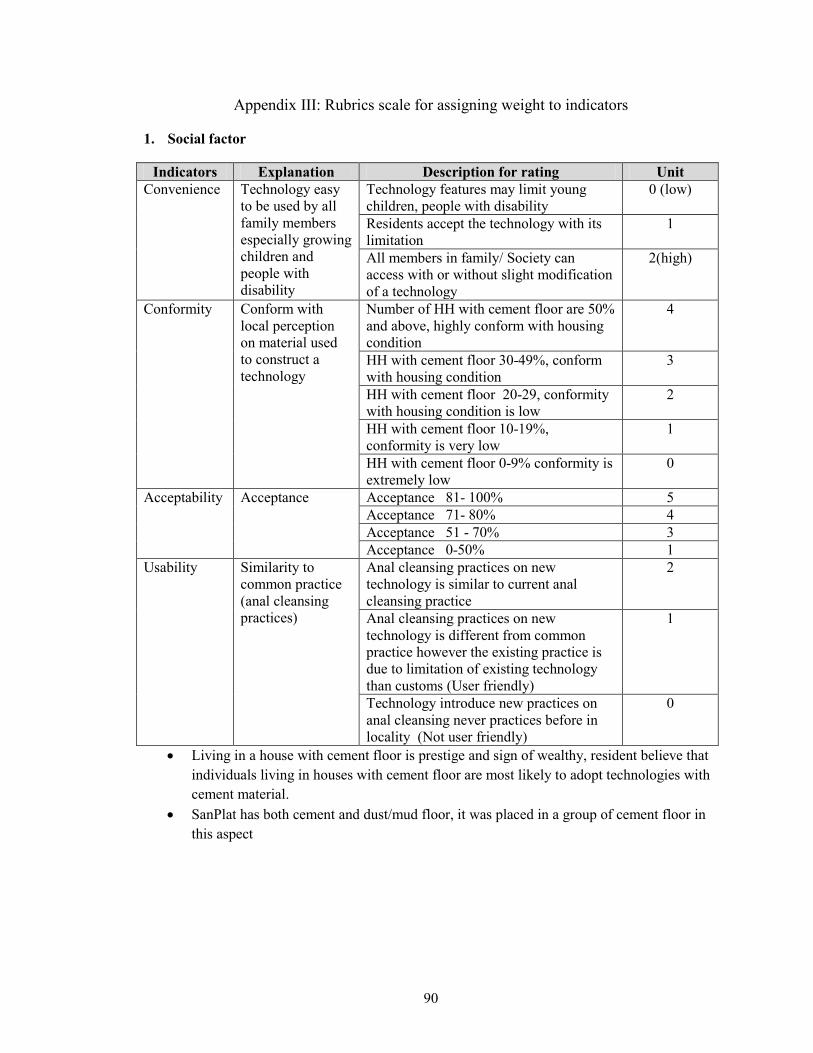
90
Appendix III: Rubrics scale for assigning weight to indicators
1. Social factor
Indicators Explanation Description for rating Unit Convenience Technology easy
to be used by all family members especially growing children and people with disability
Technology features may limit young children, people with disability
0 (low)
Residents accept the technology with its limitation
1
All members in family/ Society can access with or without slight modification of a technology
2(high)
Conformity
Conform with local perception on material used to construct a technology
Number of HH with cement floor are 50% and above, highly conform with housing condition
4
HH with cement floor 30-49%, conform with housing condition
3
HH with cement floor 20-29, conformity with housing condition is low
2
HH with cement floor 10-19%, conformity is very low
1
HH with cement floor 0-9% conformity is extremely low
0
Acceptability Acceptance Acceptance 81- 100% 5 Acceptance 71- 80% 4 Acceptance 51 - 70% 3 Acceptance 0-50% 1
Usability Similarity to common practice (anal cleansing practices)
Anal cleansing practices on new technology is similar to current anal cleansing practice
2
Anal cleansing practices on new technology is different from common practice however the existing practice is due to limitation of existing technology than customs (User friendly)
1
Technology introduce new practices on anal cleansing never practices before in locality (Not user friendly)
0
• Living in a house with cement floor is prestige and sign of wealthy, resident believe that individuals living in houses with cement floor are most likely to adopt technologies with cement material.
• SanPlat has both cement and dust/mud floor, it was placed in a group of cement floor in this aspect
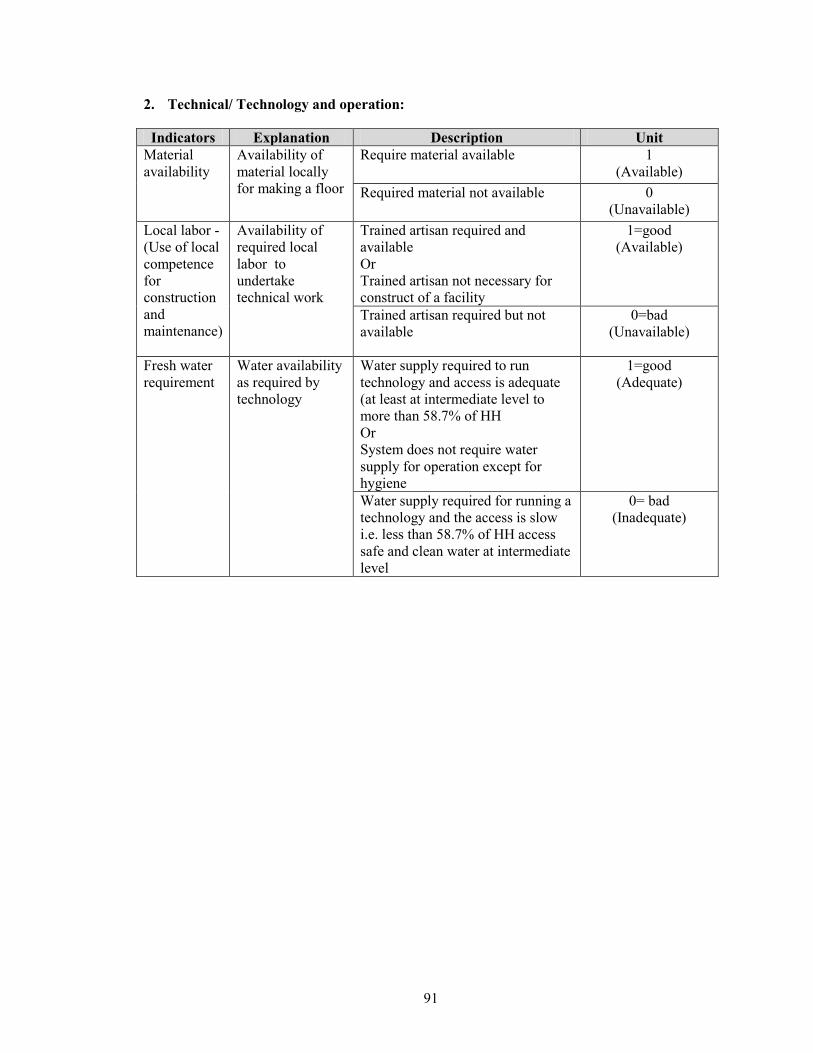
91
2. Technical/ Technology and operation:
Indicators Explanation Description Unit Material availability
Availability of material locally for making a floor
Require material available 1 (Available)
Required material not available 0 (Unavailable)
Local labor - (Use of local competence for construction and maintenance)
Availability of required local labor to undertake technical work
Trained artisan required and available Or Trained artisan not necessary for construct of a facility
1=good (Available)
Trained artisan required but not available
0=bad (Unavailable)
Fresh water requirement
Water availability as required by technology
Water supply required to run technology and access is adequate (at least at intermediate level to more than 58.7% of HH Or System does not require water supply for operation except for hygiene
1=good (Adequate)
Water supply required for running a technology and the access is slow i.e. less than 58.7% of HH access safe and clean water at intermediate level
0= bad (Inadequate)
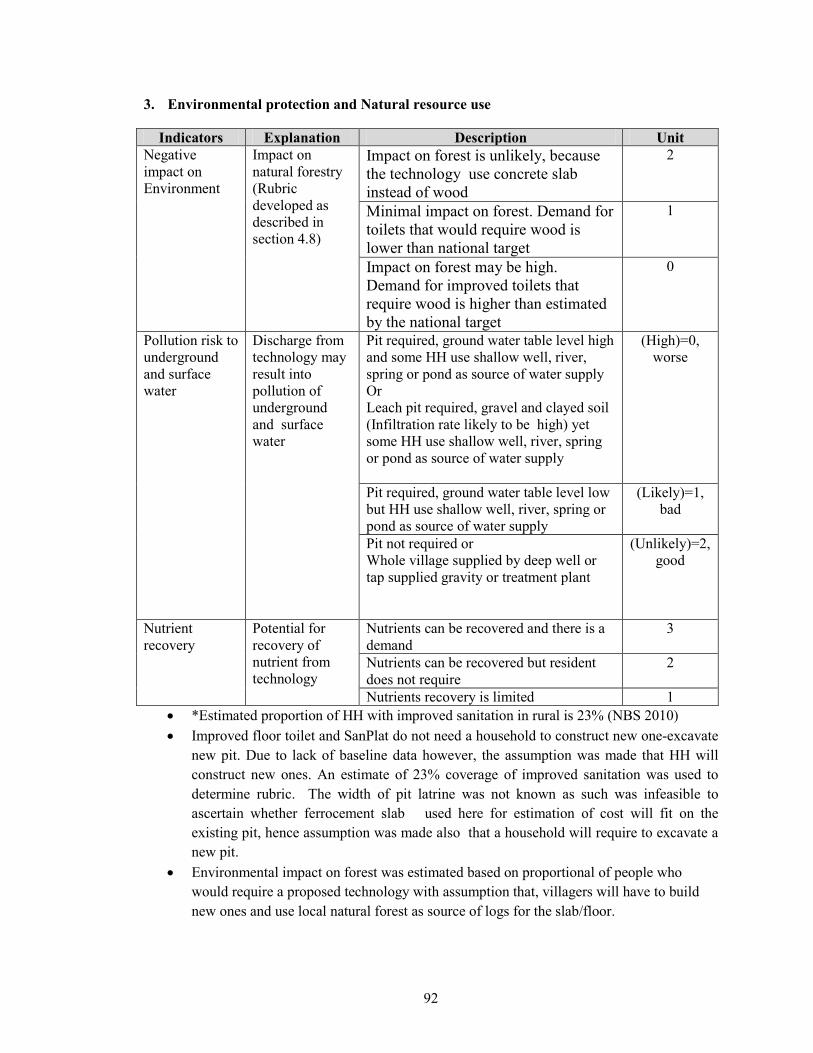
92
3. Environmental protection and Natural resource use
Indicators Explanation Description Unit Negative impact on Environment
Impact on natural forestry (Rubric developed as described in section 4.8)
Impact on forest is unlikely, because the technology use concrete slab instead of wood
2
Minimal impact on forest. Demand for toilets that would require wood is lower than national target
1
Impact on forest may be high. Demand for improved toilets that require wood is higher than estimated by the national target
0
Pollution risk to underground and surface water
Discharge from technology may result into pollution of underground and surface water
Pit required, ground water table level high and some HH use shallow well, river, spring or pond as source of water supply Or Leach pit required, gravel and clayed soil (Infiltration rate likely to be high) yet some HH use shallow well, river, spring or pond as source of water supply
(High)=0, worse
Pit required, ground water table level low but HH use shallow well, river, spring or pond as source of water supply
(Likely)=1, bad
Pit not required or Whole village supplied by deep well or tap supplied gravity or treatment plant
(Unlikely)=2, good
Nutrient recovery
Potential for recovery of nutrient from technology
Nutrients can be recovered and there is a demand
3
Nutrients can be recovered but resident does not require
2
Nutrients recovery is limited 1 • *Estimated proportion of HH with improved sanitation in rural is 23% (NBS 2010) • Improved floor toilet and SanPlat do not need a household to construct new one-excavate
new pit. Due to lack of baseline data however, the assumption was made that HH will construct new ones. An estimate of 23% coverage of improved sanitation was used to determine rubric. The width of pit latrine was not known as such was infeasible to ascertain whether ferrocement slab used here for estimation of cost will fit on the existing pit, hence assumption was made also that a household will require to excavate a new pit.
• Environmental impact on forest was estimated based on proportional of people who would require a proposed technology with assumption that, villagers will have to build new ones and use local natural forest as source of logs for the slab/floor.
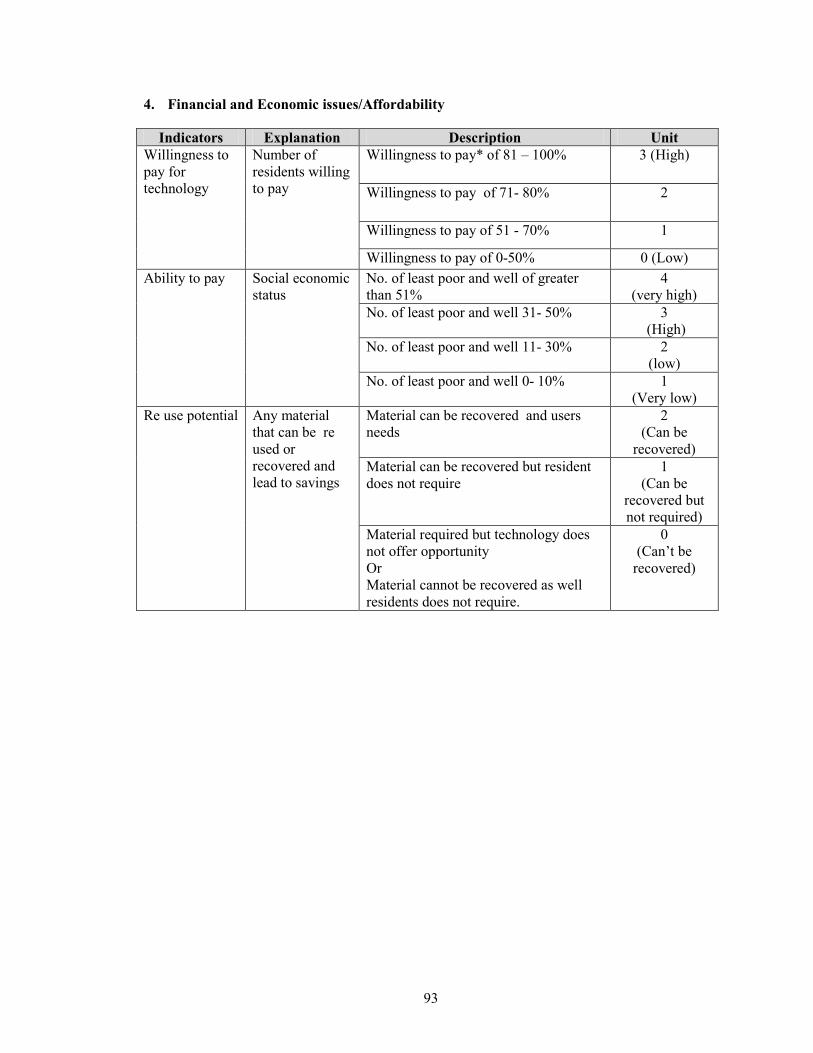
93
4. Financial and Economic issues/Affordability
Indicators Explanation Description Unit Willingness to pay for technology
Number of residents willing to pay
Willingness to pay* of 81 – 100% 3 (High)
Willingness to pay of 71- 80% 2
Willingness to pay of 51 - 70% 1
Willingness to pay of 0-50% 0 (Low) Ability to pay Social economic
status No. of least poor and well of greater than 51%
4 (very high)
No. of least poor and well 31- 50% 3 (High)
No. of least poor and well 11- 30% 2 (low)
No. of least poor and well 0- 10% 1 (Very low)
Re use potential Any material that can be re used or recovered and lead to savings
Material can be recovered and users needs
2 (Can be
recovered) Material can be recovered but resident does not require
1 (Can be
recovered but not required)
Material required but technology does not offer opportunity Or Material cannot be recovered as well residents does not require.
0 (Can’t be
recovered)
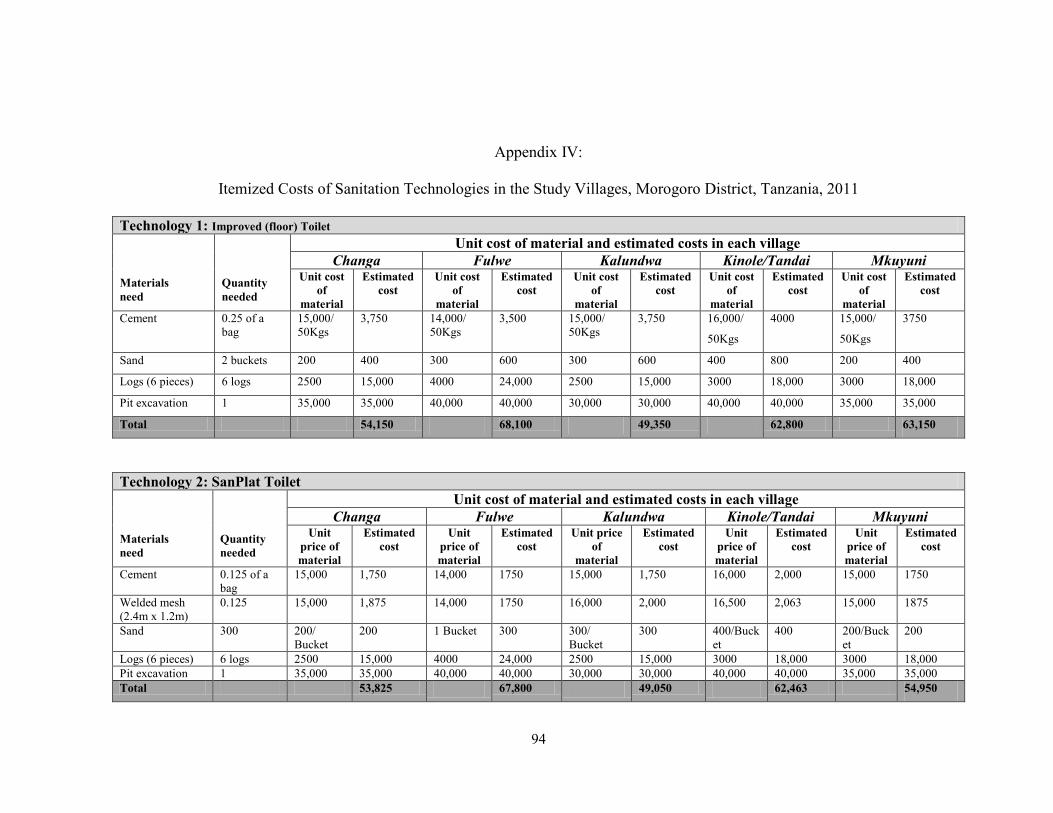
94
Appendix IV:
Itemized Costs of Sanitation Technologies in the Study Villages, Morogoro District, Tanzania, 2011
Technology 1: Improved (floor) Toilet Materials need
Quantity needed
Unit cost of material and estimated costs in each village Changa Fulwe Kalundwa Kinole/Tandai Mkuyuni
Unit cost of
material
Estimated cost
Unit cost of
material
Estimated cost
Unit cost of
material
Estimated cost
Unit cost of
material
Estimated cost
Unit cost of
material
Estimated cost
Cement 0.25 of a bag
15,000/ 50Kgs
3,750 14,000/ 50Kgs
3,500 15,000/ 50Kgs
3,750 16,000/
50Kgs
4000 15,000/
50Kgs
3750
Sand 2 buckets 200 400 300 600 300 600 400 800 200 400
Logs (6 pieces) 6 logs 2500 15,000 4000 24,000 2500 15,000 3000 18,000 3000 18,000
Pit excavation 1 35,000 35,000 40,000 40,000 30,000 30,000 40,000 40,000 35,000 35,000
Total 54,150 68,100 49,350 62,800 63,150
Technology 2: SanPlat Toilet Materials need
Quantity needed
Unit cost of material and estimated costs in each village Changa Fulwe Kalundwa Kinole/Tandai Mkuyuni
Unit price of material
Estimated cost
Unit price of material
Estimated cost
Unit price of
material
Estimated cost
Unit price of material
Estimated cost
Unit price of material
Estimated cost
Cement 0.125 of a bag
15,000 1,750 14,000 1750 15,000 1,750 16,000 2,000 15,000 1750
Welded mesh (2.4m x 1.2m)
0.125 15,000 1,875 14,000 1750 16,000 2,000 16,500 2,063 15,000 1875
Sand 300 200/ Bucket
200 1 Bucket 300 300/ Bucket
300 400/Bucket
400 200/Bucket
200
Logs (6 pieces) 6 logs 2500 15,000 4000 24,000 2500 15,000 3000 18,000 3000 18,000 Pit excavation 1 35,000 35,000 40,000 40,000 30,000 30,000 40,000 40,000 35,000 35,000 Total 53,825 67,800 49,050 62,463 54,950

95
Technology 3: VIP Latrine Materials need
Quantity needed
Unit cost of material and estimated costs in each village Changa Fulwe Kalundwa Kinole/Tandai Mkuyuni
Unit price of material
Estimated cost
Unit price of material
Estimated cost
Unit price of
material
Estimated cost
Unit price of material
Estimated cost
Unit price of material
Estimated cost
Cement 0.50 of the bag
15,000/ 50Kgs
7500 14,000/ 50Kgs
7000 15,000/ 50Kgs
7500 16,000/ 50Kgs
8000 15,000/ 50Kgs
7500
Sand 3 buckets 200/ bucket
600 300/ bucket
900 300/ bucket
900 400/ bucket
1200 200/ bucket
600
Aggregates 3 buckets 500 1,500 600 1,800 500 1,500 500 1,500 500 1,500 Welded mesh (2.4m x 1.2m)
0.5 15,000 7,500 14,000 7,000 16,000 8,000 16,500 8,250 15,000 7,500
Vent pipe 1pc 15,000 15,000 14,500 14,500 15,500 15,500 16,500 16,500 15,000 15,000 Pit excavation 1 35,000 35,000 40,000 40,000 30,000 30,000 40,000 40,000 35,000 35,000
Total 67,100 71,200 63,400 75,450 67,100
Technology 4: Pour Flush Latrine Materials need
Quantity needed
Unit cost of material and estimated costs in each village Changa Fulwe Kalundwa Kinole/Tandai Mkuyuni
Unit price of material
Estimated cost
Unit price of material
Estimated cost
Unit price of
material
Estimated cost
Unit price of material
Estimated cost
Unit price of material
Estimated cost
Cement 0.50 of the bag
15,000/ 50Kgs
7,500 14,000/ 50Kgs
7000 15,000/ 50Kgs
7,500 16,000/ 50Kgs
8,000 15,000/ 50Kgs
7,500
Sand 3 buckets 200 600 300 900 300 600 400 1,200 200 600 Aggregates 3 buckets 500 1,500 600 1,800 500 1,500 500 1,500 500 1,500 Welded mesh (2.4m x 1.2m)
0.5 a roll 15,000 7,500 14,000 7,000 16,000 7,500 16,500 8,250 15,000 7,500
Squatting Pan and trap unit
1Pc 18,000 18,000 18,000 18,000 18,000 18,000 18,000 18,000 18,000 18,000
Water for running
2-3Lts/plush
0 0 0 0 0 0 0 0 0
Pit excavation 35,000 35,000 40,000 40,000 30,000 30,000 40,000 40,000 35,000 35,000 70,100 74,700 65,100 76,950 70,100
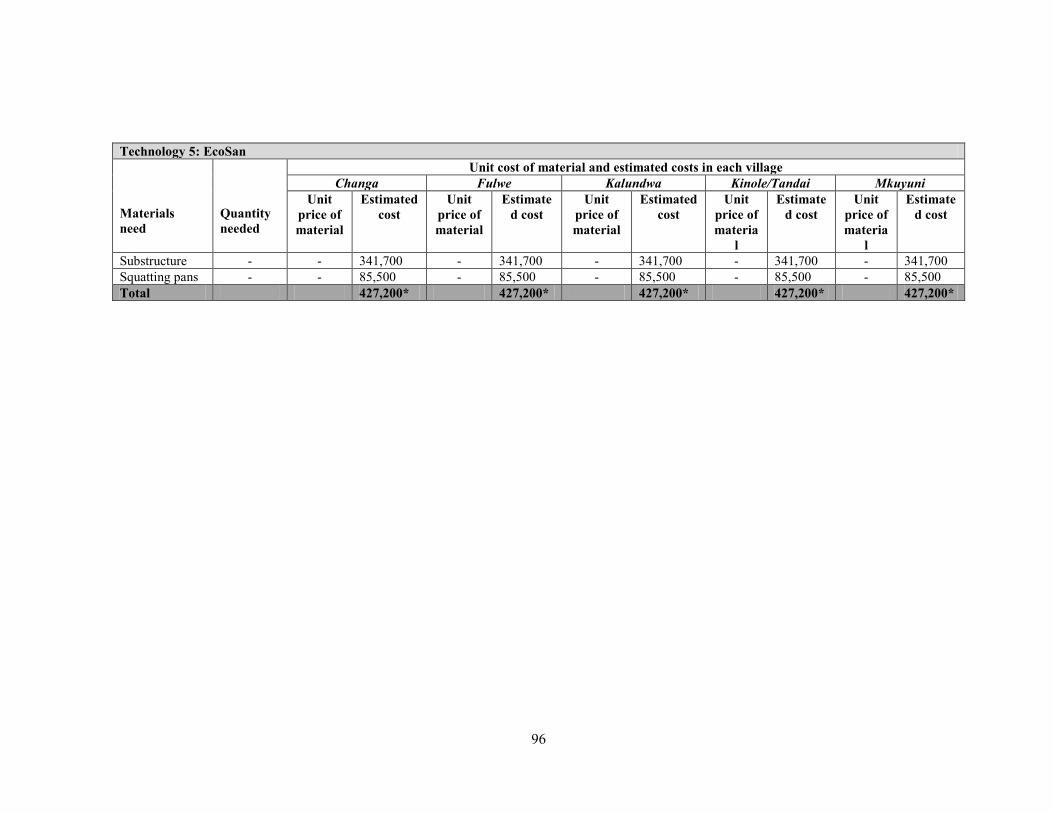
96
Technology 5: EcoSan Materials need
Quantity needed
Unit cost of material and estimated costs in each village Changa Fulwe Kalundwa Kinole/Tandai Mkuyuni
Unit price of material
Estimated cost
Unit price of material
Estimated cost
Unit price of material
Estimated cost
Unit price of materia
l
Estimated cost
Unit price of materia
l
Estimated cost
Substructure - - 341,700 - 341,700 - 341,700 - 341,700 - 341,700 Squatting pans - - 85,500 - 85,500 - 85,500 - 85,500 - 85,500 Total 427,200* 427,200* 427,200* 427,200* 427,200*
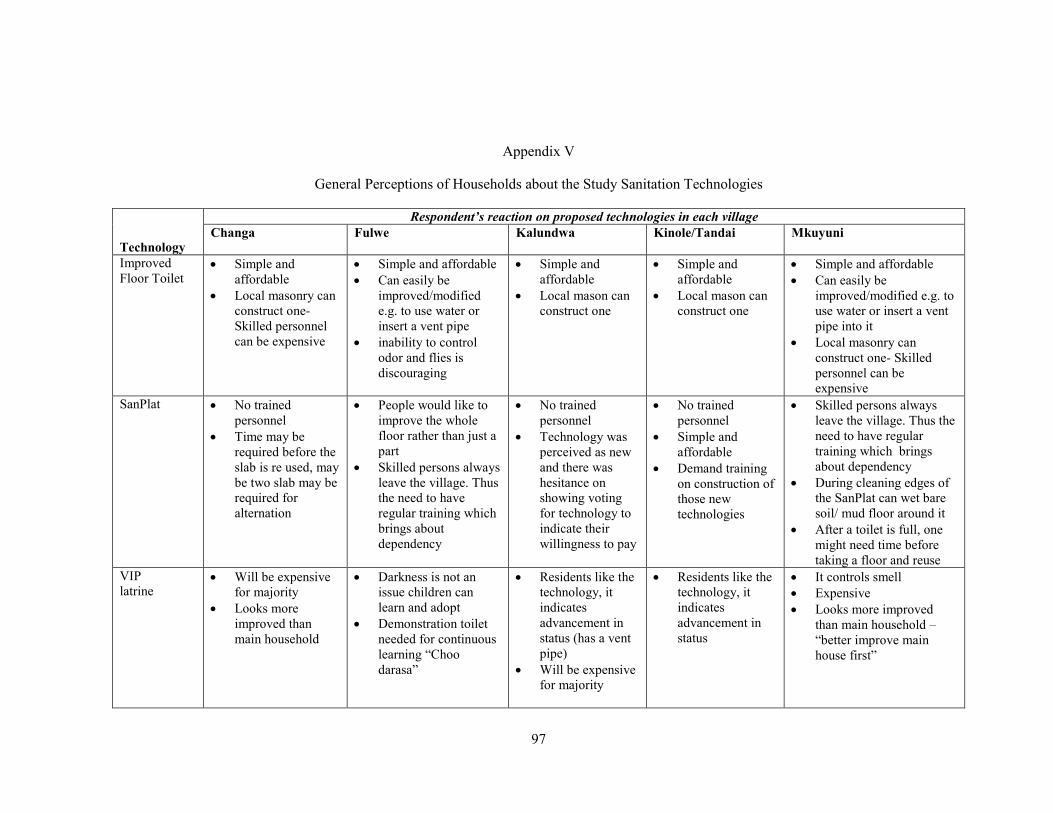
97
Appendix V
General Perceptions of Households about the Study Sanitation Technologies
Technology
Respondent’s reaction on proposed technologies in each village Changa Fulwe Kalundwa Kinole/Tandai Mkuyuni
Improved Floor Toilet
• Simple and affordable
• Local masonry can construct one- Skilled personnel can be expensive
• Simple and affordable • Can easily be
improved/modified e.g. to use water or insert a vent pipe
• inability to control odor and flies is discouraging
• Simple and affordable
• Local mason can construct one
• Simple and affordable
• Local mason can construct one
• Simple and affordable • Can easily be
improved/modified e.g. to use water or insert a vent pipe into it
• Local masonry can construct one- Skilled personnel can be expensive
SanPlat • No trained personnel
• Time may be required before the slab is re used, may be two slab may be required for alternation
• People would like to improve the whole floor rather than just a part
• Skilled persons always leave the village. Thus the need to have regular training which brings about dependency
• No trained personnel
• Technology was perceived as new and there was hesitance on showing voting for technology to indicate their willingness to pay
• No trained personnel
• Simple and affordable
• Demand training on construction of those new technologies
• Skilled persons always leave the village. Thus the need to have regular training which brings about dependency
• During cleaning edges of the SanPlat can wet bare soil/ mud floor around it
• After a toilet is full, one might need time before taking a floor and reuse
VIP latrine
• Will be expensive for majority
• Looks more improved than main household
• Darkness is not an issue children can learn and adopt
• Demonstration toilet needed for continuous learning “Choo darasa”
• Residents like the technology, it indicates advancement in status (has a vent pipe)
• Will be expensive for majority
• Residents like the technology, it indicates advancement in status
• It controls smell • Expensive • Looks more improved
than main household – “better improve main house first”
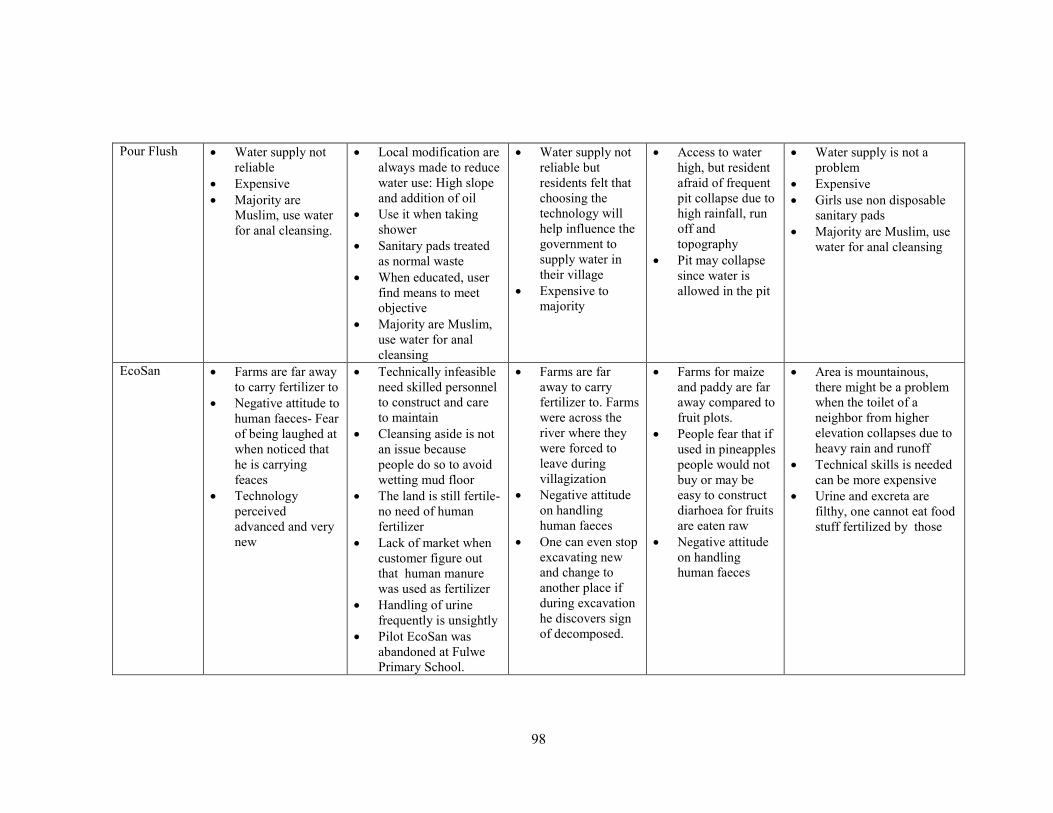
98
Pour Flush • Water supply not reliable
• Expensive • Majority are
Muslim, use water for anal cleansing.
• Local modification are always made to reduce water use: High slope and addition of oil
• Use it when taking shower
• Sanitary pads treated as normal waste
• When educated, user find means to meet objective
• Majority are Muslim, use water for anal cleansing
• Water supply not reliable but residents felt that choosing the technology will help influence the government to supply water in their village
• Expensive to majority
• Access to water high, but resident afraid of frequent pit collapse due to high rainfall, run off and topography
• Pit may collapse since water is allowed in the pit
• Water supply is not a problem
• Expensive • Girls use non disposable
sanitary pads • Majority are Muslim, use
water for anal cleansing
EcoSan • Farms are far away to carry fertilizer to
• Negative attitude to human faeces- Fear of being laughed at when noticed that he is carrying feaces
• Technology perceived advanced and very new
• Technically infeasible need skilled personnel to construct and care to maintain
• Cleansing aside is not an issue because people do so to avoid wetting mud floor
• The land is still fertile- no need of human fertilizer
• Lack of market when customer figure out that human manure was used as fertilizer
• Handling of urine frequently is unsightly
• Pilot EcoSan was abandoned at Fulwe Primary School.
• Farms are far away to carry fertilizer to. Farms were across the river where they were forced to leave during villagization
• Negative attitude on handling human faeces
• One can even stop excavating new and change to another place if during excavation he discovers sign of decomposed.
• Farms for maize and paddy are far away compared to fruit plots.
• People fear that if used in pineapples people would not buy or may be easy to construct diarhoea for fruits are eaten raw
• Negative attitude on handling human faeces
• Area is mountainous, there might be a problem when the toilet of a neighbor from higher elevation collapses due to heavy rain and runoff
• Technical skills is needed can be more expensive
• Urine and excreta are filthy, one cannot eat food stuff fertilized by those
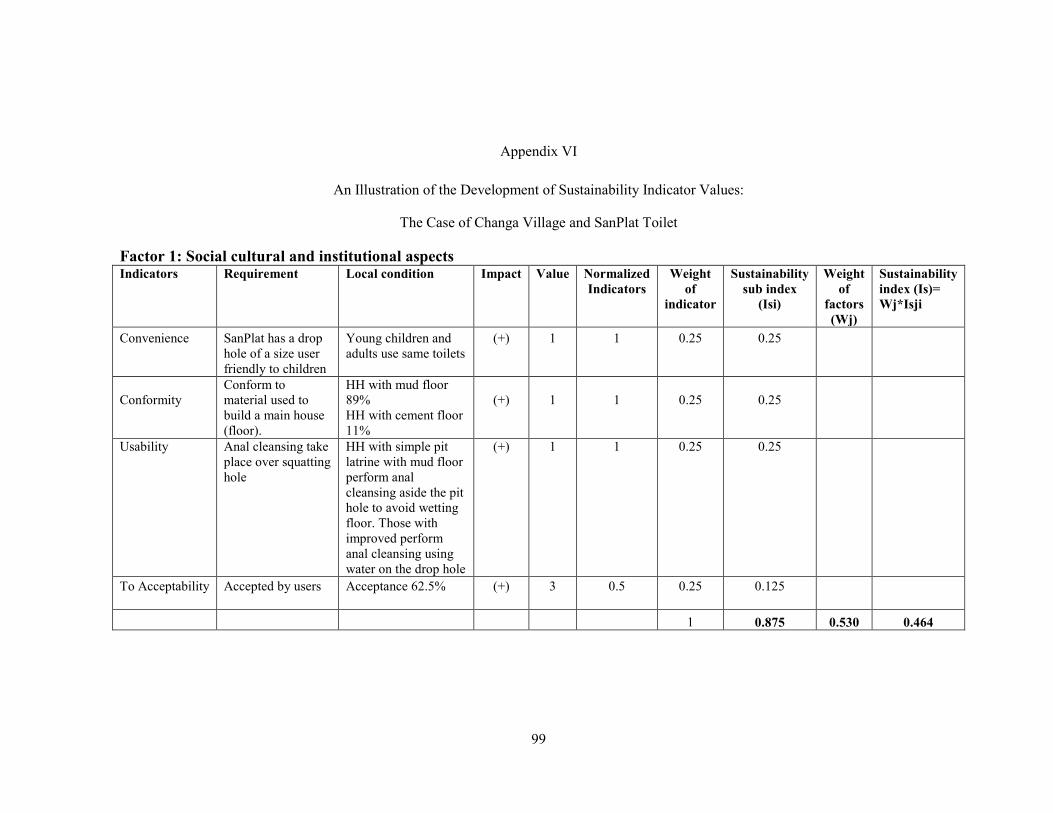
99
Appendix VI
An Illustration of the Development of Sustainability Indicator Values:
The Case of Changa Village and SanPlat Toilet
Factor 1: Social cultural and institutional aspects Indicators Requirement Local condition Impact Value Normalized
Indicators Weight
of indicator
Sustainability sub index
(Isi)
Weight of
factors (Wj)
Sustainability index (Is)= Wj*Isji
Convenience
SanPlat has a drop hole of a size user friendly to children
Young children and adults use same toilets
(+)
1
1
0.25
0.25
Conformity
Conform to material used to build a main house (floor).
HH with mud floor 89% HH with cement floor 11%
(+)
1
1
0.25
0.25
Usability
Anal cleansing take place over squatting hole
HH with simple pit latrine with mud floor perform anal cleansing aside the pit hole to avoid wetting floor. Those with improved perform anal cleansing using water on the drop hole
(+)
1
1
0.25
0.25
To Acceptability
Accepted by users
Acceptance 62.5%
(+)
3
0.5
0.25
0.125
1 0.875 0.530 0.464
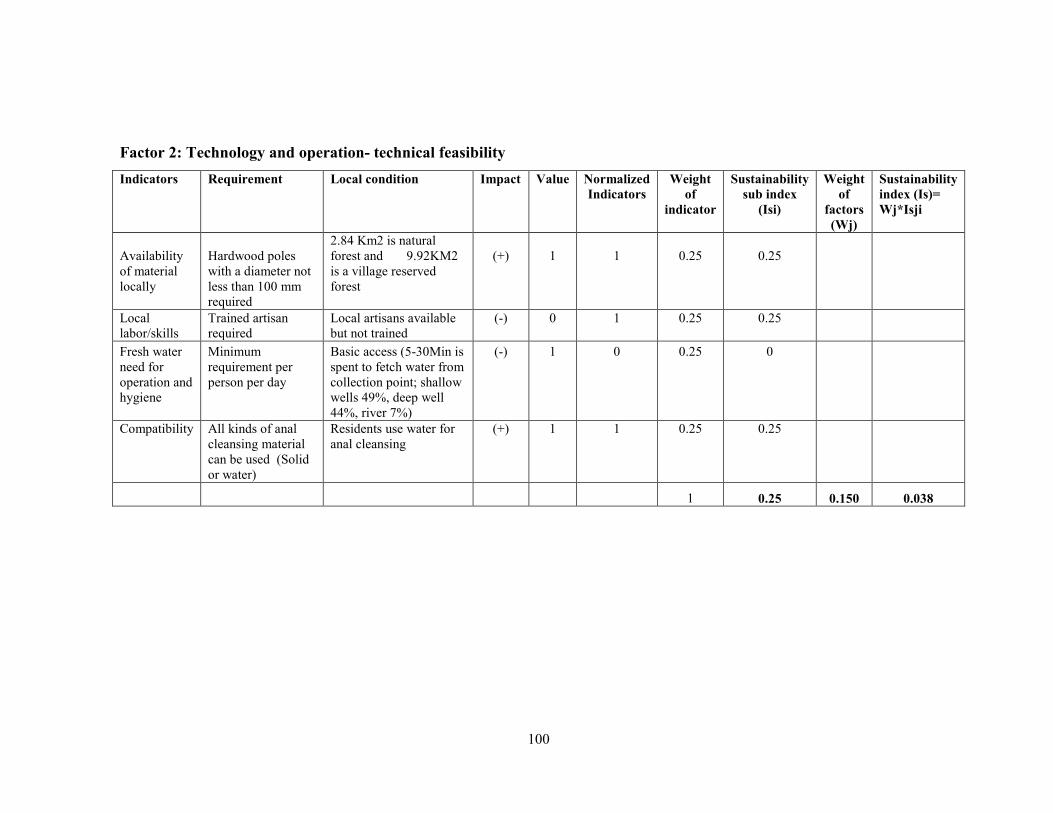
100
Factor 2: Technology and operation- technical feasibility Indicators
Requirement
Local condition
Impact
Value
Normalized Indicators
Weight of
indicator
Sustainability sub index
(Isi)
Weight of
factors (Wj)
Sustainability index (Is)= Wj*Isji
Availability of material locally
Hardwood poles with a diameter not less than 100 mm required
2.84 Km2 is natural forest and 9.92KM2 is a village reserved forest
(+)
1
1
0.25
0.25
Local labor/skills
Trained artisan required
Local artisans available but not trained
(-)
0
1
0.25
0.25
Fresh water need for operation and hygiene
Minimum requirement per person per day
Basic access (5-30Min is spent to fetch water from collection point; shallow wells 49%, deep well 44%, river 7%)
(-)
1
0
0.25
0
Compatibility
All kinds of anal cleansing material can be used (Solid or water)
Residents use water for anal cleansing
(+)
1
1
0.25
0.25
1 0.25 0.150 0.038
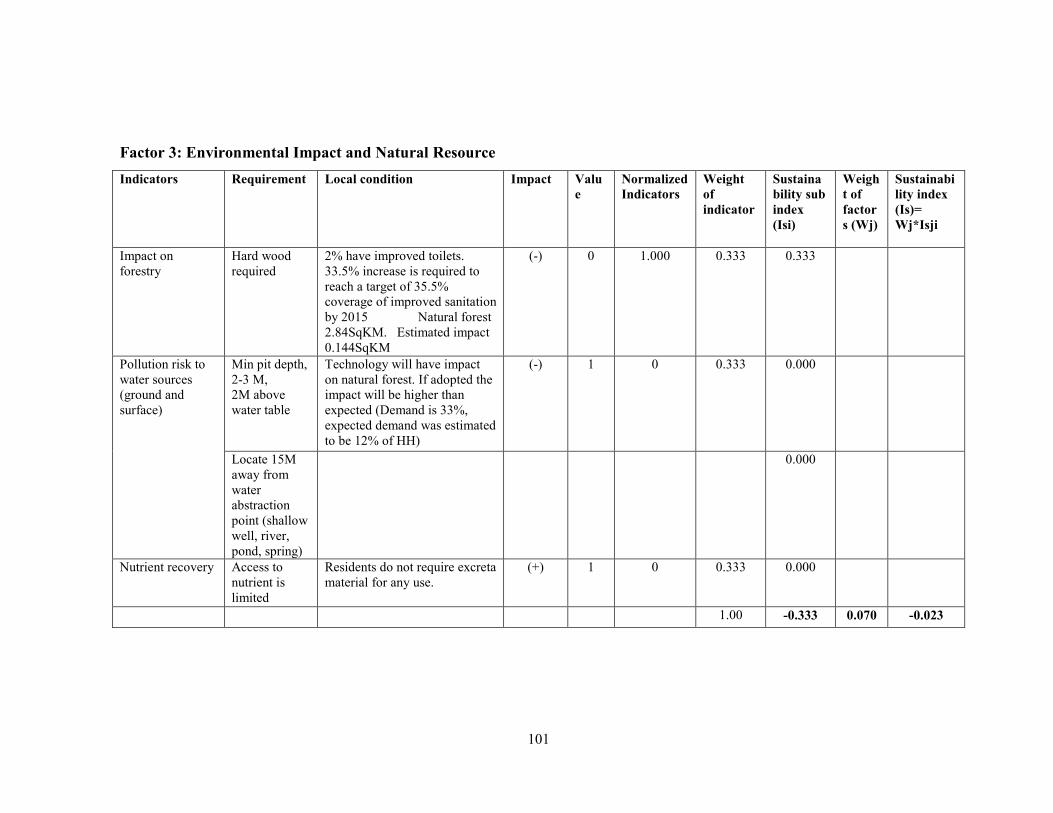
101
Factor 3: Environmental Impact and Natural Resource Indicators
Requirement
Local condition
Impact
Value
Normalized Indicators
Weight of indicator
Sustainability sub index (Isi)
Weight of factors (Wj)
Sustainability index (Is)= Wj*Isji
Impact on forestry
Hard wood required
2% have improved toilets. 33.5% increase is required to reach a target of 35.5% coverage of improved sanitation by 2015 Natural forest 2.84SqKM. Estimated impact 0.144SqKM
(-)
0
1.000
0.333
0.333
Pollution risk to water sources (ground and surface)
Min pit depth, 2-3 M, 2M above water table
Technology will have impact on natural forest. If adopted the impact will be higher than expected (Demand is 33%, expected demand was estimated to be 12% of HH)
(-) 1 0 0.333 0.000
Locate 15M away from water abstraction point (shallow well, river, pond, spring)
0.000
Nutrient recovery Access to nutrient is limited
Residents do not require excreta material for any use.
(+) 1 0 0.333 0.000
1.00 -0.333 0.070 -0.023
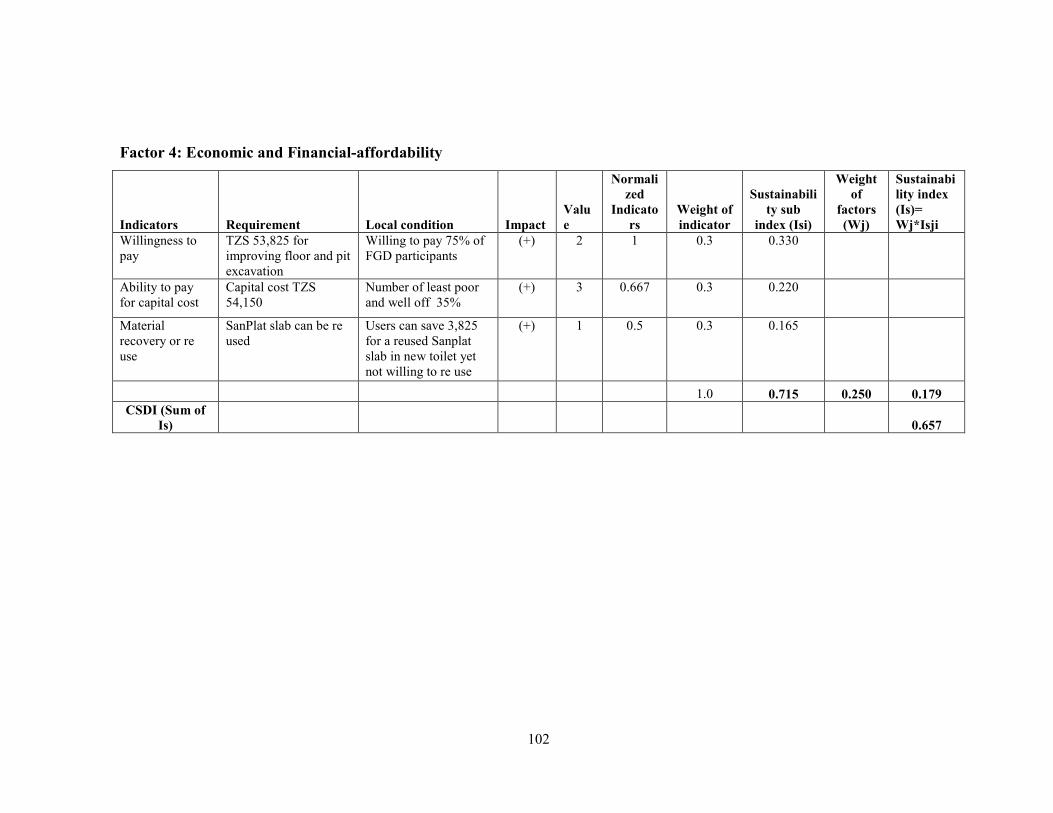
102
Factor 4: Economic and Financial-affordability
Indicators Requirement Local condition Impact Value
Normalized
Indicators
Weight of indicator
Sustainability sub
index (Isi)
Weight of
factors (Wj)
Sustainability index (Is)= Wj*Isji
Willingness to pay
TZS 53,825 for improving floor and pit excavation
Willing to pay 75% of FGD participants
(+) 2 1 0.3 0.330
Ability to pay for capital cost
Capital cost TZS 54,150
Number of least poor and well off 35%
(+) 3 0.667 0.3 0.220
Material recovery or re use
SanPlat slab can be re used
Users can save 3,825 for a reused Sanplat slab in new toilet yet not willing to re use
(+) 1 0.5 0.3 0.165
1.0 0.715 0.250 0.179 CSDI (Sum of
Is) 0.657


![Water,Sanitation,andHygieneServiceAvailabilityatRural ... · inadequate water supply and sanitation [3]. Inadequate drinking water, sanitation, and hygiene in nonhousehold settings,](https://img.pdfslide.net/doc/110x75/5e81efd69f9e151ba6551f5b/watersanitationandhygieneserviceavailabilityatrural-inadequate-water-supply.jpg)