Embed Size (px)
Citation preview

ARTICLE
Received 11 Aug 2014 | Accepted 1 Sep 2014 | Published 25 Sep 2014
Assessing technical performance in differentialgene expression experiments with external spike-inRNA control ratio mixturesSarah A. Munro1,2, Steven P. Lund1, P. Scott Pine1,2, Hans Binder3, Djork-Arne Clevert4, Ana Conesa5,
Joaquin Dopazo5,6, Mario Fasold7, Sepp Hochreiter4, Huixiao Hong8, Nadereh Jafari9, David P. Kreil10,11,
Paweł P. Łabaj10, Sheng Li12, Yang Liao13,14, Simon M. Lin15, Joseph Meehan8, Christopher E. Mason12,
Javier Santoyo-Lopez6,16, Robert A. Setterquist17, Leming Shi18, Wei Shi13,19, Gordon K. Smyth13,20,
Nancy Stralis-Pavese10, Zhenqiang Su8,w, Weida Tong8, Charles Wang21, Jian Wang22, Joshua Xu8, Zhan Ye23,
Yong Yang22, Ying Yu18 & Marc Salit1,2
There is a critical need for standard approaches to assess, report and compare the technical
performance of genome-scale differential gene expression experiments. Here we assess technical
performance with a proposed standard ‘dashboard’ of metrics derived from analysis of external
spike-in RNA control ratio mixtures. These control ratio mixtures with defined abundance ratios
enable assessment of diagnostic performance of differentially expressed transcript lists, limit of
detection of ratio (LODR) estimates and expression ratio variability and measurement bias. The
performance metrics suite is applicable to analysis of a typical experiment, and here we also apply
these metrics to evaluate technical performance among laboratories. An interlaboratory study using
identical samples shared among 12 laboratories with three different measurement processes
demonstrates generally consistent diagnostic power across 11 laboratories. Ratio measurement
variability and bias are also comparable among laboratories for the same measurement process. We
observe different biases for measurement processes using different mRNA-enrichment protocols.
DOI: 10.1038/ncomms6125
1 National Institute of Standards and Technology, 100 Bureau Drive, Gaithersburg, Maryland 20899, USA. 2 Department of Bioengineering, Stanford University,443 Via Ortega, Stanford, California 94305, USA. 3 Interdisciplinary Centre for Bioinformatics, University of Leipzig, Hartelstrasse 16—18, 04107 Leipzig,Germany. 4 Institute of Bioinformatics, Johannes Kepler University, Altenberger Str. 69, 4040 Linz, Austria. 5 Computational Genomics Program, Principe FelipeResearch Center, Avd Eduardo Primo Yufera 3, 46012 Valencia, Spain. 6 CIBER de Enfermedades Raras (CIBERER) and Functional Genomics Node, INB., Valencia,Spain. 7 ecSeq Bioinformatics, Brandvorwerkstrasse 43, 04275 Leipzig, Germany. 8 National Center for Toxicological Research, Food and Drug Administration,3900 NCTR Road, Jefferson, Arkansas 72079, USA. 9 Genomics Core Facility, Feinberg School of Medicine, Northwestern University, Tarry building 2-757, 300E. Superior St. Chicago, Illinois 60611, USA. 10 Chair of Bioinformatics, Boku University Vienna, Muthgasse 18, Vienna 1190, Austria. 11 University of Warwick,Coventry CV4 7AL, UK. 12 Department of Physiology and Biophysics, Institute for Computational Biomedicine, Weill Cornell Medical College, 1305 York Avenue,Room Y13-04, Box 140, New York, New York 10021, USA. 13 Division of Bioinformatics, The Walter and Eliza Hall Institute of Medical Research, 1G Royal Parade,Parkville, Victoria 3052, Australia. 14 Department of Medical Biology, The University of Melbourne, Parkville, Victoria 3010, Australia. 15 Nationwide Children’sHospital, Columbus, Ohio 43205, USA. 16 Medical Genome Project, Genomics and Bioinformatics Platform of Andalusia, c/ Albert Einstein s/n, 41092 Sevilla,Spain. 17 Thermo Fisher Scientific, Research & Development, 2170 Woodward Street, Austin, Texas 78744, USA. 18 State Key Laboratory of Genetic Engineeringand MOE Key Laboratory of Contemporary Anthropology, Schools of Life Sciences and Pharmacy, Fudan University, Shanghai 201203, China. 19 Department ofComputing and Information Systems, The University of Melbourne, Parkville, Victoria 3010, Australia. 20 Department of Mathematics and Statistics, TheUniversity of Melbourne, Parkville, Victoria 3010, Australia. 21 Division of Microbiology and Molecular Genetics, Center for Genomics, School of Medicine, LomaLinda University, Loma Linda, California 92350, USA. 22 Research Informatics, Eli Lilly and Company, Lilly Corporate Center, Indianapolis, Indiana 46285, USA.23 Biomedical Informatics Research Center, Marshfield Clinic Research Foundation, 1000 N Oak Avenue, Marshfield, Wisconsin 54449, USA. wPresent address:Discovery Science, Thomson Reuters IP & Science, 22 Thomson Place, Boston, Massachusetts 02210, USA. Correspondence and requests for materials shouldbe addressed to S.A.M. (email: [email protected]) or to M.S. (email: [email protected]).
NATURE COMMUNICATIONS | 5:5125 | DOI: 10.1038/ncomms6125 | www.nature.com/naturecommunications 1
& 2014 Macmillan Publishers Limited. All rights reserved.

Ratios of mRNA transcript abundance between sample typesare measures of biological activity. These measurements ofdifferential gene expression are important to underpin new
biological hypotheses and to support critical applications such asselection of disease classifiers and regulatory oversight of drugtherapies. Controls and associated ratio performance metrics areessential to understand the reproducibility and validity ofdifferential expression experimental results. External spike-incontrol ratio measurements can serve as a truth set to benchmarkthe accuracy of endogenous transcript ratio measurements.
A library of 96 external RNA spike-in controls developed bythe External RNA Controls Consortium (ERCC)1 and distributedby NIST as Standard Reference Material 2374 (ref. 2) can act astechnology-independent controls for differential expressionexperiments. Method validation of differential expressionexperiments based on these ERCC controls is the focus of thiswork. This validation supports comparisons across experiments,laboratories, technology platforms and data analysis methods3–7.In any differential expression experiment, with any technologyplatform, a pair of ERCC control ratio mixtures can be added(‘spiked’) into total RNA samples such that for each ERCCcontrol the relative abundance of the control between samples(ratio) is either of known difference (a true-positive control) orthe same (a true-negative control).
To enable rapid, reproducible and automated analysis of anydifferential expression experiment we present a new software tool,the erccdashboard R package, which produces ERCC ratioperformance metrics from expression values (for example,sequence counts or microarray signal intensities). These ratioperformance measures include diagnostic performance of differ-ential expression detection with receiver operating characteristic(ROC) curves and area under the curve (AUC) statistics, limit ofdetection of ratio (LODR) estimates and expression ratiotechnical variability and bias.
Ratio performance measures provided by the erccdashboardpackage do not supersede other quality control (QC) measures,such as the QC methods recommended to evaluate sequence databoth before and after alignment to a reference sequence inRNA-Seq experiments8–12. Sequence-level QC methods areimportant for evaluating the quality of data in both transcript-discovery and differential expression RNA-Seq experiments butdo not provide the additional analysis of positive and negativecontrols to fully evaluate differential expression experimenttechnical performance.
Analysis of ERCC ratio mixtures with the erccdashboardpackage provides technology-independent ratio performancemetrics (applicable to RNA-Seq, microarrays or any future geneexpression measurement technologies). These metrics are asignificant extension beyond previous work with ERCC tran-scripts in RNA-Seq measurements13. In this earlier work, a singlemixture of ERCC transcripts was used to assess dynamic rangeand precision in individual transcript-discovery RNA-Seqmeasurements. This earlier work did not assess differentialexpression experiments using ratio performance metrics fromERCC control ratio mixtures.
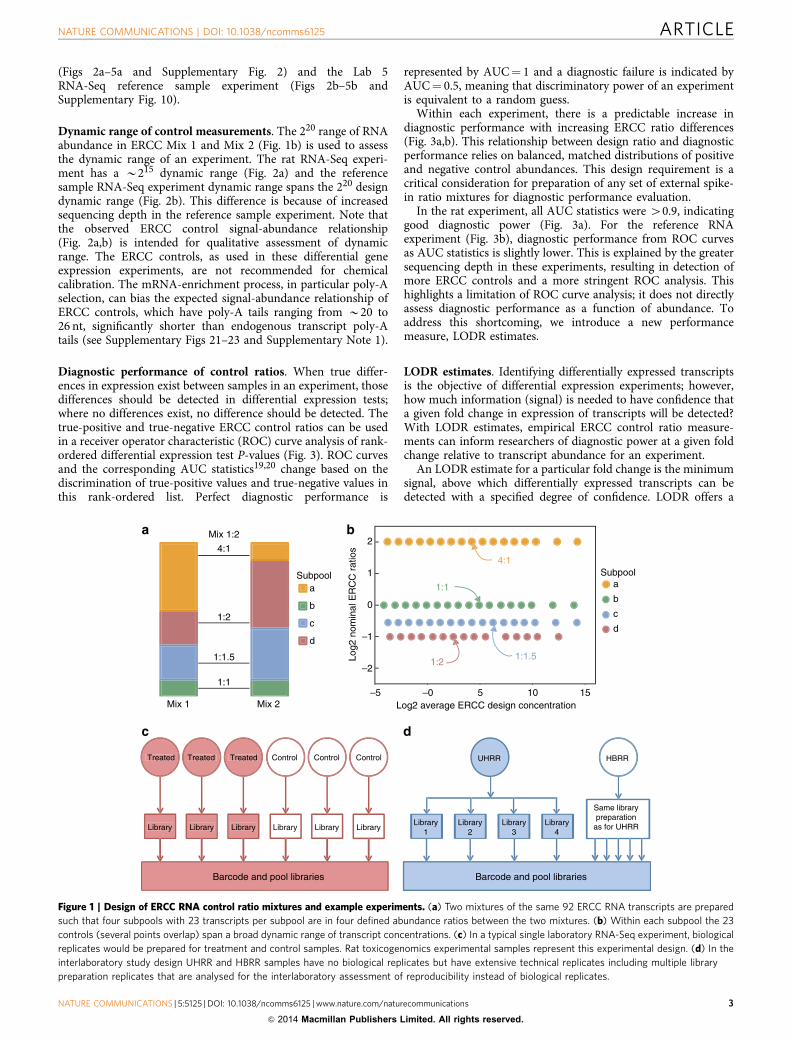
The source to create ERCC ratio mixtures is a plasmid DNAlibrary of ERCC sequences that is available as a standardreference material from NIST (SRM 2374 (ref. 2)). This library of96 sequences is intended for use as controls in commercialproducts, such as the pair of ERCC ratio mixtures used in thisanalysis. In these commercially available mixtures (Mix 1 andMix 2), 92 of the 96 ERCC RNA molecule species were pooled tocreate mixes with true-positive and true-negative relativeabundance differences. The two ERCC ratio mixtures are eachcomposed of four subpools (23 ERCC controls per subpool) withdefined abundance ratios between the mixes (Fig. 1a). Three of
the subpools have different ERCC abundances in Mix 1 and Mix2 (4:1, 1:2 and 1:1.5 ratios), and one subpool has identical ERCCabundances in the two mixes (a 1:1 ratio). Within each subpoolERCC abundances span a 220 dynamic range. Figure 1b illustratesthe ratio-abundance relationship of the 92 controls in the pair ofmixtures.
Ratio mixture analysis with the erccdashboard is demonstratedfor two types of differential expression studies: (1) rattoxicogenomics experiments with different treatments conductedat a single sequencing laboratory14 and (2) interlaboratoryanalysis of the samples used in the MicroArray Quality-Control(MAQC) study15, Universal Human Reference RNA16 (UHRR)and Human Brain Reference RNA (HBRR). The rattoxicogenomics study design consists of biological replicates fortreatment and control conditions and illustrates a canonicalRNA-Seq differential expression experiment with biologicalsample replication (Fig. 1c). In the interlaboratory study of thereference RNA samples, library replicates are compared in lieu ofbiological replicates (Fig. 1d).
The interlaboratory study design offers a valuable opportunityto evaluate performance of experiments at individual laboratoriesand reproducibility between laboratories, even in the absence ofbiological replication because of the use of reference samples.Aliquots from a pair of spiked reference RNA samples weredistributed to multiple laboratories for the Sequencing Quality-Control (SEQC) project17 and the Association of BiomolecularResource Facilities (ABRF) interlaboratory study18. Both studiesmeasured the same samples on multiple measurement platforms.Subsets of experiments from these studies are analysed here withthe erccdashboard package. These experiments include RNA-Seqexperiments from the SEQC study using the Illumina HiSeqplatform (ILM SEQC Lab 1–6) and the Life Technologies 5500platform (LIF SEQC Lab 7–9), and ABRF study Illumina HiSeqplatform (ILM ABRF Lab 10–12). Three laboratories in the SEQCproject also performed microarray experiments with these samesamples (Illumina BeadArray experiments at Lab 13 and 14 and acustom Agilent 1 M array at Lab 15).
Analysis of a differential gene expression experiment using theerccdashboard package produces four main analysis figures.These four erccdashboard figures enable ‘reproducible research’by providing an assessment of the key technical performancemeasures for any differential expression experiment. Examples ofthese four figures are presented for rat toxicogenomics experi-ments and reference RNA experiments from the large SEQC andABRF experiment cohorts. Here we also evaluate the reprodu-cibility of reference RNA experiments among laboratories usingthe SEQC and ABRF interlaboratory study data. Analysis of thesequencing experiments from the 12 laboratories participating inthe interlaboratory study shows generally consistent diagnosticpower across 11 out of the 12 participating laboratories. Ratiomeasurement variability and bias are also comparable amonglaboratories that used the same measurement process, which isdefined here as a combination of sample preparation andsequencing. Three distinct measurement processes are assessedin this interlaboratory analysis and we observe different biases formeasurement processes that include different mRNA-enrichmentprotocols.
ResultsExamples of the erccdashboard performance measure figures arepresented in Figs 2–5 for two arbitrarily-selected exampleexperiments from the large SEQC and ABRF experiment cohorts(for all results see Supplementary Figs 1–20). These two examplesare a rat toxicogenomics methimazole-treated (MET) and control(CTL) sample RNA-Seq experiment with biological replication
ARTICLE NATURE COMMUNICATIONS | DOI: 10.1038/ncomms6125
2 NATURE COMMUNICATIONS | 5:5125 | DOI: 10.1038/ncomms6125 | www.nature.com/naturecommunications
& 2014 Macmillan Publishers Limited. All rights reserved.
(Figs 2a–5a and Supplementary Fig. 2) and the Lab 5RNA-Seq reference sample experiment (Figs 2b–5b andSupplementary Fig. 10).
Dynamic range of control measurements. The 220 range of RNAabundance in ERCC Mix 1 and Mix 2 (Fig. 1b) is used to assessthe dynamic range of an experiment. The rat RNA-Seq experi-ment has a B215 dynamic range (Fig. 2a) and the referencesample RNA-Seq experiment dynamic range spans the 220 designdynamic range (Fig. 2b). This difference is because of increasedsequencing depth in the reference sample experiment. Note thatthe observed ERCC control signal-abundance relationship(Fig. 2a,b) is intended for qualitative assessment of dynamicrange. The ERCC controls, as used in these differential geneexpression experiments, are not recommended for chemicalcalibration. The mRNA-enrichment process, in particular poly-Aselection, can bias the expected signal-abundance relationship ofERCC controls, which have poly-A tails ranging from B20 to26 nt, significantly shorter than endogenous transcript poly-Atails (see Supplementary Figs 21–23 and Supplementary Note 1).
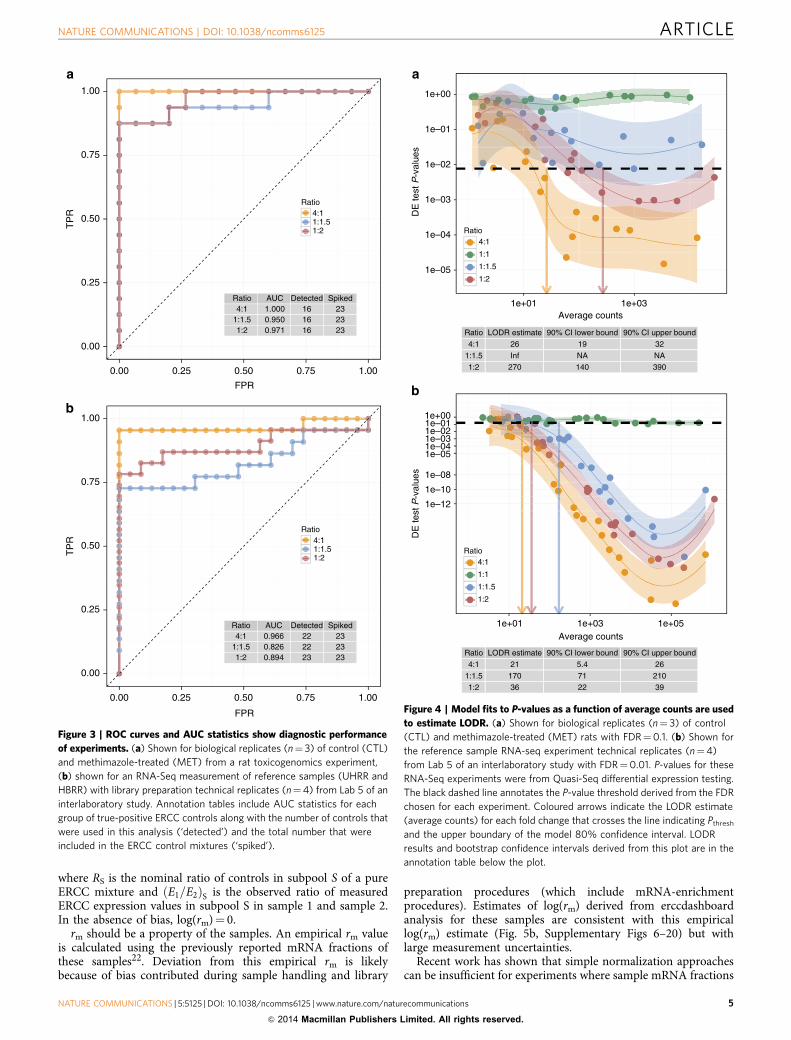
Diagnostic performance of control ratios. When true differ-ences in expression exist between samples in an experiment, thosedifferences should be detected in differential expression tests;where no differences exist, no difference should be detected. Thetrue-positive and true-negative ERCC control ratios can be usedin a receiver operator characteristic (ROC) curve analysis of rank-ordered differential expression test P-values (Fig. 3). ROC curvesand the corresponding AUC statistics19,20 change based on thediscrimination of true-positive values and true-negative values inthis rank-ordered list. Perfect diagnostic performance is
represented by AUC¼ 1 and a diagnostic failure is indicated byAUC¼ 0.5, meaning that discriminatory power of an experimentis equivalent to a random guess.
Within each experiment, there is a predictable increase indiagnostic performance with increasing ERCC ratio differences(Fig. 3a,b). This relationship between design ratio and diagnosticperformance relies on balanced, matched distributions of positiveand negative control abundances. This design requirement is acritical consideration for preparation of any set of external spike-in ratio mixtures for diagnostic performance evaluation.
In the rat experiment, all AUC statistics were 40.9, indicatinggood diagnostic power (Fig. 3a). For the reference RNAexperiment (Fig. 3b), diagnostic performance from ROC curvesas AUC statistics is slightly lower. This is explained by the greatersequencing depth in these experiments, resulting in detection ofmore ERCC controls and a more stringent ROC analysis. Thishighlights a limitation of ROC curve analysis; it does not directlyassess diagnostic performance as a function of abundance. Toaddress this shortcoming, we introduce a new performancemeasure, LODR estimates.
LODR estimates. Identifying differentially expressed transcriptsis the objective of differential expression experiments; however,how much information (signal) is needed to have confidence thata given fold change in expression of transcripts will be detected?With LODR estimates, empirical ERCC control ratio measure-ments can inform researchers of diagnostic power at a given foldchange relative to transcript abundance for an experiment.
An LODR estimate for a particular fold change is the minimumsignal, above which differentially expressed transcripts can bedetected with a specified degree of confidence. LODR offers a
Treated Treated Treated Control Control Control
LibraryLibrary
1Library
2Library
3Library
4
Same librarypreparation
as for UHRR
HBRRUHRR
–5Mix 2Mix 1
1:1
1:1.5
1:2
4:1
Mix 1:2
Subpoola
b
c
d
–2
–1
0
1
2
Log2 average ERCC design concentration
Log2
nom
inal
ER
CC
rat
ios
–0 5 10 15
d
c
b
aSubpool
1:1.5
1:1
4:1
1:2
LibraryLibraryLibraryLibraryLibrary
Barcode and pool libraries Barcode and pool libraries
Figure 1 | Design of ERCC RNA control ratio mixtures and example experiments. (a) Two mixtures of the same 92 ERCC RNA transcripts are prepared
such that four subpools with 23 transcripts per subpool are in four defined abundance ratios between the two mixtures. (b) Within each subpool the 23
controls (several points overlap) span a broad dynamic range of transcript concentrations. (c) In a typical single laboratory RNA-Seq experiment, biological
replicates would be prepared for treatment and control samples. Rat toxicogenomics experimental samples represent this experimental design. (d) In the
interlaboratory study design UHRR and HBRR samples have no biological replicates but have extensive technical replicates including multiple library
preparation replicates that are analysed for the interlaboratory assessment of reproducibility instead of biological replicates.
NATURE COMMUNICATIONS | DOI: 10.1038/ncomms6125 ARTICLE
NATURE COMMUNICATIONS | 5:5125 | DOI: 10.1038/ncomms6125 | www.nature.com/naturecommunications 3
& 2014 Macmillan Publishers Limited. All rights reserved.

statistically derived, objective alternative to other methods ofparsing gene lists.
An LODR estimate is obtained for a specified ratio bymodelling the relationship between differential expression testP-values and signal. An acceptable false discovery rate (FDR)must be chosen to estimate an LODR. For the selected FDR(q-value) a threshold P-value can be selected from the population
of P-values from the experiment. An LODR estimate for eachdifferential ratio is found based on the intersection of themodel confidence interval upper bound (90%) with the P-valuethreshold. A recommended default for erccdashboard analysis isFDR¼ 0.05; however, this input parameter may be adjusted.For all rat RNA-Seq experiments (Fig. 4a and SupplementaryFigs 1–5) FDR¼ 0.1 because in these sequencing experiments thedifferential expression testing yields P-value distributions that donot contain strong evidence for differences between the samples.A smaller FDR for these experiments would decrease thethreshold P-value and increase the LODR estimates. A muchlower threshold, FDR¼ 0.01, is used in the reference sampleexperiments (Fig. 4b and Supplementary Figs 6–20) because largedifferences in reference sample transcript abundances yield alarge number of small P-values. See Methods for more guidanceand detail on LODR estimation. In Supplementary Information,we also describe a way to assess validity of the ERCC control datafor LODR estimation and an alternative model-based approachfor LODR estimation (Supplementary Figs 24–25 andSupplementary Notes 2–3).
Detection of differential expression improves with increasingsignal for all experiments (Fig. 4a,b); this cannot be discernedwith ROC analysis. The AUC results for the rat experiment(Fig. 3a) had very similar diagnostic performance for all ratios (allratios have AUC40.95); however, the LODR estimates for eachratio are significantly different (Fig. 4a). This analysis demon-strates that, although AUC statistics can be a good summary ofoverall diagnostic performance, LODR estimates provide valuableevidence of diagnostic performance with respect to transcriptabundance.
ERCC results that are above each LODR estimate areannotated with filled points on MA plots21 (Fig. 5a,b); suchannotated MA plots can be used to design future experiments toachieve balance between cost and the desired diagnostic power.For example, when signals for genes of interest (GOIs) areobserved at or near an LODR estimate, deeper sequencing of thesamples should increase signal for the GOIs to be above theLODR estimate. Spike-in control LODR estimates provide anobjective expectation for detection of differentially expressedendogenous transcripts but will not substitute for carefulexperimental design with appropriate biological replication.
Bias and variability in control ratio measurements. Bias andvariability of control ratio measurements are evaluated graphi-cally with MA plots. ERCC control ratio measurements for eachof the four ERCC subpools should agree with the nominal ratios(annotated with solid coloured lines in Fig. 5a,b). The distancebetween the solid and dashed lines for each ERCC subpool(Fig. 5a,b) is the bias in the control ratio measurements. For therat experiment (Fig. 5a), the control ratio measurements showlittle bias; however, a more significant bias is observed for thecontrol ratio measurements in the reference RNA experiment(Fig. 5b). This bias is attributable to the documented difference inmRNA fraction between the two reference samples22. FollowingmRNA enrichment, the relative amount of ERCC mix toendogenous RNA in HBRR is greater than the amount inUHRR; this creates the bias observed in the ERCC controlratio measurements (see example illustration in SupplementaryFig. 26).
Correcting this bias because of mRNA fraction differences iscritical for accurate differential expression testing. A model todescribe this bias in control ratios, rm, is:
RS ¼ rmE1
E2
� �S
ð1Þ
–10
–5
0
5
10
a
b
–10
–5
0
5
10
0 5Log2 ERCC spike amount (attomol nt µg–1 total RNA)
10 15 20
Log2
nor
mal
ized
ER
CC
cou
nts
Ratio4:11:11:1.51:2
SampleCTLMET
0 5 10Log2 ERCC spike amount (attomol nt µg–1 total RNA)
15 20
Log2
Nor
mal
ized
ER
CC
cou
nts
SampleHBRRUHRR
Ratio4:11:11:1.51:2
Figure 2 | Signal-abundance plots show dynamic range of experiments.
(a) dynamic range of a rat toxicogenomics experiment with biological
replicates (n¼ 3) of control (CTL) and methimazole-treated (MET) (b)
dynamic range of an RNA-Seq measurement of reference samples (UHRR
and HBRR) with library preparation technical replicates (n¼4) from Lab 5
of an interlaboratory study. In each figure points are coloured by ratio
subpool, error bars represent the standard deviations of replicates, and
shape represents sample type. In the RNA-Seq results, ERCC controls that
did not have at least one count in three libraries for either sample were not
included in the signal-abundance plot.
ARTICLE NATURE COMMUNICATIONS | DOI: 10.1038/ncomms6125
4 NATURE COMMUNICATIONS | 5:5125 | DOI: 10.1038/ncomms6125 | www.nature.com/naturecommunications
& 2014 Macmillan Publishers Limited. All rights reserved.
where RS is the nominal ratio of controls in subpool S of a pureERCC mixture and E1=E2ð ÞS is the observed ratio of measuredERCC expression values in subpool S in sample 1 and sample 2.In the absence of bias, log(rm)¼ 0.
rm should be a property of the samples. An empirical rm valueis calculated using the previously reported mRNA fractions ofthese samples22. Deviation from this empirical rm is likelybecause of bias contributed during sample handling and library
preparation procedures (which include mRNA-enrichmentprocedures). Estimates of log(rm) derived from erccdashboardanalysis for these samples are consistent with this empiricallog(rm) estimate (Fig. 5b, Supplementary Figs 6–20) but withlarge measurement uncertainties.
Recent work has shown that simple normalization approachescan be insufficient for experiments where sample mRNA fractions
1e–05
1e–04
1e–03
1e–02
1e–01
1e+00
a
b
1e+01 1e+03Average counts
DE
test
P-v
alue
s
Ratio4:1
1:1
1:1.5
1:2
Ratio
4:1
1:1.5
1:2
LODR estimate
26
Inf
270
90% CI lower bound
19
NA
140
90% CI upper bound
32
NA
390
1e+001e–011e–021e–031e–041e–05
1e–08
1e–10
1e–12
1e+01 1e+03 1e+05Average counts
DE
test
P-v
alue
s
Ratio4:1
1:1
1:1.5
1:2
Ratio
4:1
1:1.5
1:2
LODR estimate
21
170
36
90% CI lower bound
5.4
71
22
90% CI upper bound
26
210
39
Figure 4 | Model fits to P-values as a function of average counts are used
to estimate LODR. (a) Shown for biological replicates (n¼ 3) of control
(CTL) and methimazole-treated (MET) rats with FDR¼0.1. (b) Shown for
the reference sample RNA-seq experiment technical replicates (n¼4)
from Lab 5 of an interlaboratory study with FDR¼0.01. P-values for these
RNA-Seq experiments were from Quasi-Seq differential expression testing.
The black dashed line annotates the P-value threshold derived from the FDR
chosen for each experiment. Coloured arrows indicate the LODR estimate
(average counts) for each fold change that crosses the line indicating Pthresh
and the upper boundary of the model 80% confidence interval. LODR
results and bootstrap confidence intervals derived from this plot are in the
annotation table below the plot.
Ratio4:1
1:1.51:2
AUC1.0000.9500.971
Detected161616
Spiked232323
0.00
0.25
0.50
0.75
1.00
a
b
0.00 0.25 0.50 0.75 1.00
FPR
TP
R
Ratio4:11:1.51:2
Ratio4:1
1:1.51:2
AUC0.9660.8260.894
Detected222223
Spiked232323
0.00
0.25
0.50
0.75
1.00
0.00 0.25 0.50 0.75 1.00
FPR
TP
R
Ratio4:11:1.51:2
Figure 3 | ROC curves and AUC statistics show diagnostic performance
of experiments. (a) Shown for biological replicates (n¼ 3) of control (CTL)
and methimazole-treated (MET) from a rat toxicogenomics experiment,
(b) shown for an RNA-Seq measurement of reference samples (UHRR and
HBRR) with library preparation technical replicates (n¼4) from Lab 5 of an
interlaboratory study. Annotation tables include AUC statistics for each
group of true-positive ERCC controls along with the number of controls that
were used in this analysis (‘detected’) and the total number that were
included in the ERCC control mixtures (‘spiked’).
NATURE COMMUNICATIONS | DOI: 10.1038/ncomms6125 ARTICLE
NATURE COMMUNICATIONS | 5:5125 | DOI: 10.1038/ncomms6125 | www.nature.com/naturecommunications 5
& 2014 Macmillan Publishers Limited. All rights reserved.

are significantly different23. This work and our analysis heredemonstrate the utility of the ERCC controls for the detection ofbias in an experiment because of sample mRNA fraction differences.
Our analysis presents evidence of bias in ERCC control signalsin experiments using poly-A selection for mRNA enrichment(Supplementary Figs 21–23 and Supplementary Note 1). This biashas been reported in earlier work13. A protocol-dependent bias(for example, poly-A selection bias) affecting the ERCC controlsignals prohibits the use of these experimental data for spike-in-based normalization approaches. Deconvolving sample mRNAfraction differences and protocol-dependent bias requireexperimentally validating the stability of the bias and using thisvalidated protocol. If the protocol-dependent bias is the same(stable) across samples of interest, then normalization usingspike-ins should be valid. Any protocol-dependent bias observedwith ERCC controls is a red flag that the same bias may affectendogenous transcripts as well.
Despite the bias in ERCC control signals arising frominefficiency in their recovery through the mRNA-enrichmentprocess, the ERCC control ratios are stable and useful formeasurement assurance of endogenous transcript ratio measure-ments. We observed that samples treated in the same librarypreparation batch experienced the same protocol-dependent bias.All transcript ratios were calculated between samples within asingle library preparation batch and the ERCC ratio results areshown to be precise and stable across a broad dynamic range andmultiple ratios (Fig. 5a,b and Supplementary Figs 1–20d).
ERCC ratio measurements in the reference sample experimentshave smaller variability compared with the rat experimentmeasurements. This difference in ratio variability can beattributed to both lower sequencing depth in the rat experimentas well as variability in spiking these biological samples (referencesamples were spiked once in bulk and then aliquoted).
Application of the erccdashboard: interlaboratory analysis.Interlaboratory reproducibility of RNA-Seq experiments is eval-uated by comparing erccdashboard performance measures usingthe spiked reference RNA samples. Three different measurementprocesses (sample preparation and sequencing platform) wereused at different laboratories: Illumina SEQC sequencing sites(ILM SEQC Lab 1–6), Life Technologies SEQC sequencingsites (LIF SEQC Lab 7–9) and Illumina ABRF sequencing sites(ILM ABRF Lab 10–12). At the ILM ABRF sites, ribosomal RNAdepletion was used for mRNA enrichment. At ILM SEQC andLIF SEQC sites, reference sample total RNA went through tworounds of poly-A selection but a different type of kit andexperimental protocol was used for each platform. Poly-A selec-tion was carried out independently for each library replicate atILM SEQC sites, and at LIF SEQC sites poly-A selection wascarried out for each sample type.
While reproducibility can be evaluated with these experiments,note that strong conclusions regarding performance of particularlaboratories, sample preparation protocols or sequencing plat-forms (these factors are confounded) would require a moresystematic study design repeated over time.
LODR estimates complement AUC statistics for each inter-laboratory site (Fig. 6a,b), supporting the use of the moreinformative LODR as a new performance metric. For the ILMSEQC experiments (Lab 1–6), although the AUC statistics for allratios at Lab 2 indicate slightly decreased diagnostic performance,the LODR estimates showed similar performance across all sixsites. LODR estimates from the ILM ABRF experiments wereconsistent with ILM SEQC experiments despite lower AUCstatistics for the ILM ABRF experiments (Lab 10–12). For the LIFSEQC experiments (Lab 7–9), both the AUC statistics and LODRestimates indicated reduced diagnostic performance at Lab 7.For 1:1.5 ratio measurements in this experiment, diagnosticperformance is very poor, AUC o0.7, and an LODR estimatecould not be obtained for the specified FDR.
weighted mean
–0.07014Log(rm) 0.1495
0
1
2
3
4a
b
–10–4
–3
–2
–1
–5 0 5 10Log2 average of normalized counts
Log2
rat
io o
f nor
mal
ized
cou
nts
Ratio4:11:11:1.51:2
0
1
2
3
4
–4
–3
–2
–1
Log2
rat
io o
f nor
mal
ized
cou
nts
Ratio4:11:11:1.51:2
(+/–) weighted standard error
–10 –5 0 5 10Log2 average of normalized counts
0.2836 0.03764
(+/–) weighted standard errorweighted mean
Log(rm)
Figure 5 | MA plots show ratio measurement variability and bias.
(a) Shown for biological replicates (n¼ 3) of control (CTL) and
methimazole treated (MET) from a rat toxicogenomics experiment.
(b) Shown for an RNA-Seq measurement of reference samples (UHRR and
HBRR) with library preparation technical replicates (n¼4) from Lab 5 of an
interlaboratory study. ERCC data points (coloured by ratio) represent the
mean ratio measurements per ERCC. Error bars represent the standard
deviation of replicate ratios. Filled circles indicate ERCC ratios above the
LODR estimate for 4:1, 1:1.5 and 1:2 ratios. Endogenous transcript ratio
measurements are shown as grey points. The estimate of mRNA fraction
differences between the samples, rm, with weighted standard errors is
provided in an inset table and used to adjust the nominal ERCC ratios. The
nominal ratios are annotated with solid coloured lines for each ratio subpool
and the adjusted ratios are annotated with dashed coloured lines.
ARTICLE NATURE COMMUNICATIONS | DOI: 10.1038/ncomms6125
6 NATURE COMMUNICATIONS | 5:5125 | DOI: 10.1038/ncomms6125 | www.nature.com/naturecommunications
& 2014 Macmillan Publishers Limited. All rights reserved.

Weighted mean estimates of the mRNA fraction differencebetween the UHRR and HBRR samples for the ILM SEQCexperiments generally show agreement with the previouslyreported rm measurement (Fig. 6c) with the exception of Lab 3.This lab also had an increased standard error for rm comparedwith the other ILM SEQC labs. This difference is echoed in otherupstream QC analysis of the ILM SEQC data that showeddecreased sequencing read quality at Lab 3 (refs 17,24).
Large standard errors for rm were obtained for the laboratoriesin both the ILM ABRF and LIF SEQC experiments. Thisincreased variability in the rm estimates is echoed in violinplots of ratio standard deviations at each site (Fig. 6d). In theILM ABRF experiments, Lab 10 had particularly high ratiomeasurement variability, suggesting the presence of a batch effectat this site (See also Supplementary Fig. 24 and Note 2). At Lab 7in the LIF SEQC experiments, the rm estimate standard errorsand overall ratio measurement variability were very high
(Fig. 6c,d), and this site also showed poor diagnostic performance(Fig. 6a,b).
QC metrics show consistency for within-platform differences.Analysis of the ERCC control ratio ‘truth set’ provides evidence ofthe poor ratio measurement performance in the Lab 7 differentialexpression experiment; however, technology-specific QC mea-sures are needed to link observations of poor ratio measurementperformance to upstream causes such as sample preparationissues. QC assessment of the mapped read data for the threeLife Technologies sites was used to identify possible reasons forperformance differences in these experiments.
Lab 7 performance is not an artifact of read mapping andquantification; similar results were obtained for LIF SEQC datausing both the Life Technologies LifeScope analysis pipeline(Supplementary Figs 12–14) and the Subread25 and
1.0a b
c d
0.9
0.8
0.7
0.6
Det
ectio
n pe
rfor
man
ce (
AU
C)
0.5
0.5
0.4
0.3
Log(r m
)
Log(rm) = 0.3597
0.2
0.1
0.0
0.6
0.9
0.0
0.3
Sta
ndar
d de
viat
ions
of E
RC
C c
ontr
ol r
atio
s
1 2 3 4 5 6Laboratory
7 8 9 10 11 12 1 2 3 4 5 6Laboratory
7 8 9 10 11 12
1:1.5
1:2
4:1
Ratio
LIF SEQC
ILM SEQC
ILM ABRF
Platform and study
1 2 3 4 5 6Laboratory Laboratory
7 8 9 10 12 1
0
100
200
4:1 1:2 1:1.5
LOD
R (
aver
age
coun
ts)
211 3 4 5 6 7 8 9 10 1211 1 2 3 4 5 6 7 8 9 10 1211 1 2 3 4 5 6 7 8 9 10 1211
Figure 6 | Interlaboratory comparison of erccdashboard performance measures for reference sample experiments. (a) AUC statistics are shown
for the ERCC controls at the three differential ratios. (b) LODR count estimates (on a log scale) for the ERCC controls at the three differential ratios.
Error bars represent LODR bootstrap method 90% confidence intervals. (c) Weighted mean estimates of mRNA fraction differences for the sample set with
error bars representing weighted standard errors. The solid black line represents the measurement of rm from previous work22 and dashed black lines show
the confidence interval from the standard deviation of this estimate. (d) Violin plots show distributions of ERCC control ratio standard deviations at each
laboratory. The legend is common to all figures, colour indicates measurement process and transparency of each colour is used to indicate results for
different ratios.
NATURE COMMUNICATIONS | DOI: 10.1038/ncomms6125 ARTICLE
NATURE COMMUNICATIONS | 5:5125 | DOI: 10.1038/ncomms6125 | www.nature.com/naturecommunications 7
& 2014 Macmillan Publishers Limited. All rights reserved.

featureCounts26 analysis pipeline (Supplementary Figs 27–29).Mapped read QC metrics from RNASeQC9 for a small subset ofUHRR data from Lab 7–9 mapped with LifeScope show possiblereasons for performance differences. Lab 7 had an increasedpercentage of duplicated reads in the libraries they prepared; afifth library prepared at an independent site (and then sharedamong the three laboratories for sequencing) showed a lowerduplication rate (Supplementary Fig. 30). These results suggestthat libraries prepared at Lab 7 had low complexity. Evidence for30 coverage bias is observed across all libraries for the middle1,000 expressed transcripts (Supplementary Fig. 31). For the top1,000 expressed transcripts, the four libraries prepared at Lab 7showed increased 30 coverage bias relative to the four librariesprepared at Lab 8 and 9 (Supplementary Fig. 32). There were nosignificant differences in ribosomal RNA mapping fractions forlibraries 1–4 at the three laboratories (Supplementary Fig. 33).
DiscussionThe erccdashboard R package is a method validation tool forstandard analysis of differential gene expression experiments. Thekey technical performance parameters from ERCC control ratiomixtures are evaluated with four main analysis figures producedby the software. Examples of these four figures are shown for twodifferent experiment types in Figs 2–5. These technology-agnosticperformance measures include dynamic range, diagnostic per-formance, LODR estimates and expression ratio bias andtechnical variability.
A dynamic range of 216 is desirable as a general rule of thumbfor a typical RNA-Seq gene expression experiment. The bestobservable dynamic range with the ERCC control ratio mixturesused in this study is 220.
Diagnostic performance of an experiment can be assessed withROC curve analysis; however, care should be taken in comparisonof AUC statistics across experiments without consideration of thenumber of controls detected in each experiment. An experimentwith 4:1 AUC of 0.85 where 16 controls were detected out of 23spiked controls may not necessarily have better performance thanan experiment where 23 controls were detected and the 4:1 AUCis 0.8. This and other issues noted for ROC curve analysis20
underscore the benefit of using the new LODR performancemetric that summarizes diagnostic performance with respect toabundance in any experiment and can be informative forexperimental design. If signals from the GOIs in a study areabove the LODR then that indicates the sequencing depth issufficient. When this is not the case, deeper sequencing of thesamples should increase signal for the GOIs to be above theLODR estimate.
Statistically significant ratio measurement bias indicates anexperimental artifact (for example, protocol-dependent bias) oran mRNA fraction difference between samples. The source of biasshould be identified and addressed with validated methods. Mostreference RNA experiments had a ratio measurement bias thatcould be explained by the known mRNA fraction difference forthe reference RNA samples; however, several experiments showeda significant difference, and some had very large standard errors.For these experiments, there may be other batch effects thatshifted the ratio measurement bias or contributed to the largestandard errors. These differences between experiments highlightthe utility of ERCC ratio measurements as a truth set tobenchmark the accuracy of endogenous transcript ratio measure-ments. In other words, ERCC ratio bias in an experiment suggeststhat endogenous transcript ratios may be biased in thatexperiment as well. Our analysis tool based on the ERCC controlsprovides researchers with the ability to use empirical evidence toassess bias in an experiment that may affect both controls andendogenous transcripts. Without the use of appropriate controls
and related analysis methods, the presence of such bias mightremain undetected.
Method validation can be accomplished with these ERCC ratioperformance measures for any gene expression measurementtechnology, including both RNA-Seq and microarrays, which cangive comparable differential expression results with appropriateexperimental design and analysis. Reproducible research calls forstandard approaches to assess, report and compare the technicalperformance of genome-scale differential expression experiments.As measurement technology costs decrease, differential expres-sion measurements are increasing in scope and complexity,including experimental designs with large sample cohorts,measured over time, at multiple laboratories. Even a singlecanonical differential expression experiment can involve theeffort of multiple investigators, from the experimentalistgenerating the samples and eventually reporting the conclusionsto the many scientists performing sample preparation, sequen-cing, bioinformatics and statistical analysis. These erccdashboardperformance measures provide a standard method to enable thescientific community conducting differential expression experi-ments to critically assess the performance of single experiments,performance of a given laboratory over time or performanceamong laboratories. Standard method validation of experimentswith erccdashboard analysis will provide scientists with con-fidence in the technical performance of their experiments at anyscale.
MethodsReference RNA sample preparation and RNA-Seq. The two ERCC spike-inRNA transcript mixtures (Ambion, Life Technologies) were produced fromplasmid DNA templates (NIST Standard Reference Material 2374). The referenceRNA samples, Universal Human Reference RNA16 (Agilent Technologies) andHuman Brain Reference RNA (Ambion, Life Technologies) were spiked with thetwo ERCC spike-in RNA transcript mixtures (Ambion, Life Technologies) by FDANational Center for Toxicological Research and distributed to SEQC sitelaboratories for sequencing on Illumina, Life Technologies, and Roche platforms asdescribed in the main SEQC project manuscript17 and these samples were also usedin the ABRF interlaboratory study18. In brief, 50 ml of ERCC Mix 1 was spiked into2500 ml UHRR (Universal Human Reference RNA) total RNA and 50 ml ERCC Mix2 was spiked into 2,500ml HBRR (Human Brain Reference RNA) total RNA. Singlealiquots (10ml each) of these two samples were sent to each participating laboratoryto produce replicate library preparations of samples.
For the SEQC study, there were separate library preparation protocols for theIllumina and Life Technologies platforms including different poly-A selectionprotocols for mRNA enrichment. Replicate library preparations (n¼ 4) wereprepared at every laboratory and then at each laboratory all library preparationswere barcoded, pooled and sequenced with 2� 100 paired-end sequencingchemistry for Illumina and 50� 35 paired-end sequencing chemistry for LifeTechnologies using the full fluidic capacity of an instrument (all lanes and flowcells). Experiments for SEQC interlaboratory analysis from six Illumina sites andthree Life Technologies sites were compared in this analysis.
In addition to the SEQC data, we also evaluated three Illumina sequencingexperiments from the ABRF study that used ribo-depletion for mRNA enrichmentinstead of poly-A selection. In these experiments, replicate library preparations(n¼ 3) were sequenced at each laboratory with 2� 50 paired-end sequencingchemistry.
For the Illumina SEQC reference RNA libraries, the mean number of reads perlibrary was 260,098,869 reads, for the Life Technologies SEQC reference RNAlibraries the mean number of reads per library was 109,307,746 reads and for theABRF Illumina reference RNA libraries the mean number of reads per library was257,451,483 reads.
Rat toxicogenomics sample preparation and RNA-Seq. Library preparation forrat toxicogenomics study samples was performed at a single laboratory withsequencing runs on Illumina HiScanSQ and HiSeq 2000 instruments as describedin the companion rat toxicogenomics manuscript14. A subset of data, measuredwith the HiScanSQ, was analysed here. Rats in the MET, 3ME and NAP samplesets were treated orally with methimazole, 3-methylcholanthrene, andbetanapthoflavone, and compared with the same set of control rats. Rats in the THIand NIT sample sets were treated by injection with thioacetamide andN-nitrosodimethylamine. RNA samples from treated rat replicates were spikedwith ERCC Mix 1 (per treatment type n¼ 3). We retained the match control (CTL)samples that were spiked with ERCC Mix 2; for the MET, 3ME and NAPexperiments, there were n¼ 3 CTL samples and for the THI and NIT experiments
ARTICLE NATURE COMMUNICATIONS | DOI: 10.1038/ncomms6125
8 NATURE COMMUNICATIONS | 5:5125 | DOI: 10.1038/ncomms6125 | www.nature.com/naturecommunications
& 2014 Macmillan Publishers Limited. All rights reserved.

the three CTL samples with the highest RIN numbers were used from a set of fiveCTL samples. For the five rat toxicogenomics experiments (21 samples), the meannumber of total reads per library was 40,281,946 reads.
Bioinformatic analysis of RNA-Seq experiments. Rat toxicogenomics sampledata were mapped at the National Center for Toxicological Research against ratand ERCC reference sequences using Tophat27. Sequence reads from the SEQCinterlaboratory study were aligned to human (hg19) and ERCC referencesequences. SEQC study Illumina platform data were mapped with Burrows-Wheeler Aligner (BWA)28 and gene level counts corresponding to human andERCC nucleic acid features were quantified using reference annotations for theERCC controls and hg19 (NCBI RefSeq, Release 52). SEQC study Life Technologiesplatform data were mapped with LifeScope (Life Technologies, Foster City, CA,USA) and reference annotations from UCSC and NIST. Life Technologies platformdata were also mapped with the Subread aligner25 and summarized using thefeatureCounts programme26. ABRF Illumina data used in this analysis weremapped with the STAR aligner using the hg19 genome assembly, and the Gencodev12 annotation was used for read counting with the Rmake pipeline (http://physiology.med.cornell.edu/faculty/mason/lab/r-make/). Count data from theseexperiments were used in the erccdashboard analysis. The default normalizationfor all RNA-Seq experiment sample replicates was 75th percentile normalization ofcount data.
Reference RNA microarray analysis. In the SEQC study, there were threemicroarray experiments. Two experiments used Illumina Bead Arrays (Lab 13and 14). For Lab 13 and 14, triplicate arrays were prepared for each referenceRNA sample. Microarray signal intensity data were not background-corrected ornormalized using the Illumina software. The unnormalized data were processedto keep only the results in all sample replicates (n¼ 6) that had probe detectionP-values that were p0.05. In erccdashboard analysis, the replicates in these arrayexperiments were normalized using the 75th percentile intensity for each replicatearray. At Lab 15, custom Agilent 1 M microarrays (n¼ 4 per sample) with avariance stabilizing normalization29 were used in erccdashboard analysis. For theAgilent arrays, probe sequence-specific signals were modelled using establishedmethods, saturation effects detrended and outlier probes downweighted30–32.
Gene expression data analysis with the erccdashboard. The erccdashboardsoftware package was developed in the R statistical computing language33 and thepackage is freely available from GitHub (https://github.com/usnistgov/erccdashboard) and Bioconductor34. The erccdashboard package documentationincludes a user guide to describe how to use the software for analysis of geneexpression data.
A negative binomial generalized linear model was fit to counts for individualERCC controls from each replicate of the treatment and control samples toestimate the bias in the empirical ERCC ratios (rm). These individual ERCC rm
estimates and standard errors were used to produce an overall weighted mean rm
estimate with a weighted standard error estimate. The rm estimate must be appliedas a correction factor to ERCC data before further analysis.
For RNA-Seq experiments, differential expression testing of ERCCs andendogenous genes was performed with QuasiSeq35, using a negative binomialdispersion trend estimated from edgeR36,37, to generate P-values for all endogenousand ERCC features. For microarray experiments, limma38 was used for differentialexpression testing. ROC curves and AUC statistics were produced using the ROCRpackage39. To construct the ROC curves, the 1:1 subpool P-values were thetrue-negative group for each differential ratio ROC curve.
Estimation of LODR requires the following parameters: fold change, fold;probability, prob; and P-value threshold, pthresh. An LODR estimate is defined asthe minimum count above which a transcript with an absolute log fold change,|log(fold)|, has at least a prob*100% chance of obtaining a q-value of FDR or less.The choice of pthresh is based on specification of an acceptable FDR, typically thismay be FDR¼ 0.05, but for samples with higher or lower populations ofdifferentially expressed genes one can be more or less conservative in this choice. Inour analysis, FDR¼ 0.1 was used to compare all rat data sets and FDR¼ 0.01 wasused for all human reference RNA data sets. For each P-value obtained fromdifferential expression testing of the population of transcripts a q-value (estimatedFDR) is computed. The maximum P-value that has a corresponding q-value lessthan or equal to FDR is defined as pthresh.
LODR estimates for each of the differential ERCC ratios were made usinglocfit40 regression trends (including a pointwise 80% prediction interval) of therelationship between abundance (log10(average count)) and strength of differentialexpression (log10(P-value)). For a given fold (ratio), the LODR is the average countwhere the upper bound of ratio prediction interval intersects with a chosen pthresh.This method of estimating LODR is annotated with coloured arrows in Fig. 4. Foreach LODR estimate, 90% confidence intervals were obtained via bootstrapping(residuals from the corresponding locfit curve were repeatedly resampled toestimate LODR).
For evaluating ratio measurement variability for the pair of samples in anexperiment, ratios of ERCC control signals for the samples were examined withrespect to the average of the sample ERCC control signals. MA plots of these data
were annotated to indicate ERCC ratio measurements above and below the LODRestimates for each ratio. Violin plots of the density distribution of ERCC controlratio s.d.’s (with the upper 10th percentile trimmed) are used to evaluate ratiomeasurement variability for multiple experiments.
All diagnostic plots provided by the erccdashboard tool were generated basedon tools available in the ggplot2 (ref. 41) and gridExtra42 R packages.
Mapped read QC analysis. Mapped read QC metrics were produced for LifeTechnologies data from Lab 7 to 9. The percentage of rRNA mapped in all UHRRLibraries (1–5) technical replicates (all lanes and flow cells) at Lab 7-9 wereextracted from LifeScope mapping filter reports that result from sample alignmentto a reference file of filter reference sequences. A subset of UHRR Library 1-5 bamfiles that were each downsampled to approximately one million read pairs using thedownSampleSam function in Picard43 were analysed using the RNASeQC analysistool9 to assess duplicate read rates and coverage bias across transcripts.
Data access. Sequence data used in this analysis are from the SEQC manu-scripts14,17 and the ABRF study manuscript18. The full SEQC project data set hasbeen deposited in GEO and is accessible by the code GSE47792 and the full ABRFstudy data set is accessible by the code GSE46876. Expression measure tablesderived from the RNA-Seq and microarray data are available (SupplementaryData 1) so that the analysis presented here may be reproduced in R with theerccdashboard package.
References1. Baker, S. C. et al. The External RNA Controls Consortium: a progress report.
Nat. Methods 2, 731–734 (2005).2. NIST SRM 2374 Certificate of Analysis, https://www-s.nist.gov/srmors/
certificates/2374.pdf (2013).3. Salit, M. Standards in gene expression microarray experiments. Methods
Enzymol. 411, 63–78 (2006).4. Lippa, K. A., Duewer, D. L., Salit, M. L., Game, L. & Causton, H. C. Exploring
the use of internal and external controls for assessing microarray technicalperformance. BMC Res. Notes 3, 349 (2010).
5. McCall, M. N. & Irizarry, R. A. Consolidated strategy for the analysis ofmicroarray spike-in data. Nucleic Acids Res. 36, e108 (2008).
6. Tong, W. et al. Evaluation of external RNA controls for the assessment ofmicroarray performance. Nat. Biotechnol. 24, 1132–1139 (2006).
7. van de Peppel, J. et al. Monitoring global messenger RNA changes in externallycontrolled microarray experiments. EMBO Rep. 4, 387–393 (2003).
8. Adiconis, X. et al. Comparative analysis of RNA sequencing methods fordegraded or low-input samples. Nat. methods 10, 623–629 (2013).
9. DeLuca, D. S. et al. RNA-SeQC: RNA-seq metrics for quality control andprocess optimization. Bioinformatics 28, 1530–1532 (2012).
10. Gertz, J. et al. Transposase mediated construction of RNA-seq libraries.Genome Res. 22, 134–141 (2012).
11. Griffith, M. et al. Alternative expression analysis by RNA sequencing. Nat.Methods 7, 843–847 (2010).
12. Ramskold, D. et al. Full-length mRNA-Seq from single-cell levels of RNA andindividual circulating tumor cells. Nat. Biotechnol. 30, 777–782 (2012).
13. Jiang, L. et al. Synthetic spike-in standards for RNA-seq experiments. GenomeRes. 21, 1543–1551 (2011).
14. Wang, C. et al.The concordance between RNA-seq and microarray datadepends on chemical treatment and transcript abundance. Nat. Biotechnol. 32,926–932 (2014).
15. Shi, L. et al. The microarray quality control (MAQC) project shows inter- andintraplatform reproducibility of gene expression measurements. Nat.Biotechnol. 24, 1151–1161 (2006).
16. Novoradovskaya, N. et al. Universal Reference RNA as a standard formicroarray experiments. BMC Genomics 5, 20 (2004).
17. SEQC/MAQC-III Consortium. A comprehensive assessment of RNA-seqaccuracy, reproducibility and information content by the Sequence QualityControl consortium. Nat. Biotechnol. 32, 903–914 (2014).
18. Li, S. et al.Multi-platform assessment of transcriptome profiling using RNA-seqin the ABRF next-generation sequencing study. Nat. Biotechnol. 32, 915–925(2014).
19. Pine, P. S. et al. Use of diagnostic accuracy as a metric for evaluating laboratoryproficiency with microarray assays using mixed-tissue RNA reference samples.Pharmacogenomics 9, 1753–1763 (2008).
20. Berrar, D. & Flach, P. Caveats and pitfalls of ROC analysis in clinicalmicroarray research (and how to avoid them). Brief Bioinform. 13, 83–97(2012).
21. Dudoit, S., Yang, Y. H., Callow, M. J. & Speed, T. P. Statistical methods foridentifying differentially expressed genes in replicated cDNA microarrayexperiments. Stat. Sin. 12, 111–139 (2002).
22. Shippy, R. et al. Using RNA sample titrations to assess microarray platformperformance and normalization techniques. Nat. Biotechnol. 24, 1123–1131(2006).
NATURE COMMUNICATIONS | DOI: 10.1038/ncomms6125 ARTICLE
NATURE COMMUNICATIONS | 5:5125 | DOI: 10.1038/ncomms6125 | www.nature.com/naturecommunications 9
& 2014 Macmillan Publishers Limited. All rights reserved.

23. Loven, J. et al. Revisiting global gene expression analysis. Cell 151, 476–482(2012).
24. Li, S. et al.Detecting and correcting systematic variation in large-scale RNAsequencing data. Nat. Biotechnol. 32, 888–895 (2014)..
25. Liao, Y., Smyth, G. K. & Shi, W. The Subread aligner: fast, accurate and scalableread mapping by seed-and-vote. Nucleic Acids Res. 41, e108 (2013).
26. Liao, Y., Smyth, G. K. & Shi, W. featureCounts: an efficient general purposeprogram for assigning sequence reads to genomic features. Bioinformatics 30,923–930 (2014).
27. Trapnell, C., Pachter, L. & Salzberg, S. L. TopHat: discovering splice junctionswith RNA-Seq. Bioinformatics 25, 1105–1111 (2009).
28. Li, H. & Durbin, R. Fast and accurate short read alignment with Burrows-Wheeler transform. Bioinformatics 25, 1754–1760 (2009).
29. Huber, W., von Heydebreck, A., Sultmann, H., Poustka, A. & Vingron, M.Variance stabilization applied to microarray data calibration and to thequantification of differential expression. Bioinformatics 18(Suppl 1): S96–104(2002).
30. Fasold, M., Stadler, P. F. & Binder, H. G-stack modulated probe intensities onexpression arrays—sequence corrections and signal calibration. BMCBioinformatics 11 (2010).
31. Hochreiter, S., Clevert, D. A. & Obermayer, K. A new summarization methodfor affymetrix probe level data. Bioinformatics 22, 943–949 (2006).
32. Mueckstein, U., Leparc, G. G., Posekany, A., Hofacker, I. & Kreil, D. P.Hybridization thermodynamics of NimbleGen microarrays. BMCBioinformatics 11, 35 (2010).
33. R: A language and environment for statistical computing. http://www.R-project.org/ (2014).
34. Gentleman, R. C. et al. Bioconductor: open software development forcomputational biology and bioinformatics. Genome Biol. 5, R80 (2004).
35. Lund, S., Nettleton, D., McCarthy, D. & Smyth, G. Detecting differentialexpression in RNA-sequence data using quasi-likelihood with shrunkendispersion estimates. Stat. Appl. Genet. Mol. Biol. 11, Iss. 5, Art. 8 (2012).
36. McCarthy, D. J., Chen, Y. & Smyth, G. K. Differential expression analysis ofmultifactor RNA-Seq experiments with respect to biological variation. NucleicAcids Res. 40, 4288–4297 (2012).
37. Robinson, M. D., McCarthy, D. J. & Smyth, G. K. edgeR: a Bioconductorpackage for differential expression analysis of digital gene expression data.Bioinformatics 26, 139–140 (2010).
38. Smyth, G. in Bioinformatics and Computational Biology Solutions using R andBioconductor (eds Gentleman, R. C., Carey, V. J., Dudoit, S., Irizarry, R. &Huber, W.) 397–420 (Springer, 2005).
39. Sing, T., Sander, O., Beerenwinkel, N. & Lengauer, T. ROCR: Visualizing theperformance of scoring classifiers. R package v. 1.0-4 (2009).
40. Loader, C. locfit: Local regression, likelihood and density estimation. R packagev. 1.5-8 (2012).
41. Wickham, H. ggplot2: Elegant Graphics for Data Analysis (Springer, 2009).42. Auguie, B. gridExtra: functions in Grid graphics. R package version 0.9.1 http://
CRAN.R-project.org/package=gridExtra (2012).
43. Picard. http://picard.sourceforge.net (2014).
AcknowledgementsWe thank David L. Duewer and Jerod Parsons for review of the manuscript, CecelieBoysen for discussion of results and all other members of the SEQC consortium whosupported this work. P.P.Ł., N.S.-P. and D.P.K. acknowledge the support from theVienna Scientific Cluster (VSC), the Vienna Science and Technology Fund (WWTF),Baxter AG, Austrian Research Centres (ARC) Seibersdorf and the Austrian Centre ofBiopharmaceutical Technology (ACBT). J.D. was supported by grant BIO2011–27069from the Spanish Ministry of Economy and Competitiveness (MINECO). L.S. and Y.Yuacknowledge support from China’s National Supercomputing Center in Guangzhou.
Author contributionsS.A.M., S.P.L., P.S.P. and M.S. conceived of the statistical analysis, graphical presentationand software design. S.A.M. and S.P.L. developed and implemented the statistical analysisand software. Y.L., P.P.Ł., W.S. and G.K.S. reviewed and contributed to the statisticalanalysis and software development. N.J., D.P.K., P.P.Ł., C.E.M., R.A.S., L.S., N.S.-P.,W.T., C.W. and J.X. performed sequencing and microarray experiment design, materialsand data acquisition and data management. S.A.M., S.P.L., P.S.P, H.B., D.-A.C., A.C.,J.D., M.F., S.H., H.H., D.P.K., P.P.Ł., S.L., Y.L. S.M.L., J.M., C.E.M., J.S.-L., W.S., G.K.S.,Z.S., J.W., J.X., Z.Y., Y.Y., Y. Yu and M.S. contributed to data analysis and interpretation.S.A.M. and M.S. wrote the paper. All authors provided intellectual input, read andapproved the manuscript. This work includes contributions from, and was reviewed by,the FDA. This work has been approved for publication by this agency, but it does notnecessarily reflect official agency policy. Certain commercial equipment, instruments ormaterials are identified in this paper in order to specify the experimental procedureadequately. Such identification is not intended to imply recommendation or endorse-ment by the National Institute of Standards and Technology (NIST) or the Food andDrug Administration (FDA), nor is it intended to imply that the materials or equipmentidentified are necessarily the best available for the purpose.
Additional informationSupplementary Information accompanies this paper at http://www.nature.com/naturecommunications
Competing financial interests: R.A.S. is an employee of Thermo Fisher Scientific, apublic company that manufactures the RNA spike-in materials (derived from NIST SRM2374 DNA plasmids) that are used in this study. The remaining authors declare nocompeting financial interests.
Reprints and permission information is available online at http://www.nature.com/reprintsandpermissions/
How to cite this article: Munro, S. A. et al. Assessing technical performance indifferential gene expression experiments with external spike-in RNA control ratiomixtures. Nat. Commun. 5:5125 doi: 10.1038/ncomms6125 (2014).
ARTICLE NATURE COMMUNICATIONS | DOI: 10.1038/ncomms6125
10 NATURE COMMUNICATIONS | 5:5125 | DOI: 10.1038/ncomms6125 | www.nature.com/naturecommunications
& 2014 Macmillan Publishers Limited. All rights reserved.