Embed Size (px)
Citation preview
Technological Forecasting & Social Change 77 (2010) 816–822
Contents lists available at ScienceDirect
Technological Forecasting & Social Change
Assessing the broadband gap: From the penetration divide to thequality divide
María Rosalía Vicente a,⁎, Fernando Gil-de-Bernabé b
a Applied Economics, University of Oviedo, Campus del Cristo s/n, Oviedo-Asturias, 33006, Spainb CISCO Systems, Inc., Dawning Centre West Tower, No. 500, Hongbaoshi Road, Shanghai 201103, China
a r t i c l e i n f o
⁎ Corresponding author.E-mail addresses: [email protected] (M.R. Vicent
1 Most recently regulatory agencies such as the Europtrue quality that consumers experience with their broadEuropeanCommission' studywill be carried out along 20such as download speed, ping performance, DNS lookupbetween rural and urban areaswill be also considered (fOfcom has analyzed the current performance of the Uinvolved the installation of hardwaremonitoring equipmbroadband speedswere significantly below the advertiscame into force in December 2008, internet service prospeeds differ from headline speeds. Besides, Ofcom hasbroadband service, and what to do if they are not gettin
0040-1625/$ – see front matter © 2009 Elsevier Inc.doi:10.1016/j.techfore.2009.12.006
a b s t r a c t
Article history:Received 14 August 2009Received in revised form 17 November 2009Accepted 15 December 2009
Only some years ago the analysis of broadband diffusion was focused on who had an Internetconnection and who did not. Now, the relevant questions are: how good is it? How fast? And,how fast is fast? Thus, the broadband gap can no longer be seen as a penetration divide. It isbecoming more and more a quality and capacity divide, and therefore, a divide in the range ofservices people can access and use. By means of the Broadband Quality Score—an index thatcombines three key performance parameters for the quality of a connection (upload anddownload speeds, and latency)—Japan is found to be the only country of the 42 countriesstudied currently prepared to deliver the quality required for next-generation web applicationsover the next 3 to 5 years.
© 2009 Elsevier Inc. All rights reserved.
Keywords:BroadbandQualityInternetSpeedIndex
1. Introduction
Around the world, governments, policy makers and regulators have made increasing the penetration of broadband servicestheir main priority. While ‘getting connected’ is an essential first step, the quality of the connection is becoming more and moreimportant since online applications have advanced beyond basic email and web browsing to more interactive media-rich services,more user-generated content being uploaded and shared, and an increasing amount of high-quality video services becomingavailable (Fig. 1). As Flamm et al. [1] pointed out only ten years ago it made sense to ask who had Internet access and who did not.Now the relevant questions are: how fast is your connection? And how fast is fast?
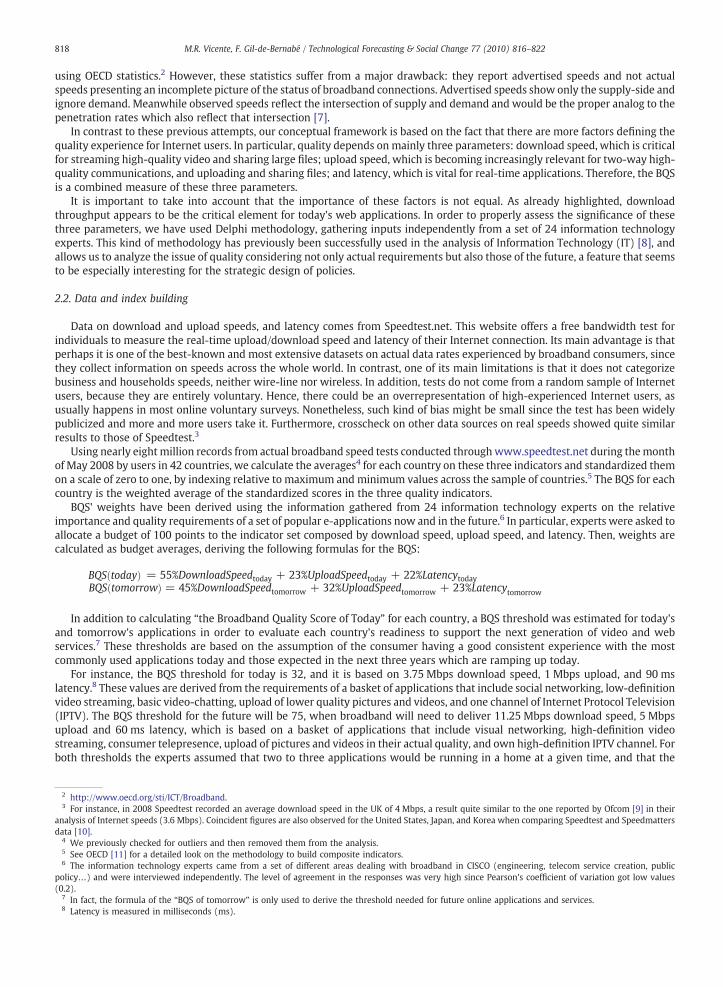
Faster connections, such asfiber-optic broadband that offers speed of 15 Mbps (Mbits per second) and above, give users access to awider range of Internet services than that experienced by users with only 200 kbps (Kbit per second) connections. Nonetheless,several additional factors come into play when examining what determines the quality of experience for users. Thus, broadbandexperience is mainly affected by broadband throughput in both directions, latency, network oversubscription, jitter, and packet loss(Table 1). However, for consumers the only available information about quality is typically the advertised download speed.1
e), [email protected] (F. Gil-de-Bernabé).ean Commission and Ofcom (the latter in the United Kingdom—UK) have taken an active role in clarifying theband connections. Hence, these two organisms have commissioned some studies in this field. In particular, a10 to look at the effective speedof the retail broadband services. Itwillmeasure several performance indicatorstime, and packet loss. Ratios on advertised versus effective speed, effective speeds by operators, and differencesormore information check thewebsite http://ec.europa.eu/information_society/eeurope/i2010/). During 2009K's broadband networks, focusing on the actual download speeds that consumers receive [3]. This researchent in the homes of a representative sample of over 1600 UK broadband users. Results confirmed that actua
ed headline speeds. Ofcom has also elaborated a Code of Practice on Broadband Speeds. Under this code, whichviders are required to tell customers the maximum speed they can expect and must also explain why actuapublished some guides giving advice to consumers on what elements they should consider when choosing ag the expected speed (http://www.ofcom.org.uk).
All rights reserved.
l
l
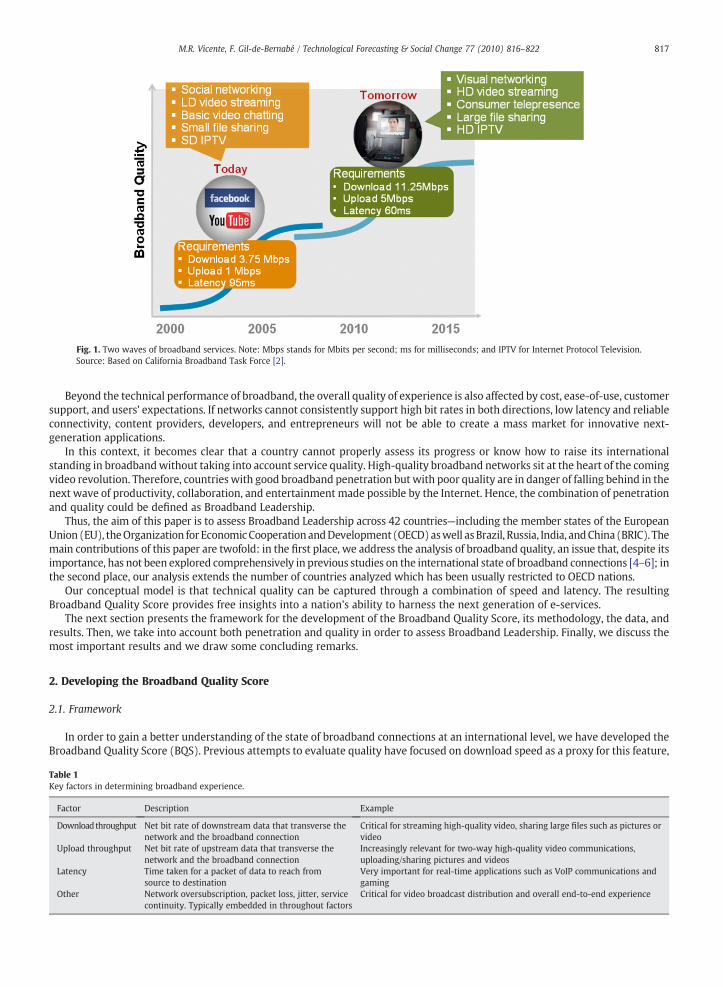
Fig. 1. Two waves of broadband services. Note: Mbps stands for Mbits per second; ms for milliseconds; and IPTV for Internet Protocol Television.Source: Based on California Broadband Task Force [2].
Table 1Key factors in determining broadband experience.
Factor Description Example
Downloadthroughput Net bit rate of downstream data that transverse thenetwork and the broadband connection
Critical for streaming high-quality video, sharing large files such as pictures orvideo
Upload throughput Net bit rate of upstream data that transverse thenetwork and the broadband connection
Increasingly relevant for two-way high-quality video communications,uploading/sharing pictures and videos
Latency Time taken for a packet of data to reach fromsource to destination
Very important for real-time applications such as VoIP communications andgaming
Other Network oversubscription, packet loss, jitter, servicecontinuity. Typically embedded in throughout factors
Critical for video broadcast distribution and overall end-to-end experience
817M.R. Vicente, F. Gil-de-Bernabé / Technological Forecasting & Social Change 77 (2010) 816–822
Beyond the technical performance of broadband, the overall quality of experience is also affected by cost, ease-of-use, customersupport, and users' expectations. If networks cannot consistently support high bit rates in both directions, low latency and reliableconnectivity, content providers, developers, and entrepreneurs will not be able to create a mass market for innovative next-generation applications.
In this context, it becomes clear that a country cannot properly assess its progress or know how to raise its internationalstanding in broadbandwithout taking into account service quality. High-quality broadband networks sit at the heart of the comingvideo revolution. Therefore, countrieswith good broadband penetration but with poor quality are in danger of falling behind in thenext wave of productivity, collaboration, and entertainment made possible by the Internet. Hence, the combination of penetrationand quality could be defined as Broadband Leadership.
Thus, the aim of this paper is to assess Broadband Leadership across 42 countries—including the member states of the EuropeanUnion (EU), theOrganization for EconomicCooperation andDevelopment (OECD)aswell asBrazil, Russia, India, andChina (BRIC). Themain contributions of this paper are twofold: in the first place, we address the analysis of broadband quality, an issue that, despite itsimportance, has not been explored comprehensively in previous studies on the international state of broadband connections [4–6]; inthe second place, our analysis extends the number of countries analyzed which has been usually restricted to OECD nations.
Our conceptual model is that technical quality can be captured through a combination of speed and latency. The resultingBroadband Quality Score provides free insights into a nation's ability to harness the next generation of e-services.
The next section presents the framework for the development of the Broadband Quality Score, its methodology, the data, andresults. Then, we take into account both penetration and quality in order to assess Broadband Leadership. Finally, we discuss themost important results and we draw some concluding remarks.
2. Developing the Broadband Quality Score
2.1. Framework
In order to gain a better understanding of the state of broadband connections at an international level, we have developed theBroadband Quality Score (BQS). Previous attempts to evaluate quality have focused on download speed as a proxy for this feature,
818 M.R. Vicente, F. Gil-de-Bernabé / Technological Forecasting & Social Change 77 (2010) 816–822
using OECD statistics.2 However, these statistics suffer from a major drawback: they report advertised speeds and not actualspeeds presenting an incomplete picture of the status of broadband connections. Advertised speeds show only the supply-side andignore demand. Meanwhile observed speeds reflect the intersection of supply and demand and would be the proper analog to thepenetration rates which also reflect that intersection [7].
In contrast to these previous attempts, our conceptual framework is based on the fact that there are more factors defining thequality experience for Internet users. In particular, quality depends on mainly three parameters: download speed, which is criticalfor streaming high-quality video and sharing large files; upload speed, which is becoming increasingly relevant for two-way high-quality communications, and uploading and sharing files; and latency, which is vital for real-time applications. Therefore, the BQSis a combined measure of these three parameters.
It is important to take into account that the importance of these factors is not equal. As already highlighted, downloadthroughput appears to be the critical element for today's web applications. In order to properly assess the significance of thesethree parameters, we have used Delphi methodology, gathering inputs independently from a set of 24 information technologyexperts. This kind of methodology has previously been successfully used in the analysis of Information Technology (IT) [8], andallows us to analyze the issue of quality considering not only actual requirements but also those of the future, a feature that seemsto be especially interesting for the strategic design of policies.
2.2. Data and index building
Data on download and upload speeds, and latency comes from Speedtest.net. This website offers a free bandwidth test forindividuals to measure the real-time upload/download speed and latency of their Internet connection. Its main advantage is thatperhaps it is one of the best-known and most extensive datasets on actual data rates experienced by broadband consumers, sincethey collect information on speeds across the whole world. In contrast, one of its main limitations is that it does not categorizebusiness and households speeds, neither wire-line nor wireless. In addition, tests do not come from a random sample of Internetusers, because they are entirely voluntary. Hence, there could be an overrepresentation of high-experienced Internet users, asusually happens in most online voluntary surveys. Nonetheless, such kind of bias might be small since the test has been widelypublicized and more and more users take it. Furthermore, crosscheck on other data sources on real speeds showed quite similarresults to those of Speedtest.3
Using nearly eight million records from actual broadband speed tests conducted throughwww.speedtest.net during themonthof May 2008 by users in 42 countries, we calculate the averages4 for each country on these three indicators and standardized themon a scale of zero to one, by indexing relative to maximum and minimum values across the sample of countries.5 The BQS for eachcountry is the weighted average of the standardized scores in the three quality indicators.
BQS' weights have been derived using the information gathered from 24 information technology experts on the relativeimportance and quality requirements of a set of popular e-applications now and in the future.6 In particular, experts were asked toallocate a budget of 100 points to the indicator set composed by download speed, upload speed, and latency. Then, weights arecalculated as budget averages, deriving the following formulas for the BQS:
2 http3 For
analysisdata [10
4 We5 See6 The
policy…(0.2).
7 In f8 Late
BQSðtodayÞ = 55%DownloadSpeedtoday + 23%UploadSpeedtoday + 22%LatencytodayBQSðtomorrowÞ = 45%DownloadSpeedtomorrow + 32%UploadSpeedtomorrow + 23%Latencytomorrow
In addition to calculating “the Broadband Quality Score of Today” for each country, a BQS threshold was estimated for today'sand tomorrow's applications in order to evaluate each country's readiness to support the next generation of video and webservices.7 These thresholds are based on the assumption of the consumer having a good consistent experience with the mostcommonly used applications today and those expected in the next three years which are ramping up today.
For instance, the BQS threshold for today is 32, and it is based on 3.75 Mbps download speed, 1 Mbps upload, and 90 mslatency.8 These values are derived from the requirements of a basket of applications that include social networking, low-definitionvideo streaming, basic video-chatting, upload of lower quality pictures and videos, and one channel of Internet Protocol Television(IPTV). The BQS threshold for the future will be 75, when broadband will need to deliver 11.25 Mbps download speed, 5 Mbpsupload and 60 ms latency, which is based on a basket of applications that include visual networking, high-definition videostreaming, consumer telepresence, upload of pictures and videos in their actual quality, and own high-definition IPTV channel. Forboth thresholds the experts assumed that two to three applications would be running in a home at a given time, and that the
://www.oecd.org/sti/ICT/Broadband.instance, in 2008 Speedtest recorded an average download speed in the UK of 4 Mbps, a result quite similar to the one reported by Ofcom [9] in theirof Internet speeds (3.6 Mbps). Coincident figures are also observed for the United States, Japan, and Korea when comparing Speedtest and Speedmatters].previously checked for outliers and then removed them from the analysis.OECD [11] for a detailed look on the methodology to build composite indicators.information technology experts came from a set of different areas dealing with broadband in CISCO (engineering, telecom service creation, public) and were interviewed independently. The level of agreement in the responses was very high since Pearson's coefficient of variation got low values
act, the formula of the “BQS of tomorrow” is only used to derive the threshold needed for future online applications and services.ncy is measured in milliseconds (ms).
819M.R. Vicente, F. Gil-de-Bernabé / Technological Forecasting & Social Change 77 (2010) 816–822
service experience would be on average good enough that consumers would be compelled to use these services regularly. Theseare conservative estimates.
2.3. Results
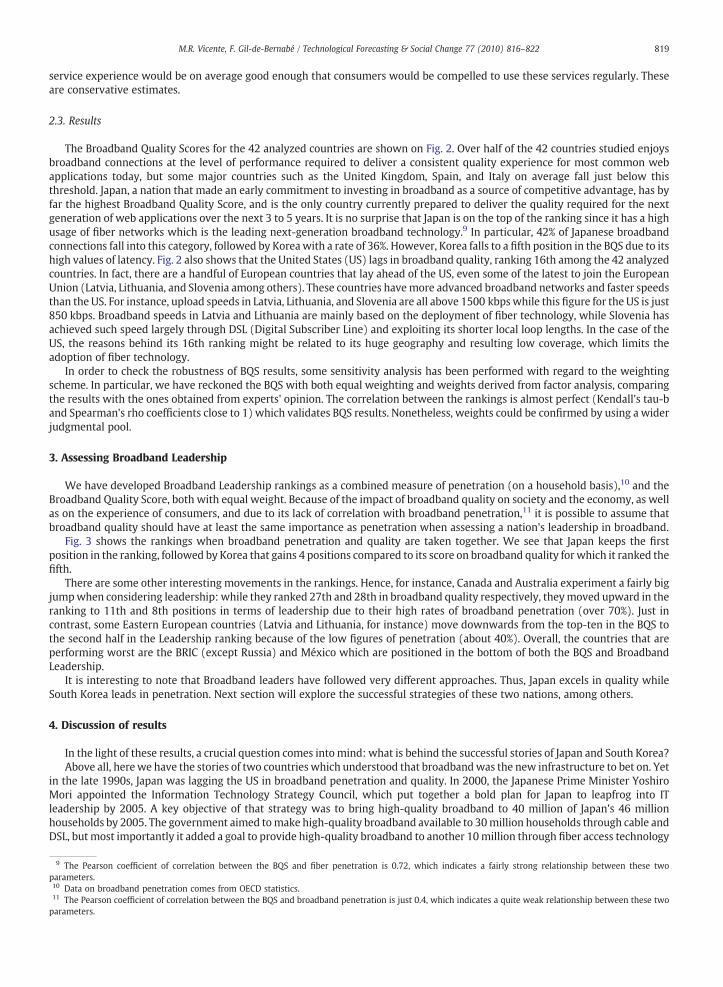
The Broadband Quality Scores for the 42 analyzed countries are shown on Fig. 2. Over half of the 42 countries studied enjoysbroadband connections at the level of performance required to deliver a consistent quality experience for most common webapplications today, but some major countries such as the United Kingdom, Spain, and Italy on average fall just below thisthreshold. Japan, a nation that made an early commitment to investing in broadband as a source of competitive advantage, has byfar the highest Broadband Quality Score, and is the only country currently prepared to deliver the quality required for the nextgeneration of web applications over the next 3 to 5 years. It is no surprise that Japan is on the top of the ranking since it has a highusage of fiber networks which is the leading next-generation broadband technology.9 In particular, 42% of Japanese broadbandconnections fall into this category, followed by Koreawith a rate of 36%. However, Korea falls to a fifth position in the BQS due to itshigh values of latency. Fig. 2 also shows that the United States (US) lags in broadband quality, ranking 16th among the 42 analyzedcountries. In fact, there are a handful of European countries that lay ahead of the US, even some of the latest to join the EuropeanUnion (Latvia, Lithuania, and Slovenia among others). These countries havemore advanced broadband networks and faster speedsthan the US. For instance, upload speeds in Latvia, Lithuania, and Slovenia are all above 1500 kbpswhile this figure for the US is just850 kbps. Broadband speeds in Latvia and Lithuania are mainly based on the deployment of fiber technology, while Slovenia hasachieved such speed largely through DSL (Digital Subscriber Line) and exploiting its shorter local loop lengths. In the case of theUS, the reasons behind its 16th ranking might be related to its huge geography and resulting low coverage, which limits theadoption of fiber technology.
In order to check the robustness of BQS results, some sensitivity analysis has been performed with regard to the weightingscheme. In particular, we have reckoned the BQS with both equal weighting and weights derived from factor analysis, comparingthe results with the ones obtained from experts' opinion. The correlation between the rankings is almost perfect (Kendall's tau-band Spearman's rho coefficients close to 1) which validates BQS results. Nonetheless, weights could be confirmed by using a widerjudgmental pool.
3. Assessing Broadband Leadership
We have developed Broadband Leadership rankings as a combined measure of penetration (on a household basis),10 and theBroadband Quality Score, both with equal weight. Because of the impact of broadband quality on society and the economy, as wellas on the experience of consumers, and due to its lack of correlation with broadband penetration,11 it is possible to assume thatbroadband quality should have at least the same importance as penetration when assessing a nation's leadership in broadband.
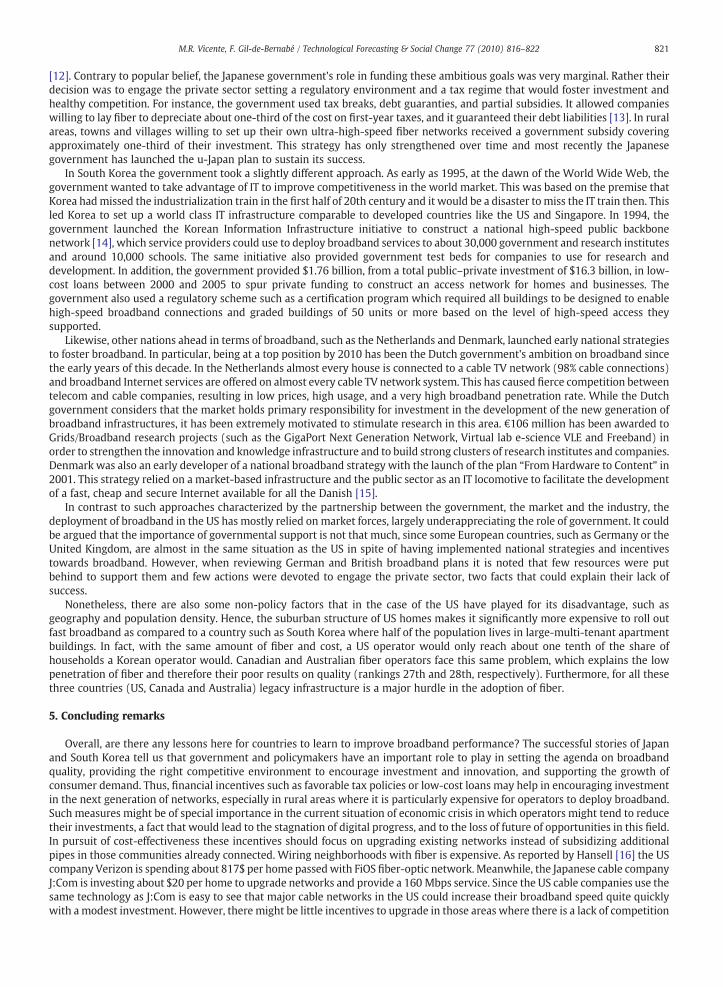
Fig. 3 shows the rankings when broadband penetration and quality are taken together. We see that Japan keeps the firstposition in the ranking, followed by Korea that gains 4 positions compared to its score on broadband quality for which it ranked thefifth.
There are some other interesting movements in the rankings. Hence, for instance, Canada and Australia experiment a fairly bigjumpwhen considering leadership: while they ranked 27th and 28th in broadband quality respectively, theymoved upward in theranking to 11th and 8th positions in terms of leadership due to their high rates of broadband penetration (over 70%). Just incontrast, some Eastern European countries (Latvia and Lithuania, for instance) move downwards from the top-ten in the BQS tothe second half in the Leadership ranking because of the low figures of penetration (about 40%). Overall, the countries that areperforming worst are the BRIC (except Russia) and México which are positioned in the bottom of both the BQS and BroadbandLeadership.
It is interesting to note that Broadband leaders have followed very different approaches. Thus, Japan excels in quality whileSouth Korea leads in penetration. Next section will explore the successful strategies of these two nations, among others.
4. Discussion of results
In the light of these results, a crucial question comes into mind: what is behind the successful stories of Japan and South Korea?Above all, herewe have the stories of two countries which understood that broadbandwas the new infrastructure to bet on. Yet
in the late 1990s, Japan was lagging the US in broadband penetration and quality. In 2000, the Japanese Prime Minister YoshiroMori appointed the Information Technology Strategy Council, which put together a bold plan for Japan to leapfrog into ITleadership by 2005. A key objective of that strategy was to bring high-quality broadband to 40 million of Japan's 46 millionhouseholds by 2005. The government aimed tomake high-quality broadband available to 30million households through cable andDSL, but most importantly it added a goal to provide high-quality broadband to another 10million through fiber access technology
9 The Pearson coefficient of correlation between the BQS and fiber penetration is 0.72, which indicates a fairly strong relationship between these twoparameters.10 Data on broadband penetration comes from OECD statistics.11 The Pearson coefficient of correlation between the BQS and broadband penetration is just 0.4, which indicates a quite weak relationship between these twoparameters.
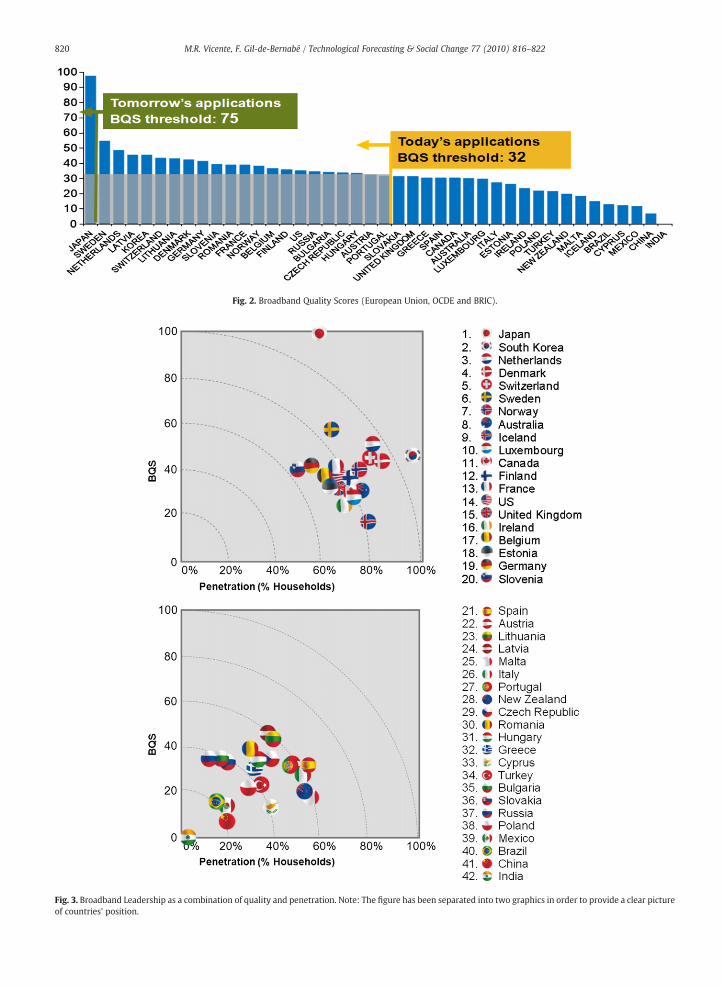
Fig. 2. Broadband Quality Scores (European Union, OCDE and BRIC).
Fig. 3. Broadband Leadership as a combination of quality and penetration. Note: The figure has been separated into two graphics in order to provide a clear pictureof countries' position.
820 M.R. Vicente, F. Gil-de-Bernabé / Technological Forecasting & Social Change 77 (2010) 816–822
821M.R. Vicente, F. Gil-de-Bernabé / Technological Forecasting & Social Change 77 (2010) 816–822
[12]. Contrary to popular belief, the Japanese government's role in funding these ambitious goals was very marginal. Rather theirdecision was to engage the private sector setting a regulatory environment and a tax regime that would foster investment andhealthy competition. For instance, the government used tax breaks, debt guaranties, and partial subsidies. It allowed companieswilling to lay fiber to depreciate about one-third of the cost on first-year taxes, and it guaranteed their debt liabilities [13]. In ruralareas, towns and villages willing to set up their own ultra-high-speed fiber networks received a government subsidy coveringapproximately one-third of their investment. This strategy has only strengthened over time and most recently the Japanesegovernment has launched the u-Japan plan to sustain its success.
In South Korea the government took a slightly different approach. As early as 1995, at the dawn of the World Wide Web, thegovernment wanted to take advantage of IT to improve competitiveness in the world market. This was based on the premise thatKorea hadmissed the industrialization train in the first half of 20th century and it would be a disaster to miss the IT train then. Thisled Korea to set up a world class IT infrastructure comparable to developed countries like the US and Singapore. In 1994, thegovernment launched the Korean Information Infrastructure initiative to construct a national high-speed public backbonenetwork [14], which service providers could use to deploy broadband services to about 30,000 government and research institutesand around 10,000 schools. The same initiative also provided government test beds for companies to use for research anddevelopment. In addition, the government provided $1.76 billion, from a total public–private investment of $16.3 billion, in low-cost loans between 2000 and 2005 to spur private funding to construct an access network for homes and businesses. Thegovernment also used a regulatory scheme such as a certification program which required all buildings to be designed to enablehigh-speed broadband connections and graded buildings of 50 units or more based on the level of high-speed access theysupported.
Likewise, other nations ahead in terms of broadband, such as the Netherlands and Denmark, launched early national strategiesto foster broadband. In particular, being at a top position by 2010 has been the Dutch government's ambition on broadband sincethe early years of this decade. In the Netherlands almost every house is connected to a cable TV network (98% cable connections)and broadband Internet services are offered on almost every cable TV network system. This has caused fierce competition betweentelecom and cable companies, resulting in low prices, high usage, and a very high broadband penetration rate. While the Dutchgovernment considers that the market holds primary responsibility for investment in the development of the new generation ofbroadband infrastructures, it has been extremely motivated to stimulate research in this area. €106 million has been awarded toGrids/Broadband research projects (such as the GigaPort Next Generation Network, Virtual lab e-science VLE and Freeband) inorder to strengthen the innovation and knowledge infrastructure and to build strong clusters of research institutes and companies.Denmark was also an early developer of a national broadband strategy with the launch of the plan “From Hardware to Content” in2001. This strategy relied on a market-based infrastructure and the public sector as an IT locomotive to facilitate the developmentof a fast, cheap and secure Internet available for all the Danish [15].
In contrast to such approaches characterized by the partnership between the government, the market and the industry, thedeployment of broadband in the US has mostly relied on market forces, largely underappreciating the role of government. It couldbe argued that the importance of governmental support is not that much, since some European countries, such as Germany or theUnited Kingdom, are almost in the same situation as the US in spite of having implemented national strategies and incentivestowards broadband. However, when reviewing German and British broadband plans it is noted that few resources were putbehind to support them and few actions were devoted to engage the private sector, two facts that could explain their lack ofsuccess.
Nonetheless, there are also some non-policy factors that in the case of the US have played for its disadvantage, such asgeography and population density. Hence, the suburban structure of US homes makes it significantly more expensive to roll outfast broadband as compared to a country such as South Korea where half of the population lives in large-multi-tenant apartmentbuildings. In fact, with the same amount of fiber and cost, a US operator would only reach about one tenth of the share ofhouseholds a Korean operator would. Canadian and Australian fiber operators face this same problem, which explains the lowpenetration of fiber and therefore their poor results on quality (rankings 27th and 28th, respectively). Furthermore, for all thesethree countries (US, Canada and Australia) legacy infrastructure is a major hurdle in the adoption of fiber.
5. Concluding remarks
Overall, are there any lessons here for countries to learn to improve broadband performance? The successful stories of Japanand South Korea tell us that government and policymakers have an important role to play in setting the agenda on broadbandquality, providing the right competitive environment to encourage investment and innovation, and supporting the growth ofconsumer demand. Thus, financial incentives such as favorable tax policies or low-cost loans may help in encouraging investmentin the next generation of networks, especially in rural areas where it is particularly expensive for operators to deploy broadband.Such measures might be of special importance in the current situation of economic crisis in which operators might tend to reducetheir investments, a fact that would lead to the stagnation of digital progress, and to the loss of future of opportunities in this field.In pursuit of cost-effectiveness these incentives should focus on upgrading existing networks instead of subsidizing additionalpipes in those communities already connected. Wiring neighborhoods with fiber is expensive. As reported by Hansell [16] the UScompany Verizon is spending about 817$ per home passedwith FiOS fiber-optic network. Meanwhile, the Japanese cable companyJ:Com is investing about $20 per home to upgrade networks and provide a 160 Mbps service. Since the US cable companies use thesame technology as J:Com is easy to see that major cable networks in the US could increase their broadband speed quite quicklywith a modest investment. However, there might be little incentives to upgrade in those areas where there is a lack of competition
822 M.R. Vicente, F. Gil-de-Bernabé / Technological Forecasting & Social Change 77 (2010) 816–822
in the cable market. That is another point for regulators to address: stimulating a competitive environment. Moreover, it isparticularly important to reinforce the policies towards investing in wireless technologies. The future of broadband will beincreasingly shaped bywireless networks. Hence, it is the right moment for countries to do a real beat on this technology. Finally, itis vital to keep on tracking the quality of broadband connections, not only in a certain moment of time but its evolution. The use oftools like the Broadband Quality and the Broadband Leadership Scores would allow us to identify those countries that areconsistently performing well (badly) over time, and analyze the reasons of their broadband success/failure.
Acknowledgements
The authors would like to acknowledge the valuable contribution to carry out this research project of the following four MBAstudents from the Oxford Said Business School: Prashanth Angani, Taegyue Kim, Utkarsh Guleri and, Yukihiro Misawa. We alsothank the suggestions of two anonymous reviewers and the editor to improve this paper.
References
[1] K. Flamm, A. Friedlander, J. Horrigan, W. Lehr, Measuring Broadband: Improving Communications Policymaking through Better Data Collection, Pew Internet& American Life Project, Washington D.C, 2007.
[2] California Broadband Task Force, The state of connectivity, Building innovation through broadband, California Broadband Task Force, 2008, http://www.calink.ca.gov.
[3] Ofcom, UK Broadband Speeds in 2009, Consumers' Experience of Fixed-line Broadband Performance, Ofcom, London, 2009.[4] D.K. Correa, The road to next-generation broadband, IEEE Internet Comput. 11 (6) (2007) 68–71.[5] G.S. Ford, T.M. Koutsky, L.J. Spiwak, The Broadband Performance Index: a policy-relevant method of comparing broadband adoption among countries,
Phoenix Center Policy Paper Series 29, 2007, http://www.phoenix-center.org.[6] R.D. Atkinson, D.K. Correa, J.A. Hedlund, Explaining International Broadband Leadership, The Information Technology and Innovation Foundation,
Washington D.C, 2008.[7] S. Wallsten, Understanding international broadband comparisons, Technology Policy Institute Working Papers, 2008, http://www.techpolicyinstitute.org.[8] L. Press, G. Burkhart, W. Foster, S. Goodman, J. Woodard, An Internet diffusion framework, Commun. ACM 41 (10) (1998) 21–26.[9] Ofcom, UK Broadband Speeds in 2008, Ofcom, London, 2008.[10] SpeedMatters.org, A Report on Internet Speeds in all 50 States, Communications Workers of America, Washington D.C, 2009.[11] OECD, Handbook on Constructing Composite Indicators, Methodology and User Guide, OECD, Paris, 2008.[12] T. Ebihara, Understanding the Japanese Broadband Miracle, ITIF Policy Forum, The Information Technology and Innovation Foundation, Washington D.C,
2007.[13] T. Ida, Broadband Economics: Lesson from Japan, Routledge, London, UK, 2009.[14] M. Fransman, Global Broadband Battles, Stanford University Press, California, CA, 2006.[15] Ministry of Information Technology and Research, From Hardware to Content: Strategy for Fast, Cheap and Secure Internet to all of Denmark, Ministry of
Information Technology and Research, Copenhagen, 2001.[16] S. Hansell, World's Fastest Broadband at $20 per home, The New York Times, April 3 (2009).
María Rosalía Vicente is an assistant professor of Applied Economics at the University of Oviedo (Spain). She is specialized in the analysis of ICT diffusion and thedigital divide. María has published some papers in scientific journals (Applied Economic Letters, Economics Letters, Information & Management, Regional and SectoralEconomic Studies) and has presented her work in more than twenty international conferences.
Fernando Gil-de-Bernabé holds an M.B.A. and a Management of Technology certificate (MOT) from the Haas School of Business and the College of Engineering atU.C. Berkeley (California, USA). He previously graduated (BEE, MS) from the School of Telecommunications Engineering at the Polytechnic University of Cataloniain Spain. Nowadays, Fernando is the Managing Director for the Worldwide Strategy Practice in the Internet Business Solutions Group for CISCO Systems.