Embed Size (px)
Citation preview
Assessing the ecological footprint of a large metropolitan water supplier
– lessons for water management and planning towards sustainability –
Sven Lundie University of New South Wales
Manfred Lenzen University of SydneyBransgrove, Charet and Sack Sydney Water Corporation
ContentsContents
Motivation for applying the Ecological Motivation for applying the Ecological Footprint ConceptFootprint Concept
Ecological Footprint methodEcological Footprint method Calculation procedure of SWCs’ Calculation procedure of SWCs’
Ecological FootprintEcological Footprint ResultsResults Structural Path AnalysisStructural Path Analysis Conclusion Conclusion
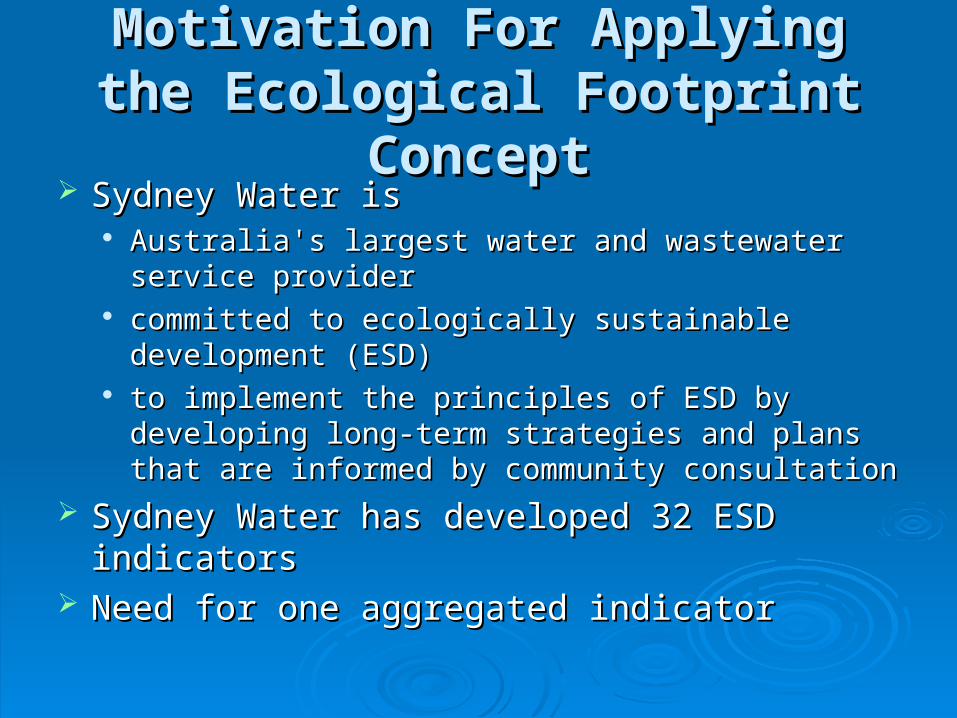
Motivation For Applying the Motivation For Applying the Ecological Footprint ConceptEcological Footprint Concept
Sydney Water is Sydney Water is Australia's largest water and wastewater service Australia's largest water and wastewater service
provider provider committed to ecologically sustainable development committed to ecologically sustainable development
(ESD)(ESD) to implement the principles of ESD by developing to implement the principles of ESD by developing
long-term strategies and plans that are informed by long-term strategies and plans that are informed by community consultationcommunity consultation
Sydney Water has developed 32 ESD indicatorsSydney Water has developed 32 ESD indicators Need for one aggregated indicator Need for one aggregated indicator
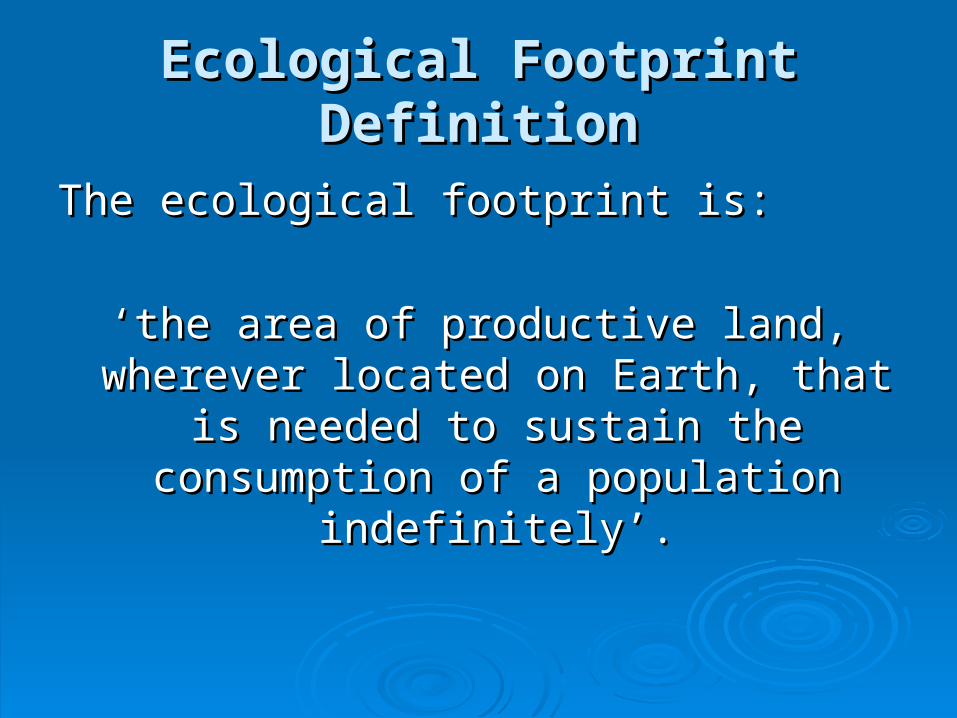
Ecological Footprint DefinitionEcological Footprint Definition
The ecological footprint is:The ecological footprint is:
‘‘the area of productive land, wherever the area of productive land, wherever located on Earth, that is needed to sustain located on Earth, that is needed to sustain
the consumption of a population the consumption of a population indefinitely’.indefinitely’.
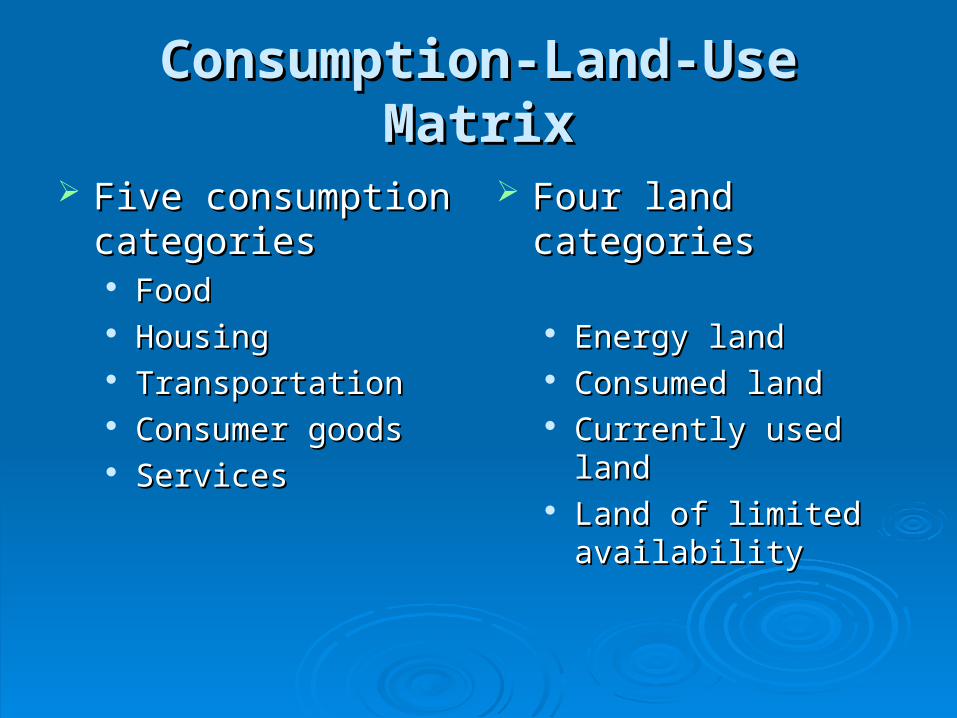
Consumption-Land-Use MatrixConsumption-Land-Use Matrix
Five consumption Five consumption categoriescategories FoodFood HousingHousing TransportationTransportation Consumer goodsConsumer goods ServicesServices
Four land categoriesFour land categories
Energy landEnergy land Consumed landConsumed land Currently used land Currently used land Land of limited Land of limited
availabilityavailability
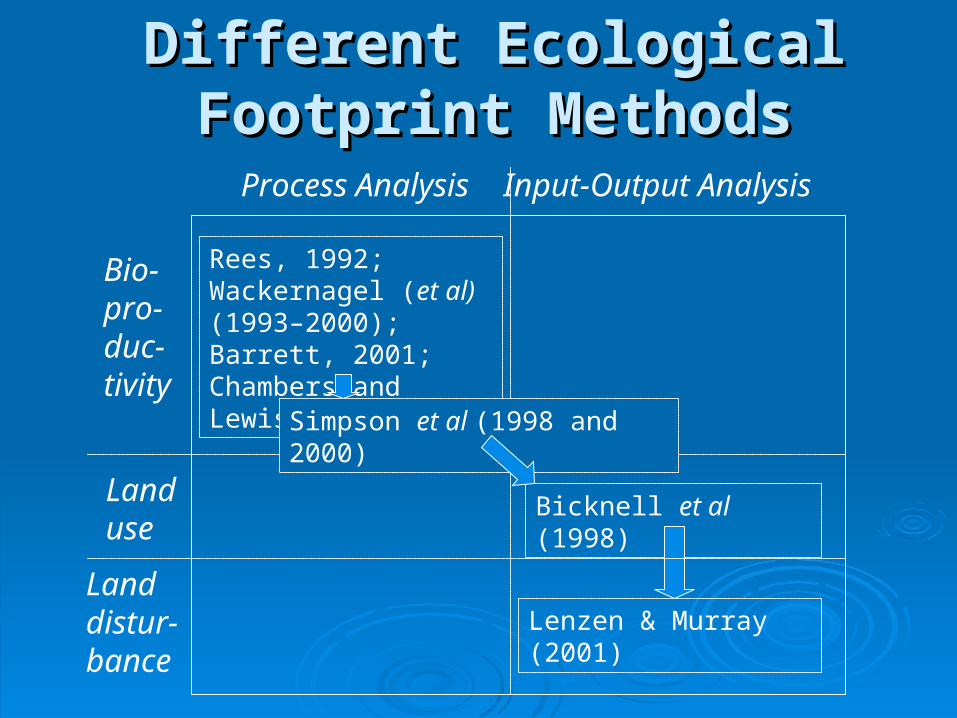
Different Ecological Footprint Different Ecological Footprint MethodsMethods
Process Analysis Input-Output Analysis
Land use
Land distur-bance
Rees, 1992; Wackernagel (et al) (1993–2000); Barrett, 2001; Chambers and Lewis, 2001
Simpson et al (1998 and 2000)
Bicknell et al (1998)
Lenzen & Murray (2001)
Bio-pro-duc-tivity
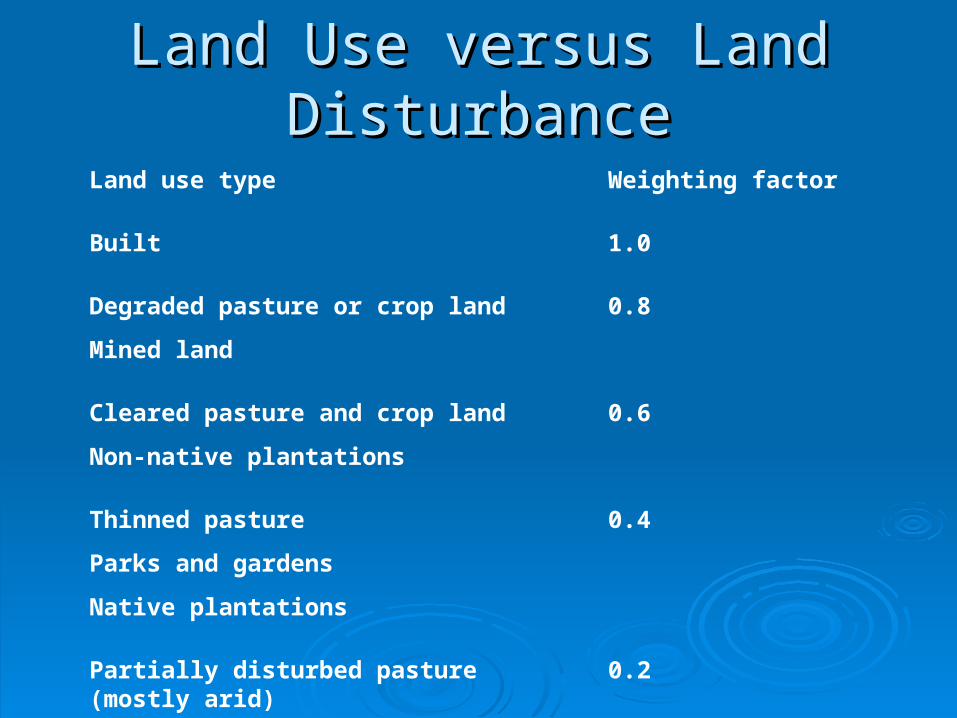
Land Use versus Land Land Use versus Land DisturbanceDisturbance
Land use type
Built
Degraded pasture or crop land
Mined land
Cleared pasture and crop land
Non-native plantations
Thinned pasture
Parks and gardens
Native plantations
Partially disturbed pasture (mostly arid)
Weighting factor
1.0
0.8
0.6
0.4
0.2
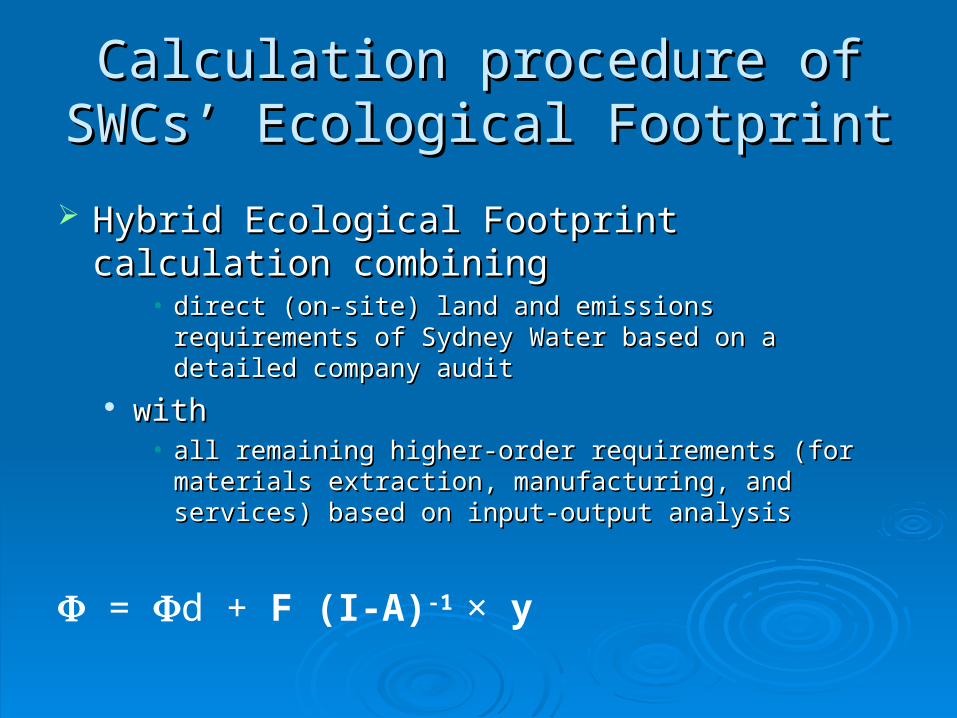
Calculation procedure of SWCs’ Calculation procedure of SWCs’ Ecological FootprintEcological Footprint
Hybrid Ecological Footprint calculation Hybrid Ecological Footprint calculation combiningcombining
• direct (on-site) land and emissions requirements of Sydney direct (on-site) land and emissions requirements of Sydney Water based on a detailed company auditWater based on a detailed company audit
with with • all remaining higher-order requirements (for materials all remaining higher-order requirements (for materials
extraction, manufacturing, and services) based on input-extraction, manufacturing, and services) based on input-output analysisoutput analysis
= d + F (I-A)-1 × y
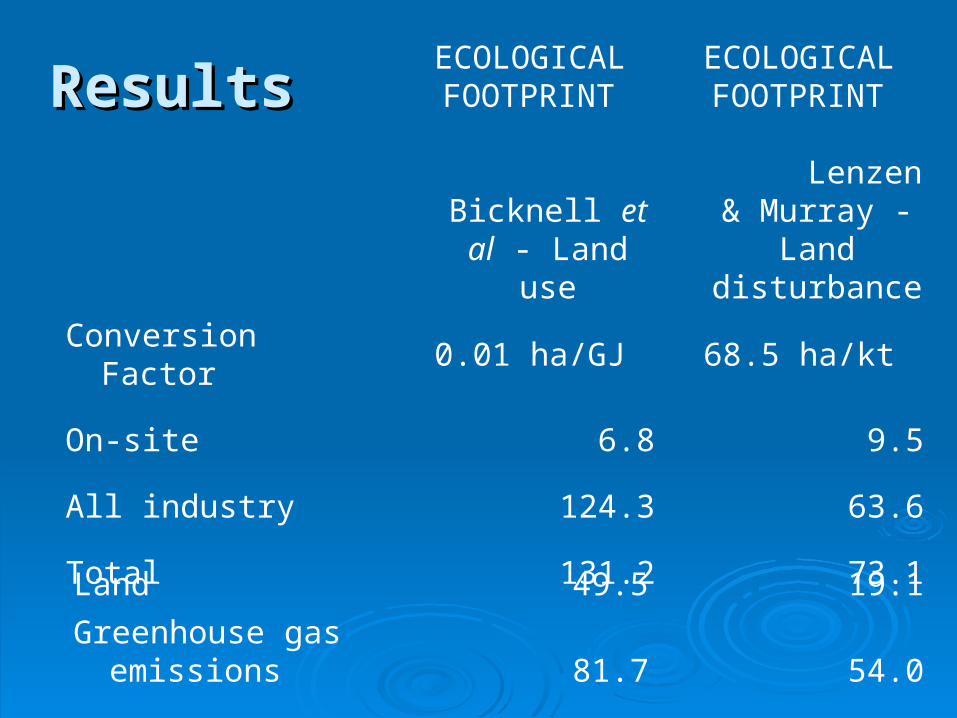
ResultsResults ECOLOGICAL FOOTPRINT Bicknell et al -
Land use
ECOLOGICAL FOOTPRINT
Lenzen &
Murray - Land disturbance
Conversion Factor 0.01 ha/GJ 68.5 ha/kt
On-site 6.8 9.5
All industry 124.3 63.6
Total 131.2 73.1
Land 49.5 19.1
Greenhouse gas emissions 81.7 54.0
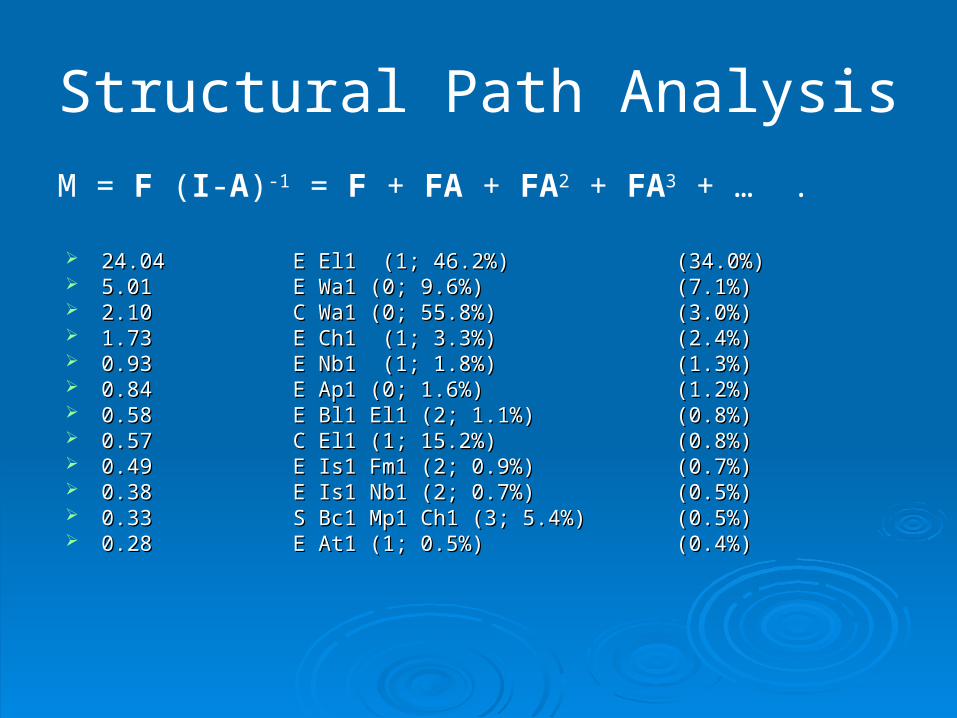
Structural Path Analysis
M = F (I-A)-1 = F + FA + FA2 + FA3 + … .
24.0424.04 E El1 (1; 46.2%)E El1 (1; 46.2%) (34.0%)(34.0%) 5.015.01 E Wa1 (0; 9.6%)E Wa1 (0; 9.6%) (7.1%)(7.1%) 2.102.10 C Wa1 (0; 55.8%)C Wa1 (0; 55.8%) (3.0%)(3.0%) 1.731.73 E Ch1 (1; 3.3%)E Ch1 (1; 3.3%) (2.4%)(2.4%) 0.930.93 E Nb1 (1; 1.8%)E Nb1 (1; 1.8%) (1.3%)(1.3%) 0.840.84 E Ap1 (0; 1.6%)E Ap1 (0; 1.6%) (1.2%)(1.2%) 0.580.58 E Bl1 El1 (2; 1.1%)E Bl1 El1 (2; 1.1%) (0.8%)(0.8%) 0.570.57 C El1 (1; 15.2%)C El1 (1; 15.2%) (0.8%)(0.8%) 0.490.49 E Is1 Fm1 (2; 0.9%)E Is1 Fm1 (2; 0.9%) (0.7%)(0.7%) 0.380.38 E Is1 Nb1 (2; 0.7%)E Is1 Nb1 (2; 0.7%) (0.5%)(0.5%) 0.330.33 S Bc1 Mp1 Ch1 (3; 5.4%)S Bc1 Mp1 Ch1 (3; 5.4%) (0.5%)(0.5%) 0.280.28 E At1 (1; 0.5%)E At1 (1; 0.5%) (0.4%)(0.4%)
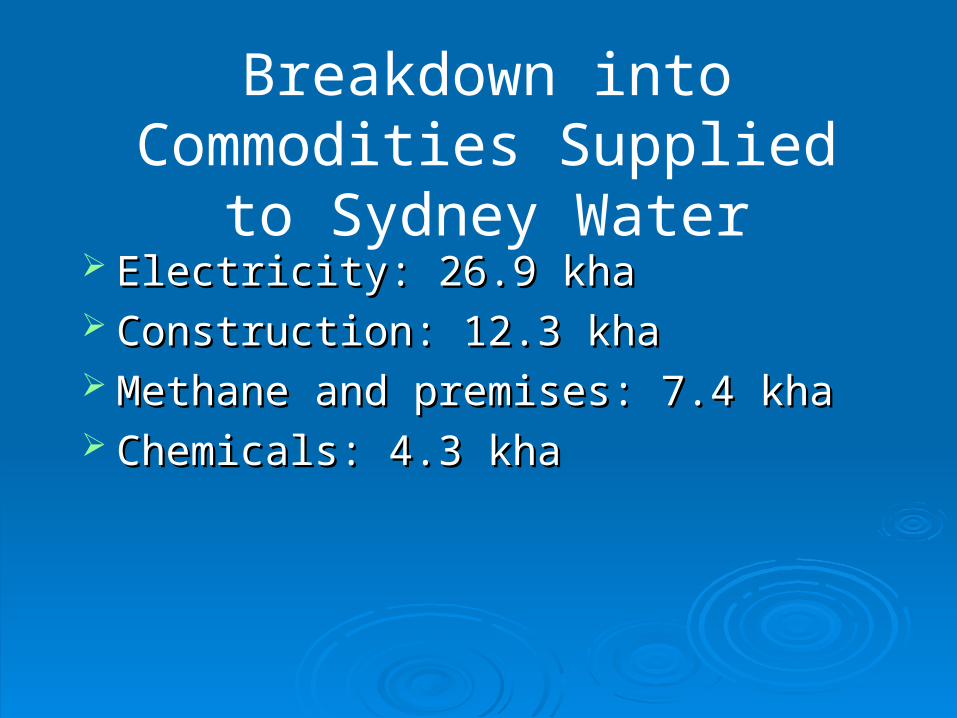
Breakdown into Commodities Supplied to Sydney Water
Electricity: 26.9 khaElectricity: 26.9 kha Construction: 12.3 khaConstruction: 12.3 kha Methane and premises: 7.4 khaMethane and premises: 7.4 kha Chemicals: 4.3 khaChemicals: 4.3 kha
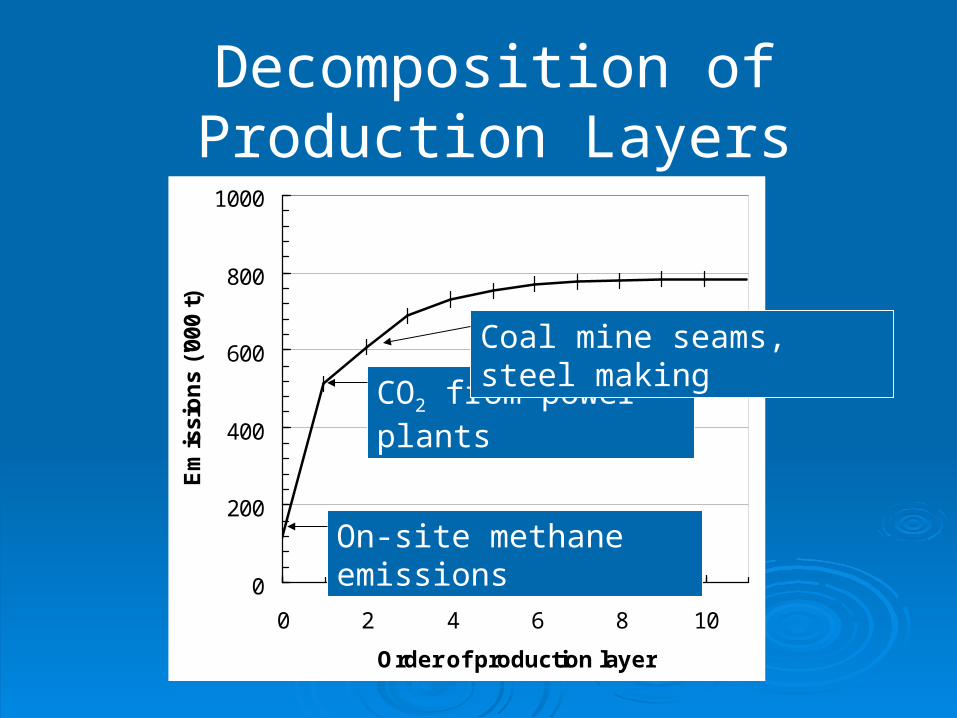
Decomposition of Production Layers
0
200
400
600
800
1000
0 2 4 6 8 10
Order of production layer
Em
issi
on
s ('0
00 t
)
On-site methane emissions
CO2 from power plants
Coal mine seams, steel making
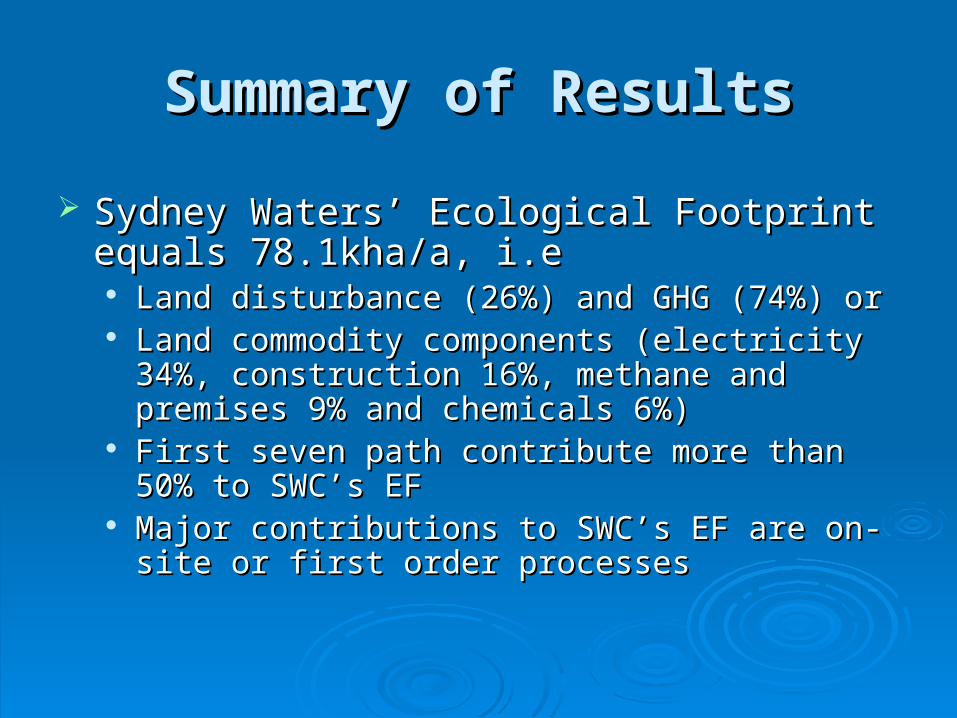
Summary of ResultsSummary of Results
Sydney Waters’ Ecological Footprint equals Sydney Waters’ Ecological Footprint equals 78.1kha/a, i.e78.1kha/a, i.e Land disturbance (26%) and GHG (74%) orLand disturbance (26%) and GHG (74%) or Land commodity components (electricity 34%, Land commodity components (electricity 34%,
construction 16%, methane and premises 9% and construction 16%, methane and premises 9% and chemicals 6%)chemicals 6%)
First seven path contribute more than 50% to SWC’s First seven path contribute more than 50% to SWC’s EFEF
Major contributions to SWC’s EF are on-site Major contributions to SWC’s EF are on-site or first or first order processesorder processes
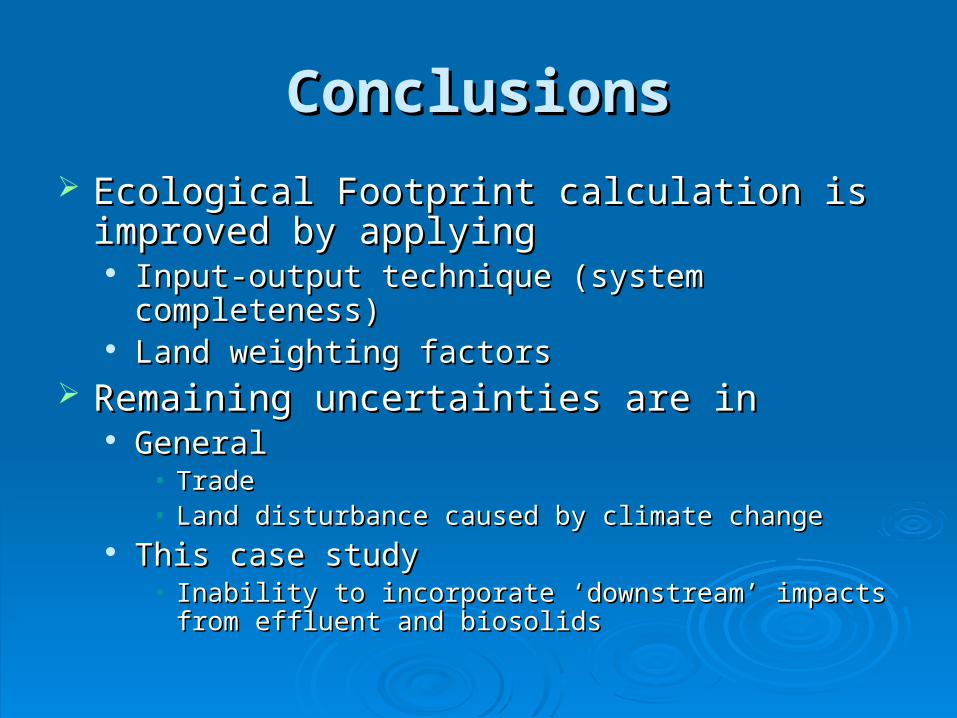
ConclusionsConclusions
Ecological Footprint calculation is improved by Ecological Footprint calculation is improved by applying applying Input-output technique (system completeness)Input-output technique (system completeness) Land weighting factorsLand weighting factors
Remaining uncertainties are inRemaining uncertainties are in GeneralGeneral
• TradeTrade• Land disturbance caused by climate changeLand disturbance caused by climate change
This case studyThis case study• Inability to incorporate ‘downstream’ impacts from effluent Inability to incorporate ‘downstream’ impacts from effluent
and biosolidsand biosolids
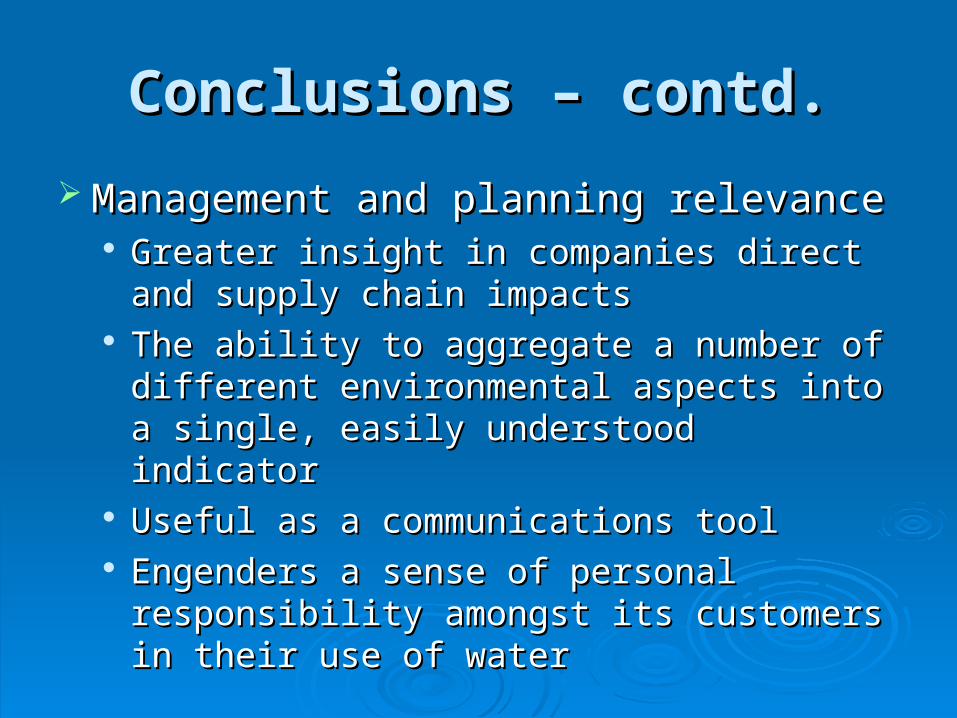
Conclusions – contd.Conclusions – contd.
Management and planning relevanceManagement and planning relevance Greater insight in companies direct and Greater insight in companies direct and
supply chain impactssupply chain impacts The ability to aggregate a number of different The ability to aggregate a number of different
environmental aspects into a single, easily environmental aspects into a single, easily understood indicatorunderstood indicator
Useful as a communications tool Useful as a communications tool EEngenders a sense of personal responsibility ngenders a sense of personal responsibility
amongst its customers in their use of wateramongst its customers in their use of water

Thank you!