Embed Size (px)
Citation preview
International Journal of Performability Engineering, Vol. ?, No. ?, Month Year
©RAMS Consultants
Printed in India
_____________________________________________________________________________________________
*Corresponding author’s email: [email protected]
Assessing the Effect of WiMAX System Parameter Settings on MAC-level Local DoS Vulnerability
Juan Denga, Richard R. Brooksa*, and James Martinb
aDept. of Electrical and Computer Engineering, Clemson University, Clemson, SC, US bDept. of Computer Science, Clemson University, Clemson, SC, US
(Received on month date, year)
Abstract–The research community has established that WiMAX networks suffer from Denial
of Service (DoS) vulnerabilities. In this paper, we analyze how WiMAX system parameter
settings increase or decrease DoS vulnerabilities of WiMAX networks. The behavior of the
WiMAX MAC level protocol is sensitive to the settings of core system parameters. Unlike
traditional network-based DoS attacks, attacks resulting from parameter misconfiguration are
difficult for network operators to detect. We focus on bandwidth contention resolution aspects
of the WiMAX MAC protocol. Simulations are performed using the ns-2 simulator. Analysis
of Variance (ANOVA) techniques on the resulting simulation data identify which bandwidth
contention resolution parameter combinations are crucial for configuring WiMAX to be less
vulnerable to DoS attacks.
Keywords: WiMAX, bandwidth contention resolution, Denial of Service (DoS), Analysis of
Variance (ANOVA), network simulator ns-2.
1. Introduction
The IEEE 802.16 standards define the physical and MAC layers for a broadband wireless
access system that supports both fixed and mobile stations. The acronym WiMAX, Worldwide
Interoperability for Microwave Access, was coined by the WiMAX Forum and when
accompanied by a release profile describes specific operating modes of the system. WiMAX
networks deploy IEEE 802.16 standards. For the sake of simplicity and conforming to the
common usage, we use the terms WiMAX and IEEE 802.16 interchangeably in this paper.
Abundant research [1-13] has analyzed security vulnerabilities in IEEE 802.16 standards.
Solutions have been proposed to fix many of them. Denial of Service (DoS) attacks on IEEE
802.16 standards have been discussed in [2, 9-13].
In this paper, we analyze DoS attacks that exploit WiMAX system parameter settings
systems. This paper is the first to consider the relationship between DoS attacks and WiMAX
system parameters settings. Our work is motivated by three facts:
1. Current literature analyzes DoS attacks that take advantage of message flows and
message designs, such as in [2, 9, 11, 12]. Literature has ignored system parameter
settings that can enable DoS attacks.
2. WiMAX has many parameters to configure. Our work provides guidelines for
evaluating these parameters.
Juan Deng, Richard R. Brooks, and James Martin2
3. Unlike other WiMAX DoS attacks, DoS attacks that exploit parameter settings are
easy to implement, and likely to be adopted by attackers. Moreover, these attacks are
difficult to detect, because attackers behave exactly like normal users, except for
using different parameter values. In this paper we concentrate on parameters concerning bandwidth contention resolution1 in
IEEE802.16 standards, since bandwidth contention could naturally be exploited by malicious
clients to deny other clients access to the network. We consider how these parameter settings
affect the ability of DoS attackers to monopolize network bandwidth. Simulations are run
using the ns-2 network simulator. Reasons for using network simulations include:
1. First, most existing WiMAX implementations are proprietary. Access to those
implementations is quite limited, typically requiring non-disclosure agreements.
2. Second, current implementations are usually hard wired and not easily modified.
We use analysis of variance (ANOVA) [14] of our simulation results to find which
parameters or parameter combinations are most important for configuring WiMAX to be less
vulnerable to DoS attacks. ANOVA analysis is used to find 1st, 2nd and 3rd order parameter
effects on network performance. First order effects quantify how much individual parameters
determine system vulnerability to attack. Second (third) order effects quantify the additional
influence of combinations of 2 (3) parameters. We use a factorial experimental design [15] to
determine the set of simulations to run. This allows us to isolate the influence and quantify the
role of both individual parameters and combinations of parameters in making WiMAX
systems vulnerable to DoS attacks. This same approach can be applied to other networking
technologies as well.
The rest of the paper is organized as follows. Section 2 discusses related work. This is
followed by our problem definition in Section 3. In section 4, we describe the bandwidth
contention resolution, associated parameters, and how these parameters can be exploited by
DoS attackers. We describe our experiment design in detail in section 5. Section 6 presents
ANOVA data analysis results. Our conclusions and suggestions for future research are
presented in section 7.
2. Related Work
In this work, we consider wireless network performability as network resilience to intentional
disturbance. Other works on wireless performability have considered mainly communications
reliability [16,17] where disturbances are modeled as stochastic processes. Resilience to
intentional attack is a more stringent metric. It is also not unrealistic, since DoS attacks are
becoming increasingly common.
IEEE 802.16 standards are subject to many DoS attacks [2, 9-13]. Research in [13]
examines whether known DoS attacks (e.g. replay attack, MAC address spoofing,
deauthentication etc.) from IEEE 802.11 are applicable to IEEE 802.16. [13] also examines
DoS vulnerabilities that are unique to IEEE 802.16 standards. These vulnerabilities include
unprotected management messages. For example, one potential DoS attack exploits RNG-RSP
message [2, 10, 13]. RNG-RSP stands for ranging response. It is sent by a Base Station (BS)
1The bandwidth contention resolution is defined in section 6.3.8 in IEEE 802.16 standards.
We consider subscriber stations that are associated with Best Effort (BE) service in the
network contend bandwidth for traffic transmission after they have joined the network.
3 title of short communication
in response to an RNG-REQ (ranging request) message from a Subscriber Station (SS). The
BS includes in the message transmission power, SS uplink and downlink channel change,
MAC re-initialization, etc. The message is neither authenticated nor encrypted. The SS
accepts any RNG-RSP message that is correctly formatted as coming from the BS and acts
accordingly. DoS attackers can fake RNG-RSP messages, telling the SS to transmit at
minimum power [2]. The transmission power is then low enough that messages from the SS
barely reach the BS, causing the SS to request ranging again and again, until it quits. Or an
attacker can fool the SS to increase its power level to maximum to drain the SS battery [2].
DoS attackers can also change SS downlink channels to the wrong frequency to force the SS
to re-scan and find the correct frequency. If the downlink channel is maliciously modified
continually, the SS keeps re-scanning until it quits [10]. A DoS attack exploiting the RNG-
RSP message is simulated in the ns-2 network simulator in [10]. The simulation showed that
the DoS attack “is devastating to the overall service levels of the WiMAX network” [10].
Other known IEEE 802.16 specific DoS vulnerabilities include sending a large number of
authentication requests [4] and the “scrambling attack” described in [11].
This paper is novel in studying the role of the bandwidth contention resolution parameters
in making networks vulnerable to DoS events. We also find that the well-established
experimental design and ANOVA analysis tools used here are too frequently used in the
network performance analysis community [18, 21]. This paper also provides a useful example
of how to perform empirical analysis of network protocol robustness to system abuse.
3. Problem Definition
To date, no one has examined how WiMAX system parameter settings can make the network
more vulnerable to DoS attacks. Attackers may masquerade as normal subscribers but ignore
the parameter values they are assigned. They can choose parameter values that degrade the
QoS of other SSs. These attacks can be designed to appear random, making them hard to
detect by network administrators. They also do not result in sudden, drastic performance
degradation for specific SSs, making them difficult to differentiate from network noise. We
explain in detail in section 4 how parameters concerning the bandwidth contention resolution
in WiMAX network can be exploited by attackers. It is worth noting that, since WiMAX
bandwidth contention resolution’s upstream bandwidth allocation uses the same mechanism as
DOCSIS-based cable access systems, the method used in this paper could also be applied to
DOCSIS networks. It is also worth noting that this work studies implicitly how SS faults that
cause them to vary from the correct parameter settings will affect performance. This is
important for WiMAX system robustness.
There are many parameters DoS attackers can exploit. Our goal is to:
1. compare the effect of setting different values for a single parameter,
2. learn which parameter(s) are dominant,
3. compare the effect of important parameter interactions, and,
4. learn which parameter interactions are dominant.
In this paper, we use techniques from experimental design to steer our data collection [15]
and ANOVA[14] techniques to quantify the importance of specific parameters in enabling
DoS attacks. By determining which parameters are most important for robust network
operation, we provide important information to network researchers as to where to concentrate
attention for stopping future DoS events. Please note that we do not provide advice on the
values to set for those parameters, rather our study determines the set of parameters whose
Juan Deng, Richard R. Brooks, and James Martin4
settings most influence system vulnerability to DoS. This work could be extended to
determine a response surface that would provide that information. In Section 7 we discuss
how this can be done.
4. Exploiting Parameters in Bandwidth Contention Resolution in IEEE 802.16
In this section, we explain the bandwidth contention resolution portion of the IEEE 802.16
standards family (section 6.3.8) and how the resolution can be exploited by DoS attackers.
Background
A simple WiMAX network contains a single BS and multiple SSs. It uses a Point to Multi-
Point (PMP) topology. The downlink direction is from the BS to SSs, while uplink is from
SSs to BS. WiMAX networks can use either Time Division Duplex (TDD), in which downlink
and uplink take turns to use the medium, or Frequency Division Duplex (FDD) where
downlink and uplink use different frequencies. In this paper, unless specified, we consider
WiMAX networks with TDD.
The BS is the only station transmitting in the downlink direction. Downlink is generally
broadcast. SSs listen to downlink traffic and capture the packets intended for them. The uplink
traffic is from SSs to BS. The medium is shared by all SSs in the network, and coordinated by
the BS. BS broadcasts UL-MAP messages periodically to inform SSs of uplink bandwidth
allocations in the near future. IEEE 802.16 also allows SSs to contend for uplink bandwidth.
UL-MAP messages include Request Information Elements (Request IEs), which defines
transmission opportunities for SSs to send their request to contend for bandwidth. Any SS
wishing to join the contention process can grab the transmission opportunities and send its
request. After receiving the request from a SS, the BS decides whether or not to grant
bandwidth and how much bandwidth to grant to the SS. Since many SSs are using the same
request transmission opportunities, it is likely that more than one SS is sending at the same,
hence create a collision. The bandwidth contention resolution defined in IEEE 802.16
standards copes with such issues.
Bandwidth Contention Resolution
Bandwidth contention resolution uses truncated binary exponential backoff. Each SS in the
network maintains an internal variable window with initial value bw_backoff_start and
maximum value bw_backoff_stop. These values are specified in UCD messages, which are
broadcast periodically by the BS to all SSs within the network. When an SS has data to send
and wants to enter the bandwidth contention process, it sets its window to the
bw_backoff_start defined in the UCD messages. The SS then randomly selects a number r
within range [0, 2 1window ]. This number r indicates the number of contention request
transmission opportunities that the SS shall defer before transmitting its bandwidth request.
These transmission opportunities are defined in Request IEs in UL-MAP messages. After
transmitting its contention request, the SS waits for the grant from the BS to transmit data. If
the grant is seen in the sub-sequential UL-MAP message, then the SS sends its data in the slots
allocated to it. If the grant is not seen within a time period, then the contention request is
considered transmission lost and the SS shall now increase its window by 1, as long as it is
less than the bw_backoff_stop. The SS shall randomly select a number within the new range
and repeat the above contention process. The retry process continues until the maximum
3 title of short communication
number of retries bw_maximum_retry has been reached or the window reaches
bw_backoff_stop. At this point, the SS should discard the data.
Parameters for Bandwidth Contention Resolution
The parameter bw_backoff_start is the initial window size. Its value should be determined
based on the average number of SSs in the network. SSs in the network obtain this value from
the UCD message broadcasted by the BS. If bw_backoff_start is too small, collisions are
likely to occur, and force the window value to increase. Larger window values indicate longer
request time for the SS. Request time is the time from SS starting contention process to SS
receiving request transmission grant. Consider the extreme situation where all SSs in the
network use bw_backoff_start =0 and all SSs sending a packet simultaneously. Collisions are
bound to occur. It will take some time for SSs to time out and increase their window large
enough to avoid collisions. If window is too large, collisions are less likely to occur but the
request time for the SS will be large, reducing the throughput of the network. DoS attackers
may choose not to use the bw_backoff_start specified by the BS and instead use a self-defined
value, which we refer to as dos_backoff_start in this paper. When dos_backoff_start is smaller
than bw_backoff_start, the DoS attackers are more likely to send requests before other SSs
and win earlier bandwidth request transmission opportunities. This is exacerbated for SSs if
either piggyback or concatenation is allowed.
bw_request_retry is the maximum number of bandwidth contention retries before SSs drop
packets. Like bw_backoff_start, bw_request_retry is determined by the BS and broadcast in
the UCD messages to every SS in the network. If bw_request_retry is too small, SSs discard
packets more frequently. If bw_request_retry is large, the probability packets get dropped will
be small, however, average request time will be long and throughput will decrease. DoS
attackers can choose their own dos_request_retry value. They do not care about packet loss,
but wish to consume as much bandwidth as much as possible. Therefore, a small
dos_request_retry value benefits DoS attackers.
Other parameters exist that affect DoS attacks on bandwidth contention resolution. One
obvious parameter is the number of DoS attackers in the network, which is denoted in this
paper as number_of_attackers. This parameter is beyond the control of the network
administrator. We also consider also another parameter, the duration of a frame,
frame_duration. A frame is dependent on the physical layer specification. Longer
frame_duration values increase the request time and lower the network throughput. DoS
attackers have no control over this parameter.
5. Simulation Design
We simulate DoS attacks where attackers attempt to exploit the bandwidth contention
resolution mechanism. In our WiMAX simulations legitimate SSs use the bw_backoff_start
and bw_request_retry values broadcasted by the BS, while attackers choose their own values
(denoted as dos_backoff_start and dos_request_retry). We also vary the number_of_attackers
in the network as well as frame_duration. Our simulations analyze the influence of these six
parameters on DoS attacks. Simulation code is available at
http://www.clemson.edu/~rrb/WiMax/WiMaxDDoSTest.tgz.
Our simulations use the ns-2 network simulator [19] with the ns-2 IEEE 802.16 module
from the National Institute of Standards and Technology (NIST) [20]. The simulation uses the
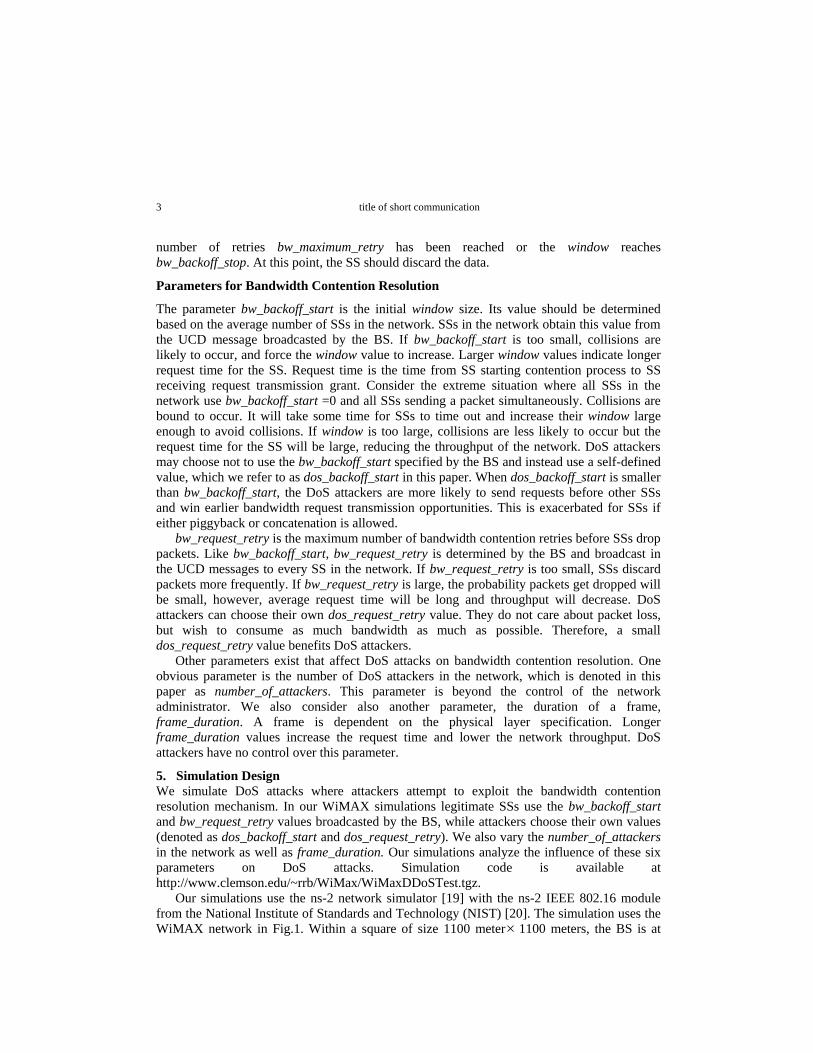
WiMAX network in Fig.1. Within a square of size 1100 meter 1100 meters, the BS is at
Juan Deng, Richard R. Brooks, and James Martin6
position (550, 550). It is set to cover 500 meters. The bandwidth of the network is 10e+6HZ.
A number of SSs, represented by in Fig. 1,are placed on the circle with a radius of 150
meters centered at the BS. DoS attackers represented by ■ are placed on the same circle. The
number of DoS attackers and SSs combined is fixed to 100. The BS is wired connected to a
sink node placed at (50,50) in the topology. The link between the BS and the sink node has
bandwidth 1000Mbps and delay 1ms. This large bandwidth avoids packet dropping on this
link that may disturb our simulation. Each user (SS or DoS attacker) has a UDP agent with a
Constant Bit Rate (CBR) traffic generator. The packet size of the UDP agents is set to 1500
bytes. Each CBR traffic generator sends a packet of size 1492 bytes to the sink node every 0.5
second. The traffic start time of the traffic generators follows a uniform distribution U(20.005,
21) to allow enough time for each user to perform the network entry process. The uniform
distribution is used to avoid collisions caused by all users sending packet at the same time. All
traffic generators stop at 120 seconds. SSs and attackers are all equally distant from the BS
and configured with the same traffic is to eliminate unfairness and allow us to study the
parameters of interest.
radius=150
udpudp
CBRCBR
sink node
(550,550)
(50,50)
BS
CBR
CBR
CBR
CBR
CBRudp
udp
udp
udp
udp
0 1100
1100
0
Fig.1: Network Topology
For each of the six parameters we chose 3 different values: low, medium and high. Table 1
shows the values used. In the NIST WiMAX module the value for frame_duration can be
chosen from: 0.0025, 0.004, 0.005, 0.008, 0.01, 0.0125, or 0.02. We use 0.004, 0.01 and 0.02.
We used a factorial experiment design to collect data [15]. There are a total of 36=729
parameter combinations. For each combination we ran 7 replications2, which gives a total of
729x7=5103 simulations. For each replication, we record the average traffic throughput and
average traffic loss rate of all SSs, sincewe measuer the DoS vulnerability by either the traffic
throughput or the traffic loss. By testing all combinations of factors, the factorial experimental
design provides robust results. Since the tests for any one factor contain values collected for
all settings of the other factors, this allows us to be certain that the results obtained are due to
2 We use the operating characteristic curve in selecting the number of replications. Please refer to [15] for details. For
our experiments, 7 replications generate the type II error of less than 0.01 and the power of more than 0.99.
3 title of short communication
that factor’s settings. In essence, the influence of the other factors is treated as noise [15].
6. Simulation Results and Analysis
Our goal is to find the parameters or parameter combinations that most affect DoS
vulnerability. We use ANOVA to accomplish this. ANOVA is used extensively for statistical
analysis in psychology, biology, medicine, economics, industrial design and other areas [18,
21]. In this section, we give a brief introduction to ANOVA, followed by a statistical ANOVA
analysis of our experimental results.
One-way ANOVA [15]
If response y is affected by a single parameter A, one-way ANOVA compares the effects of
different treatments (levels) of parameter A on response y. Table 2 shows typical data from a
single-parameter experiment. A has m treatments. For each treatment, n replicates of
experiment are performed.ijy is the observed response of replication j under treatment i. It is
described with a statistical model:
1,2 ; 1,2ij i ijy i m j n (1)
where is the true mean of all treatments, i is a parameter unique to the ith treatment called
the ith treatment effect, and ij is a random error component. This uses the random effects
model to describe the data, which makes no assumptions about how to model the influence of
parameter Aon y. We found this generalized regression approach more appropriate for this
study than the more widely used linear regression which posits that factor influence can be
described by linear functions [15]. All error components ij are independent and follow a
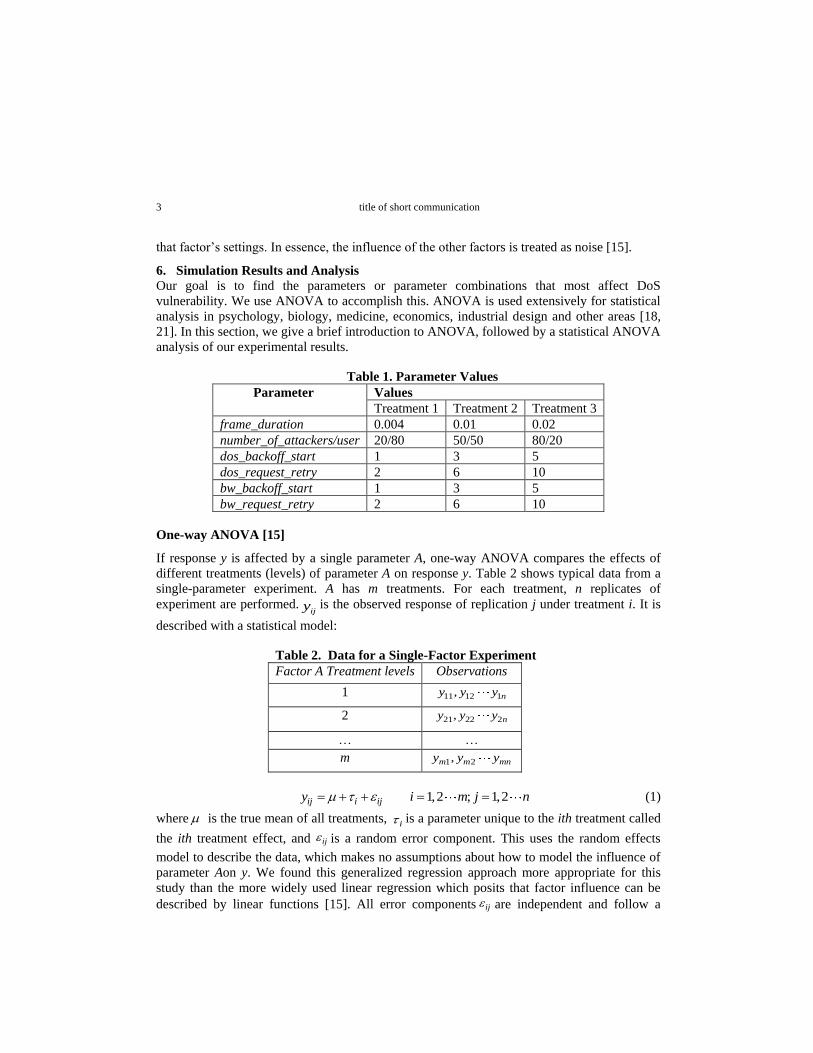
Table 2. Data for a Single-Factor Experiment
Factor A Treatment levels Observations
1 11 12 1, ny y y
2 21 22 2, ny y y
… …
m 1 2,m m mny y y
Table 1. Parameter Values
Parameter Values
Treatment 1 Treatment 2 Treatment 3
frame_duration 0.004 0.01 0.02
number_of_attackers/user 20/80 50/50 80/20
dos_backoff_start 1 3 5
dos_request_retry 2 6 10
bw_backoff_start 1 3 5
bw_request_retry 2 6 10
Juan Deng, Richard R. Brooks, and James Martin8
normal distribution with mean 0 and variance 2 . One-way ANOVA tests the equality
ofi ’s, or equivalently tests the hypothesis,
0 1 2
1
: 0
: 0 for at least one
m
i
H
H i
(2)
To do the test,
1. first compute the total Sum of Square (SS);
2. decompose SS into SS SSTreatment SSE , where SSTreatment is the SS due to
treatments and has a degree of freedom (DF) 1m , and ESS is the SS due to error and
has a DF N m . N m n is the total number of observations;
3. compute Mean Square (MS);
4. compute 0F ;
The hypothesis 0H is rejected if
0 , 1,m N mF F , where is type I error control and usually
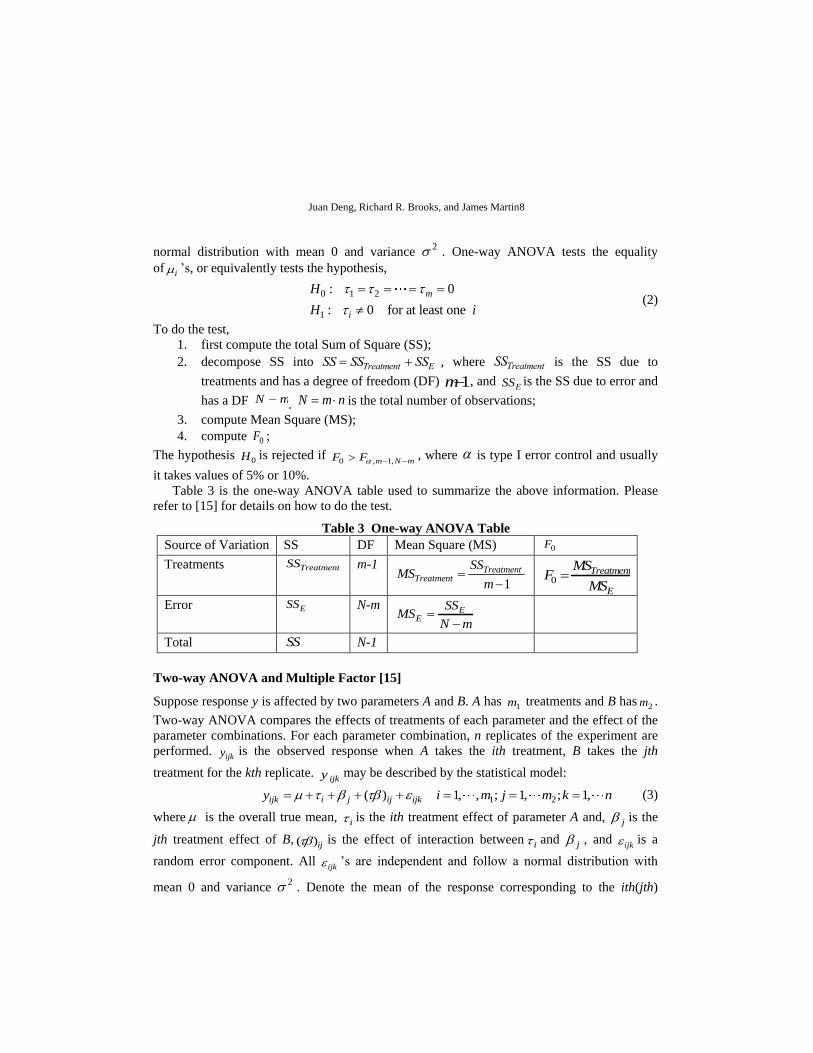
it takes values of 5% or 10%. Table 3 is the one-way ANOVA table used to summarize the above information. Please
refer to [15] for details on how to do the test.
Two-way ANOVA and Multiple Factor [15]
Suppose response y is affected by two parameters A and B. A has 1m treatments and B has 2m .
Two-way ANOVA compares the effects of treatments of each parameter and the effect of the
parameter combinations. For each parameter combination, n replicates of the experiment are
performed. ijky is the observed response when A takes the ith treatment, B takes the jth
treatment for the kth replicate. ijky may be described by the statistical model:
1 2( ) 1, , ; 1, ; 1,ijk i j ij ijky i m j m k n
(3)
where is the overall true mean, i is the ith treatment effect of parameter A and, j is the
jth treatment effect of B, ( )ij is the effect of interaction betweeni and j , and
ijk is a
random error component. All ijk ’s are independent and follow a normal distribution with
mean 0 and variance 2 . Denote the mean of the response corresponding to the ith(jth)
Table 3 One-way ANOVA Table
Source of Variation SS DF Mean Square (MS) 0F
Treatments TreatmentSS m-1
1
TreatmentTreatment
SSMS
m
0Treatment
E
MSF
MS
Error ESS N-m E
E
SSMS
N m
Total SS N-1
3 title of short communication
treatment of A (B) asAi (
Bj ). Two-way ANOVA tests the equality of Ai ’s, the equality of
Bj ’s, and whether A and B interact. Please refer to [15] for details.
The two-way ANOVA can be extended to L factors ( 3L ). As you may expect, the
ANOVA table for L factors will contain the rows for treatments of each factor, for 2nd order,
3rd order… ( 1)L th order factor interactions. Tools exist to do ANOVA. In this paper, we use
the tools in Matlab.
In ANOVA, “R-SQUARE” is commonly used in data analysis. It is defined as
2 X
T
SSR
SS
(4)
and interpreted as the percent of variance in the data “explained” by the parameter X [15].
Factor X can be a parameter or parameter interaction.
It is important to mention that these equations make the basic assumption that all error
factors have normal distributions. Since we confound readings from multiple factors, when
any parameter significantly influences y then the values for the other factors are likely not
to follow normal distributions. This may lower the significance of the test [15], increasing
the likelihood of a false negative, and possibly skewing specific values of found by
regression. But, the F-test we use for determining the significance of the influence of
individual factors is in practice robust to the normality assumption and only slightly affected.
Simulation Results and Analysis
The purpose of our analysis is to examine the effects of the 6 parameters and their
combinations on system vulnerability to DoS attacks on bandwidth contention resolution
mechanism. Each parameter has 3 treatments, as listed in Table 1. For each parameter
combination, 7 replications are run. We measure the average throughput of the SSs in the
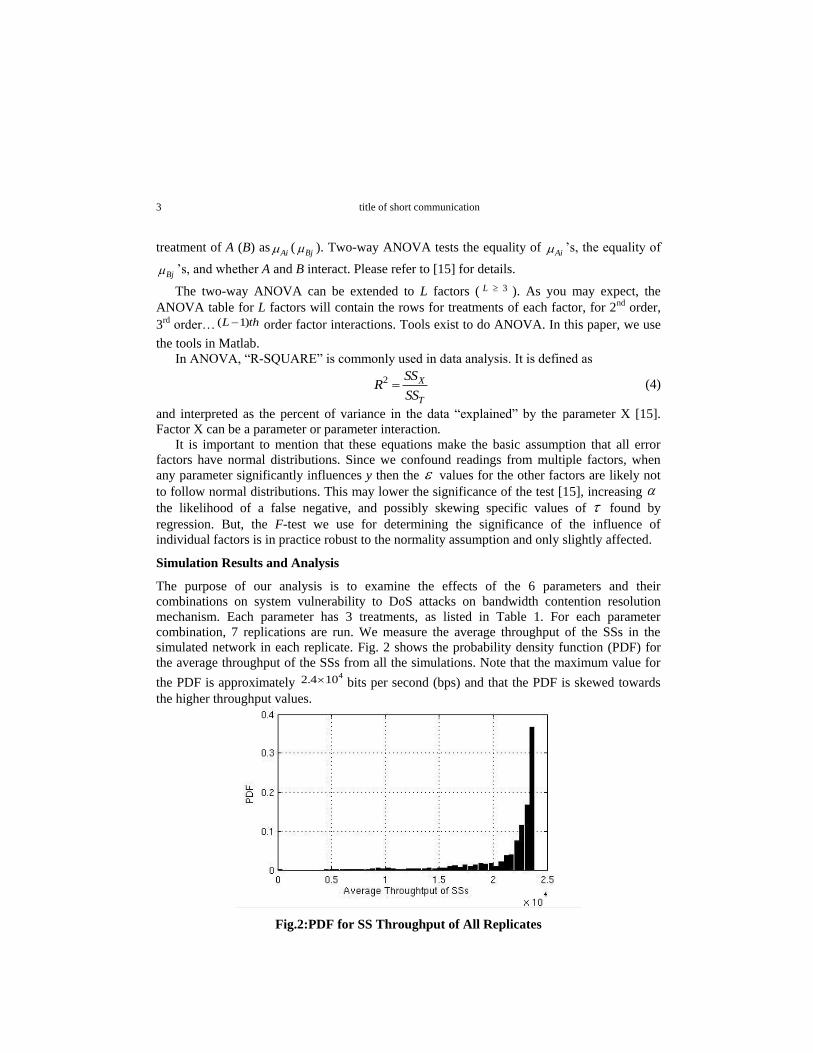
simulated network in each replicate. Fig. 2 shows the probability density function (PDF) for
the average throughput of the SSs from all the simulations. Note that the maximum value for
the PDF is approximately 42.4 10 bits per second (bps) and that the PDF is skewed towards
the higher throughput values.
Fig.2:PDF for SS Throughput of All Replicates

Juan Deng, Richard R. Brooks, and James Martin10
Table 4 ANOVA Table for Average Throughput Data
Source SS DF MS 0F F Prob>0F R
SQUARE
X1 1.143e10 2 5.713e9 11048.57 2.998 0 0.2169
X2 1.452e7 2 7.258e6 14.04 2.998 0 0.0003
X3 1.291e8 2 6.454e7 124.82 2.998 0 0.0025
X4 1.774e8 2 8.872e7 171.59 2.998 0 0.0034
X5 2.822e9 2 1.411e9 2728.55 2.998 0 0.0536
X6 1.650e10 2 8.250e9 15956.79 2.998 0 0.3133
X1X2 7.108e6 4 1.777e6 3.44 2.374 0.008 0.0001
X1X3 3.875e8 4 9.688e7 187.37 2.374 0 0.0074
X1X4 1.720e8 4 4.301e7 83.18 2.374 0 0.0033
X1X5 1.725e9 4 4.312e8 833.89 2.374 0 0.0328
X1X6 9.545e9 4 2.386e9 4614.98 2.374 0 0.1812
X2X3 3.016e7 4 7.541e6 14.58 2.374 0 0.0006
X2X4 3.695e7 4 9.237e6 17.86 2.374 0 0.0007
X2X5 6.092e7 4 1.523e7 29.45 2.374 0 0.0012
X2X6 8.926e6 4 2.231e6 4.32 2.374 0.002 0.0002
X3X4 1.168e8 4 2.920e7 56.48 2.374 0 0.0022
X3X5 1.527e8 4 3.818e7 73.85 2.374 0 0.0029
X3X6 5.286e8 4 1.321e8 255.57 2.374 0 0.0100
X4X5 7.456e6 4 1.864e6 3.61 2.374 0.006 0.0001
X4X6 1.066e8 4 2.665e7 51.54 2.374 0 0.0020
X5X6 3.870e9 4 9.675e8 1871.14 2.374 0 0.0735
X1X2X3 1.031e8 8 1.289e7 24.94 1.940 0 0.0020
X1X2X4 4.540e7 8 5.675e6 10.98 1.940 0 0.0009
X1X2X5 9.147e7 8 1.143e7 22.11 1.940 0 0.0017
X1X2X6 3.623e7 8 4.528e6 8.76 1.940 0 0.0007
X1X3X4 9.952e7 8 1.244e7 24.06 1.940 0 0.0019
X1X3X5 4.797e7 8 5.997e6 11.6 1.940 0 0.0091
X1X3X6 1.982e8 8 2.478e7 47.92 1.940 0 0.0038
X1X4X5 8.019e6 8 1.002e6 1.94 1.940 0.050 0.0002
X1X4X6 7.409e7 8 9.262e6 17.91 1.940 0 0.0001
X1X5X6 9.344e8 8 1.168e8 225.9 1.940 0 0.0177
X2X3X4 3.879e7 8 4.849e6 9.38 1.940 0 0.0007
X2X3X5 4.518e7 8 5.647e6 10.92 1.940 0 0.0009
X2X3X6 1.395e8 8 1.744e7 33.73 1.940 0 0.0027
X2X4X5 4.854e6 8 6.068e5 1.17 1.940 0.311 0.0001
X2X4X6 2.430e7 8 3.038e6 5.88 1.940 0 0.0005
X2X5X6 6.429e7 8 8.036e6 15.54 1.940 0 0.0012
X3X4X5 1.009e7 8 1.261e6 2.44 1.940 0.013 0.0002
X3X4X6 5.806e7 8 7.257e6 14.04 1.940 0 0.0011
X3X5X6 2.901e8 8 3.626e7 70.13 1.940 0 0.0055
X4X5X6 1.107e7 8 1.384e6 2.68 1.940 0.006 0.0002
Error 2.518e9 4870 5.170e5
Total 5.267e10 5102
3 title of short communication
The Matlab ANOVA function was run on the throughput data returned by the simulations,
giving the results in Table 4. We added the “R-Square” values and F values to the table3. We
only considered interactions up to the 3rd order. For brevity, labels X1 to X6 are used to
represent frame_duration, number_of_attackers, dos_backoff_start, dos_request_retry,
bw_backoff_start, and bw_request_retry. The notation XiXjXk in the “Source” column in
the table represents the interactions of the three parameters. The “Prob>F” column gives the p-
value for the F-test, which is the probability that a random process produces a value at least as
extreme as the observed value. Since we are using a significance level of 95% ( 0.05 ), we
would accept H0 if this value is greater than 0.05.
For row “X1” to “X6” in Table 4, 0H is the hypothesis that the average throughput of SSs
corresponding to different treatments of a parameter are equal. For the rest rows, 0H is the
hypothesis that no parameter interaction exists.
First we look at the first order parameter effect, row “X1” to “X6” in Table 44. The p-
values for the individual parameters are all negligible, meaning that each parameter has a
significant influence on the ability of the attackers to launch a DoS attack. The “R Square”
column states which parameters are more critical. Parameter X1 (frame_duration) explains
about 21% of the total variance, while parameter X6 (bw_request_retry) accounts for another
31% of the variance in all the tests. Of the other parameters, only parameter X5
(bw_backoff_start) accounts for more than 1% of the variance, and it only accounts for around
5% of the variance.
Consider 2nd order effects, row “X1*X2” to “X5*X6”5. We see that the p-values show all
2nd order effects to be significant. The most significant second order effect is the interaction
between X1 and X6, which accounts for an additional 18% of the variance. The only other
second order effect worth noting is the combination of X5 and X6 which accounts for about
7% of the variance. These results indicate that in our simulations parameters X1and X6
together explain over 70% of the total variability. Therefore, the average throughput of all SSs
is determined mainly by these two parameters.
The set of 3rd order interactions finds that some 3rd order effects (X1 X4 X5 and
X2X4X5 ) are not 95% significant, because their p-values are larger than 0.05. The only
3rd order effect that accounts for more than 1% of the variance is X1X5X6, which is not
surprising as these are the three parameters that are most influential. Adding X5, X1X5,
X5X6, and X1X5X6 could explain an additional 16% of the variance in the system.
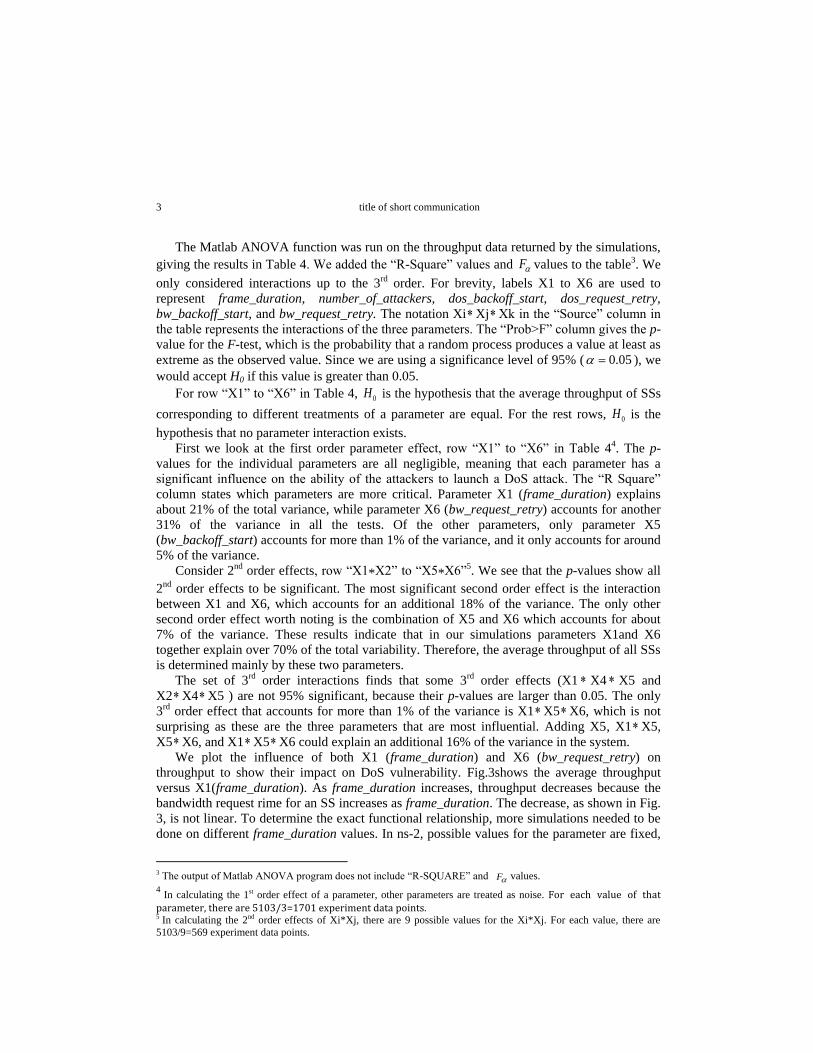
We plot the influence of both X1 (frame_duration) and X6 (bw_request_retry) on
throughput to show their impact on DoS vulnerability. Fig.3shows the average throughput
versus X1(frame_duration). As frame_duration increases, throughput decreases because the
bandwidth request rime for an SS increases as frame_duration. The decrease, as shown in Fig.
3, is not linear. To determine the exact functional relationship, more simulations needed to be
done on different frame_duration values. In ns-2, possible values for the parameter are fixed,
3 The output of Matlab ANOVA program does not include “R-SQUARE” and F values. 4 In calculating the 1st order effect of a parameter, other parameters are treated as noise. For each value of that parameter, there are 5103/3=1701 experiment data points. 5 In calculating the 2nd order effects of Xi*Xj, there are 9 possible values for the Xi*Xj. For each value, there are
5103/9=569 experiment data points.
Juan Deng, Richard R. Brooks, and James Martin12
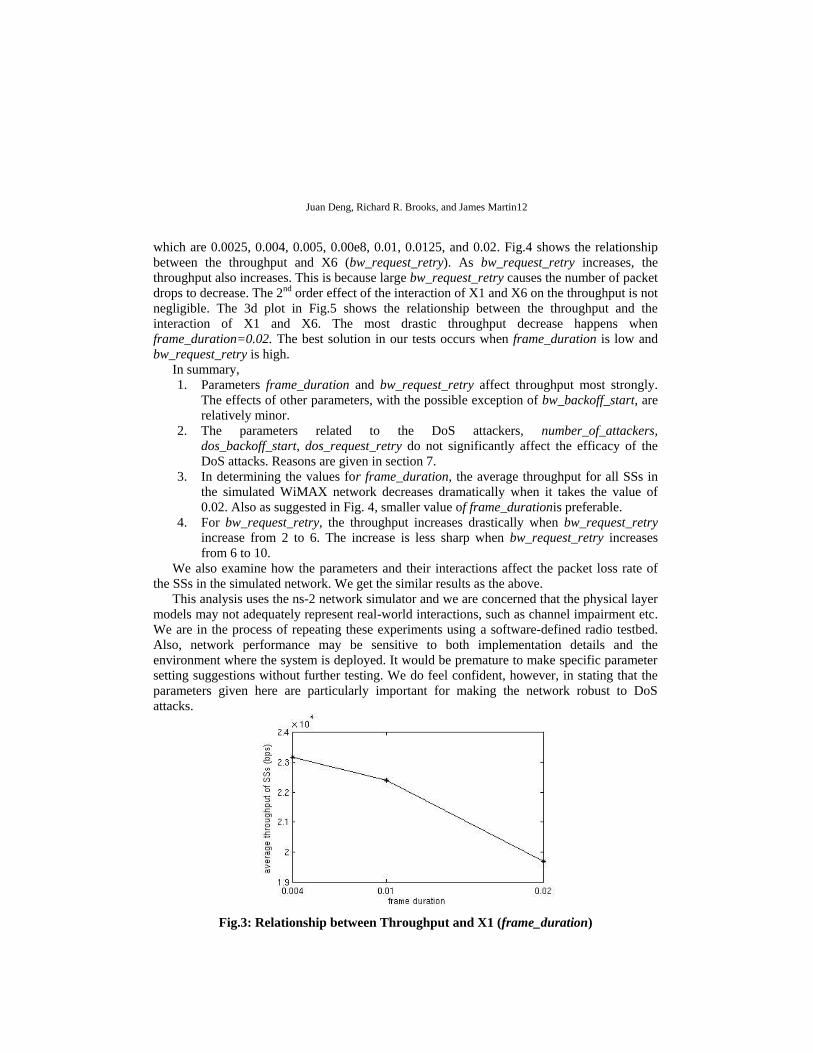
which are 0.0025, 0.004, 0.005, 0.00e8, 0.01, 0.0125, and 0.02. Fig.4 shows the relationship
between the throughput and X6 (bw_request_retry). As bw_request_retry increases, the
throughput also increases. This is because large bw_request_retry causes the number of packet
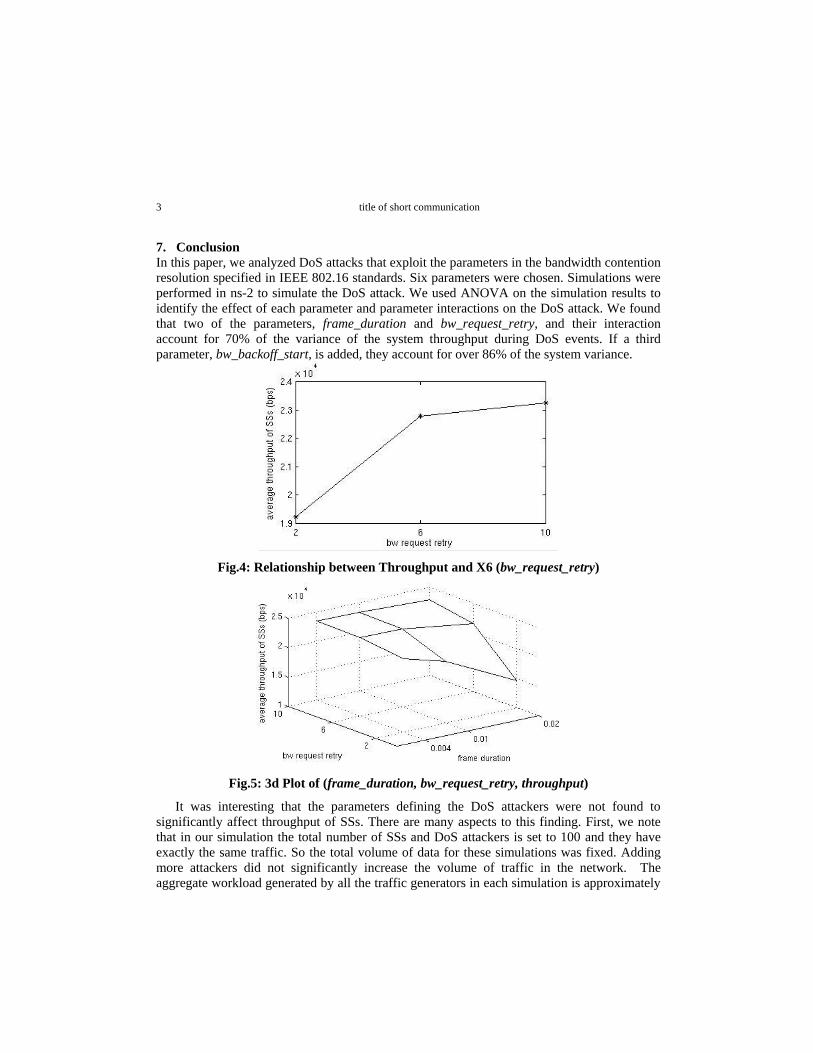
drops to decrease. The 2nd order effect of the interaction of X1 and X6 on the throughput is not
negligible. The 3d plot in Fig.5 shows the relationship between the throughput and the
interaction of X1 and X6. The most drastic throughput decrease happens when
frame_duration=0.02. The best solution in our tests occurs when frame_duration is low and
bw_request_retry is high.
In summary,
1. Parameters frame_duration and bw_request_retry affect throughput most strongly.
The effects of other parameters, with the possible exception of bw_backoff_start, are
relatively minor.
2. The parameters related to the DoS attackers, number_of_attackers,
dos_backoff_start, dos_request_retry do not significantly affect the efficacy of the
DoS attacks. Reasons are given in section 7.
3. In determining the values for frame_duration, the average throughput for all SSs in
the simulated WiMAX network decreases dramatically when it takes the value of
0.02. Also as suggested in Fig. 4, smaller value of frame_durationis preferable.
4. For bw_request_retry, the throughput increases drastically when bw_request_retry
increase from 2 to 6. The increase is less sharp when bw_request_retry increases
from 6 to 10.
We also examine how the parameters and their interactions affect the packet loss rate of
the SSs in the simulated network. We get the similar results as the above.
This analysis uses the ns-2 network simulator and we are concerned that the physical layer
models may not adequately represent real-world interactions, such as channel impairment etc.
We are in the process of repeating these experiments using a software-defined radio testbed.
Also, network performance may be sensitive to both implementation details and the
environment where the system is deployed. It would be premature to make specific parameter
setting suggestions without further testing. We do feel confident, however, in stating that the
parameters given here are particularly important for making the network robust to DoS
attacks.
Fig.3: Relationship between Throughput and X1 (frame_duration)
3 title of short communication
7. Conclusion
In this paper, we analyzed DoS attacks that exploit the parameters in the bandwidth contention
resolution specified in IEEE 802.16 standards. Six parameters were chosen. Simulations were
performed in ns-2 to simulate the DoS attack. We used ANOVA on the simulation results to
identify the effect of each parameter and parameter interactions on the DoS attack. We found
that two of the parameters, frame_duration and bw_request_retry, and their interaction
account for 70% of the variance of the system throughput during DoS events. If a third
parameter, bw_backoff_start, is added, they account for over 86% of the system variance.
Fig.4: Relationship between Throughput and X6 (bw_request_retry)
Fig.5: 3d Plot of (frame_duration, bw_request_retry, throughput)
It was interesting that the parameters defining the DoS attackers were not found to
significantly affect throughput of SSs. There are many aspects to this finding. First, we note
that in our simulation the total number of SSs and DoS attackers is set to 100 and they have
exactly the same traffic. So the total volume of data for these simulations was fixed. Adding
more attackers did not significantly increase the volume of traffic in the network. The
aggregate workload generated by all the traffic generators in each simulation is approximately
Juan Deng, Richard R. Brooks, and James Martin14
2.4 Mbps 6 , while the simulated network provides an upstream data rate of just greater
than15Mbps7. So, the network is always less than 15% utilized. This is intentional, adding
more traffic eventually results in a packet flooding DoS attack. Technical countermeasures to
packet-flooding DoS are outside the scope of this paper.
The factors found to be most significant, frame_duration and bw_request_retry both
directly influence SS throughput. Decreasing the frame_duration allows SS’s to make retry
requests more quickly when collisions occur. The request retry allows SS’s to make a larger
number of requests before timing out. It makes sense that these factors should be set
appropriately low (frame_duration) and high (bw_request_retry) to allow SSs to compensate
for the disturbances caused by attackers.
A third parameter, bw_backoff_start, was also significant. By allowing SS’s to launch
retry requests more quickly, its influence is consistent with the other two parameters.
However, since the magnitude of its influence is so much less than frame_duration and
bw_request_retry, we feel that it is more appropriate to concentrate DoS efforts on finding
proper settings for the two parameters.
This general approach is well suited to analyzing other network protocols. In future work,
we are verifying these results using a hardware-in-the-loop test environment. These tests are
currently underway using the NSF-sponsored GENI next generation network testbed and a set
of software defined SS’s and BS’s. These tests will serve both to verify these simulation
results and act as a hardware verification of the ns-2 WiMAX modules.
Once verification of these results has been done using hardware-in-the-loop, we hope to do
analysis to find a more complete response surface for the bandwidth contention resolution
parameters that significantly influence DoS vulnerability. This information should be useful
for protocol design teams, since it empirically determines the set of system parameters that
make the system most vulnerable to attack. We suggest that the next round of standards
attempt to make WiMAX more robust.
Finally, simulations are forced to model radio waves as propagating in a uniform media,
ignoring many significant problems due to multi-path fading, shadowing, etc. that are
primarily due to interactions with the local environment. It would be useful to run tests in a
number of different physical settings to see if the results presented here are consistent with
performance in commercial settings. The experimental design approach we use is particularly
suited to this work, since these tools have been developed to allow experimenters to get
significant information from a minimal number of test replications [15].
These results are useful for several reasons. They indicate for future versions of 802.16
that these bandwidth contention resolution parameters are most critical for system
performance. Researchers should concentrate on issues related to their interactions. Also, this
indicates how to make the system robust to errors in SS implementation. It will also be
interesting in the future to compare the resistance of DOCSIS, 802.16 and LET networks,
since a good deal of 802.16 was lifted from DOCSIS and a good deal of LTE is lifted from
802.16.
6 In our simulation, there are 100 nodes. Each node has a UDP agent which sends packet of size 1500 bytes every 0.5
second. So, the aggregate work load is 100*1500*8*2=2.4Mbps. This is consistent with Figure 2. The simulation
implies that well configured networks are very efficient. 7An effective data rate of 15 Mpbs represents the best possible channel conditions (i.e. utilizing 64QAM 3/4 coding)
over a 10MHz channel that is evenly divided between upstream and downstream transmissions.
3 title of short communication
The discovery of DoS vulnerabilities is an important step in the creation of more secure
protocols. This allows future versions to be developed in a way that removes these
vulnerabilities. The publication of known vulnerabilities helps make 802.16 more secure, and
may make it more secure than competing technologies.
Acknowledgement
The participation of J. Deng is supported in part by the National Science Foundation
contract/grant number CNS-1049765. The participation of R. Brooks is supported in part by
the Air Force Office of Scientific Research contract/grant number FA9550-09-1-0173. The
participant of J. Martin is supported in part by the National Science Foundation award ECCS-
0948132. Opinions expressed in this paper are those of the authors and do not necessarily
represent the official and policies of the US Department of Defense or the National Science
Foundation. We thank the reviewers for insights that helped improve the quality of this paper.
References
[1] Johnston D., and Walker J., Overview of IEEE 802.16 Security. IEEE Security and
Privacy, 2004: 40-48.
[2] Naseer S., Younus M., and Ahmed A., Vulnerabilities Exposing IEEE 802.16e
Networks to DoS Attacks: A survey. 9th ACIS International Conference on Software
Engineering, Artificially Intelligence, Networking and Parallel/Distributed Computing,
2008.
[3] S. Xu, M. Matthews, and Huang C. T., Security Issues in Privacy and Key Management
Protocols of IEEE 802.16. 44th Annual Southeast Regional Conference, Melbourne,
Florida, USA, 2006.
[4] Hur J., Shim H., KimP., Yoon H., and Song N., Security Considerations for Handover
Schemes in Mobile WiMAX Networks. IEEE Wireless Communication and Networking
Conference2008.
[5] Pang D., Tian L., et al., Overview and Analysis of IEEE 802.16e Security, Auswireless
Conference 2006. URI: http://hdl.handle.net/2100/172. [6] Deininger A., Kiyomoto S., et al., Security Vulnerabilities and Solutions in Mobile
WiMAX. LJCSNS International Journal of Computer Science and Network Security
2007; vol. 7; No. 11.
[7] Li H., and Fan G., GKDA: A Group-Based Key Distribution Algorithm for WiMAX MBS
Security, Advances in Multimedia Information Processing – PCM 2006; 4261: 310-318.
[8] Shon T., and Choi W., An Analysis of Mobile WiMAX Security: Vulnerabilities and
Solutions. First International Conference, NBiS 2007, LNCS; 4650: 88-97.
[9] Altaf A., Sirhindi R., and Ahmed A., A Novel Approach against DoS Attacks in WiMAX
Authentication Using Visual Cryptography. 2nd International Conference of Emerging
Security Information, Systems, and Technologies 2008: 238-242.
[10] Han J., Alias M. Y., Goi Bok Min, Potential Denial of Service Attacks in IEEE802.16e-
2005 networks.9th International Symposium on Communications and Information
Technology 2009: 1207-1212.
[11] Po-Wen Chi, and Chin-Laung Lei, A Prevention Approach to Scrambling Attacks in
WiMAX networks. World of Wireless, Mobile and Multimedia Networks & Workshop
2009: 1-8.
Juan Deng, Richard R. Brooks, and James Martin16
[12] Tao Han, Ning Zhang et. al., Analysis of Mobile WiMAX Security: Vulnerabilities and
Solutions. IEEE International Conference on Mobile Ad Hoc and Sensor Systems 2008:
828-833.
[13] Boom D. D., Denial of Service Vulnerabilities in IEEE 802.16 Wireless Networks.
Master Thesis of Science in Systems Engineering from Naval Postgraduate School.
2004.
[14] Rutherford A., Introducing ANOVA and ANCOVA. Great Britain by Athenaeum Press,
Gateshead, 2001.
[15] Montgomery D. C., Design and Analysis of Experiments. Third Edition, John Wiley &
Sons, 1991. [16] Soh S., Lau W., Rai S. and Brooks R. R., On Computing Reliability and Expected Hop
Count of Wireless Communication Networks. International Journal of Performability
Engineering 2007; 3 ; 2: 267-279.
[17] Shrestha A., and Xing L., Quantifying Application Communication Reliability of
Wireless Sensor Networks. International Journal of Performability Engineering 2008; 4;
1: 43-56.
[18] Guo H., and Mettas A., Reliability Assessment Using a Likelihood Ratio Test.
International Journal of Performability Engineering 2008; 4; 2:196-198.
[19] Available at http://www.isi.edu/nsnam/ns/. Last accessed 04/16/2010.
[20] Available at http://w3.antd.nist.gov/seamlessandsecure/pubtool.shtml#tools. Last
accessed 04/16/2010.
[21] Neter J., Wasserman W., and Kutner M. H., Applied Linear Regression Models.Second
Edition, Irwin, Burr Ridge, Ill. 1983.
[22] Press W. H., Vetterling W. T., Teukolsky S. A., and Flannery B. P. Numerical Recipes
in FORTRAN. Second Edition, Cambridge University Press, Cambridge, UK, 1992.
Brief bio.
Juan Deng received the B.E. degree in Electronic Information Engineering from the
University of Electronic Science and Technology of China, Sichuan, China, in 2003 and the
M.S in Control Theory and Engineering from the University of Science and Technology of
China, in 2006. She is pursuing a PhD in the Department of Electrical and Computer
Engineering, Clemson University, Clemson, SC, USA. Her research interests are computer
network security, game theory, and adversarial systems.
R. R. Brooks received the BA degree in mathematical sciences from the Johns Hopkins
University, Baltimore, MD in 1979 and the PhD degree in computer science from the
Louisiana State University, Baton Rouge in 1996. He is currently an Associate Professor with
the Holcombe Department of Electrical and Computer Engineering at Clemson University,
Clemson, SC. His current research interests are systems security, game theory, and adversarial
systems. He is a senior member of the IEEE, as well as a member of the Association for
Computing Machinery and the Institute for Operations Research and Management Sciences.
Dr. Jim Martin is an Associate Professor in the School of Computing at Clemson University.
His research interests include broadband access, wireless networks, Internet protocols, and
network performance analysis. He has received funding from NSF, NASA, the Department of
Justice, Cisco, IBM, and BMW. Dr Martin received his Ph.D. from North Carolina State
University. Prior to joining Clemson, Dr Martin was a consultant for Gartner, and prior to
that, a software engineer for IBM.


![On the Performance of Mobile WiMAX System: Measurement and … · 2013-12-24 · and propagation models of the fixed WiMAX system have been widely studied [2-5], the mobile WiMAX](https://img.pdfslide.net/doc/110x75/5e6de77655b98a760033adf3/on-the-performance-of-mobile-wimax-system-measurement-and-2013-12-24-and-propagation.jpg)