Embed Size (px)
Citation preview

Assessing the net effect of anthropogenic disturbance on aquatic communities
in wetlands: community structure relative to distance from canals
Jennifer S. Rehage* & Joel C. TrexlerDepartment of Biological Sciences, Florida International University, Miami, FL 33199, USA(*Author for correspondence: Tel.: +1-305-348-7314; Fax: +1-305-348-1986; E-mail: [email protected])
Key words: wetlands, canals, anthropogenic disturbance, density, community structure
Abstract
Anthropogenic alterations of natural hydrology are common in wetlands and often increase water per-manence, converting ephemeral habitats into permanent ones. Since aquatic organisms segregate stronglyalong hydroperiod gradients, added water permanence caused by canals can dramatically change thestructure of aquatic communities. We examined the impact of canals on the abundance and structure ofwetland communities in South Florida, USA. We sampled fishes and macroinvertebrates from marshtransects originating at canals in the central and southern Everglades. Density of all aquatic organismssampled increased in the immediate proximity of canals, but was accompanied by few compositionalchanges based on analysis of relative abundance. Large fish (>8 cm), small fish (<8 cm) and macroinver-tebrates (>5 mm) increased in density within 5 m of canals. This pattern was most pronounced in the dryseason, suggesting that canals may serve as dry-down refugia. Increases in aquatic animal density closelymatched gradients of phosphorus enrichment that decreased with distance from canals. Thus, the mostapparent impact of canals on adjacent marsh communities was as conduits for nutrients that stimulatedlocal productivity; any impact of their role as sources of increased sources of predators was not apparent.The effect of predation close to canals was overcompensated by increased secondary productivity and/orimmigration toward areas adjacent to canals in the dry season. Alternatively, the consumptive effect ofpredatory fishes using canals as dry-season refuges is very small or spread over the expanse of marshes withopen access to canals.
Introduction
Anthropogenic activities have altered freshwaterecosystems worldwide, severely threatening theirecological integrity (NCR, 1992; Naiman &Turner, 2000). The addition of dams, impound-ments, channels, canals and levees has dramati-cally disrupted flow, flooding cycles andhydrologic connectivity (Dynesius & Nilsson,1994; Power et al., 1995; Rosenberg et al., 2000;Pringle, 2001; Bronmark & Hansson, 2002). Intemporary habitats, anthropogenic hydrologicalterations often result in changes in the amount,extent and timing of flooding (Bedford & Preston,1988). In many cases, drainage and impoundment
results in complete loss of wetlands or temporaryponds (Turner et al., 1998). In other instances,hydrologic alterations may increase water perma-nence, converting ephemeral habitats into perma-nent ones (Gergel, 2002). Aquatic organisms havebeen shown to segregate strongly along gradientsof aquatic habitat permanence (Wilbur, 1980;Schneider & Frost, 1996; Wellborn et al., 1996;Corti et al., 1997; Skelly et al., 1999). Largepredatory fish are typically absent from temporarywetlands, providing a predation refuge for manysmall aquatic organisms. Thus, lengthening hy-droperiod and enhancing habitat connectance mayresult in marked changes in community structureand ecosystem function.
Hydrobiologia (2006) 569:359–373 � Springer 2006J.C. Trexler, E.E. Gaiser & D.L. Childers (eds), Interaction of Hydrology and Nutrients in Controlling Ecosystem Function inOligotrophic Coastal Environments of South FloridaDOI 10.1007/s10750-006-0142-z

In the Florida Everglades, drainage andimpoundment have drastically altered hydrologicconditions and reduced the extent of shallow, sea-sonal wetlands by more than 40% (Davis et al.,1994). Presently, over 1600 km of canals and1150 kmof levees compartmentalize the system anddisrupt the natural southerly sheet flow of waterover vegetated marshes (Light & Dineen, 1994).Historically, the spatial extent of marsh inundation(and thus habitat for aquatic organisms) fluctuatedseasonally in response to rainfall patterns (high inthe summer and fall, low in the winter and spring).Today, inundation and flow are largely controlledby this extensive system of water control structures,levees and canals. Beyond altering flow and hy-droperiod, canals provide permanent deep-waterrefuges for biota that were historically rare or ab-sent in the ecosystem (Gunderson & Loftus, 1993).These artificial habitats harbor relatively highnumbers of predatory and non-indigenous fishes(Loftus & Kushlan, 1987; Trexler et al., 2001) thatmay alter the small fish and macroinvertebratecommunities of nearby marshes.
Alterations to the natural hydrologic regime ofwetlands are often accompanied by alterations innutrient inputs (Sanchez-Carrillo & Alvarez-Co-belas, 2001). The Everglades is an oligotrophicwetland, which historically received most of itsnutrients from rain. Like many freshwater wet-lands, Everglades marshes are phosphorus(P)-limited (McCormick et al., 1996). Ambientconcentrations of total phosphorus (TP) in thewater column are typically below 10 lg/l (Davis,1994). Over the past decades, however, the eco-system has been subjected to anthropogenic Penrichment. Discharge from canals borderingnorthern agricultural lands is the main source ofnutrients; TP concentration in canal runoff hasbeen as high as 30-times ambient levels (McCor-mick et al., 1996). A number of alterations to thestructure and function of the Everglades ecosystemhave resulted from P enrichment, even at very lowlevels (Davis, 1994; Doren et al., 1997; Noe et al.,2001; Gaiser et al., 2005). Among these impacts,fish and macroinvertebrate biomass and densityhave been shown to increase at high TP concen-trations (Rader & Richardson, 1994; Turner et al.,1999; Gaiser et al., 2005).
The impact of canals on aquatic organismsinhabiting Everglades wetlands may depend on the
relative strength of predation and nutrientenrichment. If canals provide key habitats forpredatory fish species, predation pressure may in-crease in nearby marshes. On the other hand, ifcanals act as a source of nutrients, prey speciesmay increase as the enrichment effect is transmit-ted up the food web. When both resource stimu-lation and enhanced predatory consumptioncombine, there may be no net effect or a damp-ening of the stronger factor by the weaker one.The overall effect may be complex in systems suchas the Everglades where omnivory is widespread(Polis & Strong, 1996; Leibold et al., 1997).
In this study, we examined patterns of fish andmacroinvertebrate communities relative to dis-tance from canals to evaluate the net effect ofnutrients and predation. We asked: (1) How dofish and macroinvertebrate communities changewith proximity to canals? (2) Over what distancedo canals influence aquatic communities? and (3)Does the effect vary between undisturbed anddisturbed marshes (in this case, marshes impactedby airboat traffic)? To address these questions, wesampled large fishes, small fishes and macroinver-tebrates in transects originating at canals andextending into un-channelized marshes. We wereparticularly interested in determining the effect ofproximity to canals on the small fish assemblage,which dominates fish standing crops and abun-dance (Turner et al., 1999; Trexler et al., 2002) andconstitutes an important food source for wadingbirds (Frederick & Spalding, 1994). We focused onthe effect of canals at small spatial scales(5–1000 m), because our study sites consisted ofcanals with relatively low nutrient enrichmentcompared to canals included in previous studies(e.g., Doren et al., 1997; Childers et al., 2003). Byavoiding canals with high nutrient enrichment andextensive areas of nutrient-enriched marsh down-stream, we increased the possibility of document-ing the role of canals as a predator source, ifpresent.
Methods
We sampled fish and macroinvertebrates in tran-sects originating at 5 canals: I75, L28, L29 and L67in Water Conservation Area 3A (WCA3A) and theC111 in the southern Everglades, Florida, USA
360
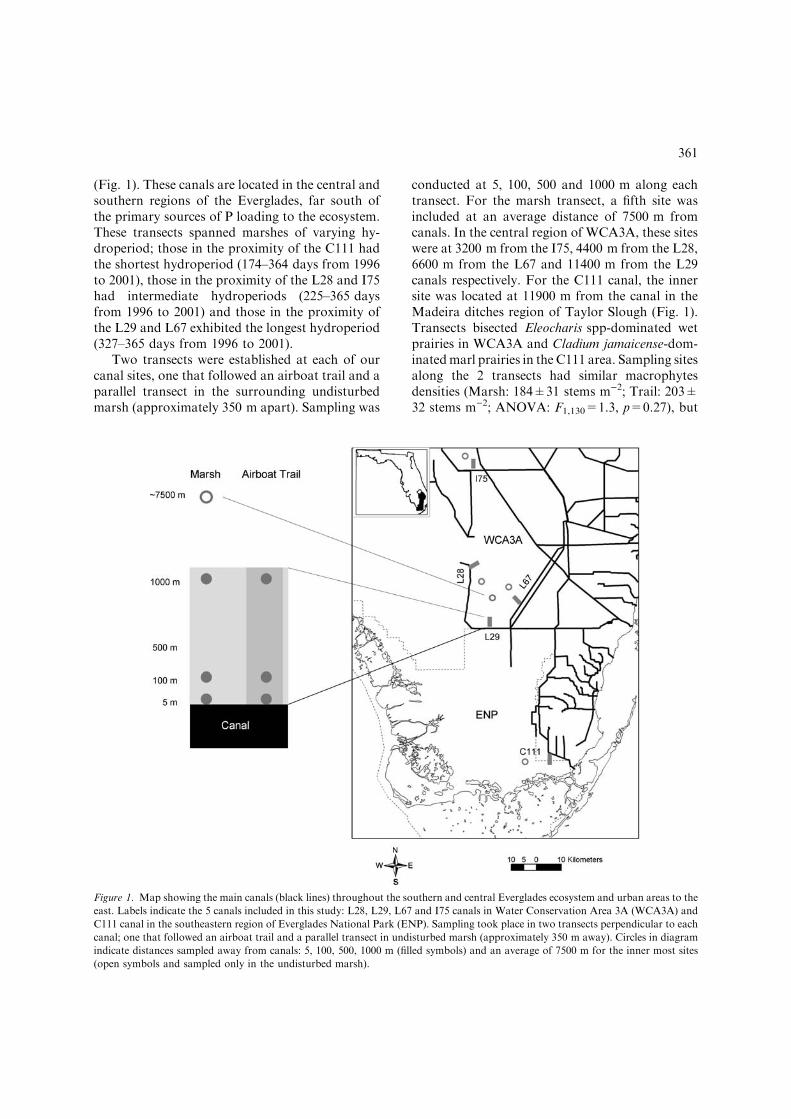
(Fig. 1). These canals are located in the central andsouthern regions of the Everglades, far south ofthe primary sources of P loading to the ecosystem.These transects spanned marshes of varying hy-droperiod; those in the proximity of the C111 hadthe shortest hydroperiod (174–364 days from 1996to 2001), those in the proximity of the L28 and I75had intermediate hydroperiods (225–365 daysfrom 1996 to 2001) and those in the proximity ofthe L29 and L67 exhibited the longest hydroperiod(327–365 days from 1996 to 2001).
Two transects were established at each of ourcanal sites, one that followed an airboat trail and aparallel transect in the surrounding undisturbedmarsh (approximately 350 m apart). Sampling was
conducted at 5, 100, 500 and 1000 m along eachtransect. For the marsh transect, a fifth site wasincluded at an average distance of 7500 m fromcanals. In the central region of WCA3A, these siteswere at 3200 m from the I75, 4400 m from the L28,6600 m from the L67 and 11400 m from the L29canals respectively. For the C111 canal, the innersite was located at 11900 m from the canal in theMadeira ditches region of Taylor Slough (Fig. 1).Transects bisected Eleocharis spp-dominated wetprairies in WCA3A and Cladium jamaicense-dom-inatedmarl prairies in the C111 area. Sampling sitesalong the 2 transects had similar macrophytesdensities (Marsh: 184±31 stems m)2; Trail: 203±32 stems m)2; ANOVA: F1,130=1.3, p=0.27), but
Figure 1. Map showing the main canals (black lines) throughout the southern and central Everglades ecosystem and urban areas to the
east. Labels indicate the 5 canals included in this study: L28, L29, L67 and I75 canals in Water Conservation Area 3A (WCA3A) and
C111 canal in the southeastern region of Everglades National Park (ENP). Sampling took place in two transects perpendicular to each
canal; one that followed an airboat trail and a parallel transect in undisturbed marsh (approximately 350 m away). Circles in diagram
indicate distances sampled away from canals: 5, 100, 500, 1000 m (filled symbols) and an average of 7500 m for the inner most sites
(open symbols and sampled only in the undisturbed marsh).
361

differed in periphyton cover (Marsh: 2783±229 ml m)2; Trail: 2260±260 ml m)2; ANOVA:F1,131 = 12.4, p=0.0006). We sampled in both thewet (September 2003) and dry seasons (January andMarch 2003). Water depth at our sampling sitesaveraged 72±1.9 cm during the wet season and48±2.0 cm during the dry-season sampling event.
Small fish (standard length (SL) <8 cm) andmacroinvertebrates (maximum dimension >5 mm)were sampled with a 1-m2 throw trap with 2-mmmesh netting on the sides, which were cleared fromthe trap using standardized techniques (Kushlan,1981; Jordan et al., 1997). Before clearing the trap,we quantified the number of emergent stems andthe volume of floating periphyton. All animals werepreserved in 10% formalin in the field and broughtto the laboratory for identification and enumera-tion. Three throw-trap samples were taken at eachdistance within each transect (3 throws � 4 dis-tances � 2 transects � 5 canal sites � 2 sea-sons = 240 throws + 30 throws at the 7500 mmarsh site = 270 possible throws). Actual samplesize was 258 because half of the sites at the C111canal were dry at the time of the dry-season sam-pling in early January 2003.
Large fish (SL>8 cm) were sampled using anairboat-mounted electrofishing unit (two-anodeone-cathode apparatus with a Smith-Root� GPP9.0 control box). Electrofishing has been shown tobe an effective method for sampling large fishes inmarshes, and electrofishing catch per unit effort(CPUE) provides a reliable index of fish abundance(Chick et al., 1999). Sampling was conducted in 25-min bouts (pedal time) at each distance withineach transect (2 bouts� 4 distances� 2 transects�5 canal sites � 2 seasons = 160 bouts + 20 boutsat 7500 m mash site = 180 possible bouts). For allbouts, electrofishing power was standardized at1500 W according to temperature and conductivityconditions (Chick et al., 1999). All fish capturedwere identified to species, measured to nearest1 mm SL and released after full recovery. Finalsample size was 162 bouts because most of theC111 sites were dry at the time of the dry-seasonsampling and we were unable to sample the L287500 m marsh site.
To investigate the presence of a nutrientenrichment gradient as a function of distance fromcanals, we measured TP concentrations in the floc-culent detrital organic layer (floc) above the soil.
The floc layer is the most microbiologically activelayer of Everglades soils and plays a key role inshort-term uptake and cycling of P (Noe et al.,2002). Because of its high responsiveness to nutrientinputs, the floc layer may be more closely tied tofoodweb responses to enrichment.We collected flocsampleswith a 2.4 cmdiameter coring device. Threecores were collected from a 1 m2 area and combinedinto a composite sample (Noe et al., 2002). Threecomposite samples were taken at each samplinglocation (3 composite samples � 4 distances � 2transects � 5 canal sites = 120 + 15 samples at7500 mmarsh site = 135 possible samples). Sampleswere dried at 70 �C for 48 hours, crushed to a finepowder and analyzed for TP in a spectrophotometerfollowing standardized procedures (Fourqureanet al., 1992). All samples were collected in March2004, except for the 7500 m samples, which werecollected in October 2002. At the C111 canal, flocsamples were only obtained at the 5 and 7500 mdistances; thus final sample size was 117 samples.
Statistical analyses
We examined variation in the abundance of fishand macroinvertebrates among canal sites and as afunction of season, distance from canals and dis-turbance level (marsh vs. trail transects) with nes-ted, repeated-measures ANOVA models. Seasonwas the repeated measure in our analyses andnesting allowed us to account for spatial variationamong our canal sites. We tested for the effect ofdistance nested within canal site and for the effectof disturbance nested within distance and canal.Focal response variables included: TP concentra-tion (lg g)1), CPUE of large fishes (number5 min)1 electrofishing bout) and densities of smallfish and macroinvertebrates (number m)2). Stemdensity (number m)2) and periphyton volume(ml m)2) were used as covariates in analyses of thethrow-trap data. In order to better satisfyassumptions of parametric tests, all variables werelog (observed value + 1)-transformed prior toanalyses. Post hoc pairwise comparisons wereperformed using Tukey-corrected contrasts. Somepairwise comparisons involving the C111 sitescould not be conducted because of missing dry-season data. Simple linear regressions were used toexamine the relationship between TP and estimatesof abundance. All analyses were performed using
362

SAS Version 9.1.3�. ANOVAs were performedusing Proc MIXED with compound symmetriccovariance structures in the repeated measures(Littell et al., 1996).
We used one-way analysis of similarity(ANOSIM) based on Bray–Curtis dissimilaritymatrices to test for effects of canal site, distanceand disturbance on fish and macroinvertebratecommunity structure (Clarke & Warwick, 2001).Dissimilarity matrices were constructed separatelyfor the large fish, small fish and macroinvertebratecommunities based on square-root transformedestimates of the relative abundance of taxa aver-aged across seasons; no seasonal variation wasevident in preliminary analyses. Analyses included22 large fish species, 28 small fish species and 36macroinvertebrate taxa. We identified macroin-vertebrates to the lowest practical taxonomic res-olution, which included 26 species, 2 genera, 4families, 2 orders and 2 classes. ANOSIM testsproduce Global R statistics with values rangingbetween 1 and )1. Values closer to 1 indicategreater community dissimilarity among groupsthan within, while values closer to )1 indicate lessdissimilarity among groups than within. We fol-lowed ANOSIM analyses with similarities per-centage breakdown analyses (SIMPER) todetermine which taxa were contributing most togroupings observed among samples. Once key taxawere identified, we examined the magnitude ofvariation in abundance with one-way ANOVAs,
followed by Tukey post hoc comparisons. We thenconstructed non-metric multi-dimensional scaling(MDS) plots to illustrate dissimilarity amonggroups. All community structure analyses wereconducted using Primer� Version 5.2.9.
Results
Small fish density
Densities of small fishes varied among canal studysites and this variation differed between samplingseasons (Table 1). On average, small fishes wereleast abundant in the proximity of the L29 canaland most abundant in marshes bordering theC111, I75 and L28 canals (9 vs. 34 fish m)2) (Tu-key pairwise comparisons, all p=0.0001). Overall,densities increased between the wet and dry season(21 vs. 31 fish m)2), but there was large variationin the magnitude and direction of this seasonaleffect among canals. Compared to the wet seasondata, small fish density increased by 200% in theC111, 100% in the L28 and 40% in the L29 canalin the dry season (p<0.08). In contrast, densitydecreased by 50% in the L67 canal (p=0.009) andremained unchanged at the I75 site. Density alsovaried as a function of distance from canals andthis effect was greatest in the dry season and canal-specific (Fig. 2a). In the wet season, a distanceeffect was only detected at the C111 site; there was
Table 1. Summary of results of nested ANOVAs and ANCOVAs testing the effect of season, canal, distance, disturbance and relevant
covariates on small fish and macroinvertebrate densities and large fish CPUE and testing effect of canal, distance and disturbance on
TP concentration in the floc layer
Source of variation Small fish Macroinvertebrate Large fish Floc total
phosphorus
df F p df F p df F P df F p
Season 1, 85 5.7 0.0188 1, 89 76.9 0.0001 1, 41 274.1 0.0001
Canal 4, 103 54.6 0.0001 4, 107 19.2 0.0001 4, 48 7.4 0.0001 4, 116 31.1 0.0001
Distance (Canal) 20, 92 9.9 0.0001 20, 96 14.0 0.0001 19, 46 15.5 0.0001 17, 116 26.9 0.0001
Disturbance [Distance (Canal)] 20, 91 5.8 0.0001 20, 95 7.0 0.0001 20, 45 3.5 0.0003 17, 116 10.2 0.0001
Season � Canal 4, 87 10.5 0.0001 4, 91 4.9 0.0013 4, 41 5.4 0.0014
Season � Distance (Canal) 19, 84 2.8 0.0007 19, 88 3.1 0.0002 15, 41 9.2 0.0001
Season � Disturbance [Distance (Canal)] 17, 84 1.8 0.0399 17, 89 3.1 0.0003 17, 41 1.7 0.0935
Plant density 1, 167 11.1 0.001 1, 167 42.6 0.0001
Periphyton volume 1, 167 8.0 0.0054 1, 167 2.25 0.1356
363
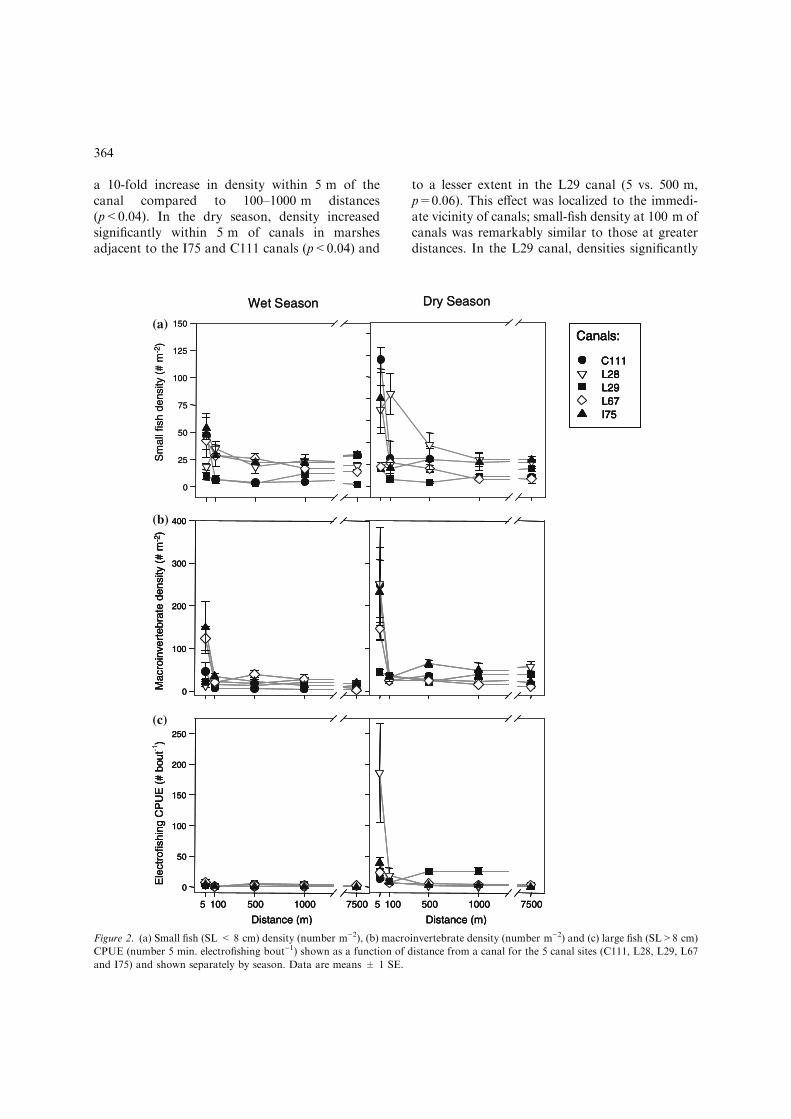
a 10-fold increase in density within 5 m of thecanal compared to 100–1000 m distances(p<0.04). In the dry season, density increasedsignificantly within 5 m of canals in marshesadjacent to the I75 and C111 canals (p<0.04) and
to a lesser extent in the L29 canal (5 vs. 500 m,p=0.06). This effect was localized to the immedi-ate vicinity of canals; small-fish density at 100 m ofcanals was remarkably similar to those at greaterdistances. In the L29 canal, densities significantly
Mac
roin
vert
ebra
te d
ensi
ty (
# m
-2)
0
100
200
300
400
Distance (m)
5 100 500 1000 7500
Ele
ctro
fishi
ng C
PU
E (
# bo
ut-1
)
0
50
100
150
200
250
Distance (m)
5 100 500 1000 7500
Wet Season
Sm
all f
ish
dens
ity(#
m-2
)
0
25
50
75
100
125
150
Dry Season
C111L28L29L67I75
Canals:
Mac
roin
vert
ebra
te d
ensi
ty (
# m
-2)
0
100
200
300
400
Mac
roin
vert
ebra
te d
ensi
ty (
# m
-2)
0
100
200
300
400
Distance (m)
5 100 500 1000 7500
Ele
ctro
fishi
ng C
PU
E (
# bo
ut)
0
50
100
150
200
250
Distance (m)
5 100 500 1000 7500
Distance (m)
5 100 500 1000 7500
Ele
ctro
fishi
ng C
PU
E (
# bo
ut)
0
50
100
150
200
250
Distance (m)
5 100 500 1000 7500
Wet Season
Sm
all f
ish
dens
ity(#
m-2
)
0
25
50
75
100
125
150
Dry Season
C111L28L29L67I75
Canals:
C111L28L29L67I75
C111L28L29L67I75
Canals:Canals:(a)
(b)
(c)
Figure 2. (a) Small fish (SL < 8 cm) density (number m)2), (b) macroinvertebrate density (number m)2) and (c) large fish (SL>8 cm)
CPUE (number 5 min. electrofishing bout)1) shown as a function of distance from a canal for the 5 canal sites (C111, L28, L29, L67
and I75) and shown separately by season. Data are means ± 1 SE.
364

increased at 100 m, but not 5 m (100 vs. 500 m,p=0.002). The L67 site was the only canal wheredry-season density did not vary as a function ofdistance from the canal (Fig. 2a). Few effects ofanthropogenic disturbance on small-fish densitywere detected. Differences between the airboattrail and adjacent undisturbed marsh were onlydetected in the I75 and L28 canals and only at 3 ofthe 10 distances sampled. In all three instances,density was higher in the airboat trail (p<0.08;50–500% difference). Small-fish density was posi-tively correlated to emergent macrophyte stemdensity, but negatively correlated to periphytonvolume (Table 1).
Macroinvertebrate density
Similar to the small fish, macroinvertebrate densityvaried among canal sites, with the lowest densitiesin the immediate proximity of the L29 canal(p<0.04). Overall, density varied with season andmore than tripled in the dry season compared tothe wet season (20 vs. 69 macroinvertebrates m)2).However, the magnitude of the seasonal effect wascanal-specific (Table 1); density increased in thedry season in the C111, L28 and L29 canals(p<0.003), but remained the same in the I75 andL67 canals. Density of macroinvertebrates variedmarkedly with distance from a canal. Most of thedistance variation was observed in the dry seasonand as seen in the small fish data it was particu-larly evident between the 5 m and all greater dis-tances (Fig. 2b). Only in the L67 canal did densityvary as a function of distance during the wet sea-son. Density within 5 m of the L67 canal was 5times higher than at greater distances (p<0.005,except for 5 vs. 500 m, p=0.85). At four canaltransects, C111, I75, L67 and L28, dry-seasonmacroinvertebrate density was 8 times higherwithin 5 m of the canal than at greater distances(p<0.05). No distance effect was detected at theL29 canal transects. Disturbance affected macro-invertebrate density only in the proximity of canalsand only in a subset of sites, particularly the I75and L28 canals. At 5 m, density was higher in theairboat trail than the undisturbed marsh (I75,p=0.0001; L28, p=0.005). Macroinvertebratedensity in our samples was positively related toemergent macrophyte stem density, but unrelatedto periphyton volume (Table 1).
Large fish CPUE
Differences among canals in electrofishing CPUEvaried between seasons (Table 1). Overall, CPUEincreased sharply at all sites in the dry season,from an average of 2 in the wet season to21 fish bout)1. In the wet season, CPUE washighest in the L67 canal and lowest in the C111canal (p=0.005). In the dry season, only the L29and I75 canals differed (17 vs. 11 fish bout)1,p=0.0002). A gradient in CPUE as a function ofdistance was only detected in the dry season, butthe effect was consistent for the 4 canals sampledfully (no data at distances greater than 5 m wereavailable for the C111 canal) (Fig. 2c). The moststriking effect was the increase in CPUE within5 m detected in the I75 and L28 canals (5 vs.other distances, all p<0.01). CPUE averaged 3and 7 fish bout)1 at 100–7500 m in the I75 andL28 canals respectively, but increased to 39 and186 fish bout)1 within 5 m of canals. In the L29canal, the effect of the canal was seen as far as1000 m away. Dry-season CPUE averaged 19 fishin the 5–1000 m range, but was only 2 fish bout)1
at the inner-marsh site (p<0.04). Less variationin CPUE was detected at the L67-canal transect,although variation was in the same direction;catches were higher close to the canal (5 vs.1000 m, p=0.02). Disturbance only affectedCPUE in the L28 canal and the effect was onlydetected at 5 m; CPUE at 5 m averaged147 fish bout)1 in the airboat trail, but only43 fish bout)1 in the undisturbed marsh(p=0.06).
Nutrient gradient
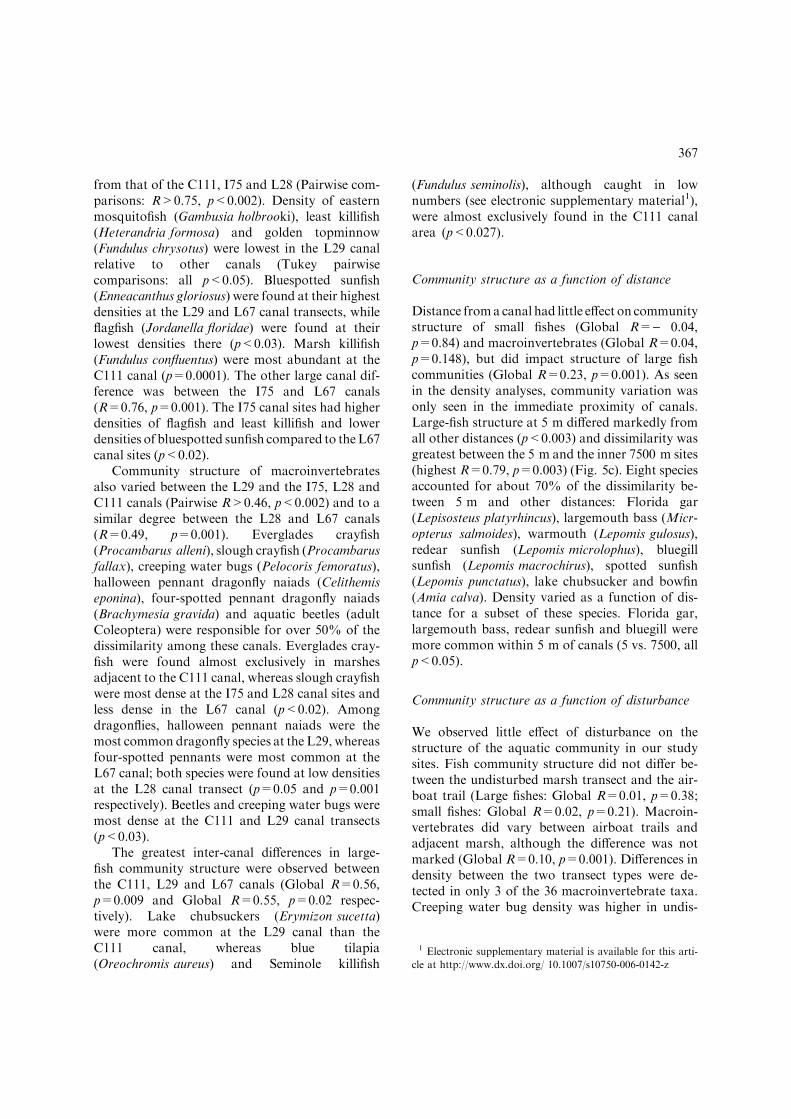
Floc TP concentration varied significantly amongcanal sites (Fig. 3).Mean concentrationwas highestin marshes along the L28 canal (1113.4 lg g)1),intermediate for the L29, L67 and I75 canal sites(816.1 lg g)1) and lowest along the C111 canal(412.4 lg g)1) (p<0.05). Concentrations varied asa function of distance in all canal sites (Table 1)except the C111, although only two distances wereavailable for this canal (5 vs. 7500 m, p=1.000). Inthe other four sites, concentrations increased by50% within 5 m of canals (5 vs. all other distances,p<0.006). Interestingly, concentrations at 7500 mwere very similar to concentrations in the 100–
365
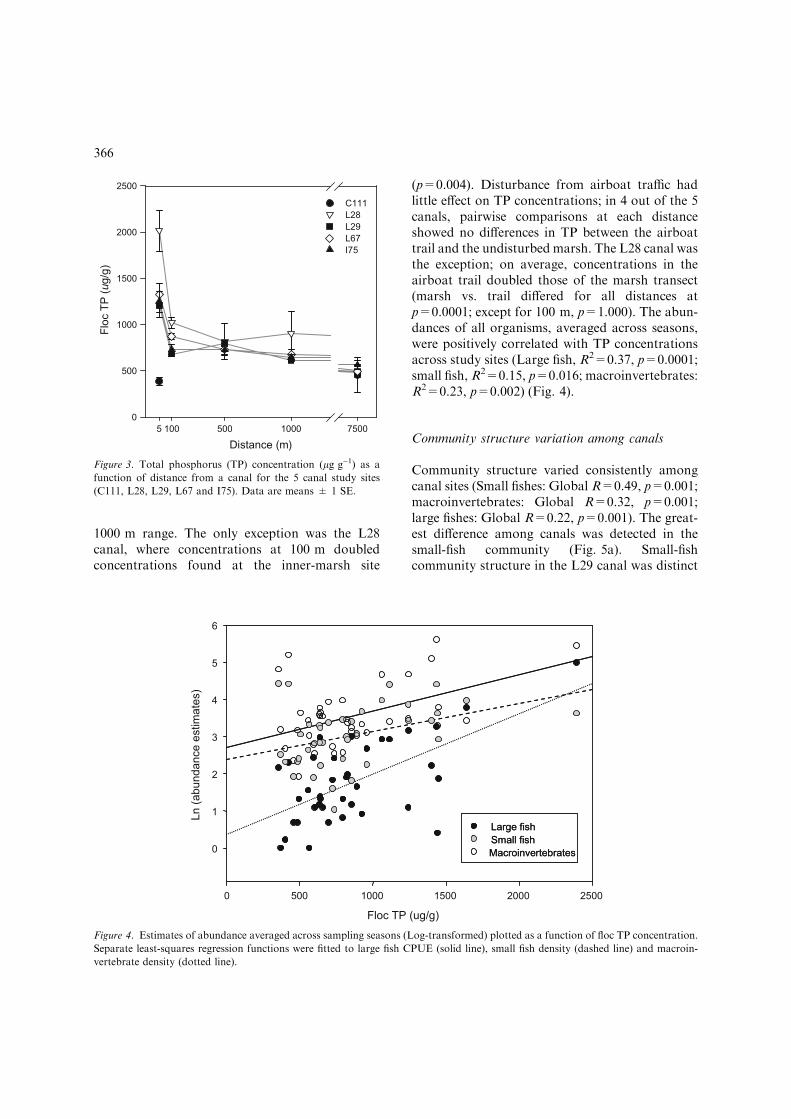
1000 m range. The only exception was the L28canal, where concentrations at 100 m doubledconcentrations found at the inner-marsh site
(p=0.004). Disturbance from airboat traffic hadlittle effect on TP concentrations; in 4 out of the 5canals, pairwise comparisons at each distanceshowed no differences in TP between the airboattrail and the undisturbed marsh. The L28 canal wasthe exception; on average, concentrations in theairboat trail doubled those of the marsh transect(marsh vs. trail differed for all distances atp=0.0001; except for 100 m, p=1.000). The abun-dances of all organisms, averaged across seasons,were positively correlated with TP concentrationsacross study sites (Large fish, R2=0.37, p=0.0001;small fish, R2=0.15, p=0.016; macroinvertebrates:R2=0.23, p=0.002) (Fig. 4).
Community structure variation among canals
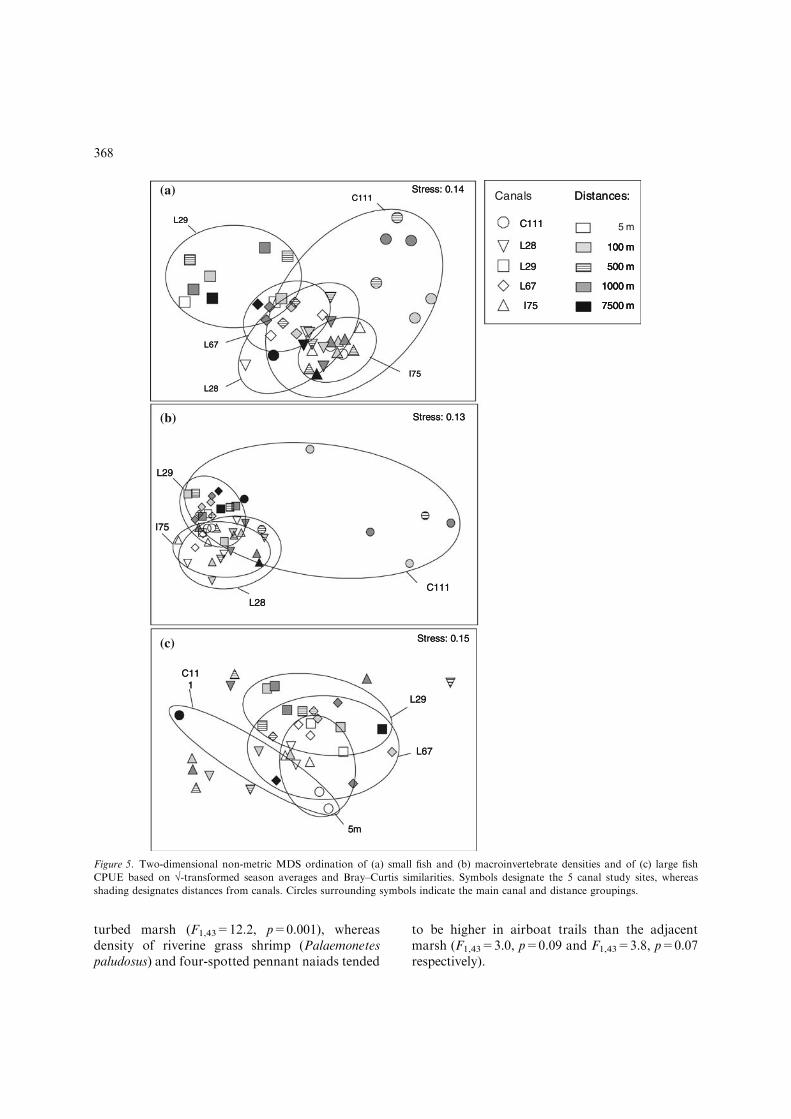
Community structure varied consistently amongcanal sites (Small fishes: Global R=0.49, p=0.001;macroinvertebrates: Global R=0.32, p=0.001;large fishes: Global R=0.22, p=0.001). The great-est difference among canals was detected in thesmall-fish community (Fig. 5a). Small-fishcommunity structure in the L29 canal was distinct
Distance (m)
5 100 500 1000 7500
Flo
c T
P (u
g/g
)
0
500
1000
1500
2000
2500
C111
L28
L29
L67
I75
Figure 3. Total phosphorus (TP) concentration (lg g)1) as a
function of distance from a canal for the 5 canal study sites
(C111, L28, L29, L67 and I75). Data are means ± 1 SE.
Floc TP (ug/g)
0 500 1500 2000 2500
Ln (
abundance e
stim
ate
s)
0
1
2
3
4
5
6
Large fish
Small fish
Macroinvertebrates
1000
Large fish
Small fish
Macroinvertebrates
Figure 4. Estimates of abundance averaged across sampling seasons (Log-transformed) plotted as a function of floc TP concentration.
Separate least-squares regression functions were fitted to large fish CPUE (solid line), small fish density (dashed line) and macroin-
vertebrate density (dotted line).
366
from that of the C111, I75 and L28 (Pairwise com-parisons: R>0.75, p<0.002). Density of easternmosquitofish (Gambusia holbrooki), least killifish(Heterandria formosa) and golden topminnow(Fundulus chrysotus) were lowest in the L29 canalrelative to other canals (Tukey pairwisecomparisons: all p<0.05). Bluespotted sunfish(Enneacanthus gloriosus) were found at their highestdensities at the L29 and L67 canal transects, whileflagfish (Jordanella floridae) were found at theirlowest densities there (p<0.03). Marsh killifish(Fundulus confluentus) were most abundant at theC111 canal (p=0.0001). The other large canal dif-ference was between the I75 and L67 canals(R=0.76, p=0.001). The I75 canal sites had higherdensities of flagfish and least killifish and lowerdensities of bluespotted sunfish compared to theL67canal sites (p<0.02).
Community structure of macroinvertebratesalso varied between the L29 and the I75, L28 andC111 canals (Pairwise R>0.46, p<0.002) and to asimilar degree between the L28 and L67 canals(R=0.49, p=0.001). Everglades crayfish(Procambarus alleni), slough crayfish (Procambarusfallax), creeping water bugs (Pelocoris femoratus),halloween pennant dragonfly naiads (Celithemiseponina), four-spotted pennant dragonfly naiads(Brachymesia gravida) and aquatic beetles (adultColeoptera) were responsible for over 50% of thedissimilarity among these canals. Everglades cray-fish were found almost exclusively in marshesadjacent to the C111 canal, whereas slough crayfishwere most dense at the I75 and L28 canal sites andless dense in the L67 canal (p<0.02). Amongdragonflies, halloween pennant naiads were themost common dragonfly species at the L29, whereasfour-spotted pennants were most common at theL67 canal; both species were found at low densitiesat the L28 canal transect (p=0.05 and p=0.001respectively). Beetles and creeping water bugs weremost dense at the C111 and L29 canal transects(p<0.03).
The greatest inter-canal differences in large-fish community structure were observed betweenthe C111, L29 and L67 canals (Global R=0.56,p=0.009 and Global R=0.55, p=0.02 respec-tively). Lake chubsuckers (Erymizon sucetta)were more common at the L29 canal than theC111 canal, whereas blue tilapia(Oreochromis aureus) and Seminole killifish
(Fundulus seminolis), although caught in lownumbers (see electronic supplementary material1),were almost exclusively found in the C111 canalarea (p<0.027).
Community structure as a function of distance
Distance froma canal had little effect on communitystructure of small fishes (Global R=) 0.04,p=0.84) and macroinvertebrates (Global R=0.04,p=0.148), but did impact structure of large fishcommunities (Global R=0.23, p=0.001). As seenin the density analyses, community variation wasonly seen in the immediate proximity of canals.Large-fish structure at 5 m differed markedly fromall other distances (p<0.003) and dissimilarity wasgreatest between the 5 m and the inner 7500 m sites(highest R=0.79, p=0.003) (Fig. 5c). Eight speciesaccounted for about 70% of the dissimilarity be-tween 5 m and other distances: Florida gar(Lepisosteus platyrhincus), largemouth bass (Micr-opterus salmoides), warmouth (Lepomis gulosus),redear sunfish (Lepomis microlophus), bluegillsunfish (Lepomis macrochirus), spotted sunfish(Lepomis punctatus), lake chubsucker and bowfin(Amia calva). Density varied as a function of dis-tance for a subset of these species. Florida gar,largemouth bass, redear sunfish and bluegill weremore common within 5 m of canals (5 vs. 7500, allp<0.05).
Community structure as a function of disturbance
We observed little effect of disturbance on thestructure of the aquatic community in our studysites. Fish community structure did not differ be-tween the undisturbed marsh transect and the air-boat trail (Large fishes: Global R=0.01, p=0.38;small fishes: Global R=0.02, p=0.21). Macroin-vertebrates did vary between airboat trails andadjacent marsh, although the difference was notmarked (Global R=0.10, p=0.001). Differences indensity between the two transect types were de-tected in only 3 of the 36 macroinvertebrate taxa.Creeping water bug density was higher in undis-
1 Electronic supplementary material is available for this arti-
cle at http://www.dx.doi.org/ 10.1007/s10750-006-0142-z
367
turbed marsh (F1,43=12.2, p=0.001), whereasdensity of riverine grass shrimp (Palaemonetespaludosus) and four-spotted pennant naiads tended
to be higher in airboat trails than the adjacentmarsh (F1,43=3.0, p=0.09 and F1,43=3.8, p=0.07respectively).
Stress: 0.14
L29
I75
L67
L28
C111Stress: 0.14
L29
I75
L67
L28
C111
Stress: 0.13
C111
L29
L28
I75
Stress: 0.13
C111
L29
L28
I75
Stress: 0.15
5m
L29
L67
C111
Stress: 0.15
5m
L29
L67
C111
C111
I75
L28
L29
L67
100 m
500 m
7500 m
1000 m
Ca ls Distances:
C111
I75
L28
L29
L67
100 m
500 m
7500 m
1000 m
5 m
100 m
500 m
7500 m
1000 m
na Distances:(a)
(b)
(c)
Figure 5. Two-dimensional non-metric MDS ordination of (a) small fish and (b) macroinvertebrate densities and of (c) large fish
CPUE based on �-transformed season averages and Bray–Curtis similarities. Symbols designate the 5 canal study sites, whereas
shading designates distances from canals. Circles surrounding symbols indicate the main canal and distance groupings.
368
Discussion
Water control structures, levees and canals havebecome ubiquitous features in aquatic ecosystems.Inmany cases, thesemay not be practically removedbecause of present-day requirements for floodcontrol in human-dominated landscapes, even insystems undergoing restoration. In the Everglades,restoration efforts call for the removal of only 380 ofthe more than 2500 km of canals and levees thatpresently control the amount, extent and timing ofwater delivery (CERP, 1999). Understanding howthese man-made features affect the structure ofaquatic communities and ecosystem processes is acritical component of understanding the ecology ofthis ecosystem. Our sampling found evidence of aneffect of man-made canals on the abundance ofaquatic organisms inhabiting nearby marshes, butlittle effect on their community structure. Previousstudies conducted in the northern Everglades havedocumented changes in community structure withdistance from canals in both vegetation (King et al.,2004) and macroinvertebrate communities(McCormick et al., 2004). In our study, distancefrom a canal consistently affected patterns ofabundance in the macroinvertebrate, small fish andlarge fish communities, but only over short dis-tances. In all three cases, density increased withinthe immediate proximity of canals (5 m), whilecommunities at 100 m or greater distances wereremarkably similar to those found in interior mar-shes.
The increases in the density of all aquaticgroups (both small prey and large predatory spe-cies) in marshes adjacent to canals matches thespatial pattern of P enrichment, suggesting a rolefor resource stimulation provided by canals. FlocTP increased sharply within 5 m of canals in allcases except the southern-most canal, the C111. Inthis area, soils are marly and have lower organicmatter content than the peat soils found in theother four study sites. These soils typically havelower P content when reported on a per-weightbasis (Harris & Hurt, 1999). Gradients of nutrientenrichment as a function of distance from canalshave been reported over much greater distancesthan those found in this study (Doren et al., 1997;Childers et al., 2003). For instance, Childers et al.(2003) reports exponential increases in soil P up to4 km from a canal in high enrichment canals and
less than 0.5 km in low enrichment canals includ-ing areas in the proximity of our L29 site.
Increases in nutrient levels can result in changesin patterns of abundance and species compositionacross multiple trophic levels. However, boththeoretical and empirical evidence show that theseresponses may be varied and unpredictable (Pow-er, 1992; Abrams, 1993) and strongly dependenton food-web structure (Leibold & Wilbur, 1992).In the Everglades, multiple effects have been re-ported in response to anthropogenic P enrichment.Even at low concentrations of TP, persistentphosphorus loading alters periphyton communitycomposition and mats eventually collapse (Gaiseret al., 2005). In the plant community, stem densityand/or biomass of macrophytes may increase inresponse to persistent low-concentration Penrichment (Daoust & Childers, 2004; Gaiseret al., 2005). High levels of P-loading lead to thereplacement of both periphyton and macrophytesby monocultures of cattail Typha domingensis(Davis, 1994; Doren et al., 1997).
In our study, the abundance of all groups,including large predators, was positively correlatedto P enrichment levels. However, previous studieshave reported both positive and negative relation-ships between primary-consumer density and Plevels. Increases in the abundance and diversity ofsmall fishes and macroinvertebrates have been re-ported along natural productivity gradients inmarshes (Turner et al., 1999; Trexler et al., 2002).In response to anthropogenic P enrichment, Turneret al. (1999) reported higher standing stocks(dry mass m)2) of small fish in P-enriched sitesnear canal inflows (<3 km), but no difference ininvertebrate standing stocks. Rader & Richardson(1994) reported greater densities and species rich-ness of both small fishes and invertebrates inP-enriched sites in the northern Everglades, butcomparable trophic structure. McCormick et al.(2004) documented both increases and decreases inmacroinvertebrate densities in enriched sitesdepending on the microhabitat sampled, accom-panied by large compositional changes and somefunctional changes. Gaiser et al. (2005) reportedcomplex responses in fish biomass that weredependent on dosing level and time since dosingwas initiated.
Our data showed that sharp increases in thedensity of aquatic organisms within 5 m from
369

canals were more prevalent in the dry season. Thisseasonal pattern suggests that canals act as dry-down refugia for both large and small aquaticorganisms. These dry-season effects were detectedeven in marshes with long hydroperiods and thatdid not dry in the year of our study. Marsh animalsmay be altering habitat use to move toward canalseither in anticipation of dropping water levels or inresponse to other physiological requirements (i.e.,mating, foraging) or stresses (i.e., decreased waterquality). Previous research has reported a similaraccumulation of predatory fishes in alligator holesin years when marsh levels drop below 30 cm(Kushlan, 1974; Nelson & Loftus, 1996; Trexleret al., 2002). Even in long-hydroperiod marshesthat rarely dry and where direct mortality due todry-down conditions is unlikely, predator densitiesdecrease significantly in the open marsh during thedry season, further suggesting movements intodeep-water refugia (Chick et al., 2004). Radiote-lemetry data demonstrate that Florida gar movelong distances (>10 km) in response to drops inwater level (J. Trexler, unpublished data). Geneticanalyses indicate that spotted sunfish are morehomogeneous in canals than in interior-marshalligator ponds, possibly from increased mixingresulting from dry-season colonization from manysources and/or high dispersal within canals(McElroy et al., 2002).
Fluctuations of the hydrology of aquatic sys-tems strongly affect fish and macroinvertebratepopulations (Snodgrass et al., 1996; Corti et al.,1997). The hydrologic pattern of recurrent droughtof Everglades marshes is a strong limiting factor onthe abundance of aquatic organisms living there(Loftus & Eklund, 1994; Ruetz et al., 2005; Trexleret al., 2005), particularly on long-lived (i.e., large)fishes (Chick et al., 2004). Standing stocks of fishare relatively low compared to other wetlands(Turner et al., 1999). Disturbance from seasonaldrying and from more severe drought events areknown to cause significant fish mortality (Kushlan,1974; Nelson & Loftus, 1996). Access to dry-seasonrefuges is thought to be a key factor affecting sur-vival and overall population dynamics (DeAngeliset al., 1997). Increased water permanence providedby canals may lessen the limiting effect of hydrol-ogy on fish populations, at least at the local scale.
Few compositional changes in the aquaticcommunities sampled were detected as a function
of distance from canals. Most of the communityvariation was detected among canal sites and weconsider this variation to reflect regional differ-ences resulting from gradients in hydroperiod andproductivity, as well as water management prac-tices (Chick et al., 2004). We detected somecompositional changes in the predatory fish com-munity and we suspect they indicate differencesamong large fishes in either their preference orability to find suitable habitat in canals. Canalsprovide larger and deeper open-water habitats thanthose found naturally in the ecosystem (Gunderson& Loftus, 1993), but habitat quality could be low.Most of the open water habitat of South Floridacanals appears to be underutilized by fishes and thelack of structural complexity can diminish recruit-ment (Annett, 1998). On the other hand, the lack ofhabitat complexity may increase the foraging effi-ciency of predators (Crowder & Cooper, 1982;Savino & Stein, 1989), although large numbers ofprey are typically absent from the open-water areasof canals (Fury et al., 1996) except in dry seasonswhen marshes are completely dried.
If high rates of predation are occurring close tocanals, the effect appears overcompensated bystimulation of increased secondary productivity bynutrient enrichment and immigration toward areasadjacent to canals in the dry season. Theory pre-dicts predator effects to be relatively weak in fre-quently-disturbed habitats (Menge & Sutherland,1987). Kushlan (1976) suggested that Evergladesfish predators have an effect on prey densities onlywhen the frequency of dry-down events is low.Trexler et al. (2005) showed that predator regula-tion may occur in regions of the ecosystem wherethe frequency of dry-down is very low (every 10–20 years), such as WCA3A. If canals decrease thefrequency of disturbance, at least locally, strongerpredator effects may be expected, which were notdetected in our study. However, lack of anapparent predatory effect at high predator densi-ties close to canals does not negate the role ofpredation because sampling data only indicate netpatterns in population dynamics.
Off-road vehicles (ORV) are known to nega-tively affect vegetation and soils in Evergladeshabitats (NPS, 2000; Welch et al., 2002). ORV use,including the use of airboats, has resulted inalterations of flow patterns, soil displacement andplant community compositional changes. In our
370

study, disturbance from airboat trails had some ef-fects on densities of aquatic organisms, althougheffects were limited to short distances from canals.In cases where differences were detected, greaternumbers of fishes and macroinvertebrates were de-tected in airboat trails than in undisturbedmarshes.We suspect these effects relate to variation in habitatquality.Althoughwe did not detect large differencesin stem density, differences in plant communitystructure (higher numbers of water lilies such asNymphaea spp at 5 m from canals) and lowerperiphyton volumes made trails more open habitatsthat may be preferred by large fish species. Radio-telemetry surveys suggest that large fishes dispersethrough marshes using trails (Trexler et al. unpub-lished data). Trails had highly disturbed sedimentsand were slightly deeper than undisturbed marshes.This suspension of floc could also make them pre-ferred foraging grounds for detritivores.
This study has important implications for effortsto assess the impact of canals in the Everglades. Ourresults indicate that canal effects are multifacetedand not easily ascertained by net patterns of popu-lation density. Canals affect immigration, resourceavailability and predatory consumption simulta-neously in complex patterns. The net effect of canalsappears to be limited to their immediate vicinity ifthey are not delivering nutrient-enriched waterconsistently over time. However, this may maskgeneral effects of canals if their impact as refuges forlarge predatory fishes is spread throughout theecosystem by relatively long-distance dispersal inthe wet season. Further research into movementpatterns of these fishes, along with experimentalanalysis of their impacts, is required to further elu-cidate results from this study.
Acknowledgements
We thank B. Shamblin, R. Urgelles, E. Grumbachand A. Gonzalez for their field and laboratoryassistance.We thank S. E. Liston, K. J. Dunker andtwo reviewers, whose comments greatly improvedthis manuscript. This project was supported byCooperative Agreement H5281-02-A0C1 betweenFlorida International University and EvergladesNational Park and through funding to the FloridaCoastal Everglades (FCE) Long-term EcologicalResearch program (National Science Foundation
grant no. 9910514). This is contribution (305 of theSoutheast Environmental Research Center atFlorida International University.
References
Abrams, P. A., 1993. Effects of increased productivity on the
abundances of trophic levels. American Naturalist 141: 351–
371.
Annett, C. A., 1998. Hunting behavior of Florida largemouth
bass, Micropterus salmoides floridanus, in a channelized riv-
er. Environmental Biology of Fishes 53: 75–87.
Bedford, B. L. & E. M. Preston (eds), 1998. Cumulative effects
on landscape system of wetlands: scientific status, prospects
and regulatory perspectives. Environmental Management
12: 561–775.
Bronmark, C. & L. -A. Hansson, 2002. Environmental issues in
lakes and ponds: current state and perspectives. Environ-
mental Conservation 29: 290–306.
Clarke, K. R. & R. M. Warwick, 2001. Changes in Marine
Communities: An Approach to Statistical Analyses and
Interpretation (2nd edn.). National Environmental Research
Council, Plymouth Marine Laboratory, Plymouth, UK.
Comprehensive Everglades Restoration Plan (CERP), 1999.
U.S. Army Corps of Engineers and South Florida Water
Management District. Jacksonville FL. (www.everglades-
plan.org/pub/restudy_eis.cfm(main report).
Chick, J. H., S. Coyne & J. C. Trexler, 1999. Effectiveness of
airboat electrofishing for sampling fishes in shallow vege-
tated habitats. North American Journal of Fisheries Man-
agement 19: 957–967.
Chick, J. H., C. R. Ruetz & J. C. Trexler, 2004. Spatial scale and
abundance patterns of large fish communities in freshwater
marshes of the Florida Everglades. Wetlands 24: 652–664.
Childers, D. L., R. F. Doren, R. Jones, G. B. Noe, M. Rugge &
L. J. Scinto, 2003. Decadal changes in vegetation and soil
phosphorus pattern across the Everglades landscape. Journal
of Environmental Quality 32: 344–362.
Corti, D., S. L. Kohler & R. E. Sparks, 1997. Effects of hy-
droperiod and predation on a Mississippi River floodplain
invertebrate community. Oecologia 109: 154–165.
Crowder, L. B. & W. E. Cooper, 1982. Habitat structural
complexity and the interaction between bluegill and their
prey. Ecology 63: 1802–1813.
Daoust, R. J. & D. L. Childers, 2004. Ecological effects of low-
level phosphorus additions on two plant communities in a
neotropical freshwater wetland ecosystem. Oecologia 141:
672–686.
Davis, S. M., 1994. Phosphorus inputs and vegetation sensi-
tivity in the Everglades. In Davis, S. M. & J. C. Ogden (eds),
Everglades: the System and its Restoration. St. Lucie Press,
Delray Beach FL, 357–378.
Davis, S. M., L. H. Gunderson, W. A. Park, J. R. Richardson
& J. E. Mattson, 1994. Landscape dimension, composition
and function in a changing Everglades ecosystem. In Davis,
S. M. & J. C. Ogden (eds), Everglades: The System and its
Restoration. St. Lucie Press, Delray Beach FL, 419–444.
371
DeAngelis, D. L., W. F. Loftus, J. C. Trexler & R. E. Ula-
nowicz, 1997. Modeling fish dynamics in a hydrologically
pulsed ecosystem. Journal of Aquatic Ecosystem Stress and
Recovery 6: 1–13.
Doren, R. F., T. V. Armentano, L. D. Whiteaker & R. D.
Jones, 1997. Marsh vegetation patterns and soil phosphorus
gradients in the Everglades ecosystem. Aquatic Botany 56:
145–163.
Dynesius, M. & C. Nilsson, 1994. Fragmentation and flow
regulation of river systems in the northern third of the world.
Science 266: 753–762.
Fourqurean, J. W., J. C. Zieman & G. V. N. Powell, 1992.
Phosphorus limitation of primary production in Florida
Bay: evidence from the C:N:P ratios of the dominant sea-
grass Thalassia testudinum. Limnology and Oceanography
37: 162–171.
Frederick, P. C. & M. G. Spalding, 1994. Factors affecting
reproductive success of wading birds (Ciconiiformes) in the
Everglades ecosystem. In Davis, S. M. & J. C. Ogden (eds),
Everglades: The System and its Restoration. St. Lucie Press,
Delray Beach FL, 659–691.
Fury, J. R., J. D. Wiikert, J. Cimbaro & F. Morello, 1996.
Everglades Fisheries Investigations Project F56. Florida Fish
and Wildlife Conservation Commission Report, Vero Beach,
FL.
Gaiser, E. E., J. C. Trexler, J. H. Richards, D. L. Childers,
D. Lee, A. L. Edwards, L. J. Scinto, K. Jayachandran, G. B.
Noe & R. D. Jones, 2005. Cascading ecological effects of
low-level phosphorus enrichment in the Florida Everglades.
Journal of Environmental Quality 34: 1–8.
Gergel, S. E., 2002. Assessing cumulative impacts of levees and
dams on floodplain ponds: a neutral-terrain model
approach. Ecological Applications 12: 1740–1754.
Gunderson, L. H. & W. F. Loftus, 1993. The Everglades. In
Martin, W. H., S. G. Boyce & A. C. Echternacht (eds),
Biodiversity of the Southeastern United States: Lowland
Terrestrial Communities. John Wiley & Sons, New York
NY, 199–255.
Harris, W. & W. Hurt, 1999. Introduction to soils of subtrop-
ical Florida. In Reddy, K. R. et al. (eds), Phosphorus Bio-
geochemistry in Subtropical Ecosystems. Lewis, New York,
NY, 143–170.
Jordan, F., S. Coyne & J. C. Trexler, 1997. Sampling fishes in
vegetated habitats effects of habitat structure on sampling
characteristics of the 1)m2 throw trap. Transactions of the
American Fisheries Society 126: 1012–1020.
King, R. S., C. J. Richardson, D. L. Urban & E. A. Roman-
owicz, 2004. Spatial dependency of vegetation-environment
linkages in an anthropogenically influenced wetland ecosys-
tem. Ecosystems 7: 75–97.
Kushlan, J. A., 1974. Observations on the role of the American
alligator (Alligator mississippiensis) in the southern Florida
wetlands. Copeia 1974: 993–996.
Kushlan, J. A., 1976. Environmental stability & fish community
diversity. Ecology 57: 821–825.
Kushlan, J. A., 1981. Sampling characteristics of enclosure fish
traps. Transactions of the American Fisheries Society 110:
557–662.
Leibold, M. A. & H. M. Wilbur, 1992. Interactions between
food web structure and nutrients on pond organisms. Nature
360: 341–343.
Leibold,M.A., J.M. Chase, J. B. Shurin&A. L.Downing, 1997.
Species turnover and the regulation of trophic structure. An-
nual Review of Ecology and Systematics 28: 467–494.
Light, S. S. & J. W. Dineen, 1994. Water control in the Ever-
glades: a historical perspective. In Davis, S. M. & J. C.
Ogden (eds), Everglades: The System and its Restoration.
St. Lucie Press, Delray Beach FL, 47–84.
Littell, R. C., G. A. Milliken, W. W. Stroup & R. D. Wolfinger,
1996. SAS� System for Mixed Models. SAS Institute, Cary
NC.
Loftus, W. F. & J. A. Kushlan, 1987. Freshwater fishes of
southern Florida. Bulletin of the Florida State Museum –
Biological Sciences 31: 147–344.
Loftus, W. F. & A. M. Eklund, 1994. Long-term dynamics of
an Everglades fish community. In Davis, S. M. & J. C. Og-
den (eds), Everglades: The System and its Restoration. St.
Lucie Press, Delray Beach FL, 461–483.
McCormick, P. V., P. S. Rawlik, K. Lurding, E. P. Smith &
F. H. Sklar, 1996. Periphyton–water quality relationships
along a nutrient gradient in the northern Florida Everglades.
Journal of the North American Benthological Society 15:
443–449.
McCormick, P. V., R. E. Shuford & P. S. Rawlik, 2004.
Changes in macroinvertebrate community structure along a
phosphorus gradient in the Florida Everglades. Hydrobio-
logia 529: 113–132.
McElroy, T. C., L. L. Kandl, J. Garcia & J. C. Trexler, 2002.
Extinction-colonization dynamics structure genetic variation
of spotted sunfish (Lepomis punctatus) in the Florida Ever-
glades. Molecular Ecology 12: 355–368.
Menge, B. A. & J. P. Sutherland, 1987. Community regulation:
variation in disturbance, competition, and predation in re-
lation to environmental stress and recruitment. American
Naturalist 130: 730–757.
Naiman, R. J. & M. G. Turner, 2000. A future perspective on
North America’s freshwater ecosystems. Ecological Appli-
cations 10: 958–970.
Nelson, C. M. & W. F. Loftus, 1996. Effects of high-water
conditions on fish communities in Everglades alligator ponds.
In Armentano, T. V. (ed.), Proceedings of the 1996 Confer-
ence: Ecological Assessment of the 1994–1995 High Water
Conditions in the Southern Everglades. Florida International
University, Miami, FL, 22–23 August 1996: 89–101.
Noe, G. B., D. L. Childers & R. D. Jones, 2001. Phosphorus
biogeochemistry and the impact of phosphorus enrichment:
why is the Everglades so unique? Ecosystems 4: 603–624.
Noe, G. B., D. L. Childers, A. L. Edwards, E. Gaiser,
K. Jayachandran, D. Lee, J. Meeder, J. Richards, L. J.
Scinto, J. C. Trexler & R. D. Jones, 2002. Short-term
changes in phosphorus storage in an oligotrophic Everglades
wetland system receiving experimental nutrient enrichment.
Biogeochemistry 59: 239–267.
NPS (National Park Service), 2000. Final recreational off-road
vehicle management plan supplemental environmental
impact statement. U.S. National Park Service, Big Cypress
372
National Preserve, Ochopee, FL (http://www.nps.gov/bicy/
Bicy-018.htm).
NRC (National Research Council), 1992. Restoration of
Aquatic Ecosystems: Science, Technology and Public Policy.
National Academy Press, Washington DC.
Polis, G. A. & D. R. Strong, 1996. Food web complexity and
community dynamics. American Naturalist 147: 813–846.
Power, M. E., 1992. Top-down and bottom-up forces in food
webs: do plants have primacy. Ecology 73: 733–746.
Power, M. E., A. Sun, G. Parker, W. E. Dietrich & J. T.
Wootton, 1995. Hydraulic food-chain models. BioScience
45: 159–168.
Pringle, C. M., 2001. Hydrologic connectivity and the man-
agement of biological reserves: a global perspective. Eco-
logical Applications 11: 981–998.
Rader, R. B. & C. J. Richardson, 1994. Response of macroin-
vertebrates and small fish to nutrient enrichment in the
northern Everglades. Wetlands 14: 134–146.
Rosenberg, D. M., P. McCully & C. M. Pringle, 2000. Global-
scale environmental effects of hydrological alterations;
introduction. BioScience 50: 746–751.
Ruetz, C. R., J. C. Trexler, F. Jordan, W. F. Loftus & S. A.
Perry, 2005. Population dynamics of wetland fishes: spatio-
temporal patterns shaped by hydrological disturbance?
Journal of Animal Ecology 74: 322–332.
Sanchez-Carrillo, S. & M. Alvarez-Cobelas, 2001. Nutrient
dynamics and eutrophication patterns in a semi-arid wet-
land: the effects of fluctuating hydrology. Water, Air and
Soil Pollution 131: 97–118.
Savino, J. F. & R. A. Stein, 1989. Behavioral interactions be-
tween fish predators and their prey: effects of plant density.
Animal Behavior 37: 311–321.
Schneider, D. W. & T. M. Frost, 1996. Habitat duration and
community structure in temporary ponds. Journal of the
North American Benthological Society 15: 64–86.
Skelly, D. K., E. E. Werner & S. A. Cortwright, 1999. Long-
term distributional dynamics of a Michigan amphibian
assemblage. Ecology 80: 2326–2337.
Snodgrass, J. W., A. L. Bryan, R. F. Lide & G. M. Smith, 1996.
Factors affecting the occurrence and structure of fish as-
semblages in isolated wetlands of the upper coastal plain,
USA. Canadian Journal of Fisheries and Aquatic Sciences
53: 443–454.
Trexler, J. C., W. F. Loftus, C. F. Jordan, J. H. Chick, K. L.
Kandl, T. C. McElroy & O. L. Bass, 2002. Ecological scale
and its implications for freshwater fishes in the Florida
Everglades. In Porter, J. W. & K. G. Porter (eds), The
Everglades, Florida Bay and Coral Reefs of the Florida
Keys: An Ecosystem Sourcebook. CRC Press, Boca Raton
FL, 153–181.
Trexler, J. C., W. F. Loftus, F. Jordan, J. Lorenz, J. H. Chick &
R. M. Kobza, 2001. Empirical assessment of fish introduc-
tions in a subtropical wetland: an evaluation of contrasting
views. Biological Invasions 2: 265–277.
Trexler, J. C., W. F. Loftus & S. Perry, 2005. Hydrological
limitation of Everglades fish communities by a twenty-five
year intervention study. Oecologia Online first: DOI:
10.1007/s00442-005-0094-4.
Turner, M. G., S. R. Carpenter, E. J. Gustafson, R. J. Naiman
& S. M. Pearson, 1998. Land use. In Mac, J., P. A. Opler, P.
Doran & C. Haecker (eds), Status and Trends of our Na-
tion’s Biological Resources. 1 National Biological Service,
Washington DC, 37–61.
Turner, A. M., J. C. Trexler, F. Jordan, S. J. Slack, P. Geddes,
J. Chick & W. F. Loftus, 1999. Targeting ecosystem features
for conservation: standing crops in the Florida Everglades.
Conservation Biology 13: 898–911.
Welch, R., M. Madden & B. Doren, 2002. Maps and GIS da-
tabases for environmental studies of the Everglades. In
Porter, J. W. & K. G. Porter (eds), The Everglades, Florida
Bay and Coral Reefs of the Florida Keys, an Ecosystem
Sourcebook. CRC Press, Boca Raton FL, 259–279.
Wellborn, G. A., D. K. Skelly & E. E. Werner, 1996. Mecha-
nisms creating community structure across a freshwater
habitat gradient. Annual Review of Ecology and Systematics
27: 337–363.
Wilbur, H. M., 1980. Complex life cycles. Annual Review of
Ecology and Systematics 11: 67–93.
373