Embed Size (px)
Citation preview

1
Published as: Dupont, L. & Van Eetvelde, V. (2013).
Assessing the potential impacts of climate change on
traditional landscapes and their heritage values on the
local level: case studies in the Dender basin in Flanders,
Belgium. Land Use Policy, vol. 35, pp. 179-191.
Assessing the potential impacts of climate change
on traditional landscapes and their heritage values
on the local level: case studies in the Dender basin
in Flanders, Belgium
The Landscape Atlas of Flanders describes the traditional relic landscapes in Flanders
(Belgium), characterized by important heritage values and more specifically by natural-
scientific, historical, socio-cultural and aesthetic values. These heritage landscapes constitute
a considerable part of the common cultural heritage and are therefore managed by specific
landscape management plans. However, these plans do not address climate change
vulnerability and adaptation, while this is considered as an important driving force of
landscape change. This change may impact on the unaffected traditional character of heritage
landscapes and cause these valuable landscapes to deteriorate. In this study, we assess and
map the potential overall impact of climate change on two relic landscapes in Flanders and
map possible adaption measures on a detailed level to allow insertion in the landscape
management plans. Detailed synthesis vulnerability and adaptation maps are elaborated in a

2
GIS, based on the results of impact- and model studies. The vulnerability maps indicate that
both case studies are sensitive to climate change. In particular, forest desiccation, wind throw,
crop deterioration, soil erosion and flooding might affect the landscape quality and threaten
the natural-scientific, historical and aesthetic heritage values of the landscapes. In order to
preserve these heritage values, the adaptation maps present possible adaptation measures,
which are sustainable and non-destructive with respect to the landscape quality. Although
adaptation will cause change as well, it offers more chances to preserve the heritage values of
the landscapes. To be effective, detailed climate change vulnerability and adaptation maps
should be included in the binding landscape management plans.
Climate change; vulnerability; adaptation; landscape management; heritage landscapes;
GIS-analysis
1 INTRODUCTION
Like in most parts of the world, the climate in Belgium is changing. Measurements of the
Royal Meteorological Institute show an increase in the mean temperature of 2°C between
1833 and 2009 (Brouyaux et al., 2009). The Intergovernmental Panel on Climate Change
(IPCC, IVth
Assessment Report, 2007) predicts a further increase in the mean temperature
between 1.8 and 4.0°C by 2100 compared to 1990. Measurements of the total yearly
precipitation in Belgium have also shown a rising trend of +7% since 1910. Between 1833
and 2009, the mean winter precipitation rose by 15% (Brouyaux et al., 2009). Winter
precipitation is predicted to increase 3 to 50% by 2100, while in summer a decrease of up to
50% is estimated (Ntegeka et al., 2008). Moreover, evaporation will increase with higher
temperatures (Boukhris et al., 2008) and the water availability of soils will decrease,
especially in summer (Manabe et al., 2004). Finally, storms will become more frequent and
intense due to global warming (Frei et al., 2006). All these changes can be considered as

3
primary effects of climate change. Secondary effects are flooding and drought, which in turn
induce tertiary effects such as impacts on nature and agriculture, for example the extinction
of species as a result of drought. The combination of these effects can cause drastic changes
to landscapes, which are seen as quaternary effects (Pedroli et al., 2010).
So far, most studies on the impact of climate change have been sector-oriented (e.g. the EEA
Report (2008), the Stern Review (2007)) and have focused on above-country scale (Rannow
et al., 2010). The impact of climate change on the local level and landscapes, however, has
rarely been analysed. In particular, intact traditional, cultural landscapes deserve special
attention as these are part of our common heritage, like stated in the World Heritage
Convention (1972). According to this convention, ‘cultural landscapes’ are “at the interface
between nature and culture, tangible and intangible heritage, biological and cultural diversity
- they represent a closely woven net of relationships, the essence of culture and people’s
identity” (Rössler, 2006). Often, the management approach of such landscapes is oriented
towards preventing changes, like climate change. However, it would be more beneficial to
tackle inevitable changes, and thus reinforce the resilience of the system (Bieling et al., 2011;
Lemieux et al., 2011). Bieling et al. (2011) describe resilience as “the ability to deal with
disturbances or change without altering the essential characteristics of the system in
question”. This approach focuses on how to dynamically adapt to processes of breakdown
and renewal, rather than on conservation.
This paper follows the resilience approach and presents an integrated assessment of the
potential impact of climate change and the possible adaptation measures in two specific case
studies in Flanders. In particular, two traditional landscape relics, characterized by
considerable heritage values and differing in landscape type, were selected. Traditional
landscapes contribute to the cultural heritage value of a place as they are the combined result
of the natural capacities of an area and the human land occupation throughout history before

4
the end of the 18th
century (Antrop, 2003). The relics of Flanders’ traditional landscapes are
mapped in the Landscape Atlas, based on four heritage values: the natural-scientific,
historical, socio-cultural and aesthetic value. Each value is estimated by a set of concise
criteria: coherence (the strength of the relations between the composing elements of a
landscape or ensemble), legibility (the degree to which parts of a landscape or the whole
landscape structure can be recognized and understood) and soundness (degree of maintenance
and care of the landscape site or element). Based on this methodology, relic zones and anchor
places were identified (Antrop, 2003). Anchor places are small ensembles that consist of
different features related by a unique historical development, which form almost intact
landscape entities (Van Eetvelde and Antrop, 2005). Figure 1 provides an overview of the
anchor places in Flanders. These anchor places represent the most valuable landscapes of
Flanders concerning the cultural heritage, and constitute a considerable part of the remaining
common heritage. Therefore, they need special care and attention and an integrated landscape
management (Van Eetvelde et al., 2010). This is achieved by the implementation of a new
legislation by which anchor places can be designated as ‘heritage landscapes’. Following this
procedure each heritage landscape is attributed a landscape management plan and
management commission, including local stakeholders (Antrop and Van Eetvelde, 2007).
However, these plans, and spatial planning in general, are missing detailed vulnerability and
adaptation maps to limit the potential effects of climate change. To fill this gap, the threats
and risks that climate change presents for landscapes should be assessed using detailed local
vulnerability maps in order to outline adaptation plans and preserve the heritage values of the
landscapes in the anchor places from deterioration.
In this study, we took up this challenge for two anchor places in Flanders. The first case is
situated in the hilly east of the Dender basin; the second is located in the Dender valley
(Figure 1). The aim of the study consists of identifying which threats of climate change the

5
landscapes in both case studies are exposed to, based on the available knowledge from peer
reviewed and ‘grey’ literature, output from model studies and expert judgement. So far,
research about the potential effects of climate change in Belgium has been conducted by
different institutions, though mostly focussing on one specific aspect of climate change (e.g.
soil erosion, flooding etc., see Section 2). In our study, we attempt to synthesize this
information for the two case studies, giving an overview of the potential risks threatening
their landscapes as a result of climate change. Therefore, the knowledge obtained from
former impact studies is translated into detailed vulnerability maps, locating the risks and
threats. Furthermore, possible adaptation measures are determined and translated into
corresponding adaptation maps. The maps are produced using GIS-analysis, a method
recognized to have a large potential for vulnerability and adaptation assessment (Kasperson
and Kasperson, 2001).
2 BACKGROUND: PREDICTED EFFECTS OF CLIMATE CHANGE AND
POSSIBLE ADAPTATION MEASURES IN FLANDERS
In support of the vulnerability and adaptation maps we provide an overview of the predicted
effects of climate change in Flanders, which could have an impact on landscape, and
summarize a number of possible adaptation measures.
2.1 Forests
Higher evaporation due to higher temperatures combined with a decrease in summer
precipitation (Boukhris et al., 2008) may cause forests to desiccate. Especially forests located
on rich soils are vulnerable (Vos et al., 2007). In addition, desiccated trees are more sensitive
to forest fires (de Jonge, 2008) and new diseases and pests shifting northwards (De Groof et
al., 2006). As a consequence of more frequent and more intense storms, weakened forests

6
will also become more vulnerable to wind throw (Schlyter et al., 2006). Consequently, a more
effective forest management is required. This includes maximizing ecological diversity, e.g.
by introducing new tree species to face the new conditions (Dolman et al., 2000; Metzger et
al., 2008), replacing coniferous forests by deciduous forests as these are less prone to forest
fire (Veeneklaas, 2008) and strengthening the forest structure by connecting different forests
(Noss, 2001).
2.2 Surface water
Increasing winter precipitation associated with climate change will lead to higher peak flows
of rivers. During storms, this will increase the flood risk (Dolman et al., 2000), especially in
rivers of which the active floodplain has been strongly reduced as a result of flood levee
constructions such as dikes (Pedroli and Harms, 2002). Several measures can counter this by
increasing the water storage capacity: creating more space for rivers by restoring their natural
hydrodynamic function (Pedroli et al., 2002; Vos and Kuiters, 2007), broadening and/or
deepening ditches, safeguarding valleys from new buildings (de Jonge, 2008), constructing
water retention reservoirs, etc. (Dolman et al., 2000).
In summer, drought will become a danger as well: decreases up to 40% in low flow are
expected in Flanders by 2100 (Boukhris et al., 2008). This will cause pesticides, nitrates and
phosphates to be less diluted, increasing the risk of toxic effects and eutrophication (Vos et
al., 2007). A number of measures for reducing flood risks may also resolve the drought
problem, assuring a more constant groundwater level (Vos and Kuiters, 2007) and minimum
flow in dry periods (EEA, 2007). However, vigilance about drought issues is recommended
because specific drought response is slower than adaptation related to floods. A possible
explanation is that floods are often perceived as more threatening and sudden than droughts,
7
which evolve more slowly and have more indirect consequences (Huntjens et al., 2010).
Milligan (2004) even states that “droughts and heat waves are the hidden disaster of Europe”.
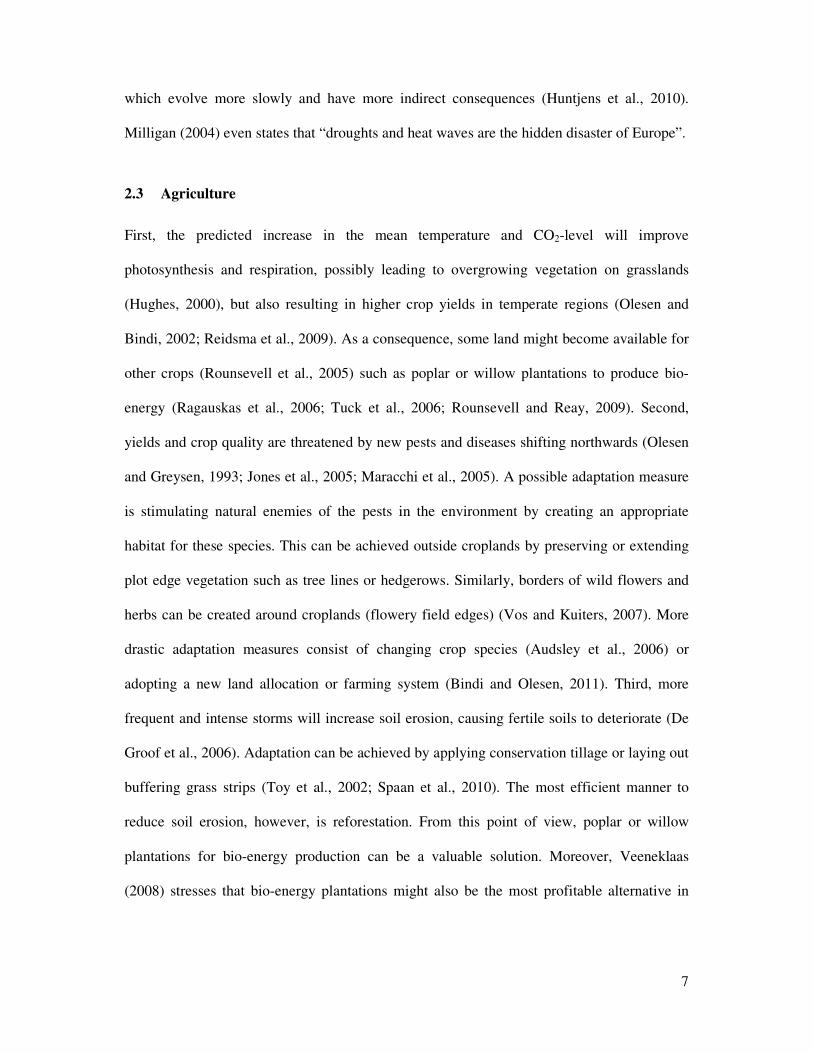
2.3 Agriculture
First, the predicted increase in the mean temperature and CO2-level will improve
photosynthesis and respiration, possibly leading to overgrowing vegetation on grasslands
(Hughes, 2000), but also resulting in higher crop yields in temperate regions (Olesen and
Bindi, 2002; Reidsma et al., 2009). As a consequence, some land might become available for
other crops (Rounsevell et al., 2005) such as poplar or willow plantations to produce bio-
energy (Ragauskas et al., 2006; Tuck et al., 2006; Rounsevell and Reay, 2009). Second,
yields and crop quality are threatened by new pests and diseases shifting northwards (Olesen
and Greysen, 1993; Jones et al., 2005; Maracchi et al., 2005). A possible adaptation measure
is stimulating natural enemies of the pests in the environment by creating an appropriate
habitat for these species. This can be achieved outside croplands by preserving or extending
plot edge vegetation such as tree lines or hedgerows. Similarly, borders of wild flowers and
herbs can be created around croplands (flowery field edges) (Vos and Kuiters, 2007). More
drastic adaptation measures consist of changing crop species (Audsley et al., 2006) or
adopting a new land allocation or farming system (Bindi and Olesen, 2011). Third, more
frequent and intense storms will increase soil erosion, causing fertile soils to deteriorate (De
Groof et al., 2006). Adaptation can be achieved by applying conservation tillage or laying out
buffering grass strips (Toy et al., 2002; Spaan et al., 2010). The most efficient manner to
reduce soil erosion, however, is reforestation. From this point of view, poplar or willow
plantations for bio-energy production can be a valuable solution. Moreover, Veeneklaas
(2008) stresses that bio-energy plantations might also be the most profitable alternative in

8
flood-prone areas because willows and poplars tolerate frequently flooded or saturated soils
(Kuzovkina and Quigley, 2005).
2.4 Recreation
Climate change will create new opportunities for recreation since higher temperatures may
increase the number of day trips and short holidays (Dolman et al., 2000). Richardson and
Loomis (2004) found that, depending on the climate scenario, recreational visits may increase
from 9.9 to 13.6% in 2020. Especially areas abounding in water and cool forests might
become more popular. To meet this growing demand it may be useful to expand recreational
parks where possible (Dolman et al., 2000). Climate change also threatens recreational
activities, especially water related ones. Higher temperatures can stimulate toxic algae in
pools and lakes to grow more easily, potentially endangering swimmers. Therefore, a
rigorous control of the water quality and announcing a swimming prohibition when necessary
will be required. Finally, the growing risk of forest fires might occasionally necessitate
closing recreational forests for visitors (de Jonge, 2008).
3 STUDY AREA: DENDER BASIN
The research area is situated in the Flemish part of the Dender basin (Figure 1). The Dender
is a 65 km long river, formed by the confluence of the Eastern and Western Dender in the city
of Ath, (Wallonia) that discharges in the Scheldt near the city of Dendermonde (Flanders). As
the Dender is mainly fed by precipitation, long periods of intense rainfall can turn the river
into a turbulent stream. Consequently, floods are not exceptional in the valley (Figure 2).
Within the river basin two cases were selected. The first area is the anchor place
‘Vrijthoutbos-Moretteberg’, situated outside the Dender valley in Asse (Figure 1) and
characterized by a hilly, open, rural landscape, alternating with large forest parcels. The well

drained ridges, located on fertile loamy soils, are used as cropland, whereas the valleys on
wet, loamy and sandy loam soils are occupied by forests and grasslands. The second case is
the anchor place, named ‘Dender valley between Idegem and Nin
situated in the valley between the cities of Ninove and Geraardsbergen (Figure 1). In this valley,
most wet clay, loamy or sandy loam soils are used for grasslands or poplar plantations. In
combination with the numerous poplar row
Outside the valley wide croplands on fertile, well drained sandy loam soils create a more open
landscape.
Figure 1 Location of the case studies in the Dender basin in Flanders (Be
Background: Digital Terrain Model of Flanders (Flanders Hydraulics Research, 2006
drained ridges, located on fertile loamy soils, are used as cropland, whereas the valleys on
wet, loamy and sandy loam soils are occupied by forests and grasslands. The second case is
the anchor place, named ‘Dender valley between Idegem and Ninove and the
situated in the valley between the cities of Ninove and Geraardsbergen (Figure 1). In this valley,
most wet clay, loamy or sandy loam soils are used for grasslands or poplar plantations. In
combination with the numerous poplar rows, a specific, rather closed landscape is formed
Outside the valley wide croplands on fertile, well drained sandy loam soils create a more open
Location of the case studies in the Dender basin in Flanders (Belgium).
Background: Digital Terrain Model of Flanders (Flanders Hydraulics Research, 2006
9
drained ridges, located on fertile loamy soils, are used as cropland, whereas the valleys on
wet, loamy and sandy loam soils are occupied by forests and grasslands. The second case is
Geitebos’ and
situated in the valley between the cities of Ninove and Geraardsbergen (Figure 1). In this valley,
most wet clay, loamy or sandy loam soils are used for grasslands or poplar plantations. In
d landscape is formed.
Outside the valley wide croplands on fertile, well drained sandy loam soils create a more open
lgium).
Background: Digital Terrain Model of Flanders (Flanders Hydraulics Research, 2006.

Figure 2 Floods of 14-15th November 2010, Grote Meersen downstream the study area
Dender valley before and during the flood
4 METHOD AND MATERIALS
The analysis was executed in two steps; the calculation process is illustrated in Figure 3. For
each study area we generated a vulnerability map and a corresponding adaptation map in
ArcGis 9.3. Data sources used to compile the maps are listed in Table 1.
Table 1 Data sources.
15th November 2010, Grote Meersen downstream the study area
Dender valley before and during the flood.
METHOD AND MATERIALS
The analysis was executed in two steps; the calculation process is illustrated in Figure 3. For
each study area we generated a vulnerability map and a corresponding adaptation map in
Data sources used to compile the maps are listed in Table 1.
10
15th November 2010, Grote Meersen downstream the study area
The analysis was executed in two steps; the calculation process is illustrated in Figure 3. For
each study area we generated a vulnerability map and a corresponding adaptation map in

11
4.1 GIS compilation of vulnerability maps
As we are focussing on the landscape-scale, only the effects with a direct impact on this level
were included in the vulnerability map. Effects on smaller scales, like for instance on
particular species or specific buildings are therefore not included in this study. Furthermore,
only the types of vulnerability with a spatial dimension could be represented on the map,
which for example excludes health effects, air quality effects etc. In accordance with the
results of former impact studies (see Section 2), we identified four types of vulnerability,
which are most likely to occur in the case studies (Figure 3A): the vulnerability of forests to
desiccation, the vulnerability of forests to wind throw, the vulnerability to soil erosion and the

12
vulnerability to floods (only occurring in the valley). The four types of vulnerability were
combined into a synthesis vulnerability map.
The time horizon for the vulnerability assessment was set at 100 years because the flood
maps for the severe climate scenario, created by the Flanders Hydraulics Research and used
in this study, are calculated for floods with a recurrence period of 100 years. The severe
climate scenario was chosen because adaptation against floods occurring each 100 years will
also protect against floods with shorter recurrences (moderate and limited climate scenarios).
In this section, we describe the method for creating the four separate vulnerability layers,
using the vulnerability of forests to desiccation as an example. The three other layers were
created similarly and will only be described briefly. The supporting tables and matrices are
included in the Appendix.
4.1.1 Data selection and reclassification
The susceptibility of forests to desiccation depends on the vulnerability of the ecosystem and
the soil type (see Section 2). Consequently, the input data for the analysis consist of the
ecosystem desiccation map and the soil map (Figure 3A). First, forests were extracted from
the current land cover as the analysis only applies to forests. Second, the ecosystem
vulnerability map (Table 1), based on the characteristics and biological value of biotopes,

13
Figure 3 Flowchart summarizing the methods for creating (1) the vulnerability maps and (2) the adaptation maps. Gray shapes represent original
key data sources (maps), white shapes are layers that have been created from the key data. Rectangles in dotted lines symbolize adaptation
measures, while full line rectangles represent the policy domains to which the adaptation measures belong. Finally, shapes in dotted lines reflect
layers that are also adaptation measures. Arrows between layers symbolize a selection of particular data from a previous layer, unless mentioned
otherwise. ‘Stretched’ refers to the reorganization of a map to present the information by a gradual colour scale.

14
was used to pinpoint the ecosystems most at risk. Finally, the soil map was integrated into the
GIS to identify the vulnerable soil types. Subsequently, each layer was converted from vector
into raster data to allow a reclassification according to the degree of vulnerability, in which
the most vulnerable areas receive the highest scores. As the layers were summed up and both
study areas needed to be comparable, we reclassified all layers in the same manner: ‘value 0’
for the least vulnerable category, ‘value 4’ for the most vulnerable category. However, the
number of categories differed for each layer, in some cases leading to decimal class limits,
which the Reclassify wizard in ArcGis 9.3 does not support. Therefore, all values were
multiplied by a factor 100, so that all layers were reclassified between ‘value 0’ and ‘value
400’. The ecosystem vulnerability map and the soil map were reclassified using the
categories as shown in Appendix, Table 3a&b. For example, as Vos et al. (2007) suggest that
forests on rich soils are more vulnerable to desiccation, clay and loam soils were attributed a
score of 400, while sand soils were rated lower.
4.1.2 Calculation of the vulnerability map
Second, the reclassified layers were added up to visualize the vulnerability of forests to
desiccation as follows:
Vulnerability of forests to desiccation = Reclassified ecosystem vulnerability map +
Reclassified soil map
The vulnerability of forests for wind throw was obtained similarly (Figure 3A and Appendix
Table 4). Schlyter et al. (2006) suggest that the degree to which forests are weakened by
desiccation contribute to the susceptibility of forests to wind throw. In addition, the altitude
and topography also influence wind throw. In areas characterized by a hilly topography,
forests situated on ridges catch more wind than trees located in depressions (Finnigan and

15
Brunet, 1995). Therefore, the vulnerability layer of forests to desiccation and the 5m-
resolution digital terrain model (DTM) were used to calculate the vulnerability of forests to
wind throw (Figure 3A). The forest vulnerability map to desiccation was reclassified so that
the forests most vulnerable to desiccation were attributed the highest value (Appendix Table
4a). The DTM was reclassified as follows: the higher the altitude, the higher the score
because forests situated on ridges are more prone to wind throw (Appendix Table 4b).
To determine the vulnerability to soil erosion and flooding, the potential soil erosion map and
the flood maps of the Dender were consulted. The flood maps are available for three potential
climate scenarios (severe, moderate and limited), based on hydrodynamic models of the
Flanders Hydraulics Research. To produce the vulnerability map, we used the severe scenario
flood map to visualize the potential worst case scenario. The values of both maps were
stretched between 0 and 400 to assure compatibility with the other vulnerability layers.
Finally, the four vulnerability layers (desiccation, wind throw, soil erosion and flooding)
were jointly presented in a synthesis vulnerability map.
4.2 GIS compilation of adaptation maps
The potential effects of climate change are shown on the vulnerability maps. In response to
these threats, we produced corresponding adaptation maps, subdivided in four groups of
measures: forest management, water management, agricultural management and recreational
management. Each group consists of different measures which are visualized in the
adaptation map. From all possible adaptation measures reported in earlier research, those
offering a long term and sustainable solution without significantly affecting the landscape
quality and/or those which fit into the original traditional landscape were chosen. Pests can,
for example, be controlled by using pesticides or by establishing flowery field edges.
However, pesticides are not sustainable for the environment. Moreover, new plot edge

16
vegetation will ‘restore’ the traditional landscape and increase its heritage value, as originally
field edge vegetation used to be widespread in the case studies. Therefore, we chose the
establishment of flowery field edges and plot edge vegetation as a solution for controlling
pests.
4.2.1 Forest management
Two measures concerning forest management were applied: active management and
conversion of coniferous forest into deciduous forest. Active forest management is crucial for
the most vulnerable forests. Therefore, the top 30% of the forests most susceptible to
desiccation and the forests highly vulnerable to wind throw were selected from the
vulnerability map (Figure 3B). On the adaptation map, these were subsequently shown as
forests, needing active monitoring and management to prevent degradation.
To visualize the second forest measure, all coniferous forests were selected from the land
cover map and added to the adaptation map as ‘Conversion of conifers to deciduous forests’.
4.2.2 Water management
Water management is only relevant in the second study area. To reduce the flood risk, two
major actions were considered (Figure 3B): the construction of a water retention basin and
the widening and/or deepening of the ditches, which can store large volumes of water during
storms. We consulted the Dender Basin Management Plan to locate the water retention
reservoir. To illustrate the second measure, all ditches were extracted from the land cover
map and represented by arrows on the adaptation map.

17
4.2.3 Agricultural management
The agricultural management consists of three major adaptation measures: the reduction of
soil erosion, the management of redundant or vulnerable farmland and the control of pests
inside and outside cropland.
Bio-energy plantations can be an alternative to farmland that has become redundant because
of the higher crop yields or agriculturally unproductive as a result of soil erosion or frequent
flooding. In order to determine the fields most suitable for bio-energy plantations, we used a
Multi Criteria Evaluation. The following variables were considered (Figure 3B): land cover,
soil erosion rate, soil type and occurrence of floods.
First, the land use map indicates where new plantations are possible: farmland and abandoned
parcels overgrown with shrubs are, for example, preferred above residential areas. Therefore,
the land cover map was reclassified (Appendix Table 5a), giving the most suitable land cover
categories the highest scores. Second, areas vulnerable to soil erosion are more appropriate to
reforest because tree plantations can reduce soil erosion. Consequently, the soil erosion map
was reclassified, attributing the highest score to the most erosion-prone areas (Appendix
Table 5b). Third, the performance of poplars and willows is maximized on wet loam or sandy
loam soils (Hughes et al., 2000; Amlin and Rood, 2002). The soil map was reclassified
accordingly (Appendix Table 5c). Finally, areas which are predicted to flood frequently are
more suitable for bio-energy plantations as in the long term this might be the most profitable
alternative function for these zones (Veeneklaas, 2008). In the reclassification of the flood
map, the areas with the largest and most frequent floods were given the highest score
(Appendix Table 5d).
Next, each variable was attributed a weight, using an Analytic Hierarchy Process (Saaty,
1980) (Appendix Table 6), in which the importance of a variable compared to all other
variables is expressed by a score (2 by 2 comparisons). Scores are given according to the

18
scale proposed by Saaty (1980, p246). If variable A (e.g. land cover) is more important than
variable B (e.g. soil erosion rate), this relationship is given a score of 3 to 9, depending on
how much more important it is. If variable A is less important than variable B the score will
be 1/3 to 1/9. The weights are then calculated by normalizing the scores of the matrix by
dividing each score by the sum of the variable’s column. Finally, the weight of the variable is
equal to the sum of the normalized values. Variations in the scores of the variables will only
cause subtle changes in the weights calculated based upon these scores and consequently
have a minor impact on the results as, although scores can vary between 3 and 9 or between
1/3 and 1/9, the direction of a relationship can never be reversed (e.g. vary between 3 and
1/3). In addition, the normalization of the scores reduces the differences. In our calculations
(Appendix Table 6), soil erosion and flood risk were considered to be the most decisive
variables (total weight of 0.64) because these are the driving forces for cultivating bio-energy
plantations. Land cover and soil type have weights of 0.08 and 0.28. The four weighted layers
were added using Spatial Analyst’s Raster Calculator, resulting in a suitability map for bio-
energy plantations:
Suitability map for bio-energy plantations = 0.08 * Reclassified land cover map + 0.28 *
Reclassified soil map + 0.64 * Reclassified soil erosion map (and Reclassified flood map)
The suitability map represents the suitability of a parcel for cultivating poplars or willows: a
value close to 0 means that the parcel is unsuitable; parcels with values close to 400 are very
suitable.
Because reforestation must be well-considered with respect to the historical background of
the landscape, two additional conditions were considered. First, new poplar or willow
plantations must preferably be planted on parcels that have been forested before. Therefore,

19
the map of de Ferraris, illustrating the landscape at the end of the 18th
century, was consulted.
Second, the plantations need to be close to existing forests to assure connectivity and prevent
a scattered plantations pattern. From all suitable parcels only those indicated as forest on the
historical map or adjacent to existing forests were considered for bio-energy plantations and
were added to the adaptation map.
Besides reforestation, soil erosion can also be controlled by applying conservation tillage or
by establishing buffering strips of grassland on cropland, both measures allowing continuing
crop cultivation. A distinction was made between priority and secondary reduction of soil
erosion, based on the potential soil erosion map (Figure 3B). The priority group consists of
parcels characterized by a high or very high potential erosion rate. Parcels indicated as
potentially susceptible to medium soil erosion belong to the second group.
Finally, the agricultural management includes the control of pests inside and outside
croplands. On cropland, this can be achieved by establishing flowery field edges, stimulating
the presence of the pest’s natural enemies. As this is a widespread threat, all cropland fields
were extracted from the land use map. Outside cropland, the preservation and reconstruction
of plot edge vegetation contributes to the control of pests. To illustrate this measure on the
adaptation map, all existing small landscape elements (tree lines, hedgerows etc.) were
mapped using orthogonal photographs, dating from 2002-2003. For the reconstruction of plot
edge vegetation these photographs were compared to aerial photographs from 1951. All tree
lines and hedgerows, that disappeared between 1951 and 2003, were mapped and saved in a
new layer (Figure 3B).

20
4.2.4 Recreational management
Adaptation measures concerning recreational management only apply to the second case,
which contains the recreational park of ‘De Gavers’ situated in a highly flood-prone area. On
the adaptation map the entire park is shown, representing the general adaptation measures
necessary to preserve the recreational function of the area. Examples are the need for a
rigorous control of the water quality in pools and lakes and the closing of the park when the
risk of forest fire is too high (Figure 3B).
5 RESULTS
5.1 The case study Asse
5.1.1 Vulnerability
The vulnerability map (Figure 4A) shows that forests, situated on wet valley soils or close to
springs, are most vulnerable to desiccation. This is consistent with the results of earlier
research by Bresser et al. (2005, pp.65), who concluded that forests on wet soils have
difficulty in recovering from desiccation because these tree species require a high water
quality. Furthermore, the map indicates that most forests are moderately to highly susceptible
to wind throw, which is caused by the open, hilly terrain that freely exposes trees to wind.
The vulnerability map also clarifies that soil erosion is widespread in the area; 62% of the
croplands, mostly located north of the small stream, are moderately to highly affected (Table
2). Three factors contribute to this problem. First, the topography is characterized by steep
slopes, with differences in altitude of more than sixty meters. Second, the majority of the
soils are loamy, which are most vulnerable to erosion (De Groof et al., 2006). Finally, most
of the land is used as cropland, which significantly increases the risk of soil erosion.

21
Figure 4 (A) Vulnerability map and (B) Adaptation map of the anchor place Asse.

22
5.1.2 Adaptation
A comparison between the vulnerability and adaptation map (Figure 4B) indicates that almost
half of the forests, mainly situated in the valleys, require an active management to prevent
degeneration due to climate change. Four conifer plantations are recommended to be replaced
by deciduous trees to reduce the fire risk. As conifers are not indigenous in the area,
removing them may partly restore the landscape’s original character.
As intensive agriculture is important in the area, measures taken on cropland are widespread.
As 79% of the affected croplands belong to the priority group (Table 2), conservation tillage
or buffering grassland strips are recommended. Second, all croplands can be protected against
new pests by creating flowery field edges (Vos and Kuiters, 2007). Similarly, measures can
be taken outside cropland, by preserving or extending tree lines and hedgerows. Finally, the
minimum area needed for bio-energy plantations is estimated at approximately five hectares,
based on the Flemish reforestation guidelines. The most suitable parcels towards this goal are
situated in the east and north of the area.
5.2 The case study Dender valley
5.2.1 Vulnerability
In the Dender valley, only few natural deciduous forests occur, of which most are vulnerable
to desiccation, especially those located on wet soils (Figure 5A). The drought resistant poplar
plantations, dominating the valley, are less endangered. Furthermore, the forest in the south
(Geitebos) is most vulnerable to wind throw. In the valley, forests are more protected against
high wind speeds and are consequently less susceptible to wind throw.
In contrast to the first case, soil erosion is a less pronounced problem in the Dender case
study, as it only occurs outside the valley and to a smaller extent. However, the issue is not

23
negligible given that of all croplands, 41% is estimated to experience significant soil erosion
(Table 2).
Finally, the vulnerability map indicates that in the severe climate scenario almost the entire
valley risks severe flooding. The most vulnerable area is located in the recreational park ‘De
Gavers’.
5.2.2 Adaptation
Figure 5B represents the adaptation map, based on the severe climate scenario and thus
consistent with the vulnerability map. The map indicates that most of the forests (nearly 75%
(Table 2)) need an active management. In contrast, only one conifer plantation needs to be
replaced by deciduous trees.
67% of the croplands affected by soil erosion belong to the priority group (Table 2), of which
all are located outside the valley. A more widespread measure is the preservation of plot edge
vegetation to control pests because of the numerous tree lines and hedgerows. Analogously,
measures concerning grasslands are important as this is the most widespread land cover in the
area. Based on the guidelines for reforestation, approximately 15 hectares might be used for
bio-energy plantations, mostly situated in the valley.
In contrast to the first case, adaptation measures concerning water management are necessary.
A water retention reservoir needs to be constructed on the Molenbeek to safeguard the centre
of Zandbergen and the area downstream from flooding. The deepening and/or broadening of
ditches may increase the water retention capacity, reducing the flood risk. As at present
nearly all parcels are surrounded by ditches and tree lines, this is a widespread adaptation
measure.

Figure 5 (A) Vulnerability map and (B) Adaptation map of the anchor place Dender valley(A) Vulnerability map and (B) Adaptation map of the anchor place Dender valley
24
(A) Vulnerability map and (B) Adaptation map of the anchor place Dender valley.

25
Finally, it is recommended to adapt the management of the recreational park, including the
expansion to meet the growing number of visitors. This is only possible on the northern side
of the park, by building a pedestrian bridge over the Dender, which would include the river
into the park instead of being a border. Furthermore, in summer, when temperatures are
highest, the water quality of the lakes requires a more frequent and stricter control to protect
swimmers against diseases caused by toxic algae. Finally, dikes need to protect the area
against floods.
Table 2 Calculation of the areas related to different adaptation measures.
5.3 Impact on landscape and its heritage values
The vulnerability maps (Figure 4 and 5, section A) illustrate that a deterioration of forests,
grasslands and croplands caused by climate change might affect a landscape as a whole. In
particular in our case studies, increased soil erosion, drought and a loss of biodiversity may
damage the natural-scientific value of the landscape, while a removal of the traditional plot

26
edge vegetation can decrease its historical value. Furthermore, the aesthetic value of the
landscape is threatened as well. In summary, we can thus not exclude that climate change
may have an impact on the landscape quality (Callaghan et al., 2004; McEvoy et al., 2008), in
particular in vulnerable, high quality heritage landscapes (Cassar, 2005). As a consequence, a
potential loss of the heritage values of such landscapes must be taken into account. Moreover,
due to climate change, relic landscapes may become less coherent as the relations between
the composing elements of the landscape are weakened. In addition, the different parts of the
landscape may become less recognizable and less understandable, which may decrease its
legibility. Finally, the landscape’s soundness (sensu Antrop, 2003) might be affected as well
because it might look uncared-for. In the worst case scenario, a loss of heritage values can
cause the formerly most valuable landscapes to be downgraded or even to lose their status of
cultural heritage, which implies suspension of special care and attention. This can especially
become reality if, following the example of the UK (Cassar, 2005) and the Netherlands (de
Boer, 2009), the Flemish Agency for Immovable Heritage starts monitoring the quality of the
cultural heritage in Belgium on a regular base, including heritage landscapes. Adaptation
measures can counter this scenario, although this implies change as well. The adaptation
maps (Figure 4 and 5, Section B) suggest that bio-energy plantations might emerge on the
grasslands which, in the climate change scenario, would be overgrown with shrubs.
Furthermore, the deciduous forests can revive as a result of the introduction of new, more
resistant tree species, green deciduous trees may replace the dead conifers and flowery field
edges can safeguard the crops on the fields from pests and soil erosion. Although adaptation
to climate change will alter the landscape, the overall impact will not be destructive with
respect to the coherence, legibility and soundness (sensu Antrop, 2003) of the landscape,
which is essential to preserve the landscape’s heritage values.

27
6 DISCUSSION
One could wonder if climate change should be considered as a serious problem for
landscapes and if efforts should be made to preserve them. Several factors may contribute to
this doubt. Climate change studies are often based on assumptions or potential scenarios and
are therefore characterized by uncertainty (Metzger et al., 2008), both in time and in
magnitude. This may contribute to a ‘wait-and-see attitude’. In addition, a number of changes
like increasing drought and erosion only proceed very slowly, making them hardly noticeable
(Meyer et al., 2010). Consequently, the need for adaptation is not always clear. However,
many studies confirm that climate change will have an effect on soils (Lavee et al., 1998;
Nearing et al., 2004), water availability (Manabe et al., 2004; Frei et al., 2006; Otero et al.,
2011), river systems (Arora and Boer, 2001; Huntjens et al., 2010), agriculture (Rounsevell
and Reay, 2009; Bindi and Olesen, 2011; Lorencová et al., 2013) fauna and flora (Burns et
al., 2003; Berry et al., 2006) and on ecosystems in general (Harris et al., 2006; Lemieux et al.,
2011). These findings provide strong indications that the landscape as a whole may also be
affected by climate change as it integrates all these single aspects into one entity (Thompson
et al., 1998; Callaghan et al., 2004; McEvoy et al., 2008).
So far, traditional heritage landscapes have often been forgotten, when it comes to preserving
the ‘cultural heritage’ against climate change. ‘Cultural heritage’ is too often reduced to
monuments (buildings, bridges, statues etc.), like in the “Atlas of climate change impact on
European cultural heritage: scientific analysis and management strategies” (Sabbioni et al.,
2010). Traditional landscape relics and landscapes in general are rarely included in climate
change vulnerability assessments and thus in policy making, while they are for sure part of
the cultural heritage. Awareness should be raised among policy makers about including the
landscape aspect when assessing climate change vulnerability and adaptation. If considerable

28
and expensive efforts are currently made to -investigate how to- protect (architectural)
monuments against climate change (e.g. protection against floods, acid rain etc.) throughout
Europe (Council of Europe, 1985; Pickard, 2002; Tsakalof et al., 2007; de Ferri et al., 2011),
it would make sense to preserve our traditional landscape relics as well.
The results of our study suggest that for preserving the heritage landscapes, it is useful to
elaborate and map vulnerability and adaptation assessments. Although adaptation to climate
change requires coordination over multiple levels of governance (Jäger and Moll, 2011;
Bennett et al., 2012), the local level is most appropriate to create these assessments (Lim et
al., 2004) as it is on this level that the consequences of climate change will be felt (Adger,
2001) and adaptation measures may need to be implemented (Huq et al., 2006; Satterthwaite
et al., 2007). However, although the need is urgent, taking immediate and drastic adaptation
actions in heritage landscapes may not be opportune. Because of the uncertainty, it is difficult
to predict which effects will actually occur and how strong their impact will be (Metzger et
al., 2008; Rannow et al., 2010). Currently, most heritage landscapes in Flanders do not show
clear signs of degradation caused by climate change. Taking drastic adaptation measures now
could therefore do more harm than good with respect to the landscape quality. Nevertheless, a
number of small and quick measures like establishing flowery field edges to control pests
(Vos and Kuiters, 2007) and applying conservation tillage to improve the soil structure and
stability (Holland, 2004) can already be executed. In the longer term, if climate change
persists, more fundamental adaptation actions may be required, like for instance switching
over to bio-energy plantations (Rounsevell and Reay, 2009). In any case, climate change
cannot be ignored and adaptation will be required, radical or subtle (King, 2004). Detailed
vulnerability assessments and appropriate and well-founded adaptation plans will therefore be
indispensable to policy makers (Lim et al., 2004).

29
In Flanders, the first step to realize this is to include adaptation plans into the landscape
management plans of the heritage landscapes. This assures action as these plans are binding
upon policy makers. If these adaptation plans are not drawn up, adaptation might become
very difficult, slow and inefficient. In addition, outlining a univocal adaptation strategy based
on scientific research with clear guidelines for all heritage landscapes provides a solid
framework for policy makers and land owners. This also restricts the possibility that land
owners start taking adaptation measures at their own initiative, which might result in a wide
variety of inefficient and unverifiable actions not geared to one another or in no adaptation at
all. The impact on the landscape would in this case be highly unpredictable, uncontrollable
and heterogeneous, which would probably undermine the landscape quality.
In Belgium, however, more research on the specific local effects of climate change is
required to be able to elaborate such a framework. So far, research related to climate change
has mainly focused on mitigation (den Ouden and Vanderstraeten, 2004), but a clear
understanding of the specific effects of climate change in Belgium is needed to effectively
adapt to it. An integrated assessment is therefore indispensable, including a shift from
mitigation to adaptation based, interdisciplinary and multi-scale research. For Flanders, this
approach is necessary to create more reliable local vulnerability and adaptation maps, which
should first be elaborated for the heritage landscapes as according to Cassar (2005), such
landscapes are a valuable and vulnerable part of the common cultural heritage. In the longer
term, the methodology can be extended to the whole Flemish region, because heritage
landscapes cannot be considered as isolated islands. Mismanagement of adjacent areas could
have consequences for these landscapes. Although the methodology used in this study can be

30
applied to other landscapes/areas, the results might vary depending on the landscape type
concerned and the local effects of climate change.
In order to make this system work, considerable efforts are needed to integrate adaptation
plans into the spatial planning system in general (Meyer et al., 2010). In Flanders, however,
this has not yet been achieved because of the difficulties of translating uncertain scientific
climate projections into adaptation plans, which hampers the communication between climate
modellers/impact assessors and spatial planners/landscape experts (Rannow et al., 2010). In
addition, the political situation in Belgium contributes to the absence of climate change
adaptation plans in spatial planning. Since the state reform in the 1970s, spatial planning,
landscape protection and management, nature and environment have become the authority of
the regions, while climate has remained a federal policy. This does not facilitate
policymaking as decisions are taken on different levels, which are not always geared to one
another. This divergence leads to unexpected situations, like illustrated by the floods of 2010
(Figure 2). As the Dender is separately managed by the Walloon and Flemish regions, only
the Walloon part was dredged in spring 2010. In November 2010, this resulted in major
floods in large areas downstream in Flanders, while no floods occurred in Wallonia.
Since recently, efforts have been made to address climate change issues in Belgium. The first
initiative has been taken with the formulation of a national climate policy by the National
Climate Commission in 2009, though still mainly focussing on mitigation. The Belgian
National Climate Change Adaptation Strategy has been published (National Climate
Commission, 2010), summarizing the potential threats posed by climate change per sector in
Belgium. Moreover, it highlights the need for adaptation and focuses on concrete actions.
However, the last step, the formulation of a comprehensive national adaptation plan has not

31
yet been taken. Meanwhile, the Flemish and Walloon regions have started to establish a
Regional Adaptation Plan (National Climate Commission, 2010). Furthermore, a number of
research projects, dealing with adaptation to climate change, are currently running or have
recently been finished (e.g. ‘Science for Sustainable Development’, the Circle-2 ERA-net
(Belgian Federal Science Policy Office), the AGORA Programme (Belgian Federal Science
Policy Office and Public Health Department), the interdisciplinary research project
CcASPAR (Flemish Agency for Innovation by Science and Technology) (Allaert et al.,
2012), and the Interreg Projects SCALDWIN, TIDE and AMICE (National Climate
Commission, 2010)).
7 CONCLUSIONS
In Flanders, the Landscape Atlas lists the traditional landscape relics, which can be
considered as a valuable part of the cultural heritage, based on their natural-scientific,
historical, socio-cultural and aesthetic values. More specifically, these relics are labelled as
‘heritage landscapes’, which are assigned a binding landscape management plan to assure the
maintenance of their heritage values. However, these plans do not contain climate change
vulnerability assessments nor adaptation plans, while climate change is an important driving
force of landscape change. In heritage landscapes, this change may affect the intact
traditional character of these landscapes, which may cause a part of our common cultural
heritage to deteriorate or even get lost. To moderate this tendency, the potential impacts of
climate change and adaptation measures could be assessed and mapped on a detailed level. In
this study, we elaborated this idea for two relic landscapes in the Dender basin in Flanders
and created vulnerability and adaptation maps in a GIS. The vulnerability maps indicate a
considerable susceptibility to climate change in both cases. In the case study of Asse, situated
outside the Dender valley, a large part of the deciduous forest is prone to desiccation and

32
wind throw. Soil erosion seems to be an important threat as well. In the case study located in
the Dender valley, almost the entire area is threatened by severe flooding. Furthermore, forest
desiccation, wind throw and soil erosion are less pronounced than in the first case study,
although these issues cannot be neglected either. These effects might deteriorate the
landscape quality in both case studies, threatening the valuable heritage values of these
landscapes. In particular, the natural-scientific, historical and aesthetic values might be at risk
as a consequence of a decline in legibility, soundness and coherence (sensu Antrop, 2003) of
these landscape relics. As these effects are probable in all Flemish heritage landscapes,
climate change should be considered as a real threat to this part of the common cultural
heritage. While immediately taking drastic adaptation measures could be precipitous and
unnecessary, we at least recommend to assess the vulnerability of relic landscapes to climate
change and to start elaborating adaptation plans and maps on a detailed level to preserve this
part of the cultural heritage. To be binding, these maps can be implemented in the landscape
management plans of each heritage landscape. Although we only examined relic landscapes,
in the longer term it might be advantageous to apply the proposed approach to the whole
Flemish region. To be effective, climate change adaptation measures will need to be included
into spatial planning instruments in general, while the landscape aspect should be more
addressed when assessing climate change vulnerability and adaptation.
33
8 REFERENCES
Adger, W.N. 2001. Scales of governance and environmental justice for adaptation and
mitigation of climate change. J. Int. Dev. 13, 921-931.
Allaert, G., Bouwer, L., De Sutter, R., Gulinck, H., Meire, P., Van Damme, S., Van den
Broeck, P., Van Eetvelde, V. 2012. Klimaat in Vlaanderen als ruimtelijke uitdaging
(CcASPAR). Academia Press, Ghent, 286 pp.
Amlin, N.M., Rood, S.B. 2002. Comparative tolerances of riparian willows and cottonwoods
to water-table decline. Wetlands 22, 338-346.
Antrop, M. 2003. The role of cultural values in modern landscapes. The Flemish example. In:
Palang, H., Fry, G. (Eds.), Landscape interfaces: cultural heritage in changing landscapes.
Kluwer Academic Publishers, Dordrecht, pp. 91-108.
Antrop, M., Van Eetvelde, V. 2007. The implementation of the Landscape Atlas of Flanders
in the integrated spatial planning policy. In: Berlan-Darqué, M., Luginbühl, Y., Terrason, D.
(Eds.), Paysages de la connaissance a l’action. Editions Quae, Versailles, pp. 137-145.
Arora, V. K., Boer, G.J. 2001. Effects of simulated climate change on the hydrology of major
river basins. J. Geophys. Res. 106(D4), 3335–3348.
Audsley, E., Pearn, K.R., Simota, C., Cojocary, G., Koutsidou, E., Rousevell, M.D.A., Trnka,
M., Alexandrov, V. 2006. What can scenario modelling tell us about future European scale
agricultural land use, and what not? Environ. Sci. Pol. 9, 148-162.

34
Bennett, R., Rajabifard A., Williamson, I., Wallace, J. 2012. On the need for national land
administration infrastructures. Land Use Policy 29, 208-219.
Berry, P.M., Rounsevell, M.D.A., Harrison, P.A., Audsley, E. 2006. Assessing the
vulnerability of agricultural land use and species to climate change and the role of policy in
facilitating adaptation. Environmental Science & Policy 9, 189-204.
Bieling, C., Plieninger, T., Trommler, K. 2011. Cross the border – close the gap: resilience-
based analysis of landscape change (Editorial). European Countryside 2, 83-92.
Bindi, M., Olesen, J.E. 2011. The responses of agriculture in Europe to climate change. Reg.
Environ. Change 11, 151-158.
Boukhris, O., Vanneuville, W., Willems, P., Van Eerdenbrugh, K. 2008. Climate change
impact on hydrological extremes in Flanders: regional differences. Technical Report N.
706/13. Waterbouwkundig Laboratorium, Antwerp, 195 pp.
Bresser, A.H.M., Berk, M.M., van den Born, G.J., van Bree, L., van Gaalen, F.W., Ligtvoet,
W., van Minnen, J.G., Witmer, M.C.H. 2005. The effects of climate change in the
Netherlands. Technical Report N. 773001034. Milieu- en Natuurplanbureau, Bilthoven, 111
pp.

35
Brouyaux, F., Tricot, C., Debontridder, L., Delcloo, A., Vandiepenbeeck, M., Dewitte, S.,
Cheymol, A., Joukoff, A., De Backer, H., Hus, J., Van Malderen, R., Vannitsem, S., Roulin,
E., Mohymont, B. 2009. Oog voor het klimaat. KMI, Brussels, 58 pp.
Burns, C.E., Johnston, K.M., Schmitz, O.J. 2003. Global climate change and mammalian
species diversity in U.S. National Parks. Proc. Natl. Acad. Sci. U.S.A. 100
(20), 11474–11477.
Callaghan, T.V., Bjorn, L.O., Chernov, Y., Chapin, T., Christensen, T.R., Huntley, B., Ims,
R.A., Johansson, M., Jolly, D., Jonasson, S., Matveyeva, N., Panikov, N., Oechel, W.,
Shaver, G., Schaphoff, S., Sitch, S. 2004. Effects of changes in climate on landscape and
regional processes, and feedbacks to the climate system. Ambio 33, 459-468.
Cassar, M. 2005. Climate change and the historic environment. University College London,
Centre for sustainable heritage, Nottingham, 98 pp.
Council of Europe. 1985. Convention for the Protection of the Architectural Heritage of
Europe, explanatory report. Granada.
De Boer, M. Erfgoedbalans 2009. Rijksdienst voor het cultureel erfgoed, Amersfoort, 300 pp.
de Ferri, L., Lottici, P.P., Lorenzi, A., Montenero, A., Salvioli-Mariani, E. 2011. Study of
silica nanoparticles – polysiloxane hydrophobic treatments for stone-based monument
protection. Journal of Cultural Heritage 12(4), 356-363.

36
De Groof, A., Hecq, W., Coninx, I., Bachus, K., Dewals, B., Pirotton, M., El Kahloun, M.,
Meire, P., De Smet, L., De Sutter, R. 2006. General study and evaluation of potential impacts
of climate change in Belgium. Technical Report N. WP1-3. Federaal Wetenschapsbeleid,
Brussels, 66 pp.
de Jonge, C. 2008. De gevolgen van klimaatverandering voor recreatie en toerisme. Kansen
voor de recreatiesector. Stichting Recreatie, Kennis- en Innovatiecentrum, Den Haag, 58 pp.
den Ouden, G, Vanderstraeten, M. 2004. Belgisch global change onderzoek 1990-2002.
Synthese van het assessment- en integratierapport. Federaal Wetenschapsbeleid, Brussels, 92
pp.
Dolman, A.J., Kabat, P., van Ierland, E.C., Hutjes, R.W.A. 2000. Klimaatverandering en de
functies van het landelijk gebied. Technical Report N. 082. Alterra, Wageningen, 96 pp.
EEA (European Environment Agency) 2007. Climate change and water adaptation issues.
Technical Report 2/2007. EEA, Copenhagen, 111 pp.
EEA (European Environment Agency) 2008. Impacts of Europe’s changing climate – 2008
indicator-based assessment. Report 4/2008. EEA, Brussels, 247 pp.
Finnigan, J.J., Brunet, Y. 1995. Turbulent airflow in forests on flat and hilly terrain. In:
Coutts, M.P., Grace, J. (Eds.), Wind and trees. Cambridge University Press, Cambridge, pp.
3-40.

37
Frei, C., Schöll, R., Fukutome, S., Schmidli, J., Vidale, P.L. 2006. Future change of
precipitation extremes in Europe: Intercomparison of scenarios from regional climate models.
J. Geophys. Res.-Atmos. 111, (D6). doi:10.1029/2005JD005965.
Harris, J.A., Hobbs, R.J., Higgs, E., Aronson, J. 2006. Ecological restoration and global
climate change. Rest. Ecol. 14 (2), 170–176.
Holland, J.M. 2004. The Environmental consequences of adopting conservation tillage in
Europe: reviewing the evidence. Agriculture, Ecosystems and Environment 103, 1-25.
Huntjens, P., Pahl-Wostl, C., Grin, J. 2010. Climate change adaptation in European river
basins. Reg. Environ. Change 10, 263-284.
Hughes, L. 2000. Biological consequences of global warming: is the signal already apparent?
Trends Ecol. Evol. 15, 56-61.
Hughes, F.M.R., Barsoum, N., Richards, K.S., Winfield, M., Hayes, A. 2000. The response
of male and female black poplar (Populus NigraL. subspecies Betulifolia (Pursh) W. Wettst)
cuttings to different water table depths and sediment types: implications for flow
management and river corridor biodiversity. Hydrol. Process. 14, 3075-3098.
Huq, S., Reid, H., Murray, L.A. 2006. Climate change and development links, the gatekeeper
series. International Institute for Environment and Development, London, 24 pp.

38
Intergovernmental Panel on Climate Change 2007. Fourth assessment report. Cambridge
University Press, Cambridge, 976 pp.
Jäger, J., Moll, P. 2011. Adaptation to climate change: tools and methods. Reg. Environ.
Change 11, 213-215.
Jones, G., White, M., Cooper, O., Storchmann, K. 2005. Climate change and global wine
quality. Climatic Change 73(3), 319-343.
Kasperson, J.X., Kasperson, R.E. 2001. International workshop on vulnerability and global
environmental change. Stockholm Environment Institute, Stockholm, 34 pp.
King, D.A. 2004. Climate change science: adapt, mitigate or ignore? Science 303, 176-177.
Kuzovkina, Y.A., Quigley, M.F. 2005. Willows beyond wetlands: uses of Salix L. species for
environmental projects. Water. Air. Soil. Poll. 162, 183-204.
Lavee, H., Imeson, A.C., Sarah, P. 1998. The impact of climate change on geomorphology
and desertification along a Mediterranean-arid transect. Land Degradation & Development 9,
407-422.
Lemieux, C.J., Beechey, T.J., Gray, P.A. 2011. Prospects for Canada’s protected areas in an
era of rapid climate change. Land Use Policy 28, 928-941.

39
Lim, B., Spanger-Siegfried, E., Burton, I., Malone, E., Huq, S. 2004. Adaptation policy
frameworks for climate change : developing strategies, policies and measures. Cambridge
University Press, Cambridge, 258 pp.
Lorencová, E., Frélichová, J., Nelson, E., Vackár, D. 2013. Past and future impacts of land
use and climate change on agricultural ecosystem services in the Czech Republic. Land Use
Policy 33, 183-194.
Manabe, S., Wetherald, R.T., Milly, P.C.D., Delworth, T.L., Stouffer, R.J. 2004. Century-
scale change in water availability: CO2-quadrupling experiment. Climatic Change 64, 59-76.
Maracchi, G., Sirotenko, O., Bindi, M. 2005. Impacts of present and future climate variability
on agriculture and forestry in the temperate regions: Europe. Climatic Change 70(1-2), 117-
135.
McEvoy, D., Cavan, G., Handley, J., McMorrow, J., Lindley, S. 2008. Changes to climate
and visitor behaviour: Implications for vulnerable landscapes in the North West region of
England. Journal of Sustainable Tourism 16 (1), 101-121.
Metzger, M.J., Schröter, D., Leemans, R., Cramer, W. 2008. A spatially explicit and
quantitative vulnerability assessment of ecosystem service change in Europe. Reg. Environ.
Change 8, 91-107.
Meyer, B.C., Rannow, S., Loibl, W. 2010. Climate change and spatial planning. Landscape
Urban Plan. 98, 139-140.

40
Milligan, J. 2004. Heatwaves: the developed world’s hidden disaster, Techn Ber,
International Federation of Red Cross and Red Crescent, World disasters Report. Kumarian
Press, Sterling.
National Climate Commission 2010. Belgian national climate change adaptation strategy.
Flemish Environment, Nature and Energy Department, Brussels, 74 pp.
Nearing, M.A., Pruski, F.F., O’Neal, M.R. 2004. Expected climate change impacts on soil
erosion rates: A review. Journal of Soil and Water Conservation 59 (1), 43-50.
Noss, R.F. 2001. Beyond Kyoto: Forest management in a time of rapid climate change.
Conserv. Biol. 15(3), 578-590.
Ntegeka, V., Willems, P., Baguis, P., Roulin, E. 2008. Climate change impact on
hydrological extremes along rivers and urban drainage systems. Phase 1: Development of
climate change scenarios for rainfall and ETo. Final Report Phase 1. Federaal
Wetenschapsbeleid, Brussels, 64 pp.
Olesen, J.E., Bindi, M. 2002. Consequences of climate change for European agricultural
productivity, land use and policy. Eur. J. Agron. 16, 239-262.
Olesen, J.E., Grevsen, K. 1993. Simulated effects of climate change on summer cauliflower
production in Europe. Eur. J. Agron. 2(4), 313-323.

41
Otero, I., Boada, M., Badia, A., Pla, E., Vayreda, J., Sabaté, S., Gracia, C.A., Peñuelas, J.
2011. Loss of water availability and stream biodiversity under land abandonment and climate
change in a Mediterranean catchment (Olzinelles, NE Spain). Land Use Policy 28, 207-218.
Pedroli, B., de Blust, G., van Looy, K., van Rooij, S. 2002. Setting targets in strategies for
River restoration. Landscape Ecol. 17 (suppl. 1), 5-18.
Pedroli, B., Harms, B. 2002. Introduction. Landscape Ecol. 17 (suppl. 1), 1-3.
Pedroli, B., Klijn, J., Veeneklaas, F. 2010. Anticipating landscape policy – Driving forces. In:
European spatial planning and landscape, No. 93: Proceedings of the 8th
meeting of the
Council of Europe workshops for the implementation of the European Landscape
Convention. Landscape and driving forces. Council of Europe Publishing, Belgium, pp. 39-
43.
Pickard, R. 2002. A comparative review of policy for the protection of the architectural
heritage of Europe. International Journal of Heritage Studies 8(4), 349-363.
Ragauskas, A.J., Williams, C.K., Davison, B.H., Britovsek, G., Cairney, J., Eckert, C.A.,
Frederick, W.J. Jr., Hallett, J.P., Leak, D.J., Liotta, C.L., Mielenz, J.R., Murphy, R., Templer,
R., Tschaplinski, T. 2006. The path forward for biofuels and biomaterials. Science
311(5760), 484-489.

42
Rannow, S., Loibl, W., Greiving, S., Gruehn, D., Meyer, B.C. 2010. Potential impacts of
climate change in Germany – Identifying regional properties for adaptation activities in
spatial planning. Landscape Urban Plan. 98, 160-171.
Reidsma, P., Ewert, F., Lansink, A.O., Leemans, R. 2009. Vulnerability and adaptation of
European farmers: a multi-level analysis of yield and income responses to climate variability.
Reg. Environ. Change 9, 25-40.
Richardson, R.B., Loomis, J.B. 2004. Adaptive recreation planning and climate change: a
contingent visitation approach. Ecol. Econ. 50(1-2), 83-99.
Rounsevell, M.D.A., Ewert, F., Reginster, I., Leemans, R., Carter, T.R. 2005. Future
scenarios of European agricultural land use II. Projecting changes in cropland and grassland.
Agr. Ecosyst. Environ. 107(2-3), 117-135.
Rounsevell, M.D.A., Reay, D.S. 2009. Land use and climate change in the UK. Land Use
Policy 26S, S160-S169.
Rössler, M. 2006. World heritage cultural landscapes: A UNESCO flagship programme
1992-2006. Landsc. Res. 31(4), 333-353.
Saaty, T.L. 1980. The analytic hierarchy process: planning setting priorities, resource
allocation. McGraw-Hill International, New York, 287 pp.

43
Sabbioni, C., Brimblecombe, P., Cassar, M. 2010. The atlas of climate change impact on
European cultural heritage. Scientific analysis and management strategies. Anthem Press,
London and New York, 146 pp.
Satterthwaite, D., Huq, S., Pelling, M., Reid, H., Tomero Lankao, P. 2007. Adapting to
climate change in urban areas: the possibilities and constraints in low- and middle-income
nations. International Institute for Environment and Development, London, 112 pp.
Schlyter, P., Stjernquist, I., Bärring, L., Jönsson, A.M., Nilsson, C. 2006. Assessment of the
impacts of climate change and weather extremes on boreal forests in Northern Europe,
focusing on Norway spruce. Clim. Res. 31, 75-84.
Spaan, W., Winteraeken, H., Geelen, P. 2010. Adoption of SWC measures in South Limburg
(The Netherlands): Experiences of a water manager. Land Use Policy 27, 78-85.
Stern, N. 2007. The Economics of Climate Change – The Stern Review. Cambridge
University Press, Cambridge, 712 pp.
Thompson, I.D., Flannigan, M.D., Wotton, B.M., Suffling, R. 1998. The effects of climate
change on landscape diversity: an example in Ontario forests. Environmental Monitoring and
Assessment 49, 213-233.
Toy, T.J., Foster, G.R., Renard, K.G. 2002. Soil erosion: processes, prediction, measurement
and control. John Wiley & Sons, New York, 352 pp.

44
Tsakalof, A., Manoudis, P., Karapanagiotis, I., Chryssoulakis, I., Panayiotou, C. 2007.
Assessment of synthetic polymeric coatings for the protection and preservation of stone
monuments. Journal of Cultural Heritage 8, 69-72.
Tuck, G., Glendining, M.J., Smith, P., House, J.I., Wattenbach, M. 2006. The potential
distribution of bioenergy crops in Europe under present and future climate. Biomass.
Bioenerg. 30(3), 183-197.
Van Eetvelde, V., Antrop, M. 2005. The significance of landscape relic zones in relation of
soil conditions, settlement pattern and territories in Flanders. Landscape Urban Plan. 70 (1-2),
127-141.
Van Eetvelde, V., Van De Velde, L., Sevenant, M., Antrop, M. 2010. Landscape Atlas of
Flanders+10: a decade of experiences outlining integrated landscape research for the future.
In: UNISCAPE (Ed.), Living Landscape. The European Landscape Convention in research
perspective, Firenze, pp. 305-316.
Veeneklaas, F.R. 2008. Anticiperend landschapsbeleid. Katern 1: Klimaatverandering en
klimaatbeleid. Technical Report N. 1708. Alterra, Wageningen, 88 pp.
Vos, C.C., Kuiters, A.T. 2007. Effecten van klimaatverandering op de natuur. Landsch.
24(1), 27-37.

45
Vos, C.C., Nijhof, B.S.J., van der Veen, M., Opdam, P.F.M., Verboom, J. 2007.
Risicoanalyse kwetsbaarheid natuur voor klimaatverandering. Technical Report N. 1551.
Alterra, Wageningen, 76 pp.

46
APPENDIX: Reclassification and weighting of the thematic layers for the compilation of the
vulnerability and adaptation maps.
Table 3 Reclassification of the ecosystem vulnerability map (a) and soil map (b) for the
compilation of the vulnerability map of forests to desiccation.
Original value/description New value Vulnerability to desiccation
(a) 1 0 no information available
2 57 not vulnerable to desiccation
3 114 almost not vulnerable to desiccation
4 171 little vulnerable to desiccation
5 229 moderately vulnerable to desiccation
6 286 vulnerable to desiccation
7 343 very vulnerable to desiccation
8 400 highly vulnerable to desiccation
(b) peat/artificial 0 not vulnerable to desiccation
sand/ loamy sand 200 moderately vulnerable to desiccation
(on ridges)
clay/loam/sandy loam 400 highly vulnerable to desiccation
(on ridges)

47
Table 4 Reclassification of the vulnerability map of forests to desiccation (a) and the Digital
Terrain Model (b) for the compilation of the vulnerability map of forests to wind throw.
Original value/description New value Vulnerability to desiccation
(a) 0-100 0 almost not vulnerable to wind throw
100-200 133 moderately vulnerable to wind throw
200-300 267 vulnerable to wind throw
300-400 400 highly vulnerable to wind throw
(b) <20m 0 not vulnerable to wind throw
20-30m 67 almost not vulnerable to wind throw
30-40m 133 little vulnerable to wind throw
40-50m 200 moderately vulnerable to wind throw
50-60m 267 vulnerable to wind throw
60-70m 333 very vulnerable to wind throw
>70m 400 highly vulnerable to wind throw

48
Table 5 Reclassification of the land cover map (a), soil erosion map (b), soil map (c) and
flood map (d) for the determination of the suitability of parcels for bio-energy plantations.
Original value/description New value Suitability for bio-energy plantations
(a) built areas 0 not suitable for bio-energy plantations
surface water
infrastructure
forests 100 little suitable for bio-energy plantations
cropland 200 moderately suitable for bio-energy
plantations
brushwood 300 suitable for bio-energy plantations
grassland 400 highly suitable for bio-energy plantations
(b) no erosion 0 not suitable for bio-energy plantations
negligible erosion rate 67 almost not suitable for bio-energy
plantations
very low erosion rate 133 little suitable for bio-energy plantations
low erosion rate 200 moderately suitable for bio-energy
plantations
moderate erosion rate 266 suitable for bio-energy plantations
high erosion rate 333 very suitable for bio-energy plantations
very high erosion rate 400 highly suitable for bio-energy plantations
(c) heavy clay 0 not suitable for bio-energy plantations
peat
artificial terrain
dry loamy sand 57 almost not suitable for bio-energy
stony loam plantations
dry clay 114 little suitable for bio-energy plantations
dry sandy loam 171 moderately suitable for bio-energy
plantations
dry loam 229 suitable for bio-energy plantations
wet clay 286 very suitable for bio-energy plantations
wet sandy loam 343 highly suitable for bio-energy plantations

49
wet loam 400 most suitable for bio-energy plantations
(d) 10-50cm 0 not suitable for bio-energy plantations
51-100cm 67 almost not suitable for bio-energy
plantations
101-150cm 133 little suitable for bio-energy plantations
151-200cm 200 moderately suitable for bio-energy
plantations
201-250cm 266 suitable for bio-energy plantations
251-300cm 333 very suitable for bio-energy plantations
>300cm 400 highly suitable for bio-energy plantations

50
Table 6 Calculation of the weights on the basis of Saaty’s matrix for the determination of
suitable areas for bio-energy plantations.
land cover soil type soil erosion/floods
land cover 1 1/5 1/7
soil type 5 1 1/3
soil erosion/floods 7 3 1
sum 13 21/5 31/21
land cover soil type soil erosion/floods weight
land cover 0.08 0.05 0.10 0.08
soil type 0.38 0.24 0.23 0.28
soil erosion/floods 0.54 0.71 0.68 0.64