Embed Size (px)
Citation preview
May 2019
ASSESSMENT:
ETHICAL CULTURE & PERCEPTIONS SURVEY
The Integrity and Compliance Office conducts this survey every two
years to assess employees’ perceptions of VCU’s ethical culture in
order to measure program impact and plan future initiatives.

TABLE OF CONTENTS
Executive Summary .............................................................................................................. 1
Detailed Survey Results, Analysis and Suggested Strategies .................................... 5
Awareness of the Program and Resources ........................................................................................ 5
Perceptions of Employees and Environment ...................................................................................... 8
Observing and Reporting Misconduct ............................................................................................... 11
Organizational Justice ...................................................................................................................... 17
Open Text Comments Analysis ........................................................................................................ 21
Conclusion ........................................................................................................................... 22
Survey Methodology .......................................................................................................... 25
Methodology ................................................................................................................................. 25
Survey Format .............................................................................................................................. 25
Distribution and Response Rate ................................................................................................... 26
Appendix .................................................................................................................................. i
Demographics ................................................................................................................................. i

Ethical Culture & Perceptions Assessment 1
Executive Summary
Since 2010, the Integrity and Compliance Office (ICO) has conducted a biennial survey assessing
employee awareness of certain resources; perceptions of integrity and compliance in the workplace; and
comfort level related to speaking up to raise concerns or make inquiry when clarity is needed. The survey
serves as one mechanism to identify and measure drivers (also referred to herein as key performance
indicators) of ethical conduct, opportunities to strengthen workplace culture, and effectiveness indicia of
VCU’s Ethics and Compliance program. Noted throughout are comparisons to benchmark statistics from
the 2018 Global Business Ethics Survey (GBES), the leading longitudinal, cross-sectional study of
workplace conduct from the employee’s perspective.
Survey results are widely distributed, beginning with the Board of Visitors Audit, Integrity and Compliance
Committee, VCU’s Compliance Advisory Committee, University Council, cabinet and other key
stakeholder groups. This communication pathway ensures that leaders and compliance partners
understand findings and are equipped to implement strategies for improving our ethical culture.
This assessment is made possible by 1,618 unique respondents representing all employee types and
major budget units. This cross-section provides a comprehensive view of perceptions in the environment
with a weighted representation from the grouping: University and Academic Professionals and Classified
Staff and those working here between 1-5 years. Additional demographic details are included in the
appendix.
Overall, results are positive and demonstrate the university’s commitment to accountability through
ongoing measurement and response to the voice of the university community. Results show that
expectation-setting and reporting resources remain well-known, and individuals continue to speak up.
Along with a generally healthy ethical environment, results also identified opportunities for reflection and
UAP or Classified Staff
66%
Faculty20%
Student Workers
7%
Hourly Staff7%
Less than 1 Year16%
1-5 Years34%
6-10 Years18%
11-20 Years19%
More than 20 Years13%

Ethical Culture & Perceptions Assessment 2
consideration of responsive strategies, which also align with the recommendations made by Ethisphere
in the recent effectiveness review of VCU’s Ethics and Compliance Program:
Managers would likely benefit from increased training, especially related to handling reported
concerns
Increased incentives to handle concerns appropriately (e.g., consideration for performance
reviews, bonuses, promotion, etc.)
Better communicate policies promoting ethical expectations in a civil and professional working
environment to increase awareness levels
While these topics continue to be covered in annual training requirements and other awareness
initiatives from central offices (ICO, DIE, HR, EAS, etc…), messaging from direct managers and
senior leadership is needed to increase ethical outcomes (e.g., reporting of concerns, retaliation,
rates of misconduct, pressure to compromise standards)
New questions this cycle — prompted by both industry best practices and prior survey results — are
related to:
Clarity of the Code of Conduct and universitywide policies
Values-based decision-making
Respecting students
Sources of pressure to compromise expectations
Key performance indicators are highlighted below along with a brief summary of notable results.
Following this summary, the Detailed Survey Results, Analysis and Suggested Strategies section
provides relevant supporting data.
Awareness of the Program and Resources
(beginning on page 5)
Measures familiarity with resources (including university policies).
New questions this cycle: I believe that VCU Policies are clearly written and easy to understand; I
believe the VCU Code of Conduct clearly communicates expectations.
Familiarity with resources remained consistent with 2017 survey results with 4 out of 5 respondents
agreeing that policies are clearly written and easy to understand.
Familiarity with policies promoting a civil and professional working environment and anti-retaliation
fell 7%, matching the 2015 level (77%).
These results are most likely attributable to ICO awareness and education initiatives— comparable to
the past survey cycle— which included training presentations, compliance week activities, informational
tables at VCU sponsored events, nurturing business relationships, remaining accessible and credible,
and joining several collaborative committees and workgroups. Additionally, awareness and training
surrounding the initial launch of the HR Redesign and its related policies have slowed. A new policy

Ethical Culture & Perceptions Assessment 3
codifying ethical standards was approved in December 2018. These changes may be contributing to the
drop in familiarity with policies promoting a civil and professional working environment.
Perceptions of Employees and Environment (beginning on page 8)
Measures perceptions of ethical conduct and trust related to employee-supervisor relationship.
New questions this cycle: VCU’s core values drive my decisions; VCU’s core values drive decisions
made by others in my area; my area treats students with dignity and respect.
Agreement that employees demonstrate integrity and ethical behavior in performance of duties
remained consistent with the 2017 survey.
91% agreed their area treated students with dignity and respect. The remaining 9% were not
concentrated within any one area.
73% of respondents agreed that VCU’s core values drive decisions made by others in their area and
83% agreed that the core values drive their decisions. This discrepancy is expected as,
psychologically, individuals often rate themselves higher or better than others in surveys. This aligns
with VCU norms created by prior survey responses.
Themes compiled from an open-text field question provided an opportunity to share any additional
perceptions or integrity or compliance comments/concerns; a solicitation for suggestion to improve our
culture; what topics there is a desire to learn more about or any specific rationale for agreement levels
in prior survey responses. The aim is to remain inclusive and responsive to the university community
in ways that resonate.
Observing and Reporting Misconduct (beginning on page 11)
Measures comfort level, observations and reasons for not reporting.
Responsive questions addressed whether concerns were reported and subsequently why respondents
declined to report.
New questions this cycle: The follow-up question, “describe the source of pressure” was presented if
a respondent indicated they felt pressure to bend, break or circumvent expectations.
Respondents expressed less confidence that they would be protected from retaliation, regardless of
reporting to a manager, central office or through the Helpline. Reporting to a central office had the
greatest drop, of 9%, from the prior cycle and remains the least trusted reporting pathway in regard
to retaliation.

Ethical Culture & Perceptions Assessment 4
There was a slight increase (of 4%) from the last cycle in observed or experienced misconduct at
19%; however, this rate remains low in comparison to the national average of 30% reported by the
2018 GBES.
Organizational Justice (beginning on page 17)
Measures feelings toward issue response and resolutions and perceptions of retaliation.
New question this cycle: As a manager, I have received adequate training to successfully manage and
support my employees.
75% of managers feel they have received adequate training on successfully managing employees
16% of respondents offered substantive comments, more than double from the 2017 survey. One in
five comments included either:
A positive remark
General concerns about the culture
Criticisms or suggestions related to ethics, compliance or policy
There was a 9% decrease within the subgroup of respondents who reported misconduct and their
belief that what was reported was fully or partially resolved. This subgroup contains 125 individuals
which is 12% of the respondent population.
Understandably, feelings of uncertainty and unsatisfactory handling of reported concerns is likely
attributable to the fact that communication must often be limited when the resolution is related to
personnel actions. Additionally, little or no follow-up is also a contributor, which illustrates an
opportunity for additional education on the appropriate response to employees by management
when concerns are reported.
The most common types of misconduct observed at VCU:
• 41% Intentionally not following laws, regulations or policy (n=127)
• 40% Repeated extremely disrespectful or unprofessional behavior by a supervisor (n=124)
• 36% Abusive or intimidating behavior by a co-worker (n=111)
The most common types of reported misconduct noted in the GBES
benchmark:
• 26% Intentionally lying to employees or stakeholders
• 21% Abusive/intimidating behaviors by a co-worker
• 15% Decisions or actions taken to benefit an employee over the interests of the organization
Ethical Culture & Perceptions Assessment 5
Detailed Survey Results, Analysis and Suggested Strategies
The following sections contain survey results and conclusions organized into the following themes:
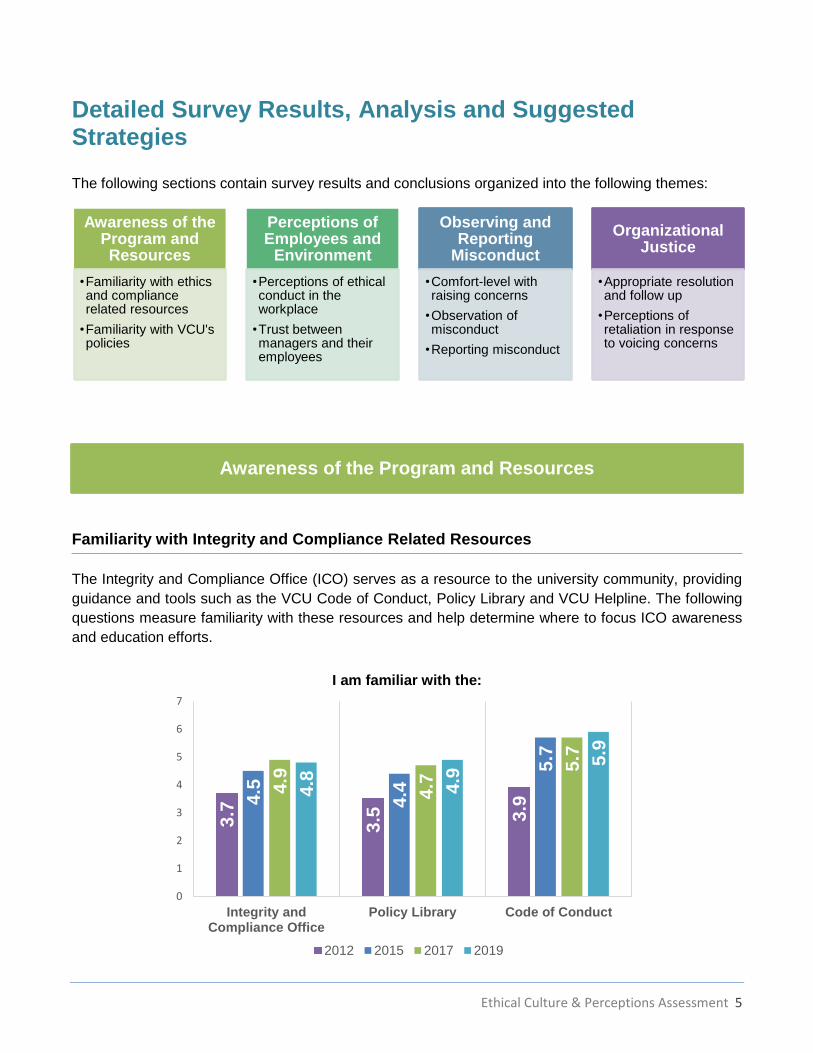
Awareness of the Program and Resources
Familiarity with Integrity and Compliance Related Resources
The Integrity and Compliance Office (ICO) serves as a resource to the university community, providing
guidance and tools such as the VCU Code of Conduct, Policy Library and VCU Helpline. The following
questions measure familiarity with these resources and help determine where to focus ICO awareness
and education efforts.
I am familiar with the:
Awareness of the Program and Resources
•Familiarity with ethics and compliance related resources
•Familiarity with VCU's policies
Perceptions of Employees and
Environment
•Perceptions of ethical conduct in the workplace
•Trust between managers and their employees
Observing and Reporting
Misconduct
•Comfort-level with raising concerns
•Observation of misconduct
•Reporting misconduct
Organizational Justice
•Appropriate resolution and follow up
•Perceptions of retaliation in response to voicing concerns
3.7
3.5 3
.94.5
4.4
5.7
4.9
4.7
5.7
4.8 4.9
5.9
0
1
2
3
4
5
6
7
Integrity andCompliance Office
Policy Library Code of Conduct
2012 2015 2017 2019

Ethical Culture & Perceptions Assessment 6
I am familiar with the VCU Helpline for anonymously voicing concerns or asking questions?
As a manager or other leadership role, I know where I can find resources to assist me in developing appropriate ethical behavior and accountability in my employees.
As a manager, I know where I can find resources to assist me in appropriately responding to and addressing reported compliance and ethical concerns.
Familiarity with the Policy Library grew from 63% in 2017 to 67% this year. This metric is expected to
continue to improve as the Policy Program is further developed, promoted and utilized.
Familiarity with the ICO (64%), VCU Helpline (73%) and VCU Code of Conduct (87%) was consistent
with past years. Most notably, there was a 9% increase in the 7-very familiar response for the Code of
Conduct. This, coupled with 88% agreeing that the Code clearly communicates expectations, indicates
a greater awareness and understanding of employee expectations. This is also reflected by VCU’s
substantiation rate for reported concerns, which has grown from 40% in FY 2017 to 72% in FY 2019.
Familiarity of resources likely remained constant from the 2017 survey due to the ICO’s comparable
education and outreach initiatives (which included training presentations, compliance week activities,
informational tables at VCU sponsored events, and participation in several collaborative committees and
65%
68%
70%
73%
2012 2015 2017 2019
5.2 5.6 6.0
5.8
0
1
2
3
4
5
6
7
2012 2015 2017 2019
5.6 6.0
5.9
0
1
2
3
4
5
6
7
2015 2017 2019

Ethical Culture & Perceptions Assessment 7
workgroups). New approaches to awareness efforts are slated throughout FY2020, with the goal of
nudging familiarity of resources upward using available existing resources.
Familiarity with Policies
Respondents were asked about awareness, familiarity and clarity of policies and procedures. The
purpose of these questions was to evaluate the ease of use and availability of information needed to
accomplish goals in accordance with VCU’s expectations.
I believe that VCU Policies are clearly written and easy to understand.
I believe the VCU Code of Conduct clearly communicates expectations.
How familiar are you with VCU's policies promoting an ethical culture, a civil and professional working environment, and anti-retaliation for reporting concerns?
Familiarity with policies promoting a civil and professional working environment and anti-retaliation fell
7%, bringing familiarity back to 2015 levels (77%). This survey result is of concern since the Expectations
of Ethical Conduct policy was recently approved and communicated (December 2018). In collaboration
with senior leadership, the ICO will focus future communications on applications of this policy and other
related policies to increase awareness and application of these behavioral standards. However,
79%
14%
8%
Agree Neither agree/disagree Disagree
88%
7%4%
Agree Neither agree/disagree Disagree
4.7 5
.3 5.7
5.4
0
1
2
3
4
5
6
7
2012 2015 2017 2019

Ethical Culture & Perceptions Assessment 8
measurable progress is dependent on area managers and others in leadership positions doing the same.
Research has shown that communicating about the importance of ethics through real incidents and
instances of addressing misconduct reinforces the importance of policies and holding employees
accountable.
Perceptions of Employees and Environment
Perceptions of Ethical Conduct in the Workplace
The following questions were included in the survey to measure ethical perceptions of peers and those
in leadership roles.
I believe that most employees at VCU demonstrate integrity and ethical behavior in performance of their job duties.
I believe that most employees in leadership positions at VCU demonstrate integrity and ethical behavior in performance of their job duties.
VCU’s core values drive my decisions.
VCU’s core values drive decisions made by others in my area.
5.5
5.5 5.7
5.6
0
1
2
3
4
5
6
7
2012 2015 2017 2019
5.4
5.4 5.5
5.3
0
1
2
3
4
5
6
7
2012 2015 2017 2019
83%
11%6%
Agree Neither agree/disagree Disagree
73%
16%
12%
Agree Neither agree/disagree Disagree

Ethical Culture & Perceptions Assessment 9
I believe that my area treats students with dignity and respect.
Agreement that most employees demonstrate integrity and ethical behavior in the workplace remained
consistent from 2017; however, there was a 6% drop in the 7-strongly agree response when respondents
rated those in leadership positions. On its face, this is not an overtly negative result; however, this change
will be monitored through other data sources to ensure early detection of any potential negative or positive
trend. Leadership is encouraged to weave in VCU’s core values and mission statement application when
explaining, communicating or making decisions. This promotes transparency in the decision-making
process and may help to counteract negative perceptions. This also strengthens the ethical tone from
the top and exemplifies how organizational ethics fuel thought processes.
Looking at the two new questions related to values-based decision making, it is not surprising that 73%
of respondents agreed that VCU’s core values drive decisions made by others in their area while 83%
agreed that the core values drive their decisions. This demonstrates employees may be overconfident in
their own ethical-decision making; thus, mirroring findings from decades of research related to the effect
known as the overconfidence bias. For example, a recent research survey found 50% of respondents
believed they were in the top 10% ethically, which is statistically impossible (Di Miceli da Silveira, 2018).1
Perception also has a real impact on ethical culture. The Global Business Ethics Survey (GBES) found
that when people are encouraged to base decision-making on organizational values and standards
favorable ethics outcomes (e.g., increased reporting of concerns, less retaliation, lower rates of
misconduct, reduced pressure to compromise) are increased by 11x. Per GBES, one example of this is
the number of voiced concerns rising by 94% when top management verbally promotes workplace
integrity. The significance of this at VCU is further explored in the Observing and Reporting Misconduct
section of this report.
This year’s survey also asked whether the respondent believed their area treated students with dignity
and respect. The overwhelming majority agreed in the positive with only 4% disagreeing. Of this 4%, no
1 Silveira, Alexandre Di Miceli da. The Virtuous Barrel: How to Transform Corporate Scandals into Good Businesses via Behavioral Ethics. 2018.
91%
5%4%
Agree Neither agree/disagree Disagree

Ethical Culture & Perceptions Assessment 10
specific school or unit stood out; however, most areas disagreeing were located within the Office of the
Provost or one of the schools/colleges that report up through the Provost. It may be that these areas or
more indicative of actual culture in this area since these areas have more frequent interaction with
students in comparison to other units. This will be monitored in other data sources for trends in either
direction.
Trust Between Managers and Their Employees
These questions measure the level of trust employees feel with their direct manager, which impacts
comfort in speaking up to establish clarity or to report concerns, demonstrating ethical conduct and
accountability, and contributing to overall organizational health.
My manager trusts me to do my job well and with integrity.
I trust my manager to support me in my role and follow through on promises and commitments.
The GBES found that employees who felt their managers demonstrated accountability are almost 24x
more likely to believe managers are open, honest and care about employees as people. At VCU, 92% of
employees indicated that their manager trusts them to do their job well and with integrity, while 82%
agreed that they trust their supervisor to support them and follow through on promises/commitments.
While, this is a positive indicator of healthy relationships between employees and their direct manager
(for reasons noted above in the GBES), the 7% decrease in agreement that managers will follow through
on promises and commitments should be explored further.
Agree95%
Agree92%
3% 4%
2% 4%
2017 2019
Agree Neither agree/disagree Disagree
Agree89%
Agree82%
5%7%
6% 12%
2017 2019Agree Neither agree/disagree Disagree
Ethical Culture & Perceptions Assessment 11
Observing and Reporting Misconduct
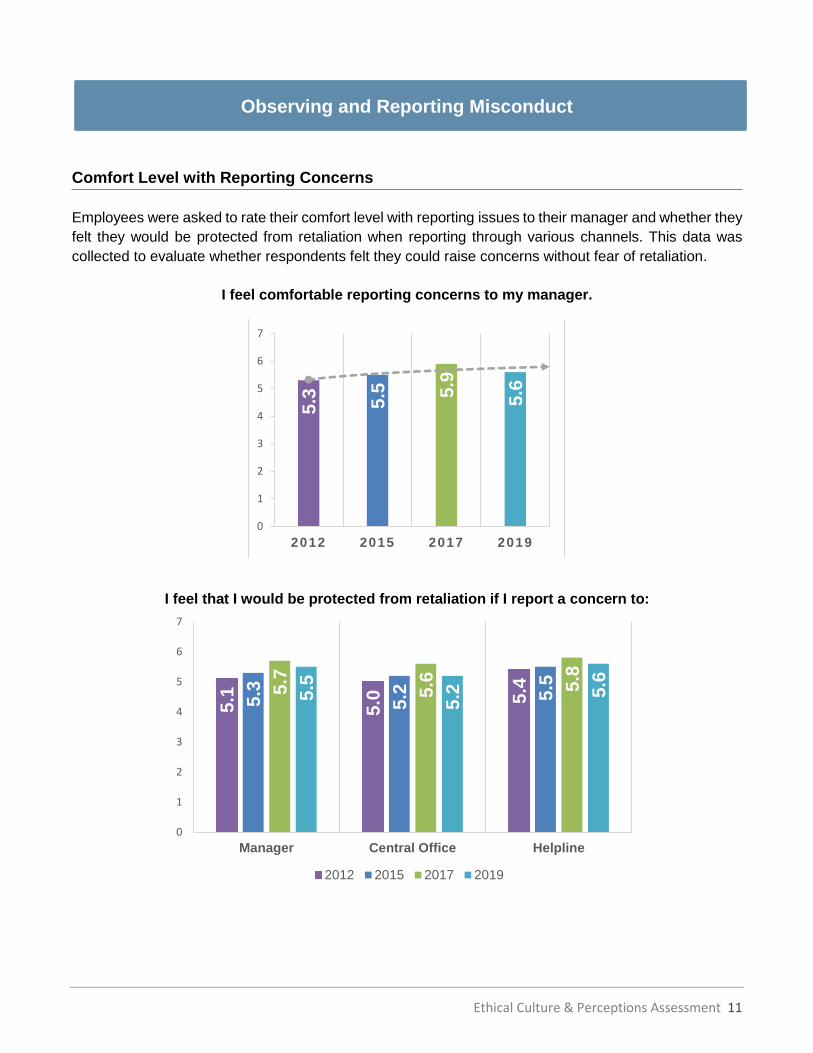
Comfort Level with Reporting Concerns
Employees were asked to rate their comfort level with reporting issues to their manager and whether they
felt they would be protected from retaliation when reporting through various channels. This data was
collected to evaluate whether respondents felt they could raise concerns without fear of retaliation.
I feel comfortable reporting concerns to my manager.
I feel that I would be protected from retaliation if I report a concern to:
5.3 5.5 5
.9
5.6
0
1
2
3
4
5
6
7
2012 2015 2017 2019
5.1
5.0 5
.4
5.3
5.2 5.55.7
5.6 5.8
5.5
5.2 5
.6
0
1
2
3
4
5
6
7
Manager Central Office Helpline
2012 2015 2017 2019

Ethical Culture & Perceptions Assessment 12
Since 2017, respondents expressed less confidence that they would be protected from retaliation if
reporting to a manager, central office or through the Helpline. Reporting to a central office had the
greatest drop of 9% from the prior year and remains the least trusted reporting pathway.
Although fear of retaliation is a commonly cited deterrent to reporting concerns across all industries and
is reflected at low levels in VCU’s data (21 reporters noted fear of retaliation when reporting misconduct),
the university receives very few allegations of actual retaliation or threat of retaliation (7 in the last two
years) and none of these allegations were substantiated (and one is pending as of August 5, 2019).
However, retaliation is often difficult to substantiate, is subjective and may not meet VCU’s policy
definition of retaliation.2
While substantiated retaliation is low at VCU, research has shown that perceptions drive behavior, which
is why management’s involvement in addressing this perception is paramount to easing fears (GBES).
The 2018 GBES found ethical outcomes increased 14x when employees felt encouraged to speak up.
Encouragement has been suggested by this research to be as simple as routinely asking for feedback or
whether the employee has any concerns or questions about anything. This is in contrast to a traditional
leadership approach of assuming employees will speak up without routine or pro-active invitation to do
so. Other strategies include:
Showing great appreciation (whether with words or more tangible incentives like spot or bonus
awards) when an employee speaks up regardless of whether the concern is substantiated (as
long as it has some merit)
Publicly acknowledging when issues were raised, praising this behavior and sharing the resolution
during staff/department meetings
2 Additional findings related to retaliation are noted on pages 19-21.

Ethical Culture & Perceptions Assessment 13
Observation of Misconduct
The following questions assess perceptions of misconduct, whether experienced or observed.
I was asked (or felt pressure to) bend, break or circumvent laws, regulations and/or university policies during the last 12 months by someone in my department.
Please describe the source of pressure.
I directly experienced or observed a violation of law/regulation, university policy or our Code of
Conduct within my area in the last 12 months.
5% 4% 3%7%
No95%
No96%
No90%
2015 2017 2019
Yes Pressured; not directly asked No
Dept mgmt or senior leader
28%
Other colleagues
26%
Direct manager
24%
Unspoken culture
20%
Direct reports2%
8% 7% 9%11% 8% 10%
No81%
No85%
No81%
2015 2017 2019
Yes I believe so, but I can't be certain No

Ethical Culture & Perceptions Assessment 14
For individuals who observed misconduct [n=308 or 19% of all respondents]: How would you describe the misconduct you directly experienced or observed?
Respondents who observed misconduct increased 4%, returning to the 2015 level (19%). As in past
years, a discrepancy remains between reported rates of “experienced and/or observing misconduct’” and
those reporting being “directly asked to bend, break or circumvent laws, regulations or policy.” This
implies that respondents observe misconduct more often than they experience it themselves or
perceptions of misconduct may be greater than actual occurrences.
Some suggested strategies to address perceptions of misconduct include:
Ensuring process transparency and explaining the basis, or “the why”, of decisions
Respecting shared governance by seeking input from everyone impacted by a decision
Routinely and directly asking if individuals have concerns, questions or feedback
Using the above strategies as guidance, initiating conversations with those who may have an
unintended impression or impact
This cycle, we asked about perceived pressure to bend, break or circumvent the rules and from where
that pressure stemmed. Seven percent, or 110 respondents, answered that they felt pressure. The source
41%
40%
36%
29%
26%
14%
11%
6%
4%
3%
3%
2%
8%
37%
35%
28%
28%
22%
13%
10%
7%
5%
5%
2%
4%
6%
Intentionally not following laws, regulations or policy
Repeated, extremely disrespectful or unprofessionalbehavior in the workplace by a supervisor
Abusive or intimidating behavior by a co-worker
Decisions/action taken to benefit an employee overthe interests of the university
Intentionally lying to employees
Discrimination based on protected class
Falsifying documents/records
Stealing or theft of university resources
Plagiarism or other violation of academic integrity
Sexual misconduct
Substance abuse on the job
Research misconduct
Other
2019
2017

Ethical Culture & Perceptions Assessment 15
of the pressure was evenly distributed among senior leaders/management, colleagues and their direct
manager, with slightly less reporting that pressure was perceived from an unspoken cultural norm. This
is an important element to continue tracking since the Global Business Ethics Survey has shown that as
pressure to comprise rules rises, misconduct also increases:
Figure 1: 2018 GBES
Intentionally not following laws, regulations and policies remains the most frequently cited type of
misconduct observed, equating to 8% of all respondents. Eight percent of respondents also reported they
experienced or observed repeated, extremely disrespectful or unprofessional behavior in the workplace
by a manager, which is a decrease of 3% since 2017 (and 9% from 2015). This category remains the
second most cited type of misconduct from the 2017 survey.
In contrast, the GBES reported that 30% of employees nationwide observed misconduct in the workplace.
VCU’s significantly lower rate of 19% is a positive indicator of the VCU culture and of the Ethics and
Compliance Program’s effectiveness.
Reporting of Misconduct
Reporting misconduct internally to VCU is the desired outcome for almost all organizations. Individuals
reporting internally demonstrates existence of trust, a desire to have the organization self-correct, or
provide clarity, and enables agility in responding and keeping costs related to addressing concerns down.
The following charts illustrate the additional details provided by respondents who responded that they
had experienced or observed misconduct in the last 12 months (19%).

Ethical Culture & Perceptions Assessment 16
Did you voice your concern? 3
If not, why didn’t you voice your concern? (n=119 or 6% of all respondents)
3 This question was only asked if respondents replied “yes” or “I believe so but I can’t be certain” to “I directly experienced or observed a violation of laws, regulations or university policy in my office/department within the last 12 months.”
Yes43%
Yes53%
Yes60%
Yes62%
No57%
No47%
No40%
No38%
2012 2015 2017 2019
63%
38%
24%
21%
18%
10%
8%
7%
3%
47%
34%
17%
17%
20%
11%
12%
13%
9%
61%
43%
12%
19%
12%
12%
12%
9%
7%
Belief the concern would not be appropriatelyaddressed
Fear of retaliation by a supervisor
Unaware of reporting options
Fear of retaliation by coworkers
Management already aware of the concern
Other
Management in the area discourages reportingconcerns
Someone else already reported the concern
Resolved before opportunity to speak up
2019
2017
2015

Ethical Culture & Perceptions Assessment 17
Sixty-two percent of respondents reported the misconduct they experienced or observed in the last 12
months. This is a slight increase of 2% from the 2017 survey, which is less than the benchmark reporting
rate of 76% noted in the GBES.
This cycle, belief that a reported concern would not be appropriately addressed (63% or n=75) was cited
as the number one reason employees chose not to report their concerns (up from 47% in 2017 and 61%
in 2015). For external context, the GBES found 69% did not report concerns because they believed
“corrective action would not be taken.” At VCU, this belief was followed by fear of retaliation by a
supervisor at 38% (n=45) and unaware of reporting options at 24% (n=28).
Of those who observed misconduct at VCU (n=314), a majority of this sub-population (62% or n=195)
chose to report their concern, which remains notably lower than the 79% benchmark in the GBES. The
fact that these topics have been covered in annual Integrity & Compliance Education since 2013 indicates
that other approaches are necessary to reduce the perception that concerns are not appropriately
addressed.
Managers would likely benefit from the following suggested strategies:
Stand-alone training on handling reported concerns
Further incentives to consistently put the training they received on this topic into practice
Lastly, the ICO will continue to communicate reporting options and the university’s anti-retaliation policy
and will begin more direct communication about results from reported incidents; however, additional
messaging from leaders and managers promotes awareness and understanding.
Organizational Justice
Organizational justice refers generally to employee perceptions of fairness in the workplace (more
specifically related to outcomes, processes, information and treatment). The three distinct dimensions of
organizational justice are procedural, distributive and interactional. This survey section aimed to measure
satisfaction of issue response and resolution and inquired as to feelings and perceptions related to
conduct in the workplace after voicing concerns, supporting procedural and interactional justice
dimensions (the latter being a heavily weighted factor in assessing culture). Measuring and monitoring
these components is critical to understanding more about what is, or is not, reported and why.

Ethical Culture & Perceptions Assessment 18
Adequate Training to Support Employees
Feeling prepared and supported by the university is critical for managers if they are expected to address
employee concerns appropriately. Training on how to best manage and support employees in our
environment, and in line with core values, is one key indicator of sufficient support and has been added
this year to measure how the specific group of management feels about being in their role.
As a manager, I have received adequate training to successfully manage and support my employees.
While the majority of managers felt they received adequate training to successfully carry out their
management responsibilities, a quarter responded that this type of support is lacking at VCU. The ICO is
already working with compliance partners throughout the university, including HR, to provide additional
training and resources to managers. This metric is expected to trend positive as a result.
Appropriateness of Resolution and Follow-up
Fair and consistent corrective action in response to reported concerns is a foundational element to an
effective ethics and compliance program. Employee perception that reported concerns are addressed
appropriately also drives propensity to voice concerns and encourage others to do so, and thus is a key
indicator of an ethical workplace culture. The following charts illustrate perceptions of the 62% of
respondents (n=195) who reported concerns over the last 12 months.
75%
12%
14%
Agree Neither agree/disagree Disagree

Ethical Culture & Perceptions Assessment 19
Was the matter properly resolved? (n=195 or 12% of all respondents)
Of those individuals who reported misconduct, 31% of this population felt the matter was fully or partially
resolved, which is a 9% decrease from the 2017 survey. It is suspected that the unsatisfactory and unsure
rates are likely influenced by limited details of the resolution being communicated when related to
personnel actions.
Little or no follow-up is also a contributor, indicating there is an opportunity for additional education on
appropriate response to employees by management when concerns are reported. Since, the 2017
survey, new employee orientation, annual Integrity & Compliance Education and the Code of Conduct
were all updated to reflect best practices in handling concerns; however, there was no significant increase
in positive impact via this year’s survey. This may illustrate a greater need for macro-communications;
additional manager training to bolster environments conducive to soliciting and receiving individual level
feedback; measuring and incentivizing appropriate handling of concerns; and ways to demonstrate and
reward a commitment to accountability.
Perceptions of Retaliation in Response to Voicing Concerns
When employees voice concerns, managers become aware of issues, creating opportunities for early
intervention with the desired result of higher employee satisfaction and engagement and lower cost to
the organization. When employees perceive retaliation as a response to speaking up, this is detrimental
to the culture, as employees often learn to not report future incidents and likely share negative
experiences with others. For these reasons, the 62% of respondents (n=195) who did report concerns
were asked more detailed questions. This cohort was asked whether they felt they experienced any type
of retaliation for speaking up and if they responded yes, they were asked from where the perception
manifested.
No
Not sure; nofollow-up
MostlyYes
ResolutionPending
2019 2017 2015

Ethical Culture & Perceptions Assessment 20
Do you feel that you experienced any type of retaliation for speaking up? (n=195 or 12% of all
respondents)
Please describe the retaliation you may have experienced as a result of speaking up. (n=68 or
35% of respondents who voiced a concern)
Thirty-five percent of respondents who voiced concerns felt they were retaliated against for speaking up
(n=68). For comparison, the GBES found that 53% of respondents felt they were retaliated against
nationwide. At VCU, the most common type of retaliation described was a manager ignoring or treating
an employee differently (57%), followed by manager/management excluding employees from decisions
and work activities (53%). This data suggests that managers would benefit from increased training on
No65%
No65%
19% 14%
16% 21%
2017 2019
No I'm not sure, but I think so Yes
57%
53%
49%
31%
22%
18%
15%
13%
9%
22%
61%
42%
36%
27%
20%
3%
4%
19%
10%
10%
My supervisor or management intentionallyignored or began treating me differently
My supervisor or management excluded me fromdecisions and work activities
Other employees intentionally ignored or begantreating me differently
I was not given promotions or raises
I was verbally abused by a supervisor or someoneelse in management
I almost lost my job
I was verbally abused by other employees
I was demoted or my responsibilities wereremoved
I was relocated or reassigned
Other
2019
2017

Ethical Culture & Perceptions Assessment 21
avoiding retaliation and the appearance of retaliation. As noted in the Reporting of Misconduct section
above, this topic was highlighted in annual Integrity & Compliance Education and the Code of Conduct.
This education, in combination with planned messaging over the next year, is expected to positively
impact these metrics between now and the 2019 survey.
The Global Business Ethics Survey also found the following retaliation trends, which are helpful to identify
when it usually occurs and what environmental factors impact the likelihood of it occurring:
Figure 2: 2018 GBES
Figure 3: 2018 GBES
Open Text Comments Analysis
Themes of Open Text Comments
Employees had the opportunity to share comments related to an ethical and compliance environment at
VCU in an open-ended text field. A total of 266 substantive comments were shared, more than double
from 2017, representing 16% of survey respondents. General themes from these comments in
comparison to the last two cycles are as follows:

Ethical Culture & Perceptions Assessment 22
About one-fifth of respondents either noted a positive attribute of VCU’s ethical culture, a concern about
it or provided a suggestion/criticism, providing specific enhancements to consider.
More specific comments related to unethical leadership decisions and less accountability for higher-
ranking employees remained consistent from last cycle however has markedly increased over the last
two cycles; requests for training (usually related to managers) and management’s response to reported
concerns were noted as needing improvement. General mentions of discrimination, diversity and
inclusion and resources or support related concerns were also noted this year.
20%
18%
18%
16%
12%
11%
10%
10%
8%
6%
5%
3%
8%
4%
19%
23%
9%
10%
6%
8%
9%
8%
22%
12%
9%
25%
16%
7%
11%
5%
Overall Positive Comments
Concerns about VCU's Ethical Culture
General Ethics, Compliance and Policy Suggestions &Criticisms
Unethical Leadership & Less Accountability for HigherLevel Employees
Request for Increased Training/Awareness
Response to Concerns Needs Improvement
Lack of Civility & Respect in the Workplace
Discrimination, Diversity and Inclusion
Fear of Retaliation for Speaking Up
Employees not Held Accountable
Concerns about Resources or Support
Inconsistent Application of Policy or Ignoring Policy
2019
2017
2015

Ethical Culture & Perceptions Assessment 23
Conclusion & Recommendation
Proactive communication about expectations and our core values
can have a profound impact on our ethical culture. As indicated in
trend analysis of survey data, the Ethics and Compliance Program
has reached a point of maturity where increased efforts by the ICO
result in minor incremental advances. For this reason, manager
involvement in directly messaging and modeling expectations and
ethical decision-making, as well as routinely encouraging
employees to speak up, is necessary to generate greater positive
change. Benefits of ethical engagement by managers are proven
to be effective. According to the GBES, when organizations
prioritize integrity, employees are:
Less likely to feel pressure to violate ethics standards
Less likely to observe misconduct
More likely to report misconduct they observe
Less likely to experience retaliation for reporting
The GBES also revealed five management strategies that promote
an ethical workplace culture, reducing risk for employees and
organizations:
MAKE ETHICS A LEADERSHIP
PRIORITY
Make discussion of values a regular part of meetings and communications.
Ensure that ethical conduct and leadership is a highlighted area in performance reviews at all levels of management.
Institute programs, e.g., case studies, to promote regular dialogue about values between supervisors and their reports.
FOCUS ON ACHIEVING
SUCCESS THE RIGHT WAY
Evaluate goals to determine whether they are reasonably attainable without compromising organizational values and standards.
Develop a system for employees to give candid feedback about goals and their feasibility.
Examine performance review documents and processes to ensure that ethical conduct is a stated expectation, especially for promotion and advancement.
Create reward and incentive programs for ethical conduct.
1
2
THE VALUE
OF TALKING
VALUES
When managers talk about our core values and speaking up, it has a profound impact on our culture:
BELIEF THERE IS TRUST
IN THE ENVIRONMENT
When managers DON’T talk about these topics, it has an impact too:
BELIEF THERE IS TRUST IN THE
ENVIRONMENT
0%
Employees of managers who talk about
the importance of ethics are
12x MORE
ENCOURAGED TO SPEAK UP
HIGH-TRUST WORKPLACES
PAY DIVIDENDS
HIGH RETURN ON
INVESTMENT

Ethical Culture & Perceptions Assessment 24
BE ATTUNED TO THE IMPACT OF ORGANIZATION
AL CHANGE
Be particularly mindful and proactive about communications during times of added stress.
Encourage managers to regularly check in with their direct reports, keeping them informed and creating a vehicle for dialogue should issues arise.
NURTURE A SPEAK UP CULTURE
Create multiple formal and informal avenues for employees to present ideas and raise issues, whether they are business or ethics concerns.
Respond in a timely manner to questions and concerns.
Develop and publicize formal systems for checking in with employees who report misconduct, providing protection from retaliation.
BE TRANSPARENT
Foster an open, learning mindset by regularly addressing “What we’re doing well” and “What we’ve learned we need to do better.”
Encourage leaders at all levels to discuss problems and learning that occurred as a result.
Communicate about issues and the steps the organization has taken to address problems, issues and ethical misconduct.
3
4
5

Ethical Culture & Perceptions Assessment 25
Survey Methodology
Methodology
The following key indicators of ethical culture were assessed:
Survey results were benchmarked against prior year surveys conducted by the ICO as well as the most
recent 2018 Global Business Ethics Survey (GBES)—a longitudinal, cross-sectional study of ethics in
workplaces—conducted by the Ethics & Compliance Initiative (ECI).
Survey Format
The 2019 Ethical Culture & Perceptions Survey was comprised of 40 questions. A seven-point linear
scale was used to measure familiarity (not at all to very familiar) and agreement (strongly disagree to
strongly agree) with four as a neutral value. Percentages are reported in rounded whole numbers.
Thirty-four questions covered ethical perceptions of our culture
One open-ended text field was offered to collect any additional comments related to ethics and
compliance (themes from these comments are shared at the end of this report)
Five demographic questions allow for further analysis of perceptions based on department,
employee type, years of service, etc.
Awareness of the Program and Resources
8 questions: Familiarity with the Integrity and Compliance Office, VCU's Ethics and Compliance Program, expectations and related resources
Perceptions of Employees and Environment
11 questions: Ethical perceptions of peers and leadership; and trust betweenmanagers and subordinates
Observing and Reporting Misconduct
10 questions: Directly observed misconduct, comfort level with reporting theseincidents and perceived deterents for reporting
Organizational Justice
3 questions: Perception of whether employees are held accountable

Ethical Culture & Perceptions Assessment 26
Distribution and Response Rate
The survey was announced on Wednesday, March 20, 2019 through a broadcast email to all employees
and closed on Friday, April 26, 2019. Employees had a total of 28 business days to participate in the
anonymous, online survey. Reminders from senior leaders, managers and local HR were also prompted
over this period.
This cycle’s response rate is 15% (1,618 respondents), which is a 48% decrease in the number of
participants from the prior survey cycle (3,093 respondents). This is most likely attributable to a new
limitation on broadcast emails (one per activity) and the number of other surveys distributed to the
employee population shortly before or during this survey. For context, approximately 49% of recipients
opened the broadcast email and 9% clicked on the survey link.
The incentive offered may also be a factor. In past years, a chance to win prizes such gift cards was
advertised to encourage participation. This year, participation was incentivized by a donation to RamParty
(VCU’s student food bank) proportional to the participation rate (every 1% participation = $10 donation).
It is notable that feedback from the university community on this incentive was significantly positive. The
ICO is considering several solutions to increase participation in the 2021 survey.
In summation, the results of this year’s survey are similar to the last cycle and remain useful indicators
of ethical culture.
1660
2100
2522
3093
1618
2010 2012 2015 2017 2019
Survey Engagement

Ethical Culture & Perceptions Assessment i
Appendix
Demographics
All employee types, major budget units, campus locations and years of service are represented in this
year’s survey. Below is a breakdown of respondents based on these criteria.
The following best describes my job title or duties:
I am in Senior Leadership:
I am primarily located on the:
I have been employed by VCU for:
0%
10%
20%
30%
40%
50%
60%
70%
UAP or Staff Faculty StudentWorkers
Hourly Staff
Survey Respondents VCU Benchmark
0%
10%
20%
30%
40%
50%
60%
70%
80%
90%
100%
Yes No
Survey Respondents VCU Benchmark
0%
10%
20%
30%
40%
50%
60%
70%
Monroe ParkCampus
Medical CenterCampus
Qatar Campus
Survey Respondents VCU Benchmark
0%
10%
20%
30%
40%
Less than1 Year
1-5 Years 6-10Years
11-20Years
More than20 Years
Survey Respondents VCU Benchmark

Ethical Culture & Perceptions Assessment i
I am located in the following unit:
0%
10%
20%
30%
40%
50%
60%
Office of theProvost /School /College
Health Sciences Administration Finance andBudget
Research andInnovation
UniversityRelations
Developmentand AlumniRelations
All Other Areas
Survey Respondents VCU Benchmark


![Creating an Ethical Business Culture [Read-Only] · Creating an Ethical Business Culture ... Assumptions Enable responsible ... Internalization of organizational values Process for](https://img.pdfslide.net/doc/110x75/5b686fe57f8b9a20388c9f71/creating-an-ethical-business-culture-read-only-creating-an-ethical-business.jpg)