Embed Size (px)
Citation preview

ASSESSMENT OF A STATIC MULTIBEAM SONAR SCANNER FOR 3D SURVEYING INCONFINED SUBAQUATIC ENVIRONMENTS
E. Moisana,b∗, P. Charbonniera, P. Fouchera, P. Grussenmeyerb, S. Guilleminb, O. Samatc, C. Pagesc
a Cerema Est, Laboratoire de Strasbourg, 11 rue Jean Mentelin, B.P. 9, 67035 Strasbourg, France{Emmanuel.Moisan, Pierre.Charbonnier, Philippe.Foucher}@cerema.fr
b ICube Laboratory UMR 7357, Photogrammetry and Geomatics Group, INSA Strasbourg, 24 Boulevard de la Victoire,67084 Strasbourg, France - {pierre.grussenmeyer, samuel.guillemin}@insa-strasbourg.fr
c SUB-C MARINE, 18 Alfred Nobel - BP 24, 69320 Feyzin, France - {os, cp}@subcmarine.com
Commission V, WG V/3
KEY WORDS: 3D modelling, accuracy assessment, Mechanical Sonar Scanner, Terrestrial Laser Scanner
ABSTRACT:
Mechanical Scanning Sonar (MSS) is a promising technology for surveying underwater environments. Such devices are comprisedof a multibeam echosounder attached to a pan & tilt positioner, that allows sweeping the scene in a similar way as Terrestrial LaserScanners (TLS). In this paper, we report on the experimental assessment of a recent MSS, namely, the BlueView BV5000, in a confinedenvironment: lock number 50 on the Marne-Rhin canal (France). To this aim, we hung the system upside-down to scan the lockchamber from the surface, which allows surveying the scanning positions, up to an horizontal orientation. We propose a geometricmethod to estimate the remaining angle and register the scans in a coordinate system attached to the site. After reviewing the differenterrors that impair sonar data, we compare the resulting point cloud to a TLS model that was acquired the day before, while the lock wascompletely empty for maintenance. While the results exhibit a bias that can be partly explained by an imperfect setup, the maximumdifference is less than 15 cm, and the standard deviation is about 3.5 cm. Visual inspection shows that coarse defects of the masonry,such as stone lacks or cavities, can be detected in the MSS point cloud, while smaller details, e.g. damaged joints, are harder to notice.
1. INTRODUCTION
In this contribution, we propose to evaluate the capacities of aMechanical Sonar Scanner (MSS) for underwater surveying ina confined environment, by comparing the 3D model of a canallock, provided by the sonar device, to a reference model obtainedwith a Terrestrial Laser Scanner (TLS).
3D mechanical sonar scanning is an emerging technology thatproduces 3D point clouds in a similar manner as TLS. In thiswork, we consider a Blueviewr (www.blueview.com) BV5000scanner. It is composed of an underwater measuring device (amultibeam echosounder, MBES) and a tiltable mechanical rota-tion system that enables sweeping the scene around. The sys-tem may be placed on a tripod and operated from the floor of thecanal, or hung upside-down for scanning from the surface.
To our best knowledge, only a few papers address the problemof evaluating the metrological capacities of such a system in op-erating conditions. We may cite (Rondeau et al., 2012) and(Rondeau et al., 2015) for MBES in dynamic applications and(Lesnikowski and Rush, 2012) for a point-wise evaluation of theBV5000. In (Moisan et al., 2015), we outlined a qualitative anal-ysis of the difficulties relative to the use of a MSS in a canal.In the present paper, we propose a qualitative and quantitativeassessment of the measuring abilities of a MSS based on a com-parison between the point clouds obtained using a MSS and aTLS.
More specifically, we took the opportunity provided by the com-plete emptying of a canal lock for maintenance to make its com-prehensive survey using a TLS (namely, the Faror Focus 3DX330). Since the model accuracy is better than the centimeter,
∗Corresponding author
Figure 1. Top: aerial view of lock No. 50 on the Marne-Rhinecanal. Bottom left: view of the lock during maintenance opera-tions and 3D TLS surveying of the chamber; bottom right: afterrefilling.
it can be chosen as reference. After that, the lock was filled againand the MSS survey was performed. As for its terrestrial counter-
The International Archives of the Photogrammetry, Remote Sensing and Spatial Information Sciences, Volume XLI-B5, 2016 XXIII ISPRS Congress, 12–19 July 2016, Prague, Czech Republic
This contribution has been peer-reviewed. doi:10.5194/isprsarchives-XLI-B5-541-2016
541
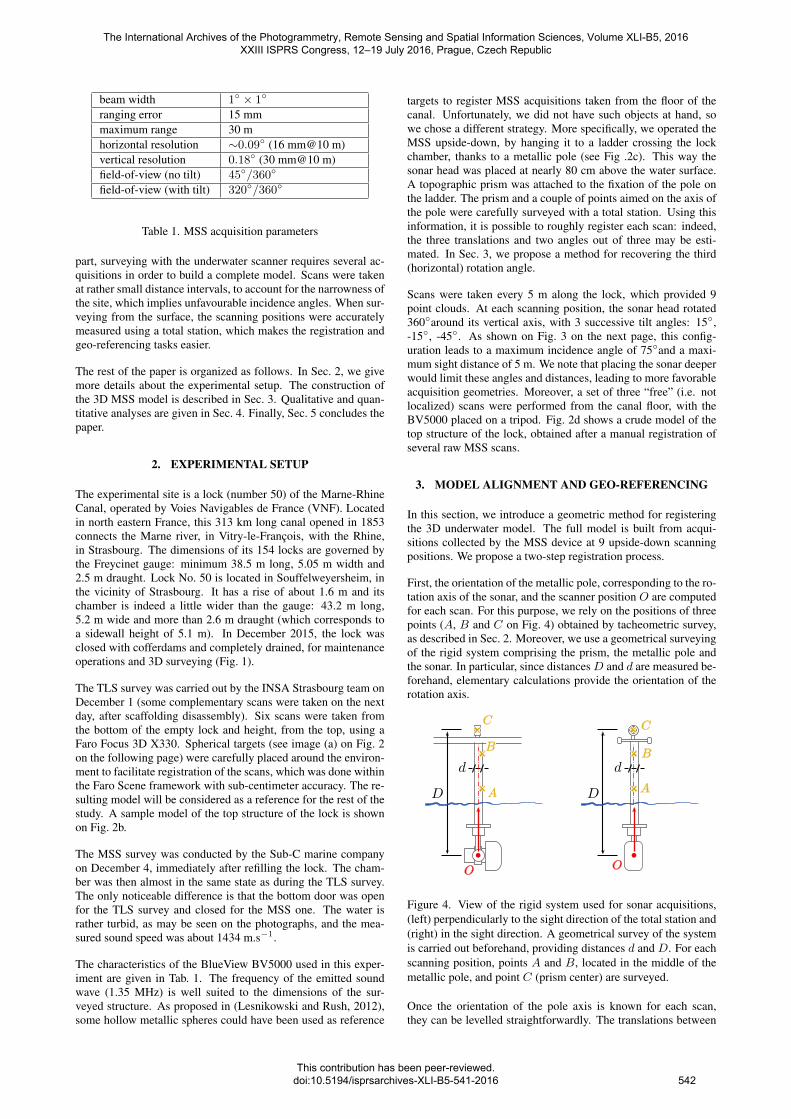
beam width 1◦ × 1◦
ranging error 15 mmmaximum range 30 mhorizontal resolution ∼0.09◦ (16 mm@10 m)vertical resolution 0.18◦ (30 mm@10 m)field-of-view (no tilt) 45◦/360◦
field-of-view (with tilt) 320◦/360◦
Table 1. MSS acquisition parameters
part, surveying with the underwater scanner requires several ac-quisitions in order to build a complete model. Scans were takenat rather small distance intervals, to account for the narrowness ofthe site, which implies unfavourable incidence angles. When sur-veying from the surface, the scanning positions were accuratelymeasured using a total station, which makes the registration andgeo-referencing tasks easier.
The rest of the paper is organized as follows. In Sec. 2, we givemore details about the experimental setup. The construction ofthe 3D MSS model is described in Sec. 3. Qualitative and quan-titative analyses are given in Sec. 4. Finally, Sec. 5 concludes thepaper.
2. EXPERIMENTAL SETUP
The experimental site is a lock (number 50) of the Marne-RhineCanal, operated by Voies Navigables de France (VNF). Locatedin north eastern France, this 313 km long canal opened in 1853connects the Marne river, in Vitry-le-Francois, with the Rhine,in Strasbourg. The dimensions of its 154 locks are governed bythe Freycinet gauge: minimum 38.5 m long, 5.05 m width and2.5 m draught. Lock No. 50 is located in Souffelweyersheim, inthe vicinity of Strasbourg. It has a rise of about 1.6 m and itschamber is indeed a little wider than the gauge: 43.2 m long,5.2 m wide and more than 2.6 m draught (which corresponds toa sidewall height of 5.1 m). In December 2015, the lock wasclosed with cofferdams and completely drained, for maintenanceoperations and 3D surveying (Fig. 1).
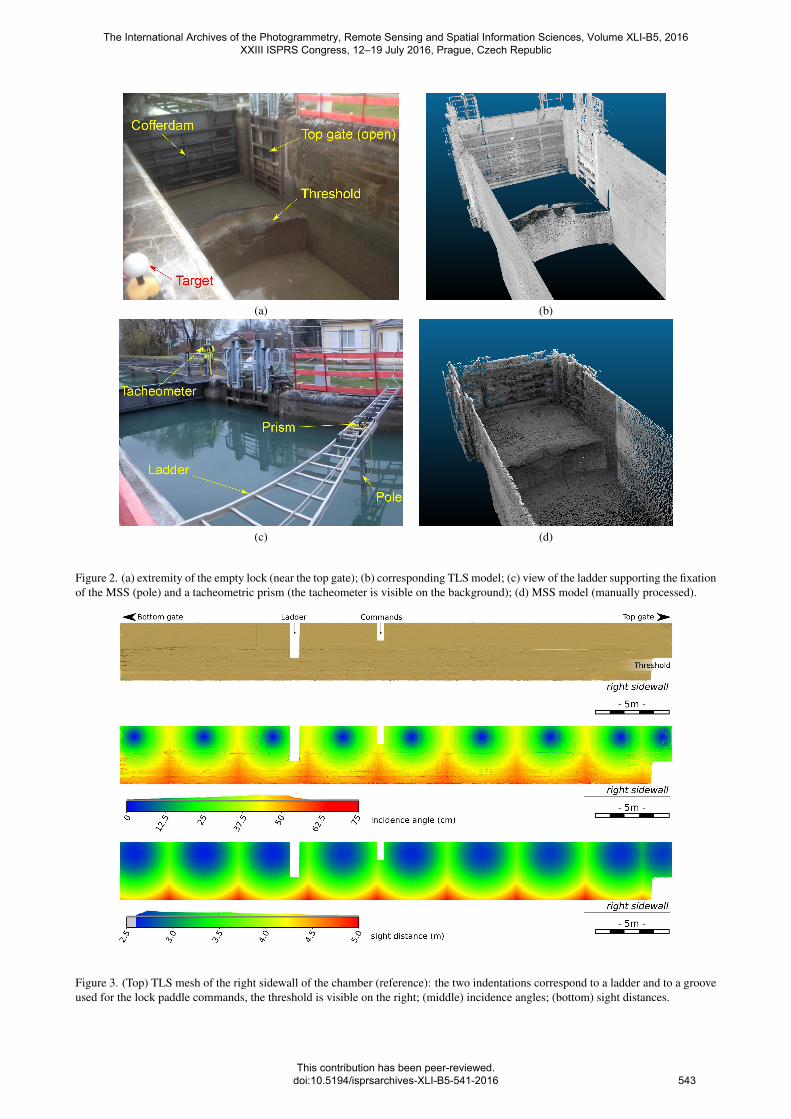
The TLS survey was carried out by the INSA Strasbourg team onDecember 1 (some complementary scans were taken on the nextday, after scaffolding disassembly). Six scans were taken fromthe bottom of the empty lock and height, from the top, using aFaro Focus 3D X330. Spherical targets (see image (a) on Fig. 2on the following page) were carefully placed around the environ-ment to facilitate registration of the scans, which was done withinthe Faro Scene framework with sub-centimeter accuracy. The re-sulting model will be considered as a reference for the rest of thestudy. A sample model of the top structure of the lock is shownon Fig. 2b.
The MSS survey was conducted by the Sub-C marine companyon December 4, immediately after refilling the lock. The cham-ber was then almost in the same state as during the TLS survey.The only noticeable difference is that the bottom door was openfor the TLS survey and closed for the MSS one. The water israther turbid, as may be seen on the photographs, and the mea-sured sound speed was about 1434 m.s−1.
The characteristics of the BlueView BV5000 used in this exper-iment are given in Tab. 1. The frequency of the emitted soundwave (1.35 MHz) is well suited to the dimensions of the sur-veyed structure. As proposed in (Lesnikowski and Rush, 2012),some hollow metallic spheres could have been used as reference
targets to register MSS acquisitions taken from the floor of thecanal. Unfortunately, we did not have such objects at hand, sowe chose a different strategy. More specifically, we operated theMSS upside-down, by hanging it to a ladder crossing the lockchamber, thanks to a metallic pole (see Fig .2c). This way thesonar head was placed at nearly 80 cm above the water surface.A topographic prism was attached to the fixation of the pole onthe ladder. The prism and a couple of points aimed on the axis ofthe pole were carefully surveyed with a total station. Using thisinformation, it is possible to roughly register each scan: indeed,the three translations and two angles out of three may be esti-mated. In Sec. 3, we propose a method for recovering the third(horizontal) rotation angle.
Scans were taken every 5 m along the lock, which provided 9point clouds. At each scanning position, the sonar head rotated360◦around its vertical axis, with 3 successive tilt angles: 15◦,-15◦, -45◦. As shown on Fig. 3 on the next page, this config-uration leads to a maximum incidence angle of 75◦and a maxi-mum sight distance of 5 m. We note that placing the sonar deeperwould limit these angles and distances, leading to more favorableacquisition geometries. Moreover, a set of three “free” (i.e. notlocalized) scans were performed from the canal floor, with theBV5000 placed on a tripod. Fig. 2d shows a crude model of thetop structure of the lock, obtained after a manual registration ofseveral raw MSS scans.
3. MODEL ALIGNMENT AND GEO-REFERENCING
In this section, we introduce a geometric method for registeringthe 3D underwater model. The full model is built from acqui-sitions collected by the MSS device at 9 upside-down scanningpositions. We propose a two-step registration process.
First, the orientation of the metallic pole, corresponding to the ro-tation axis of the sonar, and the scanner position O are computedfor each scan. For this purpose, we rely on the positions of threepoints (A, B and C on Fig. 4) obtained by tacheometric survey,as described in Sec. 2. Moreover, we use a geometrical surveyingof the rigid system comprising the prism, the metallic pole andthe sonar. In particular, since distancesD and d are measured be-forehand, elementary calculations provide the orientation of therotation axis.
Figure 4. View of the rigid system used for sonar acquisitions,(left) perpendicularly to the sight direction of the total station and(right) in the sight direction. A geometrical survey of the systemis carried out beforehand, providing distances d and D. For eachscanning position, points A and B, located in the middle of themetallic pole, and point C (prism center) are surveyed.
Once the orientation of the pole axis is known for each scan,they can be levelled straightforwardly. The translations between
The International Archives of the Photogrammetry, Remote Sensing and Spatial Information Sciences, Volume XLI-B5, 2016 XXIII ISPRS Congress, 12–19 July 2016, Prague, Czech Republic
This contribution has been peer-reviewed. doi:10.5194/isprsarchives-XLI-B5-541-2016
542
(a) (b)
(c) (d)
Figure 2. (a) extremity of the empty lock (near the top gate); (b) corresponding TLS model; (c) view of the ladder supporting the fixationof the MSS (pole) and a tacheometric prism (the tacheometer is visible on the background); (d) MSS model (manually processed).
Figure 3. (Top) TLS mesh of the right sidewall of the chamber (reference): the two indentations correspond to a ladder and to a grooveused for the lock paddle commands, the threshold is visible on the right; (middle) incidence angles; (bottom) sight distances.
The International Archives of the Photogrammetry, Remote Sensing and Spatial Information Sciences, Volume XLI-B5, 2016 XXIII ISPRS Congress, 12–19 July 2016, Prague, Czech Republic
This contribution has been peer-reviewed. doi:10.5194/isprsarchives-XLI-B5-541-2016
543
scans are computed from the positions of the BV5000 center, Oi.Henceforth, the last ambiguity concerns the horizontal orienta-tion of the point clouds, i.e. the rotations of each point cloudabout the vertical axis passing through the origin Oi. The secondstep of our registration method is devoted to the computation ofthis horizontal rotation.
Figure 5. Horizontal rotations of the point clouds for horizontalalignment. (Left) the longitudinal axis of each scan is defined us-ing PCA. (Middle) each scan is given the same orientation. Notethat the rotation angles αi are different. (Right) the point cloudsare aligned by applying a rotation with a common angle β. Scancenters Oi remain fixed during the whole process.
In our approach, we assume that the canal lock is symmetric withrespect to a vertical plane. This plane defines the longitudinalaxis of the lock, which can be computed for each point cloud us-ing Principal Component Analysis (PCA). Hence, the horizontalorientation problem is reduced to aligning the longitudinal axisof the different scans (whose center positions are known) by ap-plying rotations, as explained on Fig. 5. First, the axis of thedifferent point clouds are rotated by an angle αi, in such a waythat their resulting orientations are identical. Note that this ori-entation is arbitrarily defined (see Fig. 5-middle). Secondly theaxis of the scans are aligned by applying a rotation by a commonangle β, as shown on Fig. 5-right.
The β angle can be determined from any couple of scans, (Si, Sj),using a simple geometric construction that exploits two invari-ants: the distance between scan origins (Oi and Oj) and the or-thogonal distance between Oj and the axis of symmetry of thecorresponding scan, Sj . In practice, we compute such angles forseveral couples and take β as their mean.
As the experimental results show (see Sec. 4), the proposed methodyields satisfactory results. However, improvements might be ex-pected by refining the registration using a global technique suchas the Iterative Closest Point (ICP) method (Besl and McKay,1992). It might be important, in that case, to weight the 3D pointsaccording to their incidence angle or sight distance, in order totake into account the noise and loss of resolution effects that canbe observed, specially in narrow environments (Moisan et al.,2015).
4. EXPERIMENTAL RESULTS
Before we study the quality of the sonar model with respect tothe reference laser one, from both a quantitative and a qualitativepoint of view, it might be useful to get some insight on the differ-ent perturbations that impair sonar data, especially for the readerswho are not familiar with this kind of 3D imaging technique.
4.1. Sonar scan assessment
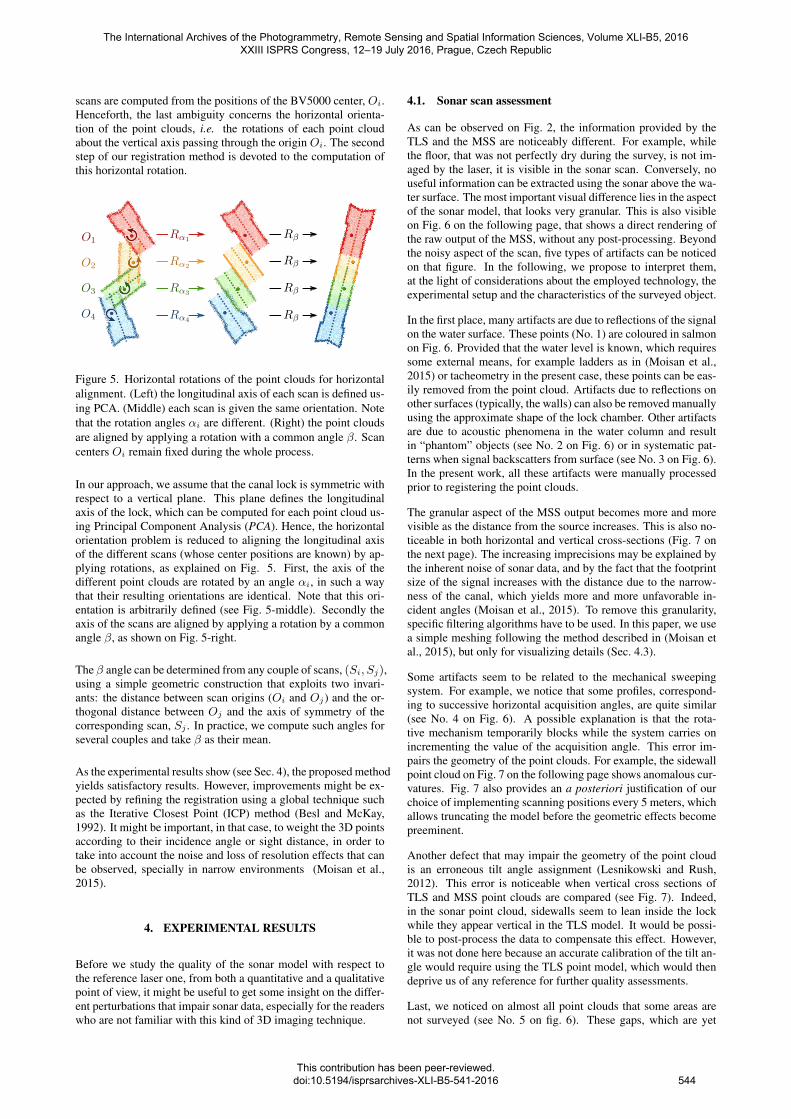
As can be observed on Fig. 2, the information provided by theTLS and the MSS are noticeably different. For example, whilethe floor, that was not perfectly dry during the survey, is not im-aged by the laser, it is visible in the sonar scan. Conversely, nouseful information can be extracted using the sonar above the wa-ter surface. The most important visual difference lies in the aspectof the sonar model, that looks very granular. This is also visibleon Fig. 6 on the following page, that shows a direct rendering ofthe raw output of the MSS, without any post-processing. Beyondthe noisy aspect of the scan, five types of artifacts can be noticedon that figure. In the following, we propose to interpret them,at the light of considerations about the employed technology, theexperimental setup and the characteristics of the surveyed object.
In the first place, many artifacts are due to reflections of the signalon the water surface. These points (No. 1) are coloured in salmonon Fig. 6. Provided that the water level is known, which requiressome external means, for example ladders as in (Moisan et al.,2015) or tacheometry in the present case, these points can be eas-ily removed from the point cloud. Artifacts due to reflections onother surfaces (typically, the walls) can also be removed manuallyusing the approximate shape of the lock chamber. Other artifactsare due to acoustic phenomena in the water column and resultin “phantom” objects (see No. 2 on Fig. 6) or in systematic pat-terns when signal backscatters from surface (see No. 3 on Fig. 6).In the present work, all these artifacts were manually processedprior to registering the point clouds.
The granular aspect of the MSS output becomes more and morevisible as the distance from the source increases. This is also no-ticeable in both horizontal and vertical cross-sections (Fig. 7 onthe next page). The increasing imprecisions may be explained bythe inherent noise of sonar data, and by the fact that the footprintsize of the signal increases with the distance due to the narrow-ness of the canal, which yields more and more unfavorable in-cident angles (Moisan et al., 2015). To remove this granularity,specific filtering algorithms have to be used. In this paper, we usea simple meshing following the method described in (Moisan etal., 2015), but only for visualizing details (Sec. 4.3).
Some artifacts seem to be related to the mechanical sweepingsystem. For example, we notice that some profiles, correspond-ing to successive horizontal acquisition angles, are quite similar(see No. 4 on Fig. 6). A possible explanation is that the rota-tive mechanism temporarily blocks while the system carries onincrementing the value of the acquisition angle. This error im-pairs the geometry of the point clouds. For example, the sidewallpoint cloud on Fig. 7 on the following page shows anomalous cur-vatures. Fig. 7 also provides an a posteriori justification of ourchoice of implementing scanning positions every 5 meters, whichallows truncating the model before the geometric effects becomepreeminent.
Another defect that may impair the geometry of the point cloudis an erroneous tilt angle assignment (Lesnikowski and Rush,2012). This error is noticeable when vertical cross sections ofTLS and MSS point clouds are compared (see Fig. 7). Indeed,in the sonar point cloud, sidewalls seem to lean inside the lockwhile they appear vertical in the TLS model. It would be possi-ble to post-process the data to compensate this effect. However,it was not done here because an accurate calibration of the tilt an-gle would require using the TLS point model, which would thendeprive us of any reference for further quality assessments.
Last, we noticed on almost all point clouds that some areas arenot surveyed (see No. 5 on fig. 6). These gaps, which are yet
The International Archives of the Photogrammetry, Remote Sensing and Spatial Information Sciences, Volume XLI-B5, 2016 XXIII ISPRS Congress, 12–19 July 2016, Prague, Czech Republic
This contribution has been peer-reviewed. doi:10.5194/isprsarchives-XLI-B5-541-2016
544
Figure 6. Rendering of a raw sonar output (from a single scanning position). 1: artifacts due to surface reflections (coloured in salmon).2: acoustic anomalies in the water column acquisition. 3: acoustic phenomena due to signal backscattering. 4: acquisition anomalyprobably due to a temporary blocking of the horizontal rotation system. 5: acquisition lack.
Figure 7. (a) Vertical and (b) horizontal cross-sections of the MSS (blue) and TLS (green) point clouds. Black dots show the sonarhead position.
unexplained, have variable angular size, but they generally occurat the same horizontal acquisition angle. We note that similarlacks can be observed on Fig. 4.9, p. 74 in (Thomas, 2011).
4.2. Model assessment
In Sec. 4.1, we have reviewed the main artifacts that impair theraw MSS data and how they were (or were not) taken into accountprior the registration was performed. The 3D model of the lockchamber, obtained using the methodology proposed in Sec 3 isshown on Fig. 8 on the next page. A quantitative assessment ofthis model is now presented. It is based on the distances betweenthe MSS model and the reference TLS model. Since it is basedon geo-referenced models (without extra adjustment), this evalu-ation concerns both the quality of the MSS data and the efficiencyand robustness of the registration method.
The proposed study is essentially a cloud-to-mesh comparison.Such an approach is well suited to our application, since the lock
chamber is a topologically simple object, with smooth surfacesand almost no occlusions. In such conditions, the meshing pro-cess is rather straightforward. We use the 3DReshaperr soft-ware from Technodigit to obtain the reference mesh from the TLSpoint cloud. The cloud-to-mesh comparison is performed withCloudCompare, which uses an algorithm inspired from METRO(Cignoni et al., 1998). Since no reference is available for thefloor of the lock, two separate evaluations are carried out, usingthe models of each sidewall.
The results of these distance computations are summarized inTab. 2. Positive distances correspond to vectors pointing inwardthe lock chamber (i.e. MSS points that are closest to the center ofthe canal than their TLS corresponding points). The histogramsof Fig. 9) show that the distance distributions are close to theGaussian. But, their mean is not null. This indicates the presenceof a bias due to possible systematic errors.
Furthermore, the spatial distribution of distances on sidewalls
The International Archives of the Photogrammetry, Remote Sensing and Spatial Information Sciences, Volume XLI-B5, 2016 XXIII ISPRS Congress, 12–19 July 2016, Prague, Czech Republic
This contribution has been peer-reviewed. doi:10.5194/isprsarchives-XLI-B5-541-2016
545
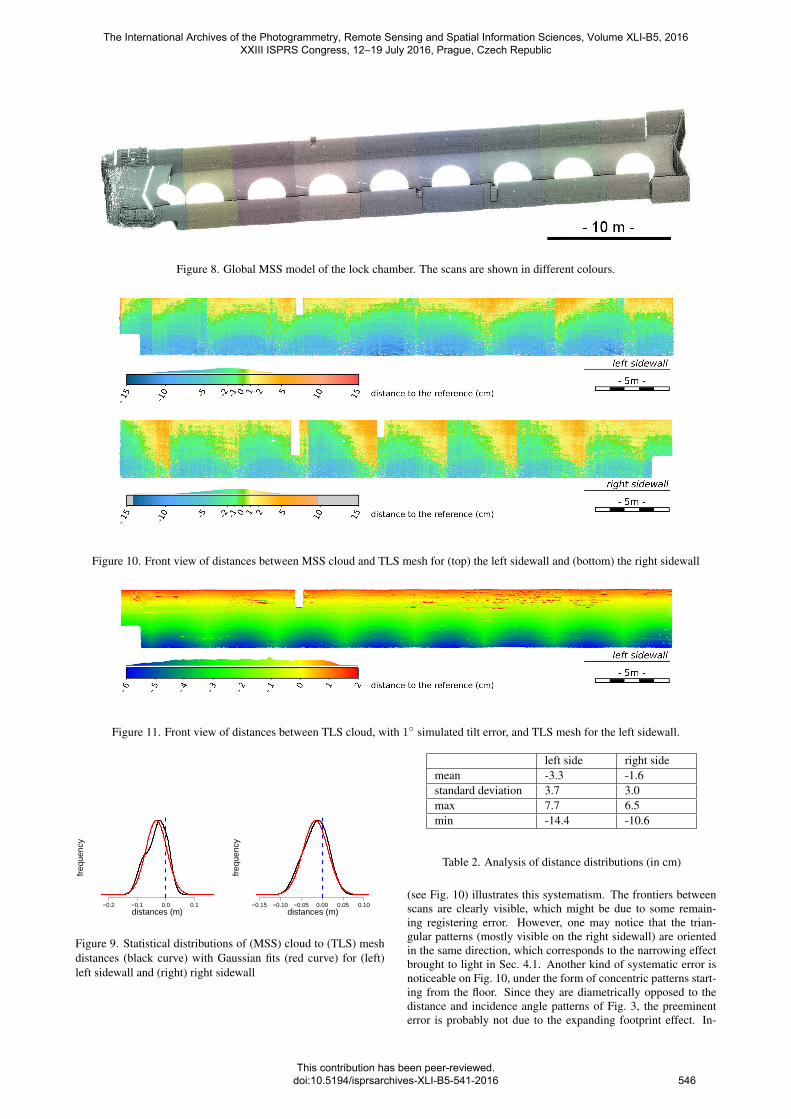
Figure 8. Global MSS model of the lock chamber. The scans are shown in different colours.
Figure 10. Front view of distances between MSS cloud and TLS mesh for (top) the left sidewall and (bottom) the right sidewall
Figure 11. Front view of distances between TLS cloud, with 1◦ simulated tilt error, and TLS mesh for the left sidewall.
−0.2 −0.1 0.0 0.1distances (m)
freq
uenc
y
−0.15 −0.10 −0.05 0.00 0.05 0.10distances (m)
freq
uenc
y
Figure 9. Statistical distributions of (MSS) cloud to (TLS) meshdistances (black curve) with Gaussian fits (red curve) for (left)left sidewall and (right) right sidewall
left side right sidemean -3.3 -1.6standard deviation 3.7 3.0max 7.7 6.5min -14.4 -10.6
Table 2. Analysis of distance distributions (in cm)
(see Fig. 10) illustrates this systematism. The frontiers betweenscans are clearly visible, which might be due to some remain-ing registering error. However, one may notice that the trian-gular patterns (mostly visible on the right sidewall) are orientedin the same direction, which corresponds to the narrowing effectbrought to light in Sec. 4.1. Another kind of systematic error isnoticeable on Fig. 10, under the form of concentric patterns start-ing from the floor. Since they are diametrically opposed to thedistance and incidence angle patterns of Fig. 3, the preeminenterror is probably not due to the expanding footprint effect. In-
The International Archives of the Photogrammetry, Remote Sensing and Spatial Information Sciences, Volume XLI-B5, 2016 XXIII ISPRS Congress, 12–19 July 2016, Prague, Czech Republic
This contribution has been peer-reviewed. doi:10.5194/isprsarchives-XLI-B5-541-2016
546
deed, the calibration of the tilt angle should be reconsidered. Inorder to verify this assumption, a simulation of a 1◦ tilt error hasbeen done using TLS data. The spatial distribution of simulateddistances, shown on Fig. 11 on the previous page is similar to theone obtained with MSS data (in particular for the left wall, wherethe narrowing error has less impact).
This study shows that the outcome distances range from -14.4 to7.7 cm. The distance mean (considering both sidewalls simul-taneously) is -2.4 cm and the standard deviation 3.5 cm. Theseresults might be enhanced by improving the registration method,or by correcting some effects (tilt offset) after calibration usingthe TLS model, or by refining the experimental setup (mechani-cal rotation system, position of the MSS) and performing a newsurvey.
4.3. Examining details
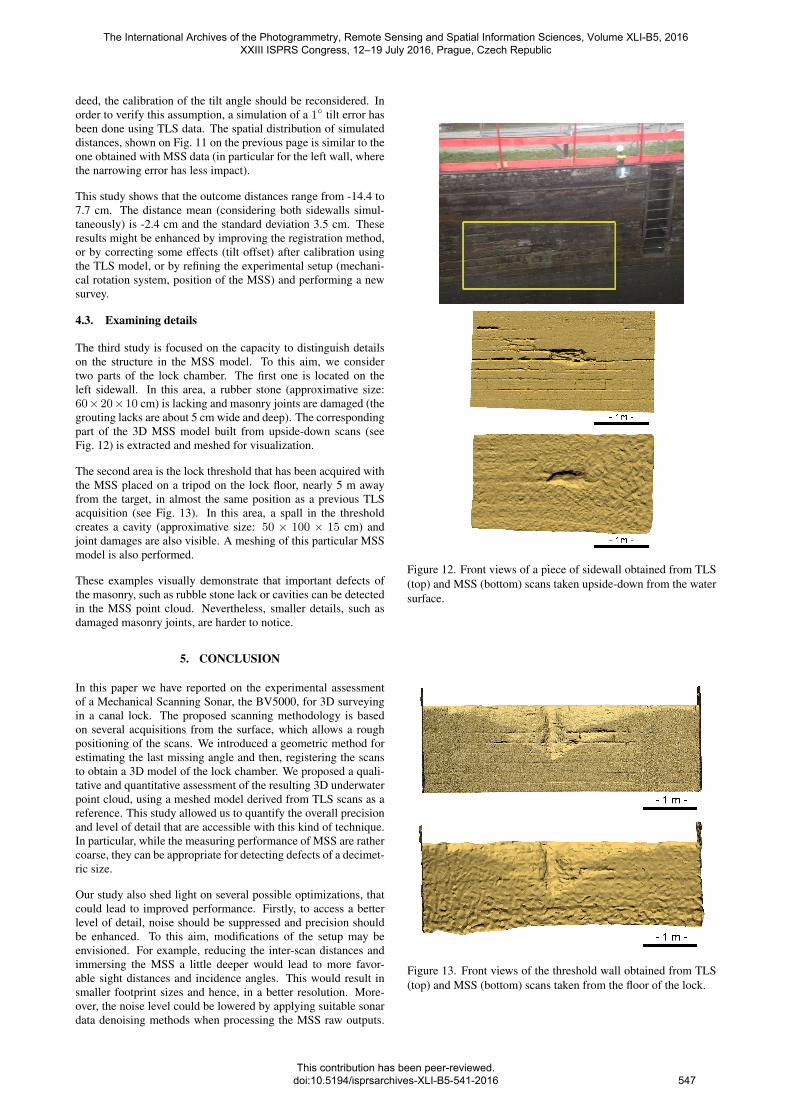
The third study is focused on the capacity to distinguish detailson the structure in the MSS model. To this aim, we considertwo parts of the lock chamber. The first one is located on theleft sidewall. In this area, a rubber stone (approximative size:60×20×10 cm) is lacking and masonry joints are damaged (thegrouting lacks are about 5 cm wide and deep). The correspondingpart of the 3D MSS model built from upside-down scans (seeFig. 12) is extracted and meshed for visualization.
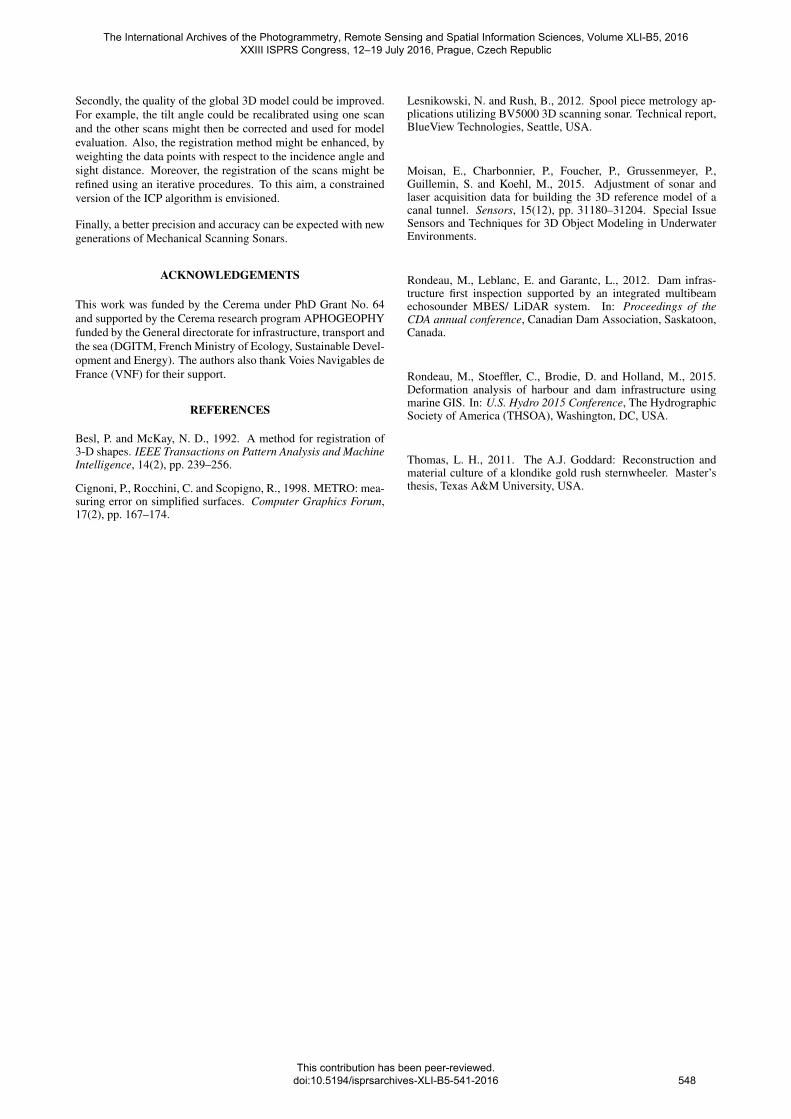
The second area is the lock threshold that has been acquired withthe MSS placed on a tripod on the lock floor, nearly 5 m awayfrom the target, in almost the same position as a previous TLSacquisition (see Fig. 13). In this area, a spall in the thresholdcreates a cavity (approximative size: 50 × 100 × 15 cm) andjoint damages are also visible. A meshing of this particular MSSmodel is also performed.
These examples visually demonstrate that important defects ofthe masonry, such as rubble stone lack or cavities can be detectedin the MSS point cloud. Nevertheless, smaller details, such asdamaged masonry joints, are harder to notice.
5. CONCLUSION
In this paper we have reported on the experimental assessmentof a Mechanical Scanning Sonar, the BV5000, for 3D surveyingin a canal lock. The proposed scanning methodology is basedon several acquisitions from the surface, which allows a roughpositioning of the scans. We introduced a geometric method forestimating the last missing angle and then, registering the scansto obtain a 3D model of the lock chamber. We proposed a quali-tative and quantitative assessment of the resulting 3D underwaterpoint cloud, using a meshed model derived from TLS scans as areference. This study allowed us to quantify the overall precisionand level of detail that are accessible with this kind of technique.In particular, while the measuring performance of MSS are rathercoarse, they can be appropriate for detecting defects of a decimet-ric size.
Our study also shed light on several possible optimizations, thatcould lead to improved performance. Firstly, to access a betterlevel of detail, noise should be suppressed and precision shouldbe enhanced. To this aim, modifications of the setup may beenvisioned. For example, reducing the inter-scan distances andimmersing the MSS a little deeper would lead to more favor-able sight distances and incidence angles. This would result insmaller footprint sizes and hence, in a better resolution. More-over, the noise level could be lowered by applying suitable sonardata denoising methods when processing the MSS raw outputs.
Figure 12. Front views of a piece of sidewall obtained from TLS(top) and MSS (bottom) scans taken upside-down from the watersurface.
Figure 13. Front views of the threshold wall obtained from TLS(top) and MSS (bottom) scans taken from the floor of the lock.
The International Archives of the Photogrammetry, Remote Sensing and Spatial Information Sciences, Volume XLI-B5, 2016 XXIII ISPRS Congress, 12–19 July 2016, Prague, Czech Republic
This contribution has been peer-reviewed. doi:10.5194/isprsarchives-XLI-B5-541-2016
547
Secondly, the quality of the global 3D model could be improved.For example, the tilt angle could be recalibrated using one scanand the other scans might then be corrected and used for modelevaluation. Also, the registration method might be enhanced, byweighting the data points with respect to the incidence angle andsight distance. Moreover, the registration of the scans might berefined using an iterative procedures. To this aim, a constrainedversion of the ICP algorithm is envisioned.
Finally, a better precision and accuracy can be expected with newgenerations of Mechanical Scanning Sonars.
ACKNOWLEDGEMENTS
This work was funded by the Cerema under PhD Grant No. 64and supported by the Cerema research program APHOGEOPHYfunded by the General directorate for infrastructure, transport andthe sea (DGITM, French Ministry of Ecology, Sustainable Devel-opment and Energy). The authors also thank Voies Navigables deFrance (VNF) for their support.
REFERENCES
Besl, P. and McKay, N. D., 1992. A method for registration of3-D shapes. IEEE Transactions on Pattern Analysis and MachineIntelligence, 14(2), pp. 239–256.
Cignoni, P., Rocchini, C. and Scopigno, R., 1998. METRO: mea-suring error on simplified surfaces. Computer Graphics Forum,17(2), pp. 167–174.
Lesnikowski, N. and Rush, B., 2012. Spool piece metrology ap-plications utilizing BV5000 3D scanning sonar. Technical report,BlueView Technologies, Seattle, USA.
Moisan, E., Charbonnier, P., Foucher, P., Grussenmeyer, P.,Guillemin, S. and Koehl, M., 2015. Adjustment of sonar andlaser acquisition data for building the 3D reference model of acanal tunnel. Sensors, 15(12), pp. 31180–31204. Special IssueSensors and Techniques for 3D Object Modeling in UnderwaterEnvironments.
Rondeau, M., Leblanc, E. and Garantc, L., 2012. Dam infras-tructure first inspection supported by an integrated multibeamechosounder MBES/ LiDAR system. In: Proceedings of theCDA annual conference, Canadian Dam Association, Saskatoon,Canada.
Rondeau, M., Stoeffler, C., Brodie, D. and Holland, M., 2015.Deformation analysis of harbour and dam infrastructure usingmarine GIS. In: U.S. Hydro 2015 Conference, The HydrographicSociety of America (THSOA), Washington, DC, USA.
Thomas, L. H., 2011. The A.J. Goddard: Reconstruction andmaterial culture of a klondike gold rush sternwheeler. Master’sthesis, Texas A&M University, USA.
The International Archives of the Photogrammetry, Remote Sensing and Spatial Information Sciences, Volume XLI-B5, 2016 XXIII ISPRS Congress, 12–19 July 2016, Prague, Czech Republic
This contribution has been peer-reviewed. doi:10.5194/isprsarchives-XLI-B5-541-2016
548


![Gas Detection using Multibeam Mapping Sonar · Gas Detection using Multibeam Mapping Sonar Processed data 56.2 Predicted bubble Distance [m] displacement 50.5 54.3 HYDRO 2010 04.11.2010,](https://img.pdfslide.net/doc/110x75/5e6855db021fec61e211231e/gas-detection-using-multibeam-mapping-sonar-gas-detection-using-multibeam-mapping.jpg)