Embed Size (px)
Citation preview
ARTICLE
Multibeam sonar (DIDSON) assessment of American shad(Alosa sapidissima) approaching a hydroelectric damAnn B. Grote, Michael M. Bailey, Joseph D. Zydlewski, and Joseph E. Hightower
Abstract: We investigated the fish community approaching the Veazie Dam on the Penobscot River, Maine, prior to implemen-tation of a major dam removal and river restoration project. Multibeam sonar (dual-frequency identification sonar, DIDSON)surveys were conducted continuously at the fishway entrance from May to July in 2011. A 5% subsample of DIDSON datacontained 43 793 fish targets, the majority of which were of Excellent (15.7%) or Good (73.01%) observation quality. Excellentquality DIDSON targets (n = 6876) were apportioned by species using a Bayesian mixture model based on four known fork lengthdistributions (river herring (alewife, Alosa psuedoharengus, and blueback herring, Alosa aestivalis), American shad, Alosa sapidissima)and two size classes (one sea-winter and multi-sea-winter) of Atlantic salmon (Salmo salar). 76.2% of targets were assigned to theAmerican shad distribution; Atlantic salmon accounted for 15.64%, and river herring 8.16% of observed targets. Shad-sized (99.0%)and salmon-sized (99.3%) targets approached the fishway almost exclusively during the day, whereas river herring-sized targetswere observed both during the day (51.1%) and at night (48.9%). This approach demonstrates how multibeam sonar imaging canbe used to evaluate community composition and species-specific movement patterns in systems where there is little overlap inthe length distributions of target species.
Résumé : Nous avons étudié la communauté de poissons s’approchant du barrage Veazie, sur le fleuve Penobscot (Maine,États-Unis), avant la mise en œuvre d’un important projet de démantèlement du barrage et de remise en état du fleuve. Desrelevés au sonar multifaisceaux (DIDSON) ont été menés en continu a l’entrée de la passe migratoire, de mai a juillet 2011. Unsous-échantillon de 5 % des données DIDSON contenait 43 793 cibles de poissons, la majeure partie de ces observations étantd’excellente (15,7 %) ou de bonne (73,01 %) qualité. Les cibles DIDSON d’excellente qualité (n = 6876) ont été réparties par espècea l’aide d’un modèle de mélange bayésien basé sur quatre distributions connues de longueurs a la fourche, soit celles des alosesde rivière (gaspareau, Alosa psuedoharengus, et alose d’été, Alosa aestivalis), de l’alose savoureuse (Alosa sapidissima) et de deuxcatégories de tailles (un hiver en mer et plus d’un hiver en mer) de saumon atlantique (Salmo salar). Des cibles observées, 76,2 %ont été affectées a la distribution de l’alose savoureuse, alors que les saumons atlantiques et les aloses de rivière représentaient15,64 % et 8,16 %, respectivement, des cibles observées. Les cibles de tailles de l’alose savoureuse et du saumon s’approchaient dela passe migratoire presque exclusivement durant le jour (99,0 % et 99,3 %, respectivement), alors que les cibles de tailles desaloses de rivière étaient observées tant durant le jour (51,1 %) que durant la nuit (48,9 %). Cette approche démontre l’utilité del’imagerie par sonar multifaisceaux pour l’évaluation de la composition de communautés et des habitudes de déplacementd’espèces données dans des systèmes dans lesquels les distributions des longueurs de différentes espèces cibles se chevauchentpeu. [Traduit par la Rédaction]
IntroductionDam removal is an increasingly used management option for
the restoration of impounded and impaired aquatic systems (Pohl2002; Stanley and Doyle 2003). The ecological benefits of damremoval may include re-establishing the natural hydrograph,thermal regime, sediment dynamics, nutrient cycling, and migra-tory fish connectivity (Gregory et al. 2002). One of the major chal-lenges associated with dam removal is the assessment of systemresponse with respect to those potential benefits, and to datethere is a dearth of well-designed studies evaluating the ecologicaloutcomes of river restoration efforts (Babbitt 2002; Hart et al.2002; Palmer et al. 2005).
Baseline data collection is a critical, but often neglected, step inrestoration assessment (Bernhardt et al. 2007). Baseline data are
necessary as they allow managers and researchers to compareconditions before and after dam removal and thereby evaluatesystem response (Kibler et al. 2011). In spite of their importance,pretreatment data can be challenging to collect, especially forecological restoration projects. The presence of Threatened orEndangered aquatic species may limit not only the types of sam-pling (netting, angling, electrofishing, piscicide application) thatare utilized, but also the seasonality and duration of samplingepisodes. Thus, a major question facing many dam removal andriver restoration projects is how to evaluate baseline fish behaviorand species composition without adversely affecting protectedfish.
The Penobscot River is currently the subject of an intensiveriver restoration effort. Under the Penobscot River Restoration
Received 10 June 2013. Accepted 3 December 2013.
Paper handled by Associate Editor Josef Michael Jech.
A.B. Grote. Department of Wildlife Ecology University of Maine, Orono, ME 04469, USA.M.M. Bailey. Department of Wildlife Ecology University of Maine, Orono, ME 04469, USA; US Fish and Wildlife Service, Central New England FisheryResources Office, Nashua, NH 03063, USA.J.D. Zydlewski. Department of Wildlife Ecology University of Maine, Orono, ME 04469, USA; US Geological Survey, Maine Cooperative Fish and WildlifeResearch Unit, University of Maine, Orono, ME 04469, USA.J.E. Hightower. US Geological Survey, North Carolina Cooperative Fish and Wildlife Research Unit, NC State University, Raleigh, NC 27695, USA.Corresponding author: Joseph D. Zydlewski (e-mail: [email protected]).
545
Can. J. Fish. Aquat. Sci. 71: 545–558 (2014) dx.doi.org/10.1139/cjfas-2013-0308 Published at www.nrcresearchpress.com/cjfas on 15 January 2014.
Can
. J. F
ish.
Aqu
at. S
ci. D
ownl
oade
d fr
om w
ww
.nrc
rese
arch
pres
s.co
m b
y U
nive
rsity
of
Mai
ne o
n 04
/09/
14Fo
r pe
rson
al u
se o
nly.
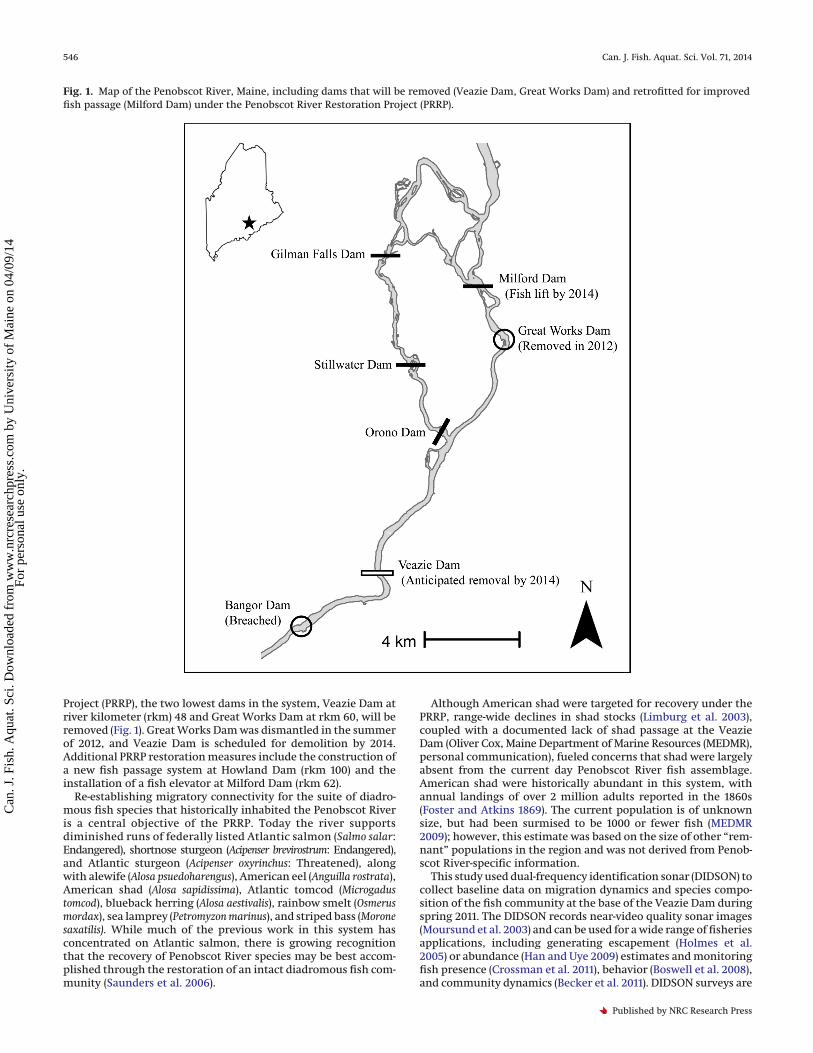
Project (PRRP), the two lowest dams in the system, Veazie Dam atriver kilometer (rkm) 48 and Great Works Dam at rkm 60, will beremoved (Fig. 1). Great Works Dam was dismantled in the summerof 2012, and Veazie Dam is scheduled for demolition by 2014.Additional PRRP restoration measures include the construction ofa new fish passage system at Howland Dam (rkm 100) and theinstallation of a fish elevator at Milford Dam (rkm 62).
Re-establishing migratory connectivity for the suite of diadro-mous fish species that historically inhabited the Penobscot Riveris a central objective of the PRRP. Today the river supportsdiminished runs of federally listed Atlantic salmon (Salmo salar:Endangered), shortnose sturgeon (Acipenser brevirostrum: Endangered),and Atlantic sturgeon (Acipenser oxyrinchus: Threatened), alongwith alewife (Alosa psuedoharengus), American eel (Anguilla rostrata),American shad (Alosa sapidissima), Atlantic tomcod (Microgadustomcod), blueback herring (Alosa aestivalis), rainbow smelt (Osmerusmordax), sea lamprey (Petromyzon marinus), and striped bass (Moronesaxatilis). While much of the previous work in this system hasconcentrated on Atlantic salmon, there is growing recognitionthat the recovery of Penobscot River species may be best accom-plished through the restoration of an intact diadromous fish com-munity (Saunders et al. 2006).
Although American shad were targeted for recovery under thePRRP, range-wide declines in shad stocks (Limburg et al. 2003),coupled with a documented lack of shad passage at the VeazieDam (Oliver Cox, Maine Department of Marine Resources (MEDMR),personal communication), fueled concerns that shad were largelyabsent from the current day Penobscot River fish assemblage.American shad were historically abundant in this system, withannual landings of over 2 million adults reported in the 1860s(Foster and Atkins 1869). The current population is of unknownsize, but had been surmised to be 1000 or fewer fish (MEDMR2009); however, this estimate was based on the size of other “rem-nant” populations in the region and was not derived from Penob-scot River-specific information.
This study used dual-frequency identification sonar (DIDSON) tocollect baseline data on migration dynamics and species compo-sition of the fish community at the base of the Veazie Dam duringspring 2011. The DIDSON records near-video quality sonar images(Moursund et al. 2003) and can be used for a wide range of fisheriesapplications, including generating escapement (Holmes et al.2005) or abundance (Han and Uye 2009) estimates and monitoringfish presence (Crossman et al. 2011), behavior (Boswell et al. 2008),and community dynamics (Becker et al. 2011). DIDSON surveys are
Fig. 1. Map of the Penobscot River, Maine, including dams that will be removed (Veazie Dam, Great Works Dam) and retrofitted for improvedfish passage (Milford Dam) under the Penobscot River Restoration Project (PRRP).
546 Can. J. Fish. Aquat. Sci. Vol. 71, 2014
Published by NRC Research Press
Can
. J. F
ish.
Aqu
at. S
ci. D
ownl
oade
d fr
om w
ww
.nrc
rese
arch
pres
s.co
m b
y U
nive
rsity
of
Mai
ne o
n 04
/09/
14Fo
r pe
rson
al u
se o
nly.
noninvasive and do not require capturing, handling, or disturbingstudy subjects. These characteristics make the DIDSON well-suitedfor use in systems like the lower Penobscot River, where multiplethreatened and endangered fish species are present, and adverseeffects associated with traditional physical sampling (Ellenderet al. 2012) must be minimized.
A second advantage of the DIDSON is that that the images areconstructed from sound and not light information; therefore,data can be collected at night and in turbid waters (Maxwell andGove 2007). As a result, DIDSON sampling can be conducted con-tinuously, 24 h a day, and in weather and flow conditions wherephysical surveys would not be feasible. The resulting data areappropriate for systematically investigating diurnal effects (Tiffanet al. 2005; Kimball et al. 2010; Becker et al. 2011), which is animportant consideration for spawning and migrating fishes.
The overall goal of this study was to describe baseline condi-tions (species proportions, migration dynamics) of the PenobscotRiver fish assemblage prior to dam removal using DIDSON. Ourhypothesis was that American shad were present in the lowerriver and that they would be discernible based on fork length (FL)data. The specific objectives of the study were to (i) apportionDIDSON observations by species based on FL data, (ii) assess whetherAmerican shad were approaching the Veazie Dam fishway, and(iii) characterize the behavior of fish approaching Veazie Dam.
Methods
Study areaFish passage in the Penobscot River has long been impeded by
an extensive network of dams. From 1877 to 1977, the head-of-tidedam was located in the city of Bangor at rkm 44. The Old BangorDam breached naturally in 1997, and today the river is tidalthrough Eddington Bend to Veazie Dam. Both Veazie Dam andGreat Works Dam will be removed by 2014, and following fullimplementation of the PRRP, Milford Dam will be the lowest damon the mainstem Penobscot River (Fig. 1).
The Veazie Hydroelectric Project is a 7.6 m high concrete damwith an installed hydroelectric capacity of 8.4 megawatts. Fishpassage structures at this facility include a vertical slot fishwaylocated mid-channel between the forebay and spillway and a der-elict, nonoperable pool–weir ladder on the eastern shore. MEDMRmaintains a wire and fyke fish trap at the exit of the operable fishladder. The trap is operated annually from May through Octoberand is tended on a daily basis. Although the main purpose of thisoperation is to collect and enumerate Atlantic salmon, otherlarge-bodied fish are also trapped and counted. Smaller fish, suchas river herring, are sometimes retained in the trap, but gaps inthe trap wall are big enough to allow many smaller fish to escape.Nontarget fish are released into the Veazie Dam headpond. Whilesome migratory species, including Atlantic salmon, successfullynavigate the fish ladder to the trap, American shad typically donot. Only 16 American shad have been collected from the trapfrom 1978 to 2012 (Oliver Cox, MEDMR, personal communication).
Known length frequency distributionsThe lower Penobscot River is occupied by a diminished migra-
tory and resident fish community (Saunders et al. 2006). Recentdata from both electrofishing surveys (Kiraly et al. 2012) and theVeazie Dam trap (Oliver Cox, MEDMR, unpublished data) wereused to identify fish species expected to migrate to and attempt topass the Veazie Dam. Based on those data, four species (alewife,blueback herring, American shad, and Atlantic salmon) were as-sumed as those most likely to be schooling at the base of the dam.
Fish images obtained using DIDSON typically cannot be identi-fied to species, but DIDSON length data can be used to estimatespecies proportions. This is done using a mixture modeling ap-proach (see below), along with auxiliary information on Penob-scot River-specific FL distributions for the four species of interest.
Data from the spring 2011 Veazie Dam trapping season were usedto describe Atlantic salmon FL distributions (Table 1; Oliver Cox,MEDMR, unpublished data). Atlantic salmon spawn after eitherone sea-winter (1SW) or multiple sea winters (i.e., multi-sea-winter, MSW), and MSW fish are substantially larger. As a result,the Atlantic salmon length frequency data were bimodal and weremodeled as separate length distributions.
Length data for alewives and blueback herring were collected in2010 and 2011 from below the Veazie Dam (Kiraly et al. 2012), butonly total lengths (TLs) were recorded. To standardize length met-rics across species, linear regression was used to relate FLs and TLsfor alewife and blueback herring data from the Oyster River inNew Hampshire (Kevin Sullivan, New Hampshire Fish and Game,unpublished data). Data from the Oyster River were used becauseit was the closest system with available length data for both ale-wife and blueback herring runs. The resulting model met all re-gression assumptions and was applied to Penobscot River TL datato estimate FLs. These two herrings are very similar in size andappearance, and adults migrating in the same system may bedifficult to identify to species. To avoid any issues with misidenti-fication in the Oyster River, Penobscot River, or DIDSON data sets,all length data for alewife and blueback herring were combinedinto a single “river herring” distribution for our analysis. Riverherring FL was positively and significantly related to TL (FL =0.406 + 0.868TL, R2 = 0.977, P < 0.001), and this relationship wasused to estimate FLs for river herring from the Penobscot system.
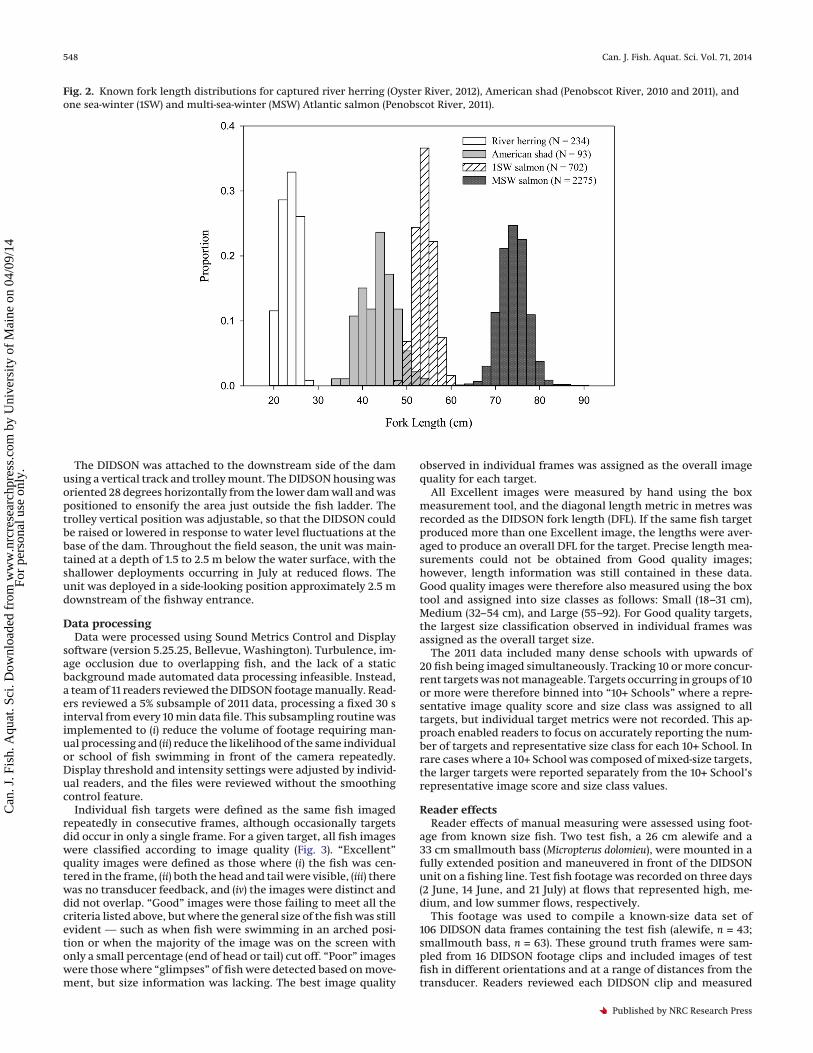
Finally, American shad FL data were collected in 2010 and 2011in a companion telemetry study (Grote et al. in press) that focusedon the behavior of adult Penobscot River shad. The range of ob-served (and, in the case of river herring, modeled) FLs were asfollows: river herring 18.0–26.0 cm, American shad 34.0–53.5 cm,1SW Atlantic salmon 48–60 cm, and MSW Atlantic salmon 62–90 cm (Fig. 2).
Hydroacoustic samplingFixed DIDSON surveys were conducted at the base of the Veazie
Dam from 24 May to 21 July 2011. Water flows in this area of thetailrace are turbulent, with spill from the headpond and flowsfrom the fish ladder mixing with the water at the base of the dam.Data were collected using a standard (short-range) DIDSON, oper-ating in high-frequency identification mode (1.8 MHz). The win-dow length was set to 2.5 m (starting at 1.67 m and ending at4.17 m), and the focus was set at 2.91 m. This short window wasselected to improve the image quality of smaller targets. The re-cording frame rate varied between 9 and 11 frames per second,and data files were saved to external drives every 10 min. Datawere collected continuously 24 h per day, except when the datadrives were swapped, the unit was cleaned, or power outagesaffected operations. The longest interruptions to data collectionoccurred on 19 June – 20 June and 9 July – 11 July. Despite theseinterruptions, the DIDSON was operational for 1301 of 1389 possi-ble sample hours (93.7%) over the course of the entire surveyperiod.
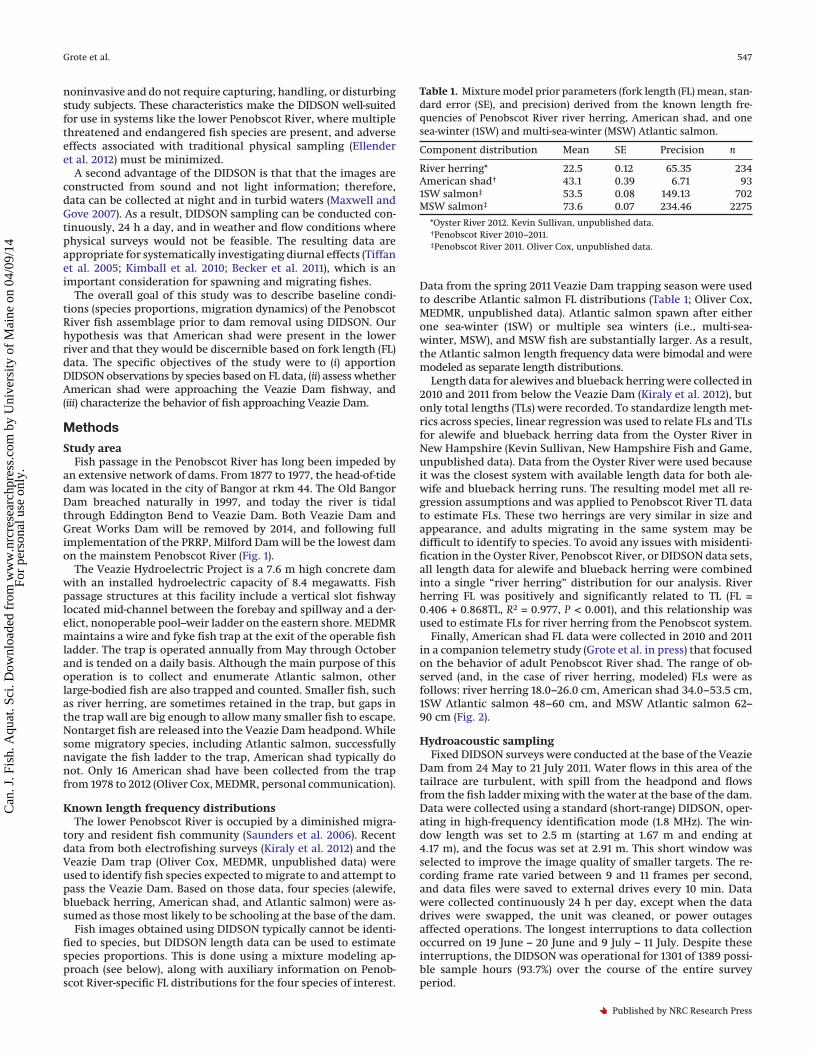
Table 1. Mixture model prior parameters (fork length (FL) mean, stan-dard error (SE), and precision) derived from the known length fre-quencies of Penobscot River river herring, American shad, and onesea-winter (1SW) and multi-sea-winter (MSW) Atlantic salmon.
Component distribution Mean SE Precision n
River herring* 22.5 0.12 65.35 234American shad† 43.1 0.39 6.71 931SW salmon‡ 53.5 0.08 149.13 702MSW salmon‡ 73.6 0.07 234.46 2275
*Oyster River 2012. Kevin Sullivan, unpublished data.†Penobscot River 2010–2011.‡Penobscot River 2011. Oliver Cox, unpublished data.
Grote et al. 547
Published by NRC Research Press
Can
. J. F
ish.
Aqu
at. S
ci. D
ownl
oade
d fr
om w
ww
.nrc
rese
arch
pres
s.co
m b
y U
nive
rsity
of
Mai
ne o
n 04
/09/
14Fo
r pe
rson
al u
se o
nly.
The DIDSON was attached to the downstream side of the damusing a vertical track and trolley mount. The DIDSON housing wasoriented 28 degrees horizontally from the lower dam wall and waspositioned to ensonify the area just outside the fish ladder. Thetrolley vertical position was adjustable, so that the DIDSON couldbe raised or lowered in response to water level fluctuations at thebase of the dam. Throughout the field season, the unit was main-tained at a depth of 1.5 to 2.5 m below the water surface, with theshallower deployments occurring in July at reduced flows. Theunit was deployed in a side-looking position approximately 2.5 mdownstream of the fishway entrance.
Data processingData were processed using Sound Metrics Control and Display
software (version 5.25.25, Bellevue, Washington). Turbulence, im-age occlusion due to overlapping fish, and the lack of a staticbackground made automated data processing infeasible. Instead,a team of 11 readers reviewed the DIDSON footage manually. Read-ers reviewed a 5% subsample of 2011 data, processing a fixed 30 sinterval from every 10 min data file. This subsampling routine wasimplemented to (i) reduce the volume of footage requiring man-ual processing and (ii) reduce the likelihood of the same individualor school of fish swimming in front of the camera repeatedly.Display threshold and intensity settings were adjusted by individ-ual readers, and the files were reviewed without the smoothingcontrol feature.
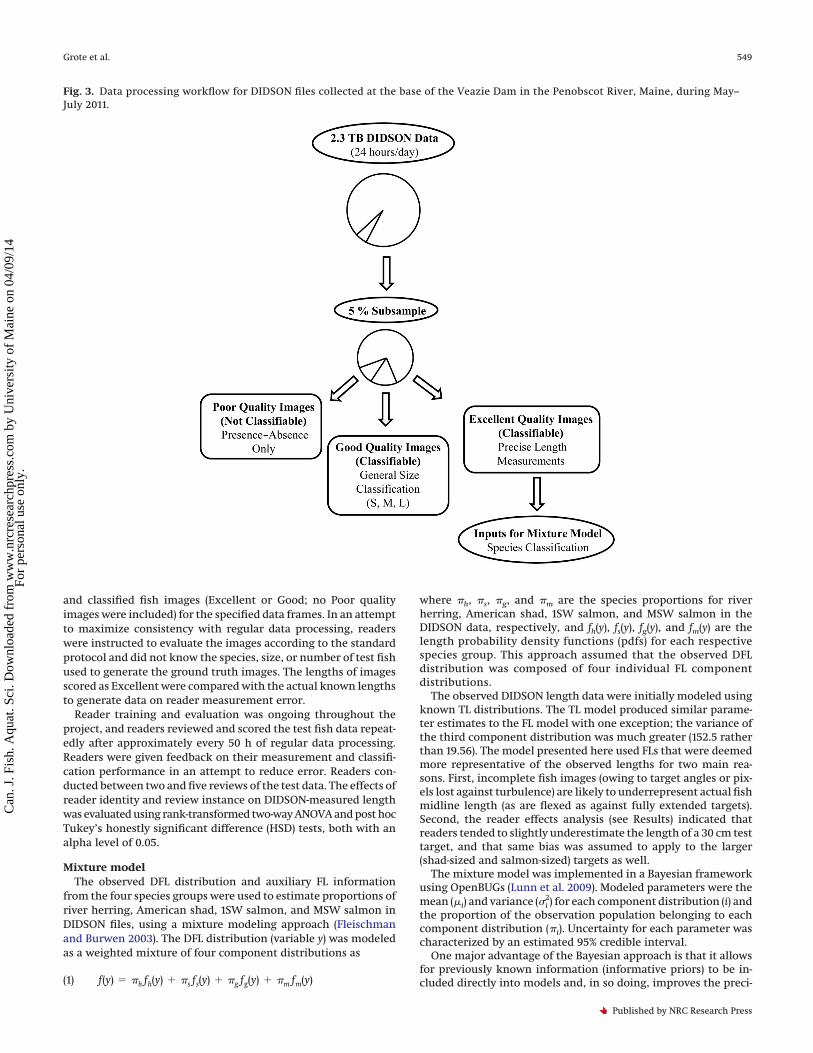
Individual fish targets were defined as the same fish imagedrepeatedly in consecutive frames, although occasionally targetsdid occur in only a single frame. For a given target, all fish imageswere classified according to image quality (Fig. 3). “Excellent”quality images were defined as those where (i) the fish was cen-tered in the frame, (ii) both the head and tail were visible, (iii) therewas no transducer feedback, and (iv) the images were distinct anddid not overlap. “Good” images were those failing to meet all thecriteria listed above, but where the general size of the fish was stillevident — such as when fish were swimming in an arched posi-tion or when the majority of the image was on the screen withonly a small percentage (end of head or tail) cut off. “Poor” imageswere those where “glimpses” of fish were detected based on move-ment, but size information was lacking. The best image quality
observed in individual frames was assigned as the overall imagequality for each target.
All Excellent images were measured by hand using the boxmeasurement tool, and the diagonal length metric in metres wasrecorded as the DIDSON fork length (DFL). If the same fish targetproduced more than one Excellent image, the lengths were aver-aged to produce an overall DFL for the target. Precise length mea-surements could not be obtained from Good quality images;however, length information was still contained in these data.Good quality images were therefore also measured using the boxtool and assigned into size classes as follows: Small (18–31 cm),Medium (32–54 cm), and Large (55–92). For Good quality targets,the largest size classification observed in individual frames wasassigned as the overall target size.
The 2011 data included many dense schools with upwards of20 fish being imaged simultaneously. Tracking 10 or more concur-rent targets was not manageable. Targets occurring in groups of 10or more were therefore binned into “10+ Schools” where a repre-sentative image quality score and size class was assigned to alltargets, but individual target metrics were not recorded. This ap-proach enabled readers to focus on accurately reporting the num-ber of targets and representative size class for each 10+ School. Inrare cases where a 10+ School was composed of mixed-size targets,the larger targets were reported separately from the 10+ School’srepresentative image score and size class values.
Reader effectsReader effects of manual measuring were assessed using foot-
age from known size fish. Two test fish, a 26 cm alewife and a33 cm smallmouth bass (Micropterus dolomieu), were mounted in afully extended position and maneuvered in front of the DIDSONunit on a fishing line. Test fish footage was recorded on three days(2 June, 14 June, and 21 July) at flows that represented high, me-dium, and low summer flows, respectively.
This footage was used to compile a known-size data set of106 DIDSON data frames containing the test fish (alewife, n = 43;smallmouth bass, n = 63). These ground truth frames were sam-pled from 16 DIDSON footage clips and included images of testfish in different orientations and at a range of distances from thetransducer. Readers reviewed each DIDSON clip and measured
Fig. 2. Known fork length distributions for captured river herring (Oyster River, 2012), American shad (Penobscot River, 2010 and 2011), andone sea-winter (1SW) and multi-sea-winter (MSW) Atlantic salmon (Penobscot River, 2011).
548 Can. J. Fish. Aquat. Sci. Vol. 71, 2014
Published by NRC Research Press
Can
. J. F
ish.
Aqu
at. S
ci. D
ownl
oade
d fr
om w
ww
.nrc
rese
arch
pres
s.co
m b
y U
nive
rsity
of
Mai
ne o
n 04
/09/
14Fo
r pe
rson
al u
se o
nly.
and classified fish images (Excellent or Good; no Poor qualityimages were included) for the specified data frames. In an attemptto maximize consistency with regular data processing, readerswere instructed to evaluate the images according to the standardprotocol and did not know the species, size, or number of test fishused to generate the ground truth images. The lengths of imagesscored as Excellent were compared with the actual known lengthsto generate data on reader measurement error.
Reader training and evaluation was ongoing throughout theproject, and readers reviewed and scored the test fish data repeat-edly after approximately every 50 h of regular data processing.Readers were given feedback on their measurement and classifi-cation performance in an attempt to reduce error. Readers con-ducted between two and five reviews of the test data. The effects ofreader identity and review instance on DIDSON-measured lengthwas evaluated using rank-transformed two-way ANOVA and post hocTukey’s honestly significant difference (HSD) tests, both with analpha level of 0.05.
Mixture modelThe observed DFL distribution and auxiliary FL information
from the four species groups were used to estimate proportions ofriver herring, American shad, 1SW salmon, and MSW salmon inDIDSON files, using a mixture modeling approach (Fleischmanand Burwen 2003). The DFL distribution (variable y) was modeledas a weighted mixture of four component distributions as
(1) f(y) � �h fh(y) � �s fs(y) � �g fg(y) � �m fm(y)
where �h, �s, �g, and �m are the species proportions for riverherring, American shad, 1SW salmon, and MSW salmon in theDIDSON data, respectively, and fh(y), fs(y), fg(y), and fm(y) are thelength probability density functions (pdfs) for each respectivespecies group. This approach assumed that the observed DFLdistribution was composed of four individual FL componentdistributions.
The observed DIDSON length data were initially modeled usingknown TL distributions. The TL model produced similar parame-ter estimates to the FL model with one exception; the variance ofthe third component distribution was much greater (152.5 ratherthan 19.56). The model presented here used FLs that were deemedmore representative of the observed lengths for two main rea-sons. First, incomplete fish images (owing to target angles or pix-els lost against turbulence) are likely to underrepresent actual fishmidline length (as are flexed as against fully extended targets).Second, the reader effects analysis (see Results) indicated thatreaders tended to slightly underestimate the length of a 30 cm testtarget, and that same bias was assumed to apply to the larger(shad-sized and salmon-sized) targets as well.
The mixture model was implemented in a Bayesian frameworkusing OpenBUGs (Lunn et al. 2009). Modeled parameters were themean (�i) and variance (�i
2) for each component distribution (i) andthe proportion of the observation population belonging to eachcomponent distribution (�i). Uncertainty for each parameter wascharacterized by an estimated 95% credible interval.
One major advantage of the Bayesian approach is that it allowsfor previously known information (informative priors) to be in-cluded directly into models and, in so doing, improves the preci-
Fig. 3. Data processing workflow for DIDSON files collected at the base of the Veazie Dam in the Penobscot River, Maine, during May–July 2011.
Grote et al. 549
Published by NRC Research Press
Can
. J. F
ish.
Aqu
at. S
ci. D
ownl
oade
d fr
om w
ww
.nrc
rese
arch
pres
s.co
m b
y U
nive
rsity
of
Mai
ne o
n 04
/09/
14Fo
r pe
rson
al u
se o
nly.
sion of the posterior parameter distributions (McCarthy 2007). Asecond advantage is that Bayesian methods account for imperfectinformation (uncertainty or error) through the use of prior distri-butions instead of fixed estimates. This type of error is common incomplex natural and ecological systems. Our mixture model in-corporated several potential sources of error, including (i) lengthmeasurement error for the captured fish, (ii) modeling error fromTL to FL river herring conversions, (iii) mathematical or softwareerror in the DIDSON measurement tool, and (iv) reader error in themanual measurements of DIDSON images.
A combination of informative and uninformative priors wasincluded in the model formulation. For each species group, aninformative normal prior distribution was used for mean FL,based on the observed mean and its variance from the Penobscot-specific length data (Table 1). Informative priors were used be-cause there was excellent system-specific data on the four lengthdistributions of interest.
An uninformative uniform prior with a range of 1–150 was usedfor each variance parameter (�i
2). These parameters were modeledas mixtures of two components: true variance due to underlyingvariability in fish length and error variance inherent in the man-ual reader measurements. This latter component was estimatedfrom the test fish length error data set described in “Reader ef-fects” section above. Species proportions (�i) ranged from 0 to 1and summed to 1 and were assigned an uninformative multino-mial Dirichlet prior.
The model ran on three Markov chains for a minimum of250 000 iterations. Chain convergence was assessed visually usingOpenBUGS (Brooks–Gelman–Rubin diagnostic tool), and all subse-quent calculations were made with a 25 000 iteration burn-in pe-riod. To reduce autocorrelation, samples were thinned by 100 to 1,with minimum of 6750 samples retained. Goodness of fit wasassessed with �2 dissimilarity-based posterior predictive checkand Bayesian P value (Kéry 2010).
Environmental dataWater temperature data were collected at the base of the Veazie
Dam with a Solinst Level Logger Jr. (Solinst, Inc., Georgetown,Ontario). Flow data for the project site was estimated from gageheights recorded at the USGS Eddington Bend gaging station lo-cated approximately 0.5 km downstream of Veazie Dam.
Results
DIDSON dataThe 5% subsample of DIDSON data produced 43 709 total fish
targets (Table 2), with 38 841 (88.7%) of the targets consideredclassifiable (Excellent or Good quality observations). The remain-ing 11.3% of observations contained no information on target sizeand were therefore excluded from subsequent size-based analy-ses. Classifiable images were predominantly Medium-sized (80.1%)and of Good (82.3%), not Excellent (17.7%), quality (Table 3). Thepercentage of Excellent targets measured by size class ranged
from 17.2% to 23.1%, although the actual number of measurableobservations in each class varied more widely (524–5364). Of the6876 Excellent quality targets, 6869 were between 18 and 92 cm inlength and were included in the mixture model analysis; seventargets were excluded because they were too small.
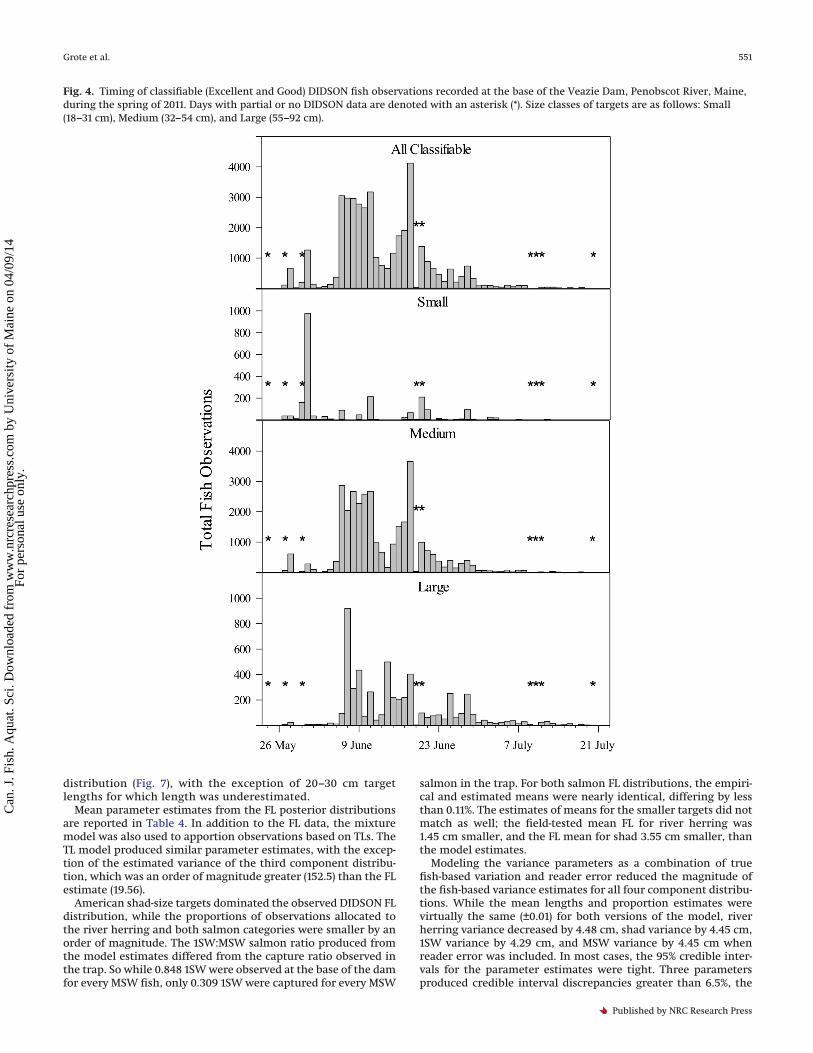
Fish were recorded every day that the DIDSON was operational(Fig. 4). The majority of targets were imaged in mid-June, with 25%and 75% of observations occurring by 8 June and 18 June, respec-tively. Run timing varied by size class, with Small and Mediumtargets appearing earlier in the spring, and Medium and Largetargets persisting later into the summer. The median target ob-servation days were 31 May (Small), 8 June (Medium), and 14 June(Large).
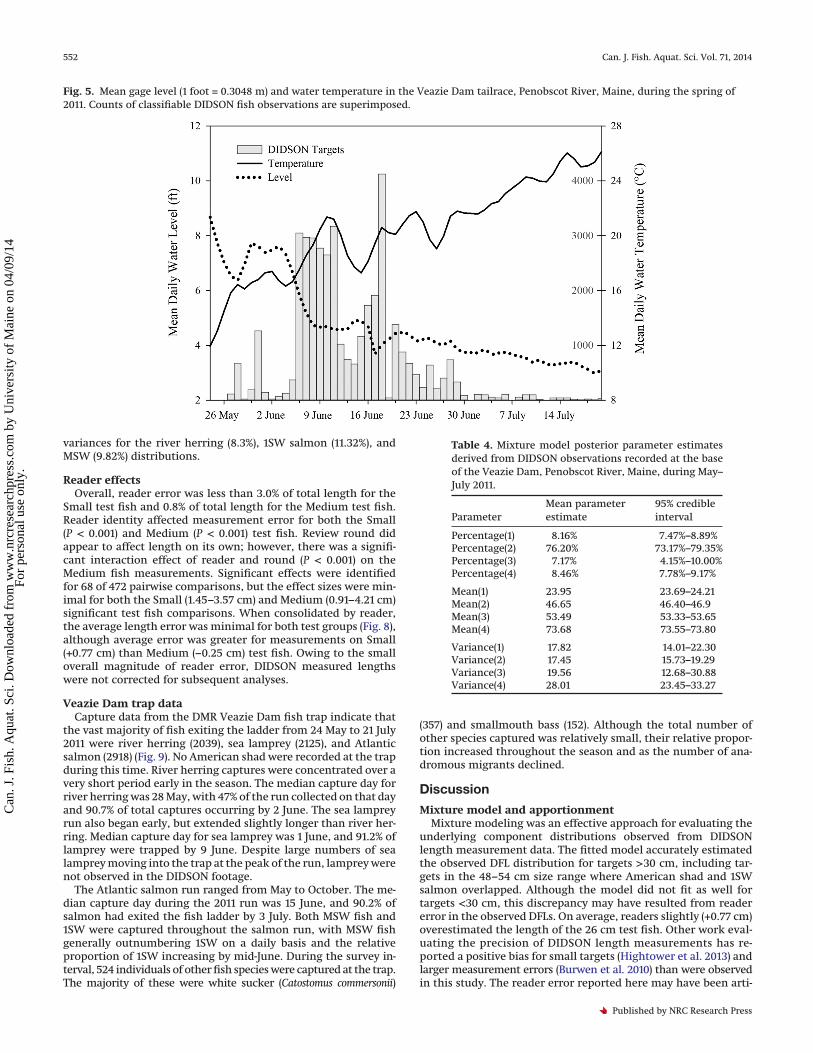
Fish activity at the base of the dam varied with water tempera-ture and water level (Fig. 5). Daily mean water temperature in-creased from 18.6 °C when 25% of targets were observed to 20.9 °Cwhen 75% of targets were observed. Conversely, daily mean waterlevel decreased from 1.47 m at 25% of observations to 1.31 m at 75%of observations. Small targets were observed at colder mediantemperatures (17.1 °C) and higher median flows (2.24 m) than ei-ther Medium (20.2 °C, 1.40 m) or Large (20.0 °C, 1.39 m) targets.
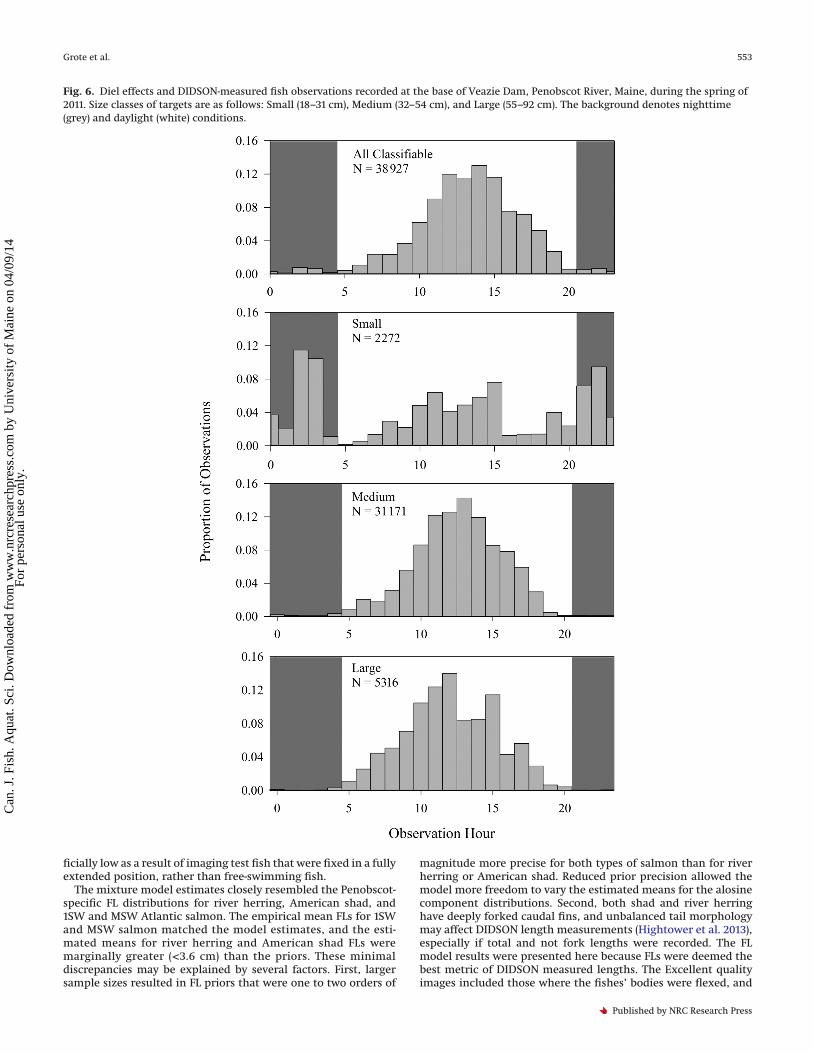
Fish activity at the base of the dam also varied as a function ofboth time of day and size class (Fig. 6). Observations of Mediumand Large targets followed a similar pattern: Medium (99%) andLarge (99%) targets were observed almost exclusively during day-light hours (0500–2059). Medium and Large targets were mostconspicuous at midday (1100–1500), when 59% and 61% of observa-tions were recorded, respectively. Observations of Small targetsincreased in the middle of the day. However, unlike the biggerfish, Small targets were often observed at night, and nearly half(49%) of Small targets were recorded between 2100 and 0459.Nearly all targets (94.3%) were observed in schools, with nearlyhalf (47.0%) recorded in 10+ Schools. As a result of the data-recording protocol for mixed-size 10+ Schools, the proportion ofSmall, Medium, and Large targets in each schooling category wasnot calculable. In addition to schooling, many targets demonstratedmilling behavior by turning, changing direction, and making multi-ple passes in front of the transducer. Target-specific milling datawere not recorded. Owing to the tendency for fish, and especiallymilling 10+ Schools, to swim out of the DIDSON range for only a fewframes and then (presumably) to swim back into the view, we did notfeel confident in our ability to describe milling behavior.
Mixture modelThe mixture model generated posterior distributions for the
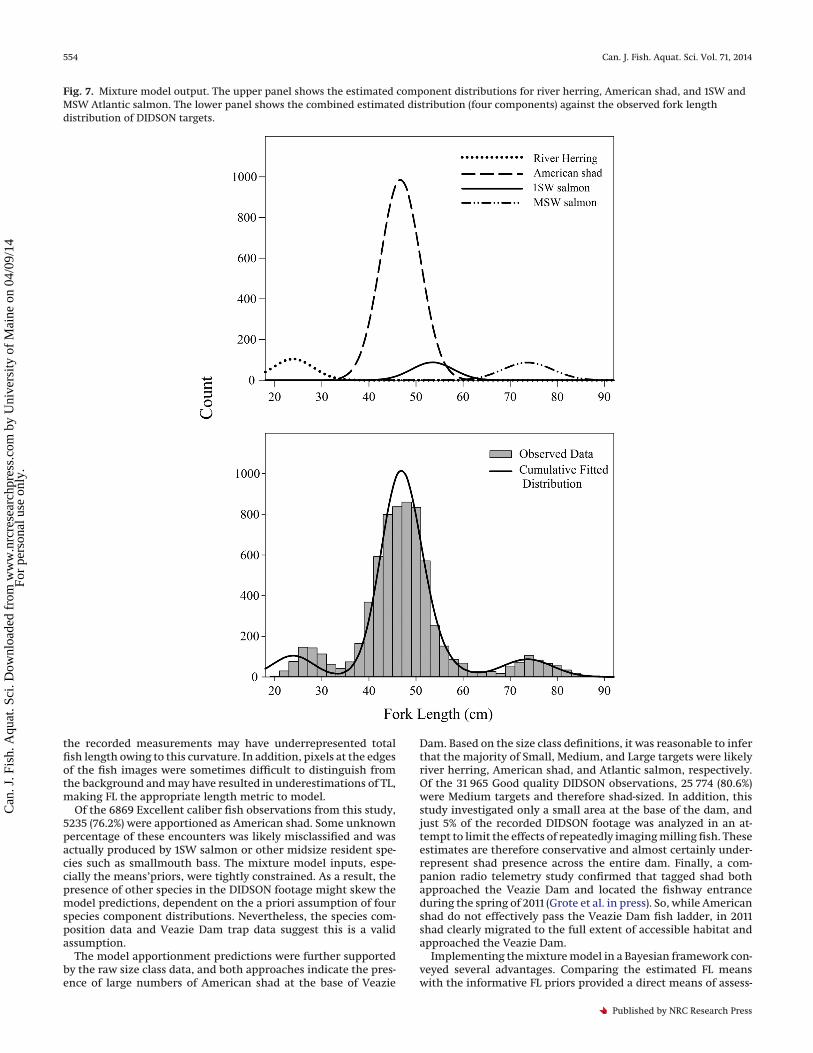
parameters describing the four component FL distributions. Themean parameter estimates from the posteriors were used to de-fine component distributions, which were combined to predictthe overall observed length distribution of DIDSON-measured fish.The model fit the observed data well (Bayesian P value = 0.465). Thefitted distribution compared favorably with the observed FL
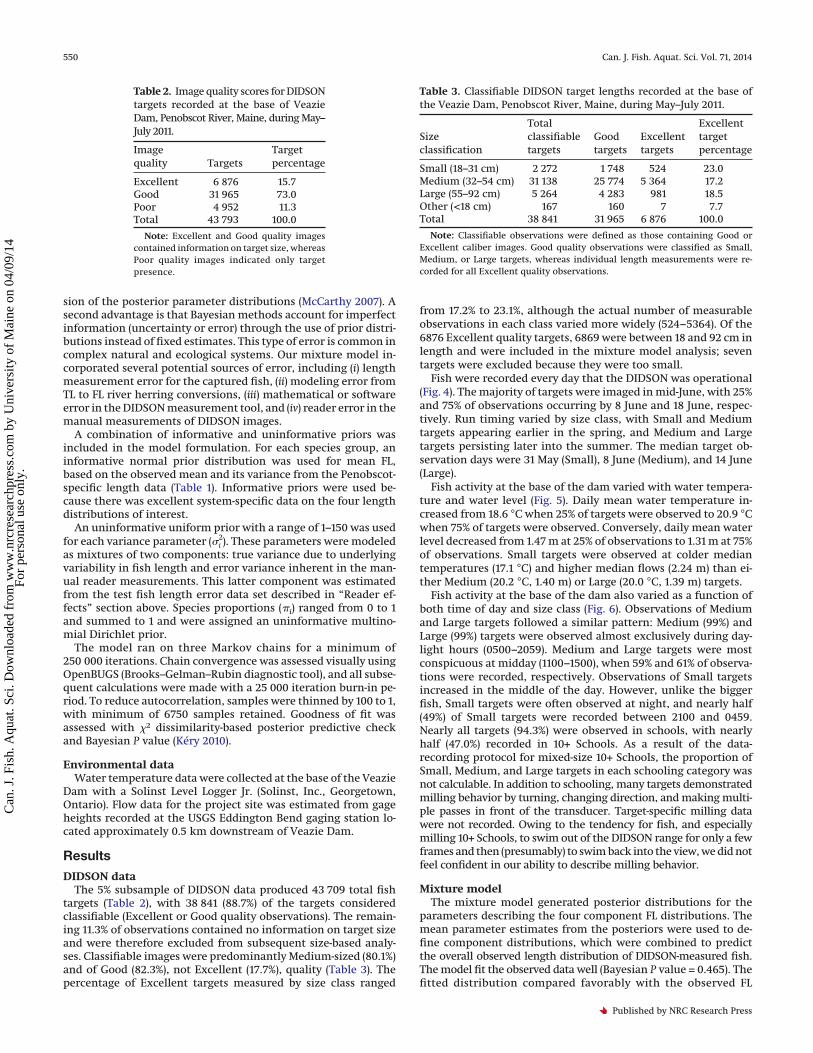
Table 2. Image quality scores for DIDSONtargets recorded at the base of VeazieDam, Penobscot River, Maine, during May–July 2011.
Imagequality Targets
Targetpercentage
Excellent 6 876 15.7Good 31 965 73.0Poor 4 952 11.3Total 43 793 100.0
Note: Excellent and Good quality imagescontained information on target size, whereasPoor quality images indicated only targetpresence.
Table 3. Classifiable DIDSON target lengths recorded at the base ofthe Veazie Dam, Penobscot River, Maine, during May–July 2011.
Sizeclassification
Totalclassifiabletargets
Goodtargets
Excellenttargets
Excellenttargetpercentage
Small (18–31 cm) 2 272 1 748 524 23.0Medium (32–54 cm) 31 138 25 774 5 364 17.2Large (55–92 cm) 5 264 4 283 981 18.5Other (<18 cm) 167 160 7 7.7Total 38 841 31 965 6 876 100.0
Note: Classifiable observations were defined as those containing Good orExcellent caliber images. Good quality observations were classified as Small,Medium, or Large targets, whereas individual length measurements were re-corded for all Excellent quality observations.
550 Can. J. Fish. Aquat. Sci. Vol. 71, 2014
Published by NRC Research Press
Can
. J. F
ish.
Aqu
at. S
ci. D
ownl
oade
d fr
om w
ww
.nrc
rese
arch
pres
s.co
m b
y U
nive
rsity
of
Mai
ne o
n 04
/09/
14Fo
r pe
rson
al u
se o
nly.
distribution (Fig. 7), with the exception of 20–30 cm targetlengths for which length was underestimated.
Mean parameter estimates from the FL posterior distributionsare reported in Table 4. In addition to the FL data, the mixturemodel was also used to apportion observations based on TLs. TheTL model produced similar parameter estimates, with the excep-tion of the estimated variance of the third component distribu-tion, which was an order of magnitude greater (152.5) than the FLestimate (19.56).
American shad-size targets dominated the observed DIDSON FLdistribution, while the proportions of observations allocated tothe river herring and both salmon categories were smaller by anorder of magnitude. The 1SW:MSW salmon ratio produced fromthe model estimates differed from the capture ratio observed inthe trap. So while 0.848 1SW were observed at the base of the damfor every MSW fish, only 0.309 1SW were captured for every MSW
salmon in the trap. For both salmon FL distributions, the empiri-cal and estimated means were nearly identical, differing by lessthan 0.11%. The estimates of means for the smaller targets did notmatch as well; the field-tested mean FL for river herring was1.45 cm smaller, and the FL mean for shad 3.55 cm smaller, thanthe model estimates.
Modeling the variance parameters as a combination of truefish-based variation and reader error reduced the magnitude ofthe fish-based variance estimates for all four component distribu-tions. While the mean lengths and proportion estimates werevirtually the same (±0.01) for both versions of the model, riverherring variance decreased by 4.48 cm, shad variance by 4.45 cm,1SW variance by 4.29 cm, and MSW variance by 4.45 cm whenreader error was included. In most cases, the 95% credible inter-vals for the parameter estimates were tight. Three parametersproduced credible interval discrepancies greater than 6.5%, the
Fig. 4. Timing of classifiable (Excellent and Good) DIDSON fish observations recorded at the base of the Veazie Dam, Penobscot River, Maine,during the spring of 2011. Days with partial or no DIDSON data are denoted with an asterisk (*). Size classes of targets are as follows: Small(18–31 cm), Medium (32–54 cm), and Large (55–92 cm).
Grote et al. 551
Published by NRC Research Press
Can
. J. F
ish.
Aqu
at. S
ci. D
ownl
oade
d fr
om w
ww
.nrc
rese
arch
pres
s.co
m b
y U
nive
rsity
of
Mai
ne o
n 04
/09/
14Fo
r pe
rson
al u
se o
nly.
variances for the river herring (8.3%), 1SW salmon (11.32%), andMSW (9.82%) distributions.
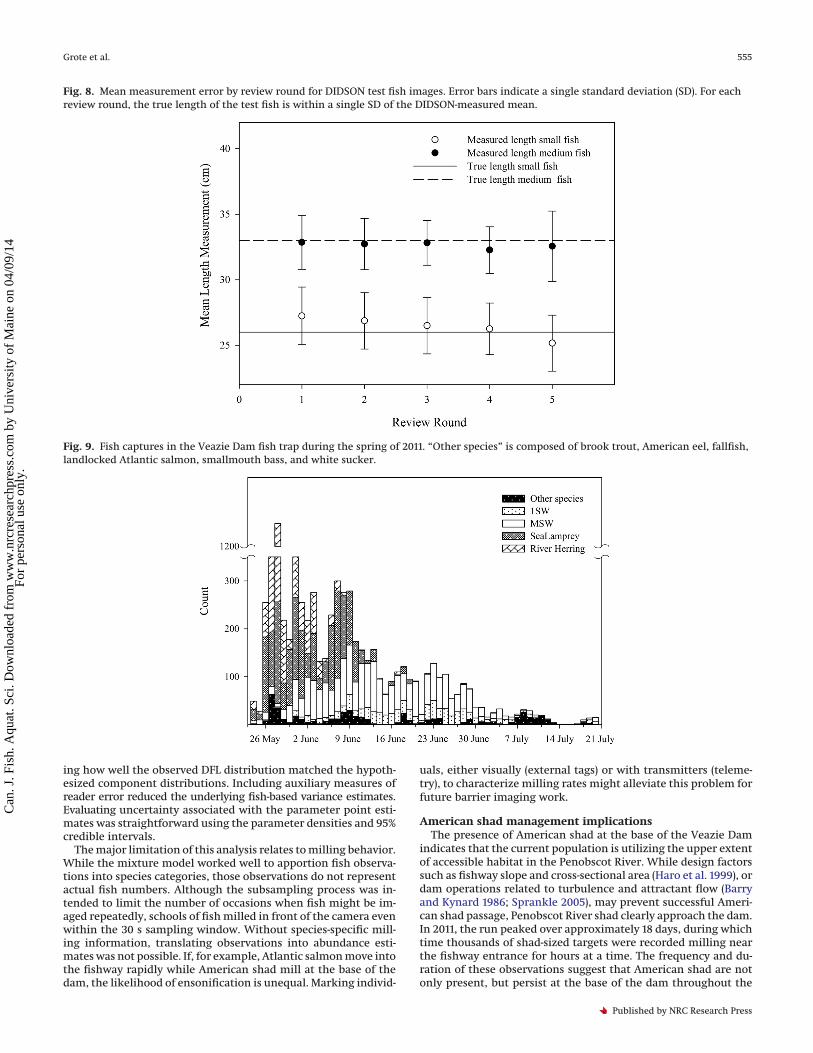
Reader effectsOverall, reader error was less than 3.0% of total length for the
Small test fish and 0.8% of total length for the Medium test fish.Reader identity affected measurement error for both the Small(P < 0.001) and Medium (P < 0.001) test fish. Review round didappear to affect length on its own; however, there was a signifi-cant interaction effect of reader and round (P < 0.001) on theMedium fish measurements. Significant effects were identifiedfor 68 of 472 pairwise comparisons, but the effect sizes were min-imal for both the Small (1.45–3.57 cm) and Medium (0.91–4.21 cm)significant test fish comparisons. When consolidated by reader,the average length error was minimal for both test groups (Fig. 8),although average error was greater for measurements on Small(+0.77 cm) than Medium (–0.25 cm) test fish. Owing to the smalloverall magnitude of reader error, DIDSON measured lengthswere not corrected for subsequent analyses.
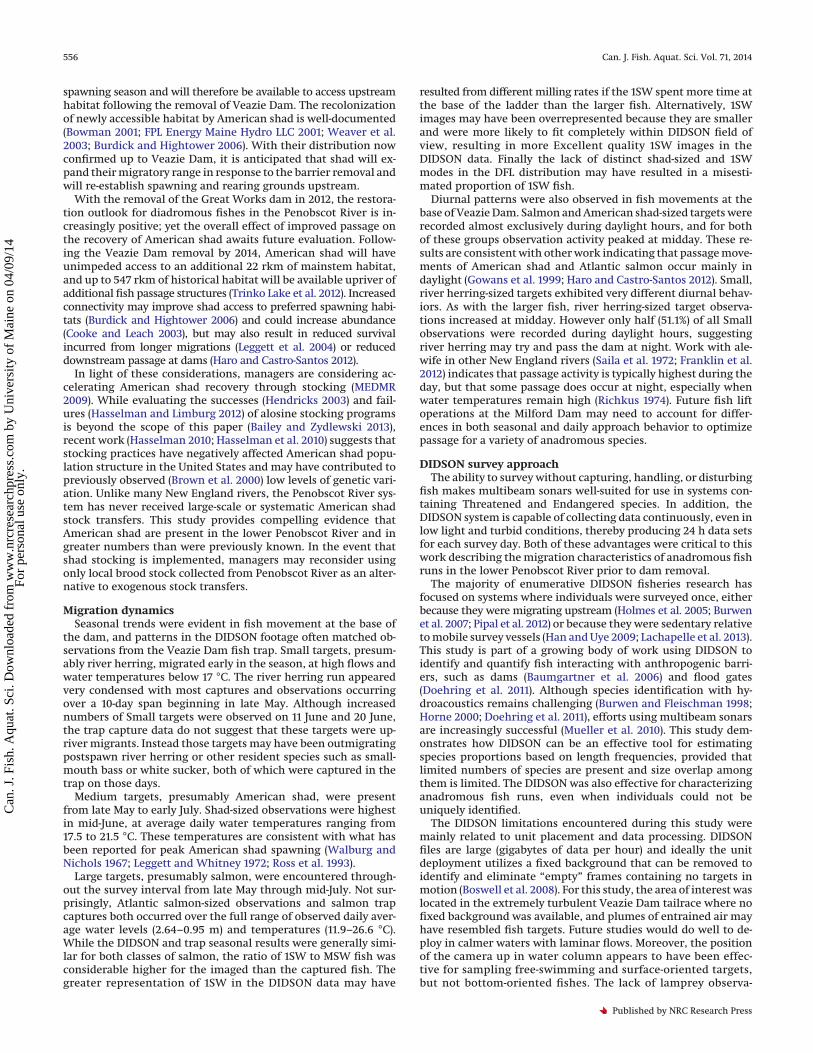
Veazie Dam trap dataCapture data from the DMR Veazie Dam fish trap indicate that
the vast majority of fish exiting the ladder from 24 May to 21 July2011 were river herring (2039), sea lamprey (2125), and Atlanticsalmon (2918) (Fig. 9). No American shad were recorded at the trapduring this time. River herring captures were concentrated over avery short period early in the season. The median capture day forriver herring was 28 May, with 47% of the run collected on that dayand 90.7% of total captures occurring by 2 June. The sea lampreyrun also began early, but extended slightly longer than river her-ring. Median capture day for sea lamprey was 1 June, and 91.2% oflamprey were trapped by 9 June. Despite large numbers of sealamprey moving into the trap at the peak of the run, lamprey werenot observed in the DIDSON footage.
The Atlantic salmon run ranged from May to October. The me-dian capture day during the 2011 run was 15 June, and 90.2% ofsalmon had exited the fish ladder by 3 July. Both MSW fish and1SW were captured throughout the salmon run, with MSW fishgenerally outnumbering 1SW on a daily basis and the relativeproportion of 1SW increasing by mid-June. During the survey in-terval, 524 individuals of other fish species were captured at the trap.The majority of these were white sucker (Catostomus commersonii)
(357) and smallmouth bass (152). Although the total number ofother species captured was relatively small, their relative propor-tion increased throughout the season and as the number of ana-dromous migrants declined.
Discussion
Mixture model and apportionmentMixture modeling was an effective approach for evaluating the
underlying component distributions observed from DIDSONlength measurement data. The fitted model accurately estimatedthe observed DFL distribution for targets >30 cm, including tar-gets in the 48–54 cm size range where American shad and 1SWsalmon overlapped. Although the model did not fit as well fortargets <30 cm, this discrepancy may have resulted from readererror in the observed DFLs. On average, readers slightly (+0.77 cm)overestimated the length of the 26 cm test fish. Other work eval-uating the precision of DIDSON length measurements has re-ported a positive bias for small targets (Hightower et al. 2013) andlarger measurement errors (Burwen et al. 2010) than were observedin this study. The reader error reported here may have been arti-
Fig. 5. Mean gage level (1 foot = 0.3048 m) and water temperature in the Veazie Dam tailrace, Penobscot River, Maine, during the spring of2011. Counts of classifiable DIDSON fish observations are superimposed.
Table 4. Mixture model posterior parameter estimatesderived from DIDSON observations recorded at the baseof the Veazie Dam, Penobscot River, Maine, during May–July 2011.
ParameterMean parameterestimate
95% credibleinterval
Percentage(1) 8.16% 7.47%–8.89%Percentage(2) 76.20% 73.17%–79.35%Percentage(3) 7.17% 4.15%–10.00%Percentage(4) 8.46% 7.78%–9.17%
Mean(1) 23.95 23.69–24.21Mean(2) 46.65 46.40–46.9Mean(3) 53.49 53.33–53.65Mean(4) 73.68 73.55–73.80
Variance(1) 17.82 14.01–22.30Variance(2) 17.45 15.73–19.29Variance(3) 19.56 12.68–30.88Variance(4) 28.01 23.45–33.27
552 Can. J. Fish. Aquat. Sci. Vol. 71, 2014
Published by NRC Research Press
Can
. J. F
ish.
Aqu
at. S
ci. D
ownl
oade
d fr
om w
ww
.nrc
rese
arch
pres
s.co
m b
y U
nive
rsity
of
Mai
ne o
n 04
/09/
14Fo
r pe
rson
al u
se o
nly.
ficially low as a result of imaging test fish that were fixed in a fullyextended position, rather than free-swimming fish.
The mixture model estimates closely resembled the Penobscot-specific FL distributions for river herring, American shad, and1SW and MSW Atlantic salmon. The empirical mean FLs for 1SWand MSW salmon matched the model estimates, and the esti-mated means for river herring and American shad FLs weremarginally greater (<3.6 cm) than the priors. These minimaldiscrepancies may be explained by several factors. First, largersample sizes resulted in FL priors that were one to two orders of
magnitude more precise for both types of salmon than for riverherring or American shad. Reduced prior precision allowed themodel more freedom to vary the estimated means for the alosinecomponent distributions. Second, both shad and river herringhave deeply forked caudal fins, and unbalanced tail morphologymay affect DIDSON length measurements (Hightower et al. 2013),especially if total and not fork lengths were recorded. The FLmodel results were presented here because FLs were deemed thebest metric of DIDSON measured lengths. The Excellent qualityimages included those where the fishes’ bodies were flexed, and
Fig. 6. Diel effects and DIDSON-measured fish observations recorded at the base of Veazie Dam, Penobscot River, Maine, during the spring of2011. Size classes of targets are as follows: Small (18–31 cm), Medium (32–54 cm), and Large (55–92 cm). The background denotes nighttime(grey) and daylight (white) conditions.
Grote et al. 553
Published by NRC Research Press
Can
. J. F
ish.
Aqu
at. S
ci. D
ownl
oade
d fr
om w
ww
.nrc
rese
arch
pres
s.co
m b
y U
nive
rsity
of
Mai
ne o
n 04
/09/
14Fo
r pe
rson
al u
se o
nly.
the recorded measurements may have underrepresented totalfish length owing to this curvature. In addition, pixels at the edgesof the fish images were sometimes difficult to distinguish fromthe background and may have resulted in underestimations of TL,making FL the appropriate length metric to model.
Of the 6869 Excellent caliber fish observations from this study,5235 (76.2%) were apportioned as American shad. Some unknownpercentage of these encounters was likely misclassified and wasactually produced by 1SW salmon or other midsize resident spe-cies such as smallmouth bass. The mixture model inputs, espe-cially the means’priors, were tightly constrained. As a result, thepresence of other species in the DIDSON footage might skew themodel predictions, dependent on the a priori assumption of fourspecies component distributions. Nevertheless, the species com-position data and Veazie Dam trap data suggest this is a validassumption.
The model apportionment predictions were further supportedby the raw size class data, and both approaches indicate the pres-ence of large numbers of American shad at the base of Veazie
Dam. Based on the size class definitions, it was reasonable to inferthat the majority of Small, Medium, and Large targets were likelyriver herring, American shad, and Atlantic salmon, respectively.Of the 31 965 Good quality DIDSON observations, 25 774 (80.6%)were Medium targets and therefore shad-sized. In addition, thisstudy investigated only a small area at the base of the dam, andjust 5% of the recorded DIDSON footage was analyzed in an at-tempt to limit the effects of repeatedly imaging milling fish. Theseestimates are therefore conservative and almost certainly under-represent shad presence across the entire dam. Finally, a com-panion radio telemetry study confirmed that tagged shad bothapproached the Veazie Dam and located the fishway entranceduring the spring of 2011 (Grote et al. in press). So, while Americanshad do not effectively pass the Veazie Dam fish ladder, in 2011shad clearly migrated to the full extent of accessible habitat andapproached the Veazie Dam.
Implementing the mixture model in a Bayesian framework con-veyed several advantages. Comparing the estimated FL meanswith the informative FL priors provided a direct means of assess-
Fig. 7. Mixture model output. The upper panel shows the estimated component distributions for river herring, American shad, and 1SW andMSW Atlantic salmon. The lower panel shows the combined estimated distribution (four components) against the observed fork lengthdistribution of DIDSON targets.
554 Can. J. Fish. Aquat. Sci. Vol. 71, 2014
Published by NRC Research Press
Can
. J. F
ish.
Aqu
at. S
ci. D
ownl
oade
d fr
om w
ww
.nrc
rese
arch
pres
s.co
m b
y U
nive
rsity
of
Mai
ne o
n 04
/09/
14Fo
r pe
rson
al u
se o
nly.
ing how well the observed DFL distribution matched the hypoth-esized component distributions. Including auxiliary measures ofreader error reduced the underlying fish-based variance estimates.Evaluating uncertainty associated with the parameter point esti-mates was straightforward using the parameter densities and 95%credible intervals.
The major limitation of this analysis relates to milling behavior.While the mixture model worked well to apportion fish observa-tions into species categories, those observations do not representactual fish numbers. Although the subsampling process was in-tended to limit the number of occasions when fish might be im-aged repeatedly, schools of fish milled in front of the camera evenwithin the 30 s sampling window. Without species-specific mill-ing information, translating observations into abundance esti-mates was not possible. If, for example, Atlantic salmon move intothe fishway rapidly while American shad mill at the base of thedam, the likelihood of ensonification is unequal. Marking individ-
uals, either visually (external tags) or with transmitters (teleme-try), to characterize milling rates might alleviate this problem forfuture barrier imaging work.
American shad management implicationsThe presence of American shad at the base of the Veazie Dam
indicates that the current population is utilizing the upper extentof accessible habitat in the Penobscot River. While design factorssuch as fishway slope and cross-sectional area (Haro et al. 1999), ordam operations related to turbulence and attractant flow (Barryand Kynard 1986; Sprankle 2005), may prevent successful Ameri-can shad passage, Penobscot River shad clearly approach the dam.In 2011, the run peaked over approximately 18 days, during whichtime thousands of shad-sized targets were recorded milling nearthe fishway entrance for hours at a time. The frequency and du-ration of these observations suggest that American shad are notonly present, but persist at the base of the dam throughout the
Fig. 8. Mean measurement error by review round for DIDSON test fish images. Error bars indicate a single standard deviation (SD). For eachreview round, the true length of the test fish is within a single SD of the DIDSON-measured mean.
Fig. 9. Fish captures in the Veazie Dam fish trap during the spring of 2011. “Other species” is composed of brook trout, American eel, fallfish,landlocked Atlantic salmon, smallmouth bass, and white sucker.
Grote et al. 555
Published by NRC Research Press
Can
. J. F
ish.
Aqu
at. S
ci. D
ownl
oade
d fr
om w
ww
.nrc
rese
arch
pres
s.co
m b
y U
nive
rsity
of
Mai
ne o
n 04
/09/
14Fo
r pe
rson
al u
se o
nly.
spawning season and will therefore be available to access upstreamhabitat following the removal of Veazie Dam. The recolonizationof newly accessible habitat by American shad is well-documented(Bowman 2001; FPL Energy Maine Hydro LLC 2001; Weaver et al.2003; Burdick and Hightower 2006). With their distribution nowconfirmed up to Veazie Dam, it is anticipated that shad will ex-pand their migratory range in response to the barrier removal andwill re-establish spawning and rearing grounds upstream.
With the removal of the Great Works dam in 2012, the restora-tion outlook for diadromous fishes in the Penobscot River is in-creasingly positive; yet the overall effect of improved passage onthe recovery of American shad awaits future evaluation. Follow-ing the Veazie Dam removal by 2014, American shad will haveunimpeded access to an additional 22 rkm of mainstem habitat,and up to 547 rkm of historical habitat will be available upriver ofadditional fish passage structures (Trinko Lake et al. 2012). Increasedconnectivity may improve shad access to preferred spawning habi-tats (Burdick and Hightower 2006) and could increase abundance(Cooke and Leach 2003), but may also result in reduced survivalincurred from longer migrations (Leggett et al. 2004) or reduceddownstream passage at dams (Haro and Castro-Santos 2012).
In light of these considerations, managers are considering ac-celerating American shad recovery through stocking (MEDMR2009). While evaluating the successes (Hendricks 2003) and fail-ures (Hasselman and Limburg 2012) of alosine stocking programsis beyond the scope of this paper (Bailey and Zydlewski 2013),recent work (Hasselman 2010; Hasselman et al. 2010) suggests thatstocking practices have negatively affected American shad popu-lation structure in the United States and may have contributed topreviously observed (Brown et al. 2000) low levels of genetic vari-ation. Unlike many New England rivers, the Penobscot River sys-tem has never received large-scale or systematic American shadstock transfers. This study provides compelling evidence thatAmerican shad are present in the lower Penobscot River and ingreater numbers than were previously known. In the event thatshad stocking is implemented, managers may reconsider usingonly local brood stock collected from Penobscot River as an alter-native to exogenous stock transfers.
Migration dynamicsSeasonal trends were evident in fish movement at the base of
the dam, and patterns in the DIDSON footage often matched ob-servations from the Veazie Dam fish trap. Small targets, presum-ably river herring, migrated early in the season, at high flows andwater temperatures below 17 °C. The river herring run appearedvery condensed with most captures and observations occurringover a 10-day span beginning in late May. Although increasednumbers of Small targets were observed on 11 June and 20 June,the trap capture data do not suggest that these targets were up-river migrants. Instead those targets may have been outmigratingpostspawn river herring or other resident species such as small-mouth bass or white sucker, both of which were captured in thetrap on those days.
Medium targets, presumably American shad, were presentfrom late May to early July. Shad-sized observations were highestin mid-June, at average daily water temperatures ranging from17.5 to 21.5 °C. These temperatures are consistent with what hasbeen reported for peak American shad spawning (Walburg andNichols 1967; Leggett and Whitney 1972; Ross et al. 1993).
Large targets, presumably salmon, were encountered through-out the survey interval from late May through mid-July. Not sur-prisingly, Atlantic salmon-sized observations and salmon trapcaptures both occurred over the full range of observed daily aver-age water levels (2.64–0.95 m) and temperatures (11.9–26.6 °C).While the DIDSON and trap seasonal results were generally simi-lar for both classes of salmon, the ratio of 1SW to MSW fish wasconsiderable higher for the imaged than the captured fish. Thegreater representation of 1SW in the DIDSON data may have
resulted from different milling rates if the 1SW spent more time atthe base of the ladder than the larger fish. Alternatively, 1SWimages may have been overrepresented because they are smallerand were more likely to fit completely within DIDSON field ofview, resulting in more Excellent quality 1SW images in theDIDSON data. Finally the lack of distinct shad-sized and 1SWmodes in the DFL distribution may have resulted in a misesti-mated proportion of 1SW fish.
Diurnal patterns were also observed in fish movements at thebase of Veazie Dam. Salmon and American shad-sized targets wererecorded almost exclusively during daylight hours, and for bothof these groups observation activity peaked at midday. These re-sults are consistent with other work indicating that passage move-ments of American shad and Atlantic salmon occur mainly indaylight (Gowans et al. 1999; Haro and Castro-Santos 2012). Small,river herring-sized targets exhibited very different diurnal behav-iors. As with the larger fish, river herring-sized target observa-tions increased at midday. However only half (51.1%) of all Smallobservations were recorded during daylight hours, suggestingriver herring may try and pass the dam at night. Work with ale-wife in other New England rivers (Saila et al. 1972; Franklin et al.2012) indicates that passage activity is typically highest during theday, but that some passage does occur at night, especially whenwater temperatures remain high (Richkus 1974). Future fish liftoperations at the Milford Dam may need to account for differ-ences in both seasonal and daily approach behavior to optimizepassage for a variety of anadromous species.
DIDSON survey approachThe ability to survey without capturing, handling, or disturbing
fish makes multibeam sonars well-suited for use in systems con-taining Threatened and Endangered species. In addition, theDIDSON system is capable of collecting data continuously, even inlow light and turbid conditions, thereby producing 24 h data setsfor each survey day. Both of these advantages were critical to thiswork describing the migration characteristics of anadromous fishruns in the lower Penobscot River prior to dam removal.
The majority of enumerative DIDSON fisheries research hasfocused on systems where individuals were surveyed once, eitherbecause they were migrating upstream (Holmes et al. 2005; Burwenet al. 2007; Pipal et al. 2012) or because they were sedentary relativeto mobile survey vessels (Han and Uye 2009; Lachapelle et al. 2013).This study is part of a growing body of work using DIDSON toidentify and quantify fish interacting with anthropogenic barri-ers, such as dams (Baumgartner et al. 2006) and flood gates(Doehring et al. 2011). Although species identification with hy-droacoustics remains challenging (Burwen and Fleischman 1998;Horne 2000; Doehring et al. 2011), efforts using multibeam sonarsare increasingly successful (Mueller et al. 2010). This study dem-onstrates how DIDSON can be an effective tool for estimatingspecies proportions based on length frequencies, provided thatlimited numbers of species are present and size overlap amongthem is limited. The DIDSON was also effective for characterizinganadromous fish runs, even when individuals could not beuniquely identified.
The DIDSON limitations encountered during this study weremainly related to unit placement and data processing. DIDSONfiles are large (gigabytes of data per hour) and ideally the unitdeployment utilizes a fixed background that can be removed toidentify and eliminate “empty” frames containing no targets inmotion (Boswell et al. 2008). For this study, the area of interest waslocated in the extremely turbulent Veazie Dam tailrace where nofixed background was available, and plumes of entrained air mayhave resembled fish targets. Future studies would do well to de-ploy in calmer waters with laminar flows. Moreover, the positionof the camera up in water column appears to have been effec-tive for sampling free-swimming and surface-oriented targets,but not bottom-oriented fishes. The lack of lamprey observa-
556 Can. J. Fish. Aquat. Sci. Vol. 71, 2014
Published by NRC Research Press
Can
. J. F
ish.
Aqu
at. S
ci. D
ownl
oade
d fr
om w
ww
.nrc
rese
arch
pres
s.co
m b
y U
nive
rsity
of
Mai
ne o
n 04
/09/
14Fo
r pe
rson
al u
se o
nly.
tions from the hydroacoustic data demonstrates how DIDSONmay have species-specific applications limited by deployment ori-entation and target species behavior. Finally the DIDSON dataincluded large schools of fish with overlapping and occludingimages, which further confounded efforts to automate target de-tection. To address this issue, data were manually processed,which was time- and resource-intensive, and introduced the pos-sibility of reader bias. While the bias analysis identified effects toosmall to warrant correction, this may not always be the case, andDIDSON studies relying on manual processing will need to ac-count for this potential source of error.
AcknowledgementsA great many people and organizations gave generously of their
time and resources to make this work possible. Financial supportwas provided by the Nature Conservancy, the University of Maine,NOAA Fisheries, the US Geological Survey Maine Cooperative Fishand Wildlife Research Unit, the US Fish and Wildlife Service, andBrookfield Power. Black Bear Hydro Partners LLC graciouslygranted access to their property. Oliver Cox, Christine Lipsky, andMichael O’Malley all shared data that provided meaningful con-text for these results. Joshua Royte and Daniel Hildreth supportedthis work with heartfelt enthusiasm for ecosystem restoration.Daniel Harrison’s initial review greatly improved the quality ofthis manuscript. Sampling was conducted under IACUC protocolNo. A2011-06-05. Mention of trade names does not imply endorse-ment by the US Government.
ReferencesBabbitt, B. 2002. What goes up, may come down. BioScience, 52(8): 656–658.
doi:10.1641/0006-3568(2002)052[0656:WGUMCD]2.0.CO;2.Bailey, M.M., and Zydlewski, J.D. 2013. To stock or not to stock? Assessing resto-
ration potential of a remnant American shad spawning run with hatcherysupplementation. N. Am. J. Fish. Manage. 33(3): 459–467. doi:10.1080/02755947.2013.763874.
Barry, T., and Kynard, B. 1986. Attraction of adult American shad to fish lifts atHolyoke Dam, Connecticut River. N. Am. J. Fish. Manage. 6(2): 233–241. doi:10.1577/1548-8659(1986)6<233:AOAAST>2.0.CO;2.
Baumgartner, L., Reynoldson, N., Cameron, L., and Stanger, J. 2006. Assessmentof a dual-frequency identification sonar (DIDSON) for applications in fishmigration studies. Fisheries Final Report 84. NSW Department of PrimaryIndustries. Murray–Darling Basin Commission, Cronulla, New South Wales.
Becker, A., Cowley, P.D., Whitfield, A.K., Järnegren, J., and Naesje, T.F. 2011. Dielfish movements in the littoral zone of a temporarily closed South Africanestuary. J. Exp. Mar. Biol. Ecol. 406(1–2): 63–70. doi:10.1016/j.jembe.2011.06.014.
Bernhardt, E.S., Sudduth, E.B., Palmer, M.A., Allan, J.D., Meyer, J.L.,Alexander, G., Follastad-Shah, J., Hassett, B., Jenkinson, R., Lave, R., Rumps, J.,and Pagano, L. 2007. Restoring rivers one reach at a time: results from asurvey of U.S. river restoration practitioners. Restor. Ecol. 15(3): 482–493.doi:10.1111/j.1526-100X. 2007.00244.x.
Boswell, K.M., Wilson, M.P., and Cowan, J.H. 2008. A semiautomated approach toestimating fish size, abundance, and behavior from Dual-Frequency Identifi-cation Sonar (DIDSON) Data. N. Am. J. Fish. Manage. 28(3): 799–807. doi:10.1577/M07-116.1.
Bowman, S.W. 2001. American shad and striped bass spawning migration andhabitat selection in the Neuse River, North Carolina. M.Sc. thesis, Depart-ment of Fisheries and Wildlife Science, North Carolina State University, Ra-leigh, N.C.
Brown, B.L., Gunter, T.P., Waters, J.M., and Epifanio, J.M. 2000. Evaluating ge-netic diversity associated with propagation-assisted restoration of Americanshad. Conserv. Biol. 14(1): 294–303. doi:10.1046/j.1523-1739.2000.98165.x.
Burdick, S.M., and Hightower, J.E. 2006. Distribution of spawning activity byanadromous fishes in an Atlantic slope drainage after removal of a low-headdam. Trans. Am. Fish. Soc. 135(5): 1290–1300. doi:10.1577/T05-190.1.
Burwen, D.L., and Fleischman, S.J. 1998. Evaluation of side-aspect target strengthand pulse width as potential hydroacoustic discriminators of fish species inrivers. Can. J. Fish. Aquat. Sci. 55(11): 2492–2502. doi:10.1139/f98-136.
Burwen, D.L., Fleischman, S.J., and Miller, J.D. 2007. Evaluation of a dual-frequency imaging sonar for detecting and estimating the size of migratingsalmon. Alaska Department of Fish and Game, Division of Sport Fish, Re-search and Technical Services, 2007.
Burwen, D.L., Fleischman, S.J., and Miller, J.D. 2010. Accuracy and precision ofsalmon length estimates taken from DIDSON sonar images. Trans. Am. Fish.Soc. 139(5): 1306–1314. doi:10.1577/T09-173.1.
Cooke, D.W., and Leach, S.D. (Editors). 2003. Beneficial effects of increased riverflow and upstream fish passage on anadromous alosine stocks. In Biodiver-
sity, status, and conservation of the world’s shads. Edited by K.E. Limburg andJ.R. Waldman. American Fisheries Society, Symposium 35, Bethesda, Md.pp. 331–338.
Crossman, J.A., Martel, G., Johnson, P.N., and Bray, K. 2011. The use of Dual-frequency IDentification SONar (DIDSON) to document white sturgeon activ-ity in the Columbia River, Canada. J. Appl. Ichthyol. 27: 53–57. doi:10.1111/j.1439-0426.2011.01832.x.
Doehring, K., Young, R.G., Hay, J., and Quarterman, A.J. 2011. Suitability ofDual-frequency Identification Sonar (DIDSON) to monitor juvenile fish move-ment at floodgates. N.Z. J. Mar. Freshw. Res. 45(3): 413–422. doi:10.1080/00288330.2011.571701.
Ellender, B.R., Becker, A., Weyl, O.L.F., and Swartz, E.R. 2012. Underwater videoanalysis as a non-destructive alternative to electrofishing for sampling im-perilled headwater stream fishes. Aquat. Conserv. Mar. Freshw. Ecosyst. 22(1):58–65. doi:10.1002/aqc.1236.
Fleischman, S.J., and Burwen, D.L. 2003. Mixture models for the species appor-tionment of hydroacoustic data, with echo-envelope length as the discrimi-natory variable. ICES J. Mar. Sci. 60(3): 592–598. doi:10.1016/S1054-3139(03)00041-9.
Foster, N.W. and Atkins, G.C. 1869. Second Report of the Commissioners ofFisheries of the State of Maine 1868. Owen and Nash Printers to the State,Augusta, Maine.
FPL Energy Maine Hydro LLC. 2001. Upstream fish passage operations at the FortHalifax project and downstream fish passage operations at the Lockwood andShawmut projects during the 2000 migration seasons.
Franklin, A.E., Haro, A., Castro-Santos, T., and Noreika, J. 2012. Evaluation ofnature-like and technical fishways for the passage of alewives at two coastalstreams in New England. Trans. Am. Fish. Soc. 141(3): 624–637. doi:10.1080/00028487.2012.683469.
Gowans, A.R.D., Armstrong, J.D., and Priede, I.G. 1999. Movements of adultAtlantic salmon in relation to a hydroelectric dam and fish ladder. J. Fish Biol.54(4): 713–726. doi:10.1111/j.1095-8649.1999.tb02028.x.
Gregory, S., Li, H., and Li, J. 2002. The conceptual basis for ecological responsesto dam removal. BioScience, 52(8): 713–723. doi:10.1641/0006-3568(2002)052[0713:TCBFER]2.0.CO;2.
Grote, A.B., Zydlewski, J.D. and, Bailey, M.M. Movements and demography ofspawning American shad in the Penobscot River, Maine, prior to dam re-moval. Trans. Am. Fish. Soc. [In Press.]
Han, C.H., and Uye, S.I. 2009. Quantification of the abundance and distributionof the common jellyfish Aurelia aurita s.l. with a Dual-frequency IDentifica-tion SONar (DIDSON). J. Plankton Res. 31(8): 805–814. doi:10.1093/plankt/fbp029.
Haro, A., and Castro-Santos, T. 2012. Passage of American shad: paradigms andrealities. Mar. Coast. Fish. 4(1): 252–261. doi:10.1080/19425120.2012.675975.
Haro, A., Odeh, M., Castro-Santos, T., and Noreika, J. 1999. Effect of slope andheadpond on passage of American shad and blueback herring through sim-ple Denil and deepened Alaska steeppass fishways. N. Am. J. Fish. Manage.19(1): 51–58. doi:10.1577/1548-8675(1999)019<0051:EOSAHO>2.0.CO;2.
Hart, D.D., Johnson, T.E., Bushaw-Newton, K.L., Horwitz, R.J., Bednarek, A.T.,Charles, D.F., Kreeger, D.A., and Velinsky, D.J. 2002. Dam removal: challengesand opportunities for ecological research and river restoration. BioScience,52(8): 669–681. doi:10.1641/0006-3568(2002)052[0669:DRCAOF]2.0.CO;2.
Hasselman, D.J. 2010. Spatial distribution of neutral genetic variation in a wideranging anadromous clupeid, the American shad (Alosa sapidissima). Doctoraldissertation, Department of Biology, Dalhousie University, Halifax, N.S.
Hasselman, D.J., and Limburg, K.E. 2012. Alosine restoration in the 21st Century:challengingthestatusquo.Mar.CoastalFish.4(1):174–187.doi:10.1080/19425120.2012.675968.
Hasselman, D.J., Bradford, R.D., and Bentzen, P. 2010. Taking stock: definingpopulations of American shad (Alosa sapidissima) in Canada using neutralgenetic markers. Can. J. Fish. Aquat. Sci. 67(6): 1021–1039. doi:10.1139/F10-031.
Hendricks, M.L. (Editor). 2003. Culture and Transplant of Alosines in North Amer-ica. In Biodiversity, status, and conservation of the world’s shads. Edited byK.E. Limburg and J.R. Waldman. American Fisheries Society, Symposium 35,Bethesda, Md. pp. 303–312.
Hightower, J.E., Magowan, K.J., Brown, L.M., and Fox, D.A. 2013. Reliability of fishsize estimates obtained from multibeam imaging sonar. J. Fish Wildl. Man-age. 4(1): 86–96. doi:10.3996/102011-JFWM-061.
Holmes, J.A., Cronkite, G., and Enzenhofer, H.J. 2005. Salmon enumeration inthe Fraser River with the dual-frequency identification sonar (DIDSON)acoustic imaging system. J. Acoustical Soc. Am. 117: 2367–2368. doi:10.1121/1.4785598.
Horne, J.K. 2000. Acoustic approaches to remote species identification: a review.Fish. Oceanogr. 9(4): 356–371. doi:10.1046/j.1365-2419.2000.00143.x.
Kéry, M. 2010. Introduction to WinBUGS for Ecologists: A Byesian approach toregression, ANOVA, mixed models and related analyses. Academic Press,Burlington, Mass.
Kibler, K.M., Tullos, D.D., and Kondolf, G.M. 2011. Learning from dam removalmonitoring: challenges to selecting experimental design and establishingsignificance of outcomes River Res. Appl. 27(8): 967–975. doi:10.1002/rra.1415.
Kimball, M.E., Rozas, L.P., Boswell, K.M., and Cowan, J.H. 2010. Evaluating theeffect of slot size and environmental variables on the passage of estuarine
Grote et al. 557
Published by NRC Research Press
Can
. J. F
ish.
Aqu
at. S
ci. D
ownl
oade
d fr
om w
ww
.nrc
rese
arch
pres
s.co
m b
y U
nive
rsity
of
Mai
ne o
n 04
/09/
14Fo
r pe
rson
al u
se o
nly.
nekton through a water control structure. J. Exp. Mar. Biol. Ecol. 395(1–2):181–190. doi:10.1016/j.jembe.2010.09.003.
Kiraly, I.A., Coghlan, S.M., Jr., Zydlewski, J.D., and Hayes, D.B. 2012. Quantifyingthe structure of fish assemblages in the Penobscot River and subsequentchanges due to dam removal. M.Sc. thesis, Department of Wildlife Ecology,The University of Maine, Orono, Maine.
Lachapelle, K., Zydlewski, G.B., Kinnison, M.T., and Bailey, M.M. 2013. Winteringshortnose sturgeon (Acipenser brevirostrum) and their habitat in the PenobscotRiver, Maine. M.Sc. thesis, Department of Ecology and Environmental Sci-ence, The University of Maine, Orono, Maine.
Leggett, W.C., and Whitney, R.R. 1972. Water temperature and the migrations ofAmerican shad. Fish. Bull. 70: 659–670.
Leggett, W.C., Savoy, T.F., and Tomichek, C.A. 2004. The impact of enhancementinitiatives on the structure and dynamics of the Connecticut River popula-tion of American shad. Am. Fish. Soc. Monogr. 9: 391–405.
Limburg, K.E., Hattala, K.A., and Kahnle, A. 2003. American shad in its nativerange. In Biodiversity, status, and conservation of the world’s shads. Edited byK.E. Limburg and J.R. Waldman. American Fisheries Society, Symposium 35,Bethesda, Md. pp. 125–140.
Lunn, D., Spiegelhalter, D., Thomas, A., and Best, N. 2009. The BUGS project:evolution, critique, and future directions. Stat. Med. 28(25): 3049–3067. doi:10.1002/sim.3680.
Maxwell, S.L., and Gove, N.E. 2007. Assessing a dual-frequency identificationsonars’ fish-counting accuracy, precision, and turbid river range capability.J. Acoust. Soc. Am. 122(6): 3364–3377. doi:10.1121/1.2799500.
McCarthy, M.A. 2007. Bayesian methods for ecology. Cambridge UniversityPress.
MEDMR. 2009. Operational plan for the restoration of anadromous fishes to thePenobscot River. Maine Department of Marine Resources, Augusta, Maine.
Moursund, R.A., Carlson, T.J., and Peters, R.D. 2003. A fisheries application of adual-frequency identification sonar acoustic camera. ICES J. Mar. Sci. 60(3):678–683.
Mueller, A.M., Burwen, D.L., Boswell, K.M., and Mulligan, T. 2010. Tail-beat pat-terns in dual-frequency identification sonar echograms and their potentialuse for species identification and bioenergetics studies. Trans. Am. Fish. Soc.139(3): 900–910. doi:10.1577/T09-089.1.
Palmer, M.A., Bernhardt, E.S., Allan, J.D., Lake, P.S., Alexander, G., Brooks, S.,Carr, J., Clayton, S., Dahm, C.N., Follstad Shah, J., Galat, D.L., Loss, S.G.,Goodwin, P., Hart, D.D., Hassett, B., Jenkinson, R., Kondolf, G.M., Lave, R.,Meyer, J.L., O’Donnell, T.K., Pagano, L., and Sudduth, E. 2005. FORUM: Stan-dards for ecologically successful river restoration. J. Appl. Ecol. 2(2): 208–217.
Pipal, K.A., Notch, J.J., Hayes, S.A., and Adams, P.B. 2012. Estimating escapement
for a low-abundance steelhead population using Dual-Frequency Identifica-tion Sonar (DIDSON). N. Am. J. Fish. Manage. 32(5): 880–893. doi:10.1080/02755947.2012.697096.
Pohl, M.M. 2002. Bringing down our dams: trends in American dam removalrationales. J. Am. Water Resour. Assoc. 38(6): 1511–1519. doi:10.1111/j.1752-1688.2002.tb04361.x.
Richkus, W.A. 1974. Factors influencing the seasonal and daily patterns of ale-wife (Alosa pseudoharengus) migration in a Rhode Island river. J. Fish. Res.Board Can. 31(9): 1485–1497. doi:10.1139/f74-178.
Ross, R.M., Backman, T.W., and Bennett, R.M. 1993. Evaluation of habitat suit-ability index models for riverine life stages of American shad, with proposedmodels for premigratory juveniles. US Fish and Wildlife Service BiologicalReport 14.
Saila, S.B., Polgar, T.T., Sheehy, D.J., and Flowers, J.M. 1972. Correlations betweenalewife activity and environmental variables at a fishway. Trans. Am. Fish.Soc. 101(4): 583–594. doi:10.1577/1548-8659(1972)101<583:CBAAAE>2.0.CO;2.
Saunders, R., Hachey, M.A., and Fay, C.W. 2006. Maine’s diadromous fish com-munity. Fisheries, 31(11): 537–547. doi:10.1577/1548-8446(2006)31[537:MDFC]2.0.CO;2.
Sprankle, K. 2005. Interdam movements and passage attraction of Americanshad in the lower Merrimack River main stem. N. Am. J. Fish. Manage. 25:1456–1466. doi:10.1577/M04-049.1.
Stanley, E.H., and Doyle, M.W. 2003. Trading off: the ecological effects of damremoval. Front. Ecol. Environ. 1(1): 15–22. doi:10.1890/1540-9295(2003)001[0015:TOTEEO]2.0.CO;2.
Tiffan, K.F., Rondorf, D.W., and Skalicky, J.J. 2005. Diel spawning behavior ofchum salmon in the Columbia River. Trans. Am. Fish. Soc. 134(4): 892–900.doi:10.1577/T04-150.1.
Trinko Lake, T.R., Ravana, K.R., and Saunders, R. 2012. Evaluating changes indiadromous species distributions and habitat accessibility following the Pe-nobscot River Restoration Project. Mar. Coastal Fish. 4(1): 284–293. doi:10.1080/19425120.2012.675971.
Walburg, C.H., and Nichols, P.R. 1967. Biology and management of the Americanshad and status of the fisheries, Atlantic coast of the United States, 1960.US Fish and Wildlife Service Special Scientific Report–Fisheries 550.
Weaver, L.A., Fisher, M.T., Bosher, B.T., Claud, M.L., and Koth, L.J. (Editors). 2003.Bosher’s Dam vertical slot fishway: a useful tool to evaluate American shadrecovery efforts in the upper James River. American Fisheries Society, Sym-posium 35, Bethesda, Md.
558 Can. J. Fish. Aquat. Sci. Vol. 71, 2014
Published by NRC Research Press
Can
. J. F
ish.
Aqu
at. S
ci. D
ownl
oade
d fr
om w
ww
.nrc
rese
arch
pres
s.co
m b
y U
nive
rsity
of
Mai
ne o
n 04
/09/
14Fo
r pe
rson
al u
se o
nly.