Embed Size (px)
Citation preview
This is a repository copy of Assessment of blending performance of pharmaceutical powder mixtures in a continuous mixer using Discrete Element Method (DEM).
White Rose Research Online URL for this paper:http://eprints.whiterose.ac.uk/157493/
Version: Accepted Version
Article:
Alizadeh Behjani, M, Motlagh, YG, Bayly, AE orcid.org/0000-0001-6354-9015 et al. (1 more author) (2020) Assessment of blending performance of pharmaceutical powder mixtures in a continuous mixer using Discrete Element Method (DEM). Powder Technology, 366. pp. 73-81. ISSN 0032-5910
https://doi.org/10.1016/j.powtec.2019.10.102
© 2020 Elsevier B.V. All rights reserved. This manuscript version is made available under the CC-BY-NC-ND 4.0 license http://creativecommons.org/licenses/by-nc-nd/4.0/.
[email protected]://eprints.whiterose.ac.uk/
Reuse
This article is distributed under the terms of the Creative Commons Attribution-NonCommercial-NoDerivs (CC BY-NC-ND) licence. This licence only allows you to download this work and share it with others as long as you credit the authors, but you can’t change the article in any way or use it commercially. More information and the full terms of the licence here: https://creativecommons.org/licenses/
Takedown
If you consider content in White Rose Research Online to be in breach of UK law, please notify us by emailing [email protected] including the URL of the record and the reason for the withdrawal request.
Journal Pre-proof
Assessment of blending performance of pharmaceutical powdermixtures in a continuous mixer using Discrete Element Method(DEM)
Mohammadreza Alizadeh Behjani, Yousef Ghaffari Motlagh,Andrew Bayly, Ali Hassanpour
PII: S0032-5910(19)30931-3
DOI: https://doi.org/10.1016/j.powtec.2019.10.102
Reference: PTEC 14869
To appear in: Powder Technology
Received date: 4 June 2019
Revised date: 25 October 2019
Accepted date: 26 October 2019
Please cite this article as: M.A. Behjani, Y.G. Motlagh, A. Bayly, et al., Assessment of
blending performance of pharmaceutical powder mixtures in a continuous mixer using
Discrete Element Method (DEM), Powder Technology(2019), https://doi.org/10.1016/
j.powtec.2019.10.102
This is a PDF file of an article that has undergone enhancements after acceptance, such
as the addition of a cover page and metadata, and formatting for readability, but it is
not yet the definitive version of record. This version will undergo additional copyediting,
typesetting and review before it is published in its final form, but we are providing this
version to give early visibility of the article. Please note that, during the production
process, errors may be discovered which could affect the content, and all legal disclaimers
that apply to the journal pertain.
© 2019 Published by Elsevier.
Assessment of blending performance of pharmaceutical powder
mixtures in a continuous mixer using Discrete Element Method
(DEM)
Mohammadreza Alizadeh Behjani, Yousef Ghaffari Motlagh, Andrew Bayly, Ali
Hassanpour*
School of Chemical and Process Engineering, University of Leeds, Leeds, UK. 茅Corresponding author:
Tel: +44(0)113 343 2405
Abstract
This study proposes a new sample-independent mixing index, termed the Coefficient of
Blending Performance (CBP), for monitoring the formation of undesired API (Active
Pharmaceutical Ingredient) agglomerates in continuous mixing processes. The sensitivity of the
proposed index is tested on a DEM-simulated twin-screw blending of pharmaceutical powders
with a novel mixing design. Model excipient and API are used in simulations with their physical
and mechanical properties being within the typical range of properties of generic
pharmaceutical powders. Results suggest that the CBP is an effective index for monitoring the
formation of API agglomerates in the mixer. Using this index, DEM results suggest a high
possibility of formation of API agglomerates during the first stage of twin screw mixing. The
results show that adding a kneading zone to the twin screw mixer enhances the blending quality
by breaking the API agglomerates, making the mixture ready for the next operating unit.
Jour
nal P
re-p
roof
Journal Pre-proof
2
Key words: Twin screw mixer; Discrete Element Method; Active Pharmaceutical Ingredient;
mixing index; agglomeration; surface energy
1 Introduction
Securing a high-quality granular blending/mixing is a vital step for many industries, and
designing suitable and efficient mixers is central for delivering a homogeneous mixture. Mixer
design depends on the nature of an industry, type of material, desired production rate, and the
maximum acceptable variance in the product composition. This includes the mixer geometrical
aspects, such as the blades/impellers shape and the mixer size as well as the operating
mechanisms, namely the type of mixing (batch or continuous) and the power input per unit
mass [1-7]. There are various types and models of mixers available which can be classified into
two main categories of batch and continuous, each of which has its own advantages and
disadvantages [8]. Although in recent decades the process of designing mixers has become
more scientific, they still fall short in meeting the needs of industries, and compared to the effort
put into mixing the outcome is not as satisfying [9, 10]. The pharmaceutical industry is one of
those industries which benefit the most from enhancement in the quality of mixers.
In pharmaceutical processing, Active Pharmaceutical Ingredient (API) is usually mixed with
excipient for the formulation of the final products. API particles are very fine (隼 の航兼) and as a
result, their attractive electrostatic and van der Waals forces are very large compared to their
inertial forces (high granular Bond number [11]), contributing to their high cohesivity and poor
flowability [12, 13]. The API particles are commonly mixed with a large quantity of excipient
materials to increase their flowability and dispersion efficiency; nevertheless, during the
blending process, the cohesive fine particles stick to each other and form agglomerates. These
agglomerates are not generally desirable, because they change the homogeneity and size
distribution of the mixture. To enhance the efficiency of blending, understanding the underlying
mechanisms and the tendency of formation of API-API agglomerates at each stage of the
blending process is highly crucial.
The conventional experimental methods for assessing the efficiency of blending in a mixer are
mainly based on the variance of particles concentration in the mixture [14-16]. To find a
Jour
nal P
re-p
roof
Journal Pre-proof
3
component concentration, sampling is needed. Evidently, differing the sample size and
sampling methodology affects the value of concentration variance. Size of a sample is
commonly defined based on the scale of scrutiny, which depends on the application of the
powder mixture. In spite of the prevalent usage of sample-dependent methods, some features
of mixing/segregation process, e.g. the agglomeration of API particles, cannot be captured by
these methods. It is utterly difficult and expensive to experimentally assess the spatial
homogeneity of a mixture in a non-destructive way; however, using modelling techniques based
on Discrete Element Method (DEM) it is possible to monitor particle contacts and
formation/breakage of agglomerates, from which the aforementioned assessments can be
easily conducted. Chandratilleke et al. [17] proposed a sample-independent index for assessing
quality of DEM simulated powder mixtures. Although their method works well for monosized
particulate systems, it is not applicable for evaluating binary systems or mixtures in which
particles have size distribution. Even though tracking particle collisions and contacts is feasible
in DEM, there is still a lack of a suitable criterion/index for monitoring the formation of
agglomerates during mixing.
The emergence and development of the DEM technique has paved the road towards designing
more efficient and practical mixers. So far, the blending process in different types of
mixers/blenders, namely the simple-rotating drums [18, 19], tumbling blenders [20-22], bin
blender [23], v-blenders [24-27], twin screw mixer [28], tote blenders [29, 30], paddle mixers
[31], double-cone blender [32], slant cone mixers [33, 34], agitated tubular mixer [35], bladed
mixers [5, 7, 17, 36, 37], and ribbon mixer [38], has been simulated using DEM. Continuous
mixing is receiving more and more attention by pharmaceutical industries due to its advantages
over the batch mixing. Among the continuous mixers, twin screw mixers have shown great
potential in pharmaceutical manufacturing processes owing to their flexibility in design, low
throughput, and relatively short residence time. Powder mixing with twin screw is a variant of
high-shear mixing where extruders are installed to blend the powders in a continuous manner
[39]. In spite of their ever-rising popularity, investigations on the agglomeration of low-level
content APIs during the continuous mixing are still lacking. In this regard, defining a versatile
criterion to quantify the rate of formation of these undesired agglomerates is necessary.
Jour
nal P
re-p
roof
Journal Pre-proof
4
Apart from the design and quality of a mixer, the particles physical and mechanical properties
also play a significant role in the quality of the final mixture. The particles size [7], size
distribution [40, 41], shape [42, 43], density [7], and surface energy [44] are all amongst the
most influential properties to be mentioned [7]. The significance of each property is also a
function of other properties; for example, when particles are very fine the adhesive forces
related to the surface energy become dominate, which eventually lead to their agglomeration
and/or segregation in the mixture.
In this study the process of blending of pharmaceutical powders in a continuous twin screw
mixer is studied using DEM technique. To monitor and analyse the formation/breakage of the
API agglomerates, a sample-independent mixing index is proposed based on the number of
contacts of similar and dissimilar particles. The sensitivity of the blending process to the
operating conditions, such as mixer design and impeller rotational speed, as well as material
properties, i.e. particles surface adhesion, is investigated. The proposed index is compared to
the commonly used relative standard deviation (RSD) method for selected cases of the
simulations.
2 Computational methodology
DEM is a method for modelling the dynamic behaviour of assemblies of individual elements.
This method, initially developed and used for geotechnical problems by Cundall and Strack [45],
is now used extensively in various fields of engineering, particularly for simulation of powder
handling and processing. In DEM, particle movements are predicted by using the Newton’s
second law of motion in translational and rotational forms and the particles interactions are
defined using appropriate contact models [46]. In this study, EDEM 2.7.1 software, provided by
DEM Solutions, Edinburgh, UK, is utilised to simulate the blending process.
2.1 Contact models
Particles collisional forces are generally divided into normal and tangential components, where
the normal term is calculated based on the Hertz model [47] and the tangential term is obtained
using the Mindlin theory [48]. More details for these theories are available elsewhere [46, 49].
As mentioned before, the pharmaceutical particles are generally cohesive and very fine;
Jour
nal P
re-p
roof
Journal Pre-proof
5
therefore, their inter-particle attractive forces have to be taken into account. To consider the
effect of adhesion on particles interactions, the JKR (Johnson-Kendall-Roberts) [50] model is
used. This model is an elastic non-linear model and is generally suitable for soft materials, in
comparison with the DMT model [51], which is mostly utilised for hard materials.
One of the main issues with using adhesive contact models is how to translate the level of
adhesivity of particles to a meaningful parameter in DEM simulations, e.g. which value should
be selected for the particles interfacial energy. In addition to the surface energy, the adhesive
forces present between two particles depend on their material properties, size, shape, and
surface roughness as well. In DEM simulations, using particles with larger size, simplified
shapes, and lower Young’s modulus is inevitable, owing to the high computational demand of
the DEM. Thus, the interfacial energy used in simulations should be a scaled version of its real
value by which similar bulk behaviour to that of the experimental one is achievable. For this
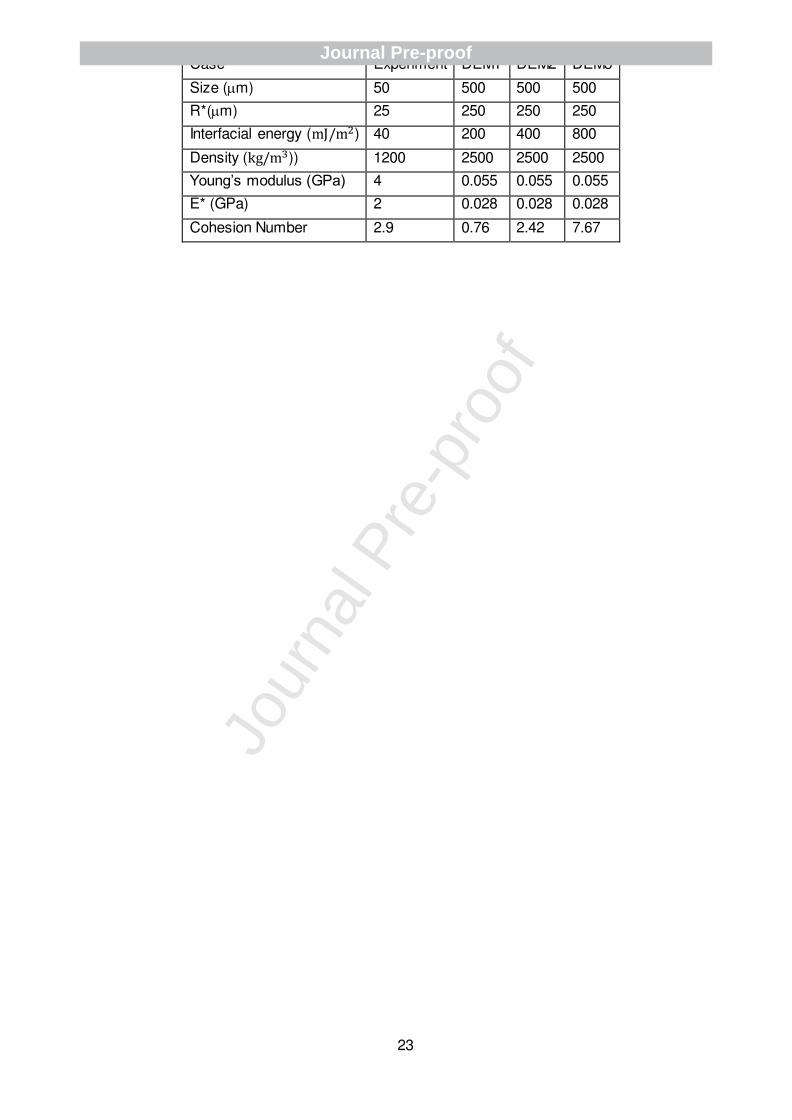
purpose, Behjani et al. [52] recently proposed a dimensionless Cohesion number for inferring
the particles interfacial energy with respect to their scaled size and stiffness. This number is
defined based upon the work of cohesion required for detaching a particle from a surface over
its gravitational potential energy, as expressed in Equation (1),
噺 なび 峭 ち泰 茅態 茅腿嶌怠 戴斑 (1)
where , び, and ち are gravitational acceleration, envelope density, and interfacial energy of the
particles respectively. 迎茅 and 継茅 are the reduced radius and Young’s modulus of elasticity of the
spheres, respectively:
迎茅 噺 磐 な迎怠 髪 な迎態卑貸怠 (2)
継茅 噺 峭な伐 荒怠態継怠 髪な伐 荒態態継態 嶌貸怠 (3)
where 迎怠 and 迎態 are the radii of the spheres, 継怠 and 継態 are their Young’s moduli, and 荒怠 and 荒態 are their Poisson’s ratios. This method of scaling has been used in other researches
successfully [53-55].
Jour
nal P
re-p
roof
Journal Pre-proof
6
2.2 Geometry and materials
Two model materials, i.e. an API and excipient, are considered in the formulation of the target
pharmaceutical powder mixture. The material properties of these model particles are extracted
from the literature in a way to resemble two common pharmaceutical ingredients, i.e.
Paracetamol as the API and Lactose as the excipient. The average values found in the
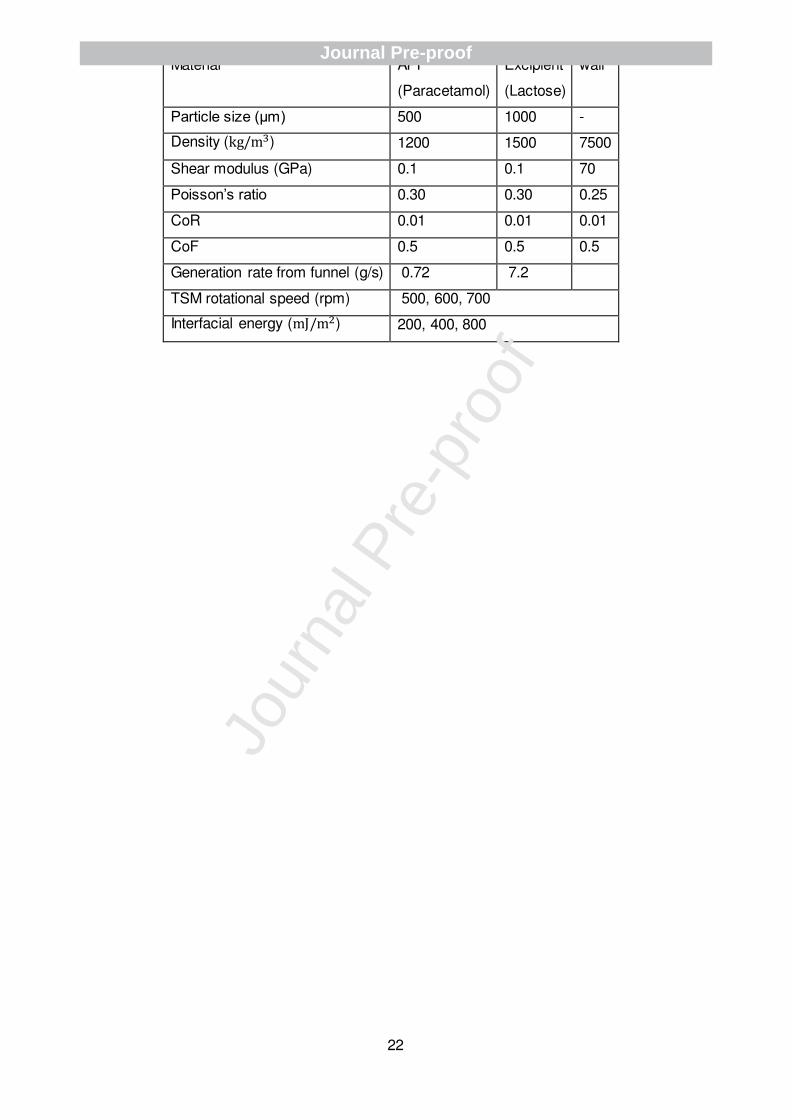
literature are used in calibration of the DEM input parameters, as given in Table 1.
The geometry used in the simulations belongs to a twin screw mixer displayed in Fig. 1. It
consists of an initial long mixing zone and a kneading zone, followed by a short secondary
mixing zone. This geometry is built using the open source mesh generator software, Gmsh, and
the .stl mesh file is exported to the EDEM software. In the EDEM software, the particles are
generated and discharged into the funnel located on the left-hand side of the mixer and then
introduced into the mixer according to the feed rate mentioned in Table 2. Afterwards, the
rotating screws mix the particles and push them gradually to the exit.
2.3 Simulation setup
The particles input parameters used in the simulations are given in Table 2. To reduce the
computation time, lower Young’s modulus values and larger particle diameters are used
compared to their real experimental values. To find a suitable value for the interfacial energy of
the scaled particles the Cohesion number is used as described in section 2.1. For scaling the
surface energy, the value of the Cohesion number using the real particle properties (Table 1)
should be equated with that of the simulation as expressed below:
系剣月勅掴椎 噺 系剣月鎚沈陳 噺 なび鎚沈陳 峭 ち泰鎚沈陳 茅態鎚沈陳 茅腿鎚沈陳嶌怠 戴斑 噺 なび勅掴椎 峭 ち泰勅掴椎 茅態勅掴椎 茅腿勅掴椎嶌怠 戴斑 (4)
where indices exp and sim denote experimental and simulation, respectively. The Cohesion
number is around 2.9 for realistic particles properties as given in Table 3. Using a similar value
for the Cohesion number of the scaled particles, i.e. simulated particles, with their new Young’s
modulus and particle size, the interfacial energy of the API (e.g. Paracetamol-Paracetamol) is
approximately 400 貸態 in DEM modelling.
Jour
nal P
re-p
roof
Journal Pre-proof
7
In total, three values are used for the interfacial energy to study the effect of particle adhesivity
on mixing quality. It should be mentioned that the excipient interfacial energy is maintained low
(40 貸態) and constant for all cases in this study in order to only study the effect of API
properties. Also, the API-excipient interfacial energy is taken as the average of the API and
excipient surface energies.
The speed at which the process of mixing is conducted can cause a significant difference in the
final quality of the mixture. For this to be studied, simulations are carried out using 500, 600,
and 700 rpm rotational speeds of the mixer as presented in Table 2. The feed rates of the API
and excipient are kept constant at 7.2 and 0.72 貸怠, respectively, for all the rotational speeds
(9% API and 91% excipient by mass). The feed consists of approximately 9% API and 91%
excipient, which is in a range of the feed ratio that is normally used by pharmaceutical
industries. Variation in feed ratio may have an impact on blending performance, however, it is
not studied in this work.
3 Mixing quantification
There are various ways in the literature to quantify the quality of a mixture most of which are
based on the variance of the components mass/volume concentration [14-16]. The relative
standard deviation (RSD), which is the ratio of the standard deviation of a variable over its
mean value, is a common index utilised by researchers and engineers [42]. In spite of being
widely used, this index is highly dependent on the sampling method and sample size, both of
which are sources of uncertainty.
In this study, the whole mixer is divided into number of bins as presented in Fig. 2. As shown in
the figure, the cross section of the mixer geometry is divided into bins based on the radial
symmetry of the mixer, so that all the bins have equal chance for accommodation particles. This
is performed to avoid variation in sample size, which is a source for uncertainty in the final
results. The mass concentrations of the API and excipient particles, 系沈, are calculated in each
bin using Equation (5).
Jour
nal P
re-p
roof
Journal Pre-proof
8
系沈 噺 兼沈デ兼沈 (5)
where 兼沈 is the mass of component i in the bin. Using the concentration values obtained for all
the bins, the RSD of the API and excipient are determined using Equation (6),
迎鯨経 噺 鯨経系違 噺 謬デ 岫系沈 伐系違岻態朝怠軽 伐なな軽デ 系沈朝怠 (6)
where SD stands for the standard deviation of the concentrations, 系違 is their mean value, and N
is the number of bins.
Due to the complexity of the geometry of the mixer, only two bin sizes are defined for
calculating the RSD values. Discretising the mixture to smaller samples will lead to the
formation of semi-empty bins and a non-homogeneous sampling. In other words, some bins
cannot be completely filled by particles because of the intervening and dynamic geometry or
due to the location of the bin. Here, as presented in Fig. 2, the cross section of the mixer is
divided into equal sections based on the radial symmetry of the mixer to reduce the sampling
issue. This issue can also be addressed by analysing the variation of composition of the
discharging mixture at the outlet of the mixer throughout the blending time. Nevertheless, this
method is still sample-dependent, i.e. the RSD alters with changing the scale of scrutiny. It is a
fact that relying on sample-dependent indices for analysing a mixture quality can sometimes be
misleading. As illustrated in Fig. 3, the composition ratios of the API and excipient in the bins
are similar for the three cases presented, based on which the RSD for all these cases would be
similarly low (ど┻どひ 判 判 ど┻なな). In the first two cases, shown in Fig. 3 (A) and (B), changing
the size or arrangement of the bins may vary the RSD value significantly. For example, in the
cases A and B if each bin is divided with a horizontal line into two similar bins (i.e. reducing bin
size to half of its original size) the RSD jumps from 0.11 up to 0.33., while, this value increases
only to 0.14 for the case C. To solve the sampling issue and also be able to analyse the
formation and depletion of API agglomerates during the blending, two new indices are defined
based on the number of contacts of similar and dissimilar particles, i.e. API-API and API-
excipient. These indices are shown in Equations (7) and (8).
Jour
nal P
re-p
roof
Journal Pre-proof
9
系迎凋勅 噺 軽凋勅軽勅 (7)
系迎凋凋 噺 軽凋凋軽凋 (8)
系迎凋勅 shows the ratio of the API-excipient contact number over the total number of excipient
particles, and 系迎凋凋 is the ratio of API-API contacts over the total number of API particles. These
values are calculated for the cases with different operating conditions and the results are
compared. As a final evaluating step, the ratio of the 系迎凋勅 and 系迎凋凋 is defined as the coefficient
of blending performance (CBP), as expressed in Equation (9), by which the efficient blending
scenarios are more easily distinguished.
系稽鶏 噺 系迎凋勅系迎凋凋 噺 軽凋勅軽凋凋軽勅軽凋 (9)
It is noteworthy that CBP can be used for assessing mixtures which have monosized particles
as well as particles of different sizes and even with a size distribution.
4 Results and discussion
4.1 Effect of twin screw mixer geometry
The geometry of a mixer is undoubtedly one of the most important factors in its performance.
Conventional twin screw mixers contain a section to mix particles with each other and deliver a
well-mixed system at the end of the process. However, there is a high chance of agglomeration
of fine particles while interacting with each other. To overcome this issue, a new geometry for
twin screw mixing is proposed, which consists of a kneading zone and a secondary mixing zone
as well. The effect of incorporating the kneading zone and secondary mixing zone into the base
model on the efficiency of mixing and formation and breakage of agglomerates is studied.
4.1.1 Steady state condition
Mass hold-up in the TSM is monitored versus time to evaluate the steady state conditions. As
presented in Fig. 4, the mass hold-up in the TSM increases constantly till t=27 s, after which
hold-up gradually plateaus, which shows that the process has reached a steady state. The
Jour
nal P
re-p
roof
Journal Pre-proof
10
overall hold-up (mass) values in both cases are very similar, suggesting similar volumetric fill
levels of the mixer in both cases. It should be noted that the excipient’s hold-up reaches the
steady state slightly earlier than that of the API. Furthermore, increasing the interface energy of
the API particles has caused a slight reduction in accumulation of APIs in the TSM, suggesting
that higher stickiness of constituents helps in maintaining the composition ratio of the mixture.
4.1.2 Blending assessment using RSD
To evaluate the effect of various sections of the twin screw mixer on blending quality, the RSD
of mass concentrations of the API and excipient particles is calculated. Two bin sizes are used,
as shown in Fig. 2, to consider the effect of sample size on the RSD. Large bins contain around
800 particles each, and small bins have less than 80 particles on average. As presented in Fig.
5, the RSD values for the API particles are much higher than those of the excipients. It is
observed that using fine bins in the sampling has increased the API and excipient RSD values
by two times. This is because reducing the size of the scale of scrutiny lowers the number of
particles in each sample which is directly associated with the randomness of the particles
composition ratio. In other words, higher variability in particles composition ratio is expected
when the sample size is reduced. Nevertheless, the RSD values are found to be insensitive to
the mixer geometry, i.e. no change in the RSD values is observed when particles move from
one section to another, either for the coarse or the fine bins.
4.1.3 Blending assessment using the contact ratios (CR)
To evaluate the particles’ arrangements more closely, contact ratios of the particles are
calculated as well and presented in Fig. 6 and Fig. 7. Lower values for the 系迎凋凋 and higher
ones for the 系迎凋勅 are indications of a more uniformly mixed system. As it is clear in Fig. 6, for
all the cases simulated, kneading zone has the lowest 系迎凋凋 compared to the first and the
second mixing zones. Also, it is observed that the number of API-API contacts has increased
largely in the second mixing zone. This means that adding the secondary mixing zone to the
whole mixer has practically deteriorated the blending quality and hence is useless.
Jour
nal P
re-p
roof
Journal Pre-proof

11
A confirmation for the positive effect of the kneading zone can be observed in the results of the 系迎凋勅 in Fig. 7. This graph shows that for most of the simulations the maximum contact number
of the API and excipient particles occurs in the kneading zone. The higher API-API contact ratio
in the mixing zones are due to their high cohesivity which leads to their local accumulation and
agglomeration; this can be easily observed through the particles distribution in the mixer as
presented in Fig. 8. Local accumulation of the API particles in the first and second mixing zones
is evident, particularly close to the areas which experience high shear rates like the screw walls.
On the other hand, the kneading zone shows a more uniform particle distribution corroborating
the quantitative results.
4.2 Effect of the particle surface energy
The effect of the surface condition of particles on the final quality of the mixture is studied by
doing simulations with three various values of the surface energy. Looking at Fig. 6 and Fig. 7,
a general increasing trend for the contact ratios is observed at the mixing zones 1 and 2 when
the surface energy is increased. This is not the case for the kneading zone, where the trends
differ from one rotational speed to another. For the 系迎凋勅, there is an increasing trend at the 500
rpm while for the 600 and 700 rpm the lowest 系迎凋勅 occurs when the surface energy is 400 態エ .
It is also worth to mention that the role of the kneading zone in improving the quality of the
mixture is more observable when the surface energy is lower; i.e. the highest increase in the
values of the 系迎凋勅 are obtained at the lowest surface energy values.
4.3 Effect of the mixer rotation rate
The mixer rotation rate is an important operating parameter which affects the quality of mixing
as well as the speed of the process. For the surface energy values of 200, 400, and 800 【 態
the API-API and API-excipient contact ratios are calculated at various rotational speeds of the
mixer. As depicted in Fig. 9, a unique trend for the 系迎凋凋 and 系迎凋勅 cannot be observed. For the
first mixing zone, a general increasing trend for the API-API contacts is observed when the
Jour
nal P
re-p
roof
Journal Pre-proof
12
rotational speed is increased. The 系迎凋勅 of the same mixing zone shows a decreasing trend with
a minimum value at 600 rpm followed by a slight increase at 700 rpm. At the Kneading zone,
however, both 系迎凋凋 and 系迎凋勅 show similar decreasing-increasing trends with slight variations.
Here the optimum rotational rate cannot be easily found, nevertheless, based on the 系迎凋凋, 600
rpm rotational speed shows a better performance in terms of breaking the API-API
agglomerates.
4.3.1 Blending assessment using CBP index
Variance-based indices, like the RSD, are useful tools for assessing the spatial distribution of
mixture components. The extent of variability in the composition ratio of species is the base for
these indices and highly influenced by sampling methodology. Regardless of the
aforementioned drawback, such indices are fundamentally incapable of giving information about
particles arrangement in a sample. In this regard, an undesired phenomenon during the
blending process of pharmaceutical powders is the agglomeration of APIs, which is hard to
monitor experimentally. Monitoring this phenomenon, however, is feasible by DEM analysis,
albeit by using a suitable index. The coefficient of blending performance, CBP, is an index
which provides information on the contact number of similar and dissimilar species. Variation in
this index is an indication of formation or breakage of undesired agglomerates.
To have a better understanding of the performance of blending in each section of the twin
screw mixer, CBP is calculated at various particle surface energies and mixer rotational speeds,
as presented in Fig. 10. Clearly, the highest CBP values for the CBP are achieved by far at the
kneading zone, where the 半 ね at 200 and 400 態エ surface energies. These values drop
slightly when the surface energy is increased to 800 態エ . On the other hand, the lowest CBP
values observed belong to the second mixing zone, where the blending performance remains
nearly constant at CBP=1 for all the surface energy values and rotational speeds. The first
mixing zone, however, has a different behaviour, where the best performance of the mixing
zone 1 is achieved at 500 rpm rotational speed, and as the rotational speed increases the CBP
decreases. Also, the CBP values reduce slightly when the surface energy of the particles is
Jour
nal P
re-p
roof
Journal Pre-proof
13
increased. A clear advantage of using CBP in this study was its sample-independent nature,
making it a robust and reliable approach for assessing the mixture quality.
5 Conclusions
High-quality mixing of pharmaceutical powders has two aspects: 1) uniform distribution of all
ingredients and 2) minimal formation of undesired API agglomerates. There is still a lack of a
rigorous methodology for the assessment of the agglomeration of low-level content API within
continuous mixers. Along with the traditional variance-based RSD index, a sample-independent
index, CBP, is proposed for assessing the formation of undesired API agglomerates. To
examine the efficacy of this index, a case study is conducted about the effect of geometry
design on blending performance of a continuous twin screw mixer, using DEM simulations.
Also, the sensitivity of the blending process to the mixer rotation rate and particles
cohesivity/adhesivity is examined using the proposed index.
The results suggest that the coefficient of blending performance (CBP) has the capability to
capture the formation of agglomerates within the mixer; while this cannot be observed using the
RSD index. Based on the CBP results, the best blending performance is achieved in the
kneading zone; whereas, the poorest mixture quality (the highest number of agglomerates) is
observed in the second mixing zone. This indicates that by adding the kneading zone to the
design of a conventional TSM, the API agglomerates which are formed during the blending
process break down to their original form before being fed into the next operating unit. In
contrast, adding the second mixing zone to the operation reduces the mixture quality
significantly. At the first mixing zone, the best blending performance is obtained when the
rotational speed is the lowest (500 rpm), however, the dependence of the blending performance
on mixer rotational speed is not considerable at the kneading and second mixing zones. In
addition, variation in the CBP does not follow a unique trend when differing the adhesivity of the
components in various sections of the mixer.
Jour
nal P
re-p
roof
Journal Pre-proof
14
Acknowledgment
We gratefully acknowledge the support of the Advanced Manufacturing Supply Chain Initiative
through the funding of the ADDoPT project (Advanced Digital Design of Pharmaceutical
Therapeutics) [Grant No. 14060] which has enabled us to develop robust tools for prediction
and analysis of continuous blending of pharmaceutical powders”
6 References
[1] K. Terashita, T. Nishimura, S. Natsuyama, Optimization of operating conditions in a high-
shear mixer using DEM model: Determination of optimal fill level, Chem Pharm Bull, 50
(2002) 1550-1557.
[2] A. Santomaso, M. Olivi, P. Canu, Mechanisms of mixing of granular materials in drum mixers
under rolling regime, Chem Eng Sci, 59 (2004) 3269-3280.
[3] G.R. Chandratilleke, A.B. Yu, R.L. Stewart, J. Bridgwater, Effects of blade rake angle and
gap on particle mixing in a cylindrical mixer, Powder Technol, 193 (2009) 303-311.
[4] S.S. Manickam, R. Shah, J. Tomei, T.L. Bergman, B. Chaudhuri, Investigating mixing in a
multi-dimensional rotary mixer: Experiments and simulations, Powder Technol, 201 (2010)
83-92.
[5] B. Remy, B.J. Glasser, J.G. Khinast, The Effect of Mixer Properties and Fill Level on
Granular Flow in a Bladed Mixer, Aiche J, 56 (2010) 336-353.
[6] M.Q. Jiang, Y.Z. Zhao, G.S. Liu, J.Y. Zheng, Enhancing mixing of particles by baffles in a
rotating drum mixer, Particuology, 9 (2011) 270-278.
[7] H. Musha, G.R. Chandratilleke, S.L.I. Chan, J. Bridgwater, A.B. Yu, Effects of Size and
Density Differences on Mixing of Binary Mixtures of Particles, Aip Conf Proc, 1542 (2013)
739-742.
[8] S. Oka, A. Sahay, W. Meng, F. Muzzio, Diminished segregation in continuous powder
mixing, Powder Technol, 309 (2017) 79-88.
[9] J. Bridgwater, Mixing of particles and powders: Where next?, Particuology, 8 (2010) 563-567.
[10] J. Bridgwater, Mixing of powders and granular materials by mechanical means-A
perspective, Particuology, 10 (2012) 397-427.
[11] M. Capece, R. Ho, J. Strong, P. Gao, Prediction of powder flow performance using a multi-
component granular Bond number, Powder Technol, 286 (2015) 561-571.
[12] J. Yang, C.-Y. Wu, M. Adams, DEM analysis of particle adhesion during powder mixing for
dry powder inhaler formulation development, Granular Matter, 15 (2013) 417-426.
[13] M. Alizadeh Behjani, M. Pasha, H. Lu, C. Hare, A. Hassanpour, Chapter 3 Prevailing
Conditions of Flow in Particulate Systems, Powder Flow: Theory, Characterisation and
Application, The Royal Society of Chemistry2019, pp. 39-63.
Jour
nal P
re-p
roof
Journal Pre-proof
15
[14] S.-H. Chou, Y.-L. Song, S.-S. Hsiau, A Study of the Mixing Index in Solid Particles, KONA
Powder and Particle Journal, (2016) 2017018.
[15] P.M.C. Lacey, The mixing of solid particles, Chemical Engineering Research and Design,
75 (1997) S49-S55.
[16] L.T. Fan, R.H. Wang, On mixing indices, Powder Technol, 11 (1975) 27-32.
[17] G.R. Chandratilleke, A.B. Yu, J. Bridgwater, K. Shinohara, A particle-scale index in the
quantification of mixing of particles, Aiche J, 58 (2012) 1099-1118.
[18] G. Baumann, I.M. Jánosi, D.E. Wolf, Particle Trajectories and Segregation in a Two-
Dimensional Rotating Drum, EPL (Europhysics Letters), 27 (1994) 203.
[19] H. Ahmadian, A. Hassanpour, M. Ghadiri, Analysis of granule breakage in a rotary mixing
drum: Experimental study and distinct element analysis, Powder Technol, 210 (2011) 175-
180.
[20] M. Moakher, T. Shinbrot, F.J. Muzzio, Experimentally validated computations of flow, mixing
and segregation of non-cohesive grains in 3D tumbling blenders, Powder Technol, 109
(2000) 58-71.
[21] B. Chaudhuri, A. Mehrotra, F.J. Muzzio, M.S. Tomassone, Cohesive effects in powder
mixing in a tumbling blender, Powder Technol, 165 (2006) 105-114.
[22] T. Shinbrot, M. Zeggio, F.J. Muzzio, Computational approaches to granular segregation in
tumbling blenders, Powder Technol, 116 (2001) 224-231.
[23] M. Lemieux, F. Bertrand, J. Chaouki, P. Gosselin, Comparative study of the mixing of free-
flowing particles in a V-blender and a bin-blender, Chem Eng Sci, 62 (2007) 1783-1802.
[24] A. Alexander, F.J. Muzzio, T. Shinbrot, Segregation patterns in V-blenders, Chem Eng Sci,
58 (2003) 487-496.
[25] J. Doucet, F. Bertrand, J. Chaouki, Experimental characterization of the chaotic dynamics of
cohesionless particles: application to a V-blender, Granular Matter, 10 (2008) 133-138.
[26] M. Lemieux, G. Léonard, J. Doucet, L.A. Leclaire, F. Viens, J. Chaouki, F. Bertrand, Large-
scale numerical investigation of solids mixing in a V-blender using the discrete element
method, Powder Technol, 181 (2008) 205-216.
[27] D. Brone, A. Alexander, F.J. Muzzio, Quantitative characterization of mixing of dry powders
in V-blenders, Aiche J, 44 (1998) 271-278.
[28] F. Qi, T.J. Heindel, M.M. Wright, Numerical study of particle mixing in a lab-scale screw
mixer using the discrete element method, Powder Technol, 308 (2017) 334-345.
[29] P.E. Arratia, N.-h. Duong, F.J. Muzzio, P. Godbole, S. Reynolds, A study of the mixing and
segregation mechanisms in the Bohle Tote blender via DEM simulations, Powder Technol,
164 (2006) 50-57.
[30] O.S. Sudah, P.E. Arratia, A. Alexander, F.J. Muzzio, Simulation and experiments of mixing
and segregation in a tote blender, Aiche J, 51 (2005) 836-844.
Jour
nal P
re-p
roof
Journal Pre-proof
16
[31] A. Hassanpour, H.S. Tan, A. Bayly, P. Gopalkrishnan, B. Ng, M. Ghadiri, Analysis of particle
motion in a paddle mixer using Discrete Element Method (DEM), Powder Technol, 206
(2011) 189-194.
[32] A.W. Alexander, T. Shinbrot, F.J. Muzzio, Granular segregation in the double-cone blender:
Transitions and mechanisms, Physics of Fluids (1994-present), 13 (2001) 578-587.
[33] B. Alchikh-Sulaiman, F. Ein-Mozaffari, A. Lohi, Evaluation of poly-disperse solid particles
mixing in a slant cone mixer using discrete element method, Chem Eng Res Des, 96 (2015)
196-213.
[34] M. Alian, F. Ein-Mozaffari, S.R. Upreti, J.N. Wu, Using discrete element method to analyze
the mixing of the solid particles in a slant cone mixer, Chem Eng Res Des, 93 (2015) 318-
329.
[35] Y. He, A.E. Bayly, A. Hassanpour, F. Muller, K. Wu, D. Yang, A GPU-based coupled SPH-
DEM method for particle-fluid flow with free surfaces, Powder Technol, 338 (2018) 548-562.
[36] S. Radl, E. Kalvoda, B.J. Glasser, J.G. Khinast, Mixing characteristics of wet granular
matter in a bladed mixer, Powder Technol, 200 (2010) 171-189.
[37] B. Remy, J.G. Khinast, B.J. Glasser, Discrete Element Simulation of Free Flowing Grains in
a Four-Bladed Mixer, Aiche J, 55 (2009) 2035-2048.
[38] G. Basinskas, M. Sakai, Numerical study of the mixing efficiency of a ribbon mixer using the
discrete element method, Powder Technol, 287 (2016) 380-394.
[39] A. Chaudhury, D. Barrasso, D.A. Pohlman, J.D. Litster, R. Ramachandran, 5 - Mechanistic
modeling of high-shear and twin screw mixer granulation processes, in: P. Pandey, R.
Bharadwaj (Eds.) Predictive Modeling of Pharmaceutical Unit Operations, Woodhead
Publishing2017, pp. 99-135.
[40] J.F. Li, C. Wassgren, J.D. Litster, Multi-scale modeling of a spray coating process in a
paddle mixer/coater: the effect of particle size distribution on particle segregation and
coating uniformity, Chem Eng Sci, 95 (2013) 203-210.
[41] A. Shimosaka, Y. Shirakawa, J. Hidaka, Effects of Particle Shape and Size Distribution on
Size Segregation of Particles, J Chem Eng Jpn, 46 (2013) 187-195.
[42] M. Alizadeh, A. Hassanpour, M. Pasha, M. Ghadiri, A. Bayly, The effect of particle shape on
predicted segregation in binary powder mixtures, Powder Technol, 319 (2017) 313-322.
[43] M.D. Sinnott, P.W. Cleary, The effect of particle shape on mixing in a high shear mixer,
Computational Particle Mechanics, 3 (2016) 477-504.
[44] R. Brewster, G.S. Grest, A.J. Levine, Effects of cohesion on the surface angle and velocity
profiles of granular material in a rotating drum, Physical Review E, 79 (2009) 011305.
[45] P.A. Cundall, O.D. Strack, A discrete numerical model for granular assemblies,
Geotechnique, 29 (1979) 47-65.
[46] M.M. Martín, Introduction to software for chemical engineers, CRC Press2014.
[47] H. Hertz, Ueber die Berührung fester elastischer Körper (on the contact of elastic solids),
Journal für die reine und angewandte Mathematik (Crelle's Journal), 1882, pp. 156–171.
Jour
nal P
re-p
roof
Journal Pre-proof
17
[48] H. Deresiewicz, R.D. Mindlin, U. Columbia, E. Department of Civil, Elastic spheres in
contact under varying oblique forces, 1952.
[49] A. Di Renzo, F.P. Di Maio, Comparison of contact-force models for the simulation of
collisions in DEM-based granular flow codes, Chem Eng Sci, 59 (2004) 525-541.
[50] K.L. Johnson, K. Kendall, A.D. Roberts, Surface Energy and the Contact of Elastic Solids,
Proceedings of the Royal Society of London A: Mathematical, Physical and Engineering
Sciences, 324 (1971) 301-313.
[51] B.V. Derjaguin, V.M. Muller, Y.P. Toporov, Effect of contact deformations on the adhesion
of particles, Journal of Colloid and Interface Science, 53 (1975) 314-326.
[52] M.A. Behjani, N. Rahmanian, N. Fardina bt Abdul Ghani, A. Hassanpour, An investigation
on process of seeded granulation in a continuous drum granulator using DEM, Advanced
Powder Technology, 28 (2017) 2456-2464.
[53] M. Alizadeh Behjani, A. Hassanpour, M. Ghadiri, A. Bayly, Numerical Analysis of the Effect
of Particle Shape and Adhesion on the Segregation of Powder Mixtures, EPJ Web Conf.,
140 (2017) 06024.
[54] W. Nan, M. Pasha, T. Bonakdar, A. Lopez, U. Zafar, S. Nadimi, M. Ghadiri, Jamming during
particle spreading in additive manufacturing, Powder Technol, 338 (2018) 253-262.
[55] M. Alizadeh, M. Asachi, M. Ghadiri, A. Bayly, A. Hassanpour, A methodology for calibration
of DEM input parameters in simulation of segregation of powder mixtures, a special focus
on adhesion, Powder Technol, 339 (2018) 789-800.
[56] A.-S. Persson, H. Ahmed, S. Velaga, G. Alderborn, Powder Compression Properties of
Paracetamol, Paracetamol Hydrochloride, and Paracetamol Cocrystals and Coformers,
Journal of Pharmaceutical Sciences, 107 (2018) 1920-1927.
[57] U.V. Shah, Z. Wang, D. Olusanmi, A.S. Narang, M.A. Hussain, M.J. Tobyn, J.Y.Y. Heng,
Effect of milling temperatures on surface area, surface energy and cohesion of
pharmaceutical powders, International Journal of Pharmaceutics, 495 (2015) 234-240.
[58] S. Pazesh, A.-S. Persson, J. Berggren, G. Alderborn, Effect of milling on the plastic and the
elastic stiffness of lactose particles, European Journal of Pharmaceutical Sciences, 114
(2018) 138-145.
[59] T. Beyer, G.M. Day, S.L. Price, The Prediction, Morphology, and Mechanical Properties of
the Polymorphs of Paracetamol, Journal of the American Chemical Society, 123 (2001)
5086-5094.
Table captions
Table 1. Physical and mechanical properties of the common pharmaceutical ingredients [56-59].
Table 2. Physical properties of the API and excipient particles used in the DEM simulations.
Table 3. The table used to scale the surface energy of the API particles in the DEM simulations.
Jour
nal P
re-p
roof
Journal Pre-proof
18
Figure captions
Fig. 1. The top, side, and front views of the mixer geometry used is the simulations.
Fig. 2. Sampling methods for obtaining the RSD values of the species mass concentration. Red particles
are API and the rest are excipient.
Fig. 3. Schematic of the effect of sampling on local segregation and agglomeration of API particles (red
colour), Blue particles resemble the excipient.
Fig. 4. Variation of mass hold-up in the TSM through mixing time, for excipient and API particles.
Fig. 5. RSD values of the mass concentration of API and excipient particles at 降 噺 のどど 堅喧兼 ち凋凋 噺ねどど 兼蛍兼貸態. The RSD values are calculated using fine and coarse bins.
Fig. 6. Comparison between the contact ratios of the API particles with each other at different zones of the
mixer.
Fig. 7. Comparison between the contact ratios of the API and excipient particles at different zones of the
mixer.
Fig. 8. Particles distribution in various sections of the twin screw mixer (降 噺 のどど 堅喧兼 ち凋凋 噺ねどど 兼蛍兼貸態).
Fig. 9. Variation of the API-API and API-excipient contact ratios versus the mixer rotational speed at
different mixer zones.
Fig. 10. A regime map for the blending performance of the twin screw mixer at various surface energies
and rotational speeds.
Jour
nal P
re-p
roof
Journal Pre-proof
19
Declaration of interests
The authors declare that they have no known competing financial interests or personal ܈
relationships that could have appeared to influence the work reported in this paper.
տThe authors declare the following financial interests/personal relationships which may be
considered as potential competing interests:
Jour
nal P
re-p
roof
Journal Pre-proof
20
Jour
nal P
re-p
roof
Journal Pre-proof
21
Material API (e.g. Paracetamol)
Excipient (e.g. Lactose)
Particle diameter (づm) 20 40
Density ( 【 戴) b1200 b1500
Young’s modulus (GPa) 9-12 11-15
Poisson’s ratio bど┻ぬぬ bど┻ぬど
Surface energy ( 【 態) 40-50 40
Jour
nal P
re-p
roof
Journal Pre-proof
22
Material API
(Paracetamol)
Excipient
(Lactose)
wall
Particle size (たm) 500 1000 -
Density ( 【 戴) 1200 1500 7500
Shear modulus (GPa) 0.1 0.1 70
Poisson’s ratio 0.30 0.30 0.25
CoR 0.01 0.01 0.01
CoF 0.5 0.5 0.5
Generation rate from funnel (g/s) 0.72 7.2
TSM rotational speed (rpm) 500, 600, 700
Interfacial energy ( 【 態) 200, 400, 800
Jour
nal P
re-p
roof
Journal Pre-proof
23
Case Experiment DEM1 DEM2 DEM3
Size (m) 50 500 500 500
R*(m) 25 250 250 250
Interfacial energy ( 【 態) 40 200 400 800
Density ( 【 戴)) 1200 2500 2500 2500
Young’s modulus (GPa) 4 0.055 0.055 0.055
E* (GPa) 2 0.028 0.028 0.028
Cohesion Number 2.9 0.76 2.42 7.67
Jour
nal P
re-p
roof
Journal Pre-proof
24
Continuous blending of pharmaceutical powders in a twin screw mixer is simulated by
the Discrete Element Method.
A kneading and secondary mixing zone is incorporated into the original design.
A new sample-independent index is proposed to assess unwanted API agglomeration.
Cohesive Active Pharmaceutical Ingredients (API) form unwanted agglomerates in the
mixing zones.
Adding a kneading zone significantly improves the performance of blending.
Jour
nal P
re-p
roof
Journal Pre-proof