Embed Size (px)
Citation preview
Assessment of Established and New Separation Methods for Water-in-Oil Emulsions
Sammenligning av etablerte og nye separasjonsmetoder for
vann-i-olje-emulsjoner
Bachelor thesis
Project number: IMA-B-05-2020
Submission date: 21st May 2020
Confidential/Open: Open
Authors: Eirik Giil Woxholt & Jørgen Sivertsen Stavrum
Internal Supervisor: Kristian Etienne Einarsrud
Employer: SINTEF Industry
Contact Person: Balram Panjwani

i
Preface This thesis was written as a part of a bachelor’s degree in chemical engineering at the Department of
Materials Science and Engineering at the Norwegian University of Science and Technology, NTNU. It
is based on the work performed at SINTEF Industry from January to May 2020.
We would like to express our gratitude to;
Balram Panjwani, for all the guidance received during the entirety of the project.
Bendik Sægrov, for the excellent help provided in all the experimental aspects of this project.
Petter Stavrum, for drawing most of the illustrations used in this thesis.
Kristian Etienne Einarsrud, for all the help with writing, all the hours of meetings and discussion and
for going above and beyond during the time of national crisis.
Trondheim, May 21st, 2020
ii
Abstract Crude oil is a chemical mixture of hydrocarbons, heteroatoms, metallic compounds as well as many
complex organic compounds. The composition varies greatly depending on where and when the oil is
collected, amongst many other factors. Some of the complex compounds found in crude oil, such as
asphaltene and other SARA-compounds can act as stabilizing agents or emulsifiers when forming
emulsions with water. This formation of emulsions is one of the big problems found in the oil
industry today, as they can be very stable and hard to separate. These emulsions are believed to be
stabilized by asphaltenes forming aggregates and the subsequent cross linkage between these.
In order to separate the stable water-in-oil emulsions, different methods are used. Today these
methods consist of centrifugal settling, gravity separators, thermal treatment, chemical
demulsification, electro coalescence and many more. Electro coalescence has proven to be one of
the most efficient method for demulsifying water-in-oil emulsions and is therefore one of the main
focuses for this thesis.
In this thesis a new method for separating emulsions, built on the principle of electro coalescence
with some additional parameters, was tested to find a better alternative to the established methods
of today. In addition to this new method, normal electro coalescence, centrifugal separation, thermal
heating and gravitational separation was also tested for comparison.
To test the effectiveness of each method, a model emulsion was made from Exxsol D60, toluene,
asphaltenes and water. Tests using different fractions of these found a water cut of 40%, with 20% of
the continuous phase being toluene and an asphaltene concentration of 1000ppm to be the best
model. These components were mixed using a homogenizer and then separated using the different
methods.
For each experiment photos were taken and post processed. The post processing was done using the
measurement tool in ImageJ, and from these measurements a degree of separation was calculated
using Excel.
The results showed that thermal heating was as effective as the gravitational separation used as a
blank, both separating 20%, normal electro coalescence achieved a degree of separation of 48%,
while centrifugation and the new method both achieved around 80% separation in three minutes.
The centrifuge had a slightly higher separation with 80.1 ± 8.0% and the new method separated
78.0 ± 11.4%. Taking into consideration the formation and breakdown of the DPL, the cost of
operating and the energy efficiency of all the methods, electro coalescence with the new parameters
was found to be the best method for separation.
iii
Sammendrag Råolje er en kjemisk blanding av hydrokarboner, heteroatomer, metalliske forbindelser og mange
komplekse organiske forbindelser. Sammensetningen av disse varierer avhengig av hvor og når
hentet, samt flere ander faktorer. Noen av de komplekse forbindelsene som finnes i råoljen, som
asfaltener og andre SARA-forbindelser fungerer som stabiliseringsmidler, eller emulgatorer, når
råoljen former emulsjoner med vann. Denne dannelsen av emulsjoner er en av de store
utfordringene innen oljeindustrien, spesielt siden de er så stabile og vanskelig å separere. Disse
emulsjonene er antatt å være stabilisert av asfaltener som danner aggregat og kryssbindinger.
For å separere disse stabile vann-i-olje emulsjonene er flere forskjellige metoder i bruk. I dag
inkluderer disse metodene sentrifuge, gravitasjonsseparatorer, varmebehandling, kjemisk
emulsjonsnedbryting, elektrokoalesens og mange flere. Elektrokoalesens har vist seg å være en av de
mest effektive metodene for å bryte ned vann-i-olje emulsjoner, og er derfor et hovedfokus i denne
oppgaven.
I denne oppgaven ble en ny metode som baserer seg på prinsippene til elektrokoalesens, med noen
nye parametere testet for å finne et bedre alternativ til dagens etablerte metoder. I tillegg til denne
nye metoden ble vanlig elektrokoalesens, sentrifuge, varmebad og gravitasjonsseparasjon testet, for
å få en god sammenligning mellom alle metodene.
For å teste effektiviteten til hver metode ble en modellemulsjon laget med Exxsol D60, toluen,
asfaltener og vann. Testing ble gjort og en sammensetning med 40% vann, en kontinuerlig fase med
20% toluen og en asfalten-konsentrasjon på 1000ppm ble funnet å være den beste modellen. Disse
komponentene ble blandet med en homogenisator, og så separert med hver av metodene.
For hvert forsøk ble det tatt bilder som videre ble post prosessert. Denne prosesseringen ble gjort
med måleverktøyet til ImageJ, og disse målingene ble videre brukt for å regne ut separasjonsgraden i
Excel.
Resultatene viste at varmebehandling hadde samme effekt som gravitasjonsseparasjon, som var
brukt som blank, begge med en separasjonsgrad på 20%. Vanlig elektrokoalesens oppnådde 48%
separasjon, mens sentrifuge og den nye metoden begge oppnådde rundt 80% separasjon, på tre
minutter. Sentrifugen hadde en litt høyere separasjonsgrad med 80.1 ± 8.0%, mens den nye
metoden hadde 78.0 ± 11.4%. Når dannelse og nedbryting av DPL, driftskostnader og
energieffektivitet til alle metoder er tatt med i betraktning ble det funnet at elektrokoalesens med de
nye parameterne var den beste separasjonsmetoden.
iv
Table of content Preface ...................................................................................................................................................... i
Abstract ....................................................................................................................................................ii
Sammendrag ........................................................................................................................................... iii
Nomenclature .......................................................................................................................................... vi
Abbreviations .......................................................................................................................................... vi
1. Introduction ..................................................................................................................................... 1
1.1 Organization of the thesis ............................................................................................................. 2
2. Theory .............................................................................................................................................. 3
2.1 Crude oil ........................................................................................................................................ 3
2.2 Emulsion ........................................................................................................................................ 4
2.2.1 Surfactants.................................................................................................................................. 5
2.2.2 Asphaltenes ................................................................................................................................ 5
2.2.3 Emulsion breakdown .................................................................................................................. 6
2.3 Separation methods ...................................................................................................................... 7
2.3.1 Electro coalescence .................................................................................................................... 7
2.3.1.1 Chain formation ....................................................................................................................... 8
2.3.1.2 Partial coalescence .................................................................................................................. 9
2.3.1.3 Critical conditions for electro coalescence............................................................................ 10
2.3.2 Centrifuge ................................................................................................................................. 11
2.3.3 Thermal heating ....................................................................................................................... 11
3. Experimental procedure ................................................................................................................ 12
3.1 Setup ............................................................................................................................................ 12
3.1.1 Formation of emulsions............................................................................................................ 12
3.1.2 Electro coalescence .................................................................................................................. 13
3.1.3 Centrifuge ................................................................................................................................. 14
3.1.4 Thermal heating ....................................................................................................................... 14
3.2 Procedure .................................................................................................................................... 15
3.2.1 Formation of emulsions............................................................................................................ 15
3.2.2 Voltage pattern for electro coalescence .................................................................................. 17
3.2.3 Frequency and voltage for electro coalescence ....................................................................... 19
3.2.4 New parameter A for electro coalescence ............................................................................... 20
3.2.5 New parameters B and C for electro coalescence ................................................................... 21
3.2.6 Centrifuge ................................................................................................................................. 22
3.2.7 Thermal heating ....................................................................................................................... 23
3.3 Post processing in ImageJ ............................................................................................................ 24
v
4 Results ........................................................................................................................................... 25
4.1 Formation of emulsions............................................................................................................... 26
4.2 Electro coalescence ..................................................................................................................... 28
4.2.1 Voltage pattern for electro coalescence .................................................................................. 28
4.2.2 Frequency and voltage for electro coalescence ....................................................................... 34
4.2.3 New parameter A for electro coalescence ............................................................................... 36
4.2.4 New parameters B and C for electro coalescence ................................................................... 37
4.3 Centrifuge .................................................................................................................................... 40
4.4 Thermal heating .......................................................................................................................... 42
4.5 Result summary ........................................................................................................................... 43
5 Discussion ...................................................................................................................................... 45
5.1 Formation of emulsions............................................................................................................... 45
5.2 Electro coalescence ..................................................................................................................... 46
5.2.1 Voltage patterns for electro coalescence................................................................................. 46
5.2.2 Frequency and Voltage for electro coalescence ...................................................................... 47
5.2.3 New parameters A, B and C for electro coalescence ............................................................... 48
5.3 Centrifuge .................................................................................................................................... 50
5.4 Thermal heating .......................................................................................................................... 52
5.5 Data processing software ............................................................................................................ 53
5.5.1 Post processing for Span83 emulsions: .................................................................................... 53
5.5.2 Post processing for asphaltene emulsions: .............................................................................. 54
6 Conclusions & Further Work ......................................................................................................... 55
7 References ..................................................................................................................................... 56
Appendices ............................................................................................................................................ 57
Appendix 1 – Crude Oil (<0.5% sulphur) HSE sheet. ................................................................................ I
Appendix 2 – Toluene HSE sheet. ............................................................................................................ II
Appendix 3 – Exxsol D60 HSE sheet ....................................................................................................... III
Appendix 4 – n-Pentane HSE sheet. ....................................................................................................... IV
Appendix 5 - D60 Technical Data ............................................................................................................ V
Appendix 6 – Water Technical Data ....................................................................................................... VI
Appendix 7 – Asphaltene emulsions. .................................................................................................... VII
Appendix 8 – Popular science article ................................................................................................... VIII
vi
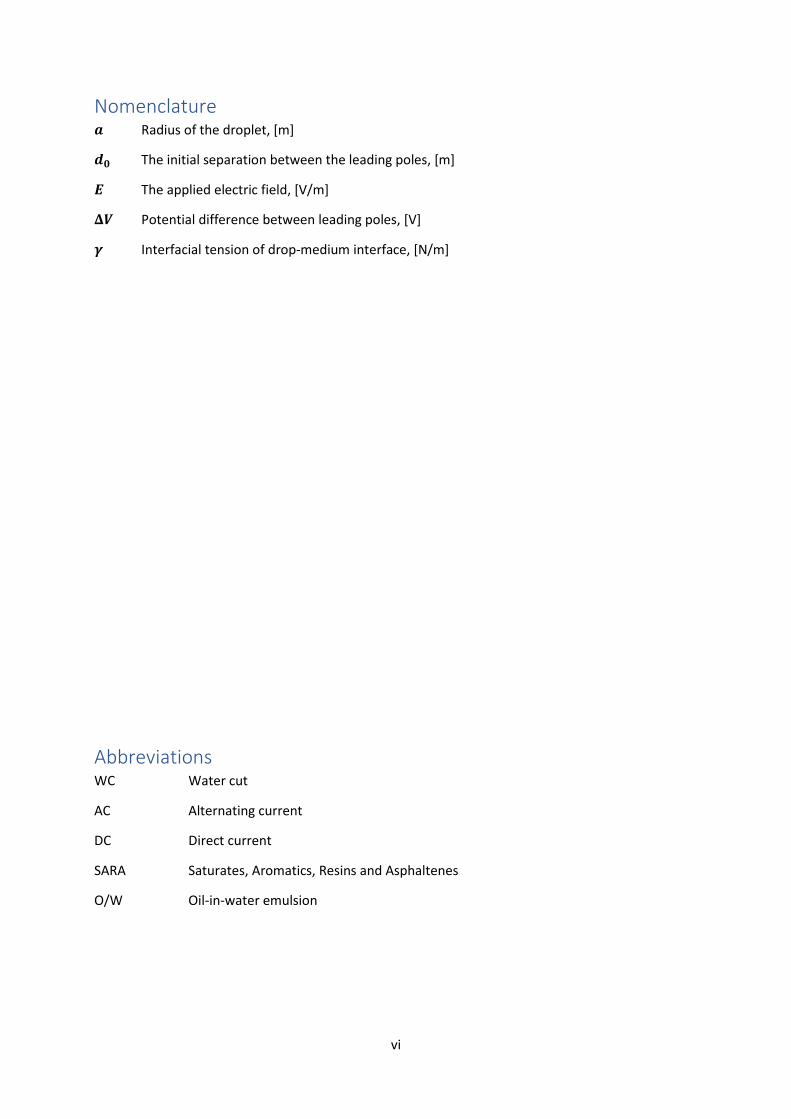
Nomenclature 𝒂 Radius of the droplet, [m]
𝒅𝟎 The initial separation between the leading poles, [m]
𝑬 The applied electric field, [V/m]
𝚫𝑽 Potential difference between leading poles, [V]
𝜸 Interfacial tension of drop-medium interface, [N/m]
Abbreviations WC Water cut
AC Alternating current
DC Direct current
SARA Saturates, Aromatics, Resins and Asphaltenes
O/W Oil-in-water emulsion
1
1. Introduction In the oil industry, the transportation of crude oil involves a major problem, namely the formation of
stable water-in-oil emulsions. These emulsions form due to the natural presence of water, as well as
the presence of natural emulsification agents, such as asphaltenes and waxes (1). These emulsions
are more voluminous and has a higher viscosity than the two fluids it is made from (2), making them
more difficult to move and work with. The formation of emulsions leads to water in the process
equipment, which in turn can lead to corrosion, catalyst-poisoning and additional cost in
transportation. Therefore, the separation of these stable emulsions is a major focus in the oil and gas
industry because of the environmental and economic advantages.
Water separation from crude oil emulsions can be self-induced or achieved by the influence of
external forces such as mechanical, thermal, electrostatic and chemical (1). There already exists
multiple methods for separating these emulsions, some of which include centrifugation, gravitational
separation, thermal heating and electro coalescence (2). These are tried and tested methods, but
none of them truly fulfil all the needs of the industry. Both the gravitational separation (1) and
thermal heating are slow methods and centrifugation introduces high costs both in acquisition and in
maintenance. Electro coalescence has shown potential since its introduction in the sixties, but has
yet to be perfected for large scale use (3).
To better understand the efficiency of the well-established separation methods, as well as to validate
the new method, experiments to test and quantify the separation degree for each method were
done. The first step in these experiments was to create a stable model emulsion with the same
characteristics as emulsions made from crude oil. To achieve this, Exxsol D60, toluene and
asphaltenes were mixed with water at different fractions. The most stable emulsion was selected for
further use. All separation methods (centrifuge, thermal heating, gravitational separation and electro
coalescence) were tested using the same configuration for the emulsion and the results were
analysed in the same way. The electricity used was also measured to find out which method was the
most energy efficient one.
In this thesis, the results from these well-established methods were compared to a new, further
developed method based on electro coalescence. This method introduces another factor with the
goal of increasing the degree of separation, without increasing the power consumption too much. As
this new method is still in the research stage and the patent is still pending, information about the
specifics of this method will therefore not be further discussed in this thesis. The goal with this is to
find the most effective, real life applicable method, which could be used for in situ separation of
water-in-oil emulsions.

2
1.1 Organization of the thesis Theory: This chapter describes the composition and properties of crude oil and basic theory about
emulsion formation and breakdown, as well as methods used for separation.
Experimental procedure: This chapter describes the setups and procedures used during the
experiments.
Results: This chapter contains the results gathered from the experiments.
Discussion: This chapter evaluates the results and the work performed.
Conclusion & Further Work: This chapter consists of conclusions drawn from the results and
discussion, as well as suggestions for further work.
3
2. Theory
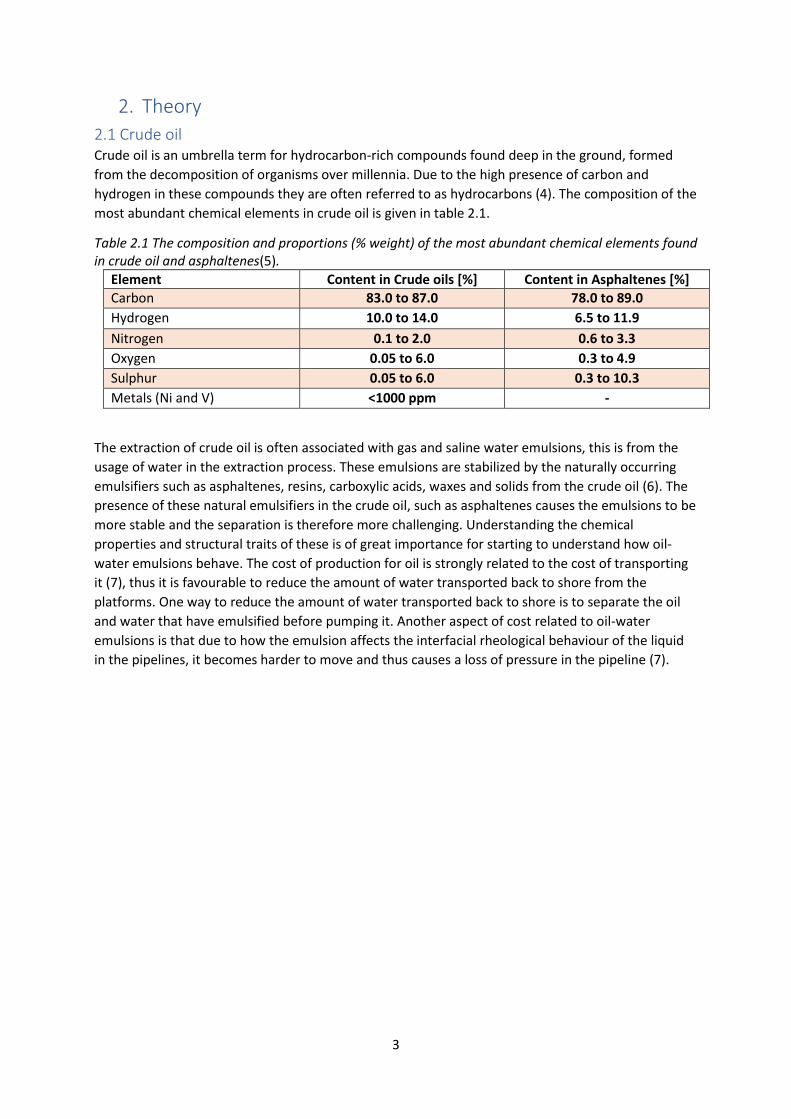
2.1 Crude oil Crude oil is an umbrella term for hydrocarbon-rich compounds found deep in the ground, formed
from the decomposition of organisms over millennia. Due to the high presence of carbon and
hydrogen in these compounds they are often referred to as hydrocarbons (4). The composition of the
most abundant chemical elements in crude oil is given in table 2.1.
Table 2.1 The composition and proportions (% weight) of the most abundant chemical elements found in crude oil and asphaltenes(5).
Element Content in Crude oils [%] Content in Asphaltenes [%]
Carbon 83.0 to 87.0 78.0 to 89.0
Hydrogen 10.0 to 14.0 6.5 to 11.9
Nitrogen 0.1 to 2.0 0.6 to 3.3
Oxygen 0.05 to 6.0 0.3 to 4.9
Sulphur 0.05 to 6.0 0.3 to 10.3
Metals (Ni and V) <1000 ppm -
The extraction of crude oil is often associated with gas and saline water emulsions, this is from the
usage of water in the extraction process. These emulsions are stabilized by the naturally occurring
emulsifiers such as asphaltenes, resins, carboxylic acids, waxes and solids from the crude oil (6). The
presence of these natural emulsifiers in the crude oil, such as asphaltenes causes the emulsions to be
more stable and the separation is therefore more challenging. Understanding the chemical
properties and structural traits of these is of great importance for starting to understand how oil-
water emulsions behave. The cost of production for oil is strongly related to the cost of transporting
it (7), thus it is favourable to reduce the amount of water transported back to shore from the
platforms. One way to reduce the amount of water transported back to shore is to separate the oil
and water that have emulsified before pumping it. Another aspect of cost related to oil-water
emulsions is that due to how the emulsion affects the interfacial rheological behaviour of the liquid
in the pipelines, it becomes harder to move and thus causes a loss of pressure in the pipeline (7).
4
2.2 Emulsion Emulsions are systems that consists of a mixture between two immiscible liquids, where droplets of
one liquid is dispersed in the other (8).
The formation of an emulsion is a non-spontaneous reaction and therefore require energy input, for
example through agitation from a homogenizer. Some of the controlling factors in the formation of
emulsions are energy input, agitation time, volumetric ratios, temperature and the concentration of
surfactants. Through the agitation of a homogenizer the two phases are broken down into large
droplets that in turn gets broken further down (9).
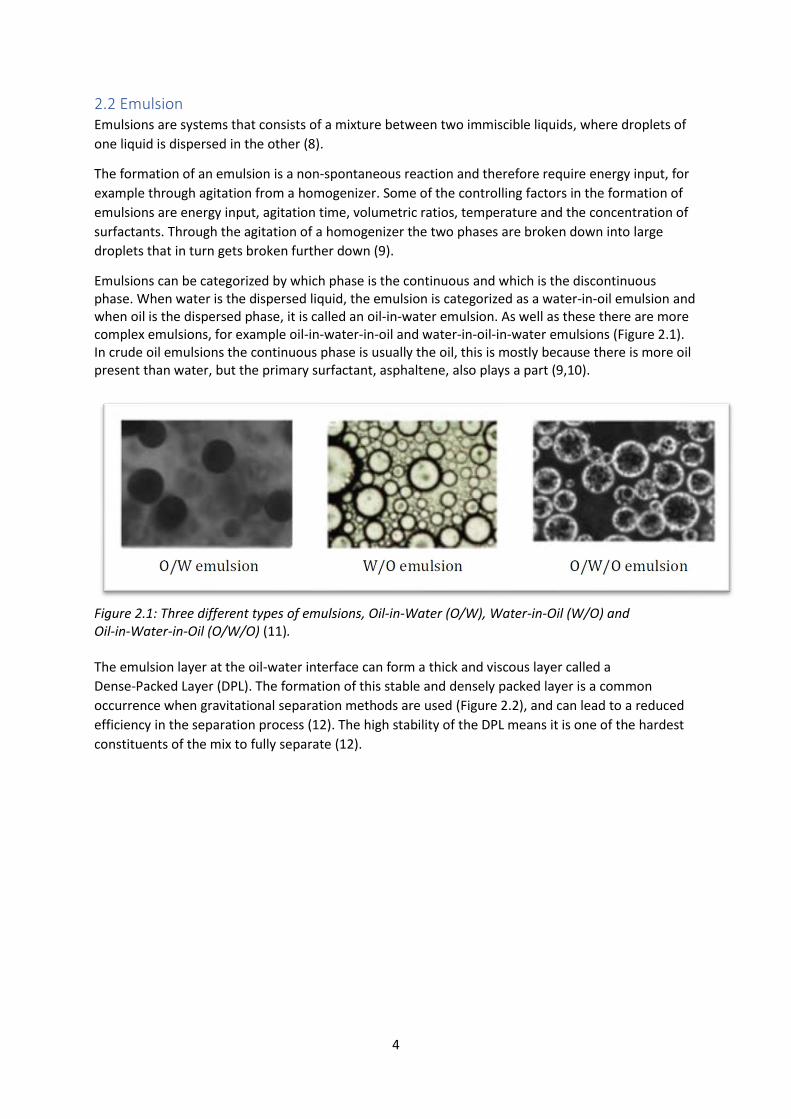
Emulsions can be categorized by which phase is the continuous and which is the discontinuous phase. When water is the dispersed liquid, the emulsion is categorized as a water-in-oil emulsion and when oil is the dispersed phase, it is called an oil-in-water emulsion. As well as these there are more complex emulsions, for example oil-in-water-in-oil and water-in-oil-in-water emulsions (Figure 2.1). In crude oil emulsions the continuous phase is usually the oil, this is mostly because there is more oil present than water, but the primary surfactant, asphaltene, also plays a part (9,10).
Figure 2.1: Three different types of emulsions, Oil-in-Water (O/W), Water-in-Oil (W/O) and Oil-in-Water-in-Oil (O/W/O) (11). The emulsion layer at the oil-water interface can form a thick and viscous layer called a
Dense-Packed Layer (DPL). The formation of this stable and densely packed layer is a common
occurrence when gravitational separation methods are used (Figure 2.2), and can lead to a reduced
efficiency in the separation process (12). The high stability of the DPL means it is one of the hardest
constituents of the mix to fully separate (12).
5
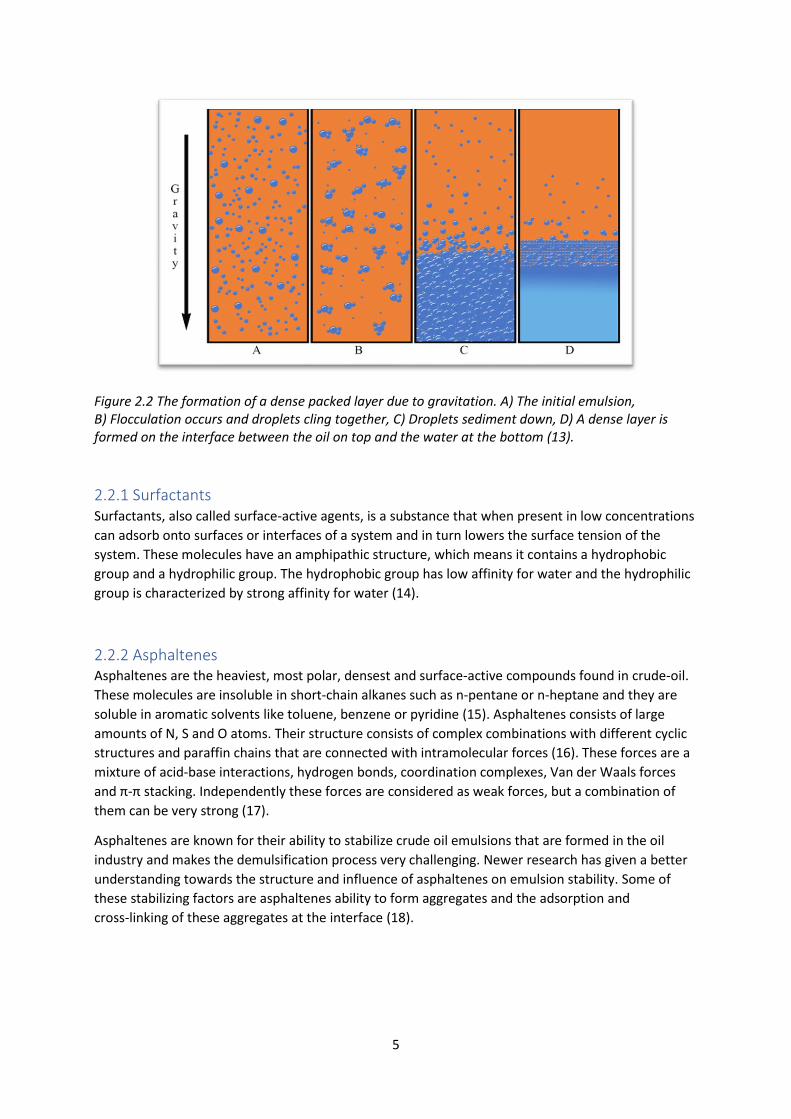
Figure 2.2 The formation of a dense packed layer due to gravitation. A) The initial emulsion, B) Flocculation occurs and droplets cling together, C) Droplets sediment down, D) A dense layer is formed on the interface between the oil on top and the water at the bottom (13).
2.2.1 Surfactants Surfactants, also called surface-active agents, is a substance that when present in low concentrations
can adsorb onto surfaces or interfaces of a system and in turn lowers the surface tension of the
system. These molecules have an amphipathic structure, which means it contains a hydrophobic
group and a hydrophilic group. The hydrophobic group has low affinity for water and the hydrophilic
group is characterized by strong affinity for water (14).
2.2.2 Asphaltenes Asphaltenes are the heaviest, most polar, densest and surface-active compounds found in crude-oil.
These molecules are insoluble in short-chain alkanes such as n-pentane or n-heptane and they are
soluble in aromatic solvents like toluene, benzene or pyridine (15). Asphaltenes consists of large
amounts of N, S and O atoms. Their structure consists of complex combinations with different cyclic
structures and paraffin chains that are connected with intramolecular forces (16). These forces are a
mixture of acid-base interactions, hydrogen bonds, coordination complexes, Van der Waals forces
and π-π stacking. Independently these forces are considered as weak forces, but a combination of
them can be very strong (17).
Asphaltenes are known for their ability to stabilize crude oil emulsions that are formed in the oil
industry and makes the demulsification process very challenging. Newer research has given a better
understanding towards the structure and influence of asphaltenes on emulsion stability. Some of
these stabilizing factors are asphaltenes ability to form aggregates and the adsorption and
cross-linking of these aggregates at the interface (18).
6
2.2.3 Emulsion breakdown With a basis in the laws of thermodynamics, an emulsion is classified as an unstable system, due to
the natural tendency of liquid-liquid systems to separate. This is to reduce the interfacial area
between the two liquids and thus reduce the interfacial energy (19). There are many different
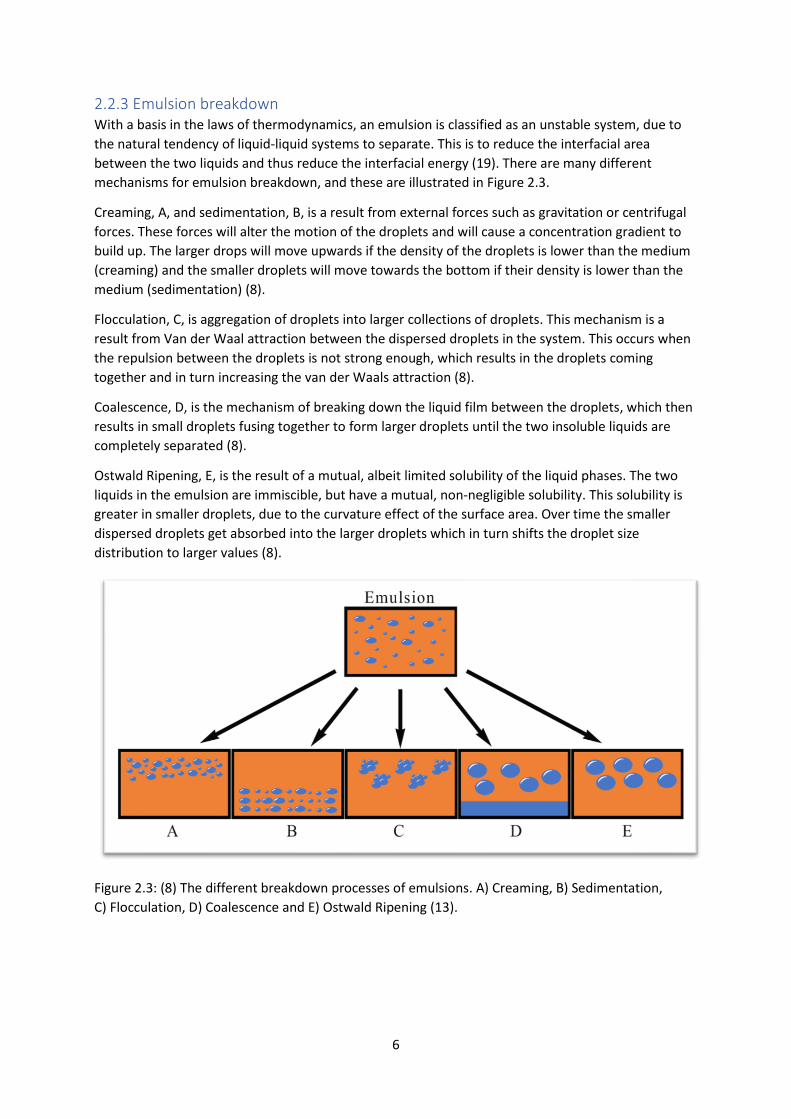
mechanisms for emulsion breakdown, and these are illustrated in Figure 2.3.
Creaming, A, and sedimentation, B, is a result from external forces such as gravitation or centrifugal
forces. These forces will alter the motion of the droplets and will cause a concentration gradient to
build up. The larger drops will move upwards if the density of the droplets is lower than the medium
(creaming) and the smaller droplets will move towards the bottom if their density is lower than the
medium (sedimentation) (8).
Flocculation, C, is aggregation of droplets into larger collections of droplets. This mechanism is a
result from Van der Waal attraction between the dispersed droplets in the system. This occurs when
the repulsion between the droplets is not strong enough, which results in the droplets coming
together and in turn increasing the van der Waals attraction (8).
Coalescence, D, is the mechanism of breaking down the liquid film between the droplets, which then
results in small droplets fusing together to form larger droplets until the two insoluble liquids are
completely separated (8).
Ostwald Ripening, E, is the result of a mutual, albeit limited solubility of the liquid phases. The two
liquids in the emulsion are immiscible, but have a mutual, non-negligible solubility. This solubility is
greater in smaller droplets, due to the curvature effect of the surface area. Over time the smaller
dispersed droplets get absorbed into the larger droplets which in turn shifts the droplet size
distribution to larger values (8).
Figure 2.3: (8) The different breakdown processes of emulsions. A) Creaming, B) Sedimentation,
C) Flocculation, D) Coalescence and E) Ostwald Ripening (13).
7
2.3 Separation methods In order to separate the stable water-in-oil emulsions, different techniques are used. Today these
techniques consist of centrifugal settling, gravity separators, thermal treatment, chemical
demulsification, electrostatic demulsification and so forth. Electro coalescence has proven to be the
most efficient method for demulsifying water-in-oil emulsions. Therefore the main focus in this
section will be electro coalescence (3).
2.3.1 Electro coalescence Electro coalescence is a technique involving the use of electrostatic force for phase separation in
liquid phases. In crude oil demulsification an electric field is commonly used to improve the process.
The electric field improves the coalescence rate of droplets, which in turn makes it easier for larger
droplets to settle by gravitational forces, as well as increasing the travel speed of the droplets in the
direction of the electrodes, which then facilitates phase separation (1).
There are four types of electric fields available today. These are Alternating Current (AC), Direct
Current (DC), combined AC/DC and pulsed DC. AC fields have a non-electrolytic nature and can
endure high water cuts. DC fields are used for handling small aqueous droplets but can cause
electrolytic corrosion, therefore it is only used for substances that has low conductivity. Research has
pointed towards AC fields being most efficient for increasing coalescing rate in electro coalescence
(3).
Multiple parameters are involved in electro coalescence and all of them influence the effectiveness
of the process. These parameters are voltage, oscillating frequency and how these are applied,
coalesce geometry, electrode configuration, temperature, flow rate, physical-chemical properties of
the emulsion components etc. Finding the optimal process parameters is of utter importance to find
the most effective method for demulsification of water-in-oil emulsions (3).
The electrostatic demulsification process is mainly based around the coalescence and sedimentation
of water droplets in the emulsion. When droplets coalesce by electro coalescence they go through
three steps: (20)
1. Impact of electrostatic force on the motion and approach of droplets.
2. Weakening the film which separates the droplets.
3. Disruption of the film and coalescence of the droplets.
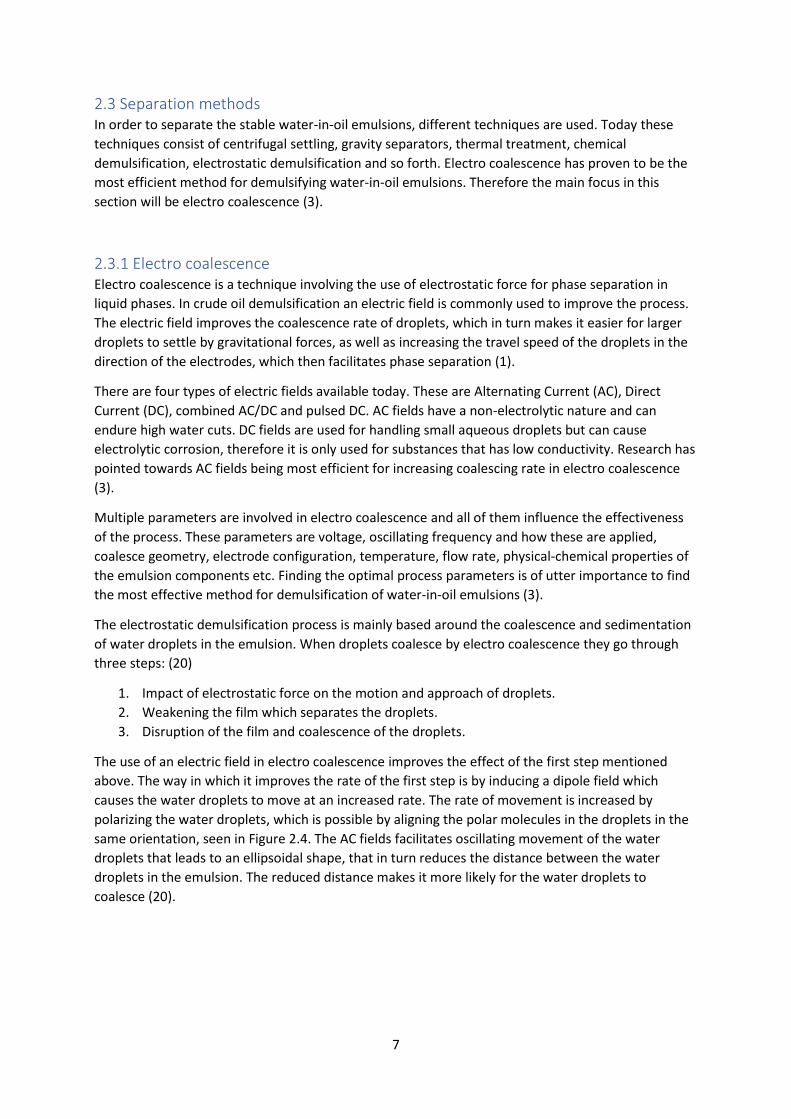
The use of an electric field in electro coalescence improves the effect of the first step mentioned
above. The way in which it improves the rate of the first step is by inducing a dipole field which
causes the water droplets to move at an increased rate. The rate of movement is increased by
polarizing the water droplets, which is possible by aligning the polar molecules in the droplets in the
same orientation, seen in Figure 2.4. The AC fields facilitates oscillating movement of the water
droplets that leads to an ellipsoidal shape, that in turn reduces the distance between the water
droplets in the emulsion. The reduced distance makes it more likely for the water droplets to
coalesce (20).
8
Figure 2.4 Principle of electro coalescence, the charged dipoles (𝛿+ 𝑎𝑛𝑑 𝛿−) of the water molecule are attracted towards the opposite charged electrode (13).
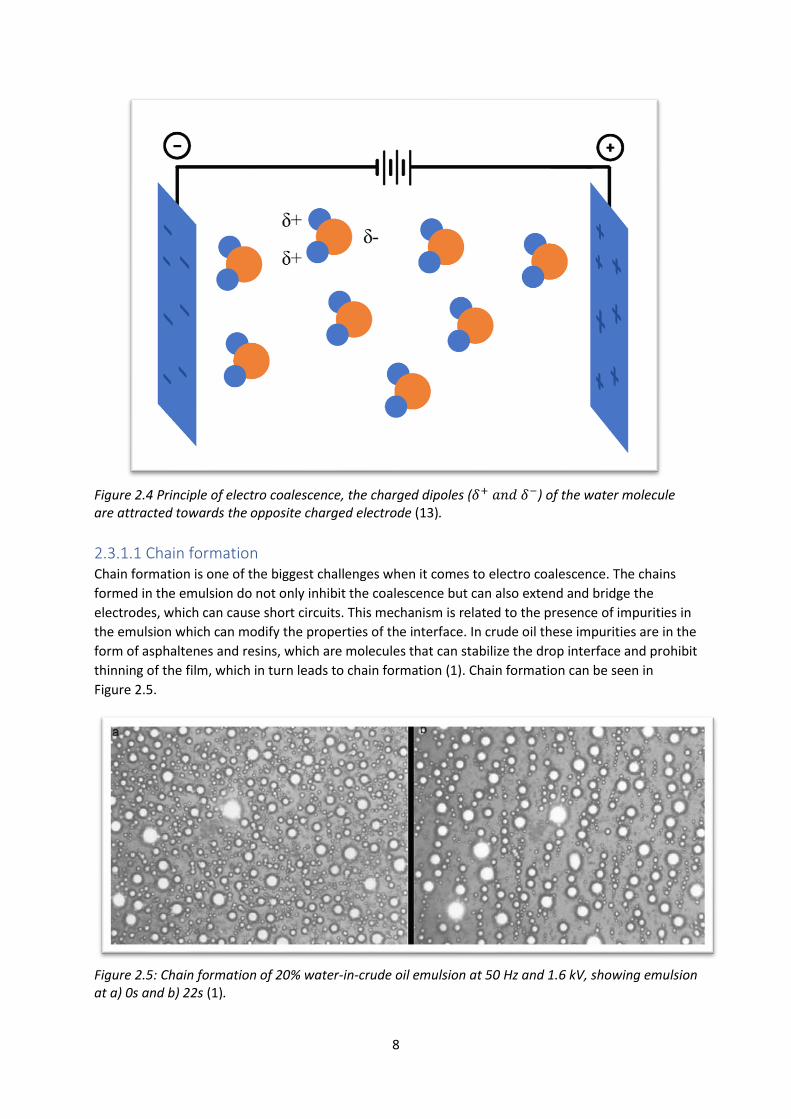
2.3.1.1 Chain formation Chain formation is one of the biggest challenges when it comes to electro coalescence. The chains
formed in the emulsion do not only inhibit the coalescence but can also extend and bridge the
electrodes, which can cause short circuits. This mechanism is related to the presence of impurities in
the emulsion which can modify the properties of the interface. In crude oil these impurities are in the
form of asphaltenes and resins, which are molecules that can stabilize the drop interface and prohibit
thinning of the film, which in turn leads to chain formation (1). Chain formation can be seen in
Figure 2.5.
Figure 2.5: Chain formation of 20% water-in-crude oil emulsion at 50 Hz and 1.6 kV, showing emulsion at a) 0s and b) 22s (1).
9
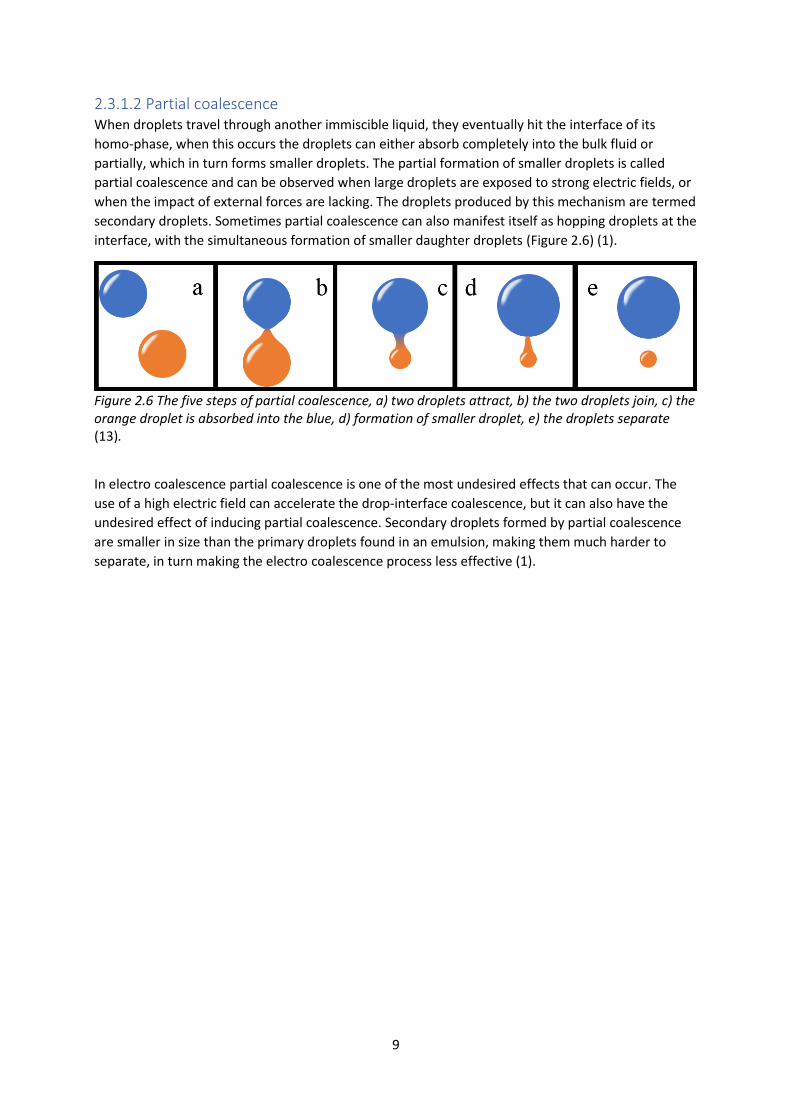
2.3.1.2 Partial coalescence When droplets travel through another immiscible liquid, they eventually hit the interface of its
homo-phase, when this occurs the droplets can either absorb completely into the bulk fluid or
partially, which in turn forms smaller droplets. The partial formation of smaller droplets is called
partial coalescence and can be observed when large droplets are exposed to strong electric fields, or
when the impact of external forces are lacking. The droplets produced by this mechanism are termed
secondary droplets. Sometimes partial coalescence can also manifest itself as hopping droplets at the
interface, with the simultaneous formation of smaller daughter droplets (Figure 2.6) (1).
Figure 2.6 The five steps of partial coalescence, a) two droplets attract, b) the two droplets join, c) the orange droplet is absorbed into the blue, d) formation of smaller droplet, e) the droplets separate (13).
In electro coalescence partial coalescence is one of the most undesired effects that can occur. The
use of a high electric field can accelerate the drop-interface coalescence, but it can also have the
undesired effect of inducing partial coalescence. Secondary droplets formed by partial coalescence
are smaller in size than the primary droplets found in an emulsion, making them much harder to
separate, in turn making the electro coalescence process less effective (1).
10
2.3.1.3 Critical conditions for electro coalescence The properties of the emulsion, such as interfacial tension, density differences, viscosity, conductivity
and permittivity of fluids, as well as droplet size, polydispersity and percentage of dispersed phase
(1). Some of these parameters have so called critical values, above or below these the coalescence is
affected negatively. Some of the critical parameters have been found, some vary from emulsion to
emulsion and some have not been found at all.
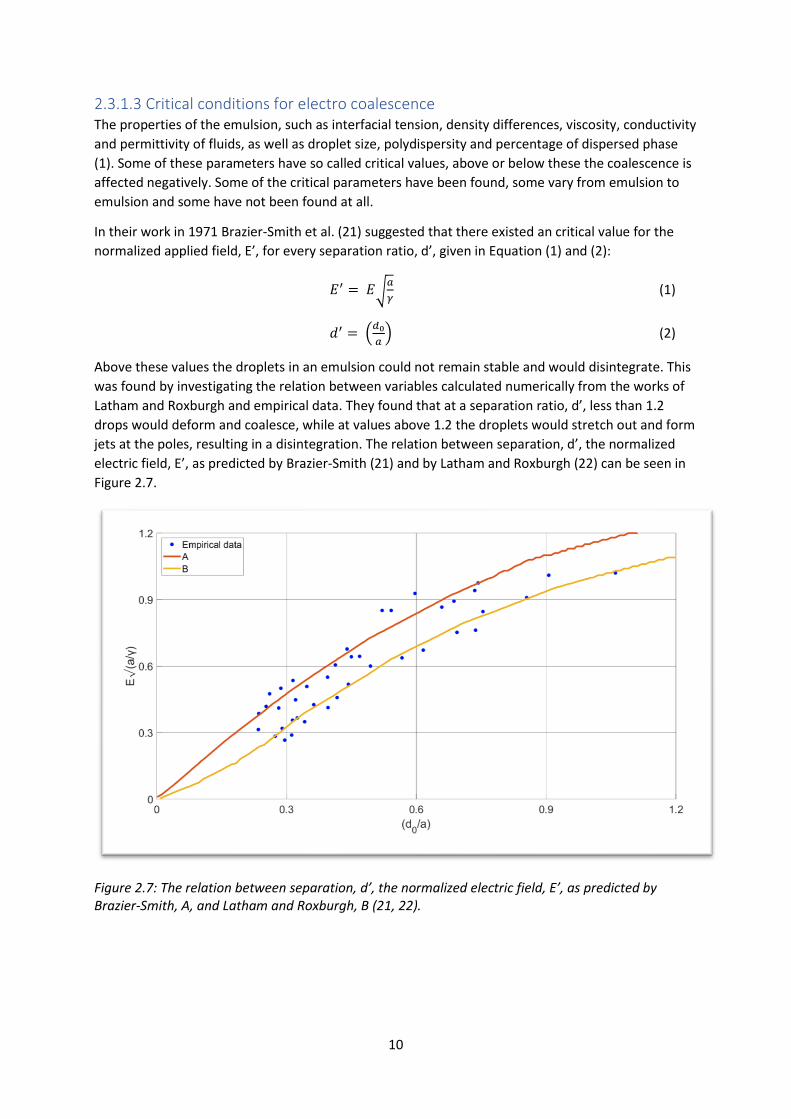
In their work in 1971 Brazier-Smith et al. (21) suggested that there existed an critical value for the
normalized applied field, E’, for every separation ratio, d’, given in Equation (1) and (2):
𝐸′ = 𝐸√𝑎
𝛾 (1)
𝑑′ = (𝑑0
𝑎) (2)
Above these values the droplets in an emulsion could not remain stable and would disintegrate. This
was found by investigating the relation between variables calculated numerically from the works of
Latham and Roxburgh and empirical data. They found that at a separation ratio, d’, less than 1.2
drops would deform and coalesce, while at values above 1.2 the droplets would stretch out and form
jets at the poles, resulting in a disintegration. The relation between separation, d’, the normalized
electric field, E’, as predicted by Brazier-Smith (21) and by Latham and Roxburgh (22) can be seen in
Figure 2.7.
Figure 2.7: The relation between separation, d’, the normalized electric field, E’, as predicted by Brazier-Smith, A, and Latham and Roxburgh, B (21, 22).
11
It has been suggested by Chen et al. that the usage of high frequency AC fields above a critical
frequency can negate chain formation in electro coalescence (23). It is therefore important to find
the optimum frequency, sadly this is affected by many factors and is hard to determine (1). It has also
been observed that for water-in-oil emulsions frequencies lower than 100 Hz tended to induce fluid
motion, this resulted in a reduced effect of the electro coalescence (24).
In 2002 Kim et al (25) found that an applied field of 2.5 kV/cm and above showed a significant
increase in separation efficiency. While in their 2009 study, Lesaint et al. (26) found that fields at 2
kV/cm or lower only led to reversible flocculation, and fields of 3.5 kV/cm and above were efficient.
Many have tried to find the optimum voltage, but a precise value has yet to be found. Although no
one has found a precise value, all studies point to a higher voltage yielding better separation, up to
an unknown upper limit.
2.3.2 Centrifuge Gravity separation is a slow sedimentation process of an emulsion, a method to accelerate this
process is centrifuging. Centrifuging as a separation method exploits the difference in density
between oil and water, the density difference allows the use of centrifugal force to break an
emulsion and separate it into oil and water. The more effective sedimentation process is achieved by
the impact of mechanical energy in the form of centripetal acceleration, which in turn makes the
demulsification process faster (27).
Centrifugation is not a widely used demulsification process in oil industry, this is because of high
costs associated with the process in terms of buying the equipment, operating the equipment and
maintenance. The centrifuge also has a low capacity and has a tendency to foul (28).
2.3.3 Thermal heating The method of thermal heating refers to a process where the emulsion is heated using a hot plate,
water bath or other methods to reduce the viscosity, increase the droplet size, dissolve paraffin
crystals and wax and increase the difference in density between oil and water (29). Increasing the
temperature of the mix increases the internal energy causing the molecules to move at an increased
rate, this in turn makes the mix less viscous. This decrease in viscosity allows the droplets to coalesce
more rapidly (29). The added heat might also deactivate some of the natural emulsifiers found in
crude oil, such as paraffin crystals and wax (29). These emulsifiers get melted and dissolved into the
mixture, thus reducing their effect. Lastly the increase in temperature, up to about 82°C (29),
increases the difference in density, in turn making it easier to separate by gravity or centrifuge.
Thermal heating is not widely used as a separation method, due to the costs associated with heating
large quantities of liquid, as well as the loss of more volatile components.
12
3. Experimental procedure
3.1 Setup The experimental work was carried out using four different setups. The setups consisted of a
homogenizer used to make the emulsions, an electro coalescer, centrifuge and a heated circulating
water bath used to separate the emulsions.
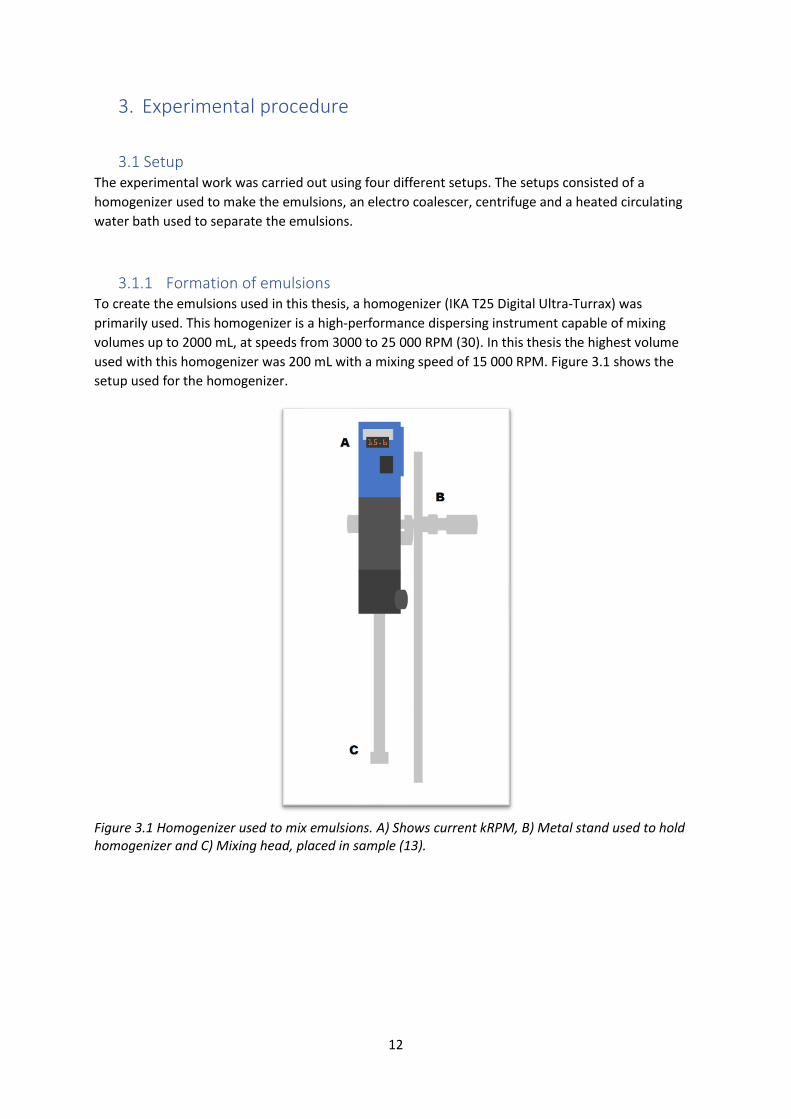
3.1.1 Formation of emulsions To create the emulsions used in this thesis, a homogenizer (IKA T25 Digital Ultra-Turrax) was
primarily used. This homogenizer is a high-performance dispersing instrument capable of mixing
volumes up to 2000 mL, at speeds from 3000 to 25 000 RPM (30). In this thesis the highest volume
used with this homogenizer was 200 mL with a mixing speed of 15 000 RPM. Figure 3.1 shows the
setup used for the homogenizer.
Figure 3.1 Homogenizer used to mix emulsions. A) Shows current kRPM, B) Metal stand used to hold homogenizer and C) Mixing head, placed in sample (13).
13
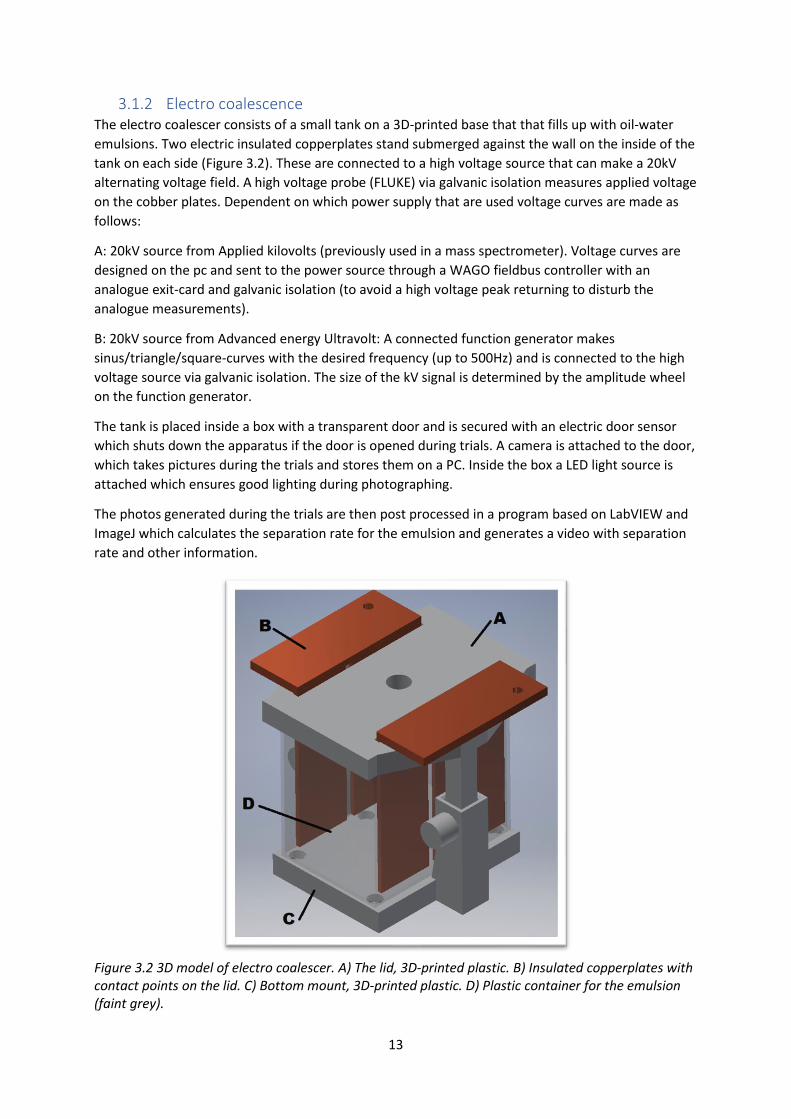
3.1.2 Electro coalescence The electro coalescer consists of a small tank on a 3D-printed base that that fills up with oil-water
emulsions. Two electric insulated copperplates stand submerged against the wall on the inside of the
tank on each side (Figure 3.2). These are connected to a high voltage source that can make a 20kV
alternating voltage field. A high voltage probe (FLUKE) via galvanic isolation measures applied voltage
on the cobber plates. Dependent on which power supply that are used voltage curves are made as
follows:
A: 20kV source from Applied kilovolts (previously used in a mass spectrometer). Voltage curves are
designed on the pc and sent to the power source through a WAGO fieldbus controller with an
analogue exit-card and galvanic isolation (to avoid a high voltage peak returning to disturb the
analogue measurements).
B: 20kV source from Advanced energy Ultravolt: A connected function generator makes
sinus/triangle/square-curves with the desired frequency (up to 500Hz) and is connected to the high
voltage source via galvanic isolation. The size of the kV signal is determined by the amplitude wheel
on the function generator.
The tank is placed inside a box with a transparent door and is secured with an electric door sensor
which shuts down the apparatus if the door is opened during trials. A camera is attached to the door,
which takes pictures during the trials and stores them on a PC. Inside the box a LED light source is
attached which ensures good lighting during photographing.
The photos generated during the trials are then post processed in a program based on LabVIEW and
ImageJ which calculates the separation rate for the emulsion and generates a video with separation
rate and other information.
Figure 3.2 3D model of electro coalescer. A) The lid, 3D-printed plastic. B) Insulated copperplates with contact points on the lid. C) Bottom mount, 3D-printed plastic. D) Plastic container for the emulsion (faint grey).
14
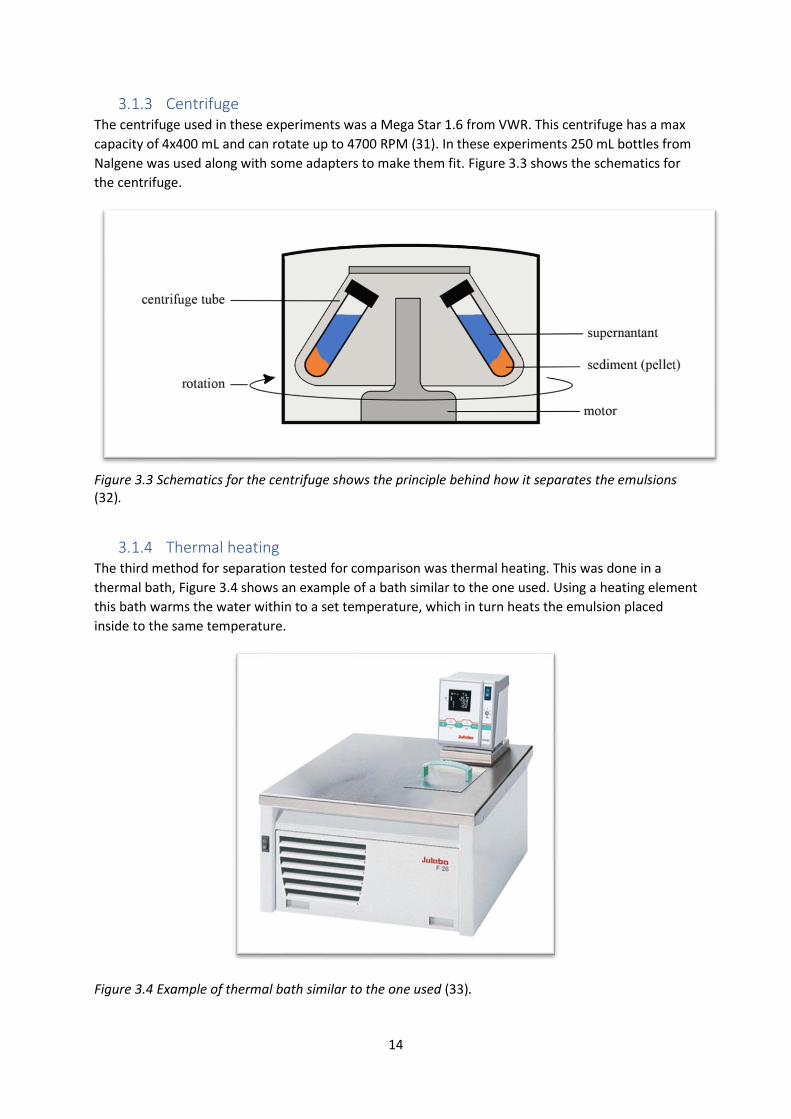
3.1.3 Centrifuge The centrifuge used in these experiments was a Mega Star 1.6 from VWR. This centrifuge has a max
capacity of 4x400 mL and can rotate up to 4700 RPM (31). In these experiments 250 mL bottles from
Nalgene was used along with some adapters to make them fit. Figure 3.3 shows the schematics for
the centrifuge.
Figure 3.3 Schematics for the centrifuge shows the principle behind how it separates the emulsions (32).
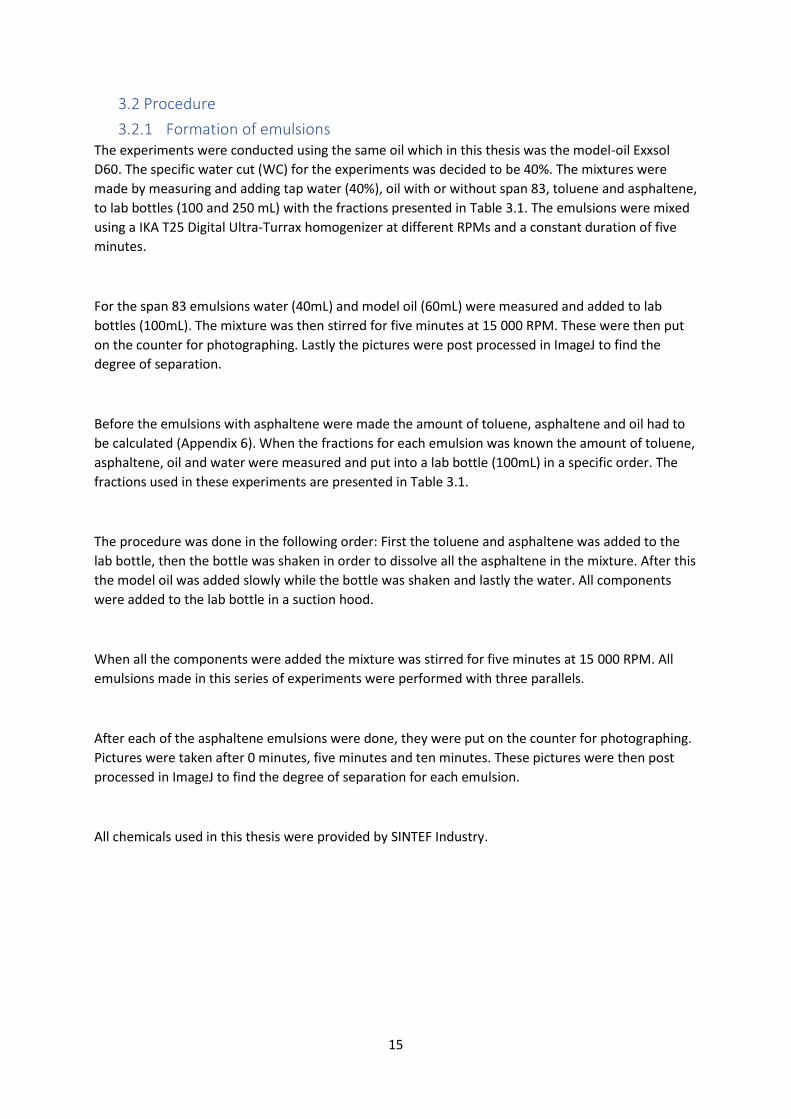
3.1.4 Thermal heating The third method for separation tested for comparison was thermal heating. This was done in a
thermal bath, Figure 3.4 shows an example of a bath similar to the one used. Using a heating element
this bath warms the water within to a set temperature, which in turn heats the emulsion placed
inside to the same temperature.
Figure 3.4 Example of thermal bath similar to the one used (33).
15
3.2 Procedure
3.2.1 Formation of emulsions The experiments were conducted using the same oil which in this thesis was the model-oil Exxsol
D60. The specific water cut (WC) for the experiments was decided to be 40%. The mixtures were
made by measuring and adding tap water (40%), oil with or without span 83, toluene and asphaltene,
to lab bottles (100 and 250 mL) with the fractions presented in Table 3.1. The emulsions were mixed
using a IKA T25 Digital Ultra-Turrax homogenizer at different RPMs and a constant duration of five
minutes.
For the span 83 emulsions water (40mL) and model oil (60mL) were measured and added to lab
bottles (100mL). The mixture was then stirred for five minutes at 15 000 RPM. These were then put
on the counter for photographing. Lastly the pictures were post processed in ImageJ to find the
degree of separation.
Before the emulsions with asphaltene were made the amount of toluene, asphaltene and oil had to
be calculated (Appendix 6). When the fractions for each emulsion was known the amount of toluene,
asphaltene, oil and water were measured and put into a lab bottle (100mL) in a specific order. The
fractions used in these experiments are presented in Table 3.1.
The procedure was done in the following order: First the toluene and asphaltene was added to the
lab bottle, then the bottle was shaken in order to dissolve all the asphaltene in the mixture. After this
the model oil was added slowly while the bottle was shaken and lastly the water. All components
were added to the lab bottle in a suction hood.
When all the components were added the mixture was stirred for five minutes at 15 000 RPM. All
emulsions made in this series of experiments were performed with three parallels.
After each of the asphaltene emulsions were done, they were put on the counter for photographing.
Pictures were taken after 0 minutes, five minutes and ten minutes. These pictures were then post
processed in ImageJ to find the degree of separation for each emulsion.
All chemicals used in this thesis were provided by SINTEF Industry.
16
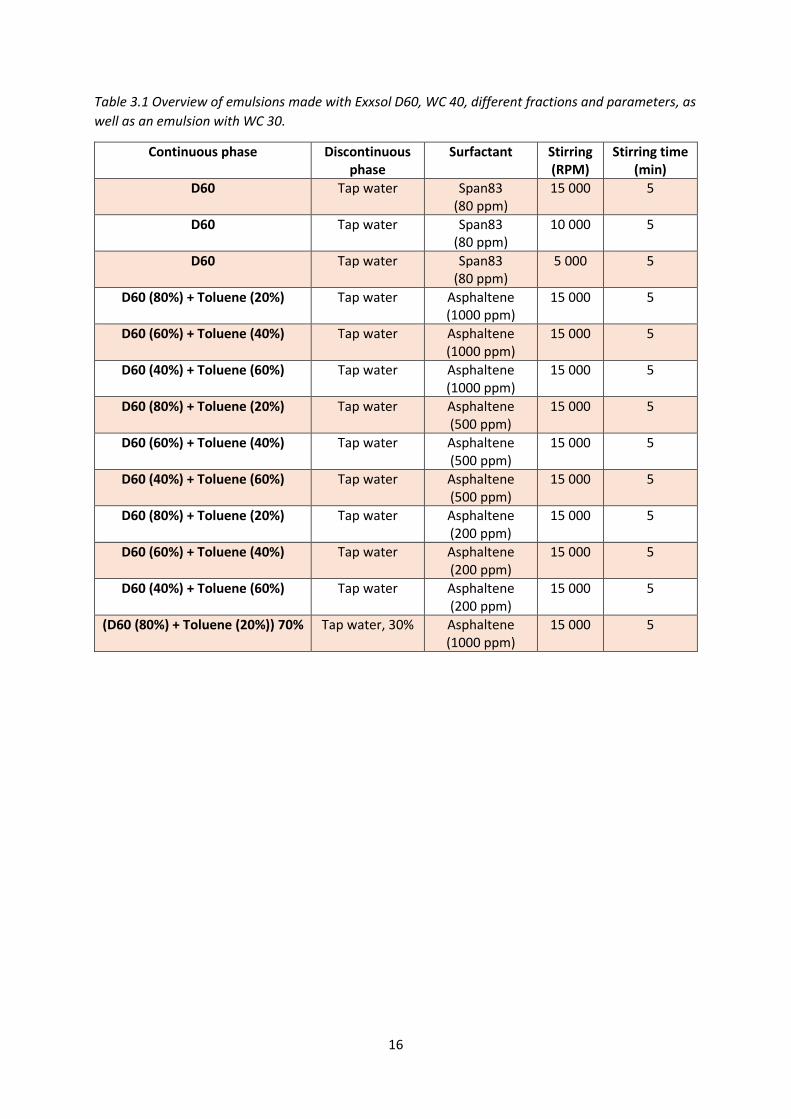
Table 3.1 Overview of emulsions made with Exxsol D60, WC 40, different fractions and parameters, as
well as an emulsion with WC 30.
Continuous phase Discontinuous phase
Surfactant Stirring (RPM)
Stirring time (min)
D60 Tap water Span83 (80 ppm)
15 000 5
D60 Tap water Span83 (80 ppm)
10 000 5
D60 Tap water Span83 (80 ppm)
5 000 5
D60 (80%) + Toluene (20%) Tap water Asphaltene (1000 ppm)
15 000 5
D60 (60%) + Toluene (40%) Tap water Asphaltene (1000 ppm)
15 000 5
D60 (40%) + Toluene (60%) Tap water Asphaltene (1000 ppm)
15 000 5
D60 (80%) + Toluene (20%) Tap water Asphaltene (500 ppm)
15 000 5
D60 (60%) + Toluene (40%) Tap water Asphaltene (500 ppm)
15 000 5
D60 (40%) + Toluene (60%) Tap water Asphaltene (500 ppm)
15 000 5
D60 (80%) + Toluene (20%) Tap water Asphaltene (200 ppm)
15 000 5
D60 (60%) + Toluene (40%) Tap water Asphaltene (200 ppm)
15 000 5
D60 (40%) + Toluene (60%) Tap water Asphaltene (200 ppm)
15 000 5
(D60 (80%) + Toluene (20%)) 70% Tap water, 30% Asphaltene (1000 ppm)
15 000 5
17
3.2.2 Voltage pattern for electro coalescence The emulsions used for these experiments were made of D60 + span 83 (60mL) and water (40mL).
These were then mixed for five minutes at 15 000 RPM.
To find the most optimal voltage pattern in the electro coalesce, the amplitude and frequency were
held constant. The combination of these constants was changed according to the voltage pattern
that were tested. The different parameters used in the experiments are displayed in Table 3.2.
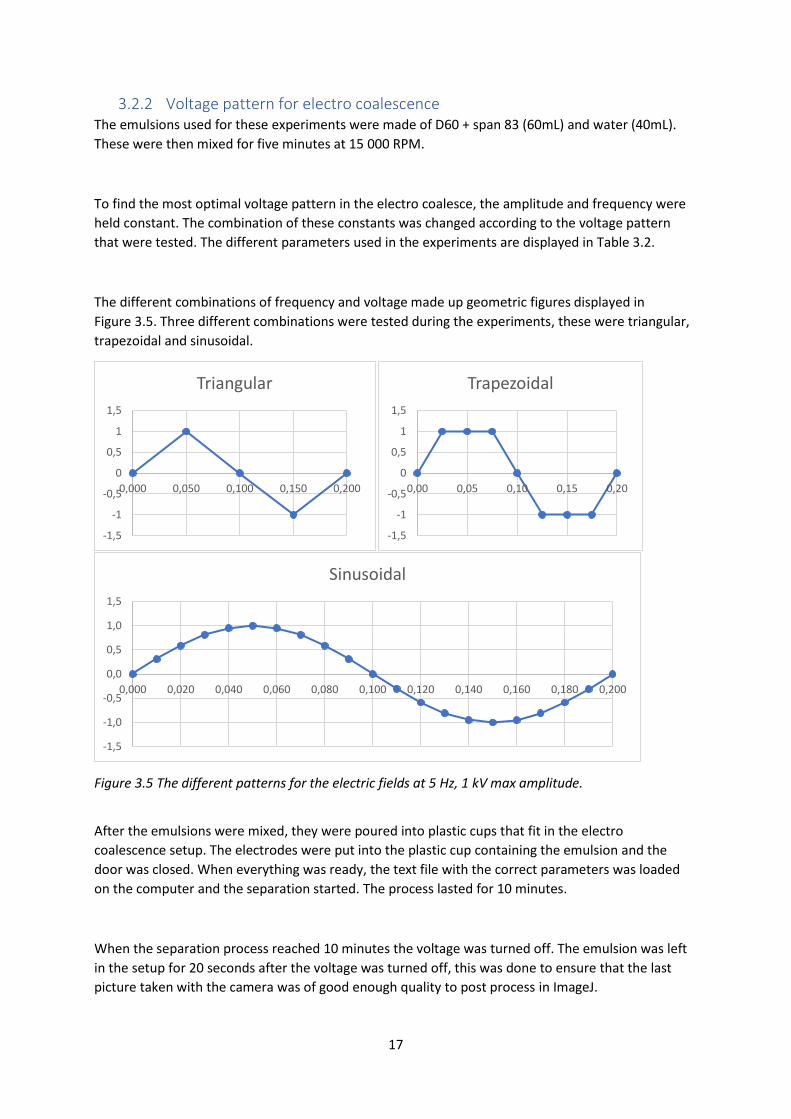
The different combinations of frequency and voltage made up geometric figures displayed in
Figure 3.5. Three different combinations were tested during the experiments, these were triangular,
trapezoidal and sinusoidal.
Figure 3.5 The different patterns for the electric fields at 5 Hz, 1 kV max amplitude.
After the emulsions were mixed, they were poured into plastic cups that fit in the electro
coalescence setup. The electrodes were put into the plastic cup containing the emulsion and the
door was closed. When everything was ready, the text file with the correct parameters was loaded
on the computer and the separation started. The process lasted for 10 minutes.
When the separation process reached 10 minutes the voltage was turned off. The emulsion was left
in the setup for 20 seconds after the voltage was turned off, this was done to ensure that the last
picture taken with the camera was of good enough quality to post process in ImageJ.
-1,5
-1
-0,5
0
0,5
1
1,5
0,000 0,050 0,100 0,150 0,200
Triangular
-1,5
-1
-0,5
0
0,5
1
1,5
0,00 0,05 0,10 0,15 0,20
Trapezoidal
-1,5
-1,0
-0,5
0,0
0,5
1,0
1,5
0,000 0,020 0,040 0,060 0,080 0,100 0,120 0,140 0,160 0,180 0,200
Sinusoidal
18
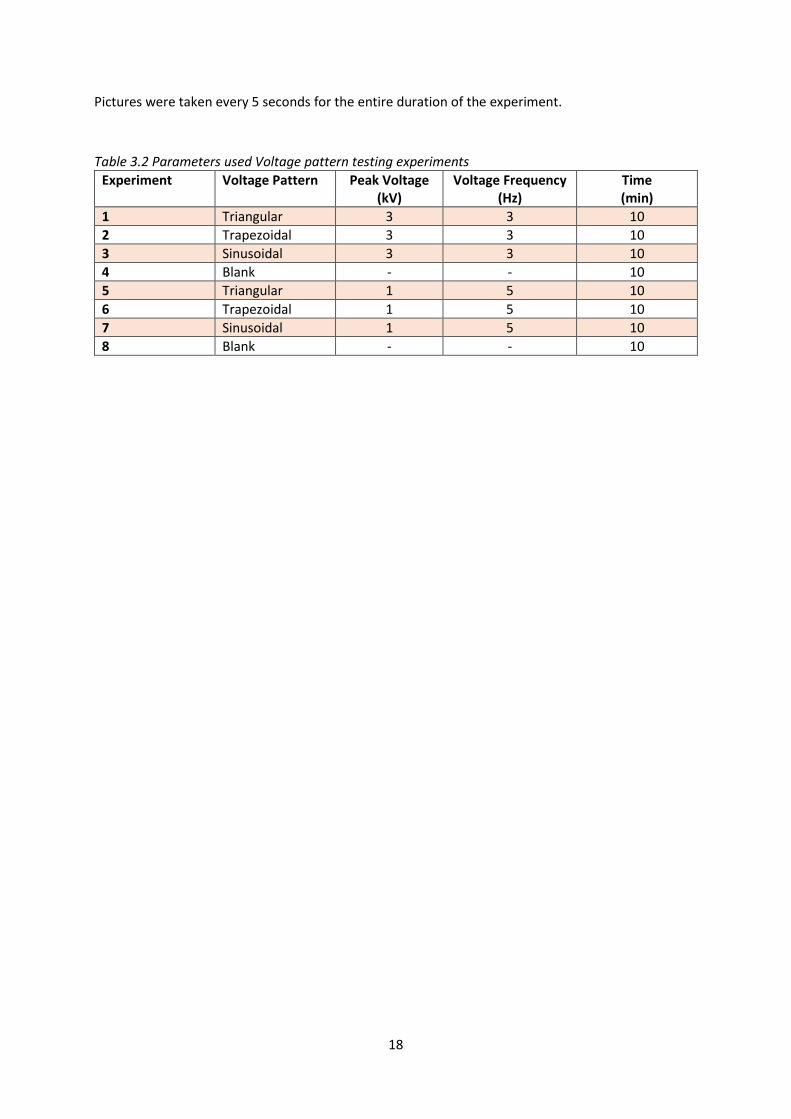
Pictures were taken every 5 seconds for the entire duration of the experiment.
Table 3.2 Parameters used Voltage pattern testing experiments
Experiment Voltage Pattern Peak Voltage (kV)
Voltage Frequency (Hz)
Time (min)
1 Triangular 3 3 10
2 Trapezoidal 3 3 10
3 Sinusoidal 3 3 10
4 Blank - - 10
5 Triangular 1 5 10
6 Trapezoidal 1 5 10
7 Sinusoidal 1 5 10
8 Blank - - 10
19
3.2.3 Frequency and voltage for electro coalescence The emulsions used for this series of experiments were made of D60 + span 83 (60mL) and water
(40mL). These were then mixed for five minutes at 15 000 RPM.
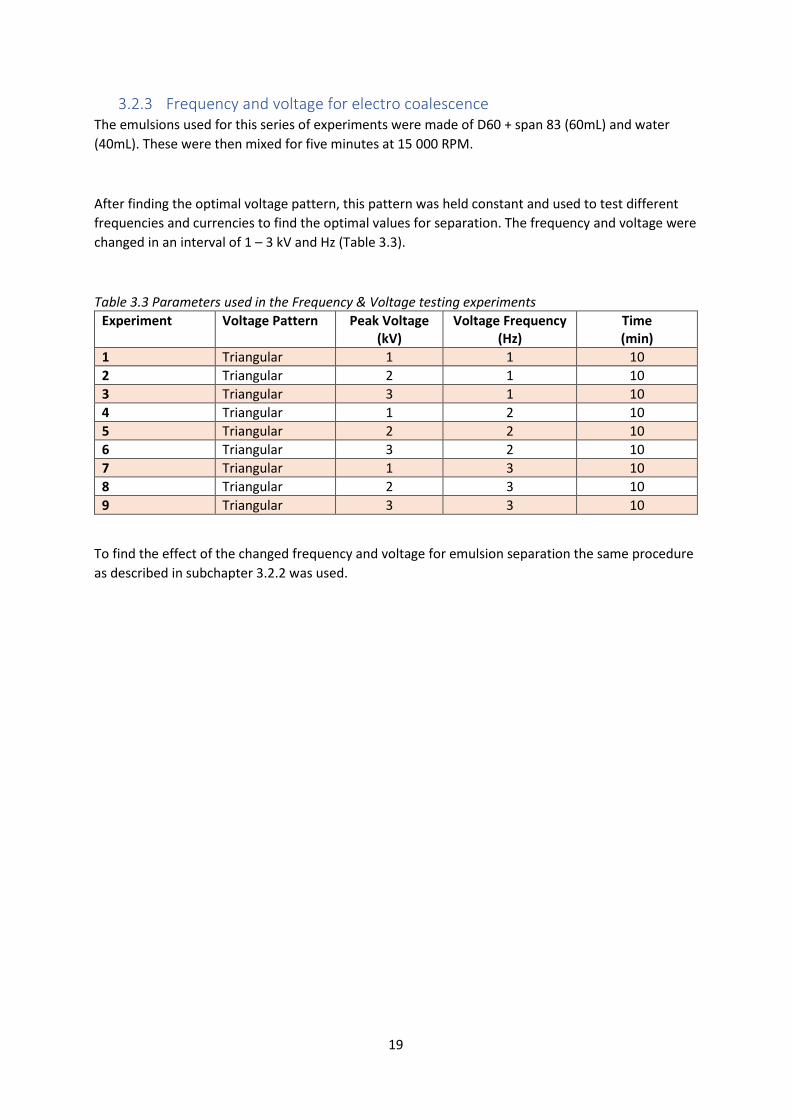
After finding the optimal voltage pattern, this pattern was held constant and used to test different
frequencies and currencies to find the optimal values for separation. The frequency and voltage were
changed in an interval of 1 – 3 kV and Hz (Table 3.3).
Table 3.3 Parameters used in the Frequency & Voltage testing experiments
Experiment Voltage Pattern Peak Voltage (kV)
Voltage Frequency (Hz)
Time (min)
1 Triangular 1 1 10
2 Triangular 2 1 10
3 Triangular 3 1 10
4 Triangular 1 2 10
5 Triangular 2 2 10
6 Triangular 3 2 10
7 Triangular 1 3 10
8 Triangular 2 3 10
9 Triangular 3 3 10
To find the effect of the changed frequency and voltage for emulsion separation the same procedure
as described in subchapter 3.2.2 was used.
20
3.2.4 New parameter A for electro coalescence In this part of the experimental work new parameters with the codename A, B and C were tested for
emulsion separation. These parameters will not be disclosed in this thesis. In this part the focus was
finding an optimum parameter A.
All emulsions separated in this series of experiments were made with WC 40 and asphaltenes
(1000ppm), with a continuous phase consisting of D60 (80%) and Toluene (20%). The mixtures were
stirred for five minutes at 15 000 RPM. These emulsions were used due to a closer resemblance to
crude oil emulsions.
After the emulsions were mixed, they were poured into plastic cups (100mL) that fit in the electro
coalescence setup. The electrodes were put into the plastic cup containing the emulsion and the
door was closed. When everything was ready, the text file with the correct parameters were loaded
on the computer and the separation started.
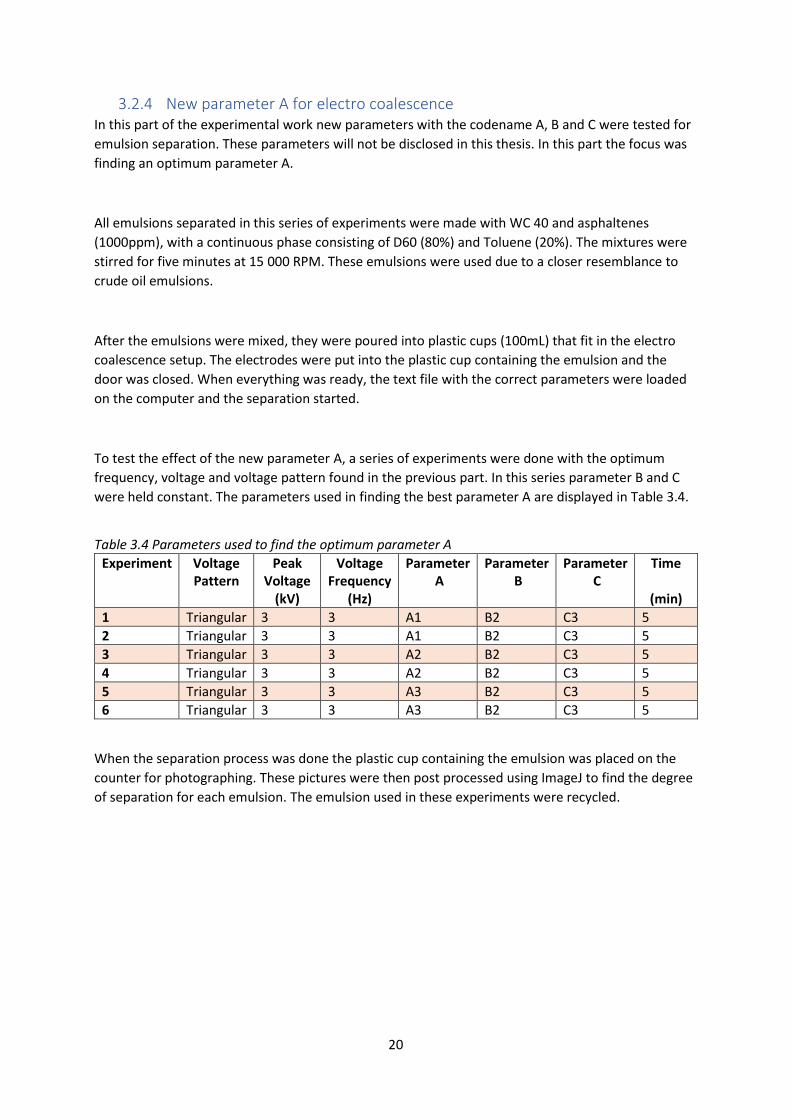
To test the effect of the new parameter A, a series of experiments were done with the optimum
frequency, voltage and voltage pattern found in the previous part. In this series parameter B and C
were held constant. The parameters used in finding the best parameter A are displayed in Table 3.4.
Table 3.4 Parameters used to find the optimum parameter A
Experiment Voltage Pattern
Peak Voltage
(kV)
Voltage Frequency
(Hz)
Parameter A
Parameter B
Parameter C
Time
(min)
1 Triangular 3 3 A1 B2 C3 5
2 Triangular 3 3 A1 B2 C3 5
3 Triangular 3 3 A2 B2 C3 5
4 Triangular 3 3 A2 B2 C3 5
5 Triangular 3 3 A3 B2 C3 5
6 Triangular 3 3 A3 B2 C3 5
When the separation process was done the plastic cup containing the emulsion was placed on the
counter for photographing. These pictures were then post processed using ImageJ to find the degree
of separation for each emulsion. The emulsion used in these experiments were recycled.
21
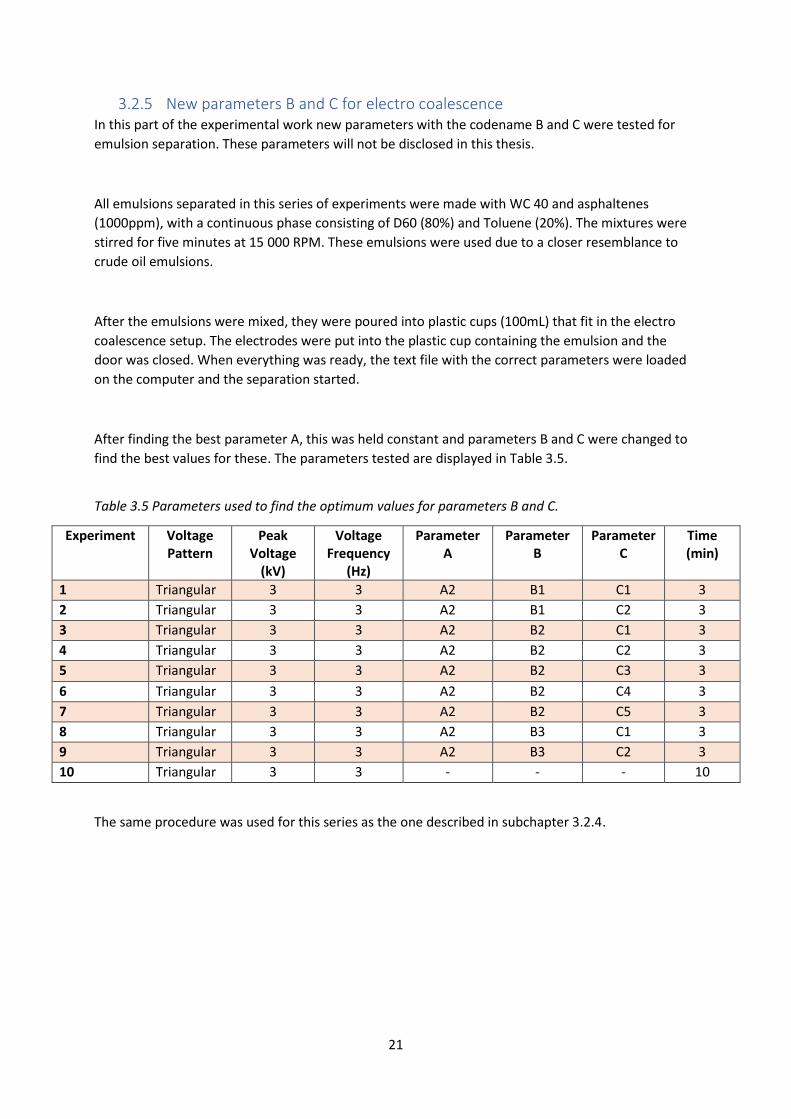
3.2.5 New parameters B and C for electro coalescence In this part of the experimental work new parameters with the codename B and C were tested for
emulsion separation. These parameters will not be disclosed in this thesis.
All emulsions separated in this series of experiments were made with WC 40 and asphaltenes
(1000ppm), with a continuous phase consisting of D60 (80%) and Toluene (20%). The mixtures were
stirred for five minutes at 15 000 RPM. These emulsions were used due to a closer resemblance to
crude oil emulsions.
After the emulsions were mixed, they were poured into plastic cups (100mL) that fit in the electro
coalescence setup. The electrodes were put into the plastic cup containing the emulsion and the
door was closed. When everything was ready, the text file with the correct parameters were loaded
on the computer and the separation started.
After finding the best parameter A, this was held constant and parameters B and C were changed to
find the best values for these. The parameters tested are displayed in Table 3.5.
Table 3.5 Parameters used to find the optimum values for parameters B and C.
The same procedure was used for this series as the one described in subchapter 3.2.4.
Experiment Voltage Pattern
Peak Voltage
(kV)
Voltage Frequency
(Hz)
Parameter A
Parameter B
Parameter C
Time (min)
1 Triangular 3 3 A2 B1 C1 3
2 Triangular 3 3 A2 B1 C2 3
3 Triangular 3 3 A2 B2 C1 3
4 Triangular 3 3 A2 B2 C2 3
5 Triangular 3 3 A2 B2 C3 3
6 Triangular 3 3 A2 B2 C4 3
7 Triangular 3 3 A2 B2 C5 3
8 Triangular 3 3 A2 B3 C1 3
9 Triangular 3 3 A2 B3 C2 3
10 Triangular 3 3 - - - 10
22
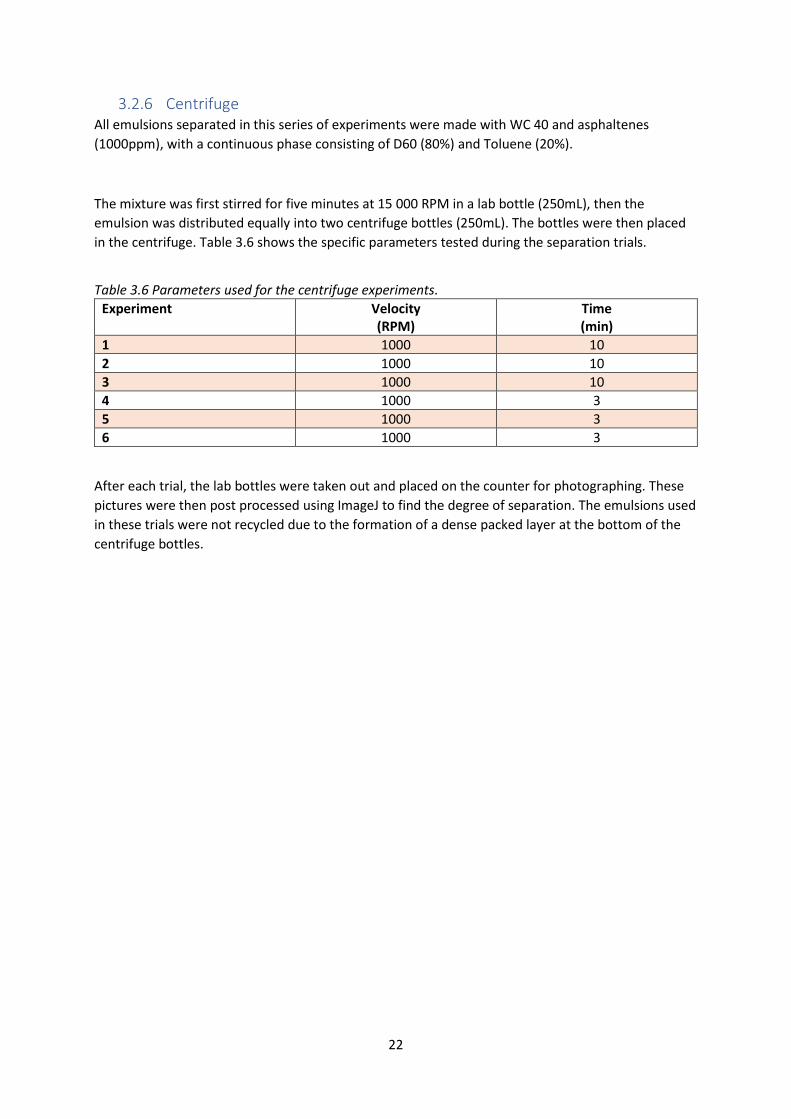
3.2.6 Centrifuge All emulsions separated in this series of experiments were made with WC 40 and asphaltenes
(1000ppm), with a continuous phase consisting of D60 (80%) and Toluene (20%).
The mixture was first stirred for five minutes at 15 000 RPM in a lab bottle (250mL), then the
emulsion was distributed equally into two centrifuge bottles (250mL). The bottles were then placed
in the centrifuge. Table 3.6 shows the specific parameters tested during the separation trials.
Table 3.6 Parameters used for the centrifuge experiments.
Experiment Velocity (RPM)
Time (min)
1 1000 10
2 1000 10
3 1000 10
4 1000 3
5 1000 3
6 1000 3
After each trial, the lab bottles were taken out and placed on the counter for photographing. These
pictures were then post processed using ImageJ to find the degree of separation. The emulsions used
in these trials were not recycled due to the formation of a dense packed layer at the bottom of the
centrifuge bottles.
23
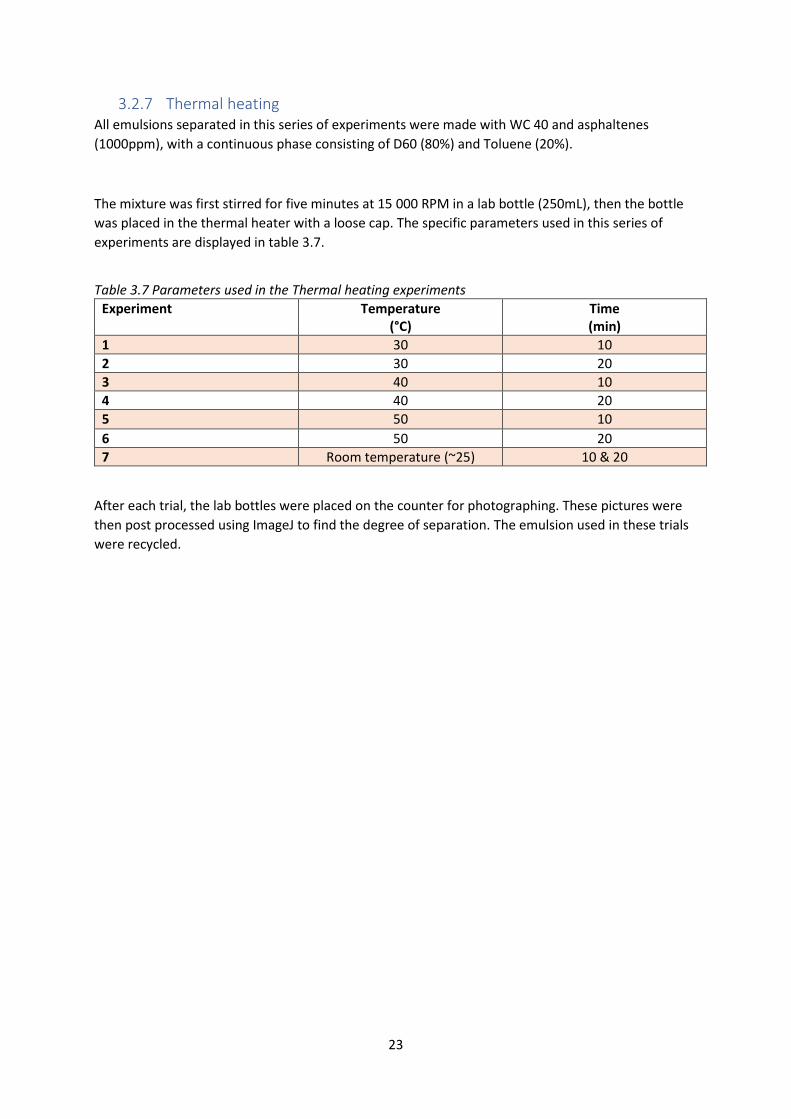
3.2.7 Thermal heating All emulsions separated in this series of experiments were made with WC 40 and asphaltenes
(1000ppm), with a continuous phase consisting of D60 (80%) and Toluene (20%).
The mixture was first stirred for five minutes at 15 000 RPM in a lab bottle (250mL), then the bottle
was placed in the thermal heater with a loose cap. The specific parameters used in this series of
experiments are displayed in table 3.7.
Table 3.7 Parameters used in the Thermal heating experiments
Experiment Temperature (°C)
Time (min)
1 30 10
2 30 20
3 40 10
4 40 20
5 50 10
6 50 20
7 Room temperature (~25) 10 & 20
After each trial, the lab bottles were placed on the counter for photographing. These pictures were
then post processed using ImageJ to find the degree of separation. The emulsion used in these trials
were recycled.
24
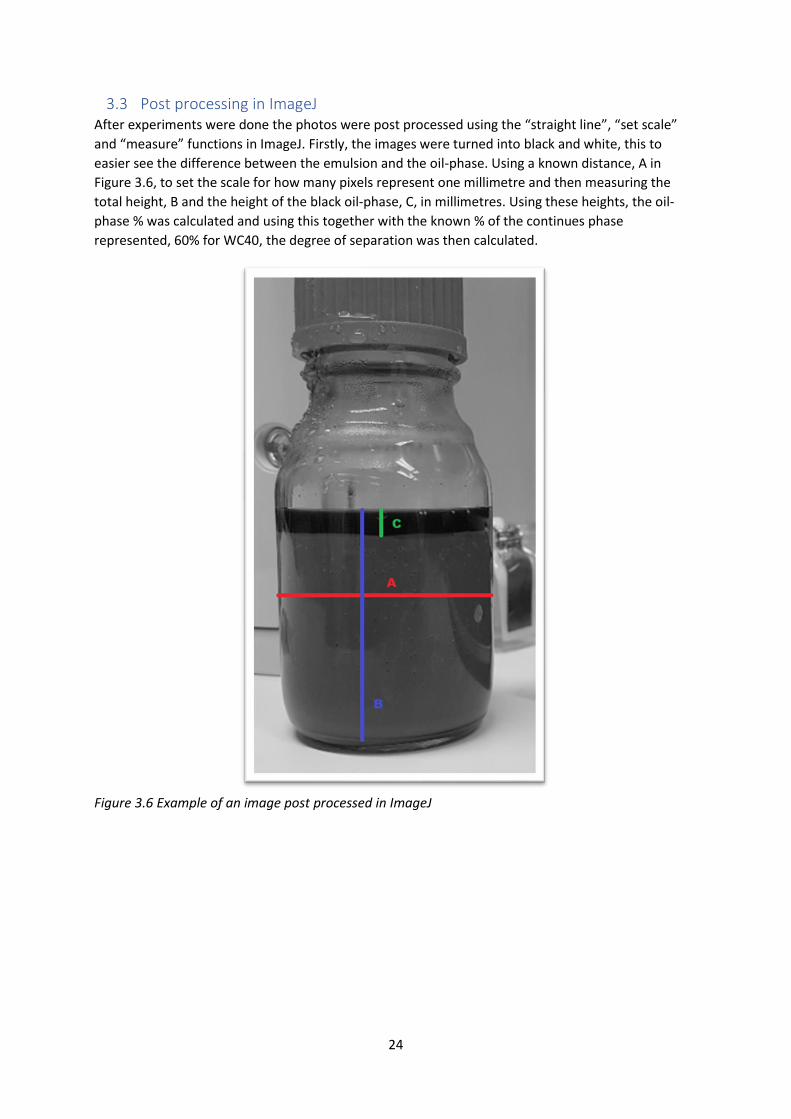
3.3 Post processing in ImageJ After experiments were done the photos were post processed using the “straight line”, “set scale”
and “measure” functions in ImageJ. Firstly, the images were turned into black and white, this to
easier see the difference between the emulsion and the oil-phase. Using a known distance, A in
Figure 3.6, to set the scale for how many pixels represent one millimetre and then measuring the
total height, B and the height of the black oil-phase, C, in millimetres. Using these heights, the oil-
phase % was calculated and using this together with the known % of the continues phase
represented, 60% for WC40, the degree of separation was then calculated.
Figure 3.6 Example of an image post processed in ImageJ
25
4 Results During the experiments the emulsion stability, the separation of water and oil and the efficiency of
the separation techniques were observed. These observations are presented for each experiment in
this chapter. Photographs were also taken for each experiment and these pictures were post
processed using ImageJ. The data gathered from ImageJ are presented as tables in the form of
degree of separation and area separated in pixels and as plots in the form of separated area as a
function of time.
Due to limited time all the results have not been processed and presented in this chapter and some
of the planned experiments were not executed due to the Covid-19 pandemic.
26
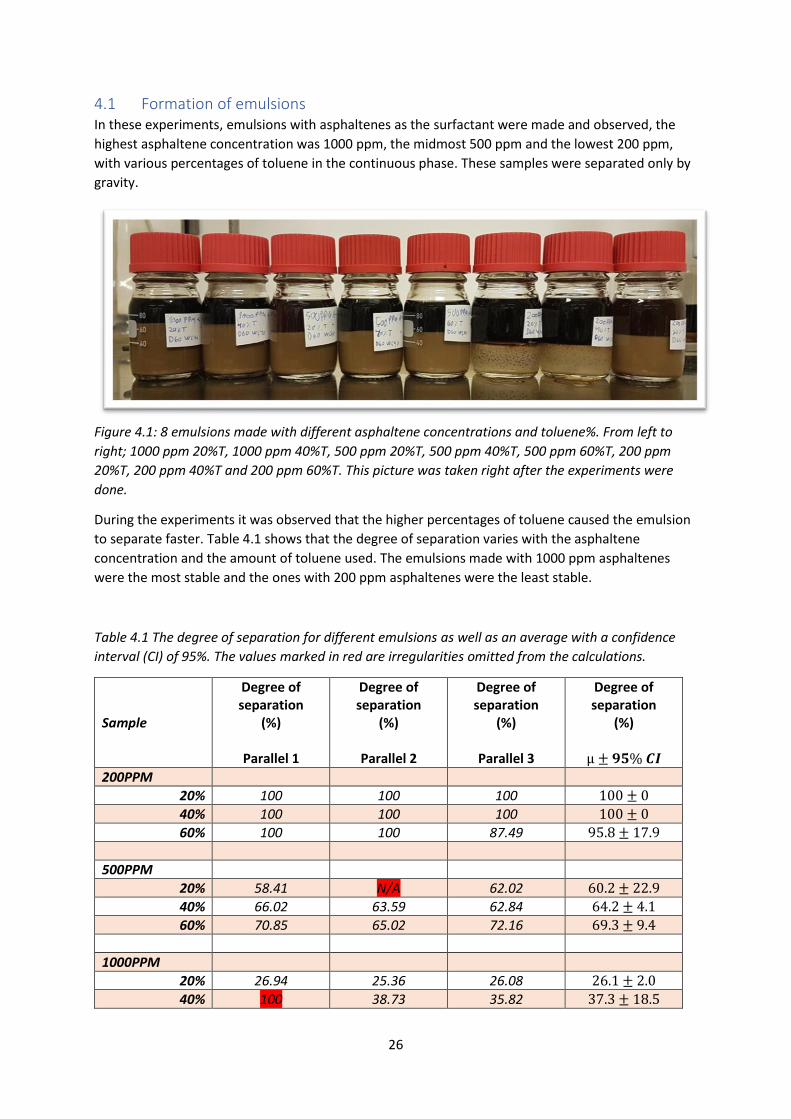
4.1 Formation of emulsions In these experiments, emulsions with asphaltenes as the surfactant were made and observed, the
highest asphaltene concentration was 1000 ppm, the midmost 500 ppm and the lowest 200 ppm,
with various percentages of toluene in the continuous phase. These samples were separated only by
gravity.
Figure 4.1: 8 emulsions made with different asphaltene concentrations and toluene%. From left to
right; 1000 ppm 20%T, 1000 ppm 40%T, 500 ppm 20%T, 500 ppm 40%T, 500 ppm 60%T, 200 ppm
20%T, 200 ppm 40%T and 200 ppm 60%T. This picture was taken right after the experiments were
done.
During the experiments it was observed that the higher percentages of toluene caused the emulsion
to separate faster. Table 4.1 shows that the degree of separation varies with the asphaltene
concentration and the amount of toluene used. The emulsions made with 1000 ppm asphaltenes
were the most stable and the ones with 200 ppm asphaltenes were the least stable.
Table 4.1 The degree of separation for different emulsions as well as an average with a confidence
interval (CI) of 95%. The values marked in red are irregularities omitted from the calculations.
Sample
Degree of separation
(%)
Parallel 1
Degree of separation
(%)
Parallel 2
Degree of separation
(%)
Parallel 3
Degree of separation
(%)
µ ± 𝟗𝟓% 𝑪𝑰
200PPM
20% 100 100 100 100 ± 0
40% 100 100 100 100 ± 0
60% 100 100 87.49 95.8 ± 17.9
500PPM
20% 58.41 N/A 62.02 60.2 ± 22.9
40% 66.02 63.59 62.84 64.2 ± 4.1
60% 70.85 65.02 72.16 69.3 ± 9.4
1000PPM
20% 26.94 25.36 26.08 26.1 ± 2.0
40% 100 38.73 35.82 37.3 ± 18.5
27
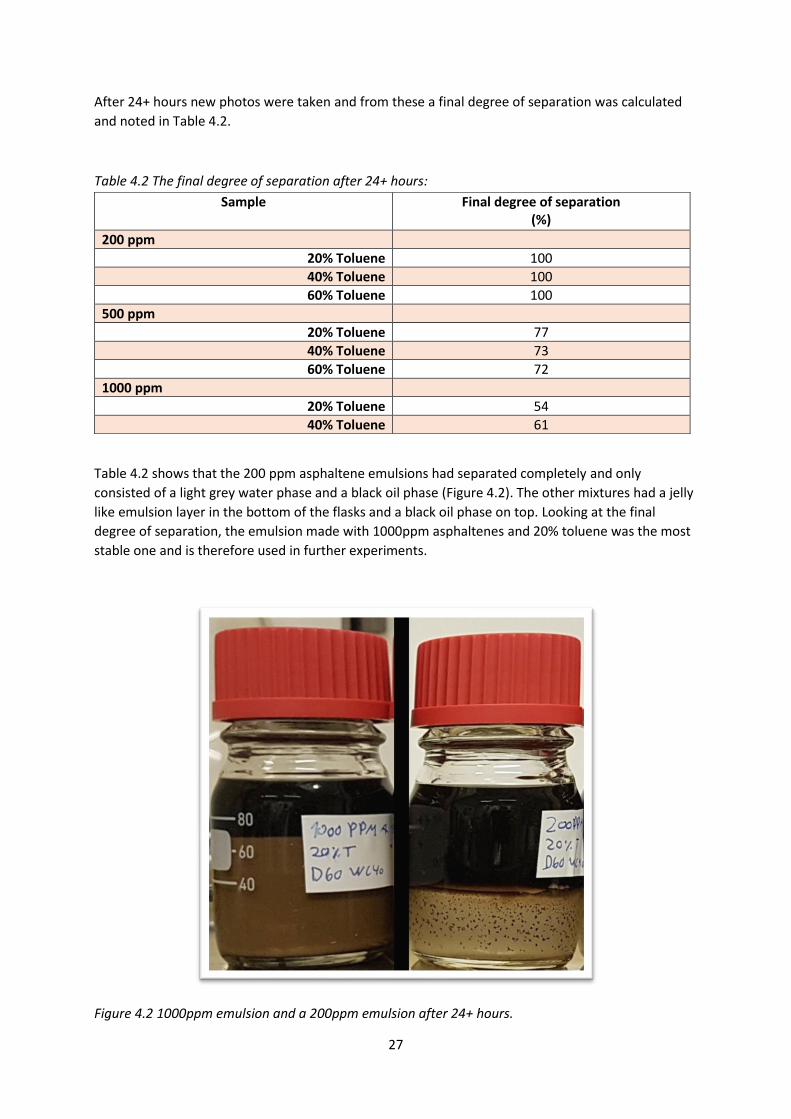
After 24+ hours new photos were taken and from these a final degree of separation was calculated
and noted in Table 4.2.
Table 4.2 The final degree of separation after 24+ hours:
Table 4.2 shows that the 200 ppm asphaltene emulsions had separated completely and only
consisted of a light grey water phase and a black oil phase (Figure 4.2). The other mixtures had a jelly
like emulsion layer in the bottom of the flasks and a black oil phase on top. Looking at the final
degree of separation, the emulsion made with 1000ppm asphaltenes and 20% toluene was the most
stable one and is therefore used in further experiments.
Figure 4.2 1000ppm emulsion and a 200ppm emulsion after 24+ hours.
Sample Final degree of separation (%)
200 ppm
20% Toluene 100
40% Toluene 100
60% Toluene 100
500 ppm
20% Toluene 77
40% Toluene 73
60% Toluene 72
1000 ppm
20% Toluene 54
40% Toluene 61
28
4.2 Electro coalescence
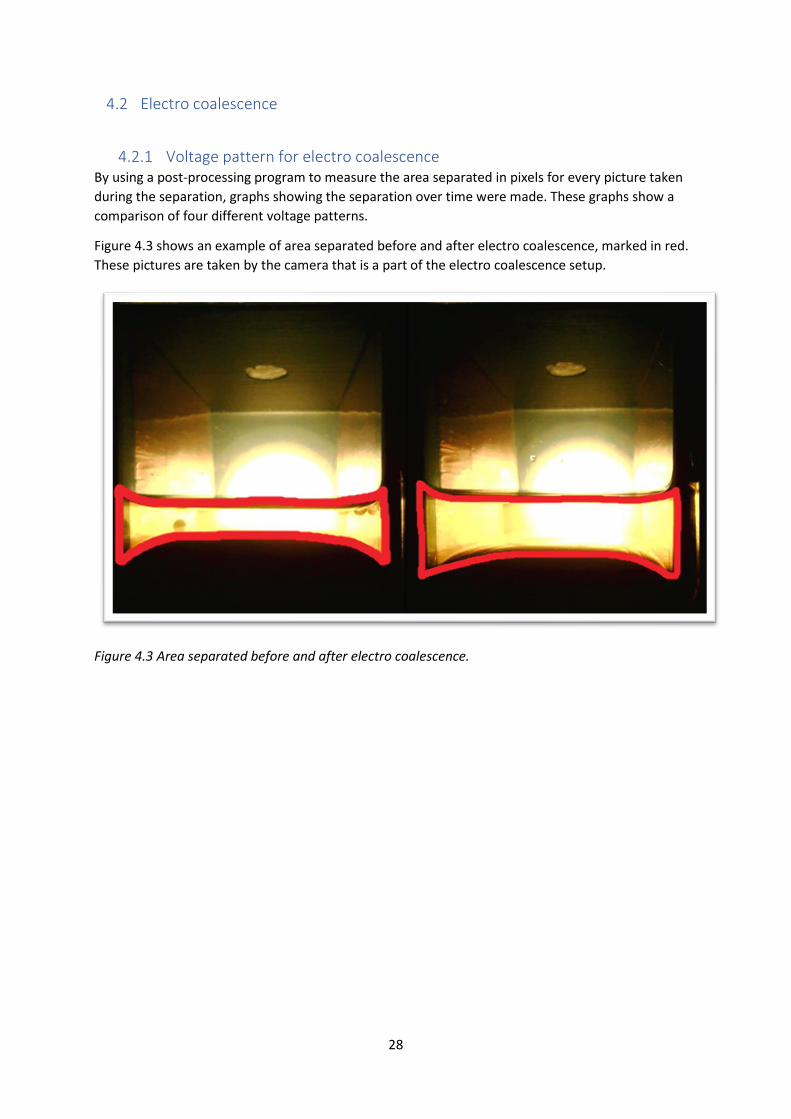
4.2.1 Voltage pattern for electro coalescence By using a post-processing program to measure the area separated in pixels for every picture taken
during the separation, graphs showing the separation over time were made. These graphs show a
comparison of four different voltage patterns.
Figure 4.3 shows an example of area separated before and after electro coalescence, marked in red.
These pictures are taken by the camera that is a part of the electro coalescence setup.
Figure 4.3 Area separated before and after electro coalescence.
29
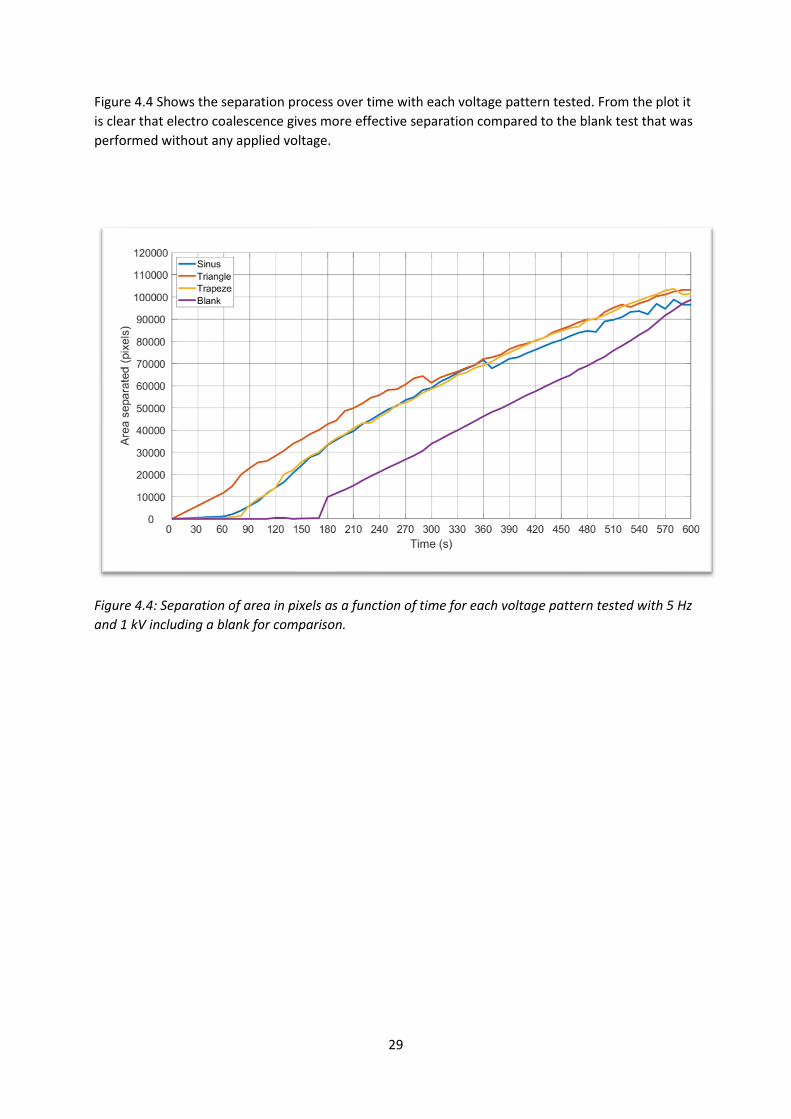
Figure 4.4 Shows the separation process over time with each voltage pattern tested. From the plot it
is clear that electro coalescence gives more effective separation compared to the blank test that was
performed without any applied voltage.
Figure 4.4: Separation of area in pixels as a function of time for each voltage pattern tested with 5 Hz
and 1 kV including a blank for comparison.
30
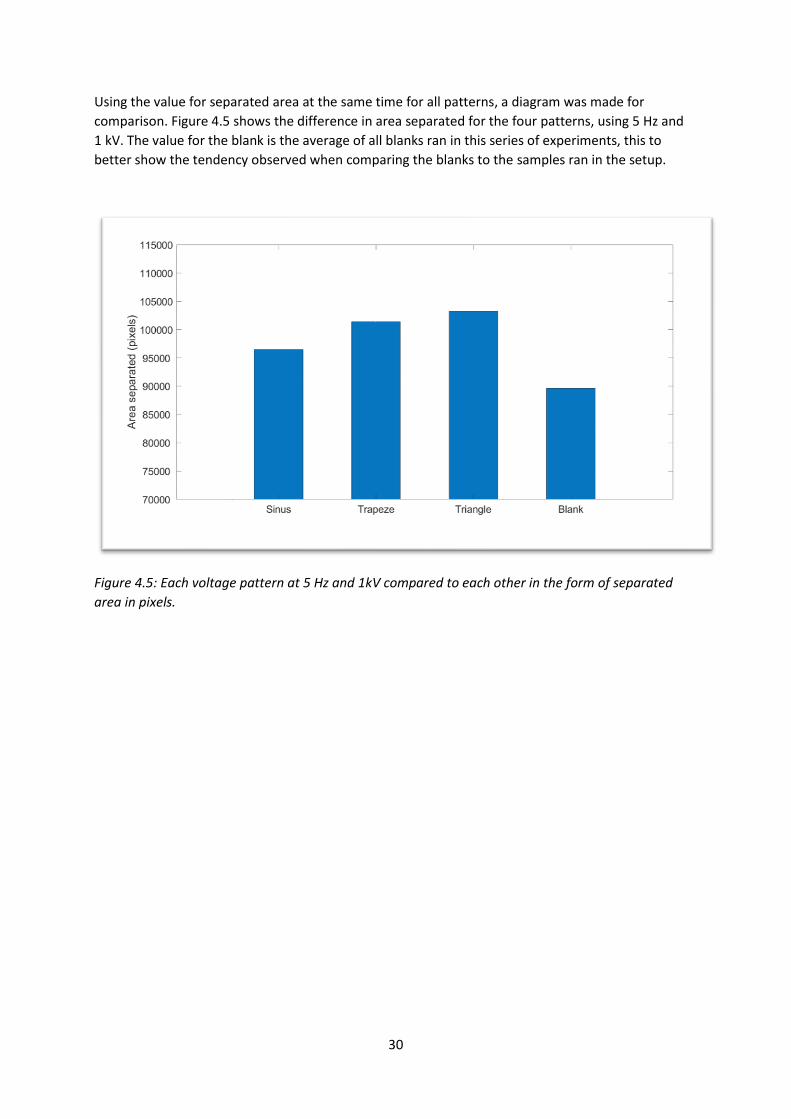
Using the value for separated area at the same time for all patterns, a diagram was made for
comparison. Figure 4.5 shows the difference in area separated for the four patterns, using 5 Hz and
1 kV. The value for the blank is the average of all blanks ran in this series of experiments, this to
better show the tendency observed when comparing the blanks to the samples ran in the setup.
Figure 4.5: Each voltage pattern at 5 Hz and 1kV compared to each other in the form of separated
area in pixels.
31
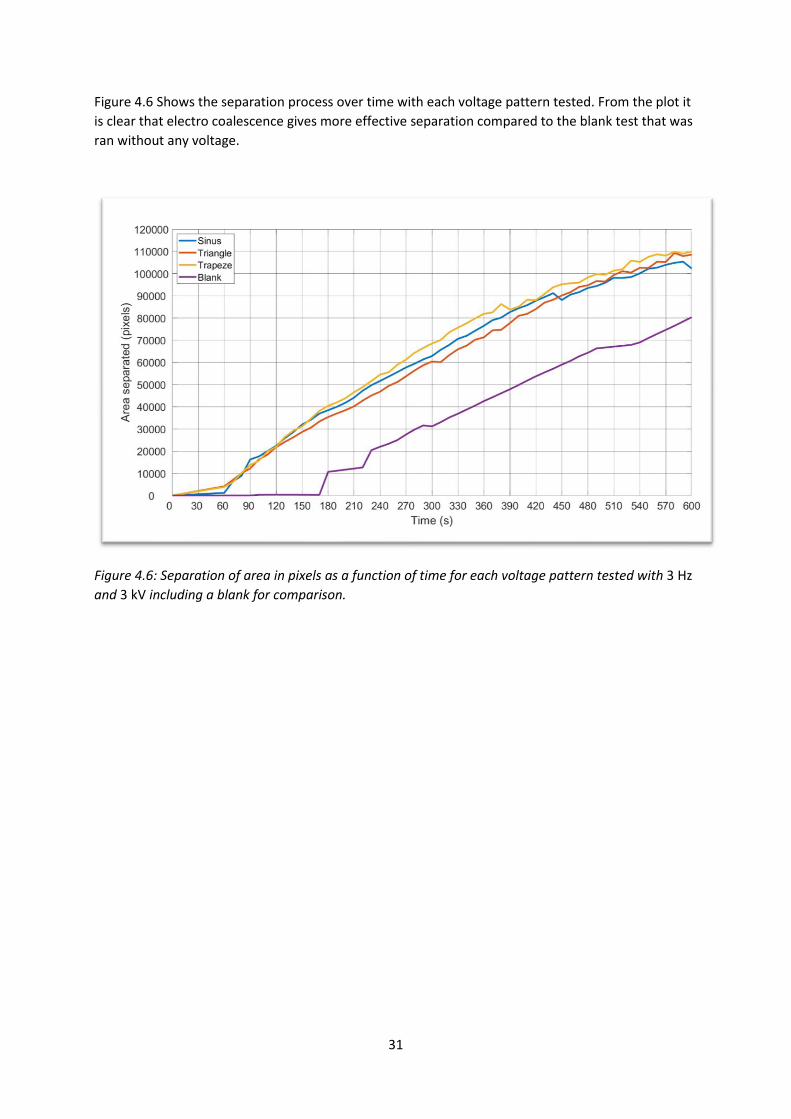
Figure 4.6 Shows the separation process over time with each voltage pattern tested. From the plot it
is clear that electro coalescence gives more effective separation compared to the blank test that was
ran without any voltage.
Figure 4.6: Separation of area in pixels as a function of time for each voltage pattern tested with 3 Hz
and 3 kV including a blank for comparison.
32
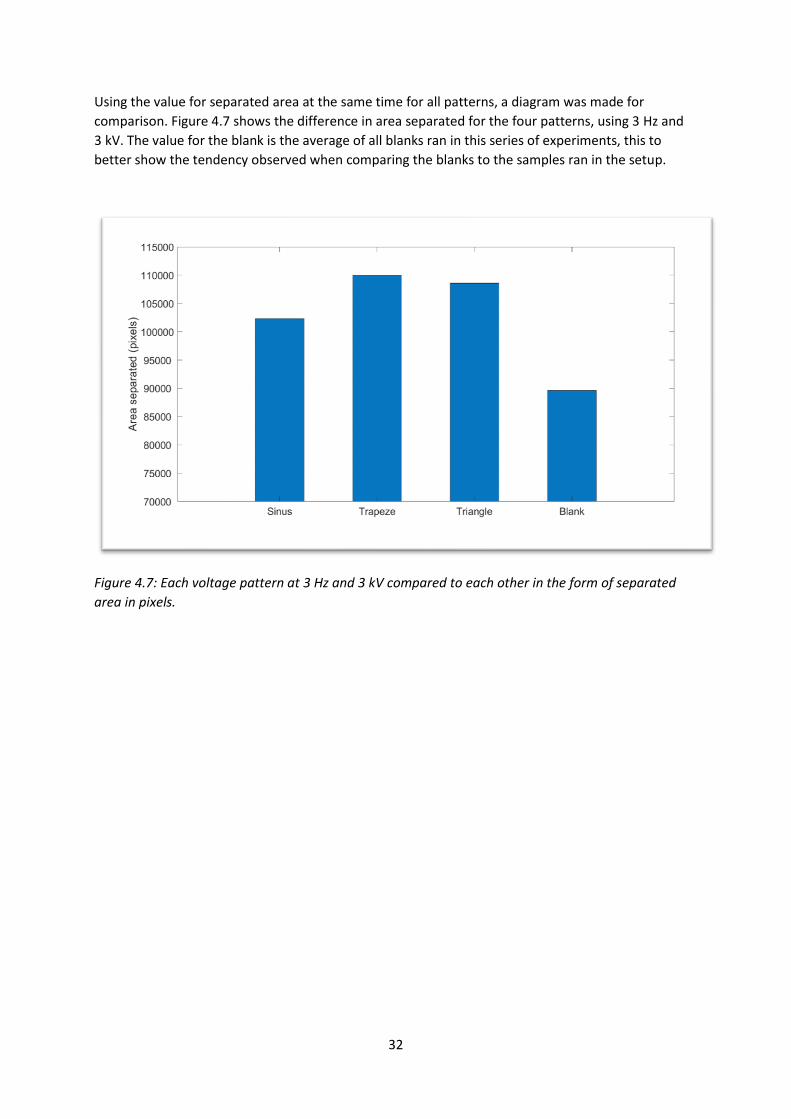
Using the value for separated area at the same time for all patterns, a diagram was made for
comparison. Figure 4.7 shows the difference in area separated for the four patterns, using 3 Hz and
3 kV. The value for the blank is the average of all blanks ran in this series of experiments, this to
better show the tendency observed when comparing the blanks to the samples ran in the setup.
Figure 4.7: Each voltage pattern at 3 Hz and 3 kV compared to each other in the form of separated
area in pixels.
33
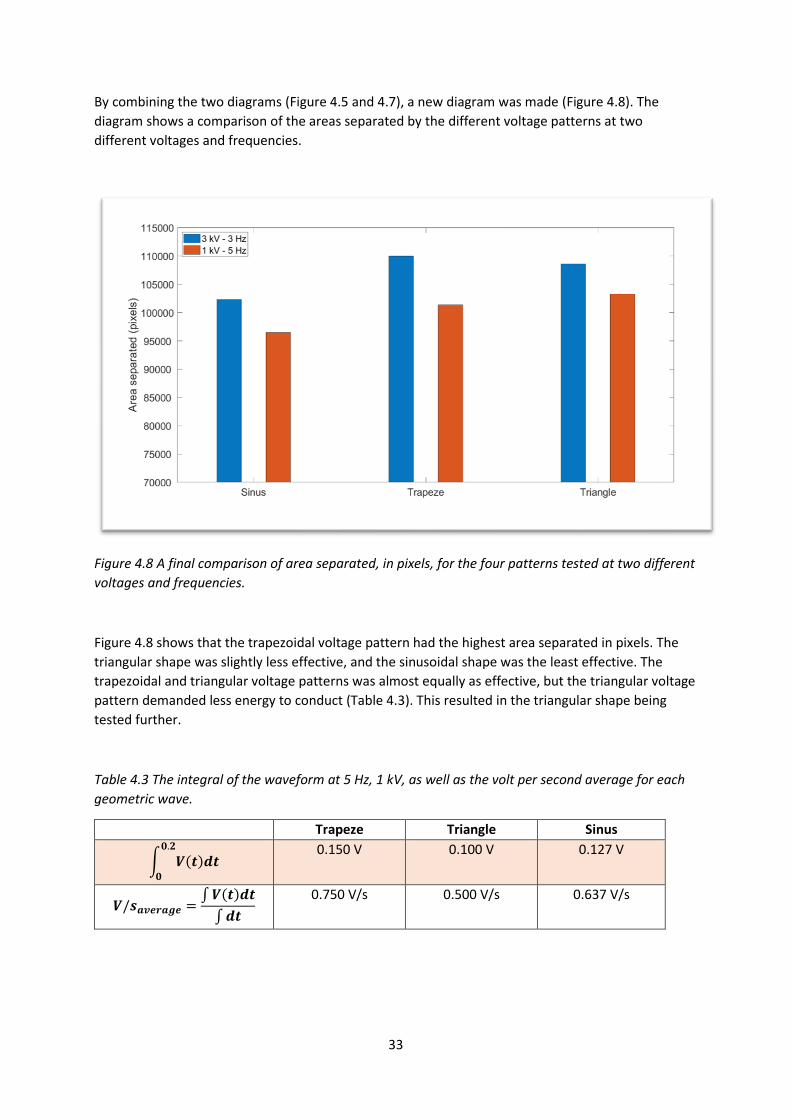
By combining the two diagrams (Figure 4.5 and 4.7), a new diagram was made (Figure 4.8). The
diagram shows a comparison of the areas separated by the different voltage patterns at two
different voltages and frequencies.
Figure 4.8 A final comparison of area separated, in pixels, for the four patterns tested at two different
voltages and frequencies.
Figure 4.8 shows that the trapezoidal voltage pattern had the highest area separated in pixels. The
triangular shape was slightly less effective, and the sinusoidal shape was the least effective. The
trapezoidal and triangular voltage patterns was almost equally as effective, but the triangular voltage
pattern demanded less energy to conduct (Table 4.3). This resulted in the triangular shape being
tested further.
Table 4.3 The integral of the waveform at 5 Hz, 1 kV, as well as the volt per second average for each
geometric wave.
Trapeze Triangle Sinus
∫ 𝑽(𝒕)𝒅𝒕𝟎.𝟐
𝟎
0.150 V 0.100 V 0.127 V
𝑽/𝒔𝒂𝒗𝒆𝒓𝒂𝒈𝒆 =∫ 𝑽(𝒕)𝒅𝒕
∫ 𝒅𝒕
0.750 V/s 0.500 V/s 0.637 V/s
34
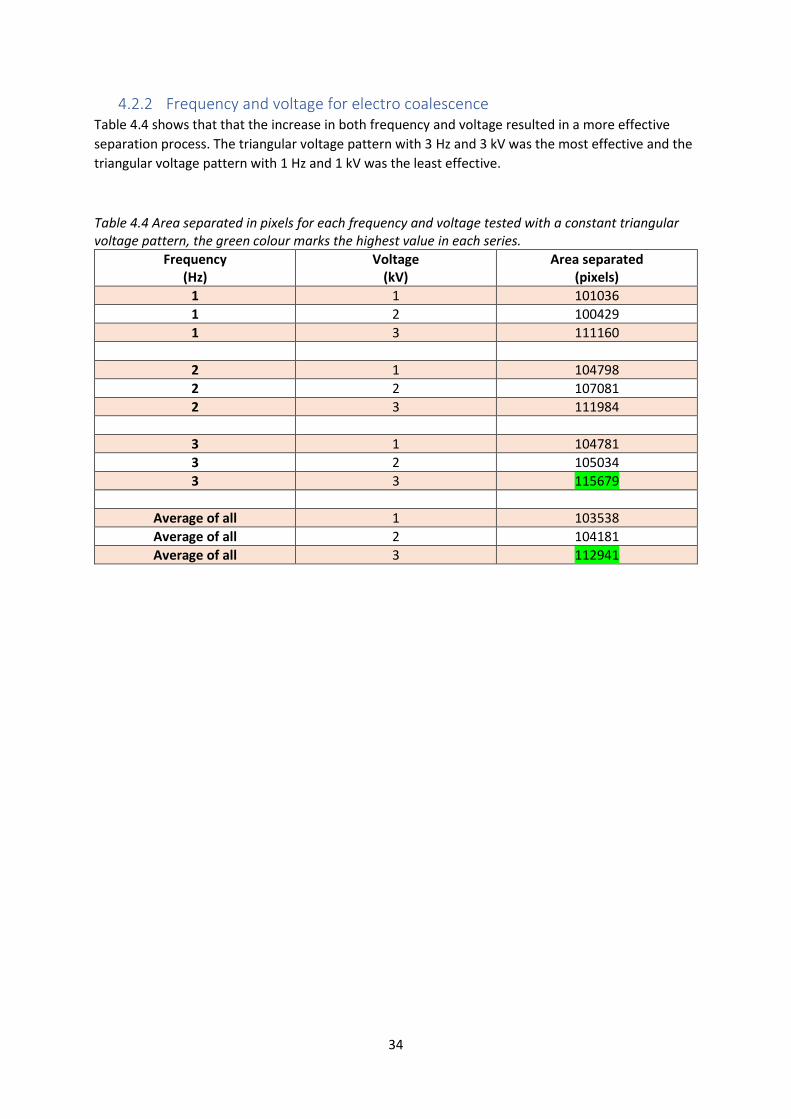
4.2.2 Frequency and voltage for electro coalescence Table 4.4 shows that that the increase in both frequency and voltage resulted in a more effective
separation process. The triangular voltage pattern with 3 Hz and 3 kV was the most effective and the
triangular voltage pattern with 1 Hz and 1 kV was the least effective.
Table 4.4 Area separated in pixels for each frequency and voltage tested with a constant triangular voltage pattern, the green colour marks the highest value in each series.
Frequency (Hz)
Voltage (kV)
Area separated (pixels)
1 1 101036
1 2 100429
1 3 111160
2 1 104798
2 2 107081
2 3 111984
3 1 104781
3 2 105034
3 3 115679
Average of all 1 103538
Average of all 2 104181
Average of all 3 112941
35
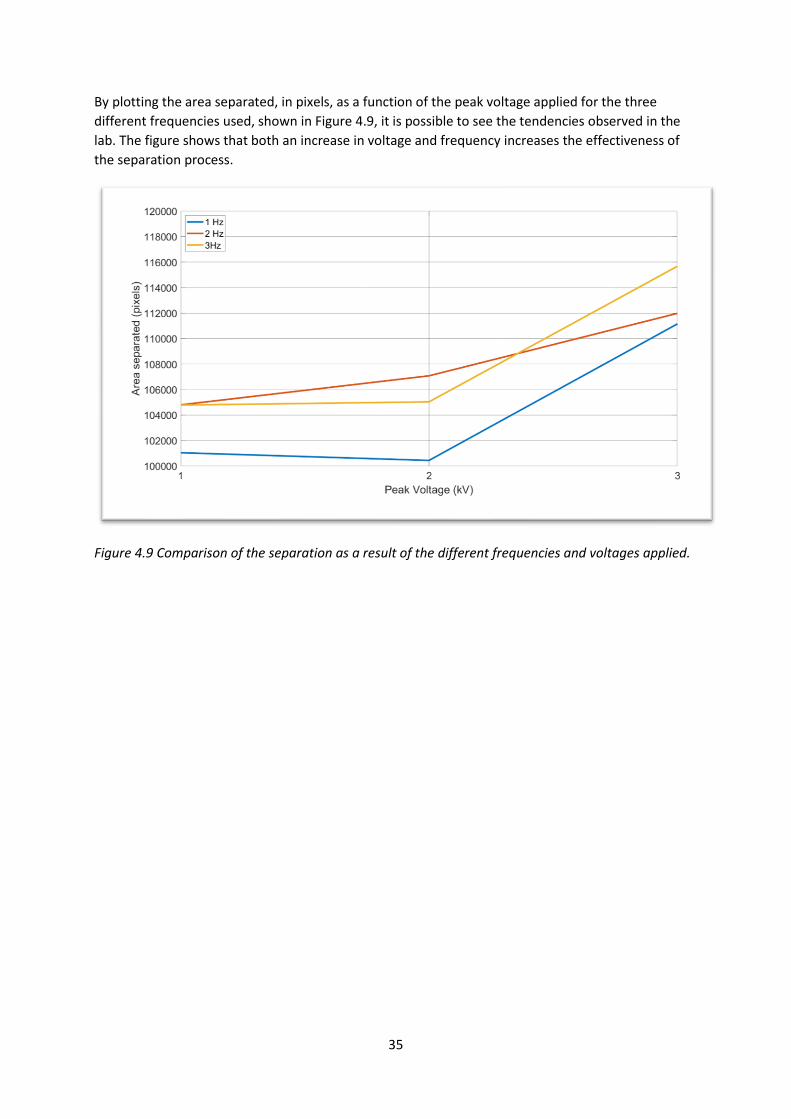
By plotting the area separated, in pixels, as a function of the peak voltage applied for the three
different frequencies used, shown in Figure 4.9, it is possible to see the tendencies observed in the
lab. The figure shows that both an increase in voltage and frequency increases the effectiveness of
the separation process.
Figure 4.9 Comparison of the separation as a result of the different frequencies and voltages applied.
36
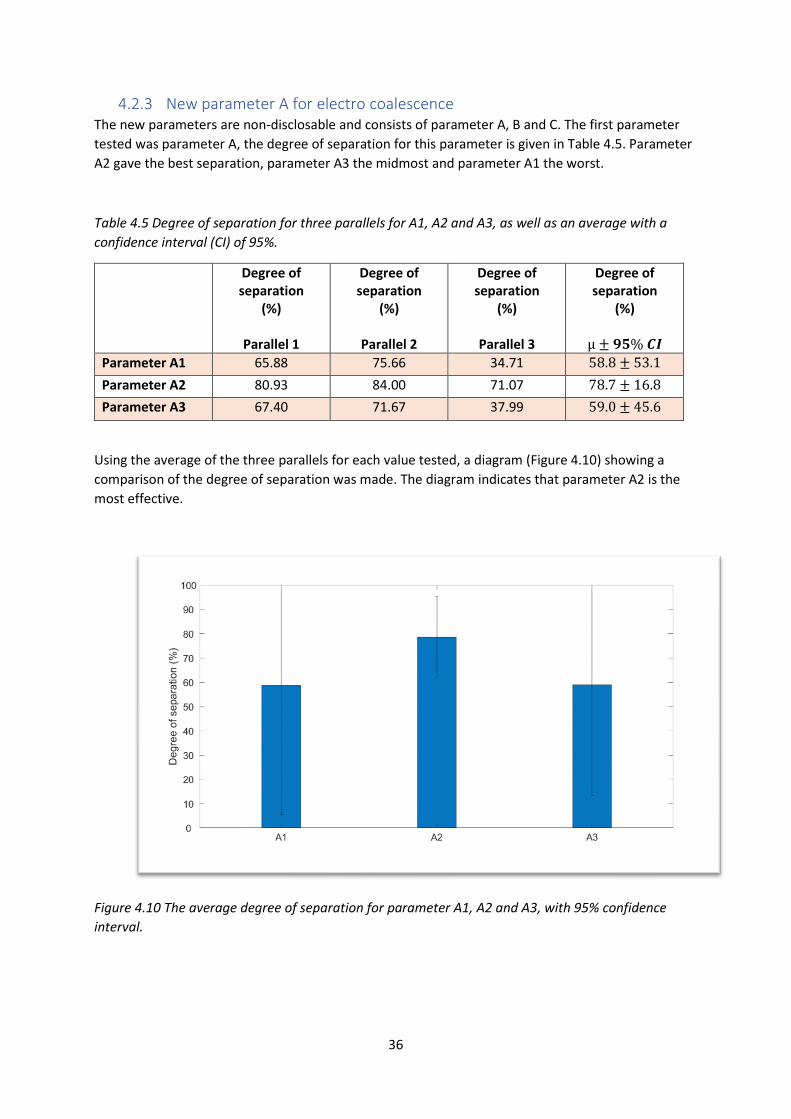
4.2.3 New parameter A for electro coalescence The new parameters are non-disclosable and consists of parameter A, B and C. The first parameter
tested was parameter A, the degree of separation for this parameter is given in Table 4.5. Parameter
A2 gave the best separation, parameter A3 the midmost and parameter A1 the worst.
Table 4.5 Degree of separation for three parallels for A1, A2 and A3, as well as an average with a
confidence interval (CI) of 95%.
Degree of separation
(%)
Parallel 1
Degree of separation
(%)
Parallel 2
Degree of separation
(%)
Parallel 3
Degree of separation
(%)
µ ± 𝟗𝟓% 𝑪𝑰
Parameter A1 65.88 75.66 34.71 58.8 ± 53.1
Parameter A2 80.93 84.00 71.07 78.7 ± 16.8
Parameter A3 67.40 71.67 37.99 59.0 ± 45.6
Using the average of the three parallels for each value tested, a diagram (Figure 4.10) showing a
comparison of the degree of separation was made. The diagram indicates that parameter A2 is the
most effective.
Figure 4.10 The average degree of separation for parameter A1, A2 and A3, with 95% confidence
interval.
37
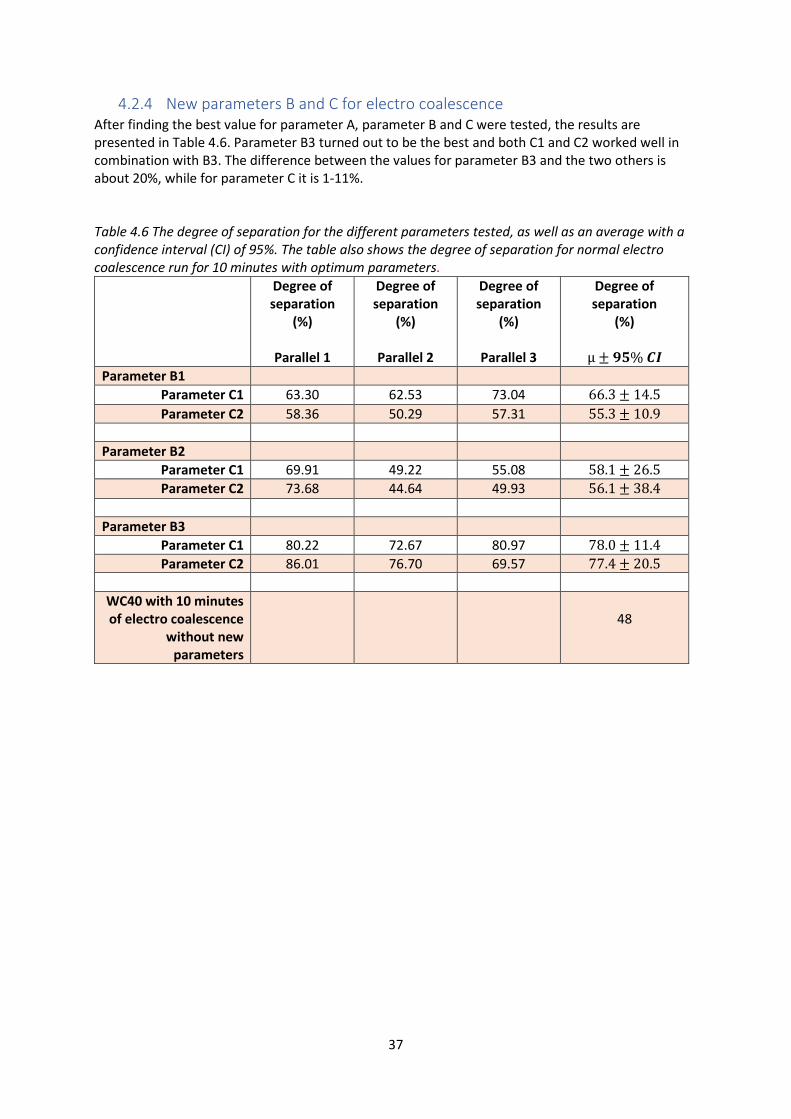
4.2.4 New parameters B and C for electro coalescence After finding the best value for parameter A, parameter B and C were tested, the results are presented in Table 4.6. Parameter B3 turned out to be the best and both C1 and C2 worked well in combination with B3. The difference between the values for parameter B3 and the two others is about 20%, while for parameter C it is 1-11%. Table 4.6 The degree of separation for the different parameters tested, as well as an average with a confidence interval (CI) of 95%. The table also shows the degree of separation for normal electro coalescence run for 10 minutes with optimum parameters.
Degree of separation
(%)
Parallel 1
Degree of separation
(%)
Parallel 2
Degree of separation
(%)
Parallel 3
Degree of separation
(%)
µ ± 𝟗𝟓% 𝑪𝑰
Parameter B1
Parameter C1 63.30 62.53 73.04 66.3 ± 14.5
Parameter C2 58.36 50.29 57.31 55.3 ± 10.9
Parameter B2
Parameter C1 69.91 49.22 55.08 58.1 ± 26.5
Parameter C2 73.68 44.64 49.93 56.1 ± 38.4
Parameter B3
Parameter C1 80.22 72.67 80.97 78.0 ± 11.4
Parameter C2 86.01 76.70 69.57 77.4 ± 20.5
WC40 with 10 minutes of electro coalescence
without new parameters
48
38
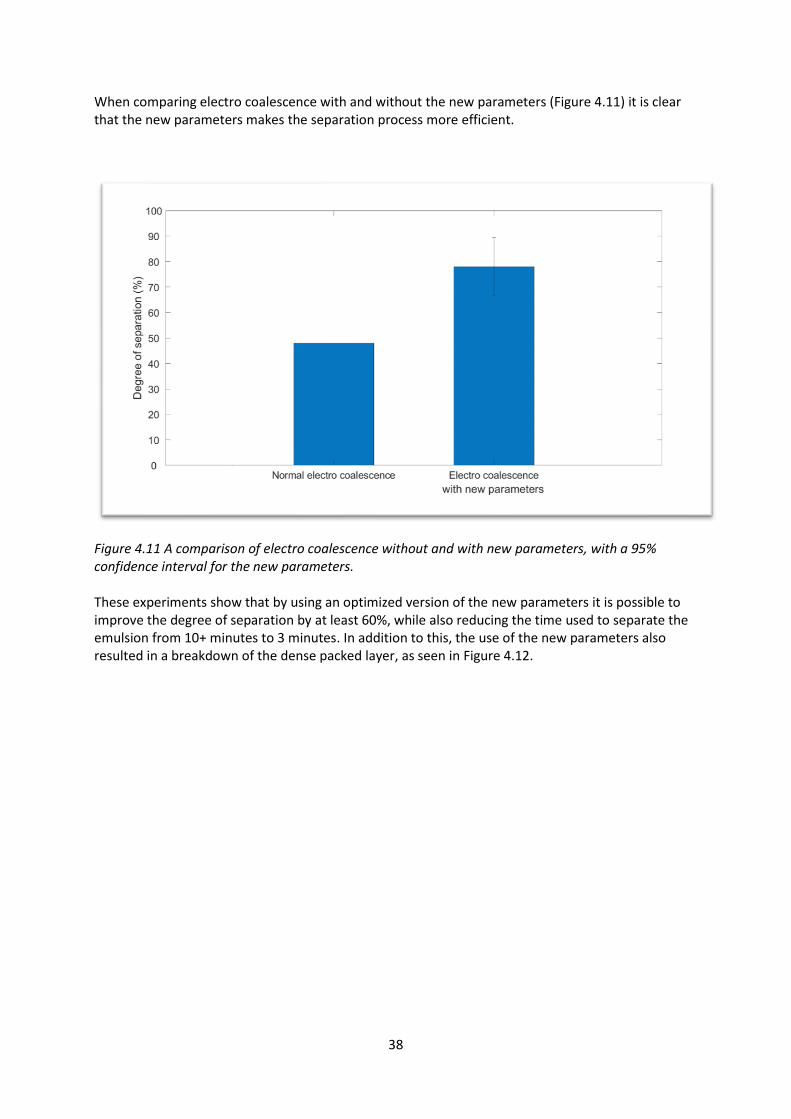
When comparing electro coalescence with and without the new parameters (Figure 4.11) it is clear that the new parameters makes the separation process more efficient.
Figure 4.11 A comparison of electro coalescence without and with new parameters, with a 95% confidence interval for the new parameters. These experiments show that by using an optimized version of the new parameters it is possible to improve the degree of separation by at least 60%, while also reducing the time used to separate the emulsion from 10+ minutes to 3 minutes. In addition to this, the use of the new parameters also resulted in a breakdown of the dense packed layer, as seen in Figure 4.12.
39
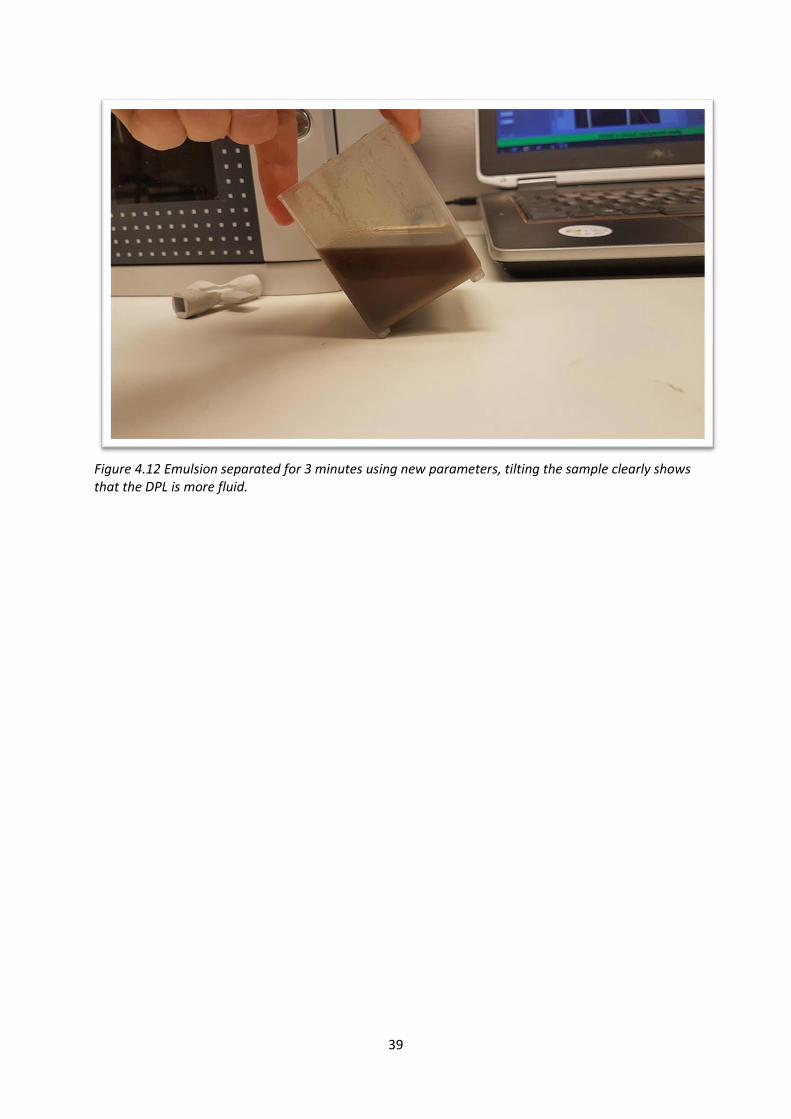
Figure 4.12 Emulsion separated for 3 minutes using new parameters, tilting the sample clearly shows that the DPL is more fluid.
40
4.3 Centrifuge After 10 minutes at 1000 RPM in the centrifuge almost all the oil had separated out of the emulsion, but the process also leads to the formation of a dense packed layer in the bottom of the flasks. This dense packed layer was solid and made it impossible to separate out the remaining oil in the emulsion. Table 4.7 shows the degree of separation for the centrifuge after 3 and 10 minutes ran at 1000RPM. Table 4.7 Comparison of centrifugation at 1000 RPM for 10 minutes, 3 minutes showing the degree of separation as well as an average with a confidence interval (CI) of 95%. The table also shows a blank after 20 minutes.
Degree of separation
(%)
Parallel 1
Degree of separation
(%)
Parallel 2
Degree of separation
(%)
Parallel 3
Degree of separation
(%)
µ ± 𝟗𝟓% 𝑪𝑰
1000RPM
10 minutes 88.28 86.33 87.51 87.4 ± 2.4
3 minutes 81.66 76.40 82.23 80.1 ± 8.0
Blank 20
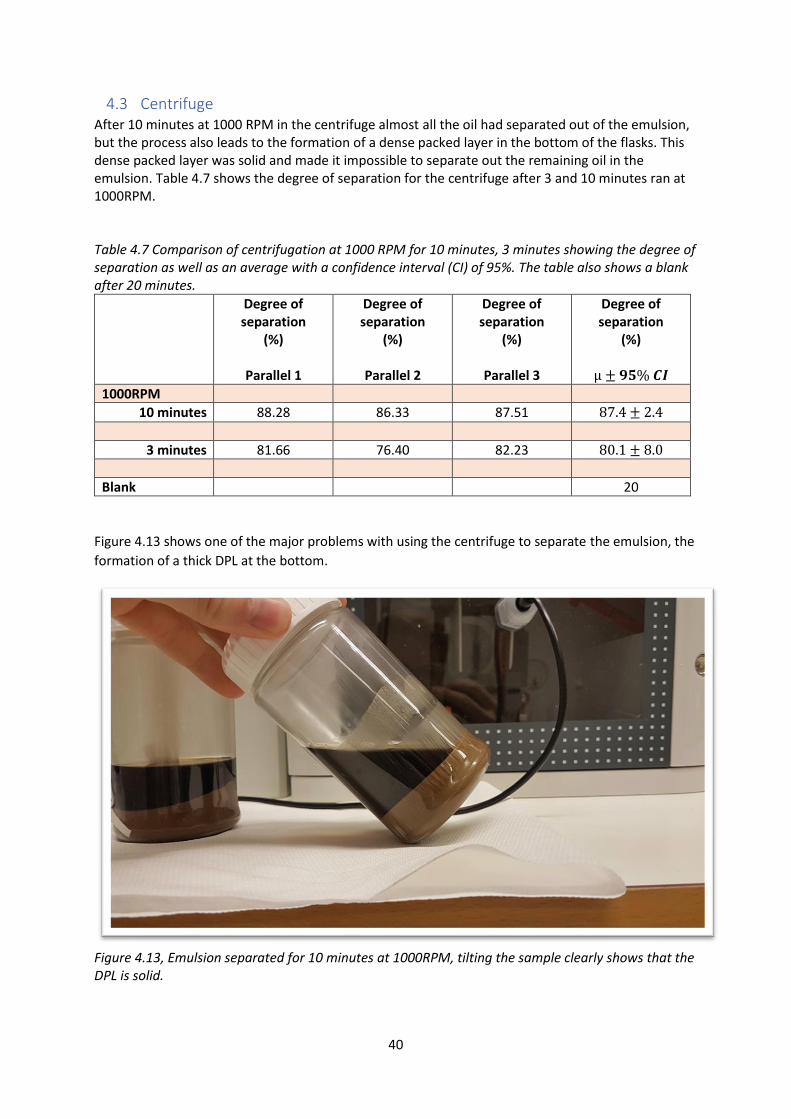
Figure 4.13 shows one of the major problems with using the centrifuge to separate the emulsion, the
formation of a thick DPL at the bottom.
Figure 4.13, Emulsion separated for 10 minutes at 1000RPM, tilting the sample clearly shows that the DPL is solid.
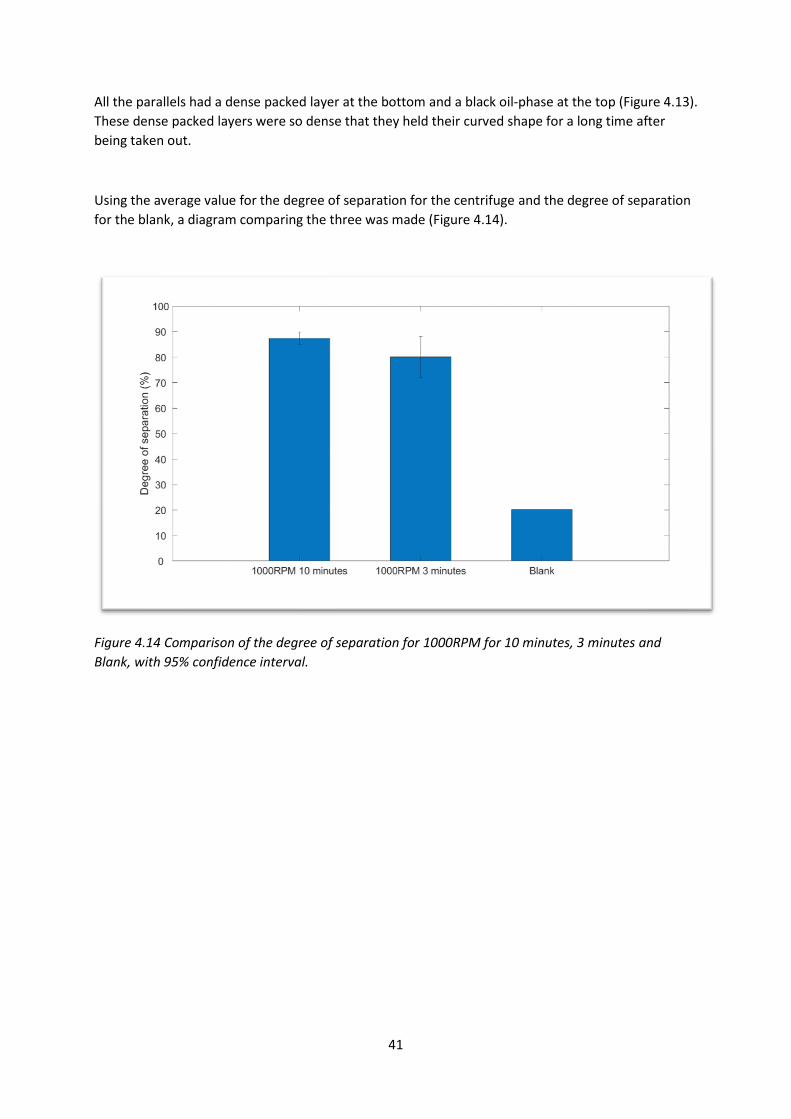
41
All the parallels had a dense packed layer at the bottom and a black oil-phase at the top (Figure 4.13).
These dense packed layers were so dense that they held their curved shape for a long time after
being taken out.
Using the average value for the degree of separation for the centrifuge and the degree of separation
for the blank, a diagram comparing the three was made (Figure 4.14).
Figure 4.14 Comparison of the degree of separation for 1000RPM for 10 minutes, 3 minutes and
Blank, with 95% confidence interval.
42
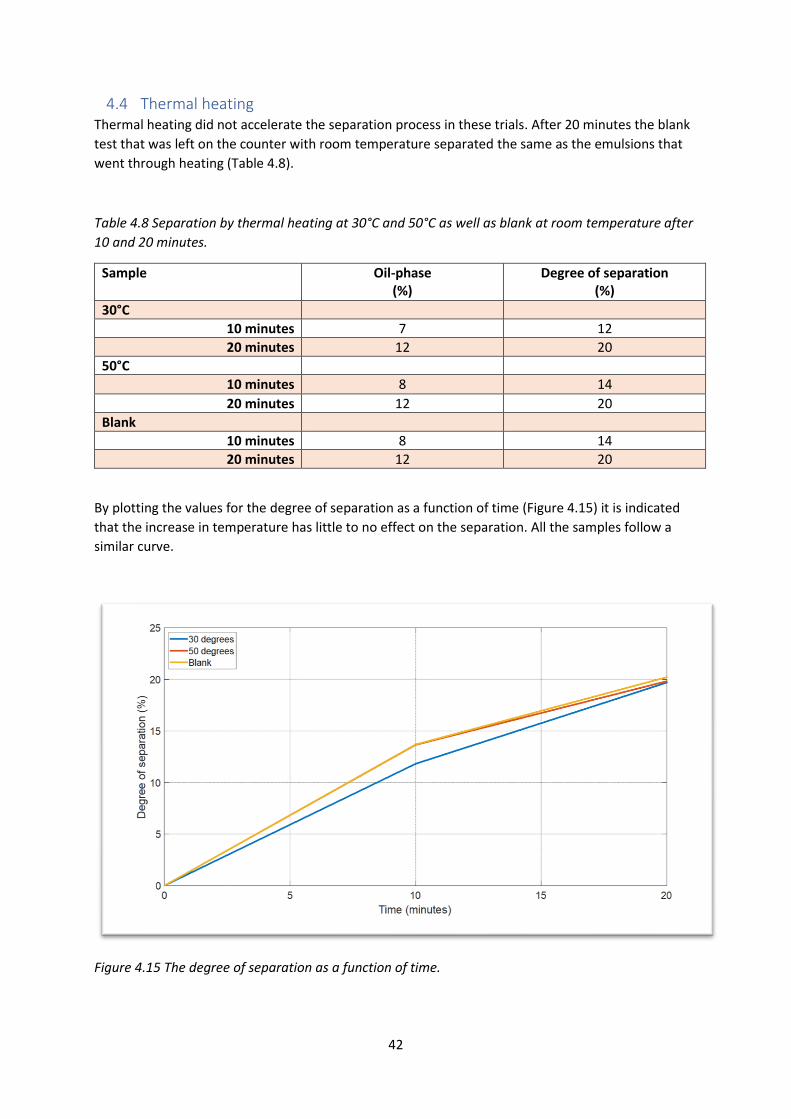
4.4 Thermal heating Thermal heating did not accelerate the separation process in these trials. After 20 minutes the blank
test that was left on the counter with room temperature separated the same as the emulsions that
went through heating (Table 4.8).
Table 4.8 Separation by thermal heating at 30°C and 50°C as well as blank at room temperature after
10 and 20 minutes.
Sample Oil-phase (%)
Degree of separation (%)
30°C
10 minutes 7 12
20 minutes 12 20
50°C
10 minutes 8 14
20 minutes 12 20
Blank
10 minutes 8 14
20 minutes 12 20
By plotting the values for the degree of separation as a function of time (Figure 4.15) it is indicated
that the increase in temperature has little to no effect on the separation. All the samples follow a
similar curve.
Figure 4.15 The degree of separation as a function of time.
43
4.5 Result summary During the experiments, the following observations were made:
Voltage pattern:
• Separation with electro coalescence is faster than gravity separation.
• Separation rate varied with the different voltage patterns.
Frequency and voltage:
• Separated area in pixels varied with the increasing of frequency and voltage.
• Separation with electro coalescence is faster than gravity separation.
New parameters (A, B and C) for electro coalescence:
• Noticeable increase in degree separation.
• Breakdown of dense packed layer.
• Increase of separation rate.
• Usage of asphaltenes and the new parameters made it harder to differentiate the layers
because of the dark colour.
Centrifuge:
• Formation of a dense packed layer at the bottom of the flask. This layer was more viscous than layers formed in electro coalescence trials.
• A high degree of separation. Thermal heating:
• Little to no effect on the separation.
• Gravity separation was more effective.
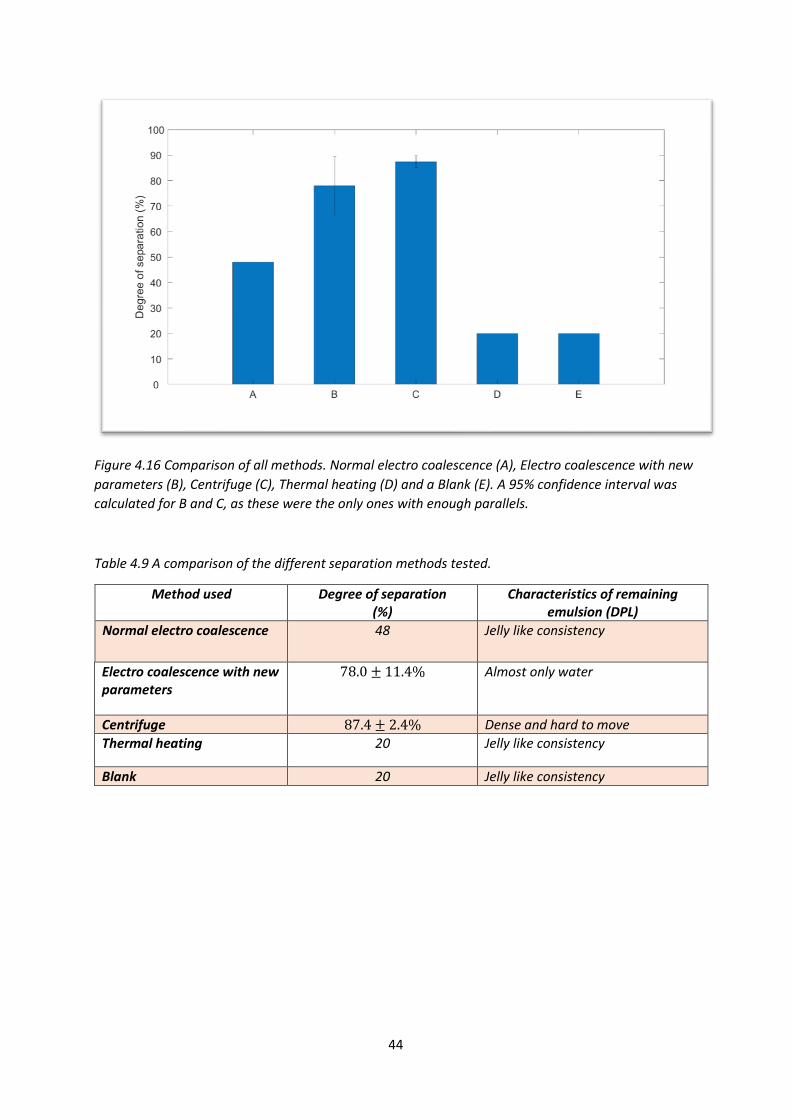
Taking the best results from each of the methods tested, a diagram (Figure 4.16) and a table
(Table 4.9) has been made to compare the results. These show that the electro coalescence with the
new parameters A, B and C and centrifuge was the best separation methods. The centrifuge resulted
in a dense packed layer which made it impossible to separate out the last bit of oil from the
emulsion, but the electro coalescence with the new parameters managed to break down this layer
and separate the emulsion even more.
44
Figure 4.16 Comparison of all methods. Normal electro coalescence (A), Electro coalescence with new
parameters (B), Centrifuge (C), Thermal heating (D) and a Blank (E). A 95% confidence interval was
calculated for B and C, as these were the only ones with enough parallels.
Table 4.9 A comparison of the different separation methods tested.
Method used Degree of separation (%)
Characteristics of remaining emulsion (DPL)
Normal electro coalescence 48 Jelly like consistency
Electro coalescence with new parameters
78.0 ± 11.4% Almost only water
Centrifuge 87.4 ± 2.4% Dense and hard to move
Thermal heating 20 Jelly like consistency
Blank 20 Jelly like consistency
45
5 Discussion To gain a better understanding of emulsion breakdown and separation several experiments were
conducted. The creation of a stable emulsion using asphaltenes as the surfactant, testing of normal
electro coalescence, testing of some new parameters, as well as a comparison with other techniques
including centrifuge and thermal heating. The results from these experiments form the basis for an
assessment of what is the best method for separation of emulsions.
5.1 Formation of emulsions In these experiments, emulsions with asphaltenes as the surfactant were made and observed, the
highest asphaltene concentration was 1000 ppm, the midmost 500 ppm and the lowest 200 ppm,
with various percentages of toluene in the continuous phase, ranging from 20% to 60%.
Based on the results (Table 4.1), the tendency observed was that a higher toluene% resulted in a
faster separation. This is believed to be due to the fact that toluene was only used as a solvent for
the asphaltenes. Only a small amount of toluene was needed to dissolve the asphaltenes used to
make the emulsions and the excess amount of toluene separated out faster than the oil, which in
turn resulted in a faster separation.
Based on the same results (Table 4.1), another tendency observed was that a higher concentration of
asphaltenes had a great impact on the emulsion stability. Figure 4.1 shows a comparison of all the
emulsions made, where the volume of the emulsion increases incrementally with the higher
concentrations. Figure 4.2 shows the difference in stability for two emulsions with the same
toluene%, but different concentrations of asphaltenes. This is a trend independent of the toluene%,
that was observed in every parallel and it may therefore be considered reliable.
In Table 4.2, the final degree of separation for the 500ppm 20% toluene sample is 4 percentage
points higher than that of the two other toluene percentages. This irregularity is believed to originate
from the post processing of the images. This will be discussed later, in chapter 5.5.
According to chapter 2.3.1.1, chain formation can occur due to the presence of impurities in the form
of asphaltenes, which in turn can result in short circuiting. This effect was not observed, likely
because the concentration of asphaltenes never exceeded 1000ppm. Taking this into consideration,
there could probably have been used higher concentrations, resulting in more stable emulsions.
46
5.2 Electro coalescence First, as part of the design of the experiments several screening experiments were conducted. The
purpose of these were to find some of the limitations of the setup used. One of the main limitations
found was the limit in change for the electrodes. Initial experiments found that the setup used was
unable to handle high frequency and voltage at the same time. If a high voltage was used, a lower
frequency was needed and vice versa. If both the frequency and voltage were lower values, the setup
worked smoothly. Due to these limitations the values used for frequency and voltage in this thesis
range from 1 to 5 Hz and 1 to 3 kV.
A possible source of error for all experiments where the emulsion was recycled is the consequent
mixing making the emulsions slightly warmer for each run. Given the results from the experiments
using the thermal bath, Chapter 4.4, where no increase in separation going from room temperature
to 50°C was found, this error might not be significant after all.
5.2.1 Voltage patterns for electro coalescence Results from the voltage pattern experiments show that each of the voltage patterns tested all gave
an increased separation compared to the blanks tested without voltage, this confirms the theory
presented in Chapter 2.3.1, that the use of electro coalescence increases the effectiveness of the
separation. This was the trend for all experiments conducted and may therefore be considered
reliable.
The results presented in Figure 4.7 show that the trapezoidal shape, at 3 Hz and 3 kV, gave the
highest separation, followed closely by the triangular shape. While at 5 Hz and 1 kV the triangular
pattern gave the highest separation, followed closely by the trapezoidal. This inconclusiveness might
be the result of errors such as the time used to move the emulsion from the mixer to the setup.
The emulsions used in these experiments were made using span83 as the surfactant and these
emulsions are not as stable as the emulsions made with asphaltenes. Due to this instability a source
of error in these experiments is the time used from the emulsions were done mixing to the
separation started. An increase in this delay may cause the emulsion to separate more than it should
for the pattern used. Another possible source of error is the recycling of materials done in these
experiments. The disposed water might have contained some of the surfactant and therefore the
concentration might have decreased. This decrease in concentration might in turn have resulted in
less stable emulsions which again might cause some of the patterns to appear more effective.
Looking at the area under the graph for the voltage patterns, Figure 3.5 in 3.2.2, the triangular
pattern has the lowest area, which in turn gives the lowest average voltage, Table 4.3. This lower
average voltage also gives a lower energy consumption. Given the inconclusiveness of the results for
which pattern had the highest separation, Figure 4.8, the energy consumption became a deciding
factor. With everything taken into consideration, the triangular pattern was chosen for further
experiments.
47
5.2.2 Frequency and Voltage for electro coalescence Based on the results presented in Table 4.4 the tendency found was that an increase in both the
frequency and voltage combined gave a more effective separation. In addition, the results presented
in Figure 4.9 show a clear tendency that the 3 kV patterns were more effective than the others by a
significant margin. This corresponds well with the theory presented in chapter 2.3.1.3, as frequencies
above 100 Hz, and an applied voltage of 2.5 kV/cm and above are both noted to be favourable.
Almost all the emulsions separated in this series of experiments showed the same tendencies and
can therefore be considered reliable.
The 1 Hz and 1 kV (hereafter 1-1) trial separated more than the 1-2 trial, this may be a result of the
1-1 trial having a longer separation duration. The 1-1 trial ran for 11 minutes while the others ran for
10 minutes. This additional minute causes the final separation to be greater than it should be, but
due to time constraints this trial was not repeated.
The results show a general trend that a higher frequency results in a higher area separated, although
not as noticeable as increasing both. This increase might be due to the impact a higher frequency has
on the rate of movement for the water droplets, which as discussed in chapter 2.3.1 is one of the
main ways the use of an electric field positively affects the coalescence of droplets.
Results presented in Figure 4.9 show that an increase from 2 kV to 3 kV had a far greater impact on
the separation than an increase from 2 Hz to 3 Hz. This difference in impact is expected to be due to
the relative increase to the optimal values discussed in chapter 2.3.1.3. For the voltage, an applied
field of 2.5 kV/cm or higher would be optimal and for frequency a frequency higher than 100 Hz
(2.3.1.3) The setup used had four cm between the electrodes, meaning that an applied voltage of 10
kV or higher would be optimal. The relative increase of 2 kV to 3 kV would be going from 20% to 30%
of the optimum value, while an increase from 2 Hz to 3 Hz would be going from 2% to 3% 1. This
difference in relative value might be the reason a greater effect was observed when increasing the
voltage rather than the frequency.
The purpose of this part of the thesis was to find the optimum values for the setup used, for further
trials. Due to the limitations of the setup, it was not possible to find the critical values for frequency
and voltage, but a general trend was found. An increase in the frequency and voltage, causes an
increase in area separated and thus a higher degree of separation. The optimum values found was
3 Hz and 3 kV, which was the most stable and effective values for the setup used. These are the
values used in further testing.
1 This is assuming the optimum value is 100 Hz, the study found that a value of 100 Hz or more was optimal,
meaning that the percentages might be even lower.
48
To find values closer to the actual optimum values for the applied electric field, E’, further analysis is
needed. From Equation 1 and 2, and Figure 2.7 in Chapter 2.3.1.3, the values missing to complete the
calculations are the radius of the droplets and the interfacial tension. To find the radius of the
droplets, analysis with a PVM-probe was planned, but not completed. To find the interfacial tension,
samples would have to be collected and further analysed.
The emulsions used in this experiment were made using span 83 as the surfactant and these had the
same sources of error as the emulsions in chapter 5.2.1.
5.2.3 New parameters A, B and C for electro coalescence In the following series of experiments emulsions made with asphaltenes dissolved in toluene were
used as surfactant. These were used to get properties with closer resemblance to crude oil
emulsions. The new emulsions had other sources of errors than the span83 ones. Most notably the
darker colour (Figure 4.1), which makes it harder to differentiate the layers after the separation, as
well as making the post processing more difficult. This darker colour made it impossible to use the
pre-existing post processing program, which in turn made it impossible to monitor the separation
during the experiments. To get quantifiable results photos were taken outside the setup and these
photos were processed by hand, introducing human error. The errors from the processing is
discussed further in chapter 5.5.
The results from the three parallels for parameter A, presented in Table 4.5, shows that
parameter A1 had an average degree of separation of 58.8 ± 53.1%, A2 had 78.7 ± 16.8% and A3
had 59.0 ± 45.6%. Parameter A2 has the highest average value but given the high level of
uncertainty for parameter A1 and A3, it is not statistically possible to say that any one of the
parameters are better than the others. Due to this, it was chosen to rely on the higher average value
and lower uncertainty of parameter A2. Figure 4.10 shows that statistically parameter A1 or A3 could
be more effective, but evidently, parameter A2 is the best.
In Table 4.5, the third parallel is consistently lower than the two first parallels. This is believed to be a
result of the new power supply installed between parallels. If this parallel is omitted in the
calculations, the average value of each parameter is increased, but also the confidence interval of A1
and A2. Due to this decrease in quality of the results if one parallel is omitted, all parallels were
included.
From the results presented in Table 4.6, it seems that changing the value for parameter B had a
greater impact on the degree of separation than changing C. For B1 and B2, the separation is around
60%, and for B3 it is around 80%. While at a constant value for parameter B, the change in separation
as a result of change in the value for parameter C is only around 2% for B2 and B3, while for B1 the
difference was 11%. Given the greater impact changing to parameter B3 had compared to changing
parameter C, it is reasonable to assume that B3 was the best value tested, while it is hard to say
which value for C was best.
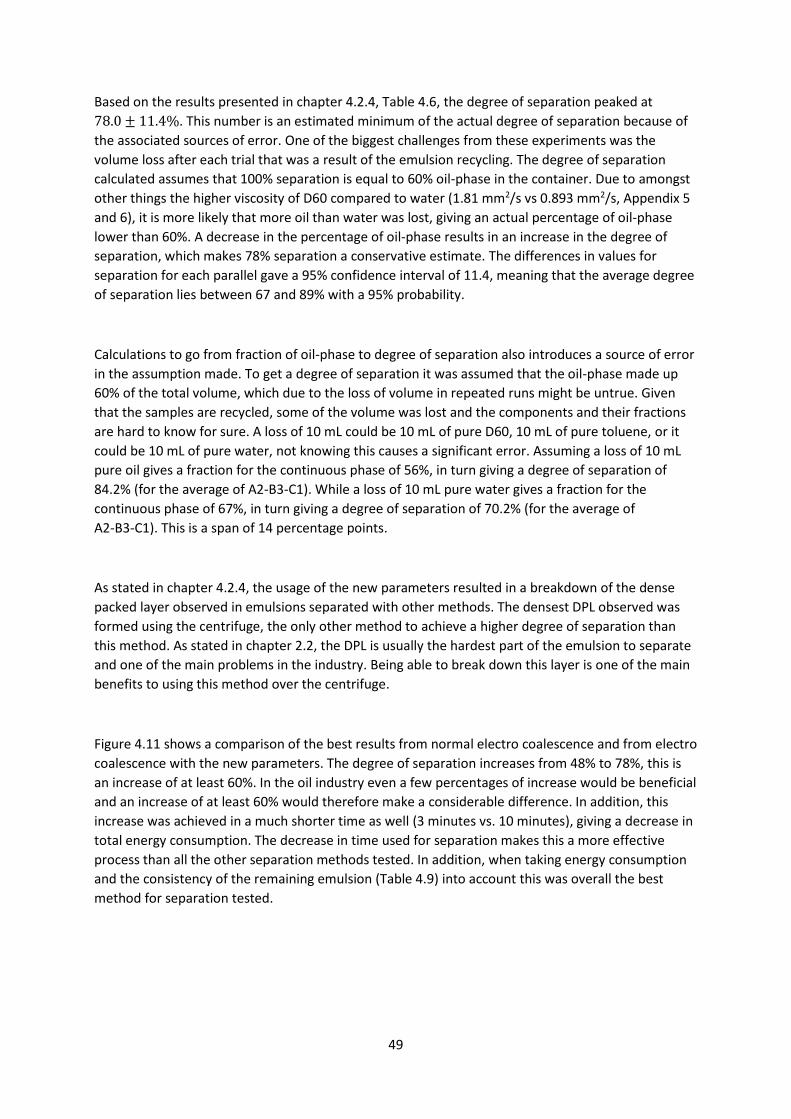
49
Based on the results presented in chapter 4.2.4, Table 4.6, the degree of separation peaked at
78.0 ± 11.4%. This number is an estimated minimum of the actual degree of separation because of
the associated sources of error. One of the biggest challenges from these experiments was the
volume loss after each trial that was a result of the emulsion recycling. The degree of separation
calculated assumes that 100% separation is equal to 60% oil-phase in the container. Due to amongst
other things the higher viscosity of D60 compared to water (1.81 mm2/s vs 0.893 mm2/s, Appendix 5
and 6), it is more likely that more oil than water was lost, giving an actual percentage of oil-phase
lower than 60%. A decrease in the percentage of oil-phase results in an increase in the degree of
separation, which makes 78% separation a conservative estimate. The differences in values for
separation for each parallel gave a 95% confidence interval of 11.4, meaning that the average degree
of separation lies between 67 and 89% with a 95% probability.
Calculations to go from fraction of oil-phase to degree of separation also introduces a source of error
in the assumption made. To get a degree of separation it was assumed that the oil-phase made up
60% of the total volume, which due to the loss of volume in repeated runs might be untrue. Given
that the samples are recycled, some of the volume was lost and the components and their fractions
are hard to know for sure. A loss of 10 mL could be 10 mL of pure D60, 10 mL of pure toluene, or it
could be 10 mL of pure water, not knowing this causes a significant error. Assuming a loss of 10 mL
pure oil gives a fraction for the continuous phase of 56%, in turn giving a degree of separation of
84.2% (for the average of A2-B3-C1). While a loss of 10 mL pure water gives a fraction for the
continuous phase of 67%, in turn giving a degree of separation of 70.2% (for the average of
A2-B3-C1). This is a span of 14 percentage points.
As stated in chapter 4.2.4, the usage of the new parameters resulted in a breakdown of the dense
packed layer observed in emulsions separated with other methods. The densest DPL observed was
formed using the centrifuge, the only other method to achieve a higher degree of separation than
this method. As stated in chapter 2.2, the DPL is usually the hardest part of the emulsion to separate
and one of the main problems in the industry. Being able to break down this layer is one of the main
benefits to using this method over the centrifuge.
Figure 4.11 shows a comparison of the best results from normal electro coalescence and from electro
coalescence with the new parameters. The degree of separation increases from 48% to 78%, this is
an increase of at least 60%. In the oil industry even a few percentages of increase would be beneficial
and an increase of at least 60% would therefore make a considerable difference. In addition, this
increase was achieved in a much shorter time as well (3 minutes vs. 10 minutes), giving a decrease in
total energy consumption. The decrease in time used for separation makes this a more effective
process than all the other separation methods tested. In addition, when taking energy consumption
and the consistency of the remaining emulsion (Table 4.9) into account this was overall the best
method for separation tested.
50
5.3 Centrifuge In the following series of experiments emulsions made with asphaltenes dissolved in toluene were
used as surfactant. These were used to get properties with closer resemblance to crude oil
emulsions. These emulsions are the same as the ones discussed in chapter 5.2.3 and have the same
errors and difficulties.
According to the results presented in Table 4.7, centrifuge had one of the highest degrees of
separation, with an average value of 87.4 ± 2.4% after running at 1000 RPM for 10 minutes, and
80.1 ± 8.0% after running for 3 minutes. Statistically it is not possible to say that these two results
are different due to the overlapping confidence intervals. This high degree of separation comes with
one caveat, the remaining emulsion layer is densely packed and very hard to further separate by
using the centrifuge. The high stability of the remaining emulsion is one of the major drawbacks of
this separation method. This layer also contains compounds that are dangerous to the environment
(Appendix 1) and is therefore costly to dispose of. This tendency was found in both the experiments
conducted and is a known problem in the oil industry (12). As stated in Chapter 2.2, a DPL can form
at the interface when gravitational separation methods are used, separation by centrifuge uses the
same principle, only with a higher force, and is therefore prone to form DPLs. As can be seen in
Figure 4.13, this was the case for these experiments as well. Compared to the bottom layer in Figure
4.12, from electro coalescence with the new parameters, the layer produced in the centrifuge was
sturdier.
The results from the experiment confirm the theory presented in 2.3.2, that the usage of mechanical
energy in the form of centripetal acceleration increases the effectiveness of the separation. The
difference in degree of separation for the blank (gravitational separation) and centrifuge samples
were almost 70 percentage points (87.4 ± 2.4% vs 20%). The centripetal acceleration forces the
particles to sediment at a much higher rate compared to normal gravity separation.
Due to the high viscosity of the remaining emulsion, the phases have a curved interface, Figure 5.1,
and differentiating and processing of the separation was therefore difficult. This may have resulted
inaccurate values for the presented degree of separation in these experiments, this is discussed
further in chapter 5.5.
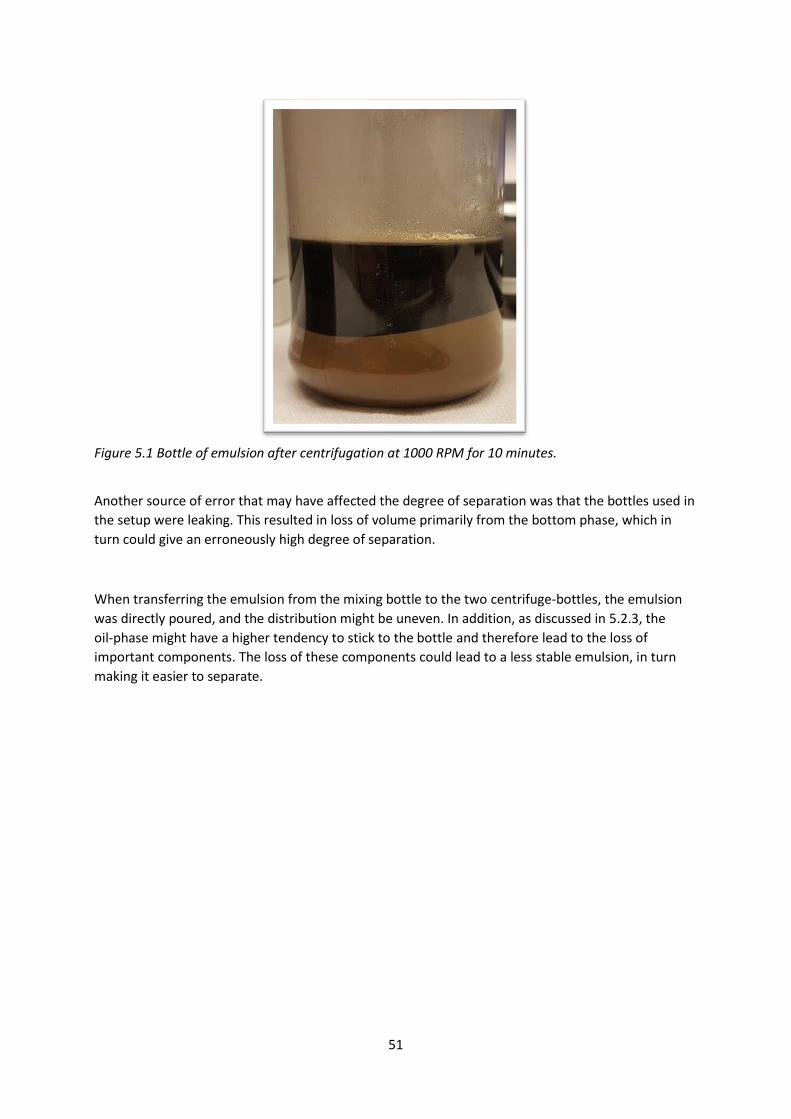
51
Figure 5.1 Bottle of emulsion after centrifugation at 1000 RPM for 10 minutes.
Another source of error that may have affected the degree of separation was that the bottles used in
the setup were leaking. This resulted in loss of volume primarily from the bottom phase, which in
turn could give an erroneously high degree of separation.
When transferring the emulsion from the mixing bottle to the two centrifuge-bottles, the emulsion
was directly poured, and the distribution might be uneven. In addition, as discussed in 5.2.3, the
oil-phase might have a higher tendency to stick to the bottle and therefore lead to the loss of
important components. The loss of these components could lead to a less stable emulsion, in turn
making it easier to separate.
52
5.4 Thermal heating In the following series of experiments emulsions made with asphaltenes dissolved in toluene were
used as surfactant. These were used to get properties with closer resemblance to crude oil
emulsions. These emulsions are the same as the ones discussed in chapter 5.2.3 and have the same
errors and difficulties.
Figure 4.15 shows the separation of the emulsion as a function of time, in this graph the blank
separated as well and better than the 50-degree sample. This result is inconsistent with the theory.
According to theory described in chapter 2.3.3, an increase in temperature should lead to an increase
in activity for the droplets, in turn facilitating more coalescence. The results from these experiments
shows the opposite. There might be several reasons to this, two of which are the duration of the
experiments and the thermal energy gained from the mixing of the emulsion.
Based on the results presented in chapter 4.4, after 20 minutes all the samples had a separation
degree of 20%. This shows that there was no noticeable effect on the separation using this method.
The similarity in separation might come from the actual temperatures of the samples, the blank
sample had a higher temperature than room temperature and therefore needed some time to cool
down, while the two other samples probably needed some time to heat up. The time necessary for
the samples to reach the temperature tested might mean that the timeframe for the experiment was
too small.
Compared to the other separation methods tested, this was the least effective. Based on the results,
this method shows no improved effect on the separation compared to the blank. According to the
theory presented in chapter 2.3.3, this method works, but according to the results it does not. Due to
the sources of error, the results of these experiments are inconclusive.
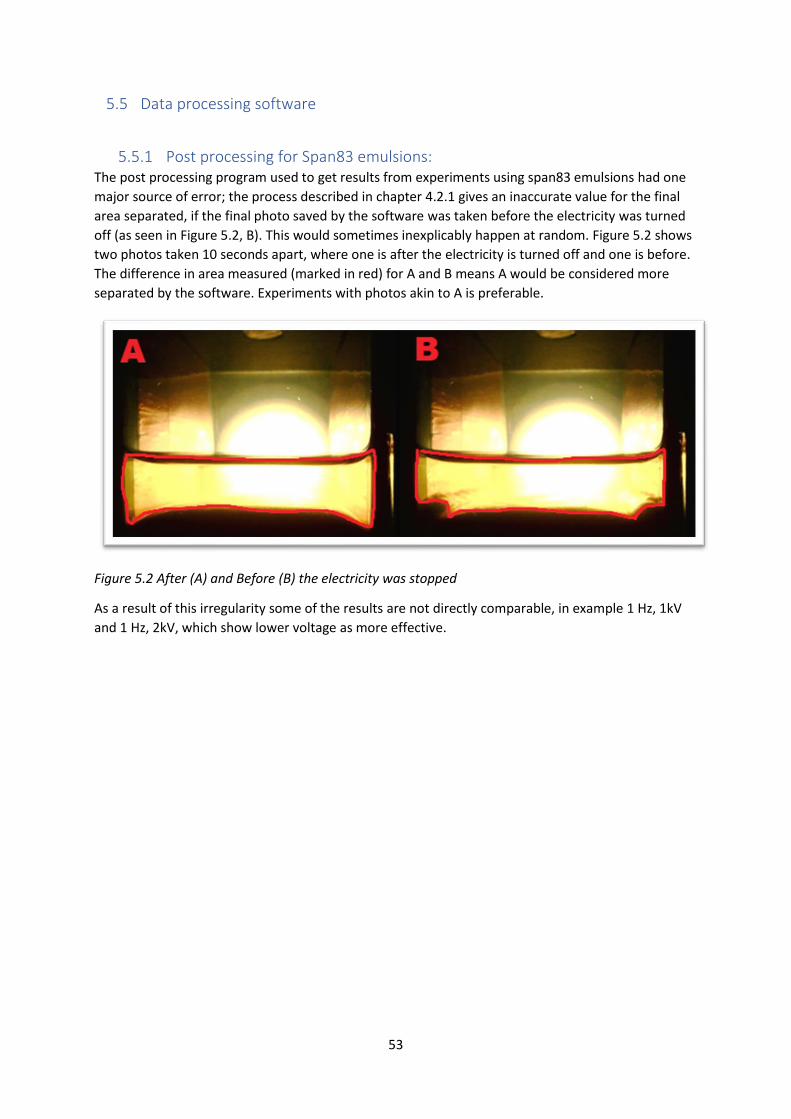
53
5.5 Data processing software
5.5.1 Post processing for Span83 emulsions: The post processing program used to get results from experiments using span83 emulsions had one
major source of error; the process described in chapter 4.2.1 gives an inaccurate value for the final
area separated, if the final photo saved by the software was taken before the electricity was turned
off (as seen in Figure 5.2, B). This would sometimes inexplicably happen at random. Figure 5.2 shows
two photos taken 10 seconds apart, where one is after the electricity is turned off and one is before.
The difference in area measured (marked in red) for A and B means A would be considered more
separated by the software. Experiments with photos akin to A is preferable.
Figure 5.2 After (A) and Before (B) the electricity was stopped
As a result of this irregularity some of the results are not directly comparable, in example 1 Hz, 1kV
and 1 Hz, 2kV, which show lower voltage as more effective.
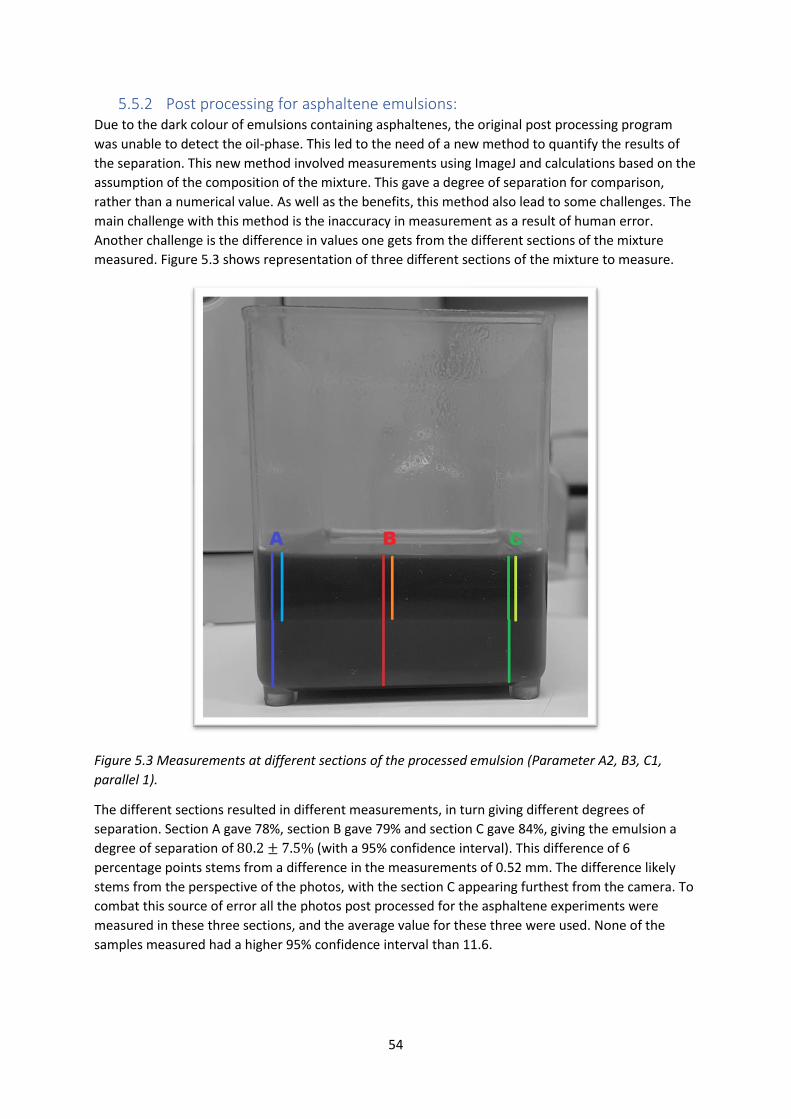
54
5.5.2 Post processing for asphaltene emulsions: Due to the dark colour of emulsions containing asphaltenes, the original post processing program
was unable to detect the oil-phase. This led to the need of a new method to quantify the results of
the separation. This new method involved measurements using ImageJ and calculations based on the
assumption of the composition of the mixture. This gave a degree of separation for comparison,
rather than a numerical value. As well as the benefits, this method also lead to some challenges. The
main challenge with this method is the inaccuracy in measurement as a result of human error.
Another challenge is the difference in values one gets from the different sections of the mixture
measured. Figure 5.3 shows representation of three different sections of the mixture to measure.
Figure 5.3 Measurements at different sections of the processed emulsion (Parameter A2, B3, C1,
parallel 1).
The different sections resulted in different measurements, in turn giving different degrees of
separation. Section A gave 78%, section B gave 79% and section C gave 84%, giving the emulsion a
degree of separation of 80.2 ± 7.5% (with a 95% confidence interval). This difference of 6
percentage points stems from a difference in the measurements of 0.52 mm. The difference likely
stems from the perspective of the photos, with the section C appearing furthest from the camera. To
combat this source of error all the photos post processed for the asphaltene experiments were
measured in these three sections, and the average value for these three were used. None of the
samples measured had a higher 95% confidence interval than 11.6.
55
6 Conclusions & Further Work Four different separation methods were tested to find the most optimal way of separating
water-in-oil emulsions. These four methods included centrifuge, thermal heating, electro
coalescence and electro coalescence with three new parameters. Gravity separation was used as a
standard blank and all other methods were compared to this. The four methods all gave different
degrees of separation, based on the parameters used.
The method found to have the highest degree of separation was the centrifuge, achieving
87.4 ± 2.4% separation in 10 minutes. Normal electro coalescence achieved a degree of separation
of 48% after 10 minutes, and the introduction of the new parameters increased the separation to
78.0 ± 11.4%, after only three minutes. Thermal heating gave the lowest degree of separation with
only 20% separation after 20 minutes, this was the same as gravitational separation after 20 minutes.
Taking into consideration the sources of error discussed in chapter 5, electro coalescence with the
new parameters could possibly have achieved similar separation as the centrifuge, with the added
benefit of a breaking down the DPL. When taking time into the consideration, the centrifuge
managed to separate the emulsion 80.1 ± 8.0% in three minutes, which is closely comparable to the
degree achieved by electro coalescence (78.0 ± 11.4%). The usage of a large-scale centrifuge is also
associated with high energy and maintenance costs, which electro coalescence could possibly
circumvent, making electro coalescence the cheaper alternative. The cumulative result of all these
aspects is that electro coalescence, with the new parameters, is the best separation method tested.
Further work:
• The concentration of asphaltenes used in these experiments were at most 1000ppm, this is
equal to 0.1% and up to 70 times diluted compared to actual crude oil. The usage of higher
concentrations would be closer to real world applications.
• Using asphaltene emulsions for all experiments, to further eliminate error from unstable
span83 emulsions.
• To get a more accurate analysis, checking the asphaltene concentration in both phases
before and after separation using a UV/vis-spectrophotometer. This could also be used to
verify the concentration of asphaltene in continues phase for every parallel.
• Running tests for electro coalescence using 10 kV and 100+ Hz. The limitations of the setup
did not allow high enough frequency with 10 kV, to test this a new power supply is needed.
This would be of help for finding the critical frequencies for electro coalescence and could
result in even better separation.
• To get more quantitative results for the remaining emulsion an analysis of the density of the
DPL should be carried out. This would result in actual numbers that represent the DPL
formed after each separation method and could help with argumentation for which one of
the methods works best.
• To get more accurate values for the degree of separation, an analysis of the remaining
emulsion in the bottles is recommended. This should be done to find the actual distribution
of compounds in the remaining emulsion.
56
7 References
1. Mhatre, S., Vivacqua, V., Ghadiri, M., Abdullah, A.M., Al-Marri, M.J., Hassanpour, A.,
Hewakandamby, B., Azzopardi, B., Kermani, B. Electrostatic phase separation: A review. Journal
of Chemical Engineering Research and Design, 2015. 96, p. 177-195.
2. Sztukowski, D.M. Oilfield solids and water-in-oil emulsion stability. Journal of Colloid Interface
Science, 2005. 285, p. 821-833
3. Noik, C., Chen, J., Dalmazzone, C.S.H. Electrostatic Demulsification on Crude Oil: A State-of-the-
Art Review (Conference paper). International Oil & Gas Conference and Exhibition, in China,
2006.
4. Bedringås, K. Introduksjon til olje- og gassteknologi. 2006, Tapir Akademiske Forlag.
5. Fossen, M. Aggregation, interfacial properties and structural characteristics of asphaltene
solubility fractions (PhD. Thesis). 2007, Fakultet for naturvitenskap og teknologi.
6. Hippmann, S., Ahmed, S.S., Fröhlich, P., Bertau, M. Demulsification of water/crude oil emulsion
using natural rock Alginite. Colloids and Surfaces A: Physicochemical and Engineering Aspects,
2018. 553, p. 71-79.
7. Patil, A., Arnesen, K., Holte, A., Farooq, U., Brunsvik, A., Strøseth, T., Johansen, S.T. Crude oil
characterization with a new dynamic emulsion stability technique. Preprint submitted to
Chemical Engineering Journal, 2020.
8. Tadros, T.F. Emulsion Formation and Stability. 2013, Hoboken: Wiley.
9. A-to-Z Guide to Thermodynamics, Heat and Mass Transfer, and Fluids Engineering. Vol. E, 2006,
Begellhouse.
10. Abdel-Raouf, M.E.-S. Factors Affecting the Stability of Crude Oil Emulsions, in Crude Oil
Emulsions- Composition Stability and Characterization. 2012, IntechOpen.
11. Holte, A., Arnesen, K. Crude oil-water emulsion flow and stability in a stirred tank (BSc. Thesis),
in Department of Chemistry and Material Technology. 2016, NTNU.
12. Keleşoğlu, S., Ponce, A. B., Sørland, G. H., Simon, S., Paso, K., Sjöblom, J. Rheological properties
of highly concentrated dense packed layer emulsions (w/o) stabilized by asphaltene. Journal of
Petroleum Science Engineering, 126. p 1–10, 2015.
13. Stavrum, P. Illustrations. 2020.
14. Rosen, M.J. Surfactants and interfacial phenomena, 3rd edition. 2012, John Wiley & Sons.
15. Ashtari, M., Ashrafizadeh, S.N., Bayat, M. Asphaltene removal from crude oil by means of
ceramic membranes. Journal of Petroleum Science and Engineering, 2012. 82-82, p. 44-49
16. Kazemzadeh, Y., Eshraghi, S.E., Kazemi, K., Sourani, S., Mehrabi, M., Ahmadi, Y. Behaviour of
Asphaltene Adsorption onto the Metal Oxide Nanoparticle Surface and Its Effect on Heavy Oil
Recovery. Industrial & Engineering Chemistry Research, 2015. 54, p. 233-239.
17. Adams, J.J. Asphaltene Adsorption, a Literature Review. Energy & Fuels, 2014. 28, p. 2831-2856.
18. Samanuik, J., Hermans, E., Verwiljen, T., Pauchard, V., Vermant, J. Soft-Glassy Rheology of
Asphaltenes at Liquid Interfaces. Journal of Dispersion Science and Technology, 2015. 36, p.
1444-1451.
19. Stability of Oil Emulsions, PetroWiki. [Cited 11.05.2020].
Available from: https://petrowiki.org/Stability_of_oil_emulsions.
20. Al-Sabagh, A.M., Kandile, N.G., Noor El-Din, M.R. Functions of Demulsifiers in the Petroleum
Industry. Separation Science and Technology, 2011. 46, p. 1144-1163.
21. Brazier-Smith, P.R., Jennings, S.G., Latham, J., Taylor, G.I. An investigation of the behaviour of
drops and drop-pairs subjected to strong electrical forces. Proceedings of the Royal Society of
London, 1971. 325, p. 363-376.
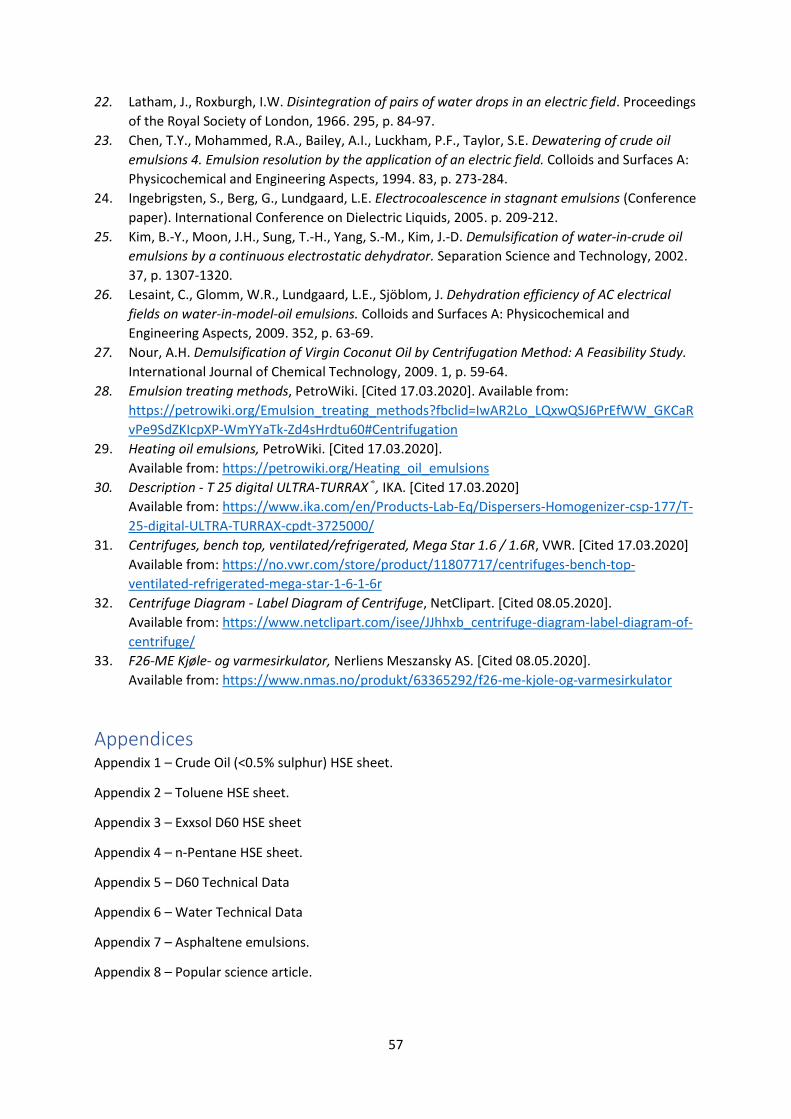
57
22. Latham, J., Roxburgh, I.W. Disintegration of pairs of water drops in an electric field. Proceedings
of the Royal Society of London, 1966. 295, p. 84-97.
23. Chen, T.Y., Mohammed, R.A., Bailey, A.I., Luckham, P.F., Taylor, S.E. Dewatering of crude oil
emulsions 4. Emulsion resolution by the application of an electric field. Colloids and Surfaces A:
Physicochemical and Engineering Aspects, 1994. 83, p. 273-284.
24. Ingebrigsten, S., Berg, G., Lundgaard, L.E. Electrocoalescence in stagnant emulsions (Conference
paper). International Conference on Dielectric Liquids, 2005. p. 209-212.
25. Kim, B.-Y., Moon, J.H., Sung, T.-H., Yang, S.-M., Kim, J.-D. Demulsification of water-in-crude oil
emulsions by a continuous electrostatic dehydrator. Separation Science and Technology, 2002.
37, p. 1307-1320.
26. Lesaint, C., Glomm, W.R., Lundgaard, L.E., Sjöblom, J. Dehydration efficiency of AC electrical
fields on water-in-model-oil emulsions. Colloids and Surfaces A: Physicochemical and
Engineering Aspects, 2009. 352, p. 63-69.
27. Nour, A.H. Demulsification of Virgin Coconut Oil by Centrifugation Method: A Feasibility Study.
International Journal of Chemical Technology, 2009. 1, p. 59-64.
28. Emulsion treating methods, PetroWiki. [Cited 17.03.2020]. Available from:
https://petrowiki.org/Emulsion_treating_methods?fbclid=IwAR2Lo_LQxwQSJ6PrEfWW_GKCaR
vPe9SdZKIcpXP-WmYYaTk-Zd4sHrdtu60#Centrifugation
29. Heating oil emulsions, PetroWiki. [Cited 17.03.2020].
Available from: https://petrowiki.org/Heating_oil_emulsions
30. Description - T 25 digital ULTRA-TURRAX®, IKA. [Cited 17.03.2020]
Available from: https://www.ika.com/en/Products-Lab-Eq/Dispersers-Homogenizer-csp-177/T-
25-digital-ULTRA-TURRAX-cpdt-3725000/
31. Centrifuges, bench top, ventilated/refrigerated, Mega Star 1.6 / 1.6R, VWR. [Cited 17.03.2020]
Available from: https://no.vwr.com/store/product/11807717/centrifuges-bench-top-
ventilated-refrigerated-mega-star-1-6-1-6r
32. Centrifuge Diagram - Label Diagram of Centrifuge, NetClipart. [Cited 08.05.2020].
Available from: https://www.netclipart.com/isee/JJhhxb_centrifuge-diagram-label-diagram-of-
centrifuge/
33. F26-ME Kjøle- og varmesirkulator, Nerliens Meszansky AS. [Cited 08.05.2020].
Available from: https://www.nmas.no/produkt/63365292/f26-me-kjole-og-varmesirkulator
Appendices Appendix 1 – Crude Oil (<0.5% sulphur) HSE sheet.
Appendix 2 – Toluene HSE sheet.
Appendix 3 – Exxsol D60 HSE sheet
Appendix 4 – n-Pentane HSE sheet.
Appendix 5 – D60 Technical Data
Appendix 6 – Water Technical Data
Appendix 7 – Asphaltene emulsions.
Appendix 8 – Popular science article.
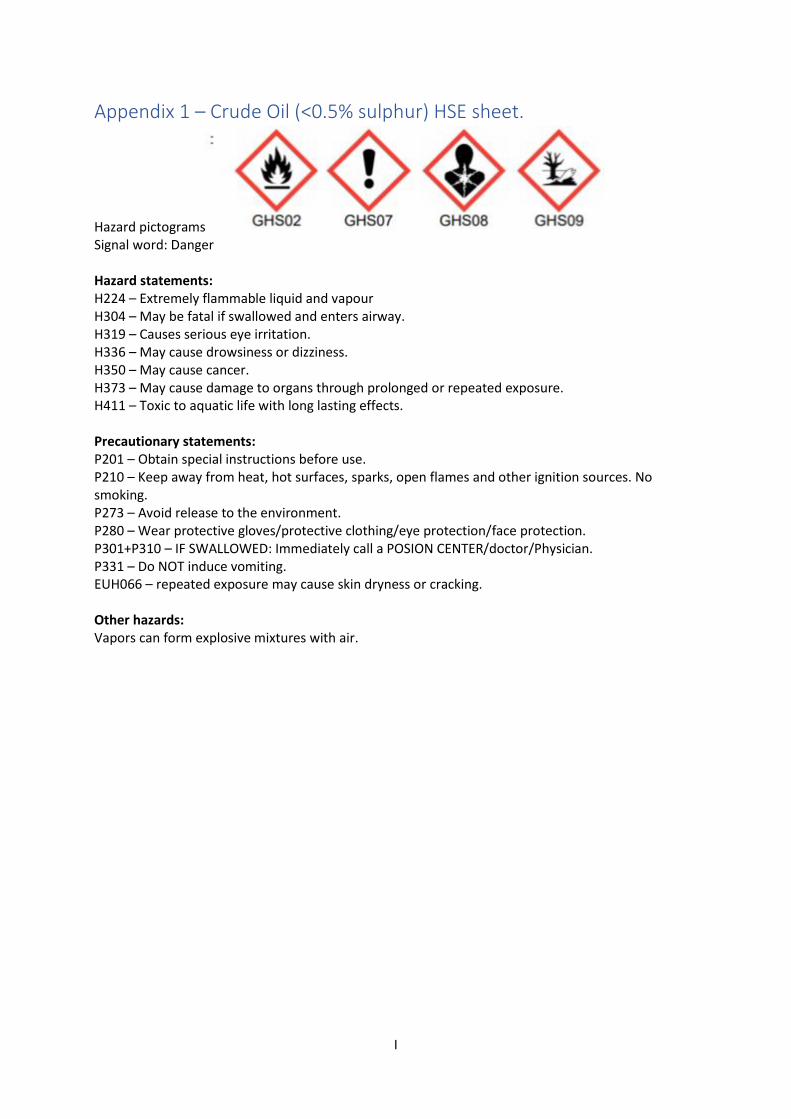
I
Appendix 1 – Crude Oil (<0.5% sulphur) HSE sheet.
Hazard pictograms Signal word: Danger Hazard statements: H224 – Extremely flammable liquid and vapour H304 – May be fatal if swallowed and enters airway. H319 – Causes serious eye irritation. H336 – May cause drowsiness or dizziness. H350 – May cause cancer. H373 – May cause damage to organs through prolonged or repeated exposure. H411 – Toxic to aquatic life with long lasting effects. Precautionary statements: P201 – Obtain special instructions before use. P210 – Keep away from heat, hot surfaces, sparks, open flames and other ignition sources. No smoking. P273 – Avoid release to the environment. P280 – Wear protective gloves/protective clothing/eye protection/face protection. P301+P310 – IF SWALLOWED: Immediately call a POSION CENTER/doctor/Physician. P331 – Do NOT induce vomiting. EUH066 – repeated exposure may cause skin dryness or cracking. Other hazards: Vapors can form explosive mixtures with air.
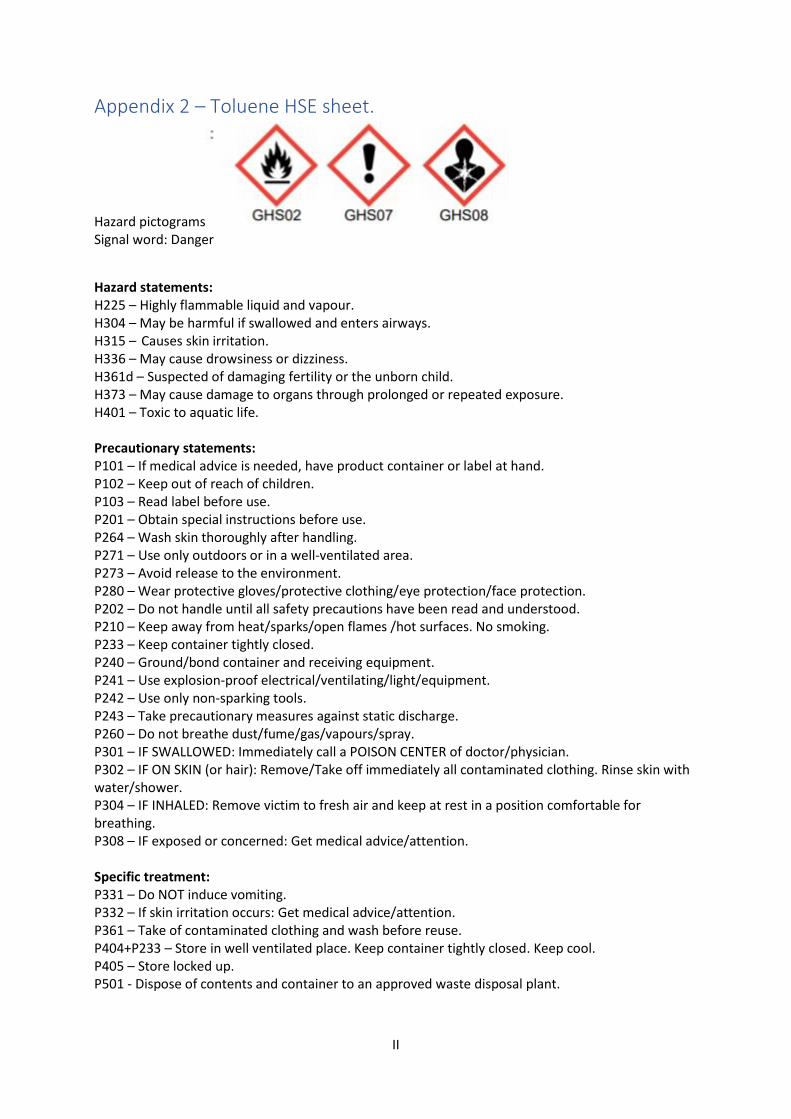
II
Appendix 2 – Toluene HSE sheet.
Hazard pictograms Signal word: Danger
Hazard statements: H225 – Highly flammable liquid and vapour. H304 – May be harmful if swallowed and enters airways. H315 – Causes skin irritation. H336 – May cause drowsiness or dizziness. H361d – Suspected of damaging fertility or the unborn child. H373 – May cause damage to organs through prolonged or repeated exposure. H401 – Toxic to aquatic life. Precautionary statements: P101 – If medical advice is needed, have product container or label at hand. P102 – Keep out of reach of children. P103 – Read label before use. P201 – Obtain special instructions before use. P264 – Wash skin thoroughly after handling. P271 – Use only outdoors or in a well-ventilated area. P273 – Avoid release to the environment. P280 – Wear protective gloves/protective clothing/eye protection/face protection. P202 – Do not handle until all safety precautions have been read and understood. P210 – Keep away from heat/sparks/open flames /hot surfaces. No smoking. P233 – Keep container tightly closed. P240 – Ground/bond container and receiving equipment. P241 – Use explosion-proof electrical/ventilating/light/equipment. P242 – Use only non-sparking tools. P243 – Take precautionary measures against static discharge. P260 – Do not breathe dust/fume/gas/vapours/spray. P301 – IF SWALLOWED: Immediately call a POISON CENTER of doctor/physician. P302 – IF ON SKIN (or hair): Remove/Take off immediately all contaminated clothing. Rinse skin with water/shower. P304 – IF INHALED: Remove victim to fresh air and keep at rest in a position comfortable for breathing. P308 – IF exposed or concerned: Get medical advice/attention. Specific treatment: P331 – Do NOT induce vomiting. P332 – If skin irritation occurs: Get medical advice/attention. P361 – Take of contaminated clothing and wash before reuse. P404+P233 – Store in well ventilated place. Keep container tightly closed. Keep cool. P405 – Store locked up. P501 - Dispose of contents and container to an approved waste disposal plant.
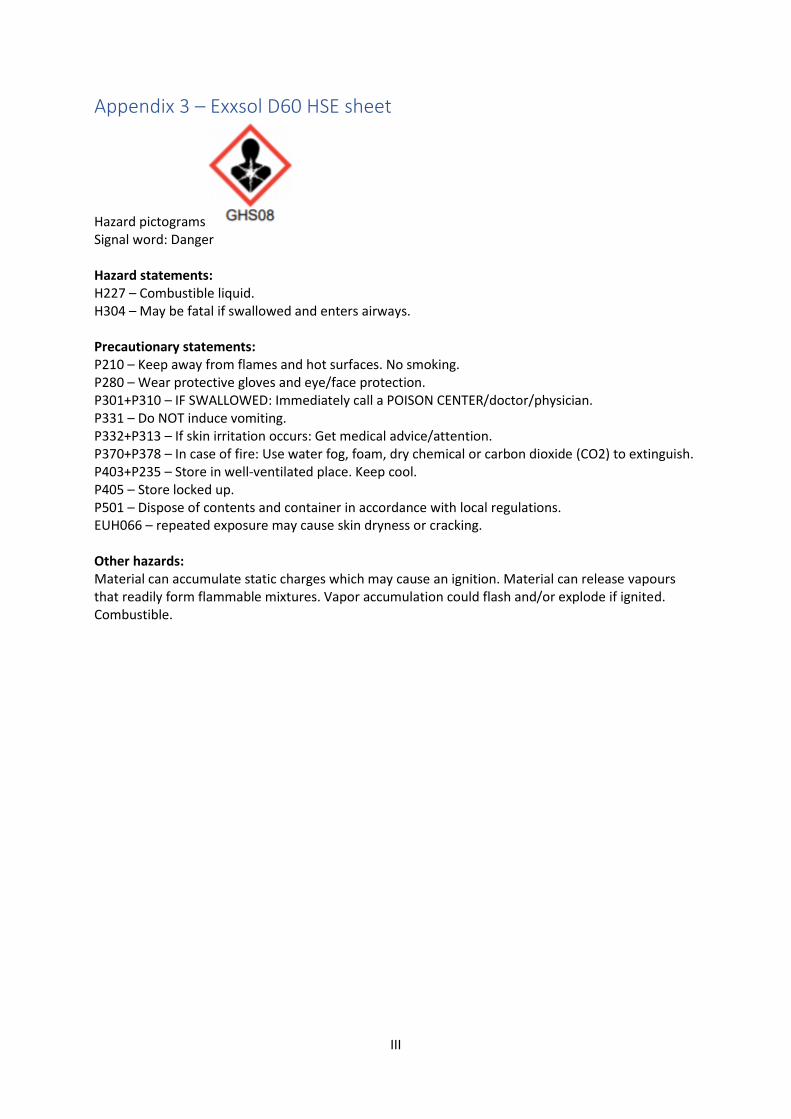
III
Appendix 3 – Exxsol D60 HSE sheet
Hazard pictograms Signal word: Danger Hazard statements: H227 – Combustible liquid. H304 – May be fatal if swallowed and enters airways. Precautionary statements: P210 – Keep away from flames and hot surfaces. No smoking. P280 – Wear protective gloves and eye/face protection. P301+P310 – IF SWALLOWED: Immediately call a POISON CENTER/doctor/physician. P331 – Do NOT induce vomiting. P332+P313 – If skin irritation occurs: Get medical advice/attention. P370+P378 – In case of fire: Use water fog, foam, dry chemical or carbon dioxide (CO2) to extinguish. P403+P235 – Store in well-ventilated place. Keep cool. P405 – Store locked up. P501 – Dispose of contents and container in accordance with local regulations. EUH066 – repeated exposure may cause skin dryness or cracking. Other hazards: Material can accumulate static charges which may cause an ignition. Material can release vapours that readily form flammable mixtures. Vapor accumulation could flash and/or explode if ignited. Combustible.
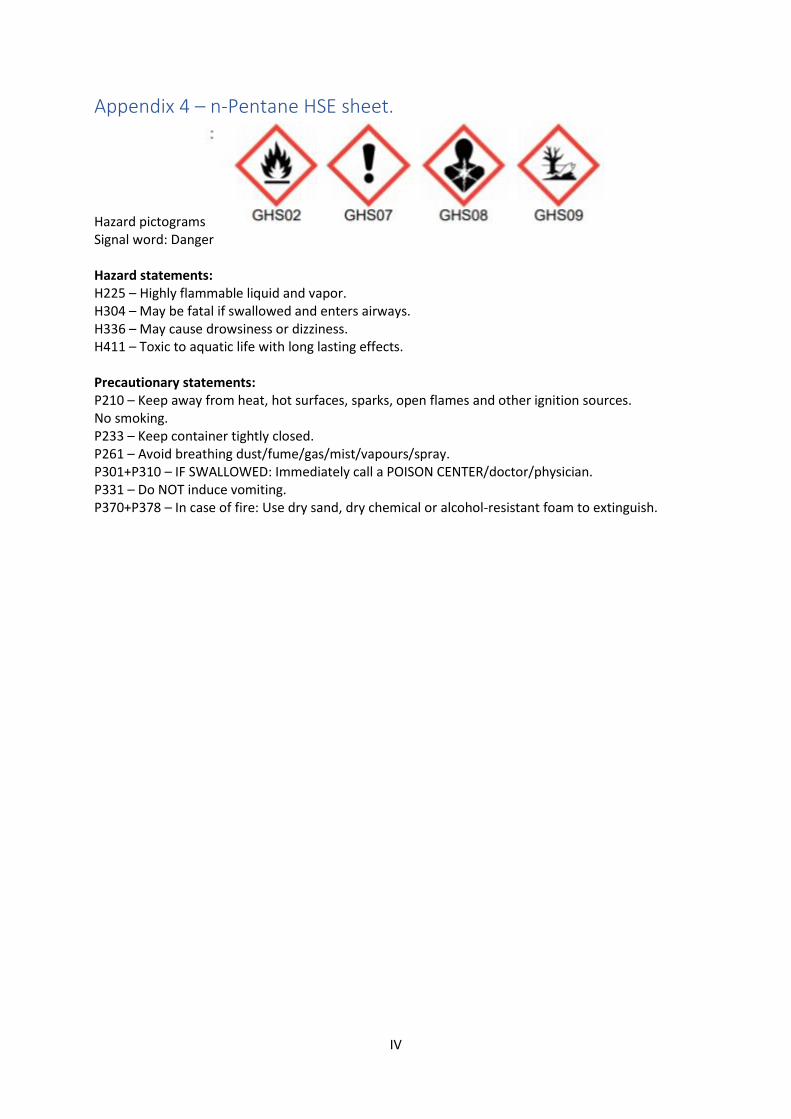
IV
Appendix 4 – n-Pentane HSE sheet.
Hazard pictograms Signal word: Danger Hazard statements: H225 – Highly flammable liquid and vapor. H304 – May be fatal if swallowed and enters airways. H336 – May cause drowsiness or dizziness. H411 – Toxic to aquatic life with long lasting effects. Precautionary statements: P210 – Keep away from heat, hot surfaces, sparks, open flames and other ignition sources. No smoking. P233 – Keep container tightly closed. P261 – Avoid breathing dust/fume/gas/mist/vapours/spray. P301+P310 – IF SWALLOWED: Immediately call a POISON CENTER/doctor/physician. P331 – Do NOT induce vomiting. P370+P378 – In case of fire: Use dry sand, dry chemical or alcohol-resistant foam to extinguish.
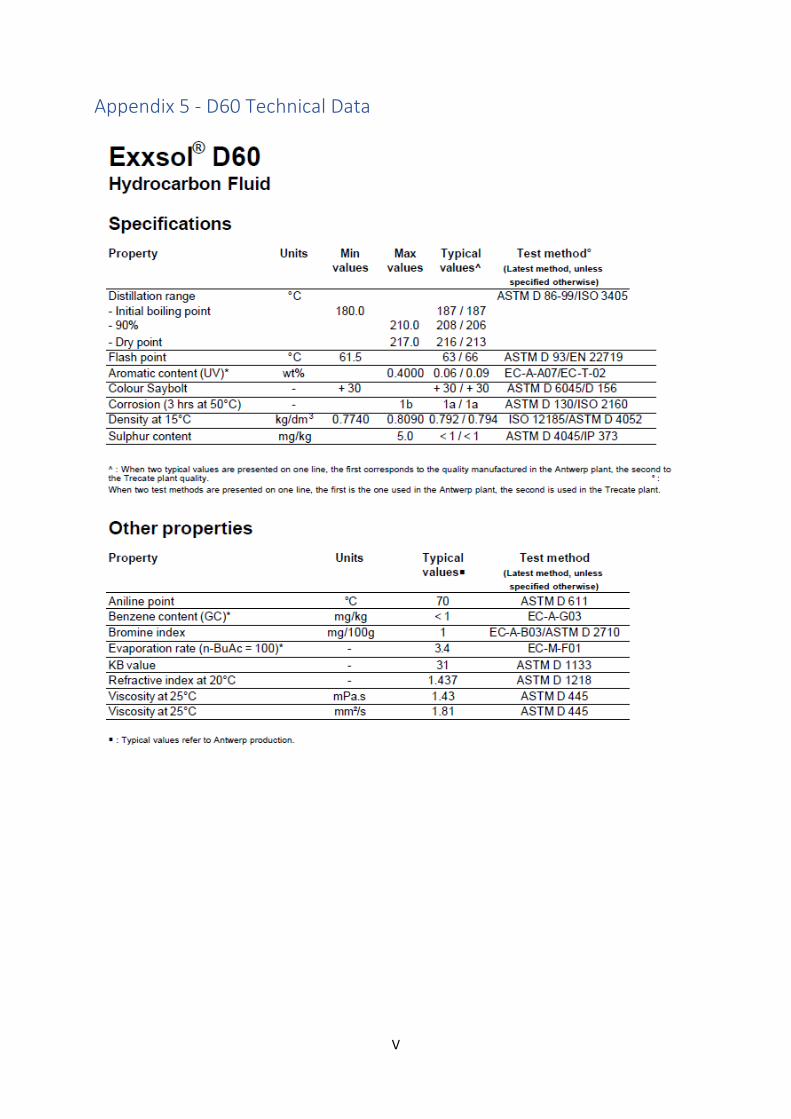
V
Appendix 5 - D60 Technical Data
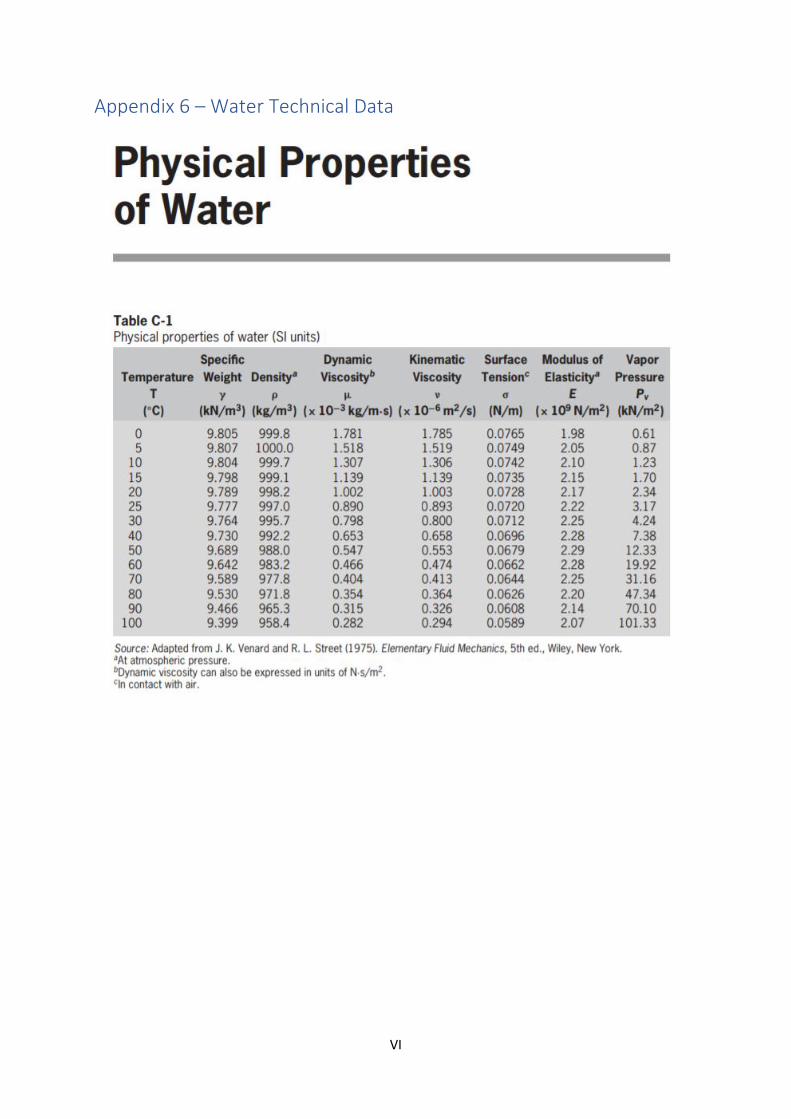
VI
Appendix 6 – Water Technical Data
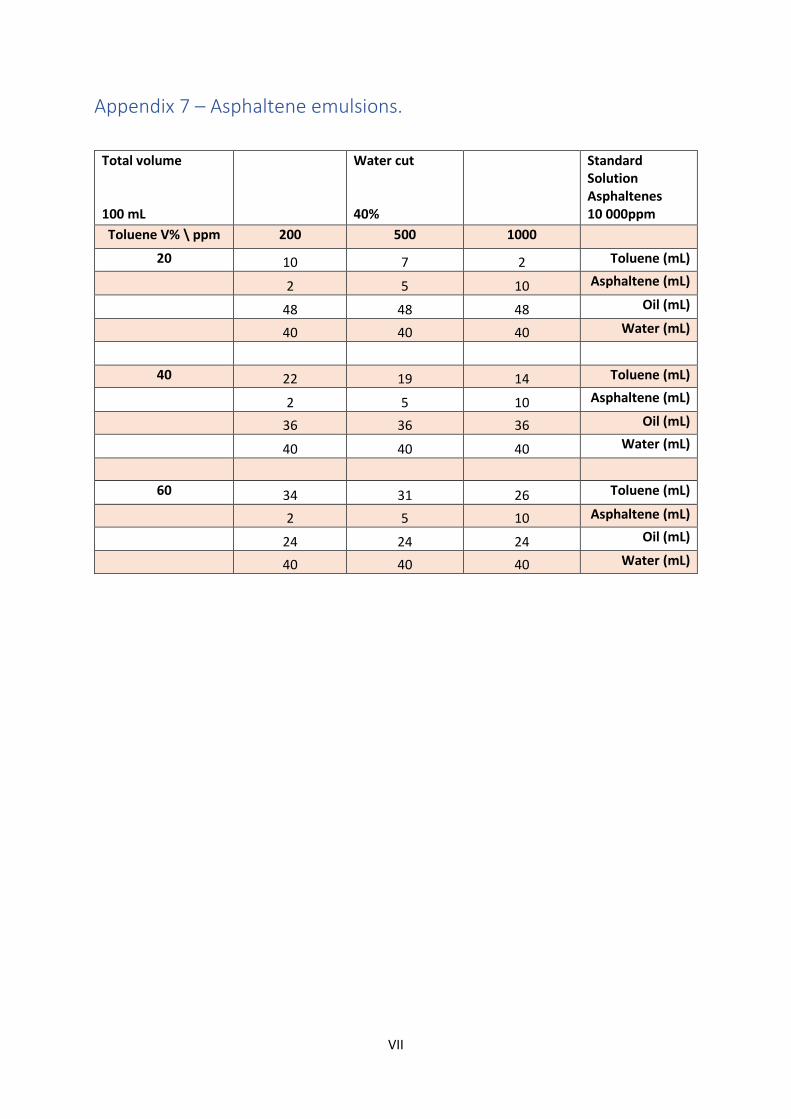
VII
Appendix 7 – Asphaltene emulsions.
Total volume 100 mL
Water cut 40%
Standard Solution Asphaltenes 10 000ppm
Toluene V% \ ppm 200 500 1000
20 10 7 2 Toluene (mL)
2 5 10 Asphaltene (mL)
48 48 48 Oil (mL)
40 40 40 Water (mL)
40 22 19 14 Toluene (mL)
2 5 10 Asphaltene (mL)
36 36 36 Oil (mL)
40 40 40 Water (mL)
60 34 31 26 Toluene (mL)
2 5 10 Asphaltene (mL)
24 24 24 Oil (mL)
40 40 40 Water (mL)
VIII
Appendix 8 – Popular science article
Separation of Water-in-Crude oil Emulsions Written by; Eirik Giil Woxholt and Jørgen Sivertsen Stavrum
Trondheim, May 21st, 2020
Crude oil and water emulsions produced from
oil wells separated in gravity separators can
form an unwanted dense packed layer. An
efficient and economical separation method
that breaks down this layer would be of great
interest to the oil and gas industry. In search
of a method that does this, SINTEF has started
a project to better understand the separation
of these emulsions.
Emulsions are systems that consists of a
mixture between two immiscible liquids,
where droplets of one liquid is dispersed in the
other (1). With a basis in the laws of
thermodynamics, an emulsion is classified as
an unstable system, due to the natural
tendency of liquid-liquid systems to separate
(2).
The formation of a DPL is undesirable and must
be avoided in the petroleum industry to afford
an efficient separation processes (3). This
formation introduces many problems in
transportation, separation, purification as well
as other steps in the refinement process.
Crude oil is an umbrella term for hydrocarbon-
rich compounds found deep in the ground,
formed from the decomposition of organisms
over millennia. Due to the high presence of
carbon and hydrogen in these compounds they
are often referred to as hydrocarbons (4).
Asphaltenes are one of the surface-active
compounds found in crude oil. They are known
for their ability to stabilize crude oil emulsions
that are formed in the oil industry and they
make the demulsification process very
challenging. Some of these stabilizing factors
are asphaltenes ability to form aggregates and
the adsorption and cross-linking of these
aggregates at the interface (5).
In order to find the most efficient separation
method, and to better understand the
breakdown of these emulsions several
experiments were carried out. The goal was to
find an efficient separation method which also
could break down the DPL.
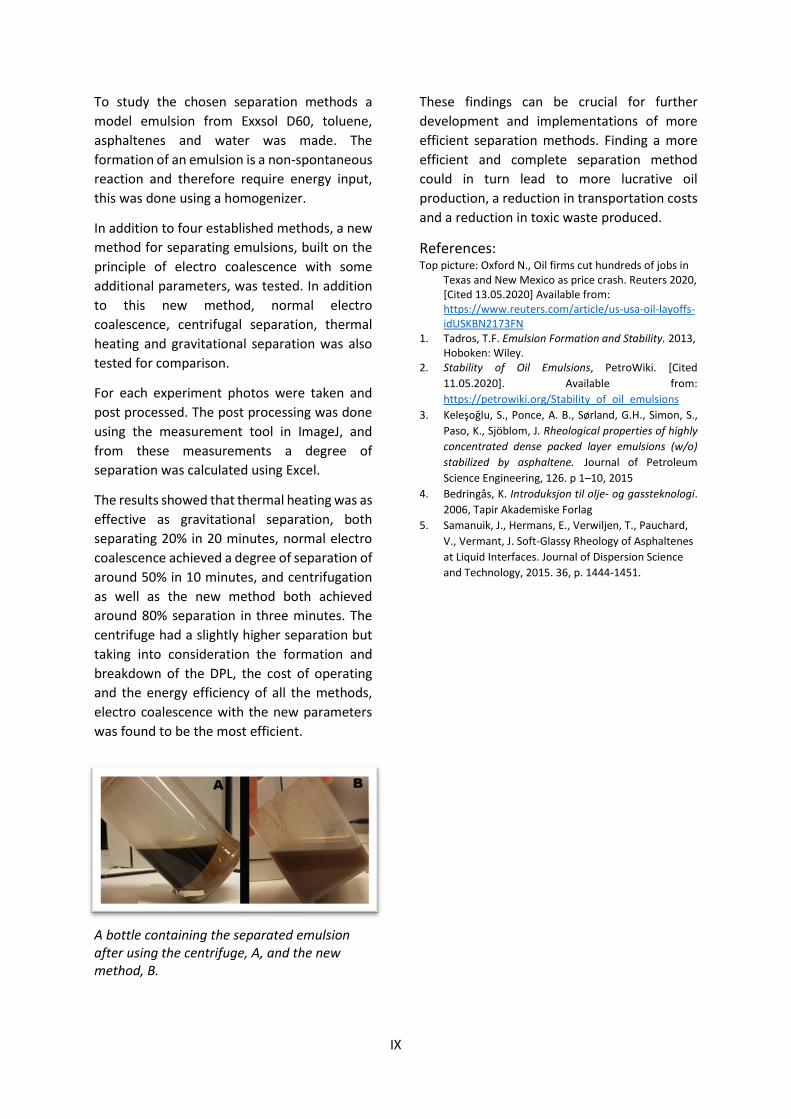
IX
To study the chosen separation methods a
model emulsion from Exxsol D60, toluene,
asphaltenes and water was made. The
formation of an emulsion is a non-spontaneous
reaction and therefore require energy input,
this was done using a homogenizer.
In addition to four established methods, a new
method for separating emulsions, built on the
principle of electro coalescence with some
additional parameters, was tested. In addition
to this new method, normal electro
coalescence, centrifugal separation, thermal
heating and gravitational separation was also
tested for comparison.
For each experiment photos were taken and
post processed. The post processing was done
using the measurement tool in ImageJ, and
from these measurements a degree of
separation was calculated using Excel.
The results showed that thermal heating was as
effective as gravitational separation, both
separating 20% in 20 minutes, normal electro
coalescence achieved a degree of separation of
around 50% in 10 minutes, and centrifugation
as well as the new method both achieved
around 80% separation in three minutes. The
centrifuge had a slightly higher separation but
taking into consideration the formation and
breakdown of the DPL, the cost of operating
and the energy efficiency of all the methods,
electro coalescence with the new parameters
was found to be the most efficient.
A bottle containing the separated emulsion after using the centrifuge, A, and the new method, B.
These findings can be crucial for further
development and implementations of more
efficient separation methods. Finding a more
efficient and complete separation method
could in turn lead to more lucrative oil
production, a reduction in transportation costs
and a reduction in toxic waste produced.
References: Top picture: Oxford N., Oil firms cut hundreds of jobs in
Texas and New Mexico as price crash. Reuters 2020, [Cited 13.05.2020] Available from: https://www.reuters.com/article/us-usa-oil-layoffs-idUSKBN2173FN
1. Tadros, T.F. Emulsion Formation and Stability. 2013, Hoboken: Wiley.
2. Stability of Oil Emulsions, PetroWiki. [Cited
11.05.2020]. Available from:
https://petrowiki.org/Stability_of_oil_emulsions
3. Keleşoğlu, S., Ponce, A. B., Sørland, G.H., Simon, S.,
Paso, K., Sjöblom, J. Rheological properties of highly
concentrated dense packed layer emulsions (w/o)
stabilized by asphaltene. Journal of Petroleum
Science Engineering, 126. p 1–10, 2015
4. Bedringås, K. Introduksjon til olje- og gassteknologi.
2006, Tapir Akademiske Forlag
5. Samanuik, J., Hermans, E., Verwiljen, T., Pauchard,
V., Vermant, J. Soft-Glassy Rheology of Asphaltenes
at Liquid Interfaces. Journal of Dispersion Science
and Technology, 2015. 36, p. 1444-1451.