Embed Size (px)
Citation preview

Republic of Kenya
Assessment of Family Planning Services in Kenya: Evidence from the 2004 Kenya
Service Provision Assessment Survey
KENYAW O R K I N G PA P E R S
Alfred Agwanda
Anne Khasakhala
Maureen Kimani
January 2009
Based on further analysis of the 2004 Kenya Service Provision Assessment Survey
No. 4
The Kenya Working Papers series is an unreviewed, unedited prepublication series of papers
reporting on studies in progress. This paper is based on further analysis of data collected in the
2004 Kenya HIV/AIDS and Maternal and Child Health Service Provision Assessment (KSPA).
The 2004 KSPA was supported by the United States Agency for International Development
(USAID), the United Nations Children’s Fund (UNICEF), and the U.K. Department for
International Development (DFID). It was implemented by the Kenya National Coordinating
Agency for Population and Development (NCAPD), the Ministry of Health (MOH), and the
Central Bureau of Statistics (CBS). Additional funding for the development of these papers was
provided by the USAID, President’s Emergency Plan for AIDS Relief (PEPFAR), and UNICEF,
which took place under the auspices of NCAPD. The MEASURE DHS program at Macro
International Inc., Calverton, Maryland, USA provided technical support for the main survey and
for the preparation of these papers. The views expressed in this paper are those of the authors and
do not necessarily represent the views of the Government of Kenya, NCAPD, USAID, UNICEF,
DFID, or the organizations with which the authors are affiliated.

Assessment of Family Planning Services in Kenya:
Evidence from the 2004 Kenya Service Provision
Assessment Survey
Alfred Agwanda1
Anne Khasakhala1
Maureen Kimani2
Corresponding author: Alfred Agwanda, Population Studies and Research Institute, University of Nairobi, P.O. Box 30197, GPO
00100, Nairobi, Kenya. Phone: +254-020-318262; Email: [email protected].
1University of Nairobi, Kenya 2Great Lakes University, Kenya

Suggested citation:
Agwanda, Alfred, Anne Khasakhala, and Maureen Kimani. 2009. Assessment of Family
Planning Services in Kenya: Evidence from the 2004 Kenya Service Provision Assessment
Survey. Kenya Working Papers No. 4. Calverton, Maryland, USA: Macro International Inc.

ABSTRACT
This study focused on factors associated with the readiness of Kenyan health facilities to provide
quality and appropriate care to family planning clientele; the degree to which health care
providers foster informed selection of an appropriate contraceptive method; and the extent to
which clients perceive services to be of high quality. Data was obtained from the 2004 Kenya
Service Provision Assessment. The composite indicators scores for facility readiness were
generally low and many facilities lacked simple items like visual aids, guidelines, towels,
speculum, etc. There were marked differences in facility readiness by region, facility type, and
managing authority. Provider service provision scores were generally high but the only important
difference was by region. Client satisfaction was dependent on the facility type, managing
authority, sex of the provider, and the waiting time to receive services. Clients were more likely
to be satisfied with female rather than male providers. Clients were less satisfied in Nyanza,
although the facilities were more ready with high-performing providers. In contrast, North
Eastern Province had less ready facilities, but high client satisfaction and high provider
performance. Health centre, clinics, and dispensaries need to be revamped to appropriate
standards so as to include all basic elements of family planning service provision. North Eastern
Province, with motivated workers, highly satisfied clients but poor facilities, deserves proper
attention. Facilities in Nairobi need improvements in staff supervision and retraining. There is
need to educate the clientele on the availability of appropriate services within the government
facilities.


1
INTRODUCTION
Unmet need for contraception can be understood as a rights-based measure of family planning,
that is, the degree to which individuals are able to translate their fertility preferences into action
by ensuring that births occur by voluntary and informed choice. Reducing unmet need has been a
priority in Kenya since the 1994 International Conference on Population and Development
(ICPD) in Cairo, and the country has made major gains over time in the use of contraceptives,
leading to a large and rapid decline in fertility in the early 1990s. However, contraceptive
prevalence rates plateaued in the last decade at 39 percent (32 percent modern methods), while
the level of unmet need increased slightly to 24 percent and the proportion of demand satisfied
remained at 63 percent, leading to high levels of unplanned pregnancies (Muga et al., 2005;
CBS, 2004).
Unmet need results from growing demand in the face of service delivery constraints
including poor quality of care, lack of support for contraceptive use from communities and
spouses, misinformation, financial costs, and transportation restrictions. Within the context of
service delivery, quality of care is particularly important: services must be appropriate according
to both health standards and client expectation, method choice must be demand-driven rather
than supply-driven, and clients must perceive the services to be of good quality in order to
increase uptake of contraceptive methods and aid women in continuing the use of their method
while they are still in need of contraception (Jain, 1989; Magadi and Curtis, 2003, Blanc et al.,
2002, RamaRao et al., 2003). We present this concept graphically in Figure 1.

2
Figure 1. Relationship between quality of health care to client uptake and continuation of
appropriate contraceptive methods
The purpose of this paper, therefore, is to describe the family planning service delivery
environment in Kenya, with a particular focus on quality of care and client satisfaction, in order
to discern the degree to which service delivery constraints stand in the way of further reductions
in unmet need. Given our conceptual understanding of how the quality of the provision of health
care can affect client perceptions of services, which in turn affect method uptake (Figure 1), our
research seeks to identify the factors associated with the readiness of Kenyan health facilities to
provide quality, appropriate care to those seeking contraceptive services, as well as the degree to
which health care providers foster informed selection of an appropriate contraceptive method.
We then turn to an examination of the extent to which clients perceive services to be of high
quality.
Client uptake and
continuation of
appropriate
contraceptive method
(met need)
Facility readiness to provide
quality health services
Provider willingness and
ability to foster informed
method selection
Client perception
of quality

3
BACKGROUND
Improving quality of care has been a necessary goal for family planning programmes worldwide.
This increased interest has been accompanied with efforts to monitor quality of care at every
level of service delivery (Williams et al., 2000). The seminal work of Bruce (1990) provided a
basic framework and a point of reference for studying quality of care in family planning service
delivery. The framework included a set of six core elements: choice of methods, information
given to clients, technical competence of the provider, client–provider interpersonal relations,
mechanisms to ensure follow-up and continuity, and the appropriate constellation of services.
Comprehensive and quality family planning service provision must include an assessment of the
needs of clients, a range of available methods, and the provision of complete and accurate
information about all methods offered, thus ensuring informed choice. Providers should have the
necessary technical skills to offer the methods safely, be trained in technically accurate and
culturally appropriate counselling techniques, and be able to use this knowledge effectively.
Services should be convenient, accessible and acceptable to clients. In addition, it is essential to
provide follow-up care to ensure continuity of services and an adequate logistics system to
ensure continuity of supplies (Bruce, 1990; Kumar et al., 1989). In this section, we discuss
findings in two areas related to these core elements: facility readiness to provide quality services,
and health care provider facilitation of informed method choice. We also review the literature on
client satisfaction and its relationship to contraceptive use and continuation.
4
Facility Readiness to Provide Quality Services
It is evident that family planning programmes lacking adequate infrastructure, supplies, and
trained personnel may not provide good quality of care (RamaRao and Mohanam, 2003). Factors
influencing facility readiness may range from system-wide targeted interventions, such as public
and private investments in family planning service delivery; management and training of the
required personnel, health system laws, and regulations including standards and guidelines.
RamaRao et al. (2003) indicated that a number of authors frequently used readiness of
facilities to provide services interchangeably with quality of care, although the two concepts are
distinct. RamaRao et al. (2003) define facility readiness as being the measure of factors that
promote delivery of good quality services, such as the availability of infrastructure equipment,
supplies, and trained staff; quality of care refers to the user's experience when receiving the
service. Although readiness of health facilities to provide quality services has been linked with
specific contraceptive behaviour such as adoption, continuation, and switching (Hotchkiss et al.,
1999; Steele et al., 1999), research on these issues has not been conclusive (RamaRao and
Mohanam, 2003; Mensch et al., 1996; Magnani et al., 1999). However, the effect of quality of
care on clients’ behaviour is well agreed upon–-perceptions of quality guide reproductive and
contraceptive behaviour of individuals. Individuals are more likely to use family planning or
modern contraceptives if they perceive the services to be of good quality. Likewise, perceptions
of poor quality are likely to dissuade them (RamaRao and Mohanam, 2003).

5
Provider Ability to Foster Informed Contraceptive Choice
Providers of reproductive health information and services are critical conduits through which
clients obtain family planning information and counselling, upon which basis clients may make
informed decisions about contraceptive use (Abdel-Tawab and Roter, 2002). Lantis et al. (2002)
noted, in a comprehensive review of the literature, that providers figure prominently in
determining the quality of family planning services. However, provider behaviour may also be
influenced by facility readiness, knowledge gaps, community myths, and insufficient skills.
Further, medical barriers and practices may limit provider interaction with the client, thus
limiting the provider’s ability to provide appropriate services (Speizer et al., 2000). Early studies
in Jamaica and the United States suggest that the preferences of providers are also important
determinants of the contraceptive methods that are prescribed or made available to clients
(Bailey et al., 1995; McDonald et al., 1995; Weeks, 1993).
Several barriers may also limit providers' ability or willingness to provide quality care.
Knowledge gaps, including both community myths and insufficient knowledge and skills among
providers, represent one type of barrier (Best, 2002). Other factors include medical barriers and
practises based on medical rationales that limit clients' access to contraception (Shelton et al.,
1992; Speizer et al., 2000). For example, an examination of quality of care in five African
countries by Miller et al. (1998) showed that a large proportion of providers imposed restrictions
on family planning based on client characteristics such as age, marital status, spousal consent and
number of children. On the other hand, some providers may believe that they are in a better
position to choose the most appropriate method for the client while others may be biased toward
certain methods, and hence preclude the client from choosing his or her own method (Creel et
al., 2002; Speizer et al., 2000).

6
Studies have also reported that social distance between providers and clients limits
quality interactions between the two (Rutenberg and Watkins, 1997). An earlier study in Kenya
suggested that providers were more likely to provide information on contraceptive side effects to
older or better educated clients (Ndhlovu, 1995). Other reports indicated that some facilities
tended to focus services on older, usually married, women more than on first users who were
likely to be young and unmarried (Potts et al., 1998; UNFPA, 1994). Schuler and Hossain
(1998), in a study of family planning clinics in rural Bangladesh, reported that some providers
appeared to selectively apply interpersonal skills and common courtesy.
Client Satisfaction
The quality of care, whether measured according to objective standards or from the perspectives
of clients or providers, is believed to influence reproductive health outcomes through improved
client satisfaction and contraceptive use behaviour (Williams et al., 2000; Blanc et al., 2002;
RamaRao et al., 2003; Steele et al., 1999). Client opinion, especially satisfaction with services, is
a subjective way of measuring quality of family planning services. Satisfied clients are more
likely to re-visit the services, pass on positive messages by word of mouth to others, and
continue use of a particular family planning method (Rutenberg and Watkins, 1997). On the
other hand, dissatisfied clients are more likely to share their negative experiences with others and
are less likely to return or continue use of family planning services (Williams et al., 2000).
Clients’ perceptions are shaped by their cultural values, previous experiences, and
interactions with providers and the health care system. These perceptions may vary depending on
the contextual factors; nevertheless, some commonalities also exist as core elements of quality of
care (Creel et al., 2002; Kelley and Boucar, 2000). One such common factor is the waiting time

7
to receive services. Williams et al. (2000), in a study of eight Latin American and Caribbean
countries using client exit interviews, revealed that almost three quarters of clients were
dissatisfied with waiting time to obtain services. Also, about half of the clients were dissatisfied
with ease of reaching service delivery and about half with the price of services.
A study conducted by Ndhlovu (1995) in Kenya reported that clients viewed low costs
and proximity of services as the two most important factors that attracted them to services.
However, a study in Bangladesh indicated that families tend to spend money on health care only
in a crisis situation. Other health issues, such contraceptive side effects and related problems, are
rarely seen as emergencies and are therefore given low priority (Schuler et al., 2001).
Nevertheless, there are instances where clients may be willing to pay higher costs if they believe
that services are of high quality (Sadasivam, 1995).

8
DATA AND METHODS
Data
This analysis uses data from the 2004 Kenya Service Provision Assessment (KSPA). The 2004
KSPA obtained information from a sample of 440 facilities, out of a total facility population of
4,742 facilities. These facilities included hospitals, health centres, dispensaries, maternity homes,
and clinics. In addition, standalone facilities offering mainly services for voluntary counselling
and testing for HIV (VCT) and antiretroviral (ARTs) were included in the sample. All the
facilities included in the sample were randomly sampled except for the 2 referral and 8
provincial hospitals in the country. These 10 facilities were sampled to ensure both national and
provincial representation. The final sample size of 453 facilities was selected to account for
logistic considerations. The 2004 KSPA, which provides national and provincial level
information on all types of facilities, collected information on child health, maternal health,
family planning, and infectious disease using a variety of data collection methods.
The data used in this study come from facility inventories, the family planning
observation protocol, and family planning client exit interviews. A detailed description of the
data collection methods used is given in the 2004 KSPA. The sample size used in the analysis
excludes standalone facilities, which were mainly added to account for information pertaining to
voluntary counselling and testing.

9
Methods
In this section we first describe our dependent and independent variables. We then describe our
approach to the analysis of each dependent variable.
Dependent Variables
Facility Readiness: Assessment of the Extent to Which the Facilities Are Ready to Provide
Services According to Expected Standard. At the facility level, appropriate service provision
encompasses a variety of critical elements. Following the approach of Hong et al. (2006), we
consider four loci where appropriateness of service provision may be assessed: the counselling
environment, the examination room, method availability, and management practices (see Table
1). To incorporate all of the relevant elements into a single variable, we created a composite
score reflecting each facility’s ability to provide appropriate family planning services. For each
item, the score represents the weight given to the aspect of each dimension. For example, in the
counselling dimension, the presence of guidelines or protocols on counselling will be given the
weight of 25/4 if available and 0 if unavailable. Similarly, under the examination room category,
a private room that ensures visual and auditory privacy is given the weight of 25/11 if present in
a facility and 0 if not. The total composite score reflects the readiness of a facility to provide
appropriate quality services to clients. The scores were subsequently divided into three
categories (high, medium, or low).

10
Table 1. Dimensions and items in the readiness index of family planning services, Kenya
SPA 2004
Quality dimension and item Definition of item
Score (weight for presence in the facility)
Percent of facilities where item was observed
1. Counselling 25
Guideline Guidelines or protocols on counselling 25/4 13
Privacy in counselling room Private room that ensures visual and auditory privacy 25/4 65
Visual aids For demonstrating the use of family planning methods 25/4 62
Individual client card Individual client card or record or chart for family planning 25/4 58
2. Examination room 25
Privacy in examination room Private room that ensures visual and auditory privacy 25/11 61
Examination table/bed Table or bed for examination such as pelvic examination 25/11 74
Source of light Examination light including spot light 25/11 17
Speculum Vaginal speculum for pelvic examination 25/11 14
Soap For hand washing 25/11 54
Water For hand washing (tap water or bucket with tap) 25/11 68
Gloves Clean (disposable or sterile) latex gloves 25/11 71
Decontamination solution Mixed solution for hand decontamination 25/11 39
Sharp box For disposing of used sharp objects (i.e., used needles) 25/11 70
Towel or drier Presence of towel or drier in the unit/facility offering family planning 25/11 5
Blood pressure (BP) machine Availability of BP machine 25/11 59
3. Supply of contraceptive methods 25
Oral contraceptives Combined or progesterone-only pills 25/5 67
Injectables Combined or progesterone-only injection 25/5 67
Condoms Male condoms 25/5 64
Implants Norplant or Implants 25/5 10
IUDs Intrauterine devices 25/5 21
4. Management 25
≥ 25% of staff received training In-service training in any family planning topic in past year 25/3 12
≥ 50% of staff received supervision Receiving personal supervision in past 6 months 25/3 34
Having up-to-date registration Having a recorded register up-to-date in last 7 days 25/3 57
Total 100 N = 430

11
Appropriateness of Method Choice/Informed Consent: Assessment of Provider Actions. Provider
behaviour is important to the provision of quality services even if the facility has the right
infrastructure. For provider behaviour, we focus on the items that were observed for each
provider during client consultation (Table 2). The scores obtained from the observations of each
provider were summed to obtain a score for each individual. Thus, a provider consultation with
an excellent consultative process would obtain a maximum score of 7 while a consultation with
the lowest score would be given a zero. As in the case of facility readiness, the scores were
divided into three categories for high, medium, and low performance scores.
Table 2. Items in the provider observation assessment index, Kenya SPA 2004
Components of consultation Score Percent of client-provider interactions where component was observed
Visual privacy assured Equals 1 if observed, 0 otherwise 87
Auditory privacy assured Equals 1 if observed, 0 otherwise 83
Client assured orally of confidentiality Equals 1 if observed, 0 otherwise 41
Client asked about concerns about methods discussed or used Equals 1 if observed, 0 otherwise 69
Provider wrote on the client card Equals 1 if observed, 0 otherwise 95
Provider used visual aids Equals 1 if observed, 0 otherwise 15
Provider discussed return visit Equals 1 if observed, 0 otherwise 92
Total score for all the items 7 N = 537 (weighted)

12
Client Perceptions: Assessment of Client Reactions to the Services Provided. The literature
indicates that among the important factors affecting satisfaction are waiting times to receive
services, convenient working hours, and cost. Clients prefer facilities where providers discuss
their issues or problems, ensure confidentiality, and are private. A battery of questions on these
topics was asked of a sample of family planning clients present at Kenyan health facilities on the
day of the survey. These items are indicated in Table 3 below. The client satisfaction score was
obtained from the cumulative sum of these responses based on whether the client reported no
problem with the issue or not. The minimum score was 0 if the client reported having a problem
with all of the issues and the maximum score was 12 if the client had no problem at all
(completely satisfied). The scores were further divided into three categories, as in the case of
provider behaviour and facility readiness.
Table 3. Items for client satisfaction with quality of family planning services at facilities,
Kenya SPA 2004
Item Score Percent of observations
Waiting time 1 if no problem, else 0 68
Discuss problems about health concerns 1 if no problem, else 0 90
Explain problem or treatment 1 if no problem, else 0 88
Quality of examination or treatment provided 1 if no problem, else 0 91
Privacy from others seeing the examination 1 if no problem, else 0 88
Privacy from others hearing consultation or discussion 1 if no problem, else 0 89
Availability of medicines or methods 1 if no problem, else 0 74
Hours of service at facility 1 if no problem, else 0 89
Days of services available at the facility 1 if no problem, else 0 91
Cleanliness of the facility 1 if no problem, else 0 91
Staff treatment 1 if no problem, else 0 92
Other problems 1 if no problem, else 0 92
Total score for all the items 12 N = 537 (weighted)

13
Independent Variables
Facility Readiness. In order to examine the variation in facility readiness to provide services, the
independent variables include the region where the facility is located, the type of facility, and the
managing authority. The region represents a variety of factors such as public differential
investments in facilities and operation in different cultural and social contexts, while the
managing authority represents not only different management systems but also the different costs
of providing service. For example, a public service environment is subsidized by taxation,
whereas a private organisation may charge the full cost of service. The cost element, therefore,
results in different workloads for service providers, with public service providers having higher
workloads and also being more likely to provide services to clientele from various social and
economic strata.
Appropriateness of Method Choice/Informed Consent: Assessment of Provider Actions. For
provider observation, the key independent variables were region where facility is located, type of
facility, and client characteristics (age and level of education). As in the case of facility
readiness, the inclusion of region represents a variety of factors ranging from socio-cultural to
socio-political influences on provision of family services. The literature also indicates that
providers' ability to provide quality care is influenced by factors such as local customs and
traditions, the strength of the facility, and the health care system in which they work (Lantis et
al., 2002). Therefore, the independent variables include facility type, managing authority, and
sex of the provider, in addition to region. The other factors are client characteristics, mainly
educational background and age. An earlier study in Kenya (Ndhlovu, 1995) indicated that
providers tended to serve educated clients better while other studies revealed the selective
treatment of clients according to age.
Client Satisfaction. The clients’ level of satisfaction depends on the local environment as well as
interaction with the health systems. Therefore, variables include region, facility type, and
managing authority. On the other hand, the managing authority may be a proxy for cost, as
public health care is subsidized while the private health care system in Kenya charges full cost.
The other factors included are the individual characteristics (age and level of education). In
addition, some studies have noted the selective provision of family planning services by age and

14
marital status (Potts et al., 1998; Schuler and Hossain, 1998; UNFPA, 1994). Similarly, level of
education may empower the client to demand better services from the provider. An indicator of
whether the provider discussed other methods of family planning was included to act as a proxy
for providing informed choice as well as provider-client interaction. An evaluation study of the
quality of family planning services in eight developing countries conducted by UNFPA indicated
that clients openly expressed their preference for female providers (UNFPA, 1994). Therefore,
we include the sex of the provider as one of the independent variables. Finally, the waiting time
to receive services is included because this is the one factor noted to influence the level of
satisfaction (Williams et al., 2000).
Analytical Approach
Bivariate Analysis. The first level of analysis was the cross-classification of the dependent
variables with each of the independent variables. The mean scores were of each of the
dependent variables by respective independent variables as a measure of the level of facility
readiness, provider service provision, and extent of client satisfaction.
Multivariate Analysis. Each of the dependent variables is polytomous since the outcome falls
into three categories: high, medium, or low. A more appropriate model for analysis is ordinal
regression, often referred to as the ordered response model. The model uses the cumulative
response probabilities Yij = Pr(Y< j) rather than category probabilities for simplicity (McCullagh
and Nelder, 1989) and in its most general form is written as:
Link Yij = {θj –[β1Xi1 +…+ βpXip]}/ exp[τ1Z1+…+ τmZm]
Yij is the cumulative probability of the jth
category for the ith
case.
θj is the threshold parameter sometimes referred to as the cut off parameter for the jth
category.
Xi1 … Xip are predictor variables that influence the response variable.
β1 … βp are the regression coefficients that account for the linear differences in the
response variable (location components).

15
Z1 … Zm are predictor variables that influence the dispersion of the response variable
(scale component).
τ1 … τm are the scale coefficients that account for the differences in variability.
Rather than predicting the cumulative probability, however, the model predicts a function
of those values often called the link function. The link function chosen depends on the nature of
the distribution of the response probabilities (McCullagh and Nelder, 1989). If the response
probabilities are uniformly distributed then the suitable link function is the logit link written as
log γij/(1- γij). For responses that may be skewed, other forms of link functions may be chosen
(McCullagh and Nelder, 1989). The location parameter coefficients (βi) influence the likelihood
of being in a higher/lower category given a change in the location independent variable Xi
constrained by the scale parameter. The coefficients in the scale component account for the
differences due to variability. The cut off parameters are not interpreted but are used to compute
the cumulative probabilities.

16
RESULTS
Descriptive Results
Facility Readiness
Table 4 indicates the distribution of facility variables by counselling dimension (characteristics
as per Table 1) of the facility readiness. The results show that there are no differences by the
facility’s regional location or by type of facility. North Eastern Province had no facility in the
category of high scores although the number of facilities in the sample was small. Overall
government facilities are more likely to have been better prepared to provide counselling
services.

17
Table 4. Percent distribution of background variables by counselling dimension of facility
readiness
Facility characteristics
Percent in category
Number (N) Low Medium High
Region
Nairobi 57% 35% 8% 37
Central 47% 51% 2% 49
Coast 56% 29% 15% 48
Eastern 47% 42% 11% 81
North Eastern 75% 25% 0% 8
Nyanza 43% 43% 15% 54
Rift Valley 57% 36% 7% 124
Western 38% 55% 7% 29
Pearson Chi square= 18.083 P=0.203
Facility Type
Hospital 45% 38% 17% 29
Health centre 42% 47% 10% 125
Clinic 63% 25% 13% 8
Dispensary 54% 38% 8% 248
Maternity 60% 35% 5% 20
Pearson Chi square= 9.008 P=0.342
Managing Authority***
Government 39% 50% 11% 245
Non-government 67% 27% 7% 185
Pearson Chi square= 31.741 P< 0.01
Total 51% 40% 9% 430

18
Table 5 shows the distribution according to the examination room dimension. There are
clear differences by all the facility characteristics (region, type, and the managing authority).
North Eastern province again scored poorly, as in the case for counselling. Although Nyanza and
Western provinces do have a lower proportion of facilities with high scores, the distribution is
quite different, as many of the facilities in these regions are within the category of a medium
level of facility readiness. Similarly, the dispensaries and clinics had low scores for this aspect of
the readiness index. It is evident from Table 1 that the majority of the facilities lacked simple
items for conducting an appropriate examination. In particular, many facilities did not have a
source of light, all sizes of speculum, soap, decontamination solution, and towels and/or a drier
(5 percent).

19
Table 5. Percent distribution of background variables by examination dimension of facility
readiness
Facility characteristics
Percent in category
Number (N) Low Medium High
Region*
Nairobi 58% 28% 14% 37
Central 42% 40% 18% 49
Coast 59% 25% 16% 48
Eastern 41% 46% 13% 81
North Eastern 75% 25% 0% 8
Nyanza 39% 54% 7% 54
Rift Valley 57% 32% 11% 124
Western 43% 50% 7% 29
Total 50% 38% 12% 429
Pearson Chi square= 23.129 P<0.1
Facility Type***
Hospital 36% 25% 39% 28
Health centre 57% 33% 10% 125
Clinic 57% 29% 14% 7
Dispensary 49% 43% 8% 249
Maternity 47% 32% 21% 19
Total 50% 38% 12% 428
Pearson Chi square= 28.750 P<0.01
Managing Authority**
Government 47% 43% 10% 245
Non-government 54% 32% 14% 186
Total 50% 38% 12% 431
Pearson Chi square= 6.234 P< 0.05

20
Contraceptive supplies are the key commodities required for family planning. Table 6
shows the extent to which facilities had all the required methods by facility characteristic. A high
score indicates the facility had nearly all the types of contraception available while a low score
means two or fewer commodities were present at the facility. Availability differs by facility
type, location of the facility, and the managing authority. North Eastern province again has few
facilities that had all the methods available.
Table 6. Percent distribution of background variables by supplies of contraceptive
commodities dimension of facility readiness
Facility characteristic
Percent in category
Number (N) Low Medium High
Region***
Nairobi 51% 11% 38% 37
Central 30% 44% 26% 50
Coast 33% 48% 19% 48
Eastern 40% 26% 34% 80
North Eastern 50% 38% 13% 8
Nyanza 20% 57% 22% 54
Rift Valley 36% 44% 20% 124
Western 24% 48% 28% 29
Total 34% 40% 25% 430
Pearson Chi square= 33.832 P< 0.01
Facility Type***
Hospital 29% 11% 61% 28
Health centre 23% 38% 39% 126
Clinic 38% 38% 25% 8
Dispensary 41% 47% 12% 249
Maternity 25% 20% 55% 20
Total 34% 40% 25% 431
Pearson Chi square= 67.155 P<0.01
Managing Authority***
Government 18% 50% 31% 245
Non-government 56% 27% 17% 185
Total 35% 40% 25% 430
Pearson Chi square= 66.685 P< 0.01
Key: P< 0.01 ***, P< 0.05 **, P< 0.1 *

21
Regarding management, few facilities have recently trained staff on family planning
provision, and in only a third of the facilities did staff have any supervision (see Table 1). Table
7 shows the distribution by facility characteristics for this dimension. In 4 out of 8 provinces no
facility had a high score. Nairobi, with the highest number of facilities falling in the low
category, was the lowest scoring region. Comparing the scores by facility type shows the direct
opposite of the other dimensions. It appears that key aspects of management are present at health
centres and clinics, but not at hospitals.
Table 7. Percent distribution of background variables by management dimension of facility
readiness
Facility characteristic
Percent in category
Number (N) Low Medium High
Region***
Nairobi 92% 8% 0% 37
Central 55% 29% 16% 49
Coast 73% 27% 0% 48
Eastern 74% 16% 10% 81
North Eastern 75% 25% 0% 8
Nyanza 54% 46% 0% 54
Rift Valley 73% 21% 6% 124
Western 45% 48% 7% 29
Total 69% 26% 6% 430
Pearson Chi square= 52.969 P< 0.01
Facility Type
Hospital 89% 11% 0% 28
Health centre 64% 26% 10% 126
Clinic 75% 13% 13% 8
Dispensary 67% 28% 5% 249
Maternity 80% 15% 5% 20
Total 68% 26% 6% 431
Pearson Chi square= 12.519 P= 0.13
Managing Authority***
Government 58% 34% 8% 245
Non-government 83% 14% 3% 185
Total 69% 26% 6% 430
Pearson Chi square= 29.963 P< 0.01

22
In summary, the key differentials occur in three main dimensions of readiness index:
examination room, supplies of commodities, and the management of the services. Table 8 shows
the distribution of the facilities by overall readiness score index. Only 9 percent of the facilities
fell in the high category, while one in three of the facilities had a low score. Western and Central
provinces had the highest number of facilities with high overall index scores, while North
Eastern province had no facility in the high category. The second-to-last column shows the
mean score by each characteristic. The mean score can be regarded as the measure of readiness
to provide quality services. Nairobi and North Eastern provinces scored lowest and were far
below average, followed by Rift Valley province. The highest scores are in Nyanza and Western
provinces. As expected, hospitals are much more ready to provide family planning services
while health centres, surprisingly, appear to be better equipped. The government facilities were
much more ready to provide the services while, rather surprisingly, the non-government facilities
are well below the average score.

23
Table 8. Percent distribution of facilities by variables and overall facility readiness index
Facility Characteristic
Percent in category Mean score
(Range 0-100) Number Low Medium High
Region**
Nairobi 51% 46% 3% 31.3 27
Central 30% 56% 14% 48.6 50
Coast 29% 63% 8% 42.9 49
Eastern 36% 53% 11% 45.4 81
North Eastern 50% 50% 0% 32.1 8
Nyanza 13% 76% 11% 53.7 54
Rift Valley 42% 51% 7% 40.4 123
Western 24% 62% 14% 50.5 29
Total 34% 57% 9% 43.7 431
Pearson Chi square= 25.594 P< 0.05
Facility Type***
Hospital 29% 50% 21% 50.9 28
Health centre 18% 74% 7% 50.5 125
Clinic 50% 38% 13% 37.6 8
Dispensary 43% 49% 9% 39.7 248
Maternity 30% 55% 15% 49.5 20
Total 34% 57% 9% 43.7 429
Pearson Chi square= 31.751 P< 0.01
Managing Authority***
Government 18% 71% 11% 53.0 245
Non-government 55% 38% 8% 32.1 185
Total 34% 57% 9% 43.7 430
Pearson Chi square= 62.097 P< 0.01
Key: P< 0.01 ***, P< 0.05 **, P< 0.1 *

24
Appropriateness of Method Choice/Informed Consent: Assessment of Provider Actions
The items describing the process of consultation with clients by providers are indicated in Table
2. The results indicate a high score for most of the observed items; nevertheless, it is noteworthy
to observe that 1 in 6 consultations were not conducted in an environment that assured both
auditory and visual privacy. About 30 percent did not discuss concerns about the methods. Few
providers (41%) orally assured the clients about confidentiality during consultation. The most
notable finding is that only 15 percent of the providers used visual aids during the consultation.
Table 9 shows the distribution of the providers by performance category and background
characteristics. Based on the items, few providers (12 percent) could be rated as having
performed poorly during the consultations. The main differences occur by region and facility
type. Despite few observations, providers in North Eastern province were more likely to be rated
in the high category. The levels and differentials in performance as measured by the mean score
indicate that providers in Western and Coast provinces performed better. Similarly, despite
having low readiness scores, providers in clinics were more likely to perform better. The most
important differences in provider performance stem from the contextual factors as measured by
the region and facility characteristics and not individual or client characteristics.

25
Table 9. Percent distribution of providers by background characteristics and category of
performance
Background characteristic
Percent In category Mean score
Range (0-7) Number (N) Low Medium High
Region***
Nairobi 25% 47% 28% 4.9 57
Central 1% 30% 68% 4.9 79
Coast 21% 42% 37% 4.4 84
Eastern 4% 56% 40% 4.8 107
North Eastern 0% 17% 83% 6.0 6
Nyanza 5% 44% 51% 4.5 63
Rift Valley 18% 44% 38% 4.8 117
Western 10% 36% 54% 5.5 108
Pearson Chi square= 65.823 P< 0.01
Facility type***
Hospital 12% 39% 49% 5.1 413
Health center 11% 59% 30% 4.7 99
Clinic 4% 54% 43% 5.2 28
Dispensary 12% 50% 39% 4.9 52
Maternity 14% 28% 59% 5.0 29
Pearson Chi square=20.382 P< 0.01
Managing authority
Government-public 12% 42% 45% 4.7 471
Non-government 9% 45% 46% 5.2 147
Pearson Chi square= 1.468 P=0.48
Sex of provider
Male 10% 42% 48% 4.7 137
Female 12% 43% 45% 5.2 484
Pearson Chi square=.944 P= 0.62
Education level of the client
None 3% 50% 47% 4.9 30
Primary 12% 42% 46% 4.9 334
Secondary + 13% 43% 44% 4.7 242
Missing 0% 40% 60% - 15
Pearson Chi square= 2.793 P= 0.59
Age group of the client
15-24 12% 42% 46% 5.4 231
25-34 13% 42% 45% 4.9 288
35-49 10% 46% 44% 4.7 88
Missing 0% 50% 50% - 14
Pearson Chi square= .564 P=0.97
Total 12% 43% 46% 4.8 621
Key: P< 0.01 ***, P< 0.05 **, P< 0.1 *

26
Client Perceptions: Assessment of Client Reactions to the Services Provided
Table 10 shows the distribution of the respondents by level of satisfaction. Client satisfaction
was generally high and only 9 percent of the clients could be considered less than satisfied.
There are no regional differences and the most important factors are the facility type and the
managing authority. In general, client perceptions are notably high based on their responses to
many of the quality of care items asked. Based on the individual items as described in Table 3,
about 10 percent of the clients were not happy with issues on privacy, about 12 percent with
explanations about method, and 25 percent with availability of medicines or methods. The
waiting time to receive services at the facility was considered to be one of the worst aspects of
service provision.
Table 10. Percent distribution of client by background characteristics and category of
satisfaction rating
Background characteristic
Percent in category Mean score
Range (0-12) Number (N) Low Medium High
Region
Nairobi 9% 49% 42% 10.4 57
Central 14% 54% 32% 10.1 79
Coast 4% 62% 35% 10.8 84
Eastern 8% 54% 38% 10.6 107
North Eastern 0% 50% 50% 11.1 6
Nyanza 16% 51% 33% 9.4 63
Rift Valley 9% 47% 44% 10.4 117
Western 6% 57% 38% 10.5 108
Pearson Chi square= 16.635 P= 0.276
Type of facility***
Hospital 10% 54% 36% 10.2 413
Health centre 7% 61% 32% 10.2 99
Clinic 4% 54% 43% 10.8 28
Dispensary 8% 54% 39% 10.7 52
Maternity 3% 21% 76% 11.4 29
Pearson Chi square= 21.677 P< 0.01
(Cont’d)

27
Table 10 – cont’d
Background characteristic
Percent in category Mean score
Range (0-12) Number (N) Low Medium High
Managing authority***
Government-public 10% 58% 32% 10.1 474
Government-nonpublic 4% 38% 58% 11.3 147
Pearson Chi square= 32.889 P< 0.01
Sex of the provider
Male 9% 58% 34% 10.5 137
Female 9% 52% 39% 10.4 484
Pearson Chi square= 1.497 P=0.473
Level of education of respondent
None 3% 57% 40% 11.2 30
Primary 8% 52% 40% 10.6 334
Secondary + 5% 57% 37% 10.5 242
Missing 80% 7% 13% - 15
Pearson Chi square= 2.966 P= 0.564
Age of respondent
15-24 6% 55% 39% 10.7 231
25-34 7% 56% 37% 10.7 288
35-49 9% 47% 44% 10.3 88
Missing 86% 14% 0% - 14
Pearson Chi square= 3.202 P=0.525
Waiting time***
0-30 min 3% 44% 53% 10.9 319
31-60 min 6% 66% 28% 10.5 113
61 or more min 16% 68% 17% 10.1 164
Missing 48% 24% 28% - 25
Pearson Chi square= 83.965 P< 0.01
Provider talked about other methods
No 11% 53% 36% 269
Yes 7% 54% 39% 352
Pearson Chi square= 3.154 P< 0.207
Total 9% 54% 38% 10.4 621
Key: P< 0.01 ***, P< 0.05 **, P< 0.1 *

28
Multivariate Analysis
Tables 11-13 show the multivariate ordinal regression results for each of the independent
variables. The estimates for both location and scale parameters are presented as cumulative odds
ratios (Agresti, 2002). Ratios greater than one represent the relative likelihood of receiving a
higher ranked score compared to the reference category. Where the model estimates include
scale parameters for better fit, their estimates represent the extent to which the dispersion
depends on the factor included in that part of the model. Values greater than one represent the
extent to which the category tends to disperse compared to the reference category.
Facility Readiness
Only a limited number of factors were considered in the analysis of facility readiness. Once other
factors are controlled for, facilities in North Eastern and Eastern provinces are less likely to be
ready to provide quality of care compared to other regions. But the result for Eastern province is
just marginally significant. Notably, health centres and dispensaries are less likely to provide
adequate quality service compared to other facility types. In addition, much of the variation on
the readiness index is caused by the health centre factor. The coefficient on the scale parameter
indicates that variation is towards the lower tail, and therefore tends to lower readiness scores.
One of the most significant differences is by type of managing authority. Government facilities
were more ready to provide better family planning services once region and facility type were
controlled for.

29
Table 11. Cumulative odds ratio estimates for ordinal regression on facility readiness
Facility readiness
Odds ratio (exp B) 95% confidence interval
Threshold (cut off )
[Low] 0.37** 0.17 0.79
[Medium] 3.44** 1.58 7.53
[High](REF)
Location parameters
Region
Nairobi 0.71 0.39 1.29
Central 1.05 0.60 1.82
Coast 1.10 0.63 1.93
Eastern 0.55* 0.30 1.01
North Eastern 0.26*** 0.11 0.58
Nyanza 0.72 0.41 1.28
Rift Valley 0.64 0.36 1.12
Western(REF)
Facility
Hospital 0.72 0.39 1.36
Health centre 0.41** 0.19 0.86
Clinic 0.68 0.32 1.45
Dispensary 0.25*** 0.10 0.59
Maternity(REF)
Managing authority
Government 4.64*** 2.44 8.80
Non-Government (REF) 1.00
Scale parameters
Facility
Hospital 0.74 0.50 1.12
Health centre 0.46*** 0.28 0.76
Clinic 1.07 0.66 1.74
Dispensary 0.72 0.45 1.16
Maternity(REF)
Number of Valid Responses (N) 405
Pseudo R square 0.30
Percent Predicted Correctly 64
Key: P< 0.01 ***, P< 0.05 **, P< 0.1 *

30
Appropriateness of Method Choice/Informed Consent: Assessment of Provider Actions
For provider observation, there are no differences in the provider observation score by sex of the
provider, age of the client, or educational attainment of the client. Similarly, the data show no
variations by type of facility or the managing authority. The only differences appear to occur by
the facility’s regional location. Providers in Nairobi, Coast, and Rift Valley provinces were more
likely to have poorer scores (Table 12).
Table 12. Cumulative odds ratio estimates for ordinal regression on assessment of provider
actions
Odds ratio 95% confidence interval
Threshold (cut off ) [High(REF)]
[Low] 0.10*** 0.03 0.39
[Medium] 0.68 0.27 1.71
Location parameters
Region [Western(REF)]
Nairobi 0.36*** 0.17 0.77
Central 1.82 0.98 3.41
Coast 0.41*** 0.21 0.80
Eastern 0.68 0.42 1.10
North Eastern 3.08 0.36 26.16
Nyanza 0.74 0.43 1.26
Rift Valley 0.46** 0.25 0.85
Facility[ Maternity(REF)]
Hospital 0.77 0.33 1.79
Health centre 0.59 0.25 1.36
Clinic 0.70 0.29 1.71
Dispensary 0.45 0.18 1.12
Managing authority [Non-government (REF)]
Government 0.80 0.55 1.17
Sex of provider [Female(REF)]
Male 1.29 0.91 1.84
Age of respondent [35-39(REF)]
15-24 1.73 0.88 3.38
25-34 1.03 0.78 1.35
Education of respondent [ Secondary+(REF)]
None 1.46 0.92 2.30
Primary 1.29 0.85 1.96
(Cont’d)

31
Table 12 – cont’d
Odds ratio 95% confidence interval
Scale parameters
Facility Maternity(REF)
Hospital 0.93 0.52 1.66
Health centre 0.58 0.31 1.07
Clinic 0.55 0.26 1.18
Dispensary 0.73 0.37 1.42
Number of Valid Responses (N) 604
Pseudo R square 0.14
Percent Predicted Correctly 51
Key: P< 0.01 ***, P< 0.05 **, P< 0.1 *
Client Satisfaction
Unlike previous regression results, the client satisfaction score does not depend on the client’s
region of residence (Table 13). However, there are clear facility differences once other factors
are controlled for. Relative to the maternity, clients were less likely to have higher levels of
satisfaction in all other facilities with clinics having much stronger effect. In addition, clients
were more likely to be satisfied by services offered in non-government facilities. The waiting
time to receive services is extremely important. Shorter duration means higher level of
satisfaction. One surprising result is that clients are less likely to be satisfied when served by
male providers. None of the individual characteristics (age and education) influence the clients’
relative ranking of satisfaction of the services.

32
Table 13. Cumulative odds ratio estimates for ordinal regression client satisfaction
Odds ratio 95% confidence interval
Threshold (cut off ) [High](REF)
[Low] 0.01*** 0.00 0.05
[Medium] 0.49 0.13 1.86
Location parameters
Region [Western(REF)]
Nairobi 0.76 0.36 1.61
Central 0.57 0.29 1.12
Coast 0.72 0.38 1.35
Eastern 1.31 0.72 2.36
North Eastern 1.42 0.26 7.89
Nyanza 0.46** 0.23 0.92
Rift Valley 0.91 0.52 1.61
Facility[ Maternity(REF)]
Hospital 0.31** 0.10 0.92
Health centre 0.23** 0.08 0.72
Clinic 0.14** 0.04 0.50
Dispensary 0.31 0.09 1.04
Managing authority [Non-Government (REF)]
Government 0.39*** 0.24 0.63
Sex of provider [Female(REF)]
Male 0.58** 0.38 0.88
Age of respondent [35-39(REF)]
15-24 0.98 0.56 1.72
25-34 0.73 0.42 1.26
Education of respondent[ Secondary+(REF)]
None 1.08 0.46 2.52
Primary 1.27 0.88 1.83
Waiting time to service [61 or more minutes (REF)]
30 min or less 5.86*** 3.71 9.26
31-60 min 2.29*** 1.35 3.88
Provider talk about other methods [Yes(REF)]
No 0.73* 0.50 1.05
Number of Valid Responses (N) 591
Pseudo R square 0.25
Percent predicted correctly 63
Key: P< 0.01 ***, P< 0.05 **, P< 0.1 *

33
Facility Readiness, Provider Service Provision, and Client Satisfaction Simulated Results
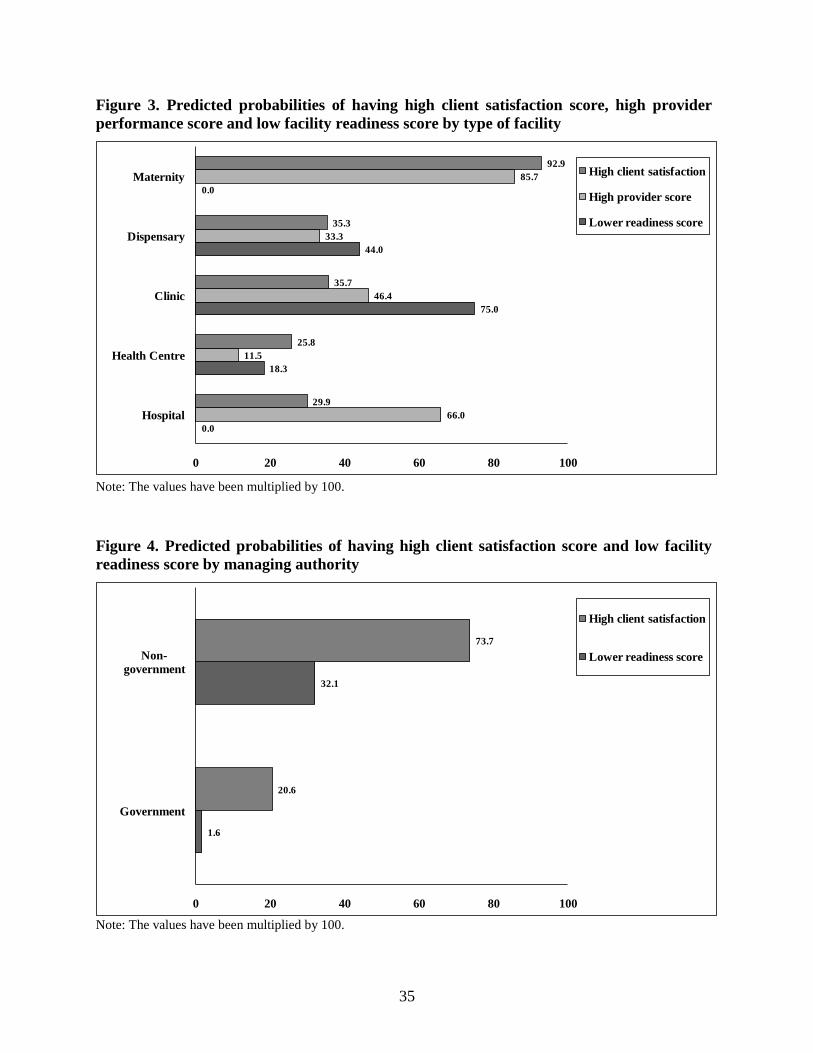
The results can be viewed much more clearly when predicted probabilities are utilized. Figures
2-4 represent the predicted proportions (they have been multiplied by 100 for clarity) of high
client satisfaction, high provider performance score, and lower facility readiness by region,
facility type, and managing authority. Interesting results come from Nyanza, North Eastern,
Coast, and Nairobi provinces. Nyanza has fewer clients (10%) reporting higher satisfaction
levels, but has high-performing providers when all other factors are controlled for (Figure 2).
North Eastern province, despite having less-ready facilities (67% in lower rank), does have both
high-performing providers and a higher proportion of more satisfied clients. The Coast province,
despite having few facilities with low scores in readiness, still has fewer satisfied clients in
addition to rather poorly performing providers.
The most consistent facilities are the maternity homes, which are more ready (none fell in
low readiness category) and have better performing providers and more satisfied clients.
Hospitals, with better facilities and better performing providers, still have a lower proportion of
satisfied clients. Clinics, health centers, and dispensaries show contrast with less highly satisfied
clients, relatively low performing providers, and less readiness to provide the required services.

34
Figure 2. Predicted probabilities of having high client satisfaction score, high provider
performance score, and low facility readiness score by region
45.9
14.3
18.8
37.0
66.7
30.2
40.3
7.1
14.5
100.0
15.5
66.7
100.0
85.2
10.5
90.6
39.6
24.0
23.0
46.5
66.7
10.2
32.7
42.2
0 20 40 60 80 100
Nairobi
Central
Coast
Eastern
North Eastern
Nyanza
Rift Valley
WesternHigh client satisfaction
High provider score
Lower readiness score
Note: The values have been multiplied by 100.
35
Figure 3. Predicted probabilities of having high client satisfaction score, high provider
performance score and low facility readiness score by type of facility
0.0
18.3
75.0
44.0
0.0
66.0
11.5
46.4
33.3
85.7
29.9
25.8
35.7
35.3
92.9
0 20 40 60 80 100
Hospital
Health Centre
Clinic
Dispensary
MaternityHigh client satisfaction
High provider score
Lower readiness score
Note: The values have been multiplied by 100.
Figure 4. Predicted probabilities of having high client satisfaction score and low facility
readiness score by managing authority
1.6
32.1
20.6
73.7
0 20 40 60 80 100
Government
Non-
government
High client satisfaction
Lower readiness score
Note: The values have been multiplied by 100.

36
DISCUSSION AND CONCLUSIONS
In this study, we examined factors associated with each of three elements of quality family
planning service provision. Since there are several dimensions to the measurement of quality of
care depending on the availability of data, we looked at the factors associated with good
performance in facility readiness, provider behaviour during the course of service provision, and
the extent of client satisfaction. However, one limitation of the study is the inability to determine
the relative effect of these factors on client contraceptive use or intentions.
Descriptive data indicates that facilities’ readiness to provide quality of care is not yet
satisfactory. Many facilities lacked essential but simple care instruments and guidelines for
performance. Nearly all facilities have oral contraceptives, injectables, and condoms, but
implants and IUDs are readily available in only hospitals and a few maternity homes. Although
results are not shown, it was also evident that a substantial proportion of providers did not inform
clients about other methods. The indication here is that the majority of facilities still lack a
variety of methods. In order to provide complete services, clinics, health centres, and
dispensaries need to be upgraded to provide a variety of methods. The other intriguing fact is the
lack of training of providers in several facilities. In addition, few facilities evidenced regular staff
supervision. Lack of staff supervision and training is, however, more predominant in Nairobi, the
capital city, which may imply some structural management issues.
The multivariate results confirm regional and facility differences in the relative readiness
to provide quality services. North Eastern Province, which is fairly remote compared to other
provinces in Kenya, appears to be considerably disadvantaged. The disadvantages may be due to
other factors such as lack of supportive infrastructure to the health care system including the
ability to recruit and retain qualified staff.

37
In general, health centres are also not adequately prepared to provide quality family
planning services. The low mean scores of the readiness index are partly due to the low scores
from health centres. On the other hand the government-supported facilities are more likely to
have appropriate service provision s compared to the non-government facilities.
The descriptive data indicate that providers were unlikely to use visual aids during
consultation. While visual aids (including manuals, posters, flipcharts, and flowcharts) can be
valuable and inexpensive tools (Knebel et al., 2000), their use during consultation may be
controversial, as some providers feel that using visual aids decreases their credibility with clients
while others may be inadequately trained and supervised in using visual aids (RamaRao and
Mohanam, 2003). Nevertheless, studies have indicated that visual aids help clients choose the
method that matches their reproductive goals and also enhances better quality of care
expectations (León, 2001). An earlier situation analysis in Kenya found that providers who used
contraceptive samples and anatomical models during counselling sessions gave clients more
information about their chosen contraceptive method (Ndhlovu, 1998).
We examined whether provider behaviour differed by age of the client or educational
characteristics. Our results confirm a lack of provider bias due to either age or education of the
client. Despite the fact that facilities differ in their readiness to provide appropriate services,
there were no differences in provider behaviour by either facility type or managing authority.
The observed regional differences in provider behaviour may be due to other factors that may not
have been accounted for here. Providers living in difficult areas may be less motivated to provide
services due to the living conditions, especially when they are not the indigenous people. Rift
Valley and Coast provinces do have facilities that are located in relatively difficult areas to live
in, but this may not be true for Nairobi. One may argue that the high cost of living in Nairobi

38
results in providers focusing their attention more in the private clinics to supplement their
income, hence paying less attention to the regular duties in their facilities. Nevertheless, this may
only be true for providers in the public sector rather than the private sector. However, it was also
noted from initial bivariate analysis that Nairobi providers were less likely to be supervised and
provided with on the job retraining (data not shown). For more information on provider
behaviour, additional elements may be necessary to reliably measure the extent of provider
behaviour. Nevertheless, the scores obtained from our measure indicate high performance.
Client perceptions are shaped by cultural values, previous experiences, perceptions of the
role of the health system, and interactions with providers (Lantis et al., 2002; Miller, 1998) but
results obtained here indicate lack of regional differences. The most important factor related to
client perceptions is the waiting time for services. This could explain the observed differences in
client satisfaction by facility types. Most of the maternity facilities are managed by non-
government organisations, are fee–based, and are less likely to be crowded. Therefore, they have
a shorter waiting time to receive services. On the other hand, the government-managed facilities
are more likely to have many customers and constant staff shortages, resulting in a longer
waiting time to receive services and leading to decreased client satisfaction. This is more
predominant in health centres and dispensaries. Client satisfaction is also likely to be influenced
by the facility’s readiness; therefore, clients are also likely to rate government facilities lower
compared to other facilities.
We find that clients were less satisfied in Nyanza province, despite the fact that Nyanza
had more-ready facilities and high-performing providers. In contrast, North Eastern province had
less-ready facilities, but registered high client satisfaction and high provider performance. These
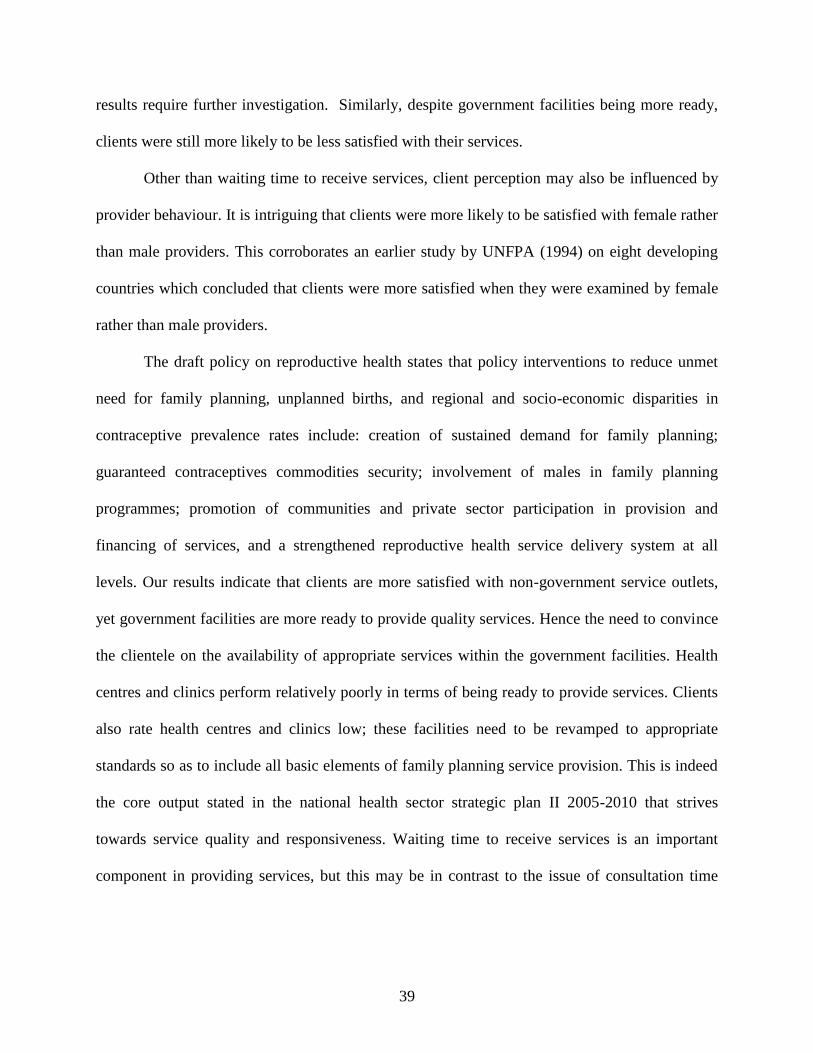
39
results require further investigation. Similarly, despite government facilities being more ready,
clients were still more likely to be less satisfied with their services.
Other than waiting time to receive services, client perception may also be influenced by
provider behaviour. It is intriguing that clients were more likely to be satisfied with female rather
than male providers. This corroborates an earlier study by UNFPA (1994) on eight developing
countries which concluded that clients were more satisfied when they were examined by female
rather than male providers.
The draft policy on reproductive health states that policy interventions to reduce unmet
need for family planning, unplanned births, and regional and socio-economic disparities in
contraceptive prevalence rates include: creation of sustained demand for family planning;
guaranteed contraceptives commodities security; involvement of males in family planning
programmes; promotion of communities and private sector participation in provision and
financing of services, and a strengthened reproductive health service delivery system at all
levels. Our results indicate that clients are more satisfied with non-government service outlets,
yet government facilities are more ready to provide quality services. Hence the need to convince
the clientele on the availability of appropriate services within the government facilities. Health
centres and clinics perform relatively poorly in terms of being ready to provide services. Clients
also rate health centres and clinics low; these facilities need to be revamped to appropriate
standards so as to include all basic elements of family planning service provision. This is indeed
the core output stated in the national health sector strategic plan II 2005-2010 that strives
towards service quality and responsiveness. Waiting time to receive services is an important
component in providing services, but this may be in contrast to the issue of consultation time

40
with providers. Nevertheless, the efficacy of the services will depend heavily on customer
perception.

41
REFERENCES
Abdel-Tawab, N., and N. Roter, 2002. The relevance of client centred communication to family
planning settings in developing countries: Lessons from Egyptian experience. Social
Science and Medicine 54(9): 1357-1368.
Agresti, Alan, 2002. Categorical Data Analysis. A. John Wiley and Sons, Inc. Hoboken, New
Jersey, Second Edition.
Bailey, W, K. Hardee, S. Smith, M. Villinski, O. McDonald, and M. Clyde, 1995. Geographical
and medical barriers to family planning services in rural Jamaica. Pp. 326-37 in Gender,
Health, and Sustainable Development: Perspectives from Asia and the Caribbean. JH
Roberts, J Kitts, LJ Arsenault, eds. Ottawa, Canada: International development Research
Centre.
Best, Kim, 2002. Medical Barriers Often Unnecessary. Network 21(3): 4-15.
Blanc, A.K., S.L. Curtis, and T.N. Croft, 2002. Monitoring contraceptive discontinuation: Links
to fertility outcomes and quality of care. Studies in Family Planning, 33(2): 127-140.
Bruce, J., 1990. Fundamental elements of the quality of care: A simple framework. Studies in
Family Planning 21(2): 61-91.
Campbell, M., N.N. Sahin-Hodoglugil, and M. Potts, 2006. Barriers to fertility regulation: A
review of literature. Studies in Family Planning 37(2): 87-98.
Central Bureau of Statistics (CBS) [Kenya], Ministry of Health (MOH) [Kenya], and ORC
Macro, 2004. Kenya Demographic and Health Survey 2003. Calverton, Maryland: CBS,
MOH, and ORC Macro.
Costello, M., M. Lacuesta, S. RamaRao, and A. Jain, 2001. Client-centered approach to family
planning: The Davao project. Studies in family planning 32(4): 302-314.

42
Creel, L C., J V. Sass, and N V. Yinger, 2002. Client-Centered Quality: Clients’ Perspectives
and Barriers to Receiving Care New Perspectives on Quality of Care No. 2. Population
Council, New York.
Hong, R., L. Montana, and V. Mishra, 2006. Family planning services quality as a determinant
of use of IUD in Egypt. BMC Health Services Research, (6)79
http://www.biomedcentral.com/1472-6963/6/79
Hotchkiss, D.R., R.J. Magnani, J.J. Rous, T.A. Mroz, M. Azelmat, and J. Heikel, 1999. The
effects of maternal–child health service utilization on subsequent contraceptive use in
Morroco. Journal of Biosocial Science 31(2): 145-165.
Jain, Anrudh K., 1989. Fertility Reduction and the Quality of Family Planning Services. Studies
in Family Planning, 20(1): 1-16.
Kelley E., and M. Boucar, 2000. Helping District Teams Measure and Act on Client Satisfaction
Data in Niger. Operations Research Results 1, No. 1. Bethesda, MD: U.S. Agency for
International Development, Quality Assurance Project.
Knebel et al., 2000. The Use of Manual Job Aids by Health Care Providers: What Do We Know?
QA Issue Papers, No. 1. Bethesda, MD: Quality Assurance Project.
Kumar, S., A. Jain, and J. Bruce, 1989. Assessing the quality of family planning services in
developing countries. Programs Division Working Paper, No 2. New York: Population
Council.
Lantis, K., C.P. Green, and S. Joyce, 2002. Providers and quality of care. New Perspectives on
Quality of Care, No. 3. Population Council, New York.
León, F R., 2001. The Job Aids–assisted Balanced Counseling Strategy Causes Positive Effects
on Essential Provider’s Service Behaviors. Peru PCI-QoC Project Bulletin 8(15) June.

43
Magadi, A.M., and S.L. Curtis, 2003. “Trends and determinants of contraceptive method choice
in Kenya”. Studies in Family Planning, 34(3): 149-159.
Magnani, R., D.R. Hotchkiss, C.S. Florence, and L.A. Schafer, 1999. The impact of family
planning supply environment on contraceptive intentions and use in Morroco. Studies in
Family Planning 30(2): 120-132.
McCullagh, P. and J.A. Nelder, 1989. Generalized Linear Models. London, Chapman and Hall.
2nd
Edition.
McDonald O., K. Hardee, W. Bailey, M. Clyde, M. Villinski, 1995. Quality of care among
Jamaican private physicians offering family planning services. Advances in
Contraception 11: 245-254.
Mensch, B., M. Arends-Kuenning, and A. Jam, 1996. The impact of the quality of family
planning services on contraceptive use in Peru. Studies in Family Planning 27(2): 59-75.
Miller et al., 1998. How Providers Restrict Access to Family Planning Methods: Results From
Five African Countries, in Clinic-Based Family Planning and Reproductive Health
Services in Africa: Findings From Situation Analysis Studies, ed. Kate Miller et al. New
York: Population Council.
Ministry of Health, 2005. The National Health Sector Strategic Plan II. Government of Kenya.
National Coordinating Agency for Population and Development (NCAPD), Ministry of Health
(MOH) [Kenya], Central Bureau of Statistics (CBS) and ORC Macro, 2005. Kenya
Service Provision Assessment (KSPA) 2004. Nairobi, Kenya.
Ndhlovu, L., 1995. Quality of Care of Family Planning Service Delivery of Kenya: Clients’ and
Providers’ Perspectives, Final Report. Nairobi, Kenya: Division of Family Health,
Ministry of Health, and New York: Population Council.

44
Ndhlovu, L., 1998. Determinants of Quality of Family Planning Services: A Case Study of
Kenya, in Client-Based Family Planning Services in Africa: Findings from Situation
Analysis Studies, ed. Kate Miller et al. New York: Population Council: 107-24.
Potts, M., J. Rooks, and B.Y. Holt, 1998. How to improve family planning and save lives using a
stage-of-life approach. International Family Planning Perspectives 24(4): 195.
RamaRao, S., M. Lacuesta, M. Costello, B. Pangolibay, and H. Jones, 2003. The link between
quality of care and contraceptive use. International Family Planning Perspectives 29(2):
76-83.
RamaRao, S., and R. Mohanam, 2003. The quality of family planning programs: Concepts,
measurements, interventions, and effects. Studies in Family Planning 34(4): 227-248.
Rutenberg, N., and S.C. Watkins, 1997. The buzz outside the clinics: Conversations and
contraception in Nyanza province, Kenya. Studies in Family Planning 28(4): 290-307.
Sadasivam, B., 1995. Female Staff, Sensitive Care: Indonesian Clinics Draw Clients, UNICEF
Feature No. 00152.IDS. New York: UNICEF.
Schuler, R.S., L.M. Bates, and M.K. Islam, 2001. Persistence of a service delivery 'culture':
findings from a qualitative study in Bangladesh. International family Planning
Perspectives 27(4): 194-200.
Schuler, R.S., and Z. Hossain. 1998. Family planning clinics through women’s eyes and voices:
A case study from rural Bangladesh. International Family Planning Perspectives 24(4):
170-175, 205.
Shelton J.D., M.A. Angle and R.A. Jacobsein, 1992. Medical Barriers to Access to Family
Planning, Lancet 340, No. 8831(28): 1334-35.

45
Speizer, I., D.R. Hotchkiss, R.J. Magnani, B. Hubbard, and K. Nelson, 2000. Do service
providers in Tanzania unnecessarily restrict access to contraceptive methods?
International Family Planning Perspectives 26(1): 13-20, 42.
Steele F., S.L Curtis., and M.K. Choe. 1999. The impact of family planning service provision on
contraceptive-use dynamics in Morocco. Studies in Family Planning 30(1): 28-42.
United Nations Population Fund (UNFPA), 1994. Quality of family planning services. Office of
Oversight and Evaluation, New York.
Weeks J.R., 1993. Service provider attitudes toward natural family planning. Advances in
Population: Psychosocial Perspectives 1: 125-155.
Williams, T., J. Schutt-Anne, and Y. Cuca, 2000. Measuring family planning service quality
through client satisfaction exit interviews. International Family Planning Perspectives
26(2): 57-73.