Embed Size (px)
Citation preview

1
Molecular Breeding
June 2012, Volume 30, Issue 1, pp 9-21
Assessment of ICCV 2 × JG 62 chickpea progenies shows
sensitivity of reproduction to salt stress and reveals QTL for
seed yield and yield components
Vincent Vadez, L. Krishnamurthy, Mahendar Thudi, Chetukuri Anuradha, Timothy D.
Colmer, Neil C. Turner, Kadambot H. M. Siddique, Pooran M. Gaur, Rajeev K. Varshney
DOI: http://dx.doi.org/10.1007/s11032-011-9594-6
This is author version post print archived in the official Institutional Repository of
ICRISAT www.icrisat.org
Assessment of ICCV 2 × JG 62 chickpea progenies shows sensitivity of
reproduction to salt stress and reveals QTLs for seed yield and yield
components
Vincent Vadez1*, L. Krishnamurthy1, Mahendar Thudi1, Chetukuri Anuradha2,
Timothy D. Colmer3,4,5, Neil C. Turner3,4, Kadambot H.M. Siddique3,4, Pooran M.
Gaur1 and Rajeev K. Varshney1,5,6
1International Crops Research Institute for the Semi-Arid Tropics (ICRISAT), Patancheru 502
324, Andhra Pradesh, India 2 Acharya NG Ranga Agricultural University, Rajendranagar, Hyderabad 500 030, AP, India 3Centre for Legumes in Mediterranean Agriculture; 4The UWA Institute of Agriculture; The University of Western Australia, 35 Stirling Highway,
Crawley, WA 6009, Australia

2
5School of Plant Biology; Faculty of Natural and Agricultural Sciences, The University of
Western Australia, 35 Stirling Highway, Crawley, WA 6009, Australia 6Genomics towards Gene Discovery Sub Programme, Generation Challenge Programme (GCP), c/o CIMMYT, Int APDO Postal 6-641, 06600 Mexico DF, Mexico.
* Author for correspondence: E-mail: [email protected]
Date of submission of revised manuscript: 15th May, 2011
Number of tables: 2
Number of figures: 7
Supplementary figures: 3
Short running title: Traits and QTLs for salinity tolerance in chickpea

3
Assessment of ICCV 2 × JG 62 chickpea progenies shows sensitivity of
reproduction to salt stress and reveals QTLs for seed yield and yield
components
Vincent Vadez1*, L. Krishnamurthy1, Mahendar Thudi1, Chetukuri Anuradha2,
Timothy D. Colmer3,4,5, Neil C. Turner3,4, Kadambot H.M. Siddique3,4, Pooran M.
Gaur1 and Rajeev K. Varshney1,5,6
1International Crops Research Institute for the Semi-Arid Tropics (ICRISAT), Patancheru 502
324, Andhra Pradesh, India 2 Acharya NG Ranga Agricultural University, Rajendranagar, Hyderabad 500 030, AP, India 3Centre for Legumes in Mediterranean Agriculture; 4The UWA Institute of Agriculture; The University of Western Australia, 35 Stirling Highway,
Crawley, WA 6009, Australia 5School of Plant Biology; Faculty of Natural and Agricultural Sciences, The University of
Western Australia, 35 Stirling Highway, Crawley, WA 6009, Australia 6Genomics towards Gene Discovery Sub Programme, Generation Challenge Programme (GCP),
c/o CIMMYT, Int APDO Postal 6-641, 06600 Mexico DF, Mexico.
* Author for correspondence: [email protected]
Abstract
Salinity is a complex abiotic stress and understanding the physiological and genetic basis
of salinity tolerance is a prerequisite for improving existing crop cultivars. Experiments
were undertaken using 126 recombinant inbred lines from a cross between JG 62
(tolerant) and ICCV 2 (sensitive) to characterize traits related to seed yield differences
under saline conditions and to map quantitative trait loci (QTL). The population
segregated for flowering time and entries were separated into ‘early’ and ‘late’ phenology
groups to undertake the analysis. In both groups seed yield varied under salinity, with
4
seed number being the most closely related trait to yield. In contrast, seed yield was not
related to 100-seed weight or flowering time. Shoot dry weight was positively correlated
with seed yield in the early entries only, but had no significant relationship with seed
number. The higher sensitivity to salinity of the early entries was related both to a smaller
biomass and lesser seed number under saline conditions. A QTL for seed yield under
saline conditions was found in linkage group 3 in the late group, and a cluster of QTLs
for seed yield components in linkage group 6, including a QTL for seed number which
explained 37% of the variation. In contrast, no QTL for seed yield was found in the early
group, but a QTL for seed number under saline conditions was found. These data indicate
that salinity tolerance traits are linked to the degree of earliness in chickpea. Tolerance is
determined by the success of reproductive sites in both early and late entries, which
relates in part to constitutive traits, and by the capacity of maintaining growth in early-
flowering lines only. This is the first report of QTLs for seed yield and seed number in
chickpea exposed to salinity.
Key words Salinity . Chickpea . Recombinant Inbred Lines . Quantitative Trait Loci .
Yield . Seed Number . Days to flowering .
Introduction
Salt stress is one of the major abiotic stresses—ranking only second to drought—which
affects crop productivity in many parts of the world (Rangasamy 2006). Salinity
continues to increase due to mobilization of salts to the root zone (secondary salinity)
owing to changes in the pattern of vegetation cover in many regions. There are increasing
numbers of cases where salinity occurs from mismanaged irrigation practices, especially
in areas where evaporation is high. Thus, salinity is an increasing threat for agriculture in
many regions.
Chickpea is sensitive to salinity (Lauter and Munns 1986; reviewed by Flowers et al.
2010) and field salinization in part explains the displacement of chickpea production
from north India to south India. Recent reports, however, show large variation in seed

5
yield among a large, representative set of chickpea genotypes (Vadez et al. 2007;
Krishnamurthy et al. 2011). Despite the relative sensitivity of chickpea to salt stress,
tolerant and sensitive lines exist that can be used to better understand tolerance
mechanisms and assist in breeding lines with improved tolerance (Munns and Tester
2008). In previous research, lines ICCV 2 and JG 62, parents of an existing mapping
population developed for double poddedness in chickpea (Cho et al. 2002), were reported
as sensitive and tolerant (low and high seed yield under salinity), respectively (Vadez et
al. 2007). This provided an opportunity to identify traits related to differences in
tolerance and to map quantitative trait loci (QTLs) for such traits, within this population.
Seed yield under salinity, measured in a short season environment, was related to
flowering time in chickpea and followed an inverted parabola, with an optimum about 55
days after sowing (Vadez et al. 2007). Both early and late maturing genotypes yielded
less well, whereas mid-duration lines tended to have the highest yields under saline
stress. Since ICCV 2 flowers early (about 30–35 days after sowing), about 10 days earlier
than JG 62, their phenological differences explain in part their yield differences under
saline conditions. Therefore, an important question is addressed here about the
segregation for seed yield under salinity in ICCV 2 × JG 62 recombinant inbred lines
(RIL) progenies and its relation to their segregation for flowering time. A second
question is whether QTLs for seed yield and putatively related traits can be identified
within or across ‘early’ and ‘late’ groups for flowering time. Two years of testing are
reported, in which different severities of salt stress were imposed in an outdoor
artificially-salinized soil pot system, enabling discrimination for salt tolerance amongst
the RILs.
Although many studies have evaluated salinity tolerance in chickpea on the basis of
biomass differences at vegetative stages (see Flowers et al. 2010), recent work has clearly
shown that salinity tolerance is not related to the capacity of genotypes to maintain
biomass production or to fill seeds (seed size) under salt stress (Vadez et al. 2007).
Rather, tolerance was related to the capacity of genotypes to maintain a large number of
seeds (i.e. filled pods), indicating that salt tolerance in chickpea is related to tolerance of
reproductive sites (Mamo et al. 1996; Katerji et al. 2001; Samineni et al. 2011). Such
relationships and mechanisms have not been tested in early maturing chickpea lines; such

6
research is needed since chickpea production is expanding in short cropping season
environments (http://test1.icrisat.org/ChickPea/Chickpea.htm).
The overall objective of this work was to map QTLs for salinity tolerance, using 126
RILs from a cross between salt sensitive ICCV 2 and salt tolerant JG 62. The specific
objectives were: (i) to evaluate the interdependence of salt tolerance and flowering time;
(ii) to test the relationship between seed yield under saline and non-saline conditions; (iii)
to test the relationship between seed yield and its components (shoot biomass, seed and
pod numbers, 100-seed weight) under salt stress; and (iv) to identify QTLs for seed yield
and components, within and across two maturity groups.
Materials and Methods
Plant growth and treatment applications
Two experiments were carried out in two different growing seasons, 2005–06 and 2007–
08. Plants were grown under saline and non-saline conditions in 27 cm diameter pots
containing 7.5 kg of vertisol soil from the International Crops Research Institute for the
Semi-Arid Tropics (ICRISAT) farm, as previously reported (Vadez et al. 2007). The soil
was fertilized with diammonium phosphate and muriate of potash, both at a rate of 300
mg kg-1 soil. The experiments were carried out between November and February (planted
on 22 Nov 2005 and 3 Nov 2007) at ICRISAT headquarters (Patancheru, AP, India) in an
open-air facility equipped with portable rainout shelters to prevent interference from
possible rain. The average maximum and minimum temperatures were 29.4 and 12°C,
respectively, in 2005–06, and 29.8 and 13.9C in 2007–08.
In 2005–06, the saline treatment had 8.77 g NaCl pot-1 (equivalent to 1.17 g NaCl kg-1
soil) applied at sowing as 80 mM NaCl solution in a sufficient volume to wet the soil to
field capacity (1.875 L pot-1 = 25% w/w). In 2007–08, salt application was increased to
10.96 g NaCl pot-1 (equivalent to 1.46 g NaCl kg-1 soil) to increase the discrimination
between entries. In 2007–08, the treatment was applied in two half-doses (equivalent to
5.48 g NaCl pot-1 each time), as 1.875 L of a 50 mM NaCl solution at sowing and 1.0 L
of a 94 mM NaCl two weeks after sowing, which together is equivalent to a 1.875 L of a

7
100 mM NaCl solution. Thereafter, pots were watered with tap water containing no
significant amount of NaCl. The bottoms of the salinity-treated pots were sealed to avoid
any salt leakage, while those of the non-saline controls contained drainage holes. Utmost
care was taken to avoid over-watering the salinity-treated pots, whilst maintaining pots
close to field capacity to avoid any increase in salt concentration. This was achieved by
applying a set amount of water to all pots, and this amount was set at each re-watering to
the amount of water needed by the smallest plants in the trial. Thereafter, the largest
plants in the trial received additional water to replace that used, based on the dryness of
soil in these particular pots and on experience from several years running such large scale
experiments in this soil (e.g. Vadez et al. 2007; Krishnamurthy et al. 2011). Non-saline
treated controls were maintained close to field capacity by regular watering. In both
treatments, six seeds of a single RIL were planted in each pot and all pots were later
thinned to four plants per pot. The experiment was a randomized block design with two
treatments (saline and non-saline) and four replicated pots for each entry within each
treatment.
Plant material
The experiments were carried out on 126 F12 RILs from the cross between ICCV 2 and
JG 62, along with the parental lines. Genotype ICCV 2 is an extra-early line which
usually flowers in less than 30–35 days, while JG 62 is a variety with two pods per node
that flowers about 10 days later. The RIL population was previously developed to
identify genes/QTLs related to the double podding trait (Cho et al. 2002). ICCV 2 was
identified as being significantly more salt-sensitive than JG 62 (low and high seed yield
under saline conditions, respectively) by Vadez et al. (2007).
Traits measured
Time to 50% flowering (i.e. at least 2 of 4 plants flowering) was recorded on each pot.
Plants were harvested at maturity and the following measurements recorded: time to
maturity (when 50% of the plants in each pot were fully mature), shoot biomass (g pot-1),

8
pod weight (g pot-1), seed weight (g pot-1), seed number per plant, pod number per plant
and 100-seed weight. Shoot, pod and seed samples were oven-dried at 70ºC for 2 days.
Marker genotyping and linkage map construction
Genotyping data were generated or compiled for 216 markers in a separate study
(Anuradha et al. 2011). The marker genotyping data were analyzed using χ2-test to test
the goodness-of-fit to the expected 1:1 segregation ratio for each marker. Subsequently,
the genotyping data of all markers, including those that showed segregation distortion,
were used to construct a linkage map at LOD threshold grouping values of 15 using
MAPMAKER (Lander et al. 1987) and Kosambi mapping function (Kosambi et al.
1944). As the map distance was unusually large at lower LOD thresholds, higher LOD
thresholds were chosen to eliminate spurious linkage among markers.
QTL identification
Composite interval mapping (CIM) with 1000 permutations was done using QTL
Cartographer (Wang et al. 2010). QTL identification was done for the two phenology
groups (early and late) separately and together. When analyzing an individual phenology
group, the other group RIL data was considered missing. The analysis was also done
within and across both years.
Statistical analysis
A two-way ANOVA was carried out within each group of entries to assess the affect of
salt treatment and of the genotype-by-treatment interaction. Then a one-way ANOVA
was carried out to assess the genotype effect for the different traits measured within each
treatment, year of experiment, and group of phenology (early and late – see below).
Unbiased estimates of variance components σ2g and σ2
e, were calculated, from which
heritability was estimated as h2= σ2g/(σ
2g + σ2
e).

9
Results
Population segregation for flowering time and effect of salt stress
The RIL population is known to segregate for flowering time under non-saline
conditions; the first objective was to assess the segregation for flowering time in the
mapping population under salinity, prior to considering yield responses to salinity. Since
there was a close agreement between flowering time across years in a given treatment (R2
= 0.81 and 0.77 under saline and non-saline conditions), flowering times were averaged
for each genotype within a treatment across years. The frequency distribution of
flowering time under non-saline control conditions identified an 'early' and 'late' group
with flowering times ranging from 29 to 40 days after sowing (DAS) and from 42 to 54
DAS, respectively. Similarly, under saline conditions, entries segregated into an 'early'
and a 'late' group with flowering times ranging from 29 to 38 days and from 41 to 56 days
after sowing, respectively (S1 - Supplementary figure).
Except for eight entries from the 'early' flowering group under non-saline conditions
that were somewhat delayed under saline conditions, flowering times across treatments
were closely related (S2 - Supplementary figure). Therefore, given the previous report of
an interaction between yield under salinity and time to flowering in chickpea (Vadez et
al. 2007), further analysis of yield and component responses to salinity was then
conducted considering separately the two phenological groups identified in the saline
treatment, i.e. 29 to 38 DAS (early) and 41 to 56 DAS (late) (S1 - Supplementary figure).
The slope of the regression equation between flowering time under non-saline and
saline conditions indicated that as flowering time increased, the delay in flowering under
salinity increased (regression equation above the 1:1 line, S2 - Supplementary figure).
This resulted in a significant delay as a result of salinity in mean flowering time in the
early group of 3 days in 2005–06 and -1 days in 2007–08, while the mean delay in
flowering time of the late group was 5 days in 2005–06 and 4 days in 2007–08 (Table 1),
a delay that was also significant.
Effect of salt stress on seed yield and components in early and late phenology groups

10
Salt treatment had a significant effect on days to flowering, seed yield, shoot dry weight,
pod number, seed number and 100-seed weight in both groups in both years, except on
seed yield in 2005-06 in the late group. In 2005-06, the genotype-by-treatment interaction
was significant for all parameters, except for the 100-seed weight in the early group,
although the magnitude of the interaction was somewhat lower in the late group. In 2007-
08, the genotype-by-treatment interaction was significant for all parameters except pod
number in the early group. By contrast, the genotype-by-treatment interaction was
significant only for the 100-seed weight in the late group (Supplementary Table 1). Under
saline conditions, there was a significant genotypic effect on seed yield, shoot dry weight,
pod number, seed number and 100-seed weight across both years and within each
phenology group (Table 1). However, for seed yield, the range of variation was narrower
in the early than in the late group in 2007–08 (S3 - Supplementary figure). Under non-
saline conditions, seed yield in the late group varied significantly among genotypes in
2005–06, whereas seed yield did not vary in 2007-08. In the early group seed yield under
non-saline conditions varied in both years, and the range of variation was also limited in
the early group. Pod number, seed number and 100-seed weight showed significant
genotypic effect across both years and within each phenology group (Table 1).
In the early group, seed yield decreased 24 and 52% under saline conditions in 2005–06
and 2007–08, respectively. In the late group, seed yield did not decrease in 2005–06, but
the higher NaCl level used in 2007–08 decreased yield by up to 38%. Salinity had a
similar effect on shoot dry weight with a 25% and 48% decrease in the early group and
7% decrease in 2005-06 in the late group. Only in 2007–08 the decrease in the late group
was slightly less (23%) than the seed yield decrease (38%). The reduction in seed yield
was explained by both a decrease in 100-seed weight and seed number. The magnitude of
the decreased 100-seed weight was similar in both groups: it decreased by 19% and 20%
in the early group in 2005–06 and 2007–08, respectively, and by 17% and 24% in the late
group. Seed number decreased by 5 and 40% in 2005–06 and 2007–08, respectively, in
the early group. Surprisingly, in the late group the saline treatment increased seed number
by 19% in 2005–06, but the more severe treatment in 2007–08 decreased it by 18%.
The heritability of seed yield in the saline treatment was high in both phenology groups
in 2005–06, close to 0.78, although it decreased to about 0.60 the higher salinity used in

11
2007–08. Heritability was usually higher for seed yield components than for seed yield:
heritability for pod number was 0.61 and 0.66 for the early and the late group in 2007–08
while heritability for seed number was up to 0.86 in 2005–06 and heritability changed
little in 2007–08 (0.78 and 0.86 for the early and late groups, respectively); heritability
for the 100-seed weight was even higher and almost unchanged across the two phenology
groups and trial years (Table 1).
Factors affecting the seed yield under saline conditions
Seed yield under non-saline conditions - In neither of the two years nor within the two
phenology groups, did seed yield under saline conditions relate to that in non-saline
controls (data not shown; in the early group, R2 = 0.05 and 0.06 in 2005–06 and 2007–08,
respectively; in the late group, R2 = 0.12 and 0.00 in 2005–06 and 2007–08,
respectively). This is different to a previous report (Vadez et al. 2007), but similar to a
more recent one (Krishnamurthy et al. 2011), where seed yield under salinity and seed
yield were not closely related, and therefore where the seed yield under salinity could not
be accountable for the yield potential (seed yield under non-saline control conditions).
Because of this lack of relationship between the seed yield under saline conditions and
that under non-saline conditions, we have not used the yield ratio (saline seed yield/non-
saline seed yield, which would reflect a relative performance under salt stress) that was
used in Vadez et al. (2007), nor the seed yield difference between treatments (non-saline
seed yield minus saline seed yield, which would reflect how far a genotype is from its
non-stressed control). The yield ratio and the yield difference between treatments were
closely related (R2 = 0.96 and 0.77 in 2005-06 and 2007-08), but the yield ratio was
poorly related to the seed yield under saline conditions, except in one case (2005-06: R2 =
0.21 and 0.55 in the early and late group; 2007-08: R2 = 0.06 and 0.21 in the early and
late group). Therefore, seed yield under salinity was used as the measure of salt tolerance
in the present study – yield in saline conditions being the objective of breeders (cf.
Richards 1983).
Flowering time - Although seed yield under salinity was positively correlated with time
to flowering across phenology groups (R2 = 0.32 and 0.59 in 2005–06 and 2007–08,

12
respectively, polynomial fit not shown), there was a strong clustering of entries by
phenology group, especially in 2007–08 when the treatment was more severe (100 mM
NaCl) (S3 - Supplementary figure). Within the early group, there was a weak although
significant relationship between seed yield and flowering time in both years (R2 = 0.08
and 0.09 in 2005–06 and 2007–08, respectively), with higher seed yield in later entries.
Within the late group, there was no relationship between seed yield and flowering time
(S3 - Supplementary figure).
Shoot dry weight under saline conditions - Across both phenology groups, seed yield
under salinity was significantly related to shoot dry weight under salinity. When the
entries were separated by phenology group, this relationship was highly significant in the
early group (R2 = 0.65 and 0.67 in 2005–06 and 2007–08, respectively). In contrast in the
late group, the relationship between seed yield and shoot dry weight was significant, but
with a smaller correlation coefficient in 2005–06 (R2 = 0.27) and not significant in the
higher salt treatment in 2007–08 (R2 = 0.01) (Fig. 1).
Seed number under saline conditions - Seed yield under salinity was significantly related
to seed number across both phenology groups. After separating the entries by phenology
group, this relationship remained highly significant within each group, except for the
early group in 2007–08 (R2 = 0.16), (early group, R2 = 0.53 in 2005-06; late group, R2 =
0.47 and 0.46 in 2005–06 and 2007–08, respectively). Figure 2 also separates seed
number under salinity between the early and late groups, and shows a higher seed number
in the late group compared to the early group (see also Table 1).
100-seed weight under saline conditions - The range of variation for 100-seed weight was
similar in both phenology groups (Fig.6). Seed yield under saline conditions had no
significant relationship with the 100-seed weight, either across both groups or after
separating entries within the two phenology groups, when plotted against 100-seed
weight (S4 - Supplementary figure).
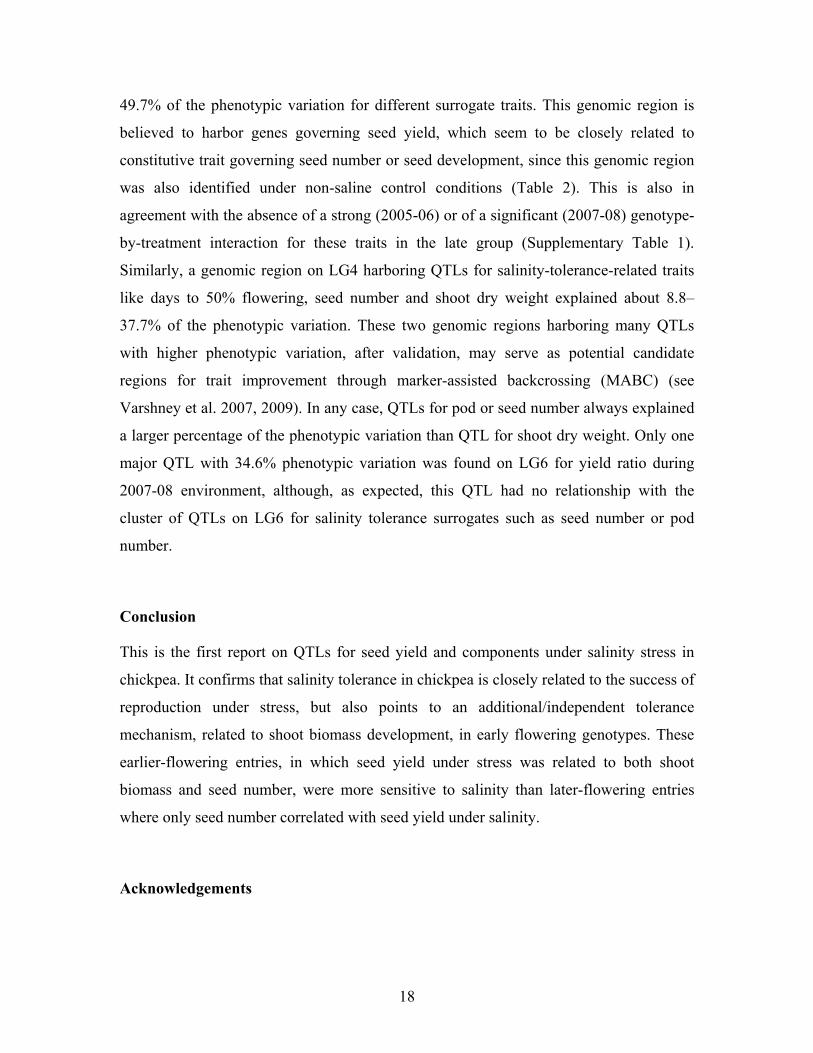
Linkage map and QTL analysis

13
Of the 216 markers tested, 135 markers were mapped on to eight linkage groups spanning
a distance of 310.2 cM, although 81 markers remained unmapped. Linkage groups were
assigned to chromosomes based on known location of legacy SSR markers (Winter et al.
2000, Nayak et al. 2010). The number of markers per linkage group ranged from 7 (LG8)
to 45 (LG6). The length of each linkage group varied from 5.1 cM (LG2) to 129.9 cM
(LG3). Overall inter marker distance was 2.3 cM (Fig. 3). QTLs identified for different
surrogate traits under saline and non-saline conditions in both environments are also
shown on the map.
While undertaking QTL analysis, no QTL was found for seed yield under salinity in the
early phenology group in either year or treatment. However, of the possible components
of seed yield in that group, one QTL for shoot dry weight under salinity was found on
LG1 in 2007–08, explaining 13% of the variation, and one QTL for seed number under
salinity was found on LG7 in 2007–08, explaining 25% of the variation (Table 2). No
QTLs were detected for yield ratio among early phenology group.
In the late phenology group, a QTL was found for seed yield under salinity on LG3 in
2007–08, explaining 19% of the variation. In the late group, one QTL was also found on
the same linkage group under non-saline control conditions, although in a different
genomic region, for shoot dry weight in 2007-08 and for yield in 2005–06 and 2007–08
(Table 2; S5 – Supplementary figure). Among the surrogates for seed yield under salinity,
a genomic region was identified on LG6 that contained QTLs for pod number, seed
number, 100-seed weight under salinity as well as non-saline (control) conditions in
2007–08. The QTL for pod number under salinity in this genomic region explained as
much as 37% of the phenotypic variation. Similarly, QTLs for seed number and 100-seed
weight were found under both saline and non-saline conditions during 2005–06 in the
same genomic region on LG6, where QTLs for pod number, seed number, and 100-seed
weight under saline and non-saline conditions in 2007–08 were found (Table 2; S6 and
S7 – Supplementary figures). One QTL for flowering time was also found consistently
across treatment and year of experiment, located on LG4 (S6 – Supplementary figure).
This QTL was flanked by three SSR markers TA35, TA144 and TS57 and explained
18.5–34.4% of the phenotypic variation in flowering time. One QTL was found for the
yield ratio in 2007-08 and contributed a phenotypic variance of 34.6%.

14
When the phenotyping data were used for QTL analysis, disregarding the groups of
phenology, no QTLs for seed yield and yield ratio was found in any of the treatments for
either of the two years. Nevertheless, a genomic region containing QTLs for seed number
and 100-seed weight under saline conditions in both 2005–06 and 2007–08 was found on
LG6. The same genomic region also contained QTLs for seed number and 100-seed
weight under non-saline conditions in both years (S7 – Supplementary figure).
Discussion
A large range of variation for seed yield under salinity was found within each of the two
phenology groups of a RIL population segregating for flowering time. In both groups,
high pod and seed numbers under saline conditions appeared to be the most important
traits for higher seed yield. Also, within groups of phenology there was no relationship
between the time to flowering, or the 100-seed weight, and seed yield. The present data
for this RIL population, together with earlier results obtained for a set of chickpea lines of
diverse backgrounds with a larger range of flowering times, but also presumably differing
in many other traits (Vadez et al. 2007), shows that time to flowering was not a major
determinant of yield under the saline conditions imposed, since seed yield under salt
stress and flowering time were not (late group), or very weakly (early group), related
within maturity groups. In addition, seed yield in the present study was also related to
shoot dry weight in the early phenology group, a relationship not present in a wider
germplasm set (Vadez et al. 2007). Several QTLs were identified for seed yield and its
components under saline conditions within each phenology group, with limited overlap,
but no major QTL was identified when the analysis was carried out on the entire set of
this RIL population.
Traits related to salt tolerance
Contrary to previous data on responses of a diverse set of chickpea genotypes to salinity
(Vadez et al. 2007), the present study of RILs found no significant relationship between
seed yield under salinity and seed yield under control treatment. This finding was
15
presumably related to the relative earliness of the genotypes tested here, which all
flowered in less than 55 days and were well adapted to the short season environment in
which these were tested; flowering times in previous work ranged from 30 to 100 days
(Vadez et al. 2007). Since the seed yield under saline condition was unrelated to the seed
yield under control, in the present case the absolute seed yield under saline conditions
was the preferred measure of salt tolerance, rather than the ratio of seed yield (seed yield
saline conditions / seed yield non-saline conditions). This ratio was in fact poorly related
to the seed yield under saline conditions and this reflects that the genotypic expression of
seed yield under salt stress is independent from the yield potential (yield under non-saline
conditions) and is specific to the stress conditions. Therefore, the use of the yield ratio in
this case would be less informative than the yield per se in saline conditions, towards our
eventual goal of breeding for improved yield in saline soils (cf. Richards 1983).
Salinity tolerance, measured here as seed yield under salinity, was then strongly related
to seed number, in both the entire genotype set and in the two separate phenology groups.
In contrast, there was no relationship between salinity tolerance and the ability of
genotypes to fill seeds (seed size, measured by the 100-seed weight). This confirms
previous data (Vadez et al. 2007; Krishnamurthy et al. 2011) and extends the validity of
the hypothesis that for genotypes with relatively early duration, salinity tolerance in
chickpea is dependent on successful production of reproductive sites under salt stress, but
the present work also found an association also with biomass in the early group
(discussed in the next paragraph). Other reports also point to reproduction as the most
sensitive process in chickpea under salt-stress (Mamo et al. 1996; Katerji et al. 2001;
Datta et al. 1987; Samineni et al. 2011) and the reproductive phase is also sensitive to
drought (Leport et al. 1999, 2006). Detailed investigations are ongoing to better
understand the process(es) affected during reproduction.
An interesting difference to previous work (Vadez et al. 2007) was the significant
relationship between seed yield and shoot dry weight in the ‘early’ group of entries.
Serraj and colleagues (2004) reported a 60% reduction in shoot biomass under similar
saline conditions in a set of 252 genotypes. Reduced shoot biomass may be deleterious
for early flowering lines that do not accumulate significant biomass before flowering, and
where only a small delay in flowering time under saline conditions could not help

16
compensate. Salinity may reduce branching in early flowering lines and thus reduce the
number of possible floral nodes (Saxena 1984). This may be reflected in a lower shoot
dry weight, which was in fact the main factor explaining the associated yield reduction in
the early entries in the RIL population assessed here. In 2007–08, the seed number also
decreased significantly in the early group, but the reduction in shoot weight was even
larger. We tested whether seed number was related to shoot dry weight in the early
entries, but found only a weak relationship (R2 = 0.12 in 2005–06 and 0.04 in 2007–08).
These data indicate that in early entries high shoot biomass and seed number both
contribute to determining high seed yield under salinity: salt tolerant early lines appear to
be capable of developing high shoot biomass with possibly more floral nodes, and
ensuring reproductive success in a large number of those floral nodes. The higher
percentage decrease in shoot biomass in the early entries than the percentage decrease in
seed number may indicate that the early entries suffered more as a result of the salinity
from a reduction in biomass production than from a reduction in successful reproductive
sites.
Clearly, salinity affected the short duration lines more than longer duration lines, and
the effect was due to both reduced biomass production and seed numbers in the early
entries. Seed number increased under salinity in 2005–06 in the late group, and was the
trait best correlated to seed yield (R2 = 0.53), whereas shoot biomass was decreased 7%.
This was surprising considering that reduced flower numbers in stressed plants are
generally reported, e.g. chickpea (Nayyar et al. 2005; Leport et al. 1998). However, there
have been earlier reports of an increase in flower number in chickpea with low/moderate
salinity treatments (Dhingra and Varghese 1993; Samineni et al. 2011). Also, earlier
reports indicate that later entries tend to produce more flowers than early entries under
salt stress (Katerji et al. 2001). So, in the late group, the capacity to produce more flowers
under salt stress could have given an additional benefit to these entries, even despite a
slight decrease in shoot biomass. In the late group, shoot biomass was not related to seed
yield, which might be explained by the fact that late entries had more days to accumulate
resources before flowering and also flowering time was delayed 4 and 5 days under saline
conditions. This observation of delayed flowering in saline conditions contrasts with
earlier onset of flowering under terminal drought than under fully irrigated conditions

17
reported in chickpea (Krishnamurthy et al. 1999). The delay in saline conditions might
involve hormonal regulation (e.g. ABA), as increased ABA has previously been reported
to delay flowering (Achard et al. 2006).
QTL analysis – Linkage mapping and QTL analysis
The intraspecific map, based on ICCV 2 × JG 62, spanned 310.2 cM; the number of
markers mapped and length of linkage groups was not correlated. For instance, although
22 markers were mapped on both LG1 (8.9 cM) and LG3 (129.9 cM), the length of
linkage groups varied significantly (Fig. 3). Similar results have been reported by
Radhika et al. (2007) and Nayak et al. (2010). Uniform marker distribution was not
observed in LG3, LG5 or LG8. The uneven distribution of markers on linkage groups
may be due to unequal recombination events in these chromosomal regions.
One major finding of this work was a QTL for seed yield, found specifically in the late
group, on LG3 and explaining a substantial portion of the phenotypic variation (19%).
This is the first ever reported QTL for salinity tolerance in chickpea. Other than chickpea,
there are not many reports in other crops dealing with identification of QTLs for salinity
tolerance, and most are QTLs for traits such as sodium exclusion in rice (Ren et al. 2005)
or growth (Takehisa et al. 2004). Fewer studies again have identified QTLs for seed yield
under stress: barley (Ellis et al. 2002), soybean (Lee et al. 2004), wheat (Quarrie et al.
2005) and rice (Gregorio et al. 2002).
In the present study, QTLs for seed yield were only found in the late flowering lines,
not in the early flowering lines. However, a QTL for shoot dry weight was found in the
early group, explaining a minor percentage of the variation. Combined QTL analysis of
the entire RIL population did not reveal any QTLs, highlighting the importance of first
elucidating the role of phenology in the genotypic response to salt stress. QTLs for yield
components explained a large proportion of the phenotypic variation, justifying their
possible use in breeding programs. A genomic region on LG6 (Fig. 3), harboring many
QTLs for different salinity-tolerance-related traits such as seed number and 100-seed
weight, in both early and late phenology groups under saline and non-saline conditions,
was identified across the two years and treatments. These QTLs explained about 14.8–
18
49.7% of the phenotypic variation for different surrogate traits. This genomic region is
believed to harbor genes governing seed yield, which seem to be closely related to
constitutive trait governing seed number or seed development, since this genomic region
was also identified under non-saline control conditions (Table 2). This is also in
agreement with the absence of a strong (2005-06) or of a significant (2007-08) genotype-
by-treatment interaction for these traits in the late group (Supplementary Table 1).
Similarly, a genomic region on LG4 harboring QTLs for salinity-tolerance-related traits
like days to 50% flowering, seed number and shoot dry weight explained about 8.8–
37.7% of the phenotypic variation. These two genomic regions harboring many QTLs
with higher phenotypic variation, after validation, may serve as potential candidate
regions for trait improvement through marker-assisted backcrossing (MABC) (see
Varshney et al. 2007, 2009). In any case, QTLs for pod or seed number always explained
a larger percentage of the phenotypic variation than QTL for shoot dry weight. Only one
major QTL with 34.6% phenotypic variation was found on LG6 for yield ratio during
2007-08 environment, although, as expected, this QTL had no relationship with the
cluster of QTLs on LG6 for salinity tolerance surrogates such as seed number or pod
number.
Conclusion
This is the first report on QTLs for seed yield and components under salinity stress in
chickpea. It confirms that salinity tolerance in chickpea is closely related to the success of
reproduction under stress, but also points to an additional/independent tolerance
mechanism, related to shoot biomass development, in early flowering genotypes. These
earlier-flowering entries, in which seed yield under stress was related to both shoot
biomass and seed number, were more sensitive to salinity than later-flowering entries
where only seed number correlated with seed yield under salinity.
Acknowledgements
19
The work was supported by Australian Research Council LP0776586 grant and COGGO
(Council of Grain Grower Organisations Ltd), from support of the Government of Japan
to ICRISAT, and from support from the Indian Council of Agriculture Research (ICAR)
from the government of India. Authors are thankful for the expert technical assistance of
Mr N Jangaiah at ICRISAT.
References
Achard P, Cheng H, De Grauwe L, Decat J, Schoutteten H, Moritz T, Van Der Straeten
D, Peng J, Harberd NP (2006) Integration of plant responses to environmentally
activated phytohormonal signals. Science 311:91-94
Anuradha C, Gaur PM, Pande S, Gali KK, Ganesh M, Kumar J, Varshney RK (2011)
Mapping QTL for resistance to botrytis grey mould in chickpea. Euphytica, in
press.
Cho S, Jagdish Kumar J, Shultz JL, Anupama K, Tefera F, Anupama K, Tefera F,
Muehlbauer FJ (2002) Mapping genes for double podding and other morphological
traits in chickpea. Euphytica 128:285–292
Datta KS, Dayal J, Goswami CL (1987) Effect of salinity on growth and yield attributes
of chickpea (Cicer arietinum L). Annals of Biology 3:47-53
Dhingra HR, Varghese TM (1993) Flowering and male reproductive functions of
chickpea (Cicer arietinum L) genotypes as affected by salinity. Biologia Plantarum
35:447–452
Ellis RP, Forster BP, Gordon DC, Handley LL, Keith RP, Lawrence P, Meyer R, Powell
W, Robinson D, Scrimgeour, Young G, Thomas WTB (2002) Phenotype/genotype
associations for yield and salt tolerance in a barley mapping population segregating
for two dwarfing genes. Journal of Experimental Botany 53:1163–1176
Flowers TJ, Gaur PM, Gowda CLL, Krishnamurthy L, Samineni S, Siddique KMH,
Turner NC, Vadez V, Varshney RK, Colmer TD (2010) Salt sensitivity in chickpea.
Plant Cell and Environment 33:490-509

20
Gregorio GB, Senadhira D, Mendoza RD, Manigbas NL, Roxas JP, Guerta CQ (2002)
Progress in breeding for salinity tolerance and associated abiotic stresses in rice.
Field Crops Research 76: 91–101
Katerji N, van Hoorn JW, Hamdy A, Mastrorilli M, Oweis T, Malhotra RS (2001)
Response to soil salinity of two chickpea varieties differing in drought tolerance.
Agricultural Water Management 50:83–96
Kosambi DD (1944) The estimation of map distance from recombination values. Annals
of Eugenetics 12:172–175
Krishnamurthy L, Johansen C, Sethi SC (1999) Investigation of factors determining
genotypic differences in seed yield of non-irrigated and irrigated chickpeas using a
physiological model of yield determination. Journal of Agronomy and Crop Science
183:9–17
Krishnamurthy L, Turner NC, Gaur PM, Upadhyaya HD, Varshney RK, Siddique KHM,
Vadez V (2011) Consistent variation across years in salinity resistance in a diverse
range of chickpea (Cicer arietinum L.) genotypes. Journal of Agronomy and Crop
Science. doi:10.1111/j.1439-037X.2010.00456.x
Lander ES, Green J (1987) Construction of multilocus genetic linkage maps in human.
Proceedings of the National Academy of Science USA 84:2363–2367
Lauter DJ, Munns DN (1986) Salt resistance of chickpea genotypes in solutions salinized
with NaCl or Na2SO4. Plant and Soil 95:271–279
Lee GJ, Boerma HR, Villagarcia MR, Zhou X, Carter Jr TE, Li Z, Gibbs MO (2004) A
major QTL conditioning salt tolerance in S-100 soybean and descendent cultivars.
Theoretical and Applied Genetics 109:610–1619
Leport L, Turner NC, French RJ, Tennant D, Thomson BD, Siddique KHM (1998) Water
relations, gas exchange and growth of cool-season grain legumes in a
Mediterranean-type environment. European Journal of Agronomy 9:295–303
Leport L, Turner NC, French RJ, Barr MD, Duda R, Davies SL, Tennant D, Siddique
KHM (1999) Physiological responses of chickpea genotypes to terminal drought in
a Mediterranean-type environment. European Journal of Agronomy 11:279–291

21
Leport L, Turner NC, Davies SL, Siddique KHM (2006) Variation in pod production and
abortion among chickpea cultivars under terminal drought. European Journal of
Agronomy 24:236–246
Mamo T, Richter C, Heiligtag B (1996) Salinity effects on the growth and ion contents of
some chickpea (Cicer arietinum L) and lentil (Lens culinaris medic) varieties.
Journal of Agronomy and Crop Science Zeitschrift Fur Acker und Pflanzenbau
176:235–247
Munns R, Tester M (2008) Mechanisms of salinity tolerance. Annual Review of Plant
Biology 59:651–681
Nayak SN, Zhu H, Varghese N , Choi HK, Datta S, Horres R, Jüngling R, Singh J, Kavi
Kishor PB, Kahl G, Winter P, Cook DR, Varshney RK (2010) Integration of novel
SSR and gene-based marker loci in the chickpea genetic map and establishment of
new anchor points with Medicago truncatula genome. Theoretical and Applied
Genetics 120:1415–1441
Nayyar H, Kaur S, Singh KJ, Dhir KK, Bains T (2005) Water stress-induced injury to
reproductive phase in chickpea: Evaluation of stress sensitivity in wild and
cultivated species in relation to abscisic acid and polyamines. Journal of Agronomy
and Crop Science 191:450–457
Quarrie SA, Steed A, Calestani C, Semikhodskii A, Lebreton C, Chinoy C, Steele N,
Pljevljakusi D, Waterman E, Weyen J, Schondelmaier J, Habash DZ, Farmer P,
Saker L, Clarkson DT, Abugalieva A, Yessimbekova M, Turuspekov Y,
Abugalieva S, Tuberosa R, Sanguineti MC, Hollington PA, Aragués R, Royo A,
Dodig D (2005) A high-density genetic map of hexaploid wheat (Triticum aestivum
L.) from the cross Chinese Spring × SQ1 and its use to compare QTLs for grain
yield across a range of environments. Theoretical and Applied Genetics 110:865–
880
Radhika P, Gowda SJM, Kadoo NY, Mhase LB, Jamadagni BM, Sainani MN, Chandra
S, Gupta VS (2007) Development of an integrated intraspecific map of chickpea

22
(Cicer arietinum L.) using two recombinant inbred line populations. Theoretical
and Applied Genetics 115:209–216
Rangasamy P (2006) World salinization with emphasis on Australia. Journal of
Experimental Botany 57:1017–1023
Ren ZH, Gao JP, Li LG, Cai XL, Huang W, Chao DY, Zhu MZ, Wang ZY, Luan S, Lin
HX (2005) A rice quantitative trait locus for salt tolerance encodes a sodium
transporter. Nature Genetics 37:1141–1146
Richards RA (1983) Should selection for yield in saline regions be made on saline or
non-saline soils. Euphitica 32: 431–438
Samineni S, Siddique KHM, Gaur PM, Colmer TD (2011) Salt sensitivity of the
vegetative and reproductive stages in chickpea (Cicer arietinum L.): Podding is a
particularly sensitive stage. Environmental and Experimental Botany 71:260-268.
Saxena NP (1984) Chickpea. In: The Physiology of Tropical Field Crops, Eds
Goldworthy and Fisher. John Wiley & Sons Ltd. New York pp. 419–452
Serraj R, Krishnamurthy L, Upadhyaya HD (2004) Screening chickpea mini-core
germplasm for tolerance to soil salinity. International Chickpea Newsletter 11:29–
32
Takehisa H, Shimodate T, Fukuta Y, Ueda T, Yano M, Yamaya T, Kameya T, Sato T
(2004) Identification of quantitative trait loci for plant growth of rice in paddy field
flooded with salt water. Field Crops Research 89:85–95
Vadez V, Krishnamurthy L, Serraj R, Gaur PM, Upadhyaya HD, Hoisington DA,
Varshney RK, Turner NC, Siddique KHM (2007) Large variation in salinity
tolerance in chickpea is explained by differences in sensitivity at the reproductive
stage. Field Crops Research 104:123–129
Varshney RK, Hoisington DA, Nayak SN, Graner A (2009) Molecular plant breeding:
methodology and achievements. In: Methods in molecular biology: Plant genomics.
Somers D, Langridge P, Gustafson PJ, Eds, The Humana Press, Totowa, NJ, USA,
pp 283–304

23
Varshney RK, Hoisington DA, Upadhyaya HD, Gaur PM, Nigam SN, Saxena K, Vadez
V, Sethy NK, Bhatia S, Aruna R, Gowda MVC, Singh NK (2007) Molecular
genetics and breeding of grain legume crops for the semi-arid tropics. In: Varshney
RK, Tuberosa R (Eds), Genomics assisted crop improvement, Vol II: Genomics
applications in crops. Springer, Dordrecht, The Netherlands, pp 207–242
Wang S, Basten CJ, Zeng ZB (2010) Windows QTL Cartographer 2.51. Department of
Statistics, North Carolina State University, Raleigh, NC.
http://statgen.ncsu.edu/qtlcart/WQTLCart.htm.
Winter P, Benko-Iseppon AM, Hüttel B, Ratnaparkhe M, Tullu A, Sonnante G, PfaV T,
Tekeoglu M, Santra D, Sant VJ, Rajesh PN, Kahl G, Muehlbauer FJ (2000) A
linkage map of the chickpea (Cicer arietinum L.) genome based on the recombinant
inbred lines from a C. arietinum × C. reticulatum cross: localization of resistance
genes for Fusarium races 4 and 5. Theoretical and Applied Genetics 101:155–1163

24
Figure captions
Fig. 1 Relationship between seed yield and shoot dry weight in saline conditions in
2005–06 (a) and 2007–08 (b) within two phenology groups, i.e. early group (flowering
within 38 days after sowing in saline conditions, open symbols) and late group (flowering
41 days or more after sowing in saline conditions, closed symbols). Data are means of
four replicate pots per genotype with four plants per replicate pot. Lines are fitted linear
regressions.
Fig. 2 Relationship between seed yield and seed number in saline conditions in 2005–06
(a) and 2007–08 (b) within two phenology groups, i.e. early group (flowering within 38
days after sowing in saline conditions, open squares) and late group (flowering 41 days or
more after sowing in saline conditions, solid squares). Data are means of four replicate
pots per genotype with four plants per replicate pot. Lines are fitted linear regressions.
Fig. 3 Genetic linkage map of chickpea (ICCV 2 × JG 62) with 135 marker loci on eight
linkage groups. Kosambi map distances are on left hand side, genomic regions harboring
QTLs (black bars) and QTLs for salinity-related-traits (colored squares), as listed in
Table 2, on right hand side of linkage group for early phenology group (E), late
phenology group (L), under both saline (S) and non-saline (C) conditions and two
environments 2005–06 (5) and 2007–08 (7).
S1 - Supplementary figure 1. Frequency distribution of flowering time in the (a) non-
saline control treatment and (b) saline treatment in 126 F12 RIL progenies, plus parental
lines, of the cross between ICCV 2 and JG 62. Within each treatment, flowering time for
each line was the average flowering time for the two years.
S2 - Supplementary figure 2. Relationship between mean flowering time under non-
saline control conditions and in the saline treatment for the RILs and parental genotypes.
The eight genotypes from the early flowering group that have delayed flowering under

25
salt treatment are ringed by an ellipse. Within each treatment, flowering time for each
line was the average flowering time for the two years. The solid line is the fitted linear
regression and the dashed line is the 1:1 line.
S3 - Supplementary figure 3. Relationship between flowering time and seed yield under
saline conditions each year (2005–06, circles; 2007–08, squares) for genotypes in the
early flowering group (flowering within 38 days after sowing in saline conditions, open
symbols) and late flowering group (flowering 41 days or more after sowing in saline
conditions, solid symbols). Data are means of four replicate pots per genotype with four
plants per replicate pot. Lines are fitted regressions.
S4 - Supplementary figure 4. Scatter plot exploring the relationship between seed yield
and the 100-seed weight in saline conditions in 2005–06 (a) and 2007–08 (b) within two
phenology groups, i.e. early group (flowering within 38 days after sowing in saline
conditions, open squares) and late group (flowering 41 days or more after sowing in
saline conditions, solid squares). Data are means of four replicate pots per genotype with
four plants per replicate pot.
S5 - Supplementary figure 5. Linkage group 6 that shows QTLs for seed number and
100-seed weight under saline conditions and non-saline conditions in both 2005-06 and
2007-08.
S6 - Supplementary figure 6.. A snapshot showing stability of the QTL for flowering
time across treatments (saline and non-saline conditions) and environments (two years).
S7 - Supplementary figure 7. A snapshot showing stability of the QTL for seed number
under non-saline condition across the two environments (i.e. two years 2005-06 and
2007-08).

26
Table 1 One-way ANOVA probabilities (F-Prob), means and heritabilities (h2) for days to flowering, seed yield (g pot-1), shoot dry
weight (DW, g pot-1), pod number (pot-1), seed number (pot-1) and 100-seed weight (g) for 'early' genotypes (flowering time <38 DAS)
and 'late' genotypes (flowering time >41 DAS) in saline and non-saline (control) treatments in 2005–06 and 2007–08.
Salinity Control
Days to flowering
Seed yield Shoot DW Pod number
Seed number
100-seed weight
Days to flowering
Seed yield Shoot DW Pod number
Seed number
100-seed weight
2005–06
Early F-Prob <0.001 <0.001 <0.001 <0.001 <0.001 <0.001 <0.001 <0.001 <0.001 <0.001
Mean 38.37 8.97 21.00 52.06 17.85 35.305 11.68 27.96 54.65 21.94
H2 0.924 0.780 0.799 0.866 0.907 0.960 0.688 0.734 0.792 0.892
Late F-Prob <0.001 <0.001 <0.001 <0.001 <0.001 <0.001 <0.001 0.036 <0.001 <0.001
Mean 50.03 11.38 29.18 62.76 18.98 45.54 11.51 31.43 52.71 22.77
H2 0.943 0.776 0.790 0.867 0.907 0.938 0.814 0.592 0.915 0.857
2007–08
Early F-Prob <0.001 0.013 <0.001 <0.001 <0.001 <0.001 <0.001 0.002 <0.001 0.010 <0.001 <0.001
Mean 31.18 5.28 11.78 33.31 35.29 15.44 32.64 10.85 22.43 52.70 59.00 19.25
H2 0.938 0.605 0.763 0.716 0.776 0.928 0.802 0.635 0.654 0.610 0.728 0.921
Late F-Prob <0.001 <0.001 0.006 <0.001 <0.001 <0.001 <0.001 0.184 0.060 <0.001 <0.001 <0.001
Mean 46.95 7.66 22.30 49.31 52.35 15.43 44.86 11.98 28.29 55.50 62.40 20.08
H2 0.918 0.624 0.753 0.837 0.864 0.897 0.841 0.545 0.578 0.656 0.650 0.928

27
Table 2: Percentage of variation explained by QTLs identified for days to flowering (DF), shoot dry weight (SDW), seed yield
(SYLD), pod number (PN), seed number (SN), yield rato(YLD_R), yield difference (YLD_D) and 100-seed weight (100SW) for
'early' genotypes (flowering time <38 DAS), 'late' genotypes (flowering time >41 DAS), and both groups together in saline and non-
saline (control) treatments in 2005–06 and 2007–08
Early genotypes Late genotypes All genotypes
Trait LG Marker interval
LOD PV (%)
LG Marker interval
LOD PV (%)
LG Marker interval
LOD PV (%)
2005
-06
Sal
ine
DF 4 TA144 – NO_Y_13
2.6 13.2 4 TA144 – NO_Y_13
3.1 24.5 5 TA114 –TA78 3.4 13.8
SDW - - - - - - - - 4 TA127 – TS57 2.5 8.8 SN - - - - 6 TR20s – TA46 3.3 25.1 6 TR20s – TA46 2.6 21.1100SW 7 TA11 –TA42 6.2 27.6 6 TA186 – TA46 4 23.3 6 TR20s – TA46 3.4 21.4100SW - - - - 7 TR59 – TS53 2.8 17.6 - - - - HI 7 TA11 – TA42 2.9 15.1 6 TA186 – TA46 2.7 15.2 6 TR20s – TA46 2.5 11.1HI 2 TA200 – TA37 2.5 11.9 - - - - 5 TA114 –
NO_X_1 3.1 11.5
Con
trol
DF 4 TA127 – TS57 6.2 15.8 4 TA144 – NO_X_1
5.8 37.7 3 TA106 – Podnode
2.5 10.1
SN - - - - 4 TA144 – NO_Y_13
3.7 17.2 - - - -
- - - - 6 TA186 – TA46 3.9 15.1 - - - - 100SW 6 TR20s – TA46 6.4 40.7 6 GA137 – TA46 4.6 49.7 6 GA137 – GA25 2.5 18.1 6 TR20s – TA46 3.5 25.6 2 TA200 - TA37 3.7 18.3 - - - - HI 7 TA11 –TA42 5.4 21.4 6 TA186 - TA46 5.3 20.4 6 TR20s – TA46 5.3 32.3SYLD - - - - 3 TA14s - TR40 2.9 22.4 - - - -

28
2007
-08
Sal
ine
DF - - - - 4 TA186 - TA46 3.3 18.5 - - - - SDW 1 TA203 – TR42 3.4 13.3 5 TS46 – NO_X_1 2.7 26.6 5 TA114 – TA78 4.9 19.5SN 7 TA11 – TA42 4.8 24.7 6 opng11 – TA46 2.9 15.7 6 TR20s – TA46 2.7 12.3100SW - - - - 6 GA137 – GA25 3.2 43.2 6 TR20s – TA46 3 17.3HI - - - - 6 TA186 – TA46 3.4 18.2 - - - - SYLD - - - - 3 TA106 –
Podnode 3.2 19.2 - - - -
PN - - - - 6 GA137 – TA46 3.9 37.2 7 TA11 – TA42 2.5 7.7
Con
trol
DF 3 TA14s – TR40 3.5 13.6 4 TA35 – TS57 4.2 24.5 5 TA114 – TA78 3.6 12.6SDW - - - - 3 TA196 – TA96 2.9 55.6 - - - - SN 6 TR20s – TA46 2.7 27.5 6 TA186 – TA46 2.6 14.8 6 GA137 – TA46 3.1 18.5HI - - - - 4 TA127 – TS57 2.5 12.7 - - - - 100SW - - - - 6 TA186 – TA46 6.5 36.6 6 TR20s – TA46 6.9 28.4HI - - - - 4 TA35 – TS57 2.6 16 - - - - - - - - 6 TA186 – TA46 2.5 14.5 - - - - SYLD - - - - 3 Opni18a – TA22 2.6 16.9 - - - - PN - - - - 6 TA46 – TA132 3.7 21.3 - - - -
2005 YLD_R - - - - - - - - - - - YLD_D - - - - - - - - - - - -
2007 YLD_R - - - - 6 TA46 – TS24 5.4 34.6 - - - - YLD_D - - - - - - - - - - - -

29
Supplementary Table 1. Two-way Anova analysis of days to flowering, seed yield (g pot-1), shoot dry weight (g pot-1), seed number (pot-1) and 100-seed weight (g) in two years of data after separating entries according to their flowering time (early entries with flowering time < 38 DAS and late entries with flowering time > 41 DAS).
Days to
flowering Seed Yield
Shoot DW
Pod number
Seed number
100-seed weight
Group F-Prob 2005-06
Early T <.001
<.001
<.001
-
0.007
<.001
G x T <.001
<.001 <.001 -
<.001
0.330
Late T <.001
0.444 <.001
-
<.001
<.001
G x T 0.030 <.001
0.003
-
<.001
0.043
2007-08
Early T <.001
<.001 <.001
<.001
<.001
<.001
G x T 0.081
0.046
0.050
0.657
0.005
<.001
Late T <.001
<.001
<.001
0.004
<.001
<.001
G x T 0.721
0.565
0.262
0.252
0.711
<.001

R2 = 0 6514
16
alin
e
Early group R 0.65
6
8
10
12
d (g
pot
-1) i
n sa
cond
ition
s
Early group
R2 = 0.27
0
2
4
0 5 10 15 20 25 30 35 40
Seed
Yie
ld
aLate group
Shoot dry weight (g pot-1) in saline conditions
12
e
R2 = 0.67
6
8
10
g po
t-1) i
n sa
line
nditi
ons
Early group
Fi 1
R2 = 0.01
0
2
4
Seed
Yie
ld (g co
n
b
Late group
Fig. 1
0 5 10 15 20 25 30 35
Shoot dry weight (g pot-1) in saline conditions

R2 = 0.5314
16
e Late group
8
10
12
14
g po
t-1) i
n sa
line
ondi
tionn
g p
R2 = 0.47
0
2
4
6Se
ed y
ield
( co
Early group
a
R2 0 46
12
20 30 40 50 60 70 80 90 100
Seed number (pot -1) in saline condition
L t R = 0.46
6
8
10
pot-1
) in
salin
e di
tion
Late group
Fi 2
R2 = 0.162
4
Seed
yie
ld (g
pco
nd
Early group b
Fig. 2
0
20 30 40 50 60 70 80 90 100
Seed number (pot -1) in saline condition
Fig.3

14
8
10
12
ndiv
idua
ls
a
2
4
6
Num
ber o
f in
0
29 30 31 32 33 34 35 36 37 38 39 40 41 42 43 44 45 46 47 48 49 50 51 52 53 54 55 56
DAS to flowering in non-saline control treatment
8
10
12
14
divi
dual
s
S1
b
2
4
6
8
Num
ber o
f indS1
0
2
29 30 31 32 33 34 35 36 37 38 39 40 41 42 43 44 45 46 47 48 49 50 51 52 53 54 55 56
DAS to flowering in saline treatment

R2 0 9560
R = 0.95
y = 1.13x - 3.35
45
50
55er
ing
in s
alin
e tm
ent
25
30
35
40
DA
S to
flow
etre
at
S2
25
25 30 35 40 45 50 55
DAS to flowering in non-saline control
S2
R2 = 0.09
10
12
14
161)
in s
alin
e nt
4
6
8
10
d yi
eld
(g p
ot-
treat
me n
S3
R2 = 0.080
2
25 30 35 40 45 50 55 60 65
Days to flowering in saline treatment
See
d
S3

14
16
e
Late group
8
10
12
14
g po
t-1) i
n sa
line
ondi
tion
Early group
0
2
4
6Se
ed y
ield
( co
a5 10 15 20 25 30
Weight of 100 seeds (g) in saline conditions
12
6
8
10
pot-1
) in
salin
e nd
ition
Early group
Late group
S4
0
2
4
Seed
yie
ld (g
co
n
b
S4
0
5 10 15 20 25
Weight of 100 seeds (g) in saline conditions

S5

S6

S7