Embed Size (px)
Citation preview
Dow
nloa
ded
from
asc
elib
rary
.org
by
CA
LIF
OR
NIA
, UN
IV O
F on
09/
15/1
3. C
opyr
ight
ASC
E. F
or p
erso
nal u
se o
nly;
all
righ
ts r
eser
ved.
Assessment of Improved Nonlinear Static Proceduresin FEMA-440
Sinan Akkar1 and Asli Metin2
Abstract: Nonlinear static procedures �NSPs� presented in the FEMA-440 document are evaluated for nondegrading three- to nine-storyreinforced concrete moment-resisting frame systems. Evaluations are based on peak single-degree-of-freedom displacement, peak roof,and interstory drifts estimations. A total of 78 soil site records and 24 buildings with fundamental periods varying between 0.3 s–1.3 s areused in 2,832 linear and nonlinear response-history analyses to derive the descriptive statistics. The moment magnitude of the groundmotions varies between 5.7 and 7.6. All records are within 23 km of the causative fault representing near-fault ground motions with andwithout pulse signals. The statistics presented suggest that lateral loading patterns used in pushover analysis to idealize the buildingsystems play a role in the accuracy of NSPs investigated. Both procedures yield fairly good deformation demand estimations on themedian. Displacement coefficient method �DCM� tends to overestimate the global deformation demands with respect to the capacityspectrum method �CSM�. The conservative deformation demand estimations of DCM are correlated with the normalized lateral strengthratio, R. The CSM tends to overestimate the deformation demands for the increasing displacement ductility, �.
DOI: 10.1061/�ASCE�0733-9445�2007�133:9�1237�
CE Database subject headings: Seismic effects; Drift; Approximation methods; Performance characteristics; Frames; Statistics.
Introduction
The response of structural systems under strong ground shakinggenerally results in nonlinear behavior. Until recently, retrofittingtechniques relied on linear analysis to predict the structural re-sponse against earthquakes. However, the increased implementa-tion of displacement-based seismic assessment of structures led tothe proposition of approximate nonlinear static procedures �NSPs�for the prediction of seismic structural behavior. The nonlinearmethods published in the ATC-40 �ATC 1996� report togetherwith the FEMA-273/274 �BSSC 1997� documents and the succes-sor FEMA-356 �ASCE 2000� report constitute the well-organizedpioneer representatives in this field. The basic premise in theseprocedures is the estimation of deformation demands on structuralsystems by making use of nonlinear force-deformation curves thatare generated from pushover analysis. This initial step reduces themultidegree-of-freedom �MDOF� system to an idealized single-degree-of-freedom �SDOF� system, thus, simplifying the struc-tural model, as well as providing insightful information about thelikely nonlinear behavior of the structure. While this initial step iscommon for the above documents, the ATC-40 document prima-rily details the capacity spectrum method �CSM�. This method is
1Associate Professor, Earthquake Engineering Research Center,Middle East Technical Univ., 06531 Ankara, Turkey. E-mail: [email protected]
2Structural Engineer, Coyne and Bellier Engineering and Consul-tancy, 06520 Ankara, Turkey.
Note. Associate Editor: Rakesh K. Goel. Discussion open untilFebruary 1, 2008. Separate discussions must be submitted for individualpapers. To extend the closing date by one month, a written request mustbe filed with the ASCE Managing Editor. The manuscript for this paperwas submitted for review and possible publication on April 12, 2006;approved on February 27, 2007. This paper is part of the Journal ofStructural Engineering, Vol. 133, No. 9, September 1, 2007. ©ASCE,
ISSN 0733-9445/2007/9-1237–1246/$25.00.JOURNAL OF
J. Struct. Eng. 2007.1
an equivalent linear technique that uses displacement ductility ���based empirical relationships to approximate the nonlinear re-sponse of the SDOF system through an equivalent linear oscilla-tor by elongating the period and increasing the viscous damping.The FEMA-356 report describes the displacement coefficientmethod �DCM� in which several empirically derived factors areused to modify the elastic response of the SDOF system for esti-mating the nonlinear behavior. The empirical factors used in theDCM are primarily based on the lateral yield strength of thesystem.
These two procedures have been recently updated by theproject ATC-55 that is principally aimed to improve the accuracyof the peak SDOF displacement estimations. The regression equa-tions used in the improved DCM for estimating the expected peakinelastic SDOF displacements were derived from the statisticalstudy conducted by Ruiz-García and Miranda �2003�. The ductil-ity dependent empirical relations used in the improved CSM werepresented by Guyader and Iwan �2006�. The principal product ofthe ATC-55 project is the FEMA-440 �ATC 2005� report thatpresents the improved versions of the DCM and CSM, as well asa limited comparative study providing a preliminary evaluation ofthese methods. The comparative results were confined to ninedistinct bilinear oscillators with periods of 0.2 s, 0.5 s, and 1.0 sthat were subjected to 13 strong ground motions. The analysesindicated that the mean SDOF deformation demand estimationsof the improved NSPs follow a fairly close pattern to the meandeformation demands computed from the nonlinear response-history analyses �RHA�.
A recent study by Kazaz et al. �2006� investigated the accuracyof the improved CSM for a significantly stiff, high-lateralstrength, wall-type structure subjected to 55 near- and far-faultground motions recorded on rock sites. The mean error statisticsdepicted by Kazaz et al. �2006� reported an average of 20%unsafe peak SDOF displacement predictions with respect to the
nonlinear RHA results. Using a comprehensive ground-motionSTRUCTURAL ENGINEERING © ASCE / SEPTEMBER 2007 / 1237
33:1237-1246.
Dow
nloa
ded
from
asc
elib
rary
.org
by
CA
LIF
OR
NIA
, UN
IV O
F on
09/
15/1
3. C
opyr
ight
ASC
E. F
or p
erso
nal u
se o
nly;
all
righ
ts r
eser
ved.
database and wide-range spectral periods, Akkar and Miranda�2005� also conducted a statistical study on the accuracy of themethods proposed by Guyader and Iwan �2006� and Ruiz-Garcíaand Miranda �2003�. Akkar and Miranda �2005� indicated that forelastoplastic behavior, on average, both methods would yield sub-stantially different estimations when vibration periods are lessthan approximately 0.6 s. The discrepancy between these meth-ods becomes more apparent for decreasing lateral strength capaci-ties having a tendency toward a significant overestimation for theequivalent linear method proposed by Guyader and Iwan �2006�.This observation is contradictory to the conclusions made byKazaz et al. �2006�, as they reported unsafe predictions by theimproved CSM. The reason behind such conflicting results mightemerge from different scenarios put forward during the evaluationof the NSPs. While Kazaz et al. �2006� established their resultsusing an idealized SDOF system of a high-strength capacity, verystiff, wall-type structure, Akkar and Miranda �2005� used genericelastoplastic oscillators to compute the relevant statistics as afunction of a normalized lateral strength and vibration period.
This study evaluates the improved NSPs presented in FEMA-440 by using a common building inventory and ground-motiondatabase with a total of 24 nondegrading, three- to nine-storyreinforced concrete �RC� moment-resisting frames and 78 stiffsoil near-fault records. The accuracy of the NSPs was verified forpeak SDOF displacement, maximum roof, and interstory drifts.The frame models conform to modern seismic design codes thatensure nondeteriorating cyclic behavior in strength. The nondete-riorating lateral strength hysteretic behavior leads the study toevaluate the common points in the improved NSPs, as both pro-cedures describe strength deterioration by different hystereticmodels that would result in biased comparisons within the contextof this study. The statistics presented suggest that the accuracy ofNSPs is sensitive to the changes in the lateral strength capacity,ductility demand, and postyield stiffness. Different lateral loadingpatterns also influence the degree of accuracy of the NSPsinvestigated.
Ground-Motion Database
The moment magnitude �M� �5.7�M�7.6� and the shortestsource-to-site distance �1 km�d�23 km� distribution of theground-motion database exhibit the features of the moderate-to-severe near-fault events. Almost all of the ground motions �75records out of 78� are recordings from stiff soil sites with anaverage shear-wave velocity of 360 m/s�Vs�760 m/s in theupper 30 m. The ground-motion database was subdivided intofour bins to emphasize the amplitude variation in the ground ve-locity and the pulse-type waveform feature that are used to pa-rameterize the near-fault influence on structures �Bray andRodriguez-Marek 2004�. Groups A and B consist of 20 near-faultrecords with 40 cm/s� peak ground velocity �PGV� �60 cm/sand 20 cm/s�PGV�40 cm/s, respectively. These records donot contain pulse signals. Groups C and D consist of 20 and 18records, respectively, and exhibit pulse signals in their wave-forms. The PGV values of the Group C records are in between40 cm/s and 60 cm/s, whereas the Group D records attain PGVvalues greater than 60 cm/s. Group A contains larger magnitudeground motions among the records without pulse, whereas GroupD ground motions are recorded at relatively closer distancesamong the pulse dominant records.
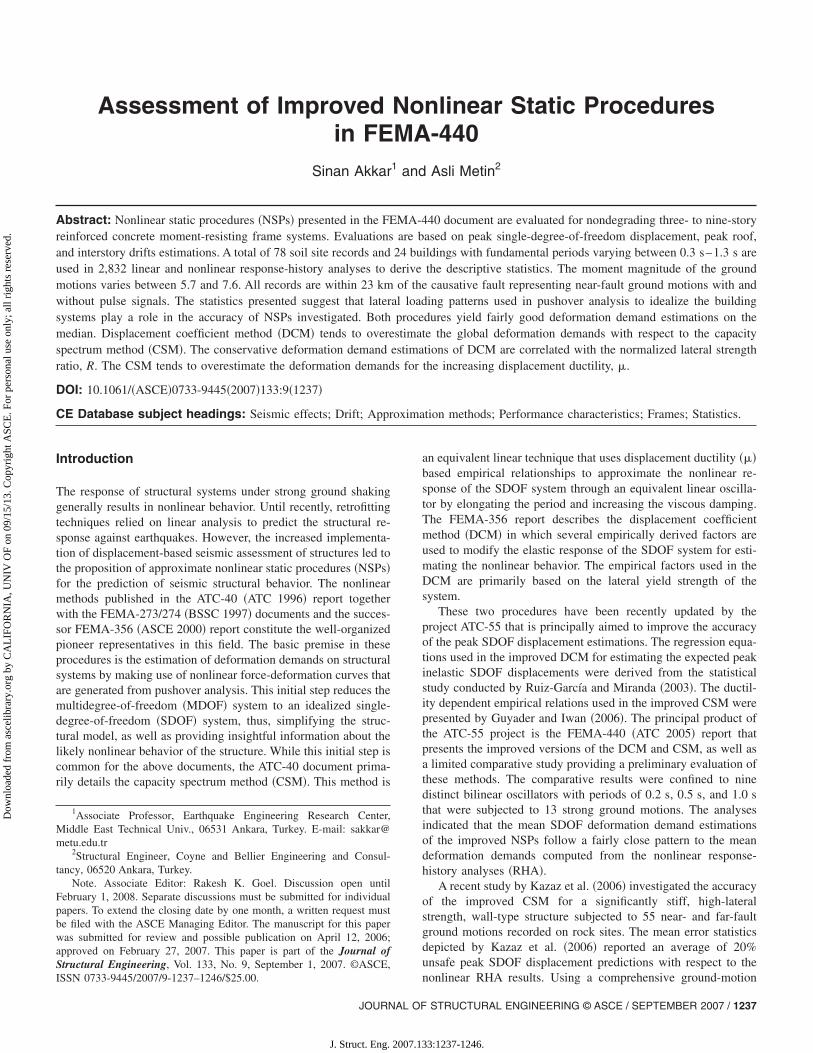
Fig. 1 presents the design spectra that describe the median
variation of 5% damped pseudo-acceleration spectra �Sa� of the1238 / JOURNAL OF STRUCTURAL ENGINEERING © ASCE / SEPTEMBER
J. Struct. Eng. 2007.1
records for each bin. The spectral shapes are consistent with themagnitude and distance features of the bins. The median demandsof Groups D and A are higher than those of Groups C and B,respectively, that contain longer distance �Group C� and lowermagnitude �Group B� records. The corner period that separatesthe constant-acceleration plateau from the descending branch isshifted towards longer periods for bins that exhibit larger PGV�such as the median design spectrum of Group A against B�and/or pulse-type signals �such as the median design spectra ofGroups C and D against Group A�. The descending branches ofGroups C and D decay relatively slower than the other two groupsdue to the dominant long-period pulses in their waveforms. Theseobservations mark the salient characteristics of the near-faultevents suggesting that the database can reflect almost all of thecommon features of the near-fault records.
Building Models and Pushover Analyses
The median design spectrum of each ground-motion bin was usedto model three bay, RC regular moment-resisting frames. Thespan width and story height of the buildings were chosen as 5 mand 3 m, respectively. The height-wise lateral stiffness distribu-tion of the frames was tuned to satisfy the drift limits imposed byFEMA-450 �BSSC 2003�. The dimensions and detailing of themodels aim to ensure nondegrading strength behavior as the NSPspresented in FEMA-440 are evaluated for this particular case. TheKent and Park model �Kent and Park 1971� was used for theconcrete stress-strain relationship that determines the ultimate de-formation capacity considering the degree of confinement. Theunconfined concrete compressive strength and initial Young’smodulus were taken as 20 and 28,500 MPa, respectively. Theconcrete strain at the maximum compressive strength is 0.002.The ultimate deformation capacity of the concrete members ishigh due to the confinement detailing. The yield and ultimatestrength capacity of the reinforcing bars are 420 MPa and588 MPa, respectively. The initial modulus of elasticity of thereinforcing bars is 200,000 MPa. At the commencement of the
Fig. 1. Median design spectra used in the model frames
strain hardening �strain values greater than 0.03� the elasticity
2007
33:1237-1246.
JOURNAL OF
J. Struct. Eng. 2007.1
Dow
nloa
ded
from
asc
elib
rary
.org
by
CA
LIF
OR
NIA
, UN
IV O
F on
09/
15/1
3. C
opyr
ight
ASC
E. F
or p
erso
nal u
se o
nly;
all
righ
ts r
eser
ved.
modulus of the steel bars reduces to 1/60th of its initial value. Theframes were analyzed using the software IDARC-2D �Valles et al.1996� that is capable of fiber modeling and spread plasticity tocapture the variation of section plasticity. The initial viscousdamping was taken as 5% for the model buildings. �Unless statedotherwise, the initial viscous damping is 5% in all dynamic analy-ses that is compatible with the NSPs investigated.�
Moderate-stiffness degradation was implemented during thenonlinear RHA of the frames that is generally expected for well-designed concrete buildings during cyclic excursions. The influ-ence of this hysteretic model on the global deformation demandswas investigated by repeating the nonlinear RHA for the bilinearcyclic behavior that does not account for the stiffness degradation.The comparisons showed that the chosen hysteretic model, onaverage, yields peak roof displacements that are 7% larger thanthose computed from the bilinear hysteretic model. This differ-ence is, on average, 8% for the peak interstory drift values. Con-fined to the ground motions and building models of this study,these observations may advocate that the results presented canarguably be valid for the bilinear cyclic behavior.
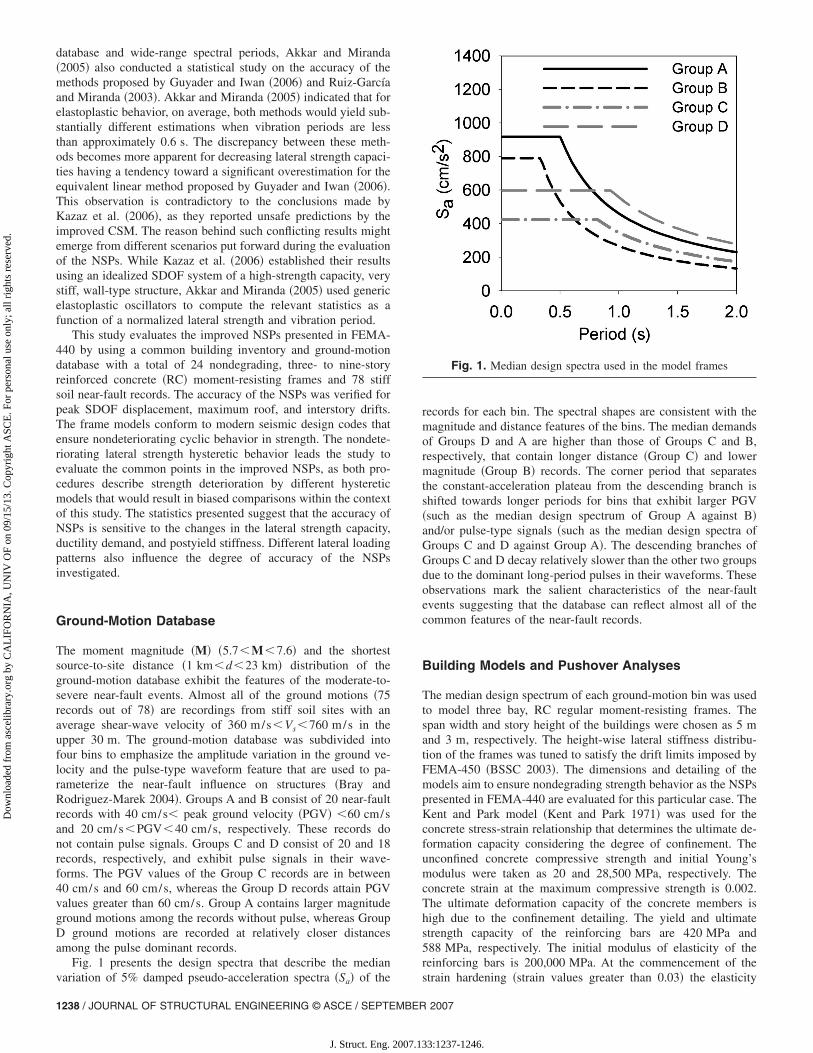
A total of six sets of frames were designed with three, five,seven, and nine stories covering a fundamental period range of0.27 s–1.31 s. Fig. 2 presents the fundamental period �T1� versusthe total height �H� variations of the models that are fairly con-sistent with the empirical relationships presented by Chopra andGoel �2000a�. Thus, the models used can be interpreted as therepresentatives of general moment-resisting RC frame behaviorfor three- to nine-story levels.
Table 1 lists some of the important features of model frames.The idealized period �T1,id� and the postyielding stiffness ratio ���
le Uniform
��%�
T1,id
�s��
�%�Groundmotion
2.3 0.25 2.2
Bin A3.1 0.40 3.7
4.3 0.57 4.9
4.6 0.74 5.4
2.3 0.31 2.6
Bin B4.1 0.51 4.7
3.5 0.59 3.6
4.5 0.84 4.7
3.2 0.51 3.2
Bin C3.8 0.70 5.5
4.5 0.88 5.3
5.5 1.14 5.7
3.9 0.38 4.0
Bin A6.3 0.59 7.6
7.1 0.78 6.1
7.7 1.07 7.3
4.4 0.44 4.4
Bin B4.4 0.64 4.5
8.2 0.83 10.5
12.4 1.13 12.1
2.7 0.38 2.7
Bin D4.2 0.54 5.0
3.5 0.69 3.9
4.4 0.98 5.5
Table 1. Important Properties of Model Buildings
Triang
BuildingStory
numberT1
�s�T1,id
�s�
Group 1
3-st. 0.27 0.27
5-st. 0.45 0.44
7-st. 0.63 0.64
9-st. 0.82 0.82
Group 2
3-st. 0.33 0.31
5-st. 0.55 0.55
7-st. 0.68 0.67
9-st. 0.92 0.88
Group 3
3-st. 0.56 0.55
5-st. 0.78 0.78
7-st. 1.05 1.00
9-st. 1.29 1.23
Group 4
3-st. 0.38 0.37
5-st. 0.64 0.65
7-st. 0.90 0.90
9-st. 1.17 1.16
Group 5
3-st. 0.47 0.47
5-st. 0.71 0.69
7-st. 0.96 0.93
9-st. 1.31 1.25
Group 6
3-st. 0.41 0.41
5-st. 0.59 0.59
7-st. 0.76 0.76
9-st. 1.05 1.03
Fig. 2. Fundamental period �T1� versus total height �H� scatter of themodel frames superimposed by the empirical boundaries presented byChopra and Goel �2000a�
STRUCTURAL ENGINEERING © ASCE / SEPTEMBER 2007 / 1239
33:1237-1246.
Dow
nloa
ded
from
asc
elib
rary
.org
by
CA
LIF
OR
NIA
, UN
IV O
F on
09/
15/1
3. C
opyr
ight
ASC
E. F
or p
erso
nal u
se o
nly;
all
righ
ts r
eser
ved.
were computed from the pushover curves. The height invariantinverse triangular and uniform loading patterns were used in thepushover �PO� analyses. The inverse triangular pattern is one ofthe lateral load distributions suggested by the building codes forstructures deforming primarily in the first mode, and is similar tothe equivalent lateral force distribution described in FEMA-356for the building models. The uniform loading pattern implementslateral forces proportional to story masses emphasizing the de-mands in the lower stories. This loading pattern is suggested to becomplementary to inverse triangular loading by FEMA-356 andaccounts for the uncertainties in the variation of deformation de-mands during strong ground shaking.
When comparing PO curves with and without P-delta effectsno negative postyield stiffness that ensures structural instability athigh deformations was observed. This suggests minimal or noP-delta effect for the frames investigated. Thus, P-delta effectswere disregarded in this study. This further simplification alsoavoids biased comparisons between the improved NSPs, sincethey consider the influence of P-delta in different ways; the im-proved DCM imposes a limit on lateral strength as a function ofthe negative postyielding stiffness ratio to prevent dynamic insta-bility during nonlinear behavior, whereas CSM provides informa-tion on the P-delta influence via in-cycle strength degradationexcursions.
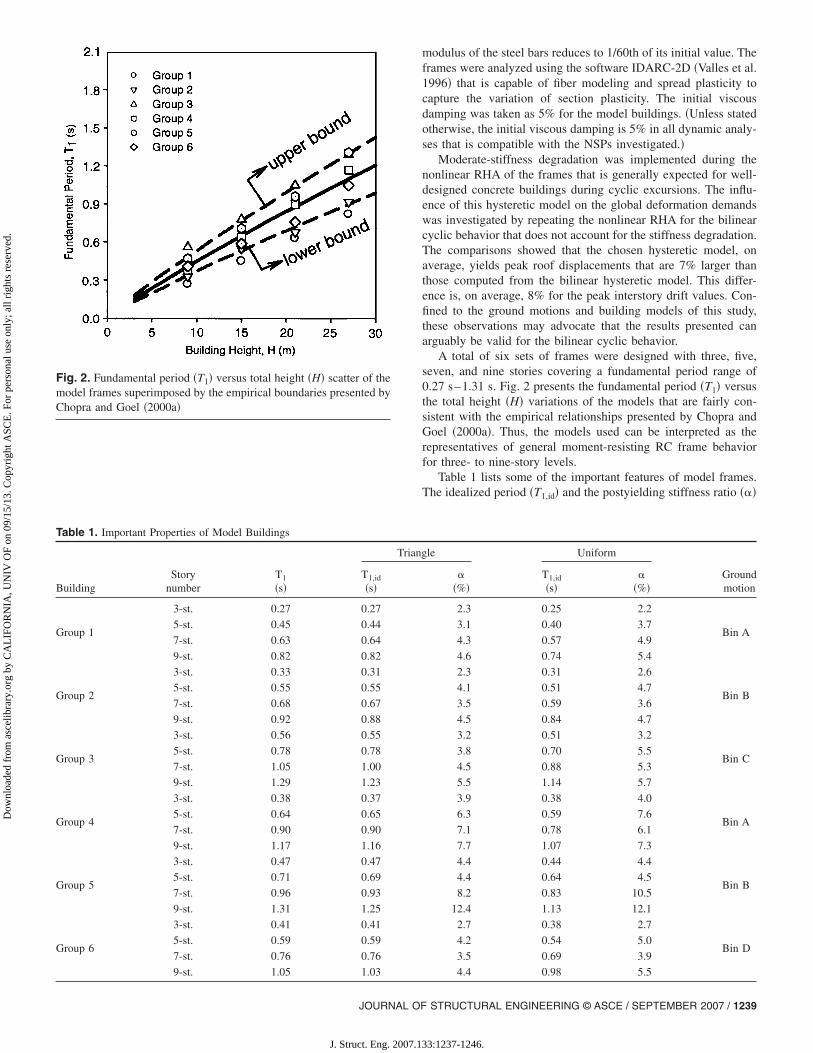
The bilinear idealization of the PO curves was performed fol-lowing the methodology presented in ATC-40 that is still one ofthe methods suggested for the improved NSPs. These curves wereused in the computation of T1,id and �, as well as representing theidealized bilinear SDOF systems of the models. A sample illus-tration of the PO curves and the corresponding bilinear idealiza-tions is presented in Fig. 3. The idealized periods computed fromthe inverse triangular and uniform loading patterns are fairly closeto the fundamental periods of most low-rise building models. Thisagreement loosens for seven- and nine-story buildings, since theirPO curves computed from the uniform loading pattern reveal
Fig. 3. Global capacity envelopes and corresponding bilinear ideali-zations of Group 1 model buildings. The plots superimpose �−�roof pairs computed from nonlinear RHA.
shorter T1,id with respect to those computed from the inverse tri-
1240 / JOURNAL OF STRUCTURAL ENGINEERING © ASCE / SEPTEMBER
J. Struct. Eng. 2007.1
angular pattern. The yield strengths computed from the uniformlateral loading attain larger values than those obtained from theinverse triangular loading. The postyield stiffness of the uniformlateral loading is generally larger than the inverse triangular load-ing, although, for some buildings the differences are negligible.The differences reported in the global capacity curves can emergefrom the point of application of the resultant force of the lateralload patterns. The uniform loading pattern gives the lowest pointof application of the resultant lateral force; hence, larger strengthand earlier global yield are computed. The resultant lateral load ofthe inverse triangular pattern is applied at a higher point display-ing lower strength, as well as higher global yield.
The maximum absolute base-shear coefficient ��� versus theroof displacement ��roof� pairs computed from the nonlinear RHAare also superimposed in Fig. 3. They show that the global re-sponse of the subject frames is enveloped fairly well by these twolateral loading patterns. For low-rise buildings, the uniform load-ing reveals fairly better representation of global response. As thenumber of stories increases, the RHA results fall between theenvelopes dictated by these alternative loading patterns. Albeit,the apparent differences between the PO curves and � versus �roof
scatters, their fairly good agreement indicates a first-mode domi-nant deformation of the model buildings. The postyielding stiff-ness ratio generally attains values in between 2%–5% that is alsorealistic for properly designed frame systems. However, for someframes, � takes large values. This can be attributed to the highquality material properties, as well as the lateral loading patternsimplemented and the bilinear idealization procedure used. Notethat similar large � values were also presented in the literature forwell-designed concrete frames �e.g., ATC 1996�. Mwafy �2001�indicated that height invariant loading patterns cannot capture thepostyield stiffness accurately when compared to the nonlinearRHA.
NSPs Presented in the FEMA-440 Report
The improved NSPs presented in FEMA-440 primarily modifythe former DCM and CSM to enhance the inelastic peak SDOFdisplacement estimations. The improved DCM modifies C1 andC2 coefficients to improve the expected elastoplastic oscillatordeformation estimations from their elastic counterparts �C1� andmodify these estimations for cyclic degradation �C2�. This proce-dure suggests eliminating coefficient C3 �used in the former ver-sion� that accounts for the amplification in deformations due tothe P-delta effects. Instead, it establishes a limit on the lateralstrength to avoid dynamic instability. The improved CSM pro-poses new effective damping and period relationships for a vastvariety of cyclic behavior �bilinear, stiffness degrading, and in-cycle strength degrading� and postyield stiffness to predict thenonlinear SDOF deformation demands through an equivalent lin-ear system. Essentially, both NSPs relate the predicted SDOFdeformation demands to the MDOF behavior through some fac-tors that rely on the first-mode shape vector and the participationfactor. This section initially discusses the modifications presentedin the FEMA-440 for the peak SDOF displacement prediction.Later, the relationships used for relating SDOF demands toMDOF response are discussed.
Improved DCM to Estimate Equivalent SDOFDeformation Demands
The recommended C1 and C2 expressions for the improved DCM
are2007
33:1237-1246.
Dow
nloa
ded
from
asc
elib
rary
.org
by
CA
LIF
OR
NIA
, UN
IV O
F on
09/
15/1
3. C
opyr
ight
ASC
E. F
or p
erso
nal u
se o
nly;
all
righ
ts r
eser
ved.
C1 = 1�+ R − 1�/�aTe2�; C2 = 1 + 1/800��R − 1�/Te�2; R =
Fe
Fy
�1�
In Eq. �1� R represents the normalized lateral strength ratio anddefines the yield strength �Fy� capacity of the SDOF system rela-tive to its elastic strength �Fe�. The elastic and yield strengthcapacities of the oscillators can be expressed by the correspond-ing elastic and yield pseudo-accelerations, respectively, when thecalculations are based on mass normalized SDOF systems. Theeffective period term, Te�vibration period of the SDOF systemcomputed from the initial branch of the idealized PO curve �T1,id
this study�. The regression constant a is devised for the influenceof different site classes. Since C1 describes the expected inelasticdeformation demands on the oscillators as a function of R andT1,id the estimated peak SDOF response is, inherently, a linearfunction of the elastic pseudo-acceleration. This factor disregardsthe influence of the postyield stiffness that is deemed to beimportant for the peak displacements of short-period and low-strength oscillators �Chopra and Chintanapakdee 2004; Ruiz-García and Miranda 2003�. The coefficient C2 accounts for thechanges in the peak SDOF displacements produced by departuresfrom the elastoplastic model due to severe stiffness, and/orstrength degrading hysteretic behavior. It is equal to 1 for periodsgreater than 0.7 s in the improved DCM. This coefficient is takenas 1, since the differences in the peak roof and interstory driftscomputed from the bilinear and moderate stiffness-degradationhysteretic models are found as negligible in this study.
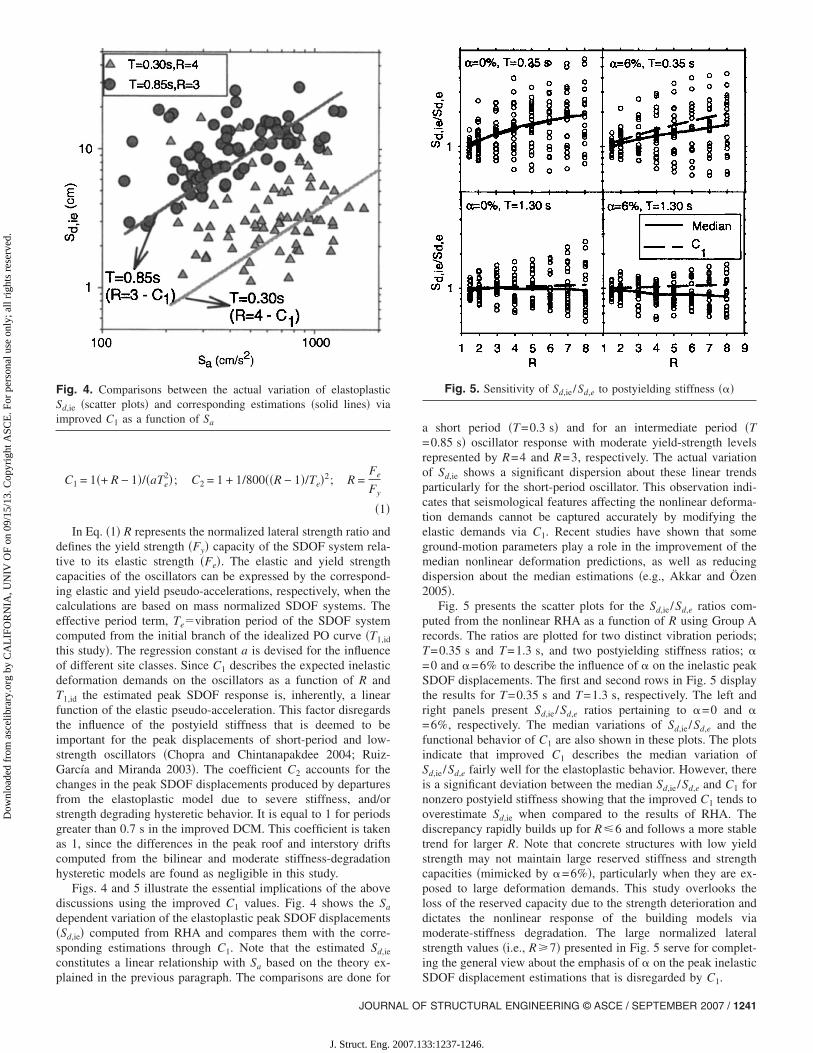
Figs. 4 and 5 illustrate the essential implications of the abovediscussions using the improved C1 values. Fig. 4 shows the Sa
dependent variation of the elastoplastic peak SDOF displacements�Sd,ie� computed from RHA and compares them with the corre-sponding estimations through C1. Note that the estimated Sd,ie
constitutes a linear relationship with Sa based on the theory ex-
Fig. 4. Comparisons between the actual variation of elastoplasticSd,ie �scatter plots� and corresponding estimations �solid lines� viaimproved C1 as a function of Sa
plained in the previous paragraph. The comparisons are done for
JOURNAL OF
J. Struct. Eng. 2007.1
a short period �T=0.3 s� and for an intermediate period �T=0.85 s� oscillator response with moderate yield-strength levelsrepresented by R=4 and R=3, respectively. The actual variationof Sd,ie shows a significant dispersion about these linear trendsparticularly for the short-period oscillator. This observation indi-cates that seismological features affecting the nonlinear deforma-tion demands cannot be captured accurately by modifying theelastic demands via C1. Recent studies have shown that someground-motion parameters play a role in the improvement of themedian nonlinear deformation predictions, as well as reducingdispersion about the median estimations �e.g., Akkar and Özen2005�.
Fig. 5 presents the scatter plots for the Sd,ie /Sd,e ratios com-puted from the nonlinear RHA as a function of R using Group Arecords. The ratios are plotted for two distinct vibration periods;T=0.35 s and T=1.3 s, and two postyielding stiffness ratios; �=0 and �=6% to describe the influence of � on the inelastic peakSDOF displacements. The first and second rows in Fig. 5 displaythe results for T=0.35 s and T=1.3 s, respectively. The left andright panels present Sd,ie /Sd,e ratios pertaining to �=0 and �=6%, respectively. The median variations of Sd,ie /Sd,e and thefunctional behavior of C1 are also shown in these plots. The plotsindicate that improved C1 describes the median variation ofSd,ie /Sd,e fairly well for the elastoplastic behavior. However, thereis a significant deviation between the median Sd,ie /Sd,e and C1 fornonzero postyield stiffness showing that the improved C1 tends tooverestimate Sd,ie when compared to the results of RHA. Thediscrepancy rapidly builds up for R�6 and follows a more stabletrend for larger R. Note that concrete structures with low yieldstrength may not maintain large reserved stiffness and strengthcapacities �mimicked by �=6%�, particularly when they are ex-posed to large deformation demands. This study overlooks theloss of the reserved capacity due to the strength deterioration anddictates the nonlinear response of the building models viamoderate-stiffness degradation. The large normalized lateralstrength values �i.e., R�7� presented in Fig. 5 serve for complet-ing the general view about the emphasis of � on the peak inelastic
Fig. 5. Sensitivity of Sd,ie /Sd,e to postyielding stiffness ���
SDOF displacement estimations that is disregarded by C1.
STRUCTURAL ENGINEERING © ASCE / SEPTEMBER 2007 / 1241
33:1237-1246.
Dow
nloa
ded
from
asc
elib
rary
.org
by
CA
LIF
OR
NIA
, UN
IV O
F on
09/
15/1
3. C
opyr
ight
ASC
E. F
or p
erso
nal u
se o
nly;
all
righ
ts r
eser
ved.
Improved CSM to Estimate Equivalent SDOFDeformation Demands
The improved CSM determines the equivalent linear parameters�effective period, Teff, and effective damping, eff through a sta-tistical analysis that minimizes the extreme differences betweenthe maximum response of an actual inelastic SDOF system and itsequivalent linear counterpart �Guyader and Iwan 2006�. In theimproved CSM, both Teff and eff expressions are discontinuousat two distinct ductility values ��=4 and �=6.5�, and they aresuggested to be used for � less than 10–12. The format of Teff andeff expressions is given in Eqs. �2�
eff = A�� − 1�2 + B�� − 1�3 + 0;
Teff = �G�� − 1�2 + H�� − 1�3 + 1�T0 � � 4 �2a�
eff = C + D�� − 1� + 0; Teff = �I + J�� − 1� + 1�T0
4.0 � � � 6.5 �2b�
eff = E�F�� − 1� − 1
F�� − 1�2 ��Teff
T0� + 0;
Teff = K� �� − 1�1 + L�� − 2�
− 1� + 1�T0 � 6.5
�2c�
The parameters T0 and 0�initial period and viscous damping ofthe bilinear SDOF system idealized from the PO curves. Theconstants A through K vary for different � values and hystereticmodels. The improved CSM also presents alternative values forthese constants that can be used for any case regardless of � andhysteretic model.
Iterative or graphical procedures are required in CSM to esti-mate the peak nonlinear SDOF displacements, since eff and Teff
are functions of � that is not known a priori from the idealizedPO curves. The effective period expressions in the improvedCSM do not follow the secant-stiffness approach that was the casein the former version presented in ATC-40. This fact complicatesthe graphical solution. Therefore, in this study, the direct iteration�Procedure A� technique was used to estimate the peak nonlinearSDOF displacements by the improved CSM. The procedure startswith an initial assumption for the displacement ductility ��initial�,computes the equivalent linear parameters using Eqs. �2�, andestimates the peak SDOF displacement from the equivalent linearsystem. This estimation is used to compute the new displacementductility ��computed�. The initial and computed ductilities are thencompared and the absolute relative difference between �initial and�computed is used as the criterion for finalizing the computations. Ifit is less than a given tolerance level, the computations are termi-nated. Otherwise, the initial ductility is set to the value of�computed and the iterations continue until �initial and �computed con-verge satisfying the predetermined tolerance level. The iterativeschemes are numerical methods, and they aim to approach theroot�s� of a function. The convergence between the consecutiveiterations warrants the satisfactory approximation to the root thatis dictated by the tolerance level. The particular iterative schemedescribed here may run into oscillating divergence problems�Chopra and Goel 2000b� that can be treated by some numericalanalysis techniques �Miranda and Akkar 2002�.
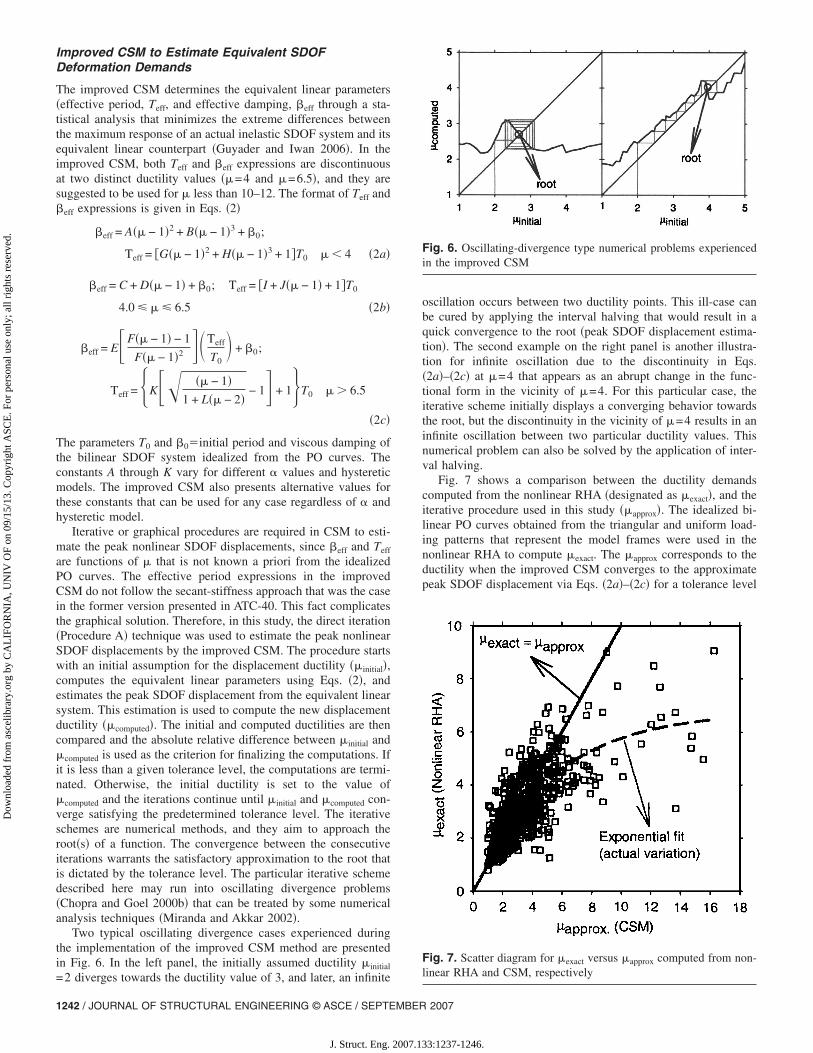
Two typical oscillating divergence cases experienced duringthe implementation of the improved CSM method are presentedin Fig. 6. In the left panel, the initially assumed ductility �initial
=2 diverges towards the ductility value of 3, and later, an infinite
1242 / JOURNAL OF STRUCTURAL ENGINEERING © ASCE / SEPTEMBER
J. Struct. Eng. 2007.1
oscillation occurs between two ductility points. This ill-case canbe cured by applying the interval halving that would result in aquick convergence to the root �peak SDOF displacement estima-tion�. The second example on the right panel is another illustra-tion for infinite oscillation due to the discontinuity in Eqs.�2a�–�2c� at �=4 that appears as an abrupt change in the func-tional form in the vicinity of �=4. For this particular case, theiterative scheme initially displays a converging behavior towardsthe root, but the discontinuity in the vicinity of �=4 results in aninfinite oscillation between two particular ductility values. Thisnumerical problem can also be solved by the application of inter-val halving.
Fig. 7 shows a comparison between the ductility demandscomputed from the nonlinear RHA �designated as �exact�, and theiterative procedure used in this study ��approx�. The idealized bi-linear PO curves obtained from the triangular and uniform load-ing patterns that represent the model frames were used in thenonlinear RHA to compute �exact. The �approx corresponds to theductility when the improved CSM converges to the approximatepeak SDOF displacement via Eqs. �2a�–�2c� for a tolerance level
Fig. 6. Oscillating-divergence type numerical problems experiencedin the improved CSM
Fig. 7. Scatter diagram for �exact versus �approx computed from non-linear RHA and CSM, respectively
2007
33:1237-1246.
Dow
nloa
ded
from
asc
elib
rary
.org
by
CA
LIF
OR
NIA
, UN
IV O
F on
09/
15/1
3. C
opyr
ight
ASC
E. F
or p
erso
nal u
se o
nly;
all
righ
ts r
eser
ved.
of 5%. The scatter diagram in Fig. 7 indicates that the ductilitydemand estimations of the improved CSM are in good agreementwith �exact for ��4. As �exact attains higher values, this agree-ment loosens. The estimations of the improved CSM attain largervalues than the nonlinear dynamic analyses. This is emphasizedby the exponential fit between �exact and �approx.
Transforming Equivalent SDOF Deformation Estimatesto MDOF Systems
The prime assumption in the NSPs is that the behavior of MDOFsystems can be anticipated from the response of the SDOF sys-tems. In most cases, the response of the bilinear SDOF system isrelated to the MDOF system via the first-mode elastic dynamicproperties as described in ATC-40 and FEMA-356 �designated asC0 in DCM�. FEMA-440 does not attempt to propose a new re-lationship for modifying the SDOF demand estimations forMDOF behavior. The statistical studies conducted in FEMA-440using a total of 11 far-fault and 4 near-fault records for 5 examplebuildings indicated that the peak roof displacements would beoverestimated by 10–20% when the peak SDOF displacementscomputed from the nonlinear RHA are modified by the product�1�1
roof �elastic first-mode participation factor, �1, multiplied bythe amplitude of first-mode vector at the roof, �1
roof�. Alternativeto �1�1
roof, FEMA-356 also tabulates some coefficients to modifythe peak SDOF displacement for the roof displacement. Thesecoefficients depend on the story number and the lateral loadingpattern used during the PO analysis.
This study conducted a statistical analysis using the ratios ofthe peak roof displacements of the building models ��roof,ie� to thepeak SDOF displacements �Sd,ie� computed from the nonlinearRHA. The idealized bilinear SDOF systems computed from thetriangular and uniform lateral loading patterns were used to com-pute Sd,ie. The ratio, �roof,ie /Sd,ie yields an empirical relationshipfor SDOF to MDOF global deformation demand variation.
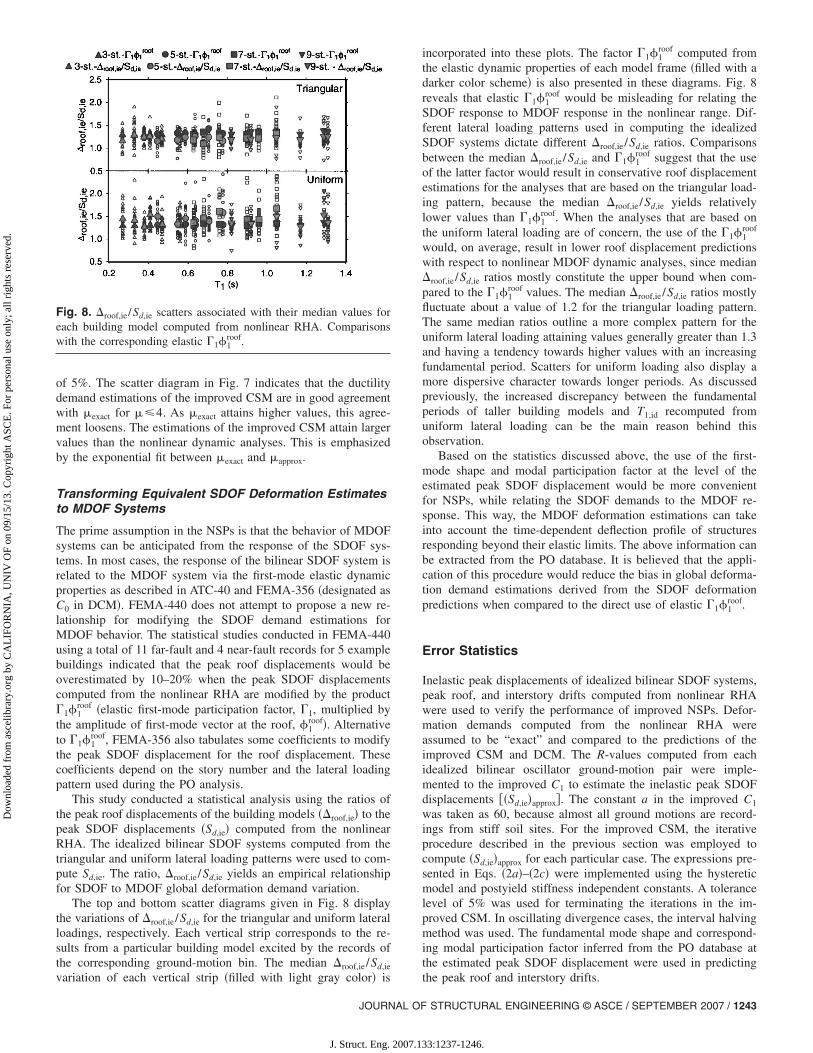
The top and bottom scatter diagrams given in Fig. 8 displaythe variations of �roof,ie /Sd,ie for the triangular and uniform lateralloadings, respectively. Each vertical strip corresponds to the re-sults from a particular building model excited by the records ofthe corresponding ground-motion bin. The median �roof,ie /Sd,ie
Fig. 8. �roof,ie /Sd,ie scatters associated with their median values foreach building model computed from nonlinear RHA. Comparisonswith the corresponding elastic �1�1
roof.
variation of each vertical strip �filled with light gray color� is
JOURNAL OF
J. Struct. Eng. 2007.1
incorporated into these plots. The factor �1�1roof computed from
the elastic dynamic properties of each model frame �filled with adarker color scheme� is also presented in these diagrams. Fig. 8reveals that elastic �1�1
roof would be misleading for relating theSDOF response to MDOF response in the nonlinear range. Dif-ferent lateral loading patterns used in computing the idealizedSDOF systems dictate different �roof,ie /Sd,ie ratios. Comparisonsbetween the median �roof,ie /Sd,ie and �1�1
roof suggest that the useof the latter factor would result in conservative roof displacementestimations for the analyses that are based on the triangular load-ing pattern, because the median �roof,ie /Sd,ie yields relativelylower values than �1�1
roof. When the analyses that are based onthe uniform lateral loading are of concern, the use of the �1�1
roof
would, on average, result in lower roof displacement predictionswith respect to nonlinear MDOF dynamic analyses, since median�roof,ie /Sd,ie ratios mostly constitute the upper bound when com-pared to the �1�1
roof values. The median �roof,ie /Sd,ie ratios mostlyfluctuate about a value of 1.2 for the triangular loading pattern.The same median ratios outline a more complex pattern for theuniform lateral loading attaining values generally greater than 1.3and having a tendency towards higher values with an increasingfundamental period. Scatters for uniform loading also display amore dispersive character towards longer periods. As discussedpreviously, the increased discrepancy between the fundamentalperiods of taller building models and T1,id recomputed fromuniform lateral loading can be the main reason behind thisobservation.
Based on the statistics discussed above, the use of the first-mode shape and modal participation factor at the level of theestimated peak SDOF displacement would be more convenientfor NSPs, while relating the SDOF demands to the MDOF re-sponse. This way, the MDOF deformation estimations can takeinto account the time-dependent deflection profile of structuresresponding beyond their elastic limits. The above information canbe extracted from the PO database. It is believed that the appli-cation of this procedure would reduce the bias in global deforma-tion demand estimations derived from the SDOF deformationpredictions when compared to the direct use of elastic �1�1
roof.
Error Statistics
Inelastic peak displacements of idealized bilinear SDOF systems,peak roof, and interstory drifts computed from nonlinear RHAwere used to verify the performance of improved NSPs. Defor-mation demands computed from the nonlinear RHA wereassumed to be “exact” and compared to the predictions of theimproved CSM and DCM. The R-values computed from eachidealized bilinear oscillator ground-motion pair were imple-mented to the improved C1 to estimate the inelastic peak SDOFdisplacements ��Sd,ie�approx�. The constant a in the improved C1
was taken as 60, because almost all ground motions are record-ings from stiff soil sites. For the improved CSM, the iterativeprocedure described in the previous section was employed tocompute �Sd,ie�approx for each particular case. The expressions pre-sented in Eqs. �2a�–�2c� were implemented using the hystereticmodel and postyield stiffness independent constants. A tolerancelevel of 5% was used for terminating the iterations in the im-proved CSM. In oscillating divergence cases, the interval halvingmethod was used. The fundamental mode shape and correspond-ing modal participation factor inferred from the PO database atthe estimated peak SDOF displacement were used in predicting
the peak roof and interstory drifts.STRUCTURAL ENGINEERING © ASCE / SEPTEMBER 2007 / 1243
33:1237-1246.
Dow
nloa
ded
from
asc
elib
rary
.org
by
CA
LIF
OR
NIA
, UN
IV O
F on
09/
15/1
3. C
opyr
ight
ASC
E. F
or p
erso
nal u
se o
nly;
all
righ
ts r
eser
ved.
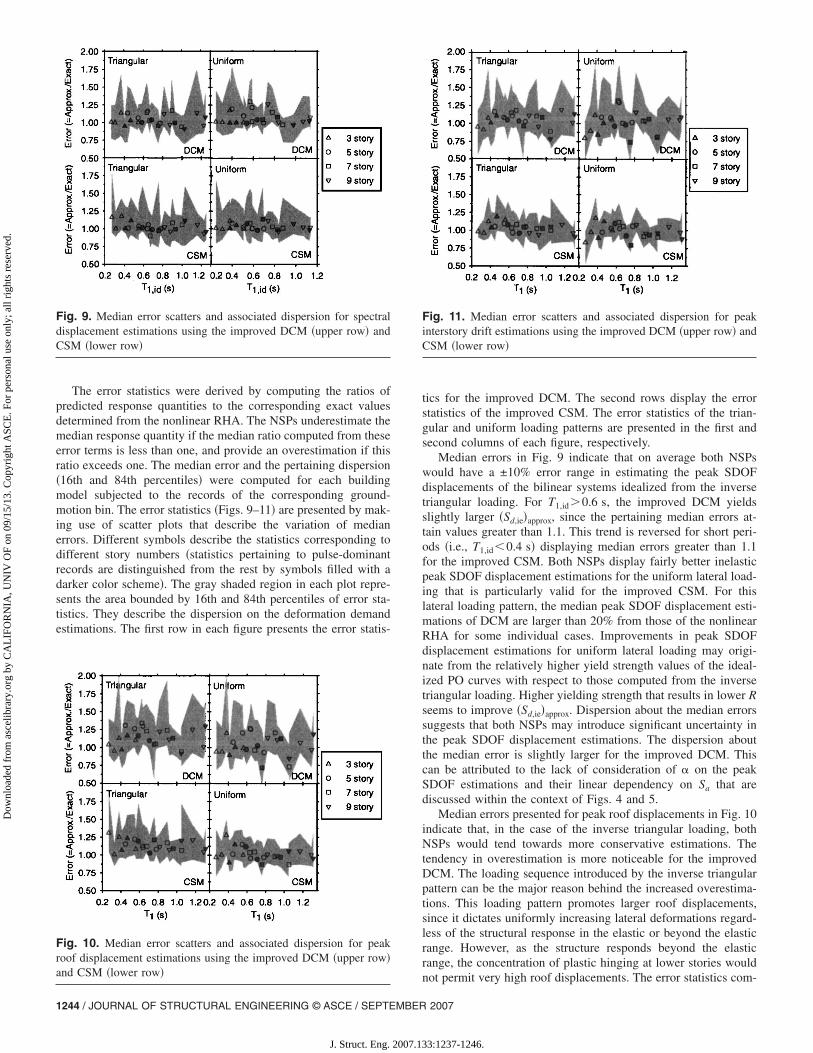
The error statistics were derived by computing the ratios ofpredicted response quantities to the corresponding exact valuesdetermined from the nonlinear RHA. The NSPs underestimate themedian response quantity if the median ratio computed from theseerror terms is less than one, and provide an overestimation if thisratio exceeds one. The median error and the pertaining dispersion�16th and 84th percentiles� were computed for each buildingmodel subjected to the records of the corresponding ground-motion bin. The error statistics �Figs. 9–11� are presented by mak-ing use of scatter plots that describe the variation of medianerrors. Different symbols describe the statistics corresponding todifferent story numbers �statistics pertaining to pulse-dominantrecords are distinguished from the rest by symbols filled with adarker color scheme�. The gray shaded region in each plot repre-sents the area bounded by 16th and 84th percentiles of error sta-tistics. They describe the dispersion on the deformation demandestimations. The first row in each figure presents the error statis-
Fig. 9. Median error scatters and associated dispersion for spectraldisplacement estimations using the improved DCM �upper row� andCSM �lower row�
Fig. 10. Median error scatters and associated dispersion for peakroof displacement estimations using the improved DCM �upper row�and CSM �lower row�
1244 / JOURNAL OF STRUCTURAL ENGINEERING © ASCE / SEPTEMBER
J. Struct. Eng. 2007.1
tics for the improved DCM. The second rows display the errorstatistics of the improved CSM. The error statistics of the trian-gular and uniform loading patterns are presented in the first andsecond columns of each figure, respectively.
Median errors in Fig. 9 indicate that on average both NSPswould have a ±10% error range in estimating the peak SDOFdisplacements of the bilinear systems idealized from the inversetriangular loading. For T1,id0.6 s, the improved DCM yieldsslightly larger �Sd,ie�approx, since the pertaining median errors at-tain values greater than 1.1. This trend is reversed for short peri-ods �i.e., T1,id�0.4 s� displaying median errors greater than 1.1for the improved CSM. Both NSPs display fairly better inelasticpeak SDOF displacement estimations for the uniform lateral load-ing that is particularly valid for the improved CSM. For thislateral loading pattern, the median peak SDOF displacement esti-mations of DCM are larger than 20% from those of the nonlinearRHA for some individual cases. Improvements in peak SDOFdisplacement estimations for uniform lateral loading may origi-nate from the relatively higher yield strength values of the ideal-ized PO curves with respect to those computed from the inversetriangular loading. Higher yielding strength that results in lower Rseems to improve �Sd,ie�approx. Dispersion about the median errorssuggests that both NSPs may introduce significant uncertainty inthe peak SDOF displacement estimations. The dispersion aboutthe median error is slightly larger for the improved DCM. Thiscan be attributed to the lack of consideration of � on the peakSDOF estimations and their linear dependency on Sa that arediscussed within the context of Figs. 4 and 5.
Median errors presented for peak roof displacements in Fig. 10indicate that, in the case of the inverse triangular loading, bothNSPs would tend towards more conservative estimations. Thetendency in overestimation is more noticeable for the improvedDCM. The loading sequence introduced by the inverse triangularpattern can be the major reason behind the increased overestima-tions. This loading pattern promotes larger roof displacements,since it dictates uniformly increasing lateral deformations regard-less of the structural response in the elastic or beyond the elasticrange. However, as the structure responds beyond the elasticrange, the concentration of plastic hinging at lower stories would
Fig. 11. Median error scatters and associated dispersion for peakinterstory drift estimations using the improved DCM �upper row� andCSM �lower row�
not permit very high roof displacements. The error statistics com-
2007
33:1237-1246.
Dow
nloa
ded
from
asc
elib
rary
.org
by
CA
LIF
OR
NIA
, UN
IV O
F on
09/
15/1
3. C
opyr
ight
ASC
E. F
or p
erso
nal u
se o
nly;
all
righ
ts r
eser
ved.
puted for the uniform loading resemble fairly better performancefor both NSPs with median estimations mostly bounded between±10% range with respect to those of the nonlinear RHA. For thisloading pattern, the median errors that reveal underestimation ofroof displacements generally belong to the relatively long-periodbuilding models subjected to records with pulse. The dispersionabout the median error for uniform loading is also reduced whencompared to the dispersion associated with inverse triangularloading. This observation is more noticeable for the improvedCSM. Note that regardless of the lateral loading pattern the dis-persions associated with the improved DCM are larger than thoseof the improved CSM.
The median error statistics presented for peak interstory driftestimations in Fig. 11 reveal similar conclusions to those de-scribed for peak roof displacements. When inverse triangularloading is considered, the median errors show that peak interstorydrifts would be overestimated by a maximum amount of 25% byboth NSPs. The overestimations are larger in the improved DCM.The median interstory drift estimations are slightly improved foruniform lateral loading, since most median errors clustered inbetween 0.9–1.1. The uniform loading pattern emphasizes defor-mation demands in the lower stories that can be a major factor forthe improvements in the median peak interstory drift estimations.This loading pattern also results in a reduction about the uncer-tainty in peak interstory drifts estimated by the improved CSM.The enhancement in median interstory drift estimations by theimproved DCM via uniform loading is not reflected to the corre-sponding dispersion statistics. The dispersions about the medianerrors in this method are significant for both the inverse triangularand uniform loading patterns. Note that, for both NSPs, the errorstatistics of records with pulse have a tendency towards the un-safe side for increasing T1.
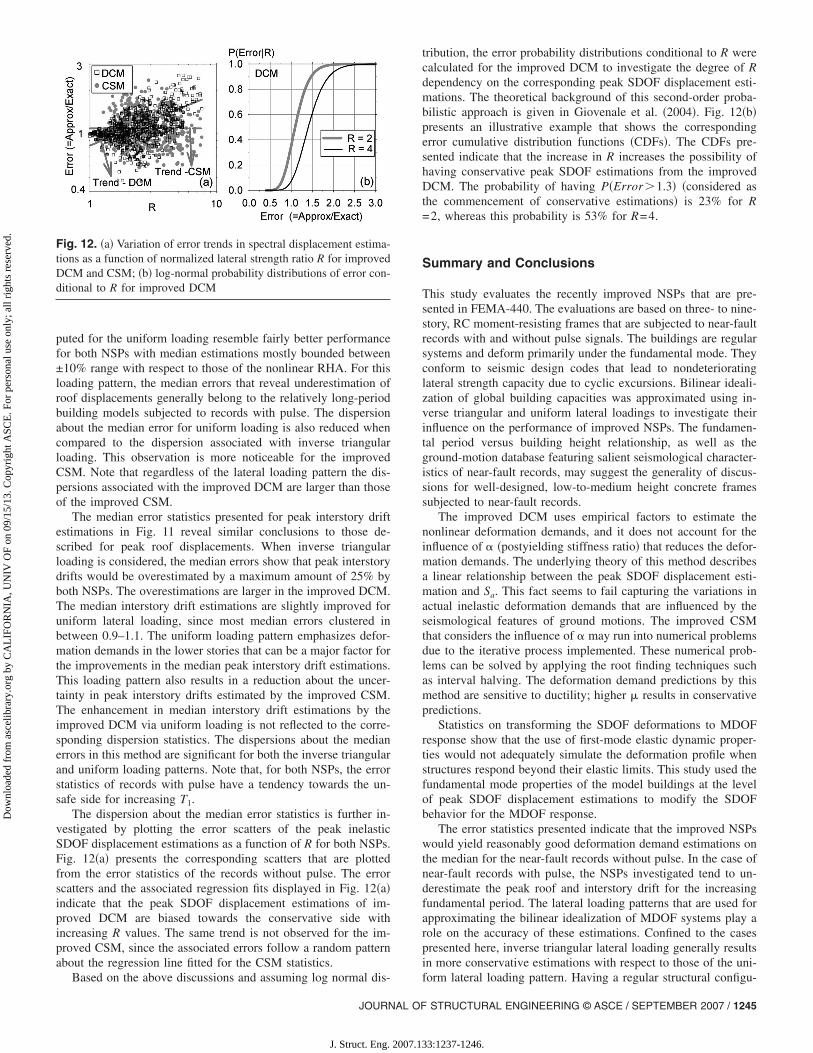
The dispersion about the median error statistics is further in-vestigated by plotting the error scatters of the peak inelasticSDOF displacement estimations as a function of R for both NSPs.Fig. 12�a� presents the corresponding scatters that are plottedfrom the error statistics of the records without pulse. The errorscatters and the associated regression fits displayed in Fig. 12�a�indicate that the peak SDOF displacement estimations of im-proved DCM are biased towards the conservative side withincreasing R values. The same trend is not observed for the im-proved CSM, since the associated errors follow a random patternabout the regression line fitted for the CSM statistics.
Fig. 12. �a� Variation of error trends in spectral displacement estima-tions as a function of normalized lateral strength ratio R for improvedDCM and CSM; �b� log-normal probability distributions of error con-ditional to R for improved DCM
Based on the above discussions and assuming log normal dis-
JOURNAL OF
J. Struct. Eng. 2007.1
tribution, the error probability distributions conditional to R werecalculated for the improved DCM to investigate the degree of Rdependency on the corresponding peak SDOF displacement esti-mations. The theoretical background of this second-order proba-bilistic approach is given in Giovenale et al. �2004�. Fig. 12�b�presents an illustrative example that shows the correspondingerror cumulative distribution functions �CDFs�. The CDFs pre-sented indicate that the increase in R increases the possibility ofhaving conservative peak SDOF estimations from the improvedDCM. The probability of having P�Error1.3� �considered asthe commencement of conservative estimations� is 23% for R=2, whereas this probability is 53% for R=4.
Summary and Conclusions
This study evaluates the recently improved NSPs that are pre-sented in FEMA-440. The evaluations are based on three- to nine-story, RC moment-resisting frames that are subjected to near-faultrecords with and without pulse signals. The buildings are regularsystems and deform primarily under the fundamental mode. Theyconform to seismic design codes that lead to nondeterioratinglateral strength capacity due to cyclic excursions. Bilinear ideali-zation of global building capacities was approximated using in-verse triangular and uniform lateral loadings to investigate theirinfluence on the performance of improved NSPs. The fundamen-tal period versus building height relationship, as well as theground-motion database featuring salient seismological character-istics of near-fault records, may suggest the generality of discus-sions for well-designed, low-to-medium height concrete framessubjected to near-fault records.
The improved DCM uses empirical factors to estimate thenonlinear deformation demands, and it does not account for theinfluence of � �postyielding stiffness ratio� that reduces the defor-mation demands. The underlying theory of this method describesa linear relationship between the peak SDOF displacement esti-mation and Sa. This fact seems to fail capturing the variations inactual inelastic deformation demands that are influenced by theseismological features of ground motions. The improved CSMthat considers the influence of � may run into numerical problemsdue to the iterative process implemented. These numerical prob-lems can be solved by applying the root finding techniques suchas interval halving. The deformation demand predictions by thismethod are sensitive to ductility; higher � results in conservativepredictions.
Statistics on transforming the SDOF deformations to MDOFresponse show that the use of first-mode elastic dynamic proper-ties would not adequately simulate the deformation profile whenstructures respond beyond their elastic limits. This study used thefundamental mode properties of the model buildings at the levelof peak SDOF displacement estimations to modify the SDOFbehavior for the MDOF response.
The error statistics presented indicate that the improved NSPswould yield reasonably good deformation demand estimations onthe median for the near-fault records without pulse. In the case ofnear-fault records with pulse, the NSPs investigated tend to un-derestimate the peak roof and interstory drift for the increasingfundamental period. The lateral loading patterns that are used forapproximating the bilinear idealization of MDOF systems play arole on the accuracy of these estimations. Confined to the casespresented here, inverse triangular lateral loading generally resultsin more conservative estimations with respect to those of the uni-
form lateral loading pattern. Having a regular structural configu-STRUCTURAL ENGINEERING © ASCE / SEPTEMBER 2007 / 1245
33:1237-1246.
Dow
nloa
ded
from
asc
elib
rary
.org
by
CA
LIF
OR
NIA
, UN
IV O
F on
09/
15/1
3. C
opyr
ight
ASC
E. F
or p
erso
nal u
se o
nly;
all
righ
ts r
eser
ved.
ration with fundamental periods less than 1.3 s, the model build-ings deform dominantly in the first-mode promoting theconcentration of plastic hinging in the lower stories. This behav-ior seems to be captured better by the uniform lateral loading. Thelack of consideration of � as well as the linear dependency of theinelastic peak SDOF displacement estimations on Sa are believedto be the important factors for the improved DCM that result inrelatively conservative estimations associated with higher disper-sions. The improved CSM considers the effect of � on SDOFdeformations. Peak nonlinear oscillator displacement estimationsby CSM are carried for each record through a set of equivalentlinear systems that may indicate a fairly better consideration ofrecord-to-record variability. Error statistics conditional to R showthat DCM is biased towards conservative estimations for increas-ing R that may contribute to the higher dispersions about themedian displacement estimations. The results presented indicatethat future inelastic deformation demand predictions should beexplicitly based on nonlinear structural behavior, as well as theimportant ground-motion parameters �i.e., magnitude, site class,source-to-site distance, etc.� to reduce the biases discussed in thetext.
Acknowledgments
This study was funded by the Scientific and Technological Re-search Council of Turkey under Award No. 104M567. The com-ments of three anonymous reviewers significantly improved thetechnical essence and presentation quality of this article. Recordsused in this study were downloaded from the COSMOS website.Professors A. Erberik and G. Özcebe gave valuable informationabout the influence of lateral loading patterns on global capacityenvelopes.
References
Akkar, S., and Özen, Ö. �2005�. “Effect of peak ground velocity on de-formation demands for SDOF systems.” Earthquake Eng. Struct.Dyn., 34, 1551–1571.
Akkar, S. D., and Miranda, E. �2005�. “Statistical evaluation of approxi-mate methods for estimating maximum deformation demands on ex-isting structures.” J. Struct. Eng., 131�1�, 160–172.
American Society of Civil Engineers �ASCE�. �2000�. “Prestandard andcommentary on the seismic rehabilitation of buildings.” Rep. No.FEMA 356, Washington, D.C.
Applied Technology Council �ATC�. �1996�. “Seismic evaluation and ret-
1246 / JOURNAL OF STRUCTURAL ENGINEERING © ASCE / SEPTEMBER
J. Struct. Eng. 2007.1
rofit of concrete buildings.” Rep. No. ATC-40, Applied TechnologyCouncil, Redwood City, Calif.
Applied Technology Council �ATC�. �2005�. “Improvement of nonlinearstatic seismic analysis procedures.” Rep. No. FEMA-440, Washington,D.C.
Bray, J. D., and Rodriguez-Marek, A. �2004�. “Characterization of for-ward directivity ground motions in the near-fault region.” Soil Dyn.Earthquake Eng., 24, 815–828.
Building Seismic Safety Council �BSSC�. �1997�. “NEHRP guidelines forthe seismic rehabilitation of buildings.” Rep. FEMA-273 (Guidelines)and Rep. FEMA-274 (Commentary), Washington, D.C.
Building Seismic Safety Council �BSSC�. �2003�. “NEHRP recom-mended provisions for seismic regulations for new buildings andother structures.” Rep. No. FEMA-450, Washington, D.C.
Chopra, A. K., and Chintanapakdee, C. �2004�. “Inelastic deformationratios for design and evaluation of structures: Single-degree-of-freedom bilinear systems.” J. Struct. Eng., 130�9�, 1309–1319.
Chopra, A. K., and Goel, R. K. �2000a�. “Building period formulas forestimating seismic displacements.” Earthquake Spectra, 16�2�, 533–536.
Chopra, A. K., and Goel, R. K. �2000b�. “Evaluation of NSP to estimateseismic deformation: SDF systems.” J. Struct. Eng., 126�4�, 482–490.
Giovenale, P., Cornell, C. A., and Esteva, L. �2004�. “Comparing theadequacy of alternative ground motion intensity measures for the es-timation of structural responses.” Earthquake Eng. Struct. Dyn., 33,951–975.
Guyader, A. C., and Iwan, W. D. �2006�. “Determining equivalent linearparameters for use in a capacity spectrum method of analysis.” J.Struct. Eng., 132�1�, 59–67.
Kazaz, İ., Yakut, A., and Gülkan, P. �2006�. “Seismic response assess-ment of a stiff structure.” Earthquake Eng. Struct. Dyn., 35, 737–759.
Kent, D. C., and Park, R. �1971�. “Flexural members with confined con-crete.” J. Struct. Div., 97�7�, 1969–1990.
Miranda, E., and Akkar, S. D. �2002�. “Evaluation of approximate meth-ods to estimate target displacements in nonlinear static procedures.”Proc., 4th U.S.-Japan Workshop on Performance-Based EarthquakeEngineering Methodology for Reinforced Concrete Building Struc-tures, Rep. No. PEER-2002/21, Pacific Earthquake Engineering Re-search Center, Univ. of California, 75–86.
Mwafy, A. M. �2001�. “Seismic performance of code designed RC build-ings.” Ph.D. thesis, Dept. of Civil and Environmental Engineering,Imperial College, London.
Ruiz-García, J., and Miranda, E. �2003�. “Inelastic displacement ratios forevaluation of existing structures.” Earthquake Eng. Struct. Dyn., 32,1237–1258.
Valles, R. E., Reinhorn, A. M., Kunnath, S. K., Li, C., and Madan, A.�1996�. “IDARC-2D version 4.0: A program for the inelastic damageanalysis of buildings.” Rep. No. NCEER 96-0010, State University of
New York at Buffalo, N.Y.2007
33:1237-1246.

![ComparativeStudyofNonlinearStaticandTime-History ...downloads.hindawi.com/journals/ace/2018/2176894.pdf · and displacement modification method (DMM) as pre-sented in FEMA 440 [5]](https://img.pdfslide.net/doc/110x75/600c7827bed86665b44919a6/comparativestudyofnonlinearstaticandtime-history-and-displacement-modiication.jpg)


![VariabilityandAccuracyofTargetDisplacementfrom ...downloads.hindawi.com/archive/2011/582426.pdf · CM proposed in the FEMA-440 report [3]andadoptedin the ASCE-41 standard [6], (3)](https://img.pdfslide.net/doc/110x75/5ec2aa5657882965be344983/variabilityandaccuracyoftargetdisplacementfrom-cm-proposed-in-the-fema-440-report.jpg)