Embed Size (px)
Citation preview
Assessment of Load Factor as a System Efficiency Earning Adjustment Mechanism
PREPARED FOR
The Joint Utilities of New York
PREPARED BY
William Zarakas
Sanem Sergici
Kevin Arritt
David Kwok
February 10, 2017

This report was prepared for Central Hudson Gas & Electric Corporation, Consolidated Edison
Company of New York, Inc., New York State Electric & Gas Corporation, Niagara Mohawk
Power Corporation d/b/a National Grid, Orange and Rockland Utilities, Inc., and Rochester Gas
and Electric Corporation (collectively the “Joint Utilities” or the “Utilities”). All results and any
errors are the responsibility of the authors and do not represent the opinion of The Brattle Group
or its clients.
Acknowledgement: We acknowledge the valuable contributions of the Joint Utilities to this
report and to the underlying analysis.
Copyright © 2017 The Brattle Group, Inc.
i | brattle.com
Table of Contents Executive Summary .............................................................................................................................. 2
I. Background .................................................................................................................................. 3
II. Historical Analysis of Load Factor in New York ....................................................................... 5
A. System Efficiency, Load Factor, and Energy-To-Peak Ratio ........................................... 5
B. Historical Load Factor and Energy Intensity Ratios ........................................................ 6
III. Forward Looking Analysis of Load Factor in New York ........................................................... 9
A. Overview of Scenarios ....................................................................................................... 9
B. Forward-Looking DER Impact on Load Factor .............................................................. 14
IV. Analysis Summary and Conclusion .......................................................................................... 15
V. Alternative Measures of System Efficiency ............................................................................. 16
1. Load Factor Derivatives .......................................................................................... 17
2. Beneficial Electrification Measures ....................................................................... 17
3. System Peak Reduction Measures .......................................................................... 18
13

2 | brattle.com
Executive Summary
In its May 19, 2016 Order,1 the New York Public Service Commission (the “Commission”)
directed the Joint Utilities (“JU”) to file a system efficiency Earnings Adjustment Mechanism
(“EAM”) that included system load factor as an EAM element. New York’s Joint Utilities
retained The Brattle Group (“Brattle”) to assess the degree to which utilities can realistically
impact system load factor, and thereby the effectiveness of specifying system load factor as an
EAM.
Mechanically, improvements in system load factor can come from either increasing sales of
energy (i.e., the ratio’s numerator) and/or reducing system peak (i.e., the ratio’s denominator).
Thus, the only ways for utilities to meet any EAM targets (concerning peak reduction and load
factor) is to either reduce peaks and/or increase energy sales. We examined the extent to which
the utilities could influence system load factor primarily through the integration of distributed
energy resources (“DERs”). We also considered the impact that initiatives concerning beneficial
electrification (such as the electrification of some areas of transportation) may have on system
load factor.2
We concluded that a system load factor EAM will largely be ineffective because utility initiatives
concerning the integration of DERs and the deployment of beneficial electrification are unlikely
to have a meaningful and distinct impact on system load factor. Specifically, our analysis, which
is presented in the remainder of this report, indicates that:
DERs will not meaningfully improve system load factor because: (1) the load profiles of
most DERs, as measured by the energy-to-peak (“EP”) ratio for DERs, are very similar to
the utilities’ contribution to the state-wide system load factor;3 and (2) DER penetration is
relatively low (compared to system load levels) over both the historical study period and
the forward-looking scenarios.
1 NY PSC Case 14-M-0101, Proceeding on Motion of the Commission in Regard to Reforming the
Energy Vision, (“REV”) Order Adopting a Ratemaking and Utility Revenue Model Policy Framework,
May 19, 2016. (“REV Ratemaking Order”).
2 Beneficial electrification refers to the carbon-reducing switch from fossil-based technology to cleaner
electric technology options. Electric vehicles are a primary example of beneficial electrification when
grids are powered with cleaner energy resources. Electric vehicle charging increases energy load, but
decreases the combustion of petroleum products, leading to a cleaner solution for transportation.
3 The load factor presented is calculated based on each utility’s peak demand coincident with the
statewide New York Control Area (NYCA) peak.
3 | brattle.com
Material impacts from DERs on system load factor are observed only in our
reach/boundary scenarios, which were designed to reflect unrealistically high levels of
DER deployments within the time frame of our study.
More realistic levels of DER penetration and beneficial electrification will result in very
low improvements in system load factor. Furthermore, the specific impacts of these
initiatives on load factor will be difficult to measure because the results fall largely within
the expected level of statistical variation. That is, they fall within the overall random
statistical pattern observed for system load factors historically year-to-year.
Beneficial electrification mainly affects the numerator of the load factor, suggesting that
utilities may be able to materially improve system load factor through such initiatives.
However, our analysis indicates that the beneficial electrification scenarios considered
had only small load factor effects, even those that included relatively aggressive cases for
electric vehicle (“EV”) penetration.
Brattle and the Joint Utilities then engaged in a high-level brainstorming effort to identify EAMs
that may more appropriately meet the Commission’s intent. Alternative EAMs identified
include: (1) load factor derivatives; (2) beneficial electrification measures; and (3) system peak
reduction measures. These alternative measures represent ideas that would need to be studied
more closely before considering whether they could appropriately be part of any system
efficiency EAM.
I. Background
The REV Ratemaking Order highlighted Staff’s recommendation for EAMs to better align the
Commission’s ratemaking practices with the regulatory policy objectives, and directed each
utility to propose specific EAMs covering four primary areas: (1) system efficiency (including
peak reduction and load factor improvement); (2) energy efficiency; (3) interconnection; and (4)
greenhouse gas reductions. The Commission emphasized its interest in the utilities developing a
system efficiency EAM; as system efficiency improvement remains a primary REV goal. In this
regard, the Commission required that each utility propose targets for peak reduction and load
factor improvement that are appropriate for its territory under a defined cost-effective strategy,
over a period of five years.4
4 Utilities were given some leeway in designing the specific EAM; targets may be annual or cumulative,
and may consider relevant benchmarks established in other jurisdictions.
4 | brattle.com
The Joint Utilities retained The Brattle Group to analyze the impacts that various REV-related
DER initiatives may have upon system load factor. Load factor is a widely-accepted indicator of
system efficiency, calculated as the ratio of average hourly load to peak load. This ratio can be
influenced through utility initiatives that increase the sale of energy and/or reduce the system
peak.
Our analysis encompassed an empirical analysis, on a historical and forward looking basis, to
determine the extent to which varying levels of DER penetrations will impact system load
factors. DERs considered in our analysis included: energy efficiency (“EE”), rooftop
photovoltaics (“PV”), demand response (“DR”), and combined heat and power (“CHP”). We also
conducted an analysis of the impact that varying penetrations of beneficial electrification,
especially electric vehicles ("EV”) have upon load factor. Specifically:
Energy efficiency encompasses a wide variety of utility and New York State Energy
Research and Development Authority (“NYSERDA”) operated programs that focus on
reducing the electricity needed to provide the same level of products and services. EE
measures could range from efficient lighting to efficient laundry machines.
Photovoltaics, in this context as a DER, encompasses small-scale behind-the-meter solar
installations. This includes residential rooftop solar, along with commercial and
industrial applications of solar panels. Large-scale utility solar is not included in this DER
category, as it is typically connected to the transmission grid.
Demand response encompasses utility or New York Independent System Operator
(“NYISO”) programs where consumers are compensated for reducing their load during
times when the electrical system is strained. DR programs can be designed to manage
local distribution system peaks or overall system level peaks. For the purposes of this
analysis, we focus only on DR programs designed to manage the overall system peak
demand.
Combined heat and power refers to power plants, which generate electricity and steam
for heating. These are also known as cogeneration plants.
Brattle’s engagement was motivated primarily by two factors. First, the Joint Utilities were
uncertain as to how much influence that initiatives such as DER integration could have upon
system load factor. Second, in its REV Ratemaking Order, the Commission recognized that some
DERs (e.g., those involving lighting efficiency) may have a negative impact on system load factor.
Thus, some analysts have hypothesized that DERs will provide significant system efficiency
benefits, while others have concluded that the opposite will more likely be the case; that is, that
high penetrations of DERs will serve to reduce load factor, thereby putting one REV goal (higher
levels of DER penetration and interconnection) at odds with its system efficiency goal. The
5 | brattle.com
details of our analysis are presented in the remainder of this report. We provide our analysis of
DER impacts on utility load factor on a historical basis in Section II, and on a forward-looking
basis in Section III. We summarize our analysis in Section IV, and then briefly consider alternate
measures of system efficiency in Section IV.
II. Historical Analysis of Load Factor in New York
A. SYSTEM EFFICIENCY, LOAD FACTOR, AND ENERGY-TO-PEAK RATIO
System efficiency refers to utilizing system assets to generate the largest possible value for
customers. System load factor is a useful indicator of system efficiency, as increasing system load
factor often means that total system costs are spread across a larger number of sales units, thus
reducing the cost burden for individual customers.
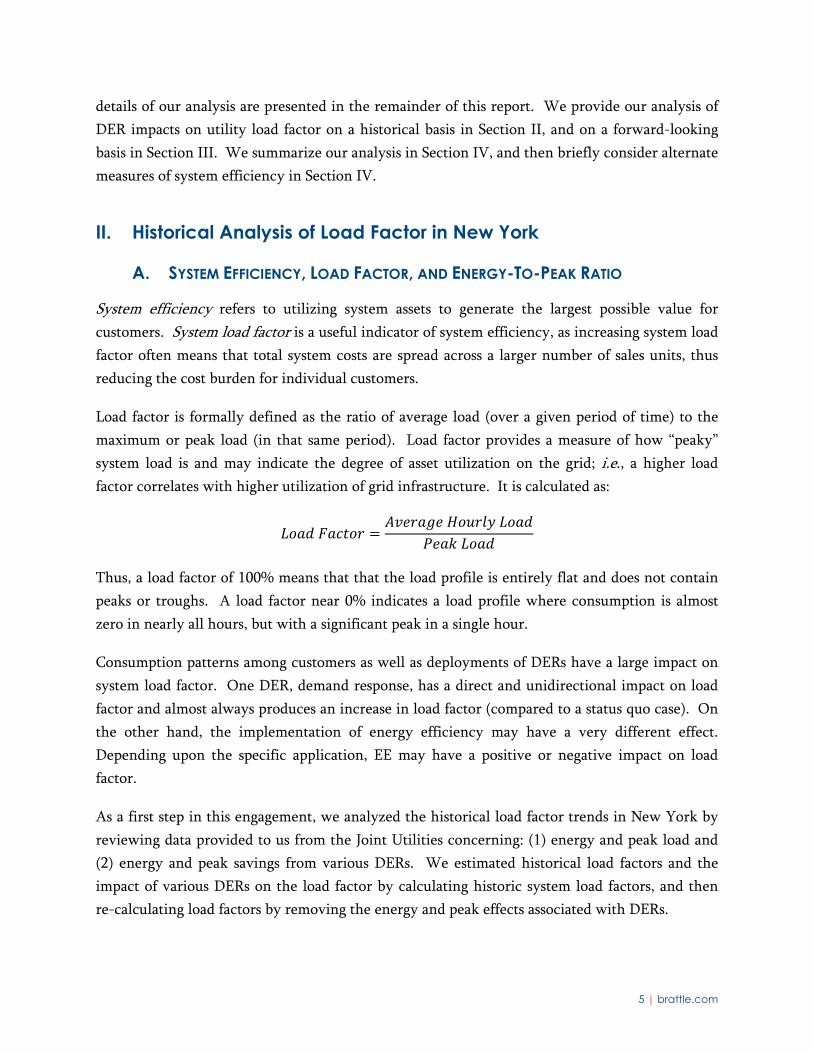
Load factor is formally defined as the ratio of average load (over a given period of time) to the
maximum or peak load (in that same period). Load factor provides a measure of how “peaky”
system load is and may indicate the degree of asset utilization on the grid; i.e., a higher load
factor correlates with higher utilization of grid infrastructure. It is calculated as:
Thus, a load factor of 100% means that that the load profile is entirely flat and does not contain
peaks or troughs. A load factor near 0% indicates a load profile where consumption is almost
zero in nearly all hours, but with a significant peak in a single hour.
Consumption patterns among customers as well as deployments of DERs have a large impact on
system load factor. One DER, demand response, has a direct and unidirectional impact on load
factor and almost always produces an increase in load factor (compared to a status quo case). On
the other hand, the implementation of energy efficiency may have a very different effect.
Depending upon the specific application, EE may have a positive or negative impact on load
factor.
As a first step in this engagement, we analyzed the historical load factor trends in New York by
reviewing data provided to us from the Joint Utilities concerning: (1) energy and peak load and
(2) energy and peak savings from various DERs. We estimated historical load factors and the
impact of various DERs on the load factor by calculating historic system load factors, and then
re-calculating load factors by removing the energy and peak effects associated with DERs.
6 | brattle.com
We used a metric for DERs that measures their energy conservation impact vs. peak impact that
we refer to as the DER’s “Energy-To-Peak-ratio (“EP ratio”). More specifically, the EP ratio is
calculated as:
An EP ratio (for a specific DER) that is equal to 100% means that the DER adds (or reduces) the
same amount of energy in both peak and non-peak hours. Alternatively, an EP ratio that is equal
to 0% indicates that DER adds (or reduces) energy during the peak hours (or shaves the peak) but
does has no effect during non-peak hours. In this case, “shaves” the system peak.
EP ratios have an inverse relationship with a DER’s impact on system load factor. In other
words, if DER has an EP ratio lower than the system load factor, then adding the subject DER
will result in an increase system load factor. That is, a low EP ratio typically is associated with a
DER that is designed to reduce system peak. The end result is a flatter, or less peaky, load profile.
We would expect DR to have a very low EP ratio, as it is entirely focused on peak energy
reduction. On the other hand, we would expect CHP to have a high EP ratio, as it is likely to run
consistently over time. Most likely, the EP ratios for EE and PV would fall somewhere in the
middle, depending on circumstances.
The EP ratio for PV depends on the extent and timing of energy generated from PV. The EP
ratio may be low to moderate if generation from PV peaks at the time of the system peak, or may
be high if the timing of PV generation is completely unaligned with the time of the system peak.
PV generation is frequently designed to maximize overall generation and thereby not aligned
with peak reductions – which would have a negative effect on load factor. However, the specific
impacts of PV on system load factor is dependent upon the specific stock of PV customers
together with their generation profiles, and can only be determined through empirical analysis.
The EP ratio for energy efficiency also depends on the specific programs making up the EE
portfolio. In a summer-peaking state like New York, EE programs that promote efficient air
conditioning units may result in lower EP ratios as compared to EE programs that focus on
efficient refrigerators, which would run constantly, regardless of the weather. As is the case
with PV, the EP ratio for EE is difficult to determine without fact-based empirical analysis.
B. HISTORICAL LOAD FACTOR AND ENERGY INTENSITY RATIOS
Each utility provided data concerning: (1) actual historical energy sales and peak demand and (2)
estimates of the energy and peak demands (coincident with system peak) for the four DERs
7 | brattle.com
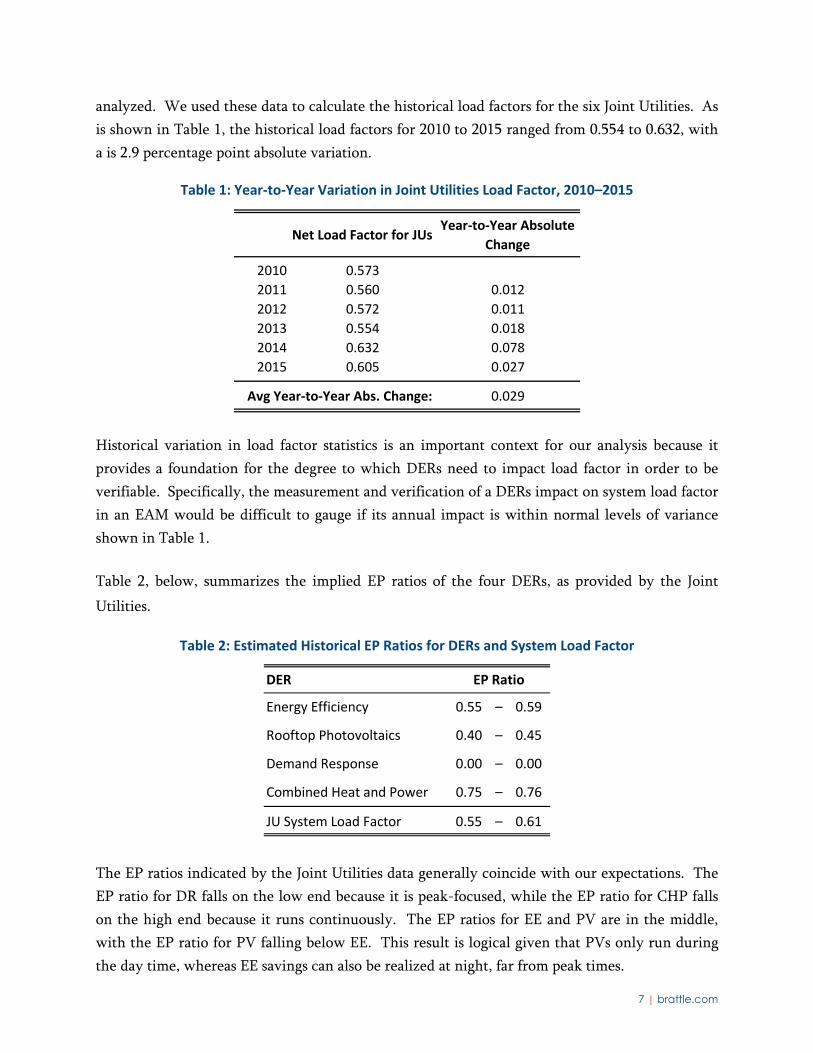
analyzed. We used these data to calculate the historical load factors for the six Joint Utilities. As
is shown in Table 1, the historical load factors for 2010 to 2015 ranged from 0.554 to 0.632, with
a is 2.9 percentage point absolute variation.
Table 1: Year‐to‐Year Variation in Joint Utilities Load Factor, 2010–2015
Historical variation in load factor statistics is an important context for our analysis because it
provides a foundation for the degree to which DERs need to impact load factor in order to be
verifiable. Specifically, the measurement and verification of a DERs impact on system load factor
in an EAM would be difficult to gauge if its annual impact is within normal levels of variance
shown in Table 1.
Table 2, below, summarizes the implied EP ratios of the four DERs, as provided by the Joint
Utilities.
Table 2: Estimated Historical EP Ratios for DERs and System Load Factor
The EP ratios indicated by the Joint Utilities data generally coincide with our expectations. The
EP ratio for DR falls on the low end because it is peak-focused, while the EP ratio for CHP falls
on the high end because it runs continuously. The EP ratios for EE and PV are in the middle,
with the EP ratio for PV falling below EE. This result is logical given that PVs only run during
the day time, whereas EE savings can also be realized at night, far from peak times.
Net Load Factor for JUsYear‐to‐Year Absolute
Change
2010 0.573
2011 0.560 0.012
2012 0.572 0.011
2013 0.554 0.018
2014 0.632 0.078
2015 0.605 0.027
Avg Year‐to‐Year Abs. Change: 0.029
DER EP Ratio
Energy Efficiency 0.55 – 0.59
Rooftop Photovoltaics 0.40 – 0.45
Demand Response 0.00 – 0.00
Combined Heat and Power 0.75 – 0.76
JU System Load Factor 0.55 – 0.61
8 | brattle.com
Actual historical energy sales and peak demand data inherently include the effects of DERs,
because the Joint Utilities reported their actually observed energy and peak load (and did not
back out the “but-for” load that would have been the case if DERs not been implemented). We
refer to the energy and peak load reported by the Joint Utilities as “net load”, as these loads are
net of the impact of the DERs.
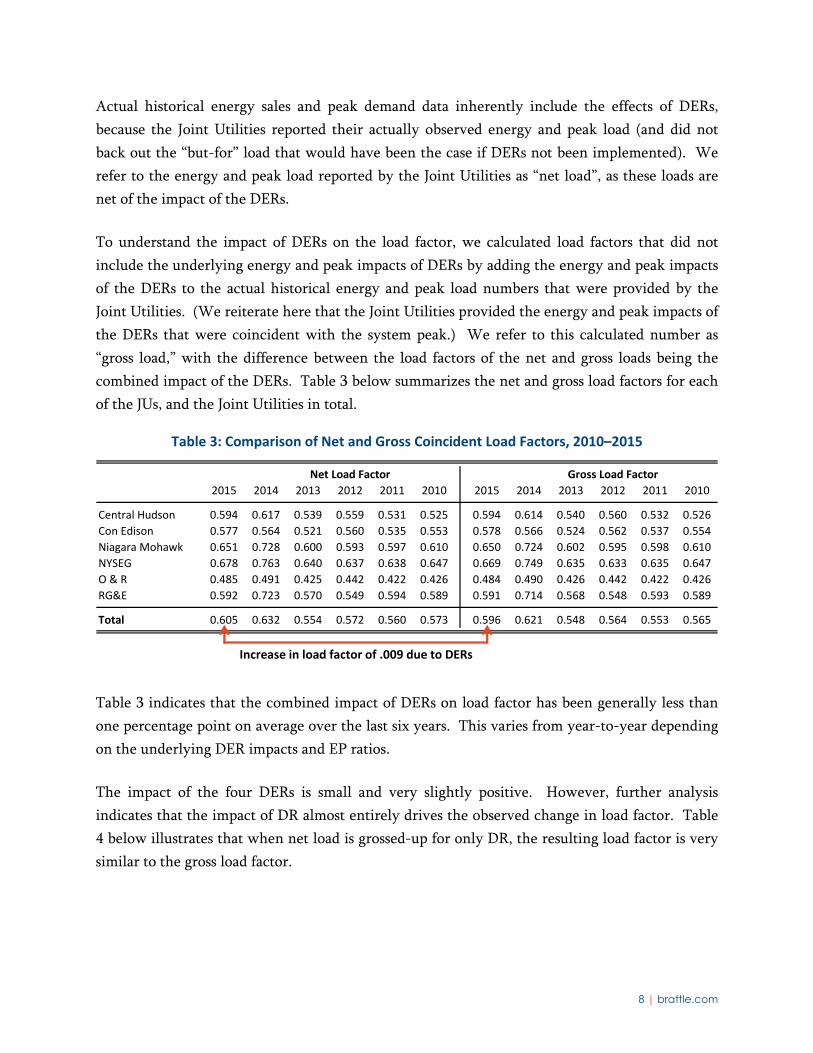
To understand the impact of DERs on the load factor, we calculated load factors that did not
include the underlying energy and peak impacts of DERs by adding the energy and peak impacts
of the DERs to the actual historical energy and peak load numbers that were provided by the
Joint Utilities. (We reiterate here that the Joint Utilities provided the energy and peak impacts of
the DERs that were coincident with the system peak.) We refer to this calculated number as
“gross load,” with the difference between the load factors of the net and gross loads being the
combined impact of the DERs. Table 3 below summarizes the net and gross load factors for each
of the JUs, and the Joint Utilities in total.
Table 3: Comparison of Net and Gross Coincident Load Factors, 2010–2015
Table 3 indicates that the combined impact of DERs on load factor has been generally less than
one percentage point on average over the last six years. This varies from year-to-year depending
on the underlying DER impacts and EP ratios.
The impact of the four DERs is small and very slightly positive. However, further analysis
indicates that the impact of DR almost entirely drives the observed change in load factor. Table
4 below illustrates that when net load is grossed-up for only DR, the resulting load factor is very
similar to the gross load factor.
Net Load Factor Gross Load Factor
2015 2014 2013 2012 2011 2010 2015 2014 2013 2012 2011 2010
Central Hudson 0.594 0.617 0.539 0.559 0.531 0.525 0.594 0.614 0.540 0.560 0.532 0.526
Con Edison 0.577 0.564 0.521 0.560 0.535 0.553 0.578 0.566 0.524 0.562 0.537 0.554
Niagara Mohawk 0.651 0.728 0.600 0.593 0.597 0.610 0.650 0.724 0.602 0.595 0.598 0.610
NYSEG 0.678 0.763 0.640 0.637 0.638 0.647 0.669 0.749 0.635 0.633 0.635 0.647
O & R 0.485 0.491 0.425 0.442 0.422 0.426 0.484 0.490 0.426 0.442 0.422 0.426
RG&E 0.592 0.723 0.570 0.549 0.594 0.589 0.591 0.714 0.568 0.548 0.593 0.589
Total 0.605 0.632 0.554 0.572 0.560 0.573 0.596 0.621 0.548 0.564 0.553 0.565
Increase in load factor of .009 due to DERs
9 | brattle.com
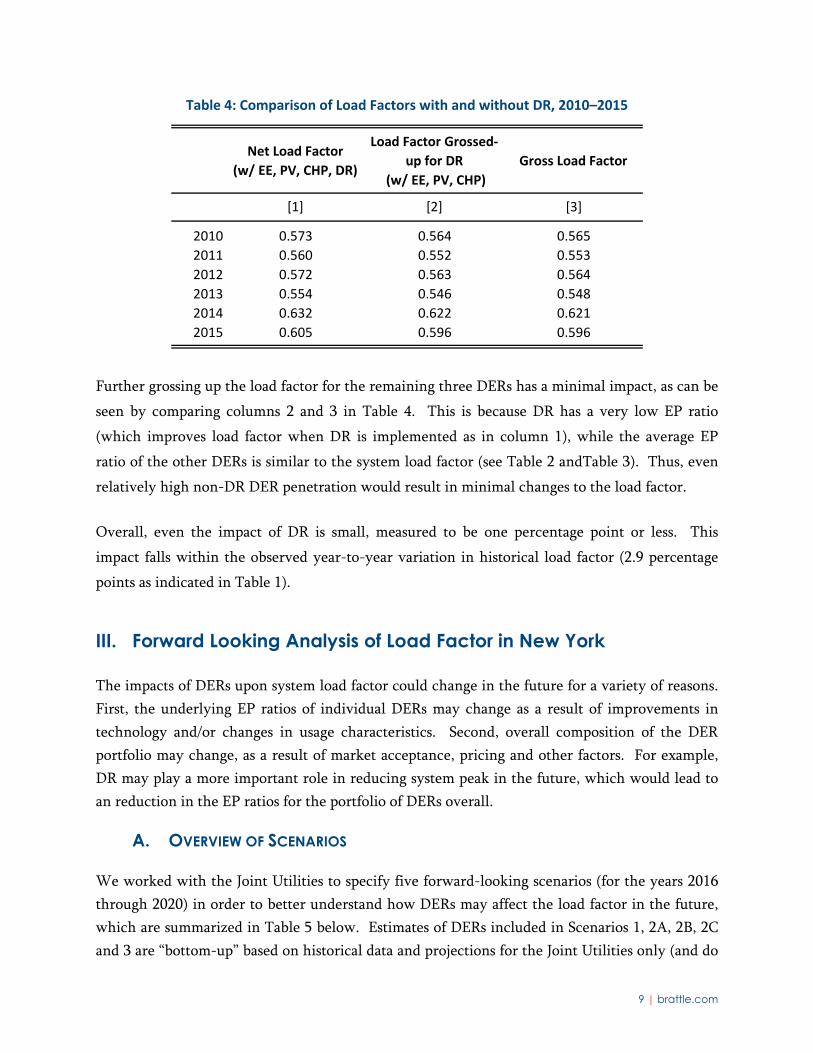
Table 4: Comparison of Load Factors with and without DR, 2010–2015
Further grossing up the load factor for the remaining three DERs has a minimal impact, as can be
seen by comparing columns 2 and 3 in Table 4. This is because DR has a very low EP ratio
(which improves load factor when DR is implemented as in column 1), while the average EP
ratio of the other DERs is similar to the system load factor (see Table 2 andTable 3). Thus, even
relatively high non-DR DER penetration would result in minimal changes to the load factor.
Overall, even the impact of DR is small, measured to be one percentage point or less. This
impact falls within the observed year-to-year variation in historical load factor (2.9 percentage
points as indicated in Table 1).
III. Forward Looking Analysis of Load Factor in New York
The impacts of DERs upon system load factor could change in the future for a variety of reasons.
First, the underlying EP ratios of individual DERs may change as a result of improvements in
technology and/or changes in usage characteristics. Second, overall composition of the DER
portfolio may change, as a result of market acceptance, pricing and other factors. For example,
DR may play a more important role in reducing system peak in the future, which would lead to
an reduction in the EP ratios for the portfolio of DERs overall.
A. OVERVIEW OF SCENARIOS
We worked with the Joint Utilities to specify five forward-looking scenarios (for the years 2016
through 2020) in order to better understand how DERs may affect the load factor in the future,
which are summarized in Table 5 below. Estimates of DERs included in Scenarios 1, 2A, 2B, 2C
and 3 are “bottom-up” based on historical data and projections for the Joint Utilities only (and do
Net Load Factor
(w/ EE, PV, CHP, DR)
Load Factor Grossed‐
up for DR
(w/ EE, PV, CHP)
Gross Load Factor
[1] [2] [3]
2010 0.573 0.564 0.565
2011 0.560 0.552 0.553
2012 0.572 0.563 0.564
2013 0.554 0.546 0.548
2014 0.632 0.622 0.621
2015 0.605 0.596 0.596
10 | brattle.com
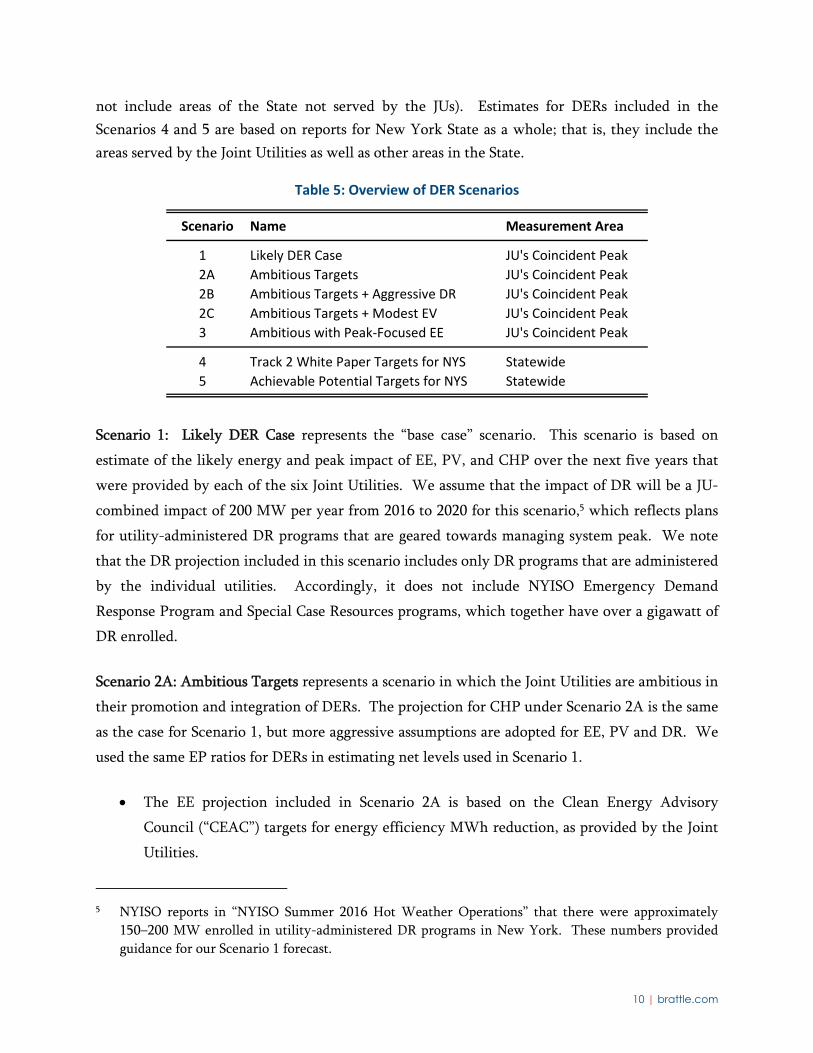
not include areas of the State not served by the JUs). Estimates for DERs included in the
Scenarios 4 and 5 are based on reports for New York State as a whole; that is, they include the
areas served by the Joint Utilities as well as other areas in the State.
Table 5: Overview of DER Scenarios
Scenario 1: Likely DER Case represents the “base case” scenario. This scenario is based on
estimate of the likely energy and peak impact of EE, PV, and CHP over the next five years that
were provided by each of the six Joint Utilities. We assume that the impact of DR will be a JU-
combined impact of 200 MW per year from 2016 to 2020 for this scenario,5 which reflects plans
for utility-administered DR programs that are geared towards managing system peak. We note
that the DR projection included in this scenario includes only DR programs that are administered
by the individual utilities. Accordingly, it does not include NYISO Emergency Demand
Response Program and Special Case Resources programs, which together have over a gigawatt of
DR enrolled.
Scenario 2A: Ambitious Targets represents a scenario in which the Joint Utilities are ambitious in
their promotion and integration of DERs. The projection for CHP under Scenario 2A is the same
as the case for Scenario 1, but more aggressive assumptions are adopted for EE, PV and DR. We
used the same EP ratios for DERs in estimating net levels used in Scenario 1.
The EE projection included in Scenario 2A is based on the Clean Energy Advisory
Council (“CEAC”) targets for energy efficiency MWh reduction, as provided by the Joint
Utilities.
5 NYISO reports in “NYISO Summer 2016 Hot Weather Operations” that there were approximately
150–200 MW enrolled in utility-administered DR programs in New York. These numbers provided
guidance for our Scenario 1 forecast.
Scenario Name Measurement Area
1 Likely DER Case JU's Coincident Peak
2A Ambitious Targets JU's Coincident Peak
2B Ambitious Targets + Aggressive DR JU's Coincident Peak
2C Ambitious Targets + Modest EV JU's Coincident Peak
3 Ambitious with Peak‐Focused EE JU's Coincident Peak
4 Track 2 White Paper Targets for NYS Statewide
5 Achievable Potential Targets for NYS Statewide
11 | brattle.com
The PV forecast uses the “interconnection queue” for PVs provided by the Joint Utilities.
We assume that all requests are interconnected, and used the estimated interconnection
dates to determine the PV levels for 2016 through 2020.
DR is modestly more aggressive than in Scenario 1, starting at 200 MW in 2016 and
growing 50 MW per year to 400 MW by 2020.
Scenario 2B: Ambitious Targets + Aggressive DR builds upon the specification included in
Scenario 2B by assuming that the utilities implement partial time-based pricing which will lead
to greater DR MWs, growing from 200 MW in 2016 to 250 MW in 2017 and then to 800 MW
thereafter. Otherwise, the assumptions concerning EE, PV and CHP are the same as used in
Scenario 2A.
Scenario 2C: Ambitious Targets + Modest EV is also based on the assumptions included in
Scenario 2A but, for this case, considers the impact of a leading candidate for beneficial
electrification, electric vehicles (EVs). For this scenario, we assume that EV charging takes place
entirely off-peak. That is, we assumed the most beneficial charging pattern from a system
efficiency perspective, as the EVs increase energy load but do not increase peak demand. Such a
charging pattern would result in an improvement in system load factor.
Several assumptions were considered in the calculation of the energy load impact of EVs in
Scenario 2C. First, we assumed that 33,000 new battery electric vehicles will be on the road in
New York by 2020. Second, we estimated the energy load of EVs by taking the average miles per
year driven in New York and converting those miles to kWh using an average of published
conversion rates for a sample of different battery electric vehicle models.
Scenario 3: Ambitious Targets with Peak-Focused EE differs from the assumptions included in
Scenario 2A in that it incorporates a peak-focused element of EE, specified through an EP ratio
that is 10% lower than that used for Scenarios 2A, 2B and 2C. Otherwise, the assumptions
concerning PV, CHP and DR are the same as used in Scenario 2A.
Scenario 4: Track 2 White Paper Targets for NYS is a peak reduction oriented scenario based on
NYISO-system wide peak reduction target of 4,846 MW by 2020 set by Commission Staff in its
12 | brattle.com
Staff Whitepaper on Ratemaking and Utility Business Models.6 We specified peak reduction of
2,125 MW (in 2020) in Scenario 1 (the base case), which means that an additional 2,121 MW of
peak reduction would need to be realized in this scenario. This target would mainly be met
through additional DR as well as some peak-shaving EE. We note that the base case includes: (1)
a level of PV growth that meets the NY-SUN target; and (2) the (limited) potential for CHP in
New York. Thus, the available means to meet the Staff’s peak reduction target would be through
DR and EE. In our view, achieving the DR reduction targets included in this scenario would
most likely require the implementation of time-based pricing.
Scenario 5: Achievable Potential Targets for NYS is also a NYISO system wide scenario, but this
time focused on DER penetration levels that are significantly higher than the levels projected by
the Joint Utilities (and used in Scenarios 1, 2A, 2B and 2C). The DER penetrations included in
this scenario are based on the “achievable targets” set by NYSERDA in its Energy Efficiency and
Renewable Energy Potential Study of New York State report.7 This includes: (1) energy
reductions targets for EE and CHP; and (2) energy and peak reductions for PV. We calculated
the peak reduction for EE and CHP by using EP ratios in Scenario 1. We also included the DR at
the same level as was included in Scenario 4 for this scenario (as the NYSERDA report did not
address DR). As we noted on our discussion concerning Scenario 4, in our view, achieving the
DR reduction targets included in this scenario would most likely require the implementation of
time-based pricing.
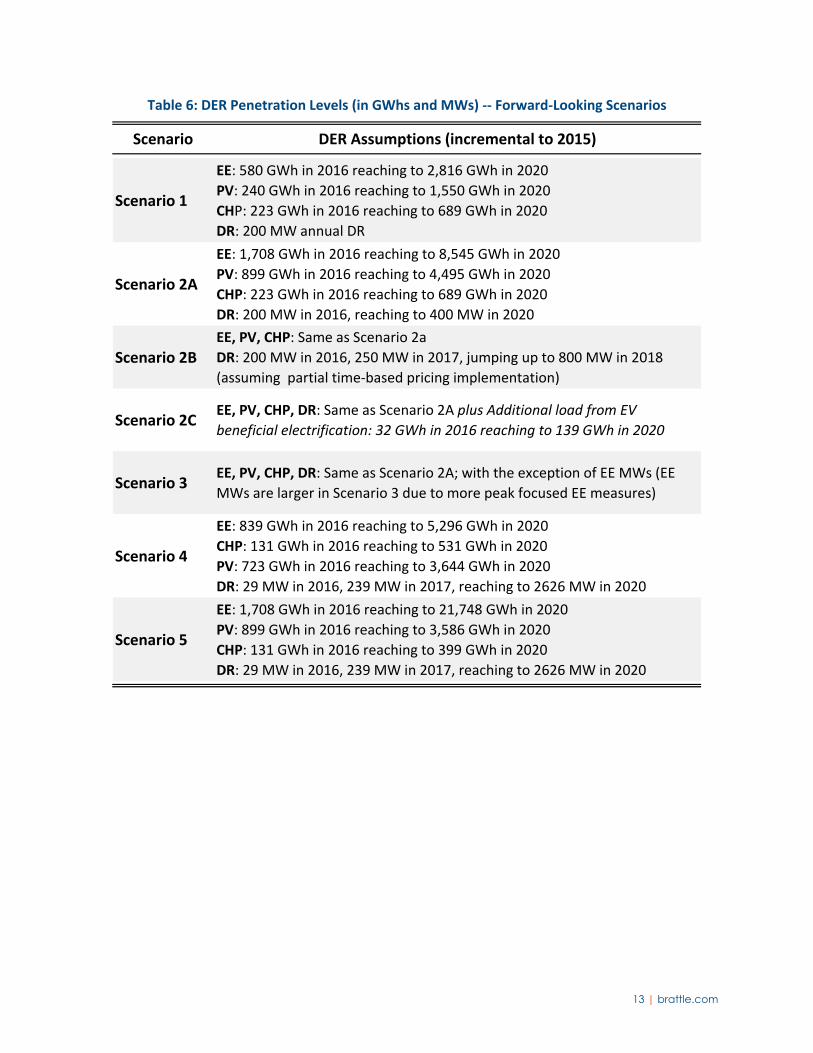
The specific levels of energy reduction and peak reduction (from the “gross” projections) for each
DER for each of the above described scenarios are included in Table 6, below.
6 July 2015.
7 For additional details, refer to https://www.nyserda.ny.gov/About/Publications/EA-Reports-and-
Studies/EERE-Potential-Studies
13 | brattle.com
Table 6: DER Penetration Levels (in GWhs and MWs) ‐‐ Forward‐Looking Scenarios
Scenario DER Assumptions (incremental to 2015)
Scenario 1
EE: 580 GWh in 2016 reaching to 2,816 GWh in 2020
PV: 240 GWh in 2016 reaching to 1,550 GWh in 2020
CHP: 223 GWh in 2016 reaching to 689 GWh in 2020
DR: 200 MW annual DR
Scenario 2A
EE: 1,708 GWh in 2016 reaching to 8,545 GWh in 2020
PV: 899 GWh in 2016 reaching to 4,495 GWh in 2020
CHP: 223 GWh in 2016 reaching to 689 GWh in 2020
DR: 200 MW in 2016, reaching to 400 MW in 2020
Scenario 2BEE, PV, CHP: Same as Scenario 2a
DR: 200 MW in 2016, 250 MW in 2017, jumping up to 800 MW in 2018
(assuming partial time‐based pricing implementation)
Scenario 2CEE, PV, CHP, DR: Same as Scenario 2A plus Additional load from EV
beneficial electrification: 32 GWh in 2016 reaching to 139 GWh in 2020
Scenario 3EE, PV, CHP, DR: Same as Scenario 2A; with the exception of EE MWs (EE
MWs are larger in Scenario 3 due to more peak focused EE measures)
Scenario 4
EE: 839 GWh in 2016 reaching to 5,296 GWh in 2020
CHP: 131 GWh in 2016 reaching to 531 GWh in 2020
PV: 723 GWh in 2016 reaching to 3,644 GWh in 2020
DR: 29 MW in 2016, 239 MW in 2017, reaching to 2626 MW in 2020
Scenario 5
EE: 1,708 GWh in 2016 reaching to 21,748 GWh in 2020
PV: 899 GWh in 2016 reaching to 3,586 GWh in 2020
CHP: 131 GWh in 2016 reaching to 399 GWh in 2020
DR: 29 MW in 2016, 239 MW in 2017, reaching to 2626 MW in 2020
14 | brattle.com
B. FORWARD-LOOKING DER IMPACT ON LOAD FACTOR
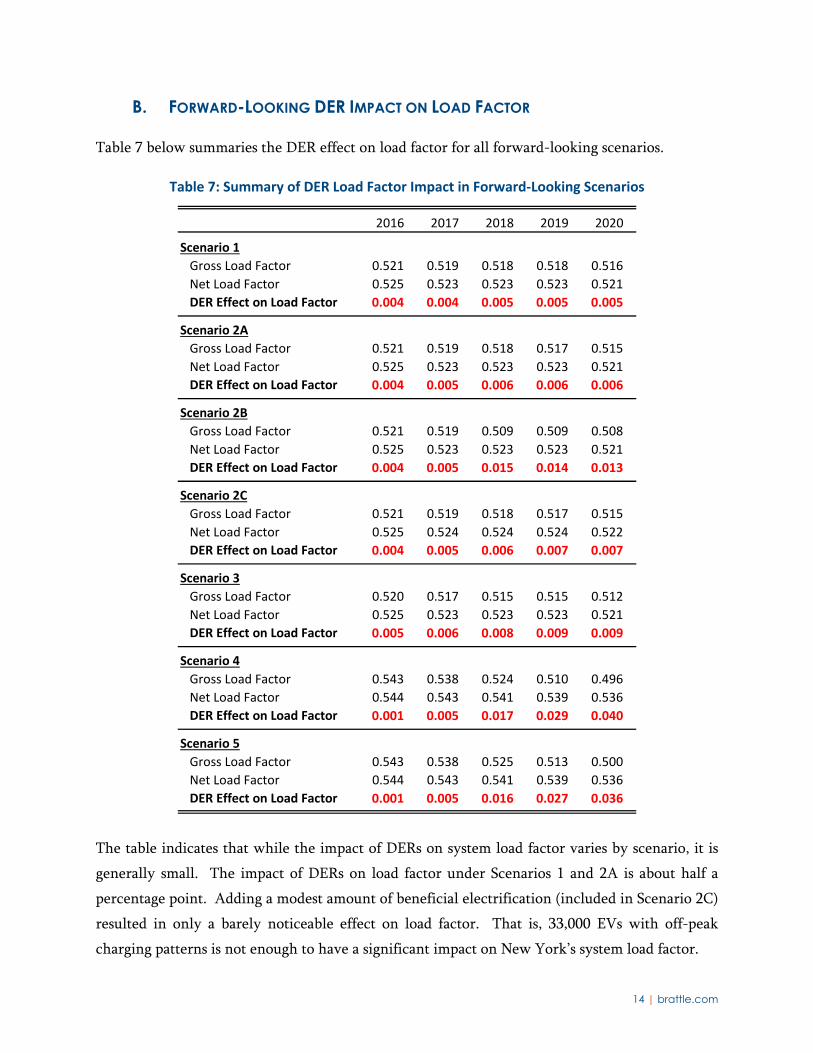
Table 7 below summaries the DER effect on load factor for all forward-looking scenarios.
Table 7: Summary of DER Load Factor Impact in Forward‐Looking Scenarios
The table indicates that while the impact of DERs on system load factor varies by scenario, it is
generally small. The impact of DERs on load factor under Scenarios 1 and 2A is about half a
percentage point. Adding a modest amount of beneficial electrification (included in Scenario 2C)
resulted in only a barely noticeable effect on load factor. That is, 33,000 EVs with off-peak
charging patterns is not enough to have a significant impact on New York’s system load factor.
2016 2017 2018 2019 2020
Scenario 1
Gross Load Factor 0.521 0.519 0.518 0.518 0.516
Net Load Factor 0.525 0.523 0.523 0.523 0.521
DER Effect on Load Factor 0.004 0.004 0.005 0.005 0.005
Scenario 2A
Gross Load Factor 0.521 0.519 0.518 0.517 0.515
Net Load Factor 0.525 0.523 0.523 0.523 0.521
DER Effect on Load Factor 0.004 0.005 0.006 0.006 0.006
Scenario 2B
Gross Load Factor 0.521 0.519 0.509 0.509 0.508
Net Load Factor 0.525 0.523 0.523 0.523 0.521
DER Effect on Load Factor 0.004 0.005 0.015 0.014 0.013
Scenario 2C
Gross Load Factor 0.521 0.519 0.518 0.517 0.515
Net Load Factor 0.525 0.524 0.524 0.524 0.522
DER Effect on Load Factor 0.004 0.005 0.006 0.007 0.007
Scenario 3
Gross Load Factor 0.520 0.517 0.515 0.515 0.512
Net Load Factor 0.525 0.523 0.523 0.523 0.521
DER Effect on Load Factor 0.005 0.006 0.008 0.009 0.009
Scenario 4
Gross Load Factor 0.543 0.538 0.524 0.510 0.496
Net Load Factor 0.544 0.543 0.541 0.539 0.536
DER Effect on Load Factor 0.001 0.005 0.017 0.029 0.040
Scenario 5
Gross Load Factor 0.543 0.538 0.525 0.513 0.500
Net Load Factor 0.544 0.543 0.541 0.539 0.536
DER Effect on Load Factor 0.001 0.005 0.016 0.027 0.036
15 | brattle.com
The scenarios which include aggressive levels of DR show the highest levels of DER induced
impacts on system load factor, a finding that is consistent with the historical analysis. This can
be readily seen by comparing Scenarios 2A and 2B, the only difference between these being that
Scenario 2B has more ambitious levels of DR – which also led to Scenario 2B registering the
largest DER-induced impact on system load factor compared to Scenarios 1, 2A, 2B, 2C, and 3.
The largest impacts of DERs on system load factor, and the only cases for which the impact
exceeds the observed historical variation of 2.9%, is found in Scenarios 4 and 5. As noted earlier,
both scenarios were designed to reflect extremely aggressive EE and DR penetration and would
be unrealistic to achieve by 2020.
The reasons that DERs have only a minimal impact on system load factors in the forward looking
scenarios is consistent with the factors that explained the historical analysis:
The EP ratios for PV and EE are sufficiently close to the system load factor that even high
EE and PV penetrations have minimal.
CHP has a higher EP ratio than the overall system load factor, but does not generate
enough electricity to affect a significant change in the load factor.
DR has a more direct impact on load factor, but nonetheless still has a minimal impact in
the most realistic scenarios due to its limited penetration.
IV. Analysis Summary and Conclusion
The above analysis provides unambiguous results demonstrating that the impact of DERs upon
system load factor is the result of two primary factors: (1) the EP ratio of the DERs considered;
and (2) the degree of DER usage. Specifically:
Higher deployments of DERs have a minimal impact on the state-wide system load factor
because the load profiles of most DERs, as measured by the EP ratio, are very similar to
the utilities’ contribution to the state-wide system load factors.
Even if EP ratios were lower than the utility load factor, system load factors would not be
affected by DER deployment in the short-run because DER penetration as a percentage of
overall system load is relatively low.
DER impacts on system load factors are demonstrated only in our most aggressive
forward looking scenarios, which were intentionally designed to express unrealistically
high levels of DER penetration.
16 | brattle.com
Electrification of vehicles is typically advanced as a leading application of beneficial
electrification, but our analysis indicates that it will have a very small impact on system
load factor under every scenario considered.
Statistically, the historical impact of DERs on load factor that we measured in our analysis
is not materially different from the year-to-year variation historically observed in system
load factor.
With the above analysis in mind, we conclude that utilities have very limited options available
through which they can effectively increase system load factor. Therefore, a system load factor
metric for an EAM cannot provide a meaningful incentive for utilities to improve system
efficiency.
V. Alternative Measures of System Efficiency
In its REV Ratemaking Order, the Commission highlighted the tensions associated with aligning
the various REV goals and the likelihood that some goals may conflict with each other. The
Commission highlighted that this may be particularly true for goals concerning system efficiency
and load factor, noting that “[M]any desirable efficiency measures, such as LED street lighting
and efficient CHP, may have the effect of reducing load factor, so a sole focus on load factor may
produce unintended and undesirable consequences.”8 Also of concern is the impact on system
efficiency of energy efficiency realized through lighting retrofitting, generally regarded as a
particularly cost-effective DER. The Commission thus included both peak reduction and load
factor elements of its overall system efficiency EAM, which would “accompany EE targets…and
be implemented in a manner that achieves an optimal balance among the policy goals.”9
In its simplest sense, load factor improvement can come from either increasing sales of energy
(i.e., the ratio’s numerator) and/or reducing system peak (i.e., the ratio’s denominator). Thus, the
only way for utilities to meet any EAM targets (concerning peak reduction and load factor) is to
either reduce peaks and/or increase energy sales.
The analysis presented above indicates that a system load EAM may not provide an incentive for
the State’s utilities to move the state closer to realizing its system efficiency goals. Brattle and the
8 NYPSC REV Ratemaking Order, p. 73.
9 NYPSC REV Ratemaking Order, p. 74.

17 | brattle.com
Joint Utilities then engaged in a high-level brainstorming effort to identify EAMs that may more
appropriately meet the Commission’s intent.
In general, these alternatives fall into three categories: (1) load factor derivatives; (2) beneficial
electrification measures; and (3) system peak reduction measures. Brief descriptions of these
alternatives measures are provided below. However, it is important to reiterate that these
represent summaries of the Brattle-Joint Utilities brainstorming session and are not a final
proposal. They will need to be studied more closely before considering whether they could
appropriately be part of a system efficiency EAM.
1. Load Factor Derivatives
These alternative measures are variations on load factor measures. Three measures (a, c, and d
below) are variations on a system load factor measure, while (b) is a local load factor measure.
a. Customer Class Load Factor: This metric could target poor load factor customers and
incentivize to improve their load factors.
b. Local Load Factor: This metric could be based on load factors in local footprints, such
as circuit or banks, for the system.
c. Load Factor calculated by excluding (1) energy efficiency and (2) energy savings from
CHP: This metric would capture load factor impacts after excluding the impact of
DERs that would reduce load factor.
d. Load Factor measured at the top X NYCA-coincident hours: This metric would be
aimed at improving system load factor during top X system peak hours.
2. Beneficial Electrification Measures
These measures track the utility’s progress in increasing average sales, but reward only those sales
that are resulting from beneficial electrification; i.e., when electrification is powered by cleaner
(lower carbon) sources than is currently the case. Primary examples of beneficial electrification
include the use of electricity for space and water heating and the electrification of transportation,
notably electric vehicles (EVs). The electrification of transportation is frequently viewed as a
strong positive contribution to improved system efficiency. However, the electrification of
transportation may be considered to be beneficial from a load factor perspective only when
assurances are put in place (via automated charging and/or pricing incentives) to ensure that such
initiatives do not inadvertently increase the system peak.

18 | brattle.com
a. Increased penetration (%) of load smoothing technologies: This metric would track
the increased penetration of technologies and programs that increase the off-peak
load through load shifting from peak periods, or load building only during the off-
peak period.
b. Increased off-peak usage as % of total delivered energy: this metric is similar to the
previous one except that it directly tracks off-peak load building instead of tracking
the penetration of DERs leading to off-peak building.
3. System Peak Reduction Measures
MW reduction in system peak: One of the most straightforward measures to track improvements
in system efficiency, which would directly track the reductions in system peak. It should be
considered as a complementary metric to load factor rather than an alternative.