Embed Size (px)
Citation preview
Assessment of Lumbar Intervertebral DiscGlycosaminoglycan Content by Gadolinium-EnhancedMRI before and after 21-Days of Head-Down-Tilt BedrestTimmo Koy1, Jochen Zange2, Jorn Rittweger2, Regina Pohle-Frohlich3, Matthias Hackenbroch4,
Peer Eysel1,5, Bergita Ganse2,6*
1 University of Cologne, Department of Orthopaedic and Trauma Surgery, Cologne, Germany, 2 German Aerospace Center (DLR), Institute of Aerospace Medicine,
Department Space Physiology, Cologne, Germany, 3 Hochschule Niederrhein, Institute for Pattern Recognition, Krefeld, Germany, 4 University of Cologne, Department of
Radiology, Cologne, Germany, 5 Cologne Center for Musculoskeletal Biomechanics (CCMB), Medical Faculty, University of Cologne, Cologne, Germany, 6 Department of
Orthopaedic Trauma, RWTH Aachen University, Aachen, Germany
Abstract
During spaceflight, it has been shown that intervertebral discs (IVDs) increase in height, causing elongation of the spine upto several centimeters. Astronauts frequently report dull lower back pain that is most likely of discogenic origin and mayresult from IVD expansion. It is unknown whether disc volume solely increases by water influx, or if the content ofglycosaminoglycans also changes in microgravity. Aim of this pilot study was to investigate effects of the spaceflight analogof bedrest on the glycosaminoglycan content of human lumbar IVDs. Five healthy, non-smoking, male human subjects ofEuropean descent were immobilized in 6u head-down-tilt bedrest for 21 days. Subjects remained in bed 24 h a day with atleast one shoulder on the mattress. Magnetic Resonance Imaging (MRI) scans were taken according to the delayedgadolinium-enhanced magnetic resonance imaging (dGEMRIC) protocol before and after bedrest. The outcome measureswere T1 and DT1. Scans were performed before and after administration of the contrast agent Gd-DOTA, and differencesbetween T1-values of both scans (DT1) were computed. DT1 is the longitudinal relaxation time in the tissue and inverselyrelated to the glycosaminoglycan-content. For data analysis, IVDs L1/2 to L4/5 were semi-automatically segmented. Zoneswere defined and analyzed separately. Results show a highly significant decrease in DT1 (p,0.001) after bedrest in all IVDs,and in all areas of the IVDs. The DT1-decrease was most prominent in the nucleus pulposus and in L4/5, and was expressedslightly more in the posterior than anterior IVD. Unexpected negative DT1-values were found in Pfirrmann-grade 2-discsafter bedrest. Significantly lower T1 before contrast agent application was found after bedrest compared to before bedrest.According to the dGEMRIC-literature, the decrease in DT1 may be interpreted as an increase in glycosaminoglycans inhealthy IVDs during bedrest. This interpretation seems contradictory to previous findings in IVD unloading.
Citation: Koy T, Zange J, Rittweger J, Pohle-Frohlich R, Hackenbroch M, et al. (2014) Assessment of Lumbar Intervertebral Disc Glycosaminoglycan Content byGadolinium-Enhanced MRI before and after 21-Days of Head-Down-Tilt Bedrest. PLoS ONE 9(11): e112104. doi:10.1371/journal.pone.0112104
Editor: Nandu Goswami, Medical University of Graz, Austria
Received May 23, 2014; Accepted October 12, 2014; Published November 7, 2014
Copyright: � 2014 Koy et al. This is an open-access article distributed under the terms of the Creative Commons Attribution License, which permits unrestricteduse, distribution, and reproduction in any medium, provided the original author and source are credited.
Data Availability: The authors confirm that all data underlying the findings are fully available without restriction. All relevant data are within the paper.
Funding: The NUC-study took place in the Institute of Aerospace Medicine of the German Aerospace Center, Cologne, Germany, and was funded by theEuropean Space Agency (www.esa.int) as part of the ‘‘Microgravity Applications Program’’ (contract number: 21381/07/NL/VJ) and by institutional funding of theGerman Aerospace Center (DLR Space Program) (www.dlr.de). The funders had influence on the study design, but had no role in data collection, analysis, decisionto publish, or preparation of the manuscript.
Competing Interests: The authors have declared that no competing interests exist.
* Email: [email protected]
Introduction
Chronic lower back pain (CLBP) is a widespread disease in the
population and also occurs in astronauts and cosmonauts [1,2]. In
many symptomatic cases, no structural cause is found in
conventional MRI, and up to 85% of patients with CLBP do
not have any visible anatomical anomalies [3]. Causes for back
pain seem to be multifactorial [3], and degeneration of interver-
tebral discs (IVDs) is one known cause for discogenic pain [4,5].
During spaceflight, IVDs gain height and cause elongation of the
spine up to several centimeters [2,6]. Astronauts frequently report
moderate to severe, dull lower back pain that is most likely of
discogenic origin and may result from IVD expansion [1,6]. It is
unknown whether the increase in disc volume is caused solely by
water influx, or if the amount of glycosaminoglycans (GAGs)
changes in microgravity [7,8]. Furthermore, astronauts may have
an increased risk for herniated nucleus pulposus, particularly in the
immediate post-flight period [9]. Possible changes in IVD
morphology are discussed as causing factors in the literature,
however it is unknown what exactly happens within the IVD. The
same type of back pain experienced in spaceflight was reported in
bedrest studies with 6u head down tilt [10]. Bedrest studies have
proven to be a good analog for changes in intervertebral disc
morphology [7,11]. Findings from space flight and bedrest might
help to better understand the pathophysiology and treatment
options for patients suffering from chronic lower back pain.
In its early stages, IVD degeneration involves a decrease in
GAG content [12,13]. While GAGs are known to decrease in IVD
degeneration, an increase over a period of time in turn indicates
recovery [14]. Standard MRI-imaging techniques are unable to
PLOS ONE | www.plosone.org 1 November 2014 | Volume 9 | Issue 11 | e112104
detect early stages of IVD-degeneration [15], and so far
microstructural changes and degeneration of lumbar intervertebral
discs have not been assessed following space flight or bedrest.
A magnetic resonance imaging (MRI) method has been
established that can quantify the loss of GAGs and detect
degeneration (a decrease in GAG concentration) and recovery
(an increase in GAG concentration). Called ‘‘delayed Gadolinium
Enhanced MRI of Cartilage’’ (dGEMRIC), it was first applied to
joint cartilage [16–19] and has recently been successfully utilized
for the assessment of IVD degeneration [13,20–22]. Standard
MRI hardware is used for dGEMRIC imaging and measurements
are performed before and after administration of a contrast agent
that degrades and distributes in IVD tissue reciprocal to the
amount of GAGs [12]. The longitudinal relaxation time (T1) in the
tissue is shortened by the contrast agent. The effect intensity
depends on the amount of contrast agent within the tissue. Thus
changes in GAG-content of the IVD can indirectly be assessed
through an analysis of T1-times in the MRI.
The aim of the present pilot study was to assess the GAG
content of lumbar intervertebral discs before and after bedrest
using the dGEMRIC protocol to investigate if the increase in IVD
thickness during bed rest might be related to changes in GAG
content. The hypothesis was that bedrest does not affect the
amount of GAGs in the IVD. This hypothesis would be supported
by the finding that the swelling of discs is accompanied by a
decrease in GAG concentration. The alternative hypothesis was
that the GAG concentration of intervertebral discs remains
constant or increases during bedrest. Overall, the aim of the pilot
study was achieved.
Materials and Methods
Ethics StatementThe study was approved by the ethics committee of North
Rhine Medical Association (Arztekammer Nordrhein, application
number 2007405), and was designed and performed in compliance
with the Declaration of Helsinki. Written informed consent was
obtained from all subjects.
Study settingThe experiment presented here was part of a large clinical trial
(the NUC-Study), performed during one of the two campaigns,
and it is by itself therefore not a clinical trial as defined in the
CONSORT or TREND guidelines. The NUC-study was
registered with the Clinical Trials Registry http://www.
clinicaltrials.gov (Number: NCT01509456). It was also registered
in the ESA Erasmus Experiment Archive http://eea.spaceflight.
esa.int/portal/ (Experiment record no. 9389). The NUC-study
took place in the Institute of Aerospace Medicine of the German
Aerospace Center, Cologne, Germany.
Study designIn the NUC-study, seven healthy, non-smoking, male human
subjects were immobilized in 6u head-down-tilt bedrest for 21 days
(HDT-1 to HDT-21) in a cross-over design. Five of these subjects
were included in the presented investigation of IVDs. The entire
bedrest-study included two campaigns for each subject, with a
wash-out period of 154 days in between. The aim was to
investigate a nutritional countermeasure for bone loss (oral
application of potassium bicarbonate 30 mmol/tablet three times
a day) in a cross-over design [7,23,24]. The dGEMRIC
measurements presented here were conducted before and after
the second campaign of the NUC-study beginning August 16th
and ending October 15th, 2010 (study schedule: Figure 1). For our
experiment, it was anticipated that the nutritional countermeasure
of the NUC-study would not have major effects on the formation
of GAGs in the IVDs. Due to the small number of subjects, smaller
potential effects could not have been found. During baseline and
recovery data collection, subjects could move free inside the lab
(baseline: 7 days, BDC-7 to BDC-1; recovery: 6 days, R+0 to R+5). Reambulation from bedrest took place in the morning of R+0.
Throughout bedrest, subjects remained in bed 24 h/day with at
least one shoulder on the mattress at any time. All hygienic
procedures, food intake and experiments took place in this position
without exception. Compliance with the protocol was ensured by
video surveillance and by staff. Subjects did not undergo exercise
or training. Psychological support was given by psychologists and
medical doctors looked after the subjects in daily ward rounds.
The dietary intake was strictly controlled by weighing all
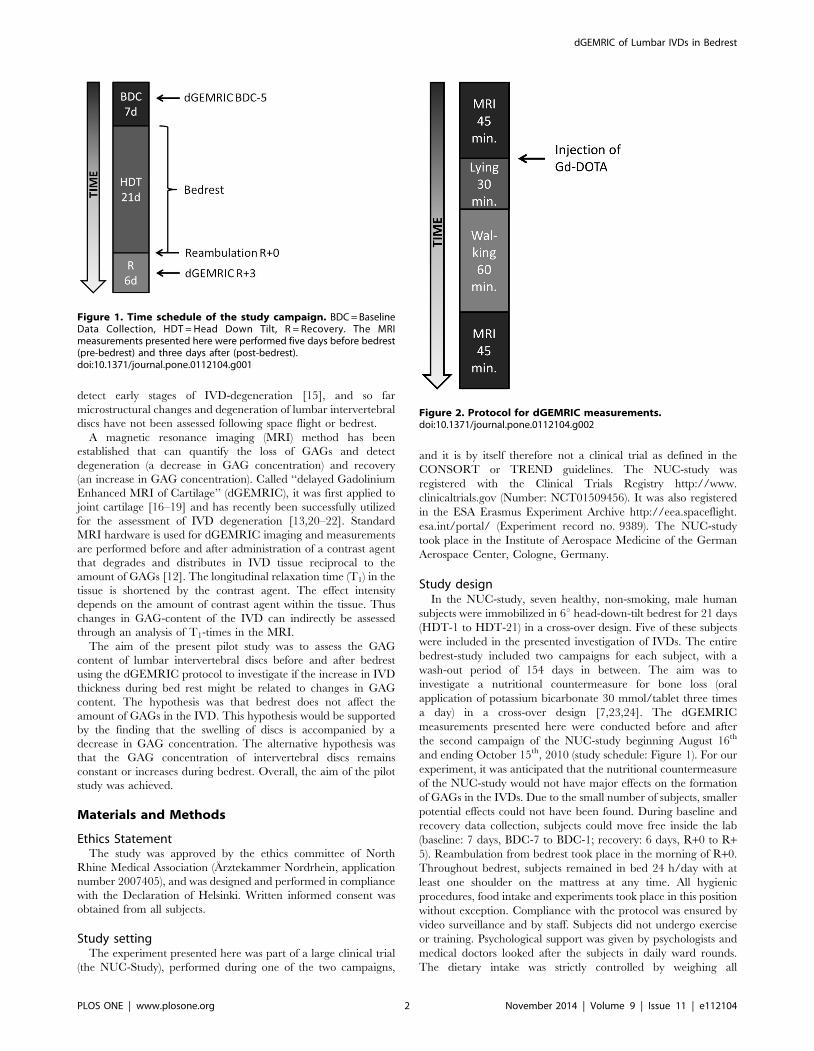
Figure 1. Time schedule of the study campaign. BDC = BaselineData Collection, HDT = Head Down Tilt, R = Recovery. The MRImeasurements presented here were performed five days before bedrest(pre-bedrest) and three days after (post-bedrest).doi:10.1371/journal.pone.0112104.g001
Figure 2. Protocol for dGEMRIC measurements.doi:10.1371/journal.pone.0112104.g002
dGEMRIC of Lumbar IVDs in Bedrest
PLOS ONE | www.plosone.org 2 November 2014 | Volume 9 | Issue 11 | e112104
ingredients, food items and beverages for each test subject to
prevent changes in bodyweight.
Subject selectionSubject recruitment was announced on the institution’s website
as well as by flyers and posters in several universities and research
institutes. Only male subjects were recruited for this study because
the European Space Agency expected hormonal variations in
female subjects to mimic effects in some of the experiments.
Subject selection included a variety of clinical and laboratory tests
as well as a psychological examination. Inclusion criteria were:
male gender, age 20–45 years, body mass index 20–26 kg/m2,
body height 158–190 cm (62–75 inches), body weight 65–85 kg
and willingness to participate in the entire study. Exclusion criteria
included abuse of drugs, medicine, nicotine or alcohol, regular
medication, vegetarians and vegans, history of mental illness,
rheumatic diseases, chronic hypertension, diabetes, obesity,
arthritis, hyperlipidaemia, renal dysfunction, thyroid dysfunction,
hepatic disease, disorders of calcium and bone metabolism,
exercising more than four times a week, chronic back pain, a
history of intervertebral disc prolapse, muscle and joint disease,
family history of thrombosis and blood clotting disorders (Tests
performed included AT III, Lupus-PTT, ferritin, Factors II, IV
and V Leiden).
The dGEMRIC protocolMRI scans of the longitudinal relaxation time were taken
according to the dGEMRIC protocol as described in the literature
[14,20–22]. Each subject underwent MRI scans of the lumbar
spine pre- and post-bedrest on BDC-5 and R+3 (Figure 1). MRI
scans were taken with a phased-array back coil in a 3T MRI
scanner (Achieva, Phillips Medical Systems). A fast spin spin-echo
inversion recovery sequence was applied which allows the pixel-
wise calculation of T1 from a series of seven images recorded with
fixed TR (1800 ms) and TE (13 ms) and variable inversion-
recovery times (TI 50, 150, 350, 700, 1050, 1400 and 2000 ms,
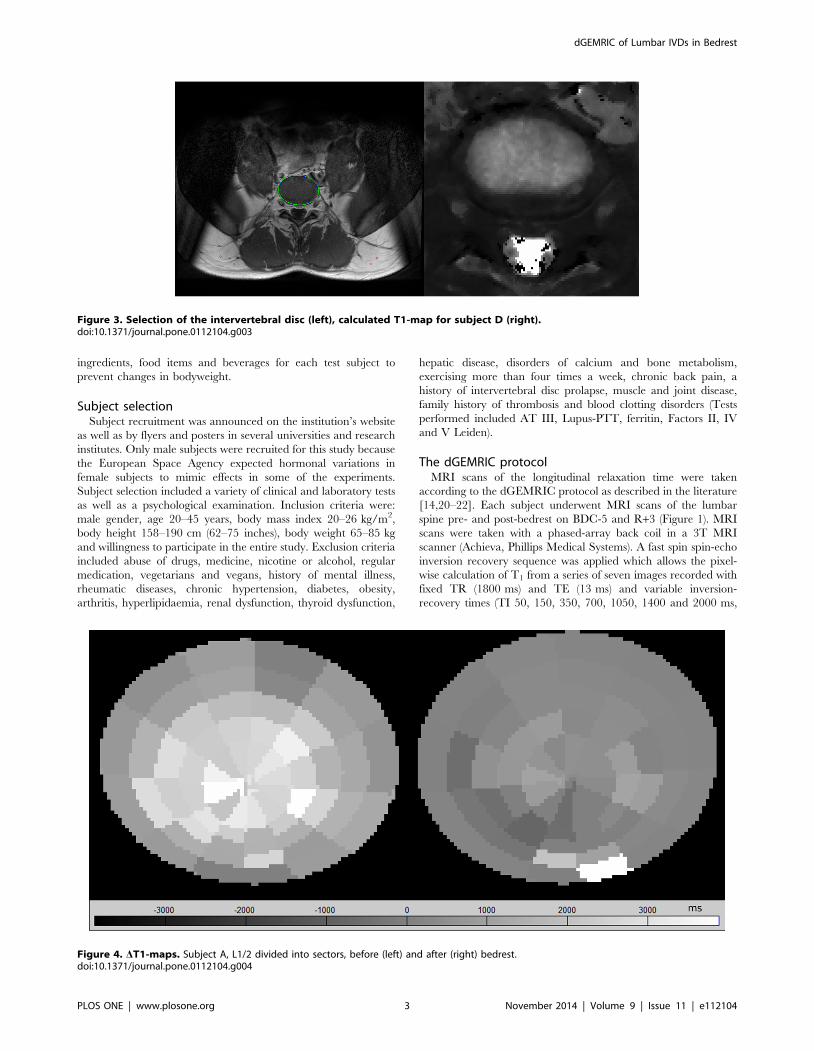
Figure 3. Selection of the intervertebral disc (left), calculated T1-map for subject D (right).doi:10.1371/journal.pone.0112104.g003
Figure 4. DT1-maps. Subject A, L1/2 divided into sectors, before (left) and after (right) bedrest.doi:10.1371/journal.pone.0112104.g004
dGEMRIC of Lumbar IVDs in Bedrest
PLOS ONE | www.plosone.org 3 November 2014 | Volume 9 | Issue 11 | e112104
respectively). For each examined intervertebral disc, two series of
cross-sectional images were individually planned based on sagittal
pilot images of the spine. The images came from two consecutive
slices recorded with 300 mm6300 mm field of view, an acquisi-
tion matrix of 5126512 pixels and 3 mm slice thickness. Each
time, MRI scans were performed before and after i.v.-adminis-
tration of the gadolinium-based contrast agent Gd-DOTA
(Dotarem, Gadoteric acid, 0,4 mg/kg bodyweight). The schedule
of Gd-DOTA administration, subject handling, and the measure-
ments followed the protocol of Niikimaki et al. [20] and is shown
in Figure 2.
Calculation of T1-valuesThe automatic normalization of signal intensity was accidentally
not disabled during some of the measurements before bedrest. In
this case the signal intensity of the seven images in a series must be
corrected prior to the calculation of T1. For the correction of
signal intensities, a normalization-factor was calculated using
manually chosen points in the subcutaneous fat tissue. T1-values of
fat were known from the correctly recorded images and were
proven to remain constant after the application of contrast agent.
All post-bedrest measurements were performed without this
technical error.
Finally, T1 was calculated for selected regions in the disc by
fitting the signal intensities of selected pixels in the seven images
and the corresponding inversion recovery times to the Nelder-
Mead equation as published by Vaga et al. [21] using
multidimensional unconstrained nonlinear minimization.
SegmentationT1-maps were calculated for L1/2 to L4/5. The IVD region
was segmented semiautomatically (Figure 3). An ellipse was fitted
to eight points that were set manually. The ellipse was then
subdivided into 60 sectors (Figure 4). For each sector, means and
SD of the T1-times, as well as DT1 were computed. Rings and
zones were defined and separately analyzed (Figure 5).
Pfirrmann-gradingSagittal T2 (spin-spin relaxation time) weighted multi echo
images of the spine were acquired using a 1.5 T MRI scanner
(Sonata, Siemens Medical Systems, Erlangen) with TR: 2500 ms,
156TE: 10,3 ms–164,8 ms, 2566256 pixels in FOV:
330 mm6330 mm, 3 mm slice thickness, 6 mm interslice gap
with a dedicated spine coil. The images were evaluated for
Pfirrmann-grading of IVD degeneration by a radiologist [25].
Pfirrmann-grades were correlated with findings from dGEMRIC
measurements.
Statistical analysisUsing factorial ANOVAs (Statistica 10, Statsoft, Tulsa, OK,
USA) native T1 values, T1-values after administration of the
contrast agent, and DT1 were tested for group effects caused by
bedrest, differences between regions within each disc and
differences between different discs. Significance was assumed at
p,0.05. Data are presented as counts and percentages, and as
means and their sd. Exclusion conditions were T1 times ,400 ms
and .1500 ms. Where significance was found, a Tukey’s post-hoc
test was performed. SigmaPlot was used for plotting of data. DT1
was the primary outcome measure of this study.
Results
Five out of seven subjects completed the entire experiment
(Table 1). Two subjects were excluded from the analysis due to
incomplete data sets (loss of data due to a software problem).
There was no adverse event in connection with the dGEMRIC
measurements.
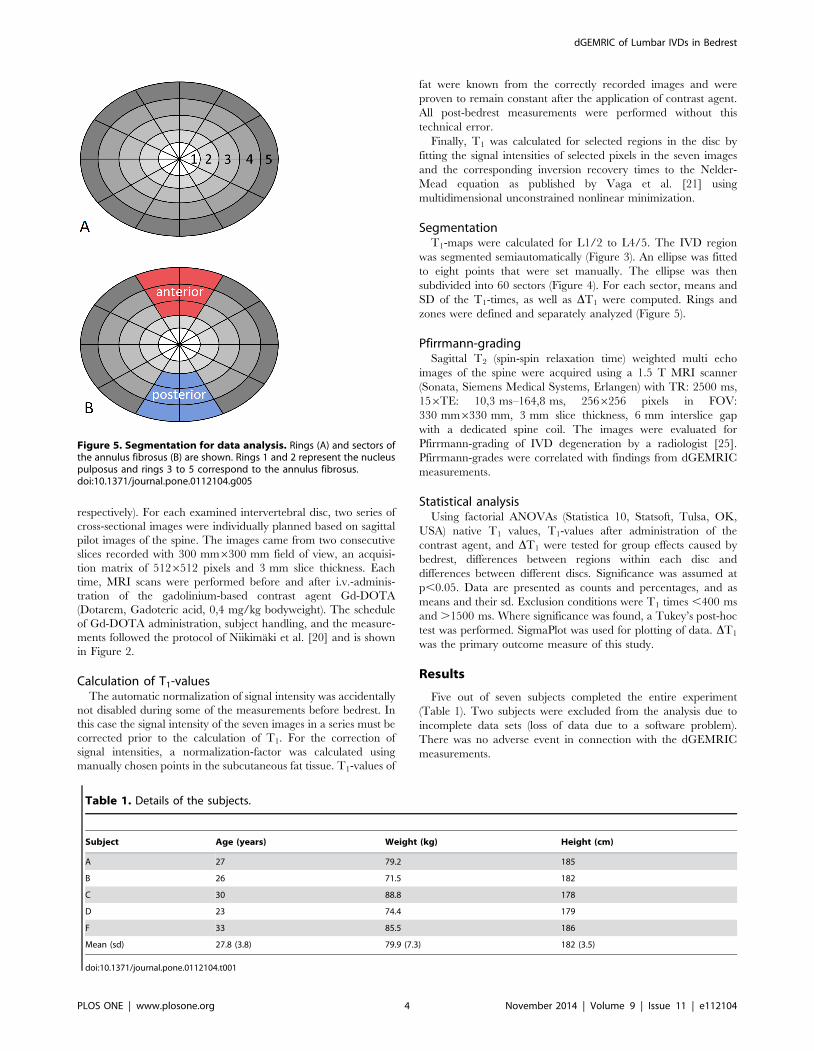
Figure 5. Segmentation for data analysis. Rings (A) and sectors ofthe annulus fibrosus (B) are shown. Rings 1 and 2 represent the nucleuspulposus and rings 3 to 5 correspond to the annulus fibrosus.doi:10.1371/journal.pone.0112104.g005
Table 1. Details of the subjects.
Subject Age (years) Weight (kg) Height (cm)
A 27 79.2 185
B 26 71.5 182
C 30 88.8 178
D 23 74.4 179
F 33 85.5 186
Mean (sd) 27.8 (3.8) 79.9 (7.3) 182 (3.5)
doi:10.1371/journal.pone.0112104.t001
dGEMRIC of Lumbar IVDs in Bedrest
PLOS ONE | www.plosone.org 4 November 2014 | Volume 9 | Issue 11 | e112104
The main findings of this study were: 1. a decrease in DT1 after
bedrest compared to before, 2. negative DT1-values, particularly in
Pfirrmann-grade 2-discs after bedrest and in L4/5, and 3.
significantly lower native T1 values after bedrest than before
bedrest.
Average DT1 value of all intervertebral discs was 104.87 ms (sd
7.64 ms) pre-bedrest and -20.20 ms (sd 4.70 ms) post-bedrest. This
difference is highly significant (p,0.001). Table 2 gives an
overview of data, showing average values and standard deviations.
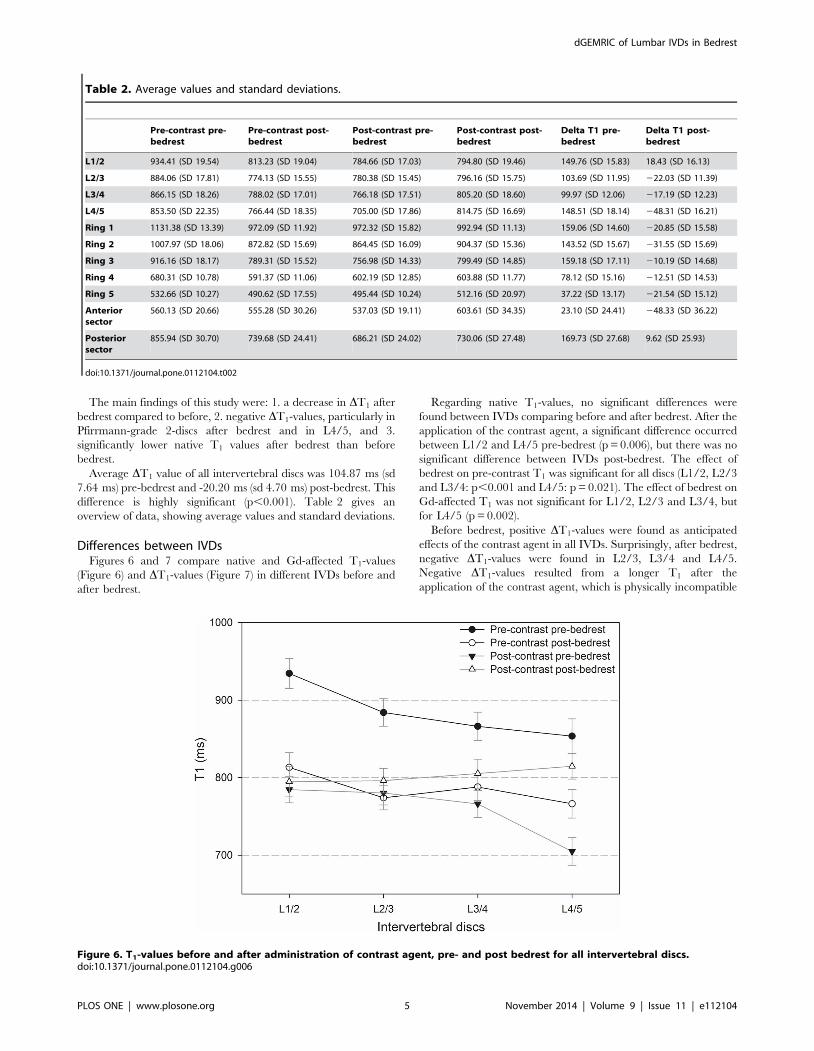
Differences between IVDsFigures 6 and 7 compare native and Gd-affected T1-values
(Figure 6) and DT1-values (Figure 7) in different IVDs before and
after bedrest.
Regarding native T1-values, no significant differences were
found between IVDs comparing before and after bedrest. After the
application of the contrast agent, a significant difference occurred
between L1/2 and L4/5 pre-bedrest (p = 0.006), but there was no
significant difference between IVDs post-bedrest. The effect of
bedrest on pre-contrast T1 was significant for all discs (L1/2, L2/3
and L3/4: p,0.001 and L4/5: p = 0.021). The effect of bedrest on
Gd-affected T1 was not significant for L1/2, L2/3 and L3/4, but
for L4/5 (p = 0.002).
Before bedrest, positive DT1-values were found as anticipated
effects of the contrast agent in all IVDs. Surprisingly, after bedrest,
negative DT1-values were found in L2/3, L3/4 and L4/5.
Negative DT1-values resulted from a longer T1 after the
application of the contrast agent, which is physically incompatible
Table 2. Average values and standard deviations.
Pre-contrast pre-bedrest
Pre-contrast post-bedrest
Post-contrast pre-bedrest
Post-contrast post-bedrest
Delta T1 pre-bedrest
Delta T1 post-bedrest
L1/2 934.41 (SD 19.54) 813.23 (SD 19.04) 784.66 (SD 17.03) 794.80 (SD 19.46) 149.76 (SD 15.83) 18.43 (SD 16.13)
L2/3 884.06 (SD 17.81) 774.13 (SD 15.55) 780.38 (SD 15.45) 796.16 (SD 15.75) 103.69 (SD 11.95) 222.03 (SD 11.39)
L3/4 866.15 (SD 18.26) 788.02 (SD 17.01) 766.18 (SD 17.51) 805.20 (SD 18.60) 99.97 (SD 12.06) 217.19 (SD 12.23)
L4/5 853.50 (SD 22.35) 766.44 (SD 18.35) 705.00 (SD 17.86) 814.75 (SD 16.69) 148.51 (SD 18.14) 248.31 (SD 16.21)
Ring 1 1131.38 (SD 13.39) 972.09 (SD 11.92) 972.32 (SD 15.82) 992.94 (SD 11.13) 159.06 (SD 14.60) 220.85 (SD 15.58)
Ring 2 1007.97 (SD 18.06) 872.82 (SD 15.69) 864.45 (SD 16.09) 904.37 (SD 15.36) 143.52 (SD 15.67) 231.55 (SD 15.69)
Ring 3 916.16 (SD 18.17) 789.31 (SD 15.52) 756.98 (SD 14.33) 799.49 (SD 14.85) 159.18 (SD 17.11) 210.19 (SD 14.68)
Ring 4 680.31 (SD 10.78) 591.37 (SD 11.06) 602.19 (SD 12.85) 603.88 (SD 11.77) 78.12 (SD 15.16) 212.51 (SD 14.53)
Ring 5 532.66 (SD 10.27) 490.62 (SD 17.55) 495.44 (SD 10.24) 512.16 (SD 20.97) 37.22 (SD 13.17) 221.54 (SD 15.12)
Anteriorsector
560.13 (SD 20.66) 555.28 (SD 30.26) 537.03 (SD 19.11) 603.61 (SD 34.35) 23.10 (SD 24.41) 248.33 (SD 36.22)
Posteriorsector
855.94 (SD 30.70) 739.68 (SD 24.41) 686.21 (SD 24.02) 730.06 (SD 27.48) 169.73 (SD 27.68) 9.62 (SD 25.93)
doi:10.1371/journal.pone.0112104.t002
Figure 6. T1-values before and after administration of contrast agent, pre- and post bedrest for all intervertebral discs.doi:10.1371/journal.pone.0112104.g006
dGEMRIC of Lumbar IVDs in Bedrest
PLOS ONE | www.plosone.org 5 November 2014 | Volume 9 | Issue 11 | e112104
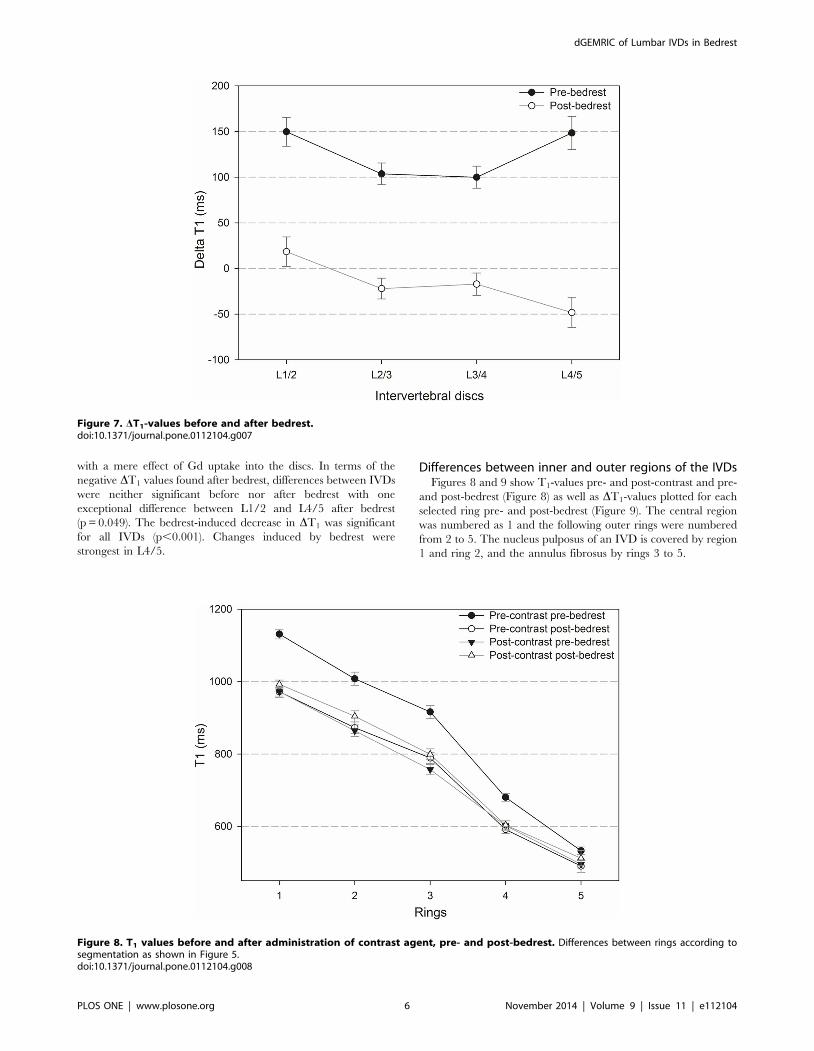
with a mere effect of Gd uptake into the discs. In terms of the
negative DT1 values found after bedrest, differences between IVDs
were neither significant before nor after bedrest with one
exceptional difference between L1/2 and L4/5 after bedrest
(p = 0.049). The bedrest-induced decrease in DT1 was significant
for all IVDs (p,0.001). Changes induced by bedrest were
strongest in L4/5.
Differences between inner and outer regions of the IVDsFigures 8 and 9 show T1-values pre- and post-contrast and pre-
and post-bedrest (Figure 8) as well as DT1-values plotted for each
selected ring pre- and post-bedrest (Figure 9). The central region
was numbered as 1 and the following outer rings were numbered
from 2 to 5. The nucleus pulposus of an IVD is covered by region
1 and ring 2, and the annulus fibrosus by rings 3 to 5.
Figure 7. DT1-values before and after bedrest.doi:10.1371/journal.pone.0112104.g007
Figure 8. T1 values before and after administration of contrast agent, pre- and post-bedrest. Differences between rings according tosegmentation as shown in Figure 5.doi:10.1371/journal.pone.0112104.g008
dGEMRIC of Lumbar IVDs in Bedrest
PLOS ONE | www.plosone.org 6 November 2014 | Volume 9 | Issue 11 | e112104
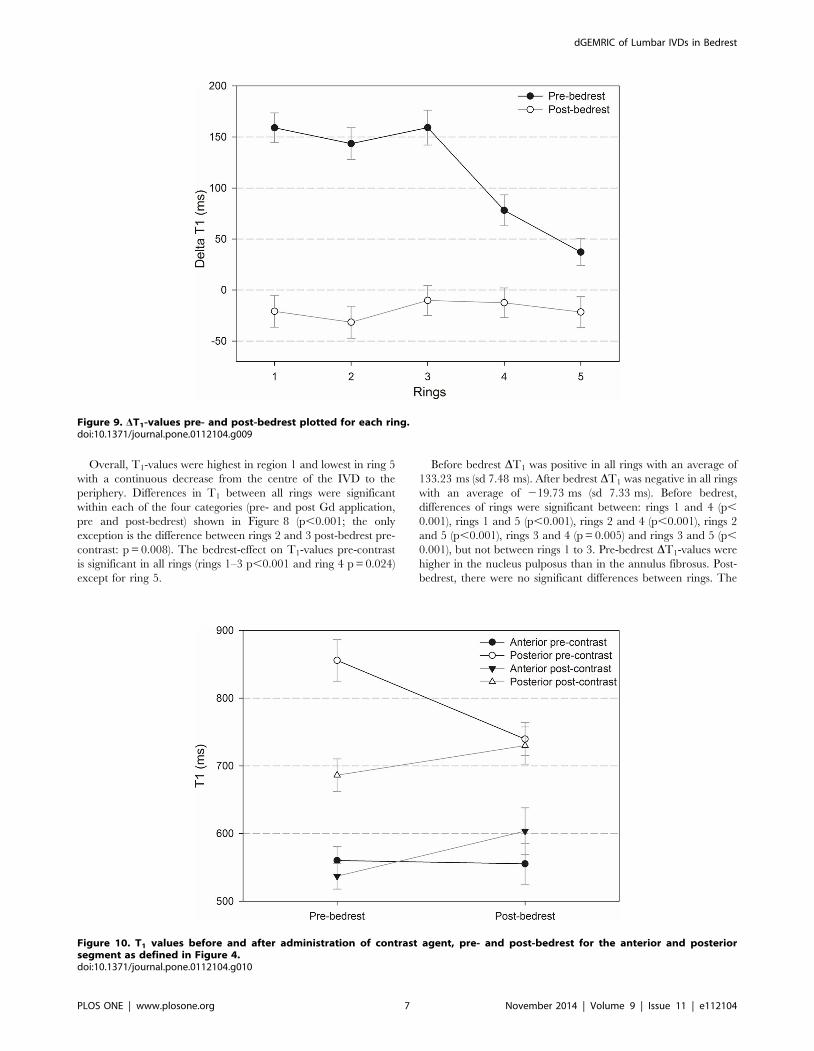
Overall, T1-values were highest in region 1 and lowest in ring 5
with a continuous decrease from the centre of the IVD to the
periphery. Differences in T1 between all rings were significant
within each of the four categories (pre- and post Gd application,
pre and post-bedrest) shown in Figure 8 (p,0.001; the only
exception is the difference between rings 2 and 3 post-bedrest pre-
contrast: p = 0.008). The bedrest-effect on T1-values pre-contrast
is significant in all rings (rings 1–3 p,0.001 and ring 4 p = 0.024)
except for ring 5.
Before bedrest DT1 was positive in all rings with an average of
133.23 ms (sd 7.48 ms). After bedrest DT1 was negative in all rings
with an average of 219.73 ms (sd 7.33 ms). Before bedrest,
differences of rings were significant between: rings 1 and 4 (p,
0.001), rings 1 and 5 (p,0.001), rings 2 and 4 (p,0.001), rings 2
and 5 (p,0.001), rings 3 and 4 (p = 0.005) and rings 3 and 5 (p,
0.001), but not between rings 1 to 3. Pre-bedrest DT1-values were
higher in the nucleus pulposus than in the annulus fibrosus. Post-
bedrest, there were no significant differences between rings. The
Figure 9. DT1-values pre- and post-bedrest plotted for each ring.doi:10.1371/journal.pone.0112104.g009
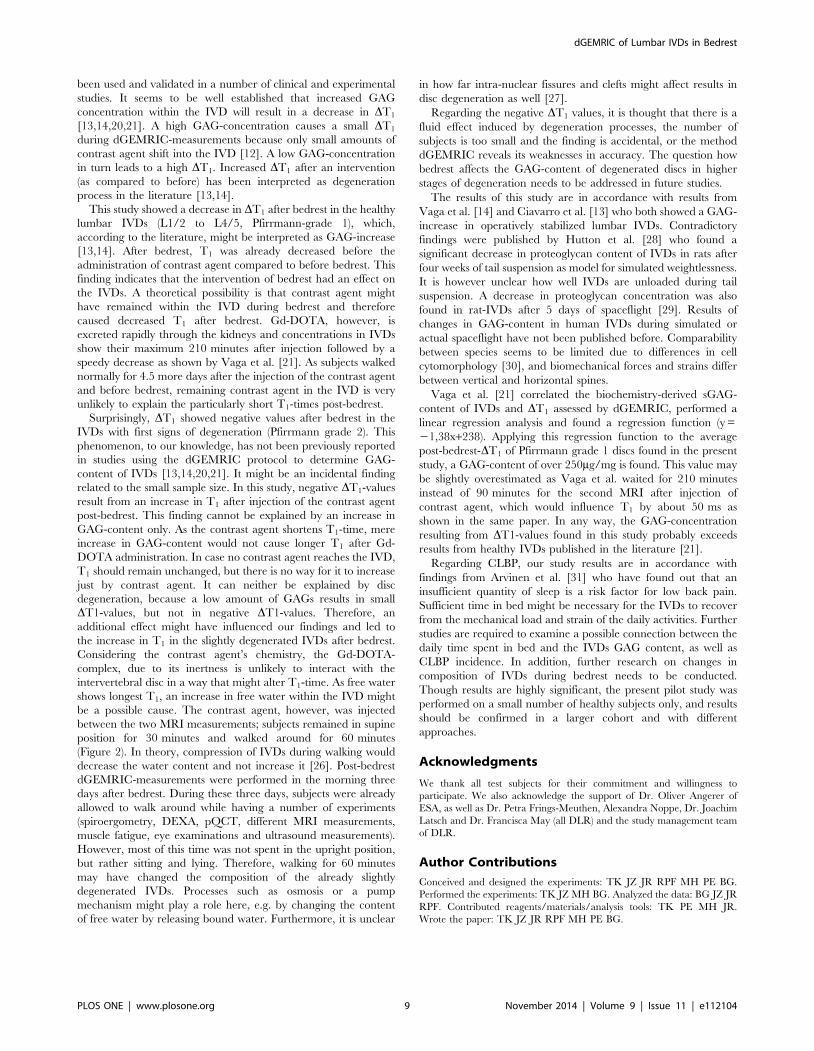
Figure 10. T1 values before and after administration of contrast agent, pre- and post-bedrest for the anterior and posteriorsegment as defined in Figure 4.doi:10.1371/journal.pone.0112104.g010
dGEMRIC of Lumbar IVDs in Bedrest
PLOS ONE | www.plosone.org 7 November 2014 | Volume 9 | Issue 11 | e112104
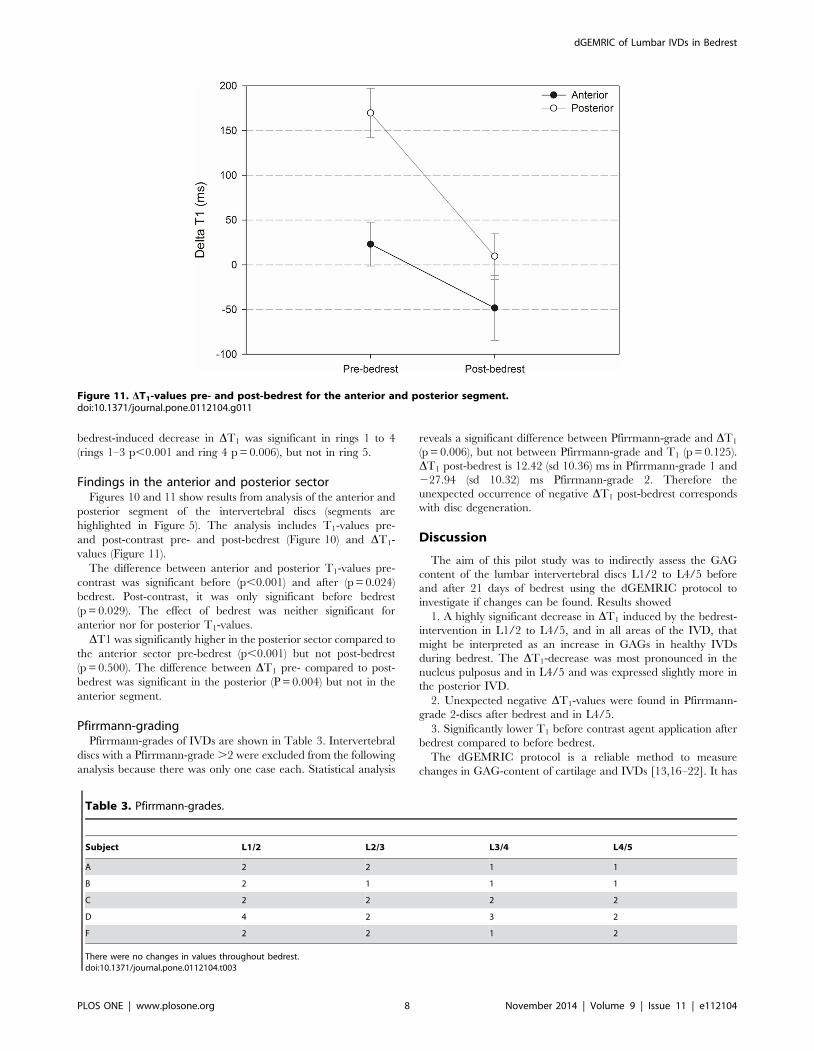
bedrest-induced decrease in DT1 was significant in rings 1 to 4
(rings 1–3 p,0.001 and ring 4 p = 0.006), but not in ring 5.
Findings in the anterior and posterior sectorFigures 10 and 11 show results from analysis of the anterior and
posterior segment of the intervertebral discs (segments are
highlighted in Figure 5). The analysis includes T1-values pre-
and post-contrast pre- and post-bedrest (Figure 10) and DT1-
values (Figure 11).
The difference between anterior and posterior T1-values pre-
contrast was significant before (p,0.001) and after (p = 0.024)
bedrest. Post-contrast, it was only significant before bedrest
(p = 0.029). The effect of bedrest was neither significant for
anterior nor for posterior T1-values.
DT1 was significantly higher in the posterior sector compared to
the anterior sector pre-bedrest (p,0.001) but not post-bedrest
(p = 0.500). The difference between DT1 pre- compared to post-
bedrest was significant in the posterior (P = 0.004) but not in the
anterior segment.
Pfirrmann-gradingPfirrmann-grades of IVDs are shown in Table 3. Intervertebral
discs with a Pfirrmann-grade .2 were excluded from the following
analysis because there was only one case each. Statistical analysis
reveals a significant difference between Pfirrmann-grade and DT1
(p = 0.006), but not between Pfirrmann-grade and T1 (p = 0.125).
DT1 post-bedrest is 12.42 (sd 10.36) ms in Pfirrmann-grade 1 and
227.94 (sd 10.32) ms Pfirrmann-grade 2. Therefore the
unexpected occurrence of negative DT1 post-bedrest corresponds
with disc degeneration.
Discussion
The aim of this pilot study was to indirectly assess the GAG
content of the lumbar intervertebral discs L1/2 to L4/5 before
and after 21 days of bedrest using the dGEMRIC protocol to
investigate if changes can be found. Results showed
1. A highly significant decrease in DT1 induced by the bedrest-
intervention in L1/2 to L4/5, and in all areas of the IVD, that
might be interpreted as an increase in GAGs in healthy IVDs
during bedrest. The DT1-decrease was most pronounced in the
nucleus pulposus and in L4/5 and was expressed slightly more in
the posterior IVD.
2. Unexpected negative DT1-values were found in Pfirrmann-
grade 2-discs after bedrest and in L4/5.
3. Significantly lower T1 before contrast agent application after
bedrest compared to before bedrest.
The dGEMRIC protocol is a reliable method to measure
changes in GAG-content of cartilage and IVDs [13,16–22]. It has
Figure 11. DT1-values pre- and post-bedrest for the anterior and posterior segment.doi:10.1371/journal.pone.0112104.g011
Table 3. Pfirrmann-grades.
Subject L1/2 L2/3 L3/4 L4/5
A 2 2 1 1
B 2 1 1 1
C 2 2 2 2
D 4 2 3 2
F 2 2 1 2
There were no changes in values throughout bedrest.doi:10.1371/journal.pone.0112104.t003
dGEMRIC of Lumbar IVDs in Bedrest
PLOS ONE | www.plosone.org 8 November 2014 | Volume 9 | Issue 11 | e112104
been used and validated in a number of clinical and experimental
studies. It seems to be well established that increased GAG
concentration within the IVD will result in a decrease in DT1
[13,14,20,21]. A high GAG-concentration causes a small DT1
during dGEMRIC-measurements because only small amounts of
contrast agent shift into the IVD [12]. A low GAG-concentration
in turn leads to a high DT1. Increased DT1 after an intervention
(as compared to before) has been interpreted as degeneration
process in the literature [13,14].
This study showed a decrease in DT1 after bedrest in the healthy
lumbar IVDs (L1/2 to L4/5, Pfirrmann-grade 1), which,
according to the literature, might be interpreted as GAG-increase
[13,14]. After bedrest, T1 was already decreased before the
administration of contrast agent compared to before bedrest. This
finding indicates that the intervention of bedrest had an effect on
the IVDs. A theoretical possibility is that contrast agent might
have remained within the IVD during bedrest and therefore
caused decreased T1 after bedrest. Gd-DOTA, however, is
excreted rapidly through the kidneys and concentrations in IVDs
show their maximum 210 minutes after injection followed by a
speedy decrease as shown by Vaga et al. [21]. As subjects walked
normally for 4.5 more days after the injection of the contrast agent
and before bedrest, remaining contrast agent in the IVD is very
unlikely to explain the particularly short T1-times post-bedrest.
Surprisingly, DT1 showed negative values after bedrest in the
IVDs with first signs of degeneration (Pfirrmann grade 2). This
phenomenon, to our knowledge, has not been previously reported
in studies using the dGEMRIC protocol to determine GAG-
content of IVDs [13,14,20,21]. It might be an incidental finding
related to the small sample size. In this study, negative DT1-values
result from an increase in T1 after injection of the contrast agent
post-bedrest. This finding cannot be explained by an increase in
GAG-content only. As the contrast agent shortens T1-time, mere
increase in GAG-content would not cause longer T1 after Gd-
DOTA administration. In case no contrast agent reaches the IVD,
T1 should remain unchanged, but there is no way for it to increase
just by contrast agent. It can neither be explained by disc
degeneration, because a low amount of GAGs results in small
DT1-values, but not in negative DT1-values. Therefore, an
additional effect might have influenced our findings and led to
the increase in T1 in the slightly degenerated IVDs after bedrest.
Considering the contrast agent’s chemistry, the Gd-DOTA-
complex, due to its inertness is unlikely to interact with the
intervertebral disc in a way that might alter T1-time. As free water
shows longest T1, an increase in free water within the IVD might
be a possible cause. The contrast agent, however, was injected
between the two MRI measurements; subjects remained in supine
position for 30 minutes and walked around for 60 minutes
(Figure 2). In theory, compression of IVDs during walking would
decrease the water content and not increase it [26]. Post-bedrest
dGEMRIC-measurements were performed in the morning three
days after bedrest. During these three days, subjects were already
allowed to walk around while having a number of experiments
(spiroergometry, DEXA, pQCT, different MRI measurements,
muscle fatigue, eye examinations and ultrasound measurements).
However, most of this time was not spent in the upright position,
but rather sitting and lying. Therefore, walking for 60 minutes
may have changed the composition of the already slightly
degenerated IVDs. Processes such as osmosis or a pump
mechanism might play a role here, e.g. by changing the content
of free water by releasing bound water. Furthermore, it is unclear
in how far intra-nuclear fissures and clefts might affect results in
disc degeneration as well [27].
Regarding the negative DT1 values, it is thought that there is a
fluid effect induced by degeneration processes, the number of
subjects is too small and the finding is accidental, or the method
dGEMRIC reveals its weaknesses in accuracy. The question how
bedrest affects the GAG-content of degenerated discs in higher
stages of degeneration needs to be addressed in future studies.
The results of this study are in accordance with results from
Vaga et al. [14] and Ciavarro et al. [13] who both showed a GAG-
increase in operatively stabilized lumbar IVDs. Contradictory
findings were published by Hutton et al. [28] who found a
significant decrease in proteoglycan content of IVDs in rats after
four weeks of tail suspension as model for simulated weightlessness.
It is however unclear how well IVDs are unloaded during tail
suspension. A decrease in proteoglycan concentration was also
found in rat-IVDs after 5 days of spaceflight [29]. Results of
changes in GAG-content in human IVDs during simulated or
actual spaceflight have not been published before. Comparability
between species seems to be limited due to differences in cell
cytomorphology [30], and biomechanical forces and strains differ
between vertical and horizontal spines.
Vaga et al. [21] correlated the biochemistry-derived sGAG-
content of IVDs and DT1 assessed by dGEMRIC, performed a
linear regression analysis and found a regression function (y =
21,38x+238). Applying this regression function to the average
post-bedrest-DT1 of Pfirrmann grade 1 discs found in the present
study, a GAG-content of over 250mg/mg is found. This value may
be slightly overestimated as Vaga et al. waited for 210 minutes
instead of 90 minutes for the second MRI after injection of
contrast agent, which would influence T1 by about 50 ms as
shown in the same paper. In any way, the GAG-concentration
resulting from DT1-values found in this study probably exceeds
results from healthy IVDs published in the literature [21].
Regarding CLBP, our study results are in accordance with
findings from Arvinen et al. [31] who have found out that an
insufficient quantity of sleep is a risk factor for low back pain.
Sufficient time in bed might be necessary for the IVDs to recover
from the mechanical load and strain of the daily activities. Further
studies are required to examine a possible connection between the
daily time spent in bed and the IVDs GAG content, as well as
CLBP incidence. In addition, further research on changes in
composition of IVDs during bedrest needs to be conducted.
Though results are highly significant, the present pilot study was
performed on a small number of healthy subjects only, and results
should be confirmed in a larger cohort and with different
approaches.
Acknowledgments
We thank all test subjects for their commitment and willingness to
participate. We also acknowledge the support of Dr. Oliver Angerer of
ESA, as well as Dr. Petra Frings-Meuthen, Alexandra Noppe, Dr. Joachim
Latsch and Dr. Francisca May (all DLR) and the study management team
of DLR.
Author Contributions
Conceived and designed the experiments: TK JZ JR RPF MH PE BG.
Performed the experiments: TK JZ MH BG. Analyzed the data: BG JZ JR
RPF. Contributed reagents/materials/analysis tools: TK PE MH JR.
Wrote the paper: TK JZ JR RPF MH PE BG.
dGEMRIC of Lumbar IVDs in Bedrest
PLOS ONE | www.plosone.org 9 November 2014 | Volume 9 | Issue 11 | e112104
References
1. Kerstman EL, Scheuring RA, Barnes MG, DeKorse TB, Saile LG (2012) Space
Adaptation Back Pain: A retrospective Study. Aviat Space Environ Med 83: 2–7.2. Wing PC, Tsang IK, Susak L, Gagnon F, Gagnon R, et al. (1991) Back pain and
spinal changes in microgravity. Orthop Clin North Am 22(2): 255–62.3. Pope MH, Goh KL, Magnusson ML (2002) Spine ergonomics. Annu Rev
Biomed Eng 4: 49–68.
4. Brisby H (2006) Pathology and possible mechanism of nervous system responseto disc degeneration. J Bone Joint Surg Am 88: 68–71.
5. D’Aprile P, Tarantino A, Jinkins JR, Brindicci D (2007) The value of fatsaturation and contrast medium administration in MRI of degenerative disease
of the posterior/peripheral elements of the lumbosacral spine. Eur Radiol 17(2):
523–31.6. Sayson JV, Hargens AR (2008) Pathophysiology of Low Back Pain during
Exposure to Microgravity. Aviat Space Environ Med 79: 365–73.7. Belavy DL, Bansmann PM, Bohme G, Frings-Meuthen P, Heer M, et al. (2011)
Changes in intervertebral disc morphology persist 5 mo after 21-day bed rest.J Appl Physiol 111: 1304–1314.
8. Paajanen H, Lehto I, Alanen A, Erkintalo M, Komu M (1994) Diurnal Fluid
Changes of Lumbar Discs Measured Indirectly by Magnetic ResonanceImaging. J Orthop Res 12(4): 509–14.
9. Johnston SL, Campbell MR, Scheuring R, Feiveson AH (2010) Risk ofHerniated Nucleus Pulposus Among U.S. Astronauts. Aviat Space Environ Med
81: 566–74.
10. Hutchinson KJ, Watenpaugh DE, Murthy G, Convertino VA, Hargens AR(1995) Back pain during 6 degrees head-down tilt approximates that during
actual microgravity. Aviat Space Environ Med 66(3): 256–9.11. Belavy DL, Armbrecht G, Felsenberg D (2012) Incomplete recovery of lumbar
intervertebral discs 2 years after 60-day bed rest. Spine 15; 37(14): 1245–51.12. Tibiletti M, Galbusera F, Ciavarro C, Brayda-Bruno M (2013) Is the Transport
of a Gadolinium-Based Contrast Agent Decreased in a Degenerated or Aged
Disc? A Post Contrast MRI Study. PLoS One 11; 8(10): e76697.13. Ciavarro C, Caiani EG, Brayda-Bruno M, Zerbi A, Galbusera F, et al. (2012)
Mid-term evaluation of the effects of dynamic neutralization system on lumbarintervertebral discs using quantitative molecular MR imaging. J Magn Reson
Imaging 35(5): 1145–51.
14. Vaga S, Brayda-Bruno M, Perona F, Fornari M, Raimondi MT, et al. (2009)Molecular MR imaging for the evaluation of the effect of dynamic stabilization
on lumbar intervertebral discs. Eur Spine J. 18 Suppl 1: 40–8.15. Hanley EN, Herkowitz HN, Kirkpatrick JS, Wang JC, Chen MN, et al. (2010)
Debating the value of spine surgery. J Bone Joint Am 92(5): 1293–304.16. Mamisch TC, Dudda M, Hughes T, Burstein D, Kim YJ (2008) Comparison of
Delayed Gadolinium Enhanced MRI of Cartilage (dGEMRIC) Using Inversion
Recovery and Fast T1 Mapping Sequences. Magn Reson Med 60: 768–773.17. Zilkens C, Jager M, Bittersohl B, Dudda M, Millis MB, et al. (2009) Delayed
Gadolinium Enhanced MRI of Cartilage (dGEMRIC): molecular MRI of hipjoint cartilage. Orthopade 38(7): 591–9.
18. Bittersohl B, Hosalkar HS, Kim YJ, Werlen S, Siebenrock KA, et al. (2009)
Delayed gadolinium-enhanced magnetic resonance imaging (dGEMRIC) of hip
joint cartilage in femoroacetabular impingement (FAI): Are pre- and
postcontrast imaging both necessary? Magn Reson Med 62(6): 1362–7.
19. Zilkens C, Holstein A, Bittersohl B, Jager M, Haamberg T, et al. (2010) Delayed
gadolinium-enhanced magnetic resonance imaging of cartilage in the long-term
follow-up after Perthes disease. J Pediatr Orthop 30(2): 147–53.
20. Niinimaki JL, Parviainen O, Ruohonen J, Ojala RO, Kurunlahti M, et al. (2006)
In Vivo Quantification of Delayed Gadolinium Enhancement in the Nucleus
Pulposus of Human Intervertebral Disc. J Magn Reson Imaging 24(7): 796–800.
21. Vaga S, Raimondi MT, Caiani EG, Costa F, Giordano C, et al. (2008)
Quantitative assessment of intervertebral disc glycosaminoglycan distribution by
gadolinium-enhanced MRI in orthopaedic patients. Magn Reson Med 59(1):
85–95.
22. Vaga S, Raimondi MT, Perona F, Fornari M, Caiani EG (2009) Division
scheme optimization for the molecular evaluation of the intervertebral disc by
Gadolinium-Enhanced MRI. J Magn Reson Imaging 29(6): 1443–9.
23. Frings-Meuthen P, Boehme G, Liphardt AM, Baecker N, Heer M, et al. (2013)
Sclerosin and DKK1 levels during 14 and 21 days of bed rest in healthy young
men. J Musculoskelet Neuronal Interact 13(1): 45–52.
24. Kelsen J, Bartels LE, Dige A, Hvas CL, Frings-Meuthen P, et al. (2012) 21 Days
head-down bed rest induces weakening of cellmediated immunity - Some
spaceflight findings confirmed in a ground-based analog. Cytokine 59: 403–9.
25. Pfirrmann CWA, Metzdorf A, Zanetti M, Hodler J, Boos N (2001) Magnetic
Resonance Classification of Lumbar Intervertebral Disc Degeneration. Spine
(Phila Pa 1976) 1; 26(17): 1873–8.
26. Lotz JC, Colliou OK, Chin JR, Duncan NA, Liebenberg E (1998) Compression-
induced degeneration of the intervertebral disc: an in vivo mouse model and
finite-element study. Spine (Phila Pa 1976) 23(23): 2493–506.
27. Perry J, Haughton V, Anderson PA, Wu Y, Fine J, et al. (2006) The Value of T2
Relaxation Times to Characterize Lumbar Intervertebral Disks: Preliminary
Results. Am J Neuroradiol 27: 337–342.
28. Hutton WC, Yoon ST, Elmer WA, Li J, Murakami H, et al. (2002) Effect of Tail
Suspension (or Simulated Weightlessness) on the Lumbar Intervertebral Disc:
study of Proteoglycans and Collagen. Spine (Phila Pa 1976) 27(12): 1286–90.
29. Sinha RK, Shah SA, Hume EL, Tuan RS (2002) The effect of a 5-day space
flight on the immature rat spine. Spine J 2(4): 239–43.
30. Hunter CJ, Matyas JR, Duncan NA (2004) Cytomorphology of notochordal and
chondrocytic cells from the nucleus pulposus: a species comparison. J. Anat 205:
357–362.
31. Auvinen JP, Tammelin TH, Taimela SP, Zitting PJ, Jarvelin MR, et al. (2010) Is
insufficient quantity and quality of sleep a risk factor for neck, shoulder and
lower back pain? A longitudinal study among adolescents. Eur Spine J 19(4):
641–9.
dGEMRIC of Lumbar IVDs in Bedrest
PLOS ONE | www.plosone.org 10 November 2014 | Volume 9 | Issue 11 | e112104