Embed Size (px)
Citation preview
African Journal of Environment and Natural Science Research
ISSN: 2689-9434
Volume 4, Issue 1, 2021 (pp. 62-83)
62
www.abjournals.org
ASSESSMENT OF MICROPLASTICS PHYSICAL AND CHEMICAL PROPERTY
CONCENTRATION IN SURFACE STREAM WATER OF UYO METROPOLIS
Chioma Nwakanma1, Thompson Blessed2 and Hanson Hanson3
1Michael Okara University of Agriculture Umudike Abia State,Nigeria.
E-mail: [email protected]
2Michael Okara University of Agriculture Umudike Abia State, Nigeria,
E-mail: [email protected]
3University of Nigeria, Nsuka, Nigeria.
E-mail: [email protected]
ABSTRACT: Assessment of microplastics physical and chemical properties in surface
stream water of Uyo metropolis was carried out at different stream locations within Uyo
metropolis where waste plastics and microplastics are generated and disposed through
runoff. Three stream water samples were used. GPS coordinates were taken, samples were
taken accurately using volume bulk collection method into glass bottles and analyzed in the
laboratory. A comparison approach was adopted with a control site to assess the level and
concentration of microplastics physical and chemical properties present in the water surface.
Water samples were collected, sieve to get the microplastic particles present and analyzed
using standard procedures by Associations of Official Analytical Chemist and American
Public Health Association. Data were analyzed statistically using ANOVA and Duncan
multiple range tests for mean separation. Correlation analysis was done to check the
differences in parameter’s relationship. The mean value of the microplastic physical and
chemical properties (proximate and ultimate analysis) ranges as follow Dominic Utuk and
Uyo village road stream had %Carbon (12.67%-8.78%), Oxygen (83.89-21.67 %), Nitrogen
(0.38-0.15%), Hydrogen (7.86-5.18 %), Sulfur (0.16-0.77 %) respectively. These were higher
than the control site (3.22, 12.05, 0.05, 2.45, 0.03%). Ultimate assay for Dominic Utuk and
Uyo village road stream recorded %Fixed carbon (19.85, 15.77), %ash (1.03, 2.09),
%volatile matter (79.12, 82.14%), and %residual content (0.89, 0.71) higher than the control
(4.23, 0.12, 17.15, 0.29%) respectively. Heavy metals and anions assessed showed that Lead,
Cadmium, Mercury, Chromium, Arsenic and Chlorine and Bromine were higher in the two
stream microplastic than that of the control site and WHO permissible limit for water.
Correlation analysis shows a strong, positive and perfect relationship between some
parameters measured. Contamination factor and pollution index also reveal possible
contamination and pollution load these elements have which can affect negatively the water
quality and marine organisms in it. The study therefore concludes that there is a huge
negative impact of microplastics particles in the stream water of Uyo metropolis and
therefore recommends a proper recycling, reuse and disposal method for plastic materials
and microplastic substances in the environment.
KEYWORDS: Anions, Contamination factor, Heavy metal, Microplastic, Pollution index
Proximate and Ultimate Analysis.

African Journal of Environment and Natural Science Research
ISSN: 2689-9434
Volume 4, Issue 1, 2021 (pp. 62-83)
63
www.abjournals.org
INTRODUCTION
MICROPLASTICS are materials or products which originate from a vast range of polymers
of high molecular mass (Bbayemi et al.,2018). These microplastics have broad applications
temporally and spatially as a result of their durability, easy to produce, less expenses and
relatively less weight. Recently in the decades past, there was tremendous increase in
microplastic usage for a wide range of products. According to the Brussels European
Commission (2013), global production of microplastic has increased from 1.5 million tons
(Mt) per year in 1950 to 245 Mt in 2008 and still counting. Microplastic originated from
plastics products comes from petroleum products just like refined gasoline from the same
petroleum products. According to the Environmental Protection Agency, estimated
production rate of plastic products and its particles account for about 8% of oil production
rate globally (Merino and Ayer, 2018). This particle breaks down to form microplastics and
microbeads in the soil and water and sometime are eaten by microorganisms to further break
it to smaller particles. Other sources of microplastics are from cosmetic products, laundry
water where cloth fibres particles are disposed of to the environment after use. This affects
the soil and water quality, aesthetic views of the environment and possibly the food web.
This, therefore, warranted the need to under study the environment so as to determine the
concentrations of microplastics as a result of indiscriminate human disposal to the ecosystem.
This study seeks to investigate the concentration of microplastics physical and chemical
characteristics using proximate and ultimate analysis methods, heavy metals and anions
content in studied water samples of Uyo metropolis. However, this research is needed to
further fill in the knowledge gap of emerging microplastic pollutants in our environment.
LITERATURE/THEORETICAL UNDERPINNING
Microplastics in the world today are common. In 2014, the World Ocean was estimated to
have between 15 and 51 trillion individual pieces of microplastic, with estimated weight of
93,000 and 236,000 metric tons (Ioakeimidis et al., 2016; Sebille et al., 2016). There is truly
a staggering amount of microplastics particles inside our world’s water bodies, as a debate of
exactly the amount of microplastics present in the world’s water bodies. A study conducted
on the distribution of surface plastic debris in the Eastern Pacific Ocean helps to demonstrate
how the concentration of plastics in the ocean is on the rise (Law et al., 2014), though there
have only been a few studies on microplastics present in freshwater ecosystems. According to
Anderson (Anderson, et al., 2016), microplastics are being detected in the world’s aquatic
environments increasingly. The first study on microplastics in freshwater ecosystems had an
average of 37.8 fragments per square meter of microplastics in Lake Huron sediment samples
which were published in 2011. Additional studies by (Ivleva et al., 2017) reported
microplastic to be present in all the Great Lakes with an average concentration of 43,000 MP
particle km. These particles get to the water and soil, breakdown into smaller particles called
microplastics and their chemical constituent enters the soil and water thereby polluting it.
Microplastics that get entangled with chemicals during the manufacturing process or
absorbed from the surrounding environment brings a big concern regarding physical and
chemical toxicity of the food chain. There is evidence regarding microplastic toxicity and
epidemiology which is emerging in today’s scientific research.

African Journal of Environment and Natural Science Research
ISSN: 2689-9434
Volume 4, Issue 1, 2021 (pp. 62-83)
64
www.abjournals.org
METHODOLOGY
Study Area
Microplastics physical and chemical property concentration in surface stream water was
carried out in Uyo metropolis, the capital city of Akwa Ibom State. The city lies between
longitudes 7051′ E and 7059′ E, and between latitudes 5040′ N and 5059′ N (fig. 1). According
to Ituen and Nyah(2015), Uyo Capital City covers an approximate area of 188.024 km2 with
an estimated population of 305,961. Uyo metropolis envelops the entire Uyo, parts of Itu,
Uruan, Nsit Ibom and Ibesikpo Asutan Local Government Areas in Akwa Ibom State (Etuk et
al., 2018). Urban expansion and economic growth lead to infrastructural development that
extends to nearby local government areas of Itu, Uruan and Ibesikpo Asutan. Temperature of
Uyo corresponds with that of the tropical humid climate and ranges between 26.2 0C and 35 0C with mean annual temperature of 28.4 0C (Ukpong 2009). The annual precipitation ranges
from 2000-3000mm per annum. According to Etim and Okon, (2013), this rainfall regime
received in most parts of the state encourages farming throughout the year. The occupations
of the inhabitants reflect the economic activity of the residents. The settlements are majorly
Ibibio though there are settlers from other ethnic groups. According to Etim et al (2006) the
settlement pattern in Uyo is nucleated and being an administrative headquarters, majority of
the residents are government employees and political office holders. These people also
engage in farming activities and other commercial ventures within and around their urban
residences as a means of augmenting and supplementing family income and food supplies
(Etim et al., 2006). According to Usoro and Akpan (2006) sandstone hills and ravine are
attributed to parts of Uruan and Uyo Local Government Areas while other sections of the
study area are filled with low lying undulating sandy plains terrain (Ituen and. Nyah, 2015).

African Journal of Environment and Natural Science Research
ISSN: 2689-9434
Volume 4, Issue 1, 2021 (pp. 62-83)
65
www.abjournals.org
Fig. 1: Map of Akwa Ibom State Showing the Uyo LGA.

African Journal of Environment and Natural Science Research
ISSN: 2689-9434
Volume 4, Issue 1, 2021 (pp. 62-83)
66
www.abjournals.org
Sampling Location and Collection
Volume-reduced Bulk water samples approach method was used for sampling because it
collects large quantities and areas of samples during sampling (Crawford and Quinn. 2017).
Water samples were taken from three stream sources within the metropolis where possible
contamination occurs through runoff and outside the metropolis (control).
The samples were collected using a large bucket and storing the water in a large volume
container. The GPS coordinates, wind speed, and wind direction (Table 1) were taken at the
time of sampling. The sample volume at each location was a minimum of 10 litres. The bulk
water samples were taken to the laboratory for analysis of microplastic polymer physical and
chemical properties as described by (Hidalgo-Ruz et al., 2012; Song et al., 2014). The
samples were stored in a refrigerator at 4°C prior to analysis (Mamun et al., 2011).
Water Sample Preparation and Laboratory Analysis.
The samples were directly poured through a sieve (stacked sieves), particles were visually
sorted out from the debris. Micro particles bead/particles identified and sorted were analyzed
for their physical and chemical characteristics.
Determination of Physical and Chemical Characteristics of Microplastic Identified
Using Proximate and Ultimate Analysis Method.
After identification of microplastic particles from water samples, they were grinded for size
reduction and analyzed further for their physical and chemical characteristics. The parameters
and method used are as follows:
Physical Characteristic of Microplastics
Heating value: The heating value of plastic particles was calculated using the Dulong
equation as Stated.
HV = 33801(C) + 144158[(H) – 0.125(O)] + 9413(S) (1)
Where:
HV(kJ/kg) is a Heating Value whereas C, H, O and S are carbon, hydrogen, oxygen and
sulfur content respectively in the dry basis. Higher heating value (HHV) is an important
property which defines the quantitative energy content and determines the clean effective and
efficient utilization of the plastic products according to (Othman et al., 2008).
pH value : the pH value of polymer identified and grinded samples were determined using
Digital pH meter as described in recent study by (Othman et al., 2008).
Moisture content: the percent moisture content of microplastic was determined by weighing
the wet microplastic particles and drying the samples in an oven at 105oC for 1 hour using
desiccators to a constant weight according (ASTM D3173) method. The percent moisture
content was calculated as a percentage loss in weight before and after drying using Equation
(2 and 3) (Othman et al., 2008).

African Journal of Environment and Natural Science Research
ISSN: 2689-9434
Volume 4, Issue 1, 2021 (pp. 62-83)
67
www.abjournals.org
% Moisture content =
[(Wet Weight – Dry Weight)/ Wet weight] x 100 (2)
Or
The percentage of moisture content (MC) was calculated as a fraction loss in weight of
sample before and after drying.
M1=mass of empty crucible (g)
M2=mass of empty crucible + sample (g)
M3=mass of empty crucible + sample after heating (g)
Moisture content = M2 – M3
% moisture content = M2 - M3/ M2 - M1 x 100 (3)
Chemical Characteristics of Microplastic
Proximate analysis: The parameters analyzed include Residual Content (R), volatile matter
(VM), Fixed Carbon (FC) and Ash Content (Ash). The method used was based on the ASTM
Standard D 3172 as suggested by (Brunner,1994). The weights of dry samples were
measured. (Othman et al., 2008).
Ultimate analysis: The parameter analyzed includes Carbon, Hydrogen, Sulphur and Oxygen
Content. In this study, the equipment used is Elemental Analyzer (CHNS Analysis) model
EA 1106 prepared by Thermo Quest Italian S.p.A. In this study, the equipment used was
Elemental Analyzer (CHNS Analysis) model EA. The weights of dry samples were measured
(Othman et al., 2008).
Neutron activation analysis: The parameter analyzed includes total chlorine and total
bromine content using Trig Mk II Reactor, Rotary Rack, Pneumatic Transfer System and
detector. For Total Chlorine determination, a short irradiation process was used and for total
bromine, a long irradiation process was used. The weight of dry samples was measured
(Othman et al., 2008).
Heavy metals Analysis: Heavy metals parameters include Cd, Cr, Hg, Pb and as were
determined from the identified microplastic particles in the soil samples. They were
determined after extraction by Flame Atomic Absorption Spectrometry in accordant with
American Society for Testing and Material (2013) standard test method.
Determination of Ultimate analysis (Elemental Composition)
The combustible percentage is shared among nitrogen, carbon, oxygen and hydrogen in
standard ultimate analysis (Durogbitan, 2019). Nitrogen, Hydrogen, Sulfur and Carbon
(NHSC) are the elemental composition of the solid waste which was carried out at the
laboratory in accordance with the procedures of the Association of Official Analytical
Chemists (2000). The composition of waste was determined using wet oxidation. 1.0-g of the
particle sample was weighed into the digestion tube and 5W of digestion mixture was added
to it. The mixture was left overnight in the fume cupboard. Using a testator, the mixture was

African Journal of Environment and Natural Science Research
ISSN: 2689-9434
Volume 4, Issue 1, 2021 (pp. 62-83)
68
www.abjournals.org
digested for 2 hours at 170o C and allowed to cool. Moreover, to digest the mixture
vigorously, 30-ml of distilled water was added to the solution and mixed. 50-ml of distilled
water was added to the solution to increase the volume of digested mixture to 80-ml. An
Atomic Absorption spectrometer was used to identify the elements under analysis.
Volatile Matter Determination: The volatile matter percentage was carried out by heating the
sample at a temperature of 50oC for 7 minutes using a muffle furnace. The crucible was
cooled in the desiccator after it was removed from the furnace and weighed. The percentage
loss of mass of the sample excluding the percentage moisture is the percentage of volatile
matter (Durogbitan, 2019). This was calculated using this formula;
% Volatile matter =M2 - M3/M2 - M1 x 100 – MC (4)
Where;
M1=mass of empty crucible (g)
M2=mass of empty crucible + sample before heating (g)
M3=mass of empty crucible + sample after heating (g)
MC=percentage of moisture content
Ash Content Determination: Ash content is the non-combustible residue of the sample
obtained after combustion which contains Sulfur and oxides. The process was carried out by
burning the sample at a temperature of 750 oC for an hour in a muffle furnace without a lid.
The sample was cooled in desiccators and weighed and the process was repeated constantly
until a constant weight was attained according to (Durogbitan, 2019). This was calculated
using this formula;
% of ash content = M3 - M1/M2 - M1 x 100 (5)
Where;
M1=mass of empty crucible (g)
M2=mass of empty crucible + sample before heating (g)
M3=mass of empty crucible + residue (g)
Ash content= M3 – M1
Fixed Carbon Determination: Mass of fixed carbon is determined by deducting the
percentage of ash content, moisture content and volatile content from the total percentage
according to (Durogbitan, 2019).
% FC=100 – % ASH – % MC - % VM (6)
Contamination Factor and Pollution Index Determination
Contamination factor (Cf,): The assessment of soil contamination can also be carried out
using Cf. This index enables the assessment of soil contamination, taking into account the

African Journal of Environment and Natural Science Research
ISSN: 2689-9434
Volume 4, Issue 1, 2021 (pp. 62-83)
69
www.abjournals.org
content of heavy metal from the surface of the soil and values of pre-industrial reference
levels given by (Guan et al., 2014)
Cf was calculated by the following formula:
Cf = Cm/Cp_i . (7)
Where Cm—mean content of at least five samples of individual element (like heavy metal)
Cp-i—preindustrial reference value for the substances
Contamination factor/level determination
Ci < 1= low contamination
1 ≤ Ci < 3 = moderate contamination
3≤ Ci < 6 = considerate contamination
Ci ≥ 6 = very high contamination
Single Pollution Index (PI)
An index that can be used to determine which heavy metal represents the highest threat for a
soil environment is the Single Pollution Index (PI). This is also necessary for the calculations
of some of complex indices called Pollution Load Index (PLI)
Pollution load index was calculated using this formula described below according to Varol
(2011);
PI = Cn/GB (8)
Where
Cn—the content of heavy metal in soil and
GB—values of the geochemical background.
PLI = n√ (CF1xCF2xCF3x…xCFn) (9)
Where, CF = contamination factor,
n = number of metals
C metal = metal concentration in polluted sediments
C Background value = background value of that metal.
The Pollution Load Index (PLI) value of >1 is polluted, whereas <1 indicates no pollution
according to Harikumar et al., (2009).
Statistical analysis: Data collected from the laboratory analysis were subjected to descriptive
statistical analysis using SPSS version 20. Results were presented in tables (mean, and

African Journal of Environment and Natural Science Research
ISSN: 2689-9434
Volume 4, Issue 1, 2021 (pp. 62-83)
70
www.abjournals.org
standard deviation,) and charts. ANOVA and correlation analysis were used to establish its
relationship and mean separation was done using Duncan multiple range tests.
Table 1: GPS Coordinate, Wind Speed, and Wind Direction of the Study Locations:
Stream water Latitude/
Elevation
Longitude/
Elevation
Time Windspeed
/Direction
Dominic Utuk stream N5o2’10.08’’/
5.03613
E7o56’25.74’’/
7.94049
8am 1m/s,4km/h-3mph
/ 250O(W)
Uyo village road stream N5o2’51.726’’/
5.04772
E7o 6’12.696’’/
7.93686
8.20 a.m 1m/s,6km/h-4mph
/ 227o (SW)
Control (Ntak Inyang) N5o4’51.174’’/
5.08088
E7o55’50.46.638/
7.92958
8.40 a.m 1m/s,5km/h-
3mph/107o (E)
RESULTS/FINDINGS
Determination of chemical characteristic of Whole microplastic resin in Uyo metropolis
Microplastics Ultimate assay in the surface stream water of Uyo metropolis
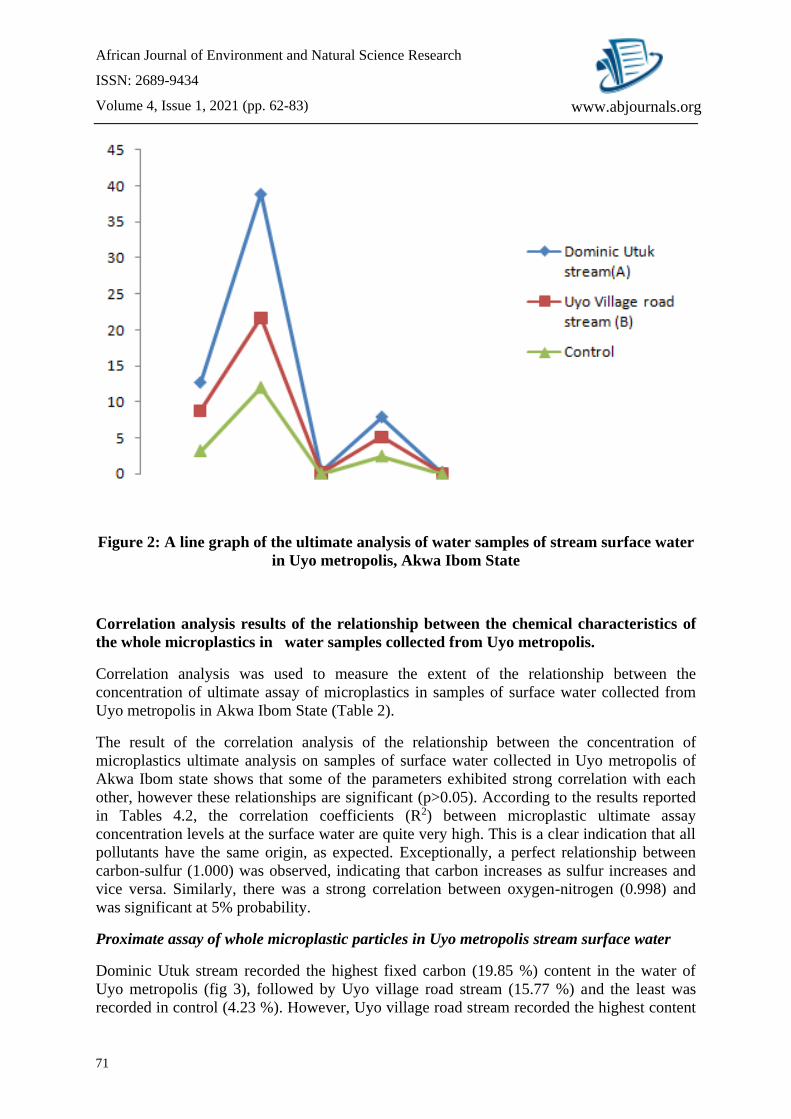
The chemical properties of the microplastics analyzed in the water showed that surface
stream water along Dominic Utuk avenue recorded the highest concentration of Carbon
(12.67%), followed by stream surface water at Uyo village road (8.78%) while the least
concentration (3.22%) was observed in a control (stream water at Ntak Inyang) (fig. 2). At
the same time, Dominic Utuk avenue surface stream water recorded the highest concentration
of Oxygen (38.89%), followed by Uyo village road stream water (21.67%) and control
recorded the least concentration (12.05%). Nitrogen content in the water recorded highest in
Dominic Utuk surface stream (0.38%), followed by Uyo village road (0.15%) while the least
concentration was recorded in the control sample (0.05%). Hydrogen content in Dominic
Utuk avenue stream water recorded highest (7.86%), followed by Uyo village road stream
water (5.18%) and control sample (2.45%). Moreover, in figure 2, Dominic Utuk Avenue
recorded highest Sulphur content (0.16%), followed by Uyo Village road stream (0.11%),
whereas the least was recorded in a control sample (0.03%) collected from Ntak Inyang
stream.
African Journal of Environment and Natural Science Research
ISSN: 2689-9434
Volume 4, Issue 1, 2021 (pp. 62-83)
71
www.abjournals.org
Figure 2: A line graph of the ultimate analysis of water samples of stream surface water
in Uyo metropolis, Akwa Ibom State
Correlation analysis results of the relationship between the chemical characteristics of
the whole microplastics in water samples collected from Uyo metropolis.
Correlation analysis was used to measure the extent of the relationship between the
concentration of ultimate assay of microplastics in samples of surface water collected from
Uyo metropolis in Akwa Ibom State (Table 2).
The result of the correlation analysis of the relationship between the concentration of
microplastics ultimate analysis on samples of surface water collected in Uyo metropolis of
Akwa Ibom state shows that some of the parameters exhibited strong correlation with each
other, however these relationships are significant (p>0.05). According to the results reported
in Tables 4.2, the correlation coefficients (R2) between microplastic ultimate assay
concentration levels at the surface water are quite very high. This is a clear indication that all
pollutants have the same origin, as expected. Exceptionally, a perfect relationship between
carbon-sulfur (1.000) was observed, indicating that carbon increases as sulfur increases and
vice versa. Similarly, there was a strong correlation between oxygen-nitrogen (0.998) and
was significant at 5% probability.
Proximate assay of whole microplastic particles in Uyo metropolis stream surface water
Dominic Utuk stream recorded the highest fixed carbon (19.85 %) content in the water of
Uyo metropolis (fig 3), followed by Uyo village road stream (15.77 %) and the least was
recorded in control (4.23 %). However, Uyo village road stream recorded the highest content

African Journal of Environment and Natural Science Research
ISSN: 2689-9434
Volume 4, Issue 1, 2021 (pp. 62-83)
72
www.abjournals.org
of Ash in the water, followed by Dominic Utuk avenue stream (1.03 %), and whereas, the
least was recorded in control samples collected at Ntak inyang stream. Concomitantly,
volatile matter content of the water recorded highest in Uyo village road stream, followed by
Dominic Utuk avenue stream (79.12 %) and the least was recorded in the control sample. In
figure 2, the highest residual content of microplastic in water was recorded in Dominic Utuk
avenue stream, followed by Uyo village road stream (0.71 %) and the list was recorded in the
control sample from Ntak Inyang stream.
Table 2: Correlation analysis result of the relationship between the ultimate assay in
samples of stream surface water collected from Uyo metropolis, Akwa Ibom State
CORRELATION % C % O % N % H % S
% C 1
% O 0.965 1
% N 0.948 0.998* 1
% H 0.995 0.986 0.974 1
% S 1.000* 0.957 0.937 0.992 1
*Correlation is significant at 0.05 percent
Table 3: Correlation analysis result of the relationship between the Whole Microplastics
proximate assays of sampled surface water collected from Akwa Ibom State
CORRELATION %Fixed
Carbon
% Ash %Volatile matter %Residual content
%Fixed Carbon
1
% Ash 0.681 1
%Volatile matter 0.957 0.865 1
%Residual content 0.999* 0.649 0.943 1
*Correlation is significant at 0.05 percent

African Journal of Environment and Natural Science Research
ISSN: 2689-9434
Volume 4, Issue 1, 2021 (pp. 62-83)
73
www.abjournals.org
Figure 3: A line graph of the proximate analysis of stream surface water samples in Uyo
metropolis, Akwa Ibom State
Correlation analysis was employed to measure the extent of the relationship between the
concentration of proximate assay of microplastics in samples of surface water collected from
Uyo metropolis in Akwa Ibom State and the result of the analysis is presented in Table 3.
The result of the correlation analysis of the relationship between the concentrations of
proximate assay parameters on samples of surface water collected in Uyo metropolis of
Akwa Ibom state shows that most of the proximate analysis parameters exhibited a strong
correlation with each other. However, some of these relationships were significant (P ≤ 0.05)
while others were not significant (P ≥ 0.05). According to the results reported in Tables 3, the
correlation coefficients (R2) between the parameters concentration levels at the surface water
are quite very high. This is a clear indication that all the parameters have the same origin.
However, these results showed that there was a strong correlation coefficient between Fixed
Carbon-Residual content were significant at 5% level, indicating strong positive correlations.
This implies that as fixed carbon increases, residual content increases and vice versa. Others
that were not significantly fixed carbon-ash (0.681), fixed carbon-volatile matter (0.957),
Ash-volatile matter (0.865), ash-residual content (0.649) and volatile matter-residual content
(0.943) show that the level of their occurrence was not as a result of other parameters but as a
result of their sources.
Determination of physical characteristic of Whole microplastic resin in Uyo metropolis
From figure 4, Uyo village road stream recorded the highest high heat value (14860KJ/g)
followed by Control sample (7320.00 KJ/g) and the least was recorded in the Dominic Utuk
stream (2134.00 KJ/g). However, Dominic Utuk stream recorded the highest moisture content
(24.87 %), followed by Uyo village (26.72 %) whereas the least was recorded in the control
sample (13.45 5). Moreover, the pH level of the resin recorded the highest value of 6.53 in

African Journal of Environment and Natural Science Research
ISSN: 2689-9434
Volume 4, Issue 1, 2021 (pp. 62-83)
74
www.abjournals.org
Uyo village road stream followed by Dominic Utuk road stream (6.34 ) and control sample
recorded the least (2.43).
Figure 4, showing physical parameters assessed from surface stream water microplastic
resin.
Correlation analysis was employed to measure the extent of the relationship between the
concentration of proximate assay of microplastics in samples of surface water collected from
Uyo metropolis in Akwa Ibom State (Table 4).
The result of the correlation analysis of the relationship between the concentration of
physical characteristics of the microplastics on samples of surface water collected from Uyo
metropolis in Akwa Ibom state shows that the parameters assessed exhibited strong
correlation with each other, however these relationships are not significant, indicating that the
level of occurrences of each of High heat value. Moisture content and pH in stream surface
water was not as a result of the presence of other nutrients but as a result of the various
sources from which these parameters entered the stream surface water in the study area.

African Journal of Environment and Natural Science Research
ISSN: 2689-9434
Volume 4, Issue 1, 2021 (pp. 62-83)
75
www.abjournals.org
Table 4: Correlation analysis result of the relationship between physical characteristics
of the whole microplastics in the samples of stream surface water collected from Uyo
metropolis.
CORRELATION HHV (KJ/g) %MOISTURE
CONTENT
pH
HHV (KJ/g) 1
%MOISTURE
CONTENT
0.820 1
pH 0.908 0.996 1
Water Microplastic Heavy metal and Anion concentration
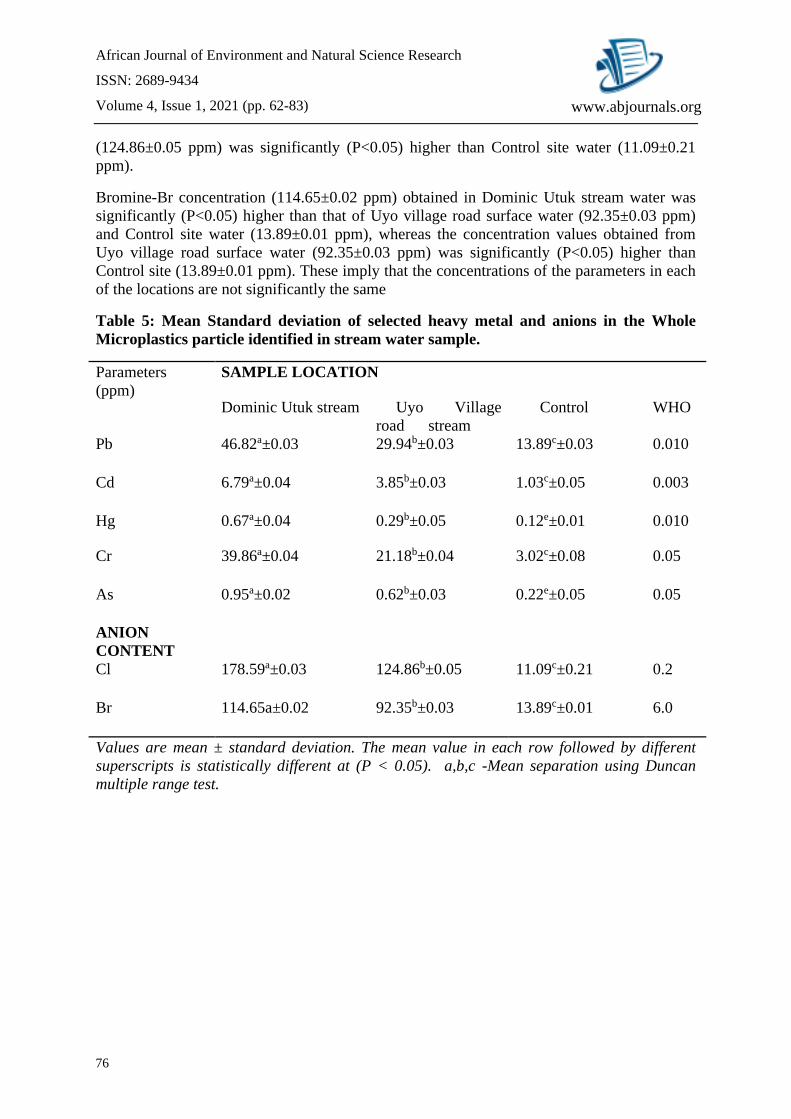
Heavy metal concentration in identified in Table 5 microplastic showed that, the value of
Lead-Pb concentration (46.82±0.03 ppm) obtained in Dominic Utuk stream surface water
was significantly (P<0.05) higher than the values obtained for Uyo village road surface water
(29.94±0.03 ppm) and Control site surface water (13.89±0.03 ppm), while the values
obtained for Uyo village road surface water (29.94±0.03 ppm) was significantly (P<0.05)
higher than Control (13.89±0.03 ppm).
Also, Cadmium- Cd concentration in Dominic Utuk stream surface water (6.79±0.04 ppm)
was significantly (P<0.05) higher than the values obtained for Uyo village road surface water
(3.85±0.03 ppm) and Control (1.03±0.05 ppm), while the values obtained for Uyo village
road surface water (3.85±0.03 ppm) was significantly (P<0.05) higher than control
(1.03±0.05 ppm).
Correspondingly, the Mercury-Hg+ value obtained from Dominic Utuk stream surface water
(0.67±0.04 ppm) was significantly (P<0.05) higher than the values obtained for Uyo village
road surface water (0.29±0.05 ppm) and Control site surface water (0.12±0.01 ppm), while
the values obtained for Uyo village road surface water (0.29±0.05 ppm) was significantly
(P<0.05) higher than Control (0.12±0.01 ppm).
Moreover, the value of Chromium-Cr obtained from Dominic Utuk stream water (39.86±0.04
ppm) was significantly higher than Uyo village road (21.18±0.04 ppm) and the control
(3.02±0.08 ppm). While Uyo village road value (21.18±0.04 ppm) was significantly higher
than the control site (3.02±0.08 ppm).
Arsenic-As concentration obtained from Dominic Utuk stream surface water (0.95±0.02
ppm) was significantly (P<0.05) higher than the values obtained for Uyo village road surface
water (0.62±0.03 ppm) and Control (0.22±0.05 ppm), while the values obtained for Uyo
village road surface water (0.62±0.03 ppm) was significantly (P<0.05) higher than Control
(0.22±0.05 ppm).
Concomitantly, Anion content in Table 5 shows that Chlorine-Cl+ concentration obtained
from Dominic Utuk stream surface water (178.59±0.03 ppm) was significantly (P<0.05)
higher than the values obtained for Uyo village road surface water (124.86±0.05 ppm) and
Control site (11.09±0.21 ppm), while the values obtained for Uyo village road surface water
African Journal of Environment and Natural Science Research
ISSN: 2689-9434
Volume 4, Issue 1, 2021 (pp. 62-83)
76
www.abjournals.org
(124.86±0.05 ppm) was significantly (P<0.05) higher than Control site water (11.09±0.21
ppm).
Bromine-Br concentration (114.65±0.02 ppm) obtained in Dominic Utuk stream water was
significantly (P<0.05) higher than that of Uyo village road surface water (92.35±0.03 ppm)
and Control site water (13.89±0.01 ppm), whereas the concentration values obtained from
Uyo village road surface water (92.35±0.03 ppm) was significantly (P<0.05) higher than
Control site (13.89±0.01 ppm). These imply that the concentrations of the parameters in each
of the locations are not significantly the same
Table 5: Mean Standard deviation of selected heavy metal and anions in the Whole
Microplastics particle identified in stream water sample.
Parameters
(ppm)
SAMPLE LOCATION
Dominic Utuk stream Uyo Village
road stream
Control WHO
Pb 46.82a±0.03 29.94b±0.03 13.89c±0.03 0.010
Cd 6.79a±0.04 3.85b±0.03 1.03c±0.05 0.003
Hg 0.67a±0.04 0.29b±0.05 0.12e±0.01 0.010
Cr 39.86a±0.04 21.18b±0.04 3.02c±0.08 0.05
As 0.95a±0.02 0.62b±0.03 0.22e±0.05 0.05
ANION
CONTENT
Cl 178.59a±0.03 124.86b±0.05 11.09c±0.21 0.2
Br 114.65a±0.02 92.35b±0.03 13.89c±0.01 6.0
Values are mean ± standard deviation. The mean value in each row followed by different
superscripts is statistically different at (P < 0.05). a,b,c -Mean separation using Duncan
multiple range test.

African Journal of Environment and Natural Science Research
ISSN: 2689-9434
Volume 4, Issue 1, 2021 (pp. 62-83)
77
www.abjournals.org
Table 6: Correlation analysis result of the relationship between the heavy metals of
whole microplastics in the samples of stream surface water collected from Uyo
metropolis, Akwa Ibom State
CORRELATION Pb Cd Hg Cr As Cl Br
Pb 1
Cd 1.00** 1
Hg 0.980 0.979 1
Cr 1.00** 1.00** 0.978 1
As 0.998* 0.998 0.963 0.998 1
Cl 0.976 0.997 0.913 0.978 0.989 1
Br 0.947 0.948 0.864 0.949 0.967 0.994 1
*Correlation is significant at 0.05 percent
Table 7: Contamination factors (CFs) and Pollution load index of heavy metals and
anions in the whole microplastics in water samples collected in AKS.
Parameters
(ppm)
Sample Locations
Dominic Utuk
stream
Uyo Village road stream
Pb 3.37 2.16
Cd 6.59 3.74
Hg 5.58 2.42
Cr 3.02 7.01
As 4.32 2.82
Contamination degree 22.88 18.15
Pollution Load Index (PLI) 201.044 98.293
ANIONS CONC.
16.10
11.26 Cl
Br 8.25 6.65
Pollution Load Index (PLI) 23.050 17.31
Contamination degree 24.35 17.91
Correlation analysis result as presented in Table 6 showed the relationship between the
concentration of heavy metal of microplastic polymer on samples of stream surface water
collected from Uyo metropolis in Akwa Ibom state shows that some of the heavy metal
element exhibited a perfect correlation with other and were significant at 5% probability
level while other heavy metal element also shows strong correlation with each other because
they were close to 1, however these relationships were not significant, indicating that the

African Journal of Environment and Natural Science Research
ISSN: 2689-9434
Volume 4, Issue 1, 2021 (pp. 62-83)
78
www.abjournals.org
level of occurrences of each of heavy metal element in the water samples of stream was not
as a result of the presence of other heavy metals or the reactivity between these heavy metals
but as a result of the sources from where these heavy metals enters the water bodies in the
study area. According to the result reported in Table 6, the correlation coefficients (R2)
between heavy metals concentration levels at the surface water that were highly perfect are
Lead-Cadmium relationship (1.00), Lead-Chromium (1.00), Cadmium-Chromium (1.00),
while strong relationship was observed for Lead-Arsenic (0.998) and they were all significant
at 0.05 % mean as one element increase, the other element increases too. Other relationships
exhibit strong correlation relationships but were not significant indicating that their source of
origin are the same as expected.
Contamination factors (CFs) and Pollution load index of heavy metals and anions
Table 7 shows the contamination factor/pollution index and pollution load index of heavy
metal and anions pollutant in stream water samples in Uyo metropolis. Pollution severity and
its variation along the sites were determined with the use of pollution index. Heavy metal
contamination factor in Dominic Utuk stream ranges between 3.37 – 6.59 ppm with the
overall degree of contamination level (22.88ppm) and pollution load index of 201.044ppm.
Uyo village road stream recorded heavy metal contamination factor which ranges from 2.16 –
7.01 ppm with 18.15 ppm degree of contamination and pollution load index of 98.293 ppm.
However, anion contamination factor in Table 7 shows that chlorine is recorded highest
(16.10 ppm) while bromine recorded the lowest (8.25 ppm) in Dominic Utuk stream with
degree of contamination (24.35 ppm) and pollution load index of 23.050. Uyo village road
stream recorded Cl contamination factor (11.26) as highest while bromine recorded the
lowest (6.65 ppm). The overall degree of contamination is17.91 ppm and pollution load index
(17.31 ppm)
DISCUSSIONS
The research study reveals the present concentration of microplastic particles (chemical and
physical properties) in the selected stream locations within Uyo metropolis of Akwa Ibom
State. Proximate and ultimate components of the microplastic representing physical and
chemical properties showed that ultimate properties of the particle Carbon, Oxygen,
Hydrogen, Nitrogen, Sulfur, in Dominic Utuk and uyo village road water course were higher
in concentration compared to the control site which was 500 meters away from the town.
High concentration entails great impact on the water quality. This may be attributed to the
chemical component used in the manufacturing process of plastic or microplastics. However,
these plastic particles get to the water and sometimes clog the water bank/ shores thereby
attracting or absorbing chemical substances from the atmosphere. Though this microplastic
takes time to disintegrate in the water but with the help of these atmospheric chemicals, this
helps in fastening up the breakdown process. During this process, the object sometimes can
absorb more elements like hydrogen, oxygen, sulfur from the water surface which may
contribute to higher concentration on its surface area. Correlation analysis between the
elements showed that the element exhibited strong and positive correlation between each
other and some relationships were perfectly correlated. The likes of carbon and sulfur
relationship which showed that that as one increases the other follows the same trend.

African Journal of Environment and Natural Science Research
ISSN: 2689-9434
Volume 4, Issue 1, 2021 (pp. 62-83)
79
www.abjournals.org
Proximate assay also reveals that fixed carbon, ash content, volatile matter, and residual
contents were higher in the two studied waters when compared to the control. This shows a
significant increase in the study object, this means that there is a huge impact on the water
body by indiscriminate waste disposal and may render the water unsafe for consumption.
Thomas (1992) stated that ash content shows a great influence by the heating value of the
microplastic. The ash content represents the part of the microplastics that will not combust
(Thomas, 1992). This content can be influenced by the high heating capability of the
microplastic recorded in the result. High heating values of the microplastic can yield high ash
content, when there is low moisture content and volatile matter.
Elements like fixed carbon which recorded (19.85, 15.77 %) from Uyo village road and
Dominic Utuk stream respectively and 4.23% from the control site showed that there is a high
amount of carbon in it and this correlates with the high Carbon content in ultimate assay. The
concentration of moisture content of the microplastics in the studied samples can be
attributed to the deposition of this microparticle of this plastic over time, some surfaces may
absorb water and other soluble agent some will not therefore the moisture content may
affected the caloric value of the plastic although, this is in contrary.
Correlation analysis also shows that they exhibited strong correlation with each other and
correlation coefficients were very high. Though some relationships were not significant at (P
≤ 0.05) but positive relationships indicate that they are from the same source.
Physical parameters such as High heating value (14860Kj/g) from Uyo village road stream
was higher than the control (7320.00kg/j) showing high presence of plastic material in the
water which can be used to generate another source of energy. There was a variation from
one of the study sites which has a lower high heating value of microplastic than the control.
These differences could be attributed to either the flowing current of the stream of the type of
thermoset present in the water. However, moisture content and pH level of the microplastic
did not follow the trend rather they were all of high amount in the studied stream when
compared to the control stream water. Since the microplastic particle was from the water, the
high moisture content and pH level (6.53) (acid in nature) could be as a result of absorption
of moisture from the water and other acidic chemicals from the atmosphere. Correlation
analysis showed not a significant relationship but they exhibited a positive, strong correlation.
This implies that the presence of one parameter cannot influence the increase of another
parameter.
Heavy metal such as lead, cadmium, mercury, chromium, and arsenic as represented in Table
5 in both Dominic Utuk stream and Uyo village road stream were of high concentration more
than the control stream site and also higher than the permissible limit by WHO. The presence
of these elements could be attributed to the additive used during the manufacturing process
and is in tandem with (Rochman, 2018) that heavy metals such as lead, cadmium and tin are
used in the manufacturing process which includes other things like catalysts, fillers, and
coloring agents, and can pose severe health risk to living organism. Similarly, anion content
(Chlorine and Bromine) from the two stream waters were higher than the control. The high
concentration of this chemicals poses danger to human health and it agrees with the findings
of (Tanaka, et al., 2013; Gallo, et al.,2018; Teuten, et al., 2009) that some additive substances
applied in manufacturing process of plastic, especially persistent organic pollutants (POPs)
which include brominated flame retardants and polychlorinated biphenyls (PCBs),
accumulate inside the tissue of organism( animals) and can transfer through the food web to

African Journal of Environment and Natural Science Research
ISSN: 2689-9434
Volume 4, Issue 1, 2021 (pp. 62-83)
80
www.abjournals.org
cause ailment. Also these chemical element recorded in the study can be linked to the
absorption process by the microplastic surface area, this agrees with (Teuten, et al., 2009) in
his work that, many pollutants like persistent organic pollutants (POPs) and heavy metals can
also adsorb or ‘stick’ to plastic surfaces for long time, as a result, this plastics particles
(microplastics) can act in form of a sponges in the environment, passively collecting
chemicals onto their surfaces area and possible absorbing them (Andrady,2011) also reported
that microplastics possessed a high surface area, giving way to many potential sites for
chemicals to bind and making them very good at concentrating chemical contaminants.
Therefore, these chemicals create major impacts on the water quality and may render it
unsafe for consumption. From the correlation point of view, the metals and anions exhibited
strong positive and perfect correlation with each other. Other relationships exhibit a strong
correlation but were not significant indicating that their sources are the same as expected as
seen in Table 6.
Moreover, from the contamination factor and pollution index analysis, these elements are
dangerous to the living organism consuming the water because they are higher in the two
streams compared to the control. The heavy metal and anions recorded in the stream surface
water as a result of additives in the plastic manufacturing process and packaging of toxic
chemicals like car battery breakdown and are discharged to the waterways through runoff.
IMPLICATION TO RESEARCH AND PRACTICE
Survey of microplastic particle chemical and physical parameters in the water of Uyo
metropolis showed a positive implication to research because it has revealed the bad actions
of humans to the environment as a result of indiscriminate waste disposal. The parameters
assessed put more light on the effect of the high present of microplastic in the environment. It
therefore opens more gaps on the research problems which need to be done in order to assess
the types of this polymer, the chemical composition and toxic chemicals attached to it. The
findings of this study proved that there is presence of microplastic in the stream water present
within the study area and proper monitoring should be done in order not to flow or move to
other locations. This will help regulate the usage and disposal in our environment.
CONCLUSION
Microplastic pollution causes harm to the communities and industries that use water from the
streams to support their livelihoods especially through contamination; damaging of aesthetic
view and intrinsic value and so on. The findings from this study conclude that, water ways,
water course of the Uyo metropolis is clogged with a high amount of microplastics especially
along the banks which are not physically seen at the distance. The analyzed microplastic
ultimate and proximate properties were higher compared to the control stream away from the
metropolis. This high amount can be attributed to the indiscriminate usage and disposal of
single use plastic in the area. And since it is an urban area full of many economic and social
activities, the presence of the microplastic substances may be linked to population growth and
urbanization. High calorific energy (high heating value) of the microplastic can be converted
to usable energy through recycling process and proper thermal treatment operation is

African Journal of Environment and Natural Science Research
ISSN: 2689-9434
Volume 4, Issue 1, 2021 (pp. 62-83)
81
www.abjournals.org
important to control emissions of these compounds. This could help reduce the quantity of
plastics disposed of. Heavy metal and anions concentration found in the microplastic are
dangerous to the aquatic species and could also affect the food web.
Future Research
Study findings recommend proper research on recycling, reuse of plastic materials rather than
disposal. Thermal treatment technology such as refuse derived fuel (RDF), power plant or
thermal depolymerization is recommended since the microplastic particles have high heating
value for energy conversion. The researcher also recommends that there should be more and
intensified legislation on the reduction of plastic usage and disposal to the environment.
Government should ensure plastic sorting from other debris when disposing or filling it.
REFERENCES
Anderson, A. G.; Grose, J., Pahl S.; Thompson, R.C.; Wyles. K. J. (2016). Microplastics in
personal care products: Exploring perceptions of environmentalists, beauticians and
students" (PDF)’’. Marine Pollution Bulletin 113(1–2): 454–460, 2016.
Andrady, A. L (2011). Microplastics in the marine environment’’. Marine Pollution Bulletin,
2011. 62(8): p. 1596–1605.
Association of Official Analytical Chemists (AOAC). (2000). Official Methods of Analysis
of AOAC International, 17th ed.; AOAC International: Gaithersburg, MD, USA, 2000.
ASTM, (2013). Annual book of ASTM standards, volume 05.06, Gaseous fuels; coal and
coke; catalysts; bioenergy and industrial chemicals from biomass. American Society for
Testing and Materials, 880 p 2013.
Babayemi, J. O. Ogundiran, M. B., Weber, R. Osibanjo, O. (2018). Initial Inventory of
Plastics Imports in Nigeria as a Basis for More Sustainable Management Policies”.
Journal of Health & Pollution Vol. 8, No. 1815pp, 2018.
BEC (2013) “Green paper: on a European strategy on plastic waste in the environment”.
Brussels: European Commission; 20 p, 2013.
Brunner, R.(1994). Hazardous Waste Incineration”, Mc. Graw- Hill International Editions,
pp 460 1994.
Crawford, C.B. and Quinn. B.(2017). Microplastic Collection Techniques, Microplastic
Pollutants’’, Elsevier pp. 179-202. 2017.
Durogbitan, A. (2019) Evaluation of Impact of Solid Wastes and Its Potential as ASource of
Renewable Energy. A Case Study from Minna and his Environs, Nigeria. Acta
Scientific Agriculture 3.5: 145-152 2019.
Etim N. A, Azeez A. A, Asa U. A (2006). Determinants of urban and peri-urban farming in
Akwa Ibom State, Nigeria. Global J. Agric. Sci.. 5(1) 13-16.
Etim, N. A. and Okom. S. (2013) Sources of technical efficiency among subsistence maize
farmers in Uyo, Nigeria. Discourse Journal of Agriculture and Food Scienc, Vol. 1 (4),
pp. 48-53, April 2013.
Etuk, S. E., Ebuka, O., and Edet, E. S. (2018). Spatial Distribution of Government and
Donor Organization Provided Public Water Facilities in Uyo Metropolis, Niger Delta
Region, Nigeria, Using Geographical Information System”. World Scientific News
WSN 94(2) (2018) 217-235, 2018.

African Journal of Environment and Natural Science Research
ISSN: 2689-9434
Volume 4, Issue 1, 2021 (pp. 62-83)
82
www.abjournals.org
Gallo, F. et al., (2018). Marine litter plastics and microplastics and their toxic chemicals
components: the need for urgent preventive measures. Environmental Sciences Europe,
2018. 30: p. 1–14.
Guan, Y., Shao, Ch., and Ju, M. (2014). Heavy metal contamination assessment and partition
for industrial and mining gathering areas”. International Journal of Environmental
Research and Public Health, 11, 7286–7303, 2014.
Harikumar, P. S., Nasir, U. P and Mujeebu Rahma, M. P. (2009). Distribution of heavy
metals in the core sediments of a tropical wetland system”, International Journal.
Environmental Science Technology, Vol. 6, No. 2, 2009, pp.225-232, 2009.
Hidalgo-Ruz, V. Gutow, L. Thompson, R. C. Thiel, M. (2012) Microplastics in the marine
environment: A Review of the methods used for identification and quantification.
Environ. Sci. Technol. 46, 3060–3075. 2012.
Ioakeimidis, C. Fotopoulou, K. N., Karapanagioti, H. K. Geraga, M.; Zeri, C.;
Papathanassiou, E.; Galgani, F. Papatheodorou, G. (2016) The degradation potential of
PET bottles in the marine environment: An ATR-FTIR based approach.. Scientific
Reports. 6: 23501. 2016. doi:10.1038/srep23501
Ituen, J. and Nyah, N. (2015). Flood Hazard Assessment And Decisions Support Using
Geographic Information System: A Case Study of Uyo Capital City, Akwa Ibom State,
Nigeria”. International Journal of Geography and Geology 2014 Vol. 3, No. 4, pp. 56-
67 ISSN(e): 2305-7041, 2015.
Ivleva, N. P. Natalia P.; Wiesheu, Alexandra C.; Niessner, Reinhard. (2017). Microplastic in
Aquatic Ecosystems". Angewandte Chemie International Edition. 56 (7): 1720–1739,
2017. doi:10.1002/anie.201606957
Koelmans, A. A., Besseling, E. and Foekema, E.M. (2014) Leaching of plastic additives to
marine organisms. Environmental Pollution, 2014. 187: p. 49–54.
Law; K. L. Morét-Ferguson S. E.; Goodwin D. S.; Zettler, Erik R.; Deforce, Emelia;
Kukulka, Tobias; G. Proskurowski. (2014). Distribution of Surface Plastic Debris in the
Eastern Pacific Ocean from an 11-Year Data Set". Environmental Science &
Technology. 48 (9): 4732–4738. 2014. doi:10.1021/es4053076
Mamun, S. A., Rahman, F., Yeasmin, F. and Islam, M. A. (2011). Suitability of the Physical
Properties of Soil for Crop Production: A Study in Tangail Sadar. J. Environ. Sci. &
Natural Resources, 4(2): 121-125, 2011. ISSN 1999-7361.
Merino, V. and Ayer, D. (2018). Plastic Pollution Primer & Action Toolkit. Earth Day
Network for the End Plastic Pollution Campaign, 2018. March 7th, 2018.pp 53, 2018.
https://www.earthday.org/wp-content/uploads/Plastic-Pollution-Primer-and-Action-
Toolkit.pdf
Othman, N. , N. E. A., N. M., Basri, Yunus, and l. M. Sidek, (2008). Determination of
physical and chemical characteristics of electronic plastic waste (EP-waste) resin using
proximate and ultimate analysis method”, in International Conference on Construction
and Building Technology. ICCBT 2008 - D - (16) – pp169-180. 2008.
Rochman, C. M. (2013) Ingested plastic transfers hazardous chemicals to fish and induces
hepatic stress”. Science Report 3:3263, 2013.
Song, Y. K. Han, G. M. Jang M. (2014) Large Accumulation of Micro-sized Synthetic
Polymer Particles in the Sea Surface Microlayer’’. Environ. Sci. Technol., 48, 9014–
9021. 2014.
Tanaka, K. et al., (2013). Accumulation of plastic-derived chemicals in tissues of seabirds
ingesting marine plastics. Marine Pollution Bulletin, 2013. 69(1–2): p. 219–222.

African Journal of Environment and Natural Science Research
ISSN: 2689-9434
Volume 4, Issue 1, 2021 (pp. 62-83)
83
www.abjournals.org
Teuten, E. L. et al (2009). Transport and release of chemicals from plastics to the
environment and to wildlife’’. Philosophical Transactions of the Royal Society B:
Biological Sciences, 2009. 364(1526): p. 2027–2045.
Thomas, L. (1992). Handbook of practical coal geology”: New York, Wiley, 338 p 1992.
Ukpong, I. E., (2009). Perspectives on Environmental Management. Uyo”. Environmental
Systems Club Inc. pp: 222-225. 2009.
Usoro E .J. and Akpan A. P. (2010) Akwa Ibom State, A geographical perspective”.
Immaculate Publications Ltd. Enugu: pp 654. 2010
Van Sebille, E. Wilcox, C. Lebreton, L.; Maximenko, Nikolai; Hardesty, Britta Denise; Van
Franeker, Jan A.; Eriksen, Marcus; Siegel, David; Galgani, Francois; Law, Kara
Lavender (2015). A global inventory of small floating plastic debris. Environmental
Research Letters. 10 (12): 124006. 2015 doi:10.1088/1748-9326/10/12
Varol, M. (2011). Assessment of heavy metal contamination in sediments of the Tigris River
(Turkey) using pollution indices and multivariate statistical techniques”. Journal of
Hazardous Materials, vol 195, 355–364, 2011.
Copyright © 2020 The Author(s). This is an Open Access article distributed under the terms
of Creative Commons Attribution-NonCommercial-NoDerivatives 4.0 International (CC BY-
NC-ND 4.0), which permits anyone to share, use, reproduce and redistribute in any medium,
provided the original author and source are credited.