Embed Size (px)
Citation preview
01HEALTH RISK ASSESSMENT GUIDANCE FOR METALS
HERAGASSESSMENT OF OCCUPATIONAL DERMAL EXPOSURE AND DERMAL ABSORPTION FOR METALS AND INORGANIC METAL COMPOUNDS
August 2007Check you have the most recent fact sheet by visiting www.metalsriskassessment.org
FACT SHEET
HERAG FACT SHEET Page 2 of 49 Occupational dermal exposure and dermal absorption
Table of contents
1. Introduction..............................................................................................................................................3
2. Dermal exposure .....................................................................................................................................5
2.1. Current EU models and concepts.......................................................................................................5 2.1.1. EASE............................................................................................................................................5 2.1.2. RISKOFDERM .............................................................................................................................6 2.1.3. DREAM ........................................................................................................................................6 2.1.4. TGD “analogous data”..................................................................................................................6
2.2. Dermal exposure – existing knowledge specific for metals and metal compounds ...........................8 2.2.1. Dermal exposure data based on the contaminating compound ................................................10 2.2.2. Dermal exposure data based on the analysed metal.................................................................11
2.3. Discussion and evaluation of currently available, recent dermal exposure data..............................12 2.3.1. Overview of dermal exposure studies for metals and metal compounds ..................................12 2.3.2. Comparison of dermal exposure studies based on EASE categories .......................................15
2.4. Dermal exposure – methodical aspects............................................................................................17 2.4.1. Sampling techniques..................................................................................................................17 2.4.2. Potential sampling artefacts relevant for the interpretation of results ........................................18
3. Dermal absorption.................................................................................................................................21
3.1. Current EU guidance and available models .....................................................................................21
3.2. Dermal absorption data for metals and their inorganic compounds .................................................22
3.3. Relevance of material bound in/on skin which is not released to receptor fluid during the study period .......................................................................................................................................................24
3.4. Dermal absorption – methodological aspects...................................................................................24 3.4.1. Current test methods..................................................................................................................24 3.4.2. Problems likely to be encountered when testing metals/compounds ........................................25 3.4.3. The EDETOX project .................................................................................................................25
4. Overall conclusions and recommendations.......................................................................................27
4.1. Assessment of occupational dermal exposure .................................................................................27
4.2. Dermal absorption for metals and inorganic metal compounds .......................................................30
5. References and abbreviations .............................................................................................................32
Appendix 1: Dermal absorption data for metals and metal compounds.............................................35
A 1.1. Zinc ................................................................................................................................................35
A 1.2. Copper ...........................................................................................................................................36
A 1.3. Nickel.............................................................................................................................................37
A 1.4. Lead...............................................................................................................................................37
A 1.5. Cobalt ............................................................................................................................................38
A 1.6. Aluminium......................................................................................................................................39
A 1.7. Cadmium .......................................................................................................................................39
A 1.8. Antimony........................................................................................................................................39
A 1.9. Titanium.........................................................................................................................................40
Appendix 2: Raw data (dermal exposure)...............................................................................................41
HERAG FACT SHEET Page 3 of 49 Occupational dermal exposure and dermal absorption
1. Introduction Uptake of metals through skin has been a major factor contributing to predicted risk in previous EU risk assessments, particularly when default model predictions of exposure were coupled with current guidance on defaults for dermal absorption (i.e. 10 %). Therefore, this fact sheet was compiled with the aim to provide guidance on how to assess occupational dermal exposure and how to measure and evaluate dermal absorption specifically for metals and their inorganic compounds. In this context, it is explicitly noted that organometallic compounds (i.e., chemical substances containing a covalent bond between carbon and the respective metal) are not considered in this fact sheet, since they clearly behave much differently, and have in several instances been shown to be readily taken up through skin. In contrast, inorganic metal compounds (which also include salts of metal cations with organic acids etc.) are required to dissociate in liquid media contaminating human skin prior to being available for percutaneous transfer. Dermal exposure With very few exceptions, there is currently very little published information on monitoring of dermal exposure for metals and their inorganic compounds. In contrast, the bulk of the now available dermal exposure data for metals was generated only very recently within EU RARs or VRA processes, usually in the form of unpublished reports which are not generally accessible to the scientific community. Thus, one of the objectives of this fact sheet is to summarise and evaluate these investigative efforts, and to put forward suggestions on future such efforts. As one of the consequences from the lack of measured dermal exposure data, model calculations have often been used in the past as an alternative in regulatory assessments. For EU Risk Assessments, extensive use has been made of the EASE
1 model, the validity of which is uncertain because the dermal
exposure part of EASE is a model that is partly based on experiments done with liquids in the USA and partly on expert judgement. Recently, the EU has funded the development of RISKOFDERM
2 to develop
a validated/benchmarked predictive model for estimating dermal exposure for use in generic risk assessment for single chemicals. Furthermore, RISKOFDERM also aims at being a practical dermal exposure risk assessment and management toolkit for use by small and medium-sized enterprises (SMEs) and others in actual workplace situations. The focus of this model is however primarily on downstream user scenarios, so that primary metal production and the industrial synthesis of inorganic compounds are not adequately covered by this model either. Finally, it has been noted that in current risk assessment reports increasing use is being made of “analogous” dermal exposure data rather than model data. For this purpose, either potential
3 dermal
exposure data on calcium carbonate (Lansink, 1996), or the only (to this date) publicly available data set on actual dermal exposure to zinc oxide (Hughson and Cherrie, 2002) have been used. For obvious reasons, it is necessary to understand whether it is appropriate to extrapolate from these data to all other metals, and based upon which argumentation. The following objectives were therefore set for this fact sheet and are discussed in chapters 2.1.-2.3.:
• To explore alternatives to EASE and RISKOFDERM models by exploiting existing monitoring data.
• To establish an “analogous” data base for inorganic metals compounds.
• To suggest a simple but realistic approach to assess dermal exposure for metals and metal compounds where there is little available data (required under REACH), by read across from existing data on another metal, or from data on a different compound of the same metal. For such read across, a set of criteria on which to base the choice of any analogous data set will be given.
Chapter 2.4 then focuses on methodological aspects of sampling techniques for dermal exposure, and also addresses potential artefacts that can be relevant for the interpretation of measured exposure data. 1 EASE: “Estimation and Assessment of Substance Exposure”, HSE (1999)
2 RISKOFDERM: van Hemmen et al. (2003)
3 Definitions: Potential exposure is measured with surrogate techniques such as patches, cotton gloves etc. outside the clothing and
any protective equipment. In contrast, actual exposure is measured by sampling any material that is actually deposited on the skin of a volunteer, e.g. by wipe-sampling, and is thus more reflective of practical workplace conditions.
HERAG FACT SHEET Page 4 of 49 Occupational dermal exposure and dermal absorption
Dermal absorption The second key factor in the assessment of risk from exposure of the skin is the correct quantification of the amount of the contaminant passing through the skin and thus actually entering the body. The correct assessment of uptake through skin has proved to be an essential feature of EU Risk Assessments for metals / metal compounds. In those cases where default model predictions of exposure were coupled with defaults for dermal absorption (i.e., 10 % or 100 % in total absence of experimental data) the risk assessments in their first drafts have attributed a relevance to this route of exposure that was later found to be inappropriate. One reason is that the TGD in its current version (2003, Part I, Chapter 2, Appendix IV B), in the case of lack of data, assigns default dermal absorption rates of 100 % or 10 % depending on the properties of a chemical substance, with an argumentation developed by de Heer (1999). Without relevant experimental data 10 % dermal absorption is used when the molecular weight (MW) of the substance is > 500 and the log Pow is smaller than -1 or higher than 4, otherwise 100 % dermal absorption is used.
Definition: the partition coefficient (P) is defined as the ratio of the equilibrium concentrations of a dissolved substance in a two-phase system consisting of two largely immiscible solvents. Most commonly used is the Pow, the partition coefficient for a substance between the solvents n-octanol and water. The partition coefficient, being the quotient of two concentrations, or the quotient of the fractions of the test substance in the two phases multiplied by a fixed volume ratio, is dimensionless and is usually given in the form of its logarithm to base ten (log Pow).
This current TGD approach to dermal absorption is conceived for organic chemical compounds, for which “there is evidence in the literature that substances with MW and/or log P values at these extremes can to a limited extent cross the skin.“ This concept is based on the hypothesis that an optimum in log Pow and a maximum in MW for facilitating percutaneous absorption exists. However, this approach is not considered particularly relevant for metals, for the following reasons:
• log Pow is a parameter that has no bearing whatsoever in the prediction of the properties of a metal or of an inorganic salt of a metal. This has already been recognised for organisms living in the environment, from which organic substances are transferred to biota via passive diffusion as predicted by Fick's Law. In contrast, most inorganic metal species do not permeate the membranes that separate organism from the external environment by passive diffusion. Instead, the uptake of metals largely depends on the presence of specific transport systems that provide biological gateways for the metal to cross the membrane.
• Conventional thinking on percutaneous transfer mechanisms assumes that dissolution of a compound is a prerequisite for subsequent (predominantly diffusion controlled) absorption mechanisms to take place. However, the dissolution of an inorganic metal compound or the metal itself on the skin surface will intrinsically require dissociation, and ultimately liberation of free metal cations.
• It is therefore obvious that the second criterion for assigning a dermal absorption rate (namely molecular weight) is irrelevant for metals, since under no circumstances is it feasible that any metal cation may exceed the cut-off value of “500“.
However, the TGD also provides for exemptions from its own rule as follows: "If data are available (e.g. data on water solubility, ionic state, ‘molecular volume’, oral absorption and dermal area dose in exposure situations in practice) which indicate the use of an alternative dermal absorption percentage value is appropriate, then this alternative value can be used. Scientific justification for the use of alternative values should be provided." Therefore, the aim of this fact sheet with respect to the correct assessment of dermal absorption is to
• collect available information on dermal absorption from previous risk assessments into a common document in order to investigate possible analogies between metals;
• where feasible, propose alternative default absorption factors, also considering dry vs. wet exposure conditions.
• if possible, provide more information on the nature of metal cations adhering to human skin and the relevance and availability of these for percutaneous transfer.
HERAG FACT SHEET Page 5 of 49 Occupational dermal exposure and dermal absorption
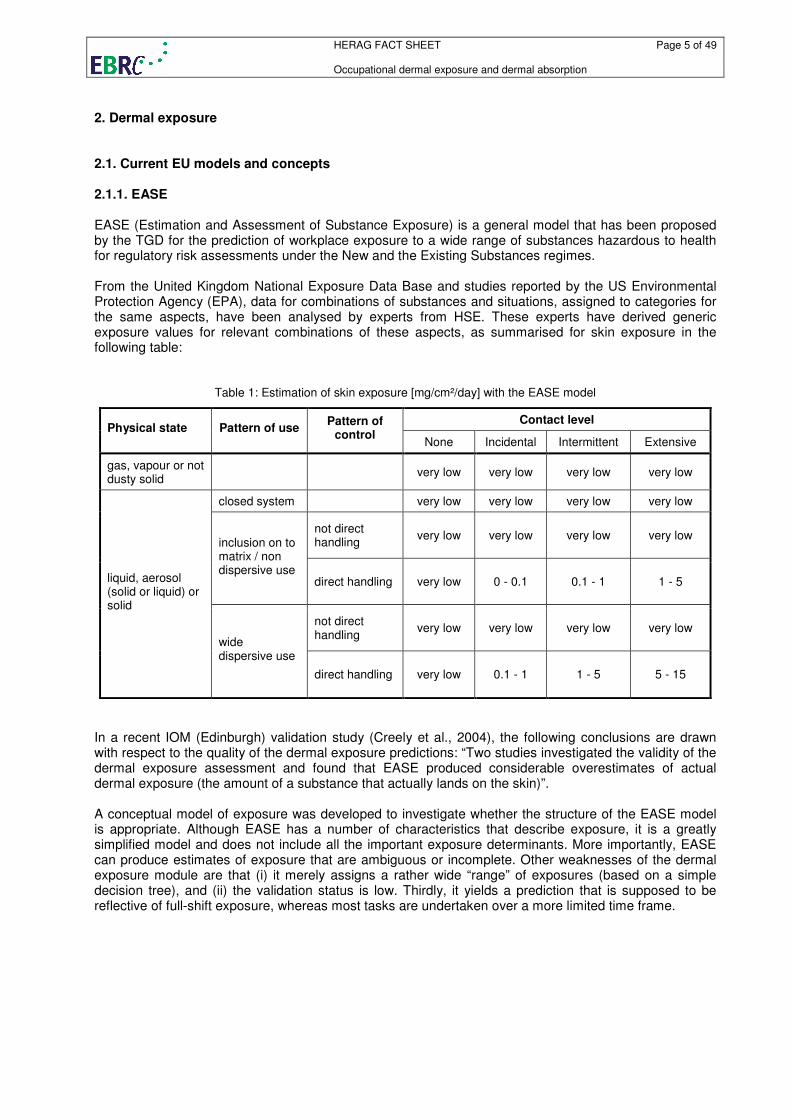
2. Dermal exposure 2.1. Current EU models and concepts 2.1.1. EASE EASE (Estimation and Assessment of Substance Exposure) is a general model that has been proposed by the TGD for the prediction of workplace exposure to a wide range of substances hazardous to health for regulatory risk assessments under the New and the Existing Substances regimes. From the United Kingdom National Exposure Data Base and studies reported by the US Environmental Protection Agency (EPA), data for combinations of substances and situations, assigned to categories for the same aspects, have been analysed by experts from HSE. These experts have derived generic exposure values for relevant combinations of these aspects, as summarised for skin exposure in the following table:
Table 1: Estimation of skin exposure [mg/cm²/day] with the EASE model
Contact level Physical state Pattern of use
Pattern of control
None Incidental Intermittent Extensive
gas, vapour or not dusty solid
very low very low very low very low
closed system very low very low very low very low
not direct handling
very low very low very low very low inclusion on to matrix / non dispersive use
direct handling very low 0 - 0.1 0.1 - 1 1 - 5
not direct handling
very low very low very low very low
liquid, aerosol (solid or liquid) or solid
wide dispersive use
direct handling very low 0.1 - 1 1 - 5 5 - 15
In a recent IOM (Edinburgh) validation study (Creely et al., 2004), the following conclusions are drawn with respect to the quality of the dermal exposure predictions: “Two studies investigated the validity of the dermal exposure assessment and found that EASE produced considerable overestimates of actual dermal exposure (the amount of a substance that actually lands on the skin)”. A conceptual model of exposure was developed to investigate whether the structure of the EASE model is appropriate. Although EASE has a number of characteristics that describe exposure, it is a greatly simplified model and does not include all the important exposure determinants. More importantly, EASE can produce estimates of exposure that are ambiguous or incomplete. Other weaknesses of the dermal exposure module are that (i) it merely assigns a rather wide “range” of exposures (based on a simple decision tree), and (ii) the validation status is low. Thirdly, it yields a prediction that is supposed to be reflective of full-shift exposure, whereas most tasks are undertaken over a more limited time frame.
HERAG FACT SHEET Page 6 of 49 Occupational dermal exposure and dermal absorption
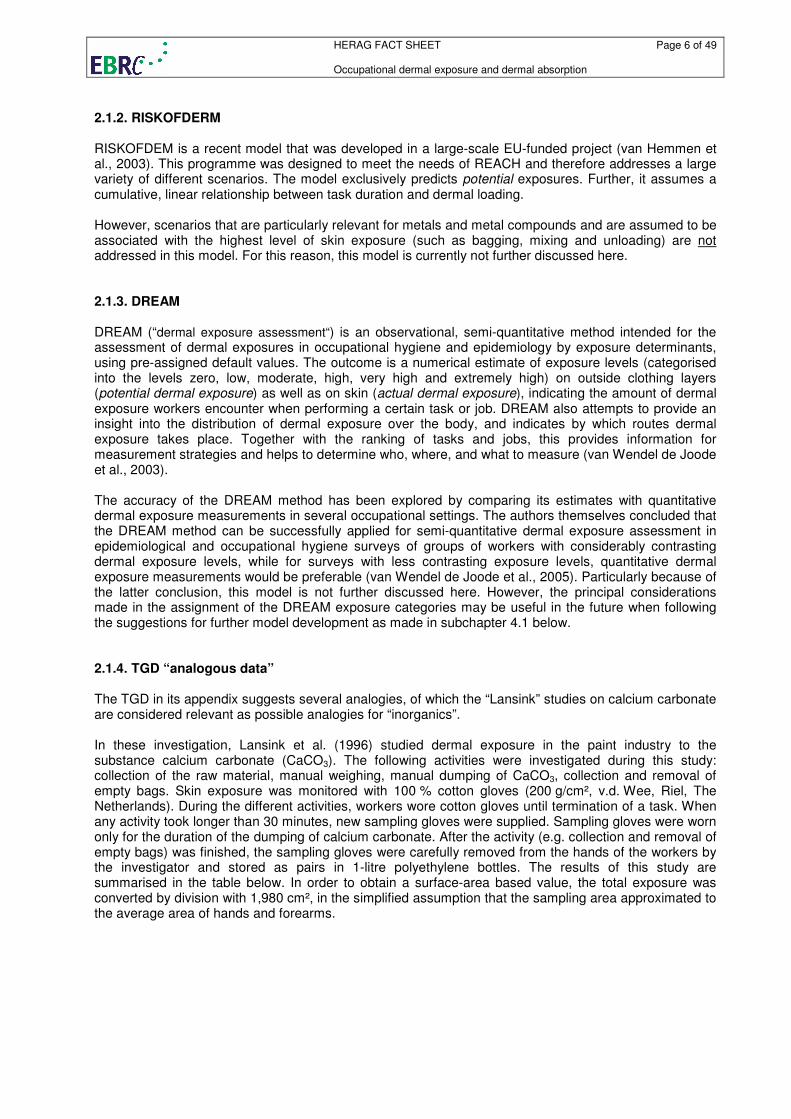
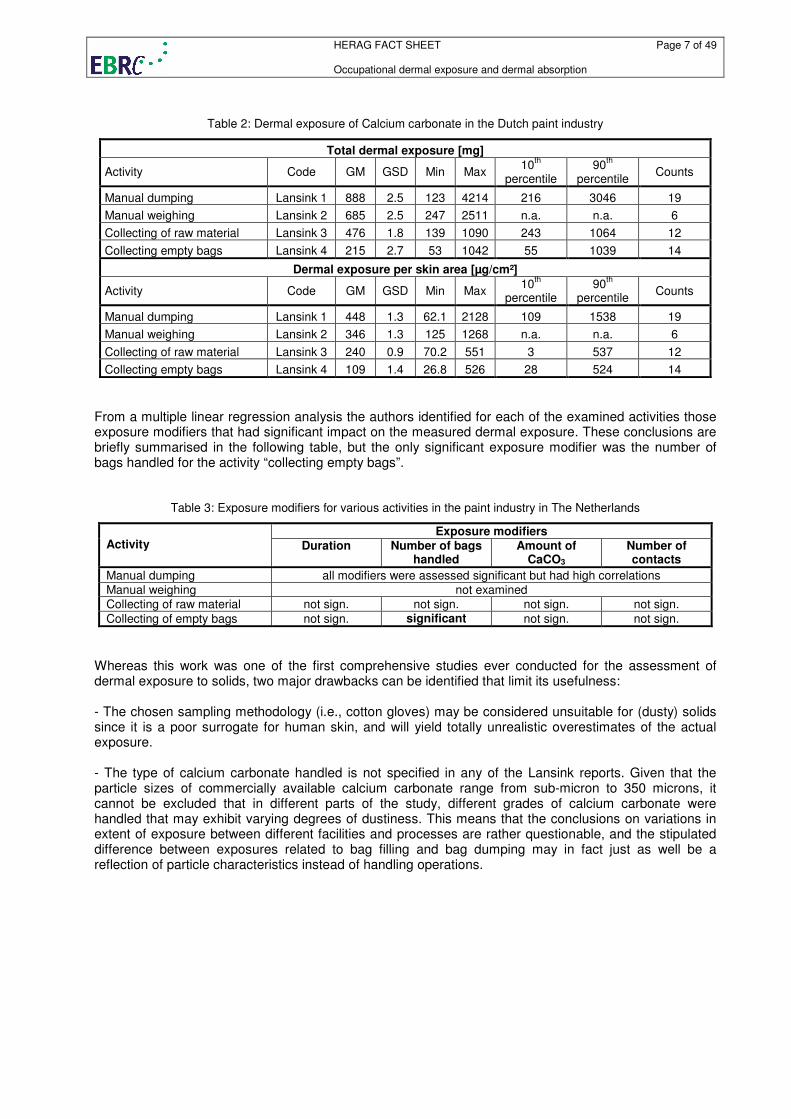
2.1.2. RISKOFDERM RISKOFDEM is a recent model that was developed in a large-scale EU-funded project (van Hemmen et al., 2003). This programme was designed to meet the needs of REACH and therefore addresses a large variety of different scenarios. The model exclusively predicts potential exposures. Further, it assumes a cumulative, linear relationship between task duration and dermal loading. However, scenarios that are particularly relevant for metals and metal compounds and are assumed to be associated with the highest level of skin exposure (such as bagging, mixing and unloading) are not addressed in this model. For this reason, this model is currently not further discussed here. 2.1.3. DREAM DREAM (“dermal exposure assessment“) is an observational, semi-quantitative method intended for the assessment of dermal exposures in occupational hygiene and epidemiology by exposure determinants, using pre-assigned default values. The outcome is a numerical estimate of exposure levels (categorised into the levels zero, low, moderate, high, very high and extremely high) on outside clothing layers (potential dermal exposure) as well as on skin (actual dermal exposure), indicating the amount of dermal exposure workers encounter when performing a certain task or job. DREAM also attempts to provide an insight into the distribution of dermal exposure over the body, and indicates by which routes dermal exposure takes place. Together with the ranking of tasks and jobs, this provides information for measurement strategies and helps to determine who, where, and what to measure (van Wendel de Joode et al., 2003). The accuracy of the DREAM method has been explored by comparing its estimates with quantitative dermal exposure measurements in several occupational settings. The authors themselves concluded that the DREAM method can be successfully applied for semi-quantitative dermal exposure assessment in epidemiological and occupational hygiene surveys of groups of workers with considerably contrasting dermal exposure levels, while for surveys with less contrasting exposure levels, quantitative dermal exposure measurements would be preferable (van Wendel de Joode et al., 2005). Particularly because of the latter conclusion, this model is not further discussed here. However, the principal considerations made in the assignment of the DREAM exposure categories may be useful in the future when following the suggestions for further model development as made in subchapter 4.1 below. 2.1.4. TGD “analogous data” The TGD in its appendix suggests several analogies, of which the “Lansink” studies on calcium carbonate are considered relevant as possible analogies for “inorganics”. In these investigation, Lansink et al. (1996) studied dermal exposure in the paint industry to the substance calcium carbonate (CaCO3). The following activities were investigated during this study: collection of the raw material, manual weighing, manual dumping of CaCO3, collection and removal of empty bags. Skin exposure was monitored with 100 % cotton gloves (200 g/cm², v.d. Wee, Riel, The Netherlands). During the different activities, workers wore cotton gloves until termination of a task. When any activity took longer than 30 minutes, new sampling gloves were supplied. Sampling gloves were worn only for the duration of the dumping of calcium carbonate. After the activity (e.g. collection and removal of empty bags) was finished, the sampling gloves were carefully removed from the hands of the workers by the investigator and stored as pairs in 1-litre polyethylene bottles. The results of this study are summarised in the table below. In order to obtain a surface-area based value, the total exposure was converted by division with 1,980 cm², in the simplified assumption that the sampling area approximated to the average area of hands and forearms.
HERAG FACT SHEET Page 7 of 49 Occupational dermal exposure and dermal absorption
Table 2: Dermal exposure of Calcium carbonate in the Dutch paint industry
Total dermal exposure [mg]
Activity Code GM GSD Min Max 10
th
percentile 90
th
percentile Counts
Manual dumping Lansink 1 888 2.5 123 4214 216 3046 19
Manual weighing Lansink 2 685 2.5 247 2511 n.a. n.a. 6
Collecting of raw material Lansink 3 476 1.8 139 1090 243 1064 12
Collecting empty bags Lansink 4 215 2.7 53 1042 55 1039 14
Dermal exposure per skin area [µg/cm²]
Activity Code GM GSD Min Max 10
th
percentile 90
th
percentile Counts
Manual dumping Lansink 1 448 1.3 62.1 2128 109 1538 19
Manual weighing Lansink 2 346 1.3 125 1268 n.a. n.a. 6
Collecting of raw material Lansink 3 240 0.9 70.2 551 3 537 12
Collecting empty bags Lansink 4 109 1.4 26.8 526 28 524 14
From a multiple linear regression analysis the authors identified for each of the examined activities those exposure modifiers that had significant impact on the measured dermal exposure. These conclusions are briefly summarised in the following table, but the only significant exposure modifier was the number of bags handled for the activity “collecting empty bags”.
Table 3: Exposure modifiers for various activities in the paint industry in The Netherlands
Exposure modifiers Activity Duration Number of bags
handled Amount of
CaCO3 Number of contacts
Manual dumping all modifiers were assessed significant but had high correlations Manual weighing not examined Collecting of raw material not sign. not sign. not sign. not sign.
Collecting of empty bags not sign. significant not sign. not sign.
Whereas this work was one of the first comprehensive studies ever conducted for the assessment of dermal exposure to solids, two major drawbacks can be identified that limit its usefulness: - The chosen sampling methodology (i.e., cotton gloves) may be considered unsuitable for (dusty) solids since it is a poor surrogate for human skin, and will yield totally unrealistic overestimates of the actual exposure. - The type of calcium carbonate handled is not specified in any of the Lansink reports. Given that the particle sizes of commercially available calcium carbonate range from sub-micron to 350 microns, it cannot be excluded that in different parts of the study, different grades of calcium carbonate were handled that may exhibit varying degrees of dustiness. This means that the conclusions on variations in extent of exposure between different facilities and processes are rather questionable, and the stipulated difference between exposures related to bag filling and bag dumping may in fact just as well be a reflection of particle characteristics instead of handling operations.
HERAG FACT SHEET Page 8 of 49 Occupational dermal exposure and dermal absorption
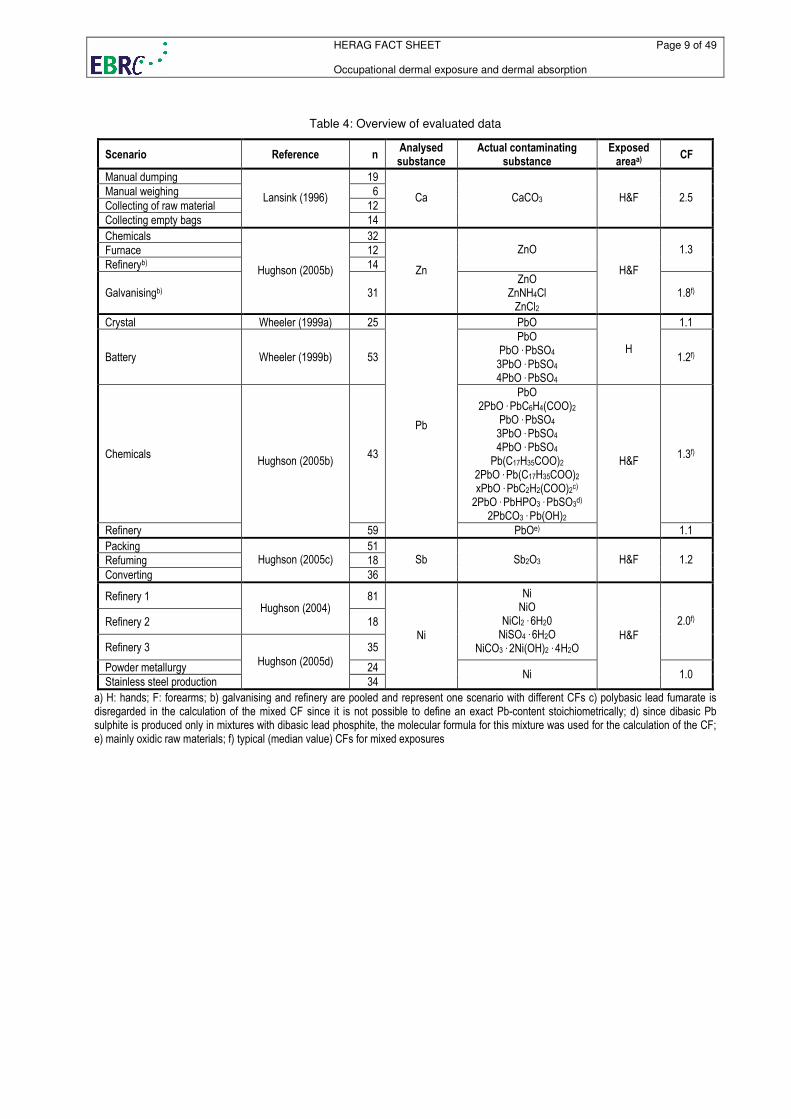
2.2. Dermal exposure – existing knowledge specific for metals and metal compounds Apart from the data presented here, the authors of this fact sheet are currently not aware of any other (unpublished) data available from industry sponsored dermal exposure studies. The majority of the data presented below in subchapters were all generated with the “wipe sampling” methodology, except for the two studies on lead (Wheeler 1999a/b) in which the “bag wash” method was used. For further details on sampling methodology please refer to subsection 2.4.1 below. Full access to all individual raw exposure data was given, which is why an adequate statistical analysis was possible. For completeness sake, it is explicitly noted that the bag wash method intrinsically only monitors the exposure of hands, whereas the wipe sampling technique may also be applied to other body areas such as the face and chest. In this document, we have focused on hands and forearms, which have consistently been shown to be the most heavily exposed areas under occupational circumstances. However, other areas of the body may have important exposure and should not be ignored. In some cases, data in the original report were provided for the contaminant compound (i.e., a certain metal compound like CaCO3 and Sb2O3), whereas in most cases (usually where mixed exposures occur), exposures were reported based on mass/cm² of “the metal” itself (e.g., exposure predominantly to ZnO but data reported as mass Zn/cm²). In order to achieve comparability between the different data sets, data is presented here both for (i) the compound to which a worker was actually exposed (chapter 2.2.1), and (ii) based on the respective metal itself (chapter 2.2.2). For the transformation of the analysed data into the contaminant of interest, for each scenario a conversion factor (CF) was applied, which represents the reciprocal value of the percentage of the analysed metal in the contaminant as shown below:
metalanalysedofweightatomic
substanceingcontaminatofweightmolecularCF =
For mixed exposures to various compounds, an equally weighted median value of all scenario factors was used under the assumption that all involved contaminating substances contribute equally to the dermal exposure:
( )n1n21 substancesubstancesubstancesubstanceexposuremixed CF,CF...,,CF,CFmedianCF
−= ,
where n is the number of substances involved in the mixed exposure scenario. The calculated conversion factors are shown below in table 4. The selection of contaminants was made based upon detailed knowledge of the technical and chemical process pertaining to the respective workplace scenarios and the predominant chemical contaminants present. The measured data sets are presented in separate sub-chapters as follows, to allow for a meaningful comparison between true mass loading rates when using these data for extrapolation purposes to “analogous compounds”: - in chapter 2.2.1, the a recalculation of the reported results (based partly on the metal itself, and partly on a specific contaminant such as Sb2O3) to the likely mass of actual contaminant in the workplace is given, and - in chapter 2.2.2, the available data are presented uniformly on the basis of recovered total “metal” per unit of exposed skin.
HERAG FACT SHEET Page 9 of 49 Occupational dermal exposure and dermal absorption
Table 4: Overview of evaluated data
Scenario Reference n Analysed substance
Actual contaminating substance
Exposed areaa)
CF
Manual dumping 19
Manual weighing 6
Collecting of raw material 12
Collecting empty bags
Lansink (1996)
14
Ca CaCO3 H&F 2.5
Chemicals 32
Furnace 12
Refineryb) 14
ZnO 1.3
Galvanisingb)
Hughson (2005b)
31
Zn ZnO
ZnNH4Cl ZnCl2
H&F
1.8f)
Crystal Wheeler (1999a) 25 PbO 1.1
Battery Wheeler (1999b) 53
PbO PbO . PbSO4 3PbO . PbSO4 4PbO . PbSO4
H 1.2f)
Chemicals 43
PbO 2PbO . PbC6H4(COO)2
PbO . PbSO4 3PbO . PbSO4 4PbO . PbSO4
Pb(C17H35COO)2 2PbO . Pb(C17H35COO)2 xPbO . PbC2H2(COO)2c) 2PbO . PbHPO3 . PbSO3
d)
2PbCO3 . Pb(OH)2
1.3f)
Refinery
Hughson (2005b)
59
Pb
PbOe)
H&F
1.1
Packing 51
Refuming 18
Converting
Hughson (2005c)
36
Sb Sb2O3 H&F 1.2
Refinery 1 81
Refinery 2 Hughson (2004)
18
Refinery 3 35
Ni NiO
NiCl2 . 6H20 NiSO4 . 6H2O
NiCO3 . 2Ni(OH)2 . 4H2O
2.0f)
Powder metallurgy 24
Stainless steel production
Hughson (2005d)
34
Ni
Ni
H&F
1.0
a) H: hands; F: forearms; b) galvanising and refinery are pooled and represent one scenario with different CFs c) polybasic lead fumarate is disregarded in the calculation of the mixed CF since it is not possible to define an exact Pb-content stoichiometrically; d) since dibasic Pb sulphite is produced only in mixtures with dibasic lead phosphite, the molecular formula for this mixture was used for the calculation of the CF; e) mainly oxidic raw materials; f) typical (median value) CFs for mixed exposures
HERAG FACT SHEET Page 10 of 49 Occupational dermal exposure and dermal absorption
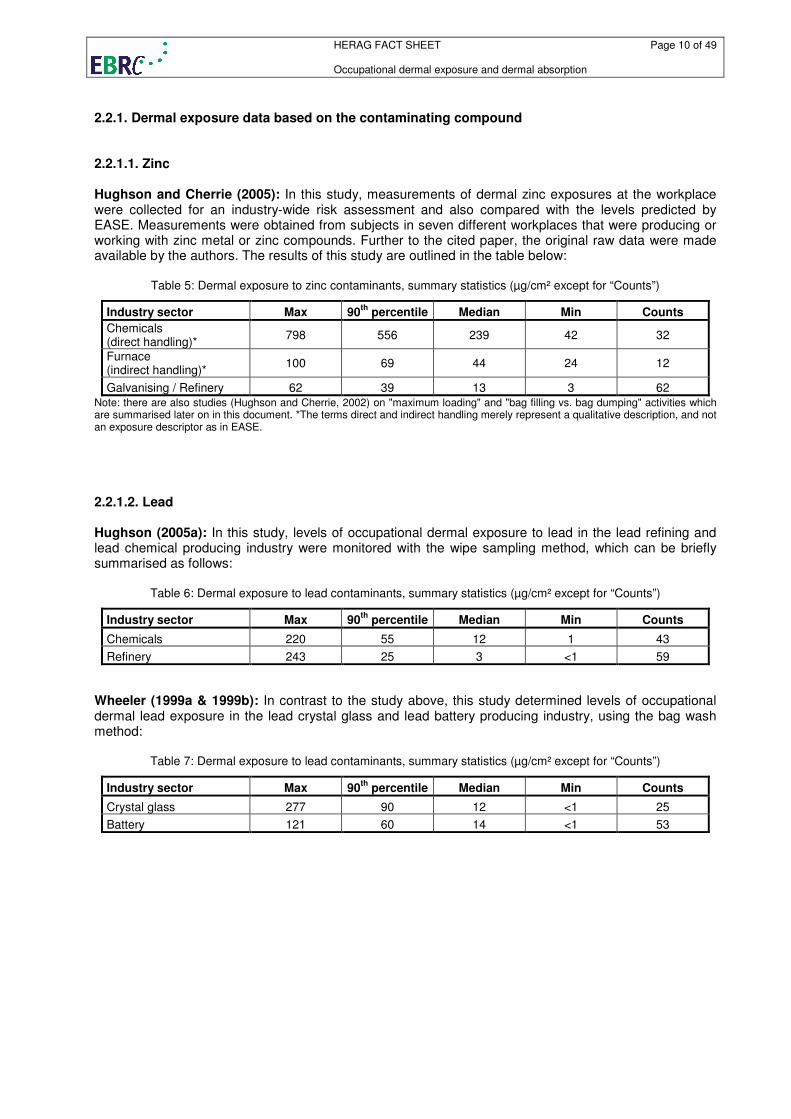
2.2.1. Dermal exposure data based on the contaminating compound 2.2.1.1. Zinc Hughson and Cherrie (2005): In this study, measurements of dermal zinc exposures at the workplace were collected for an industry-wide risk assessment and also compared with the levels predicted by EASE. Measurements were obtained from subjects in seven different workplaces that were producing or working with zinc metal or zinc compounds. Further to the cited paper, the original raw data were made available by the authors. The results of this study are outlined in the table below:
Table 5: Dermal exposure to zinc contaminants, summary statistics (µg/cm² except for “Counts”)
Industry sector Max 90th
percentile Median Min Counts
Chemicals (direct handling)*
798 556 239 42 32
Furnace (indirect handling)*
100 69 44 24 12
Galvanising / Refinery 62 39 13 3 62 Note: there are also studies (Hughson and Cherrie, 2002) on "maximum loading" and "bag filling vs. bag dumping" activities which are summarised later on in this document. *The terms direct and indirect handling merely represent a qualitative description, and not an exposure descriptor as in EASE.
2.2.1.2. Lead Hughson (2005a): In this study, levels of occupational dermal exposure to lead in the lead refining and lead chemical producing industry were monitored with the wipe sampling method, which can be briefly summarised as follows:
Table 6: Dermal exposure to lead contaminants, summary statistics (µg/cm² except for “Counts”)
Industry sector Max 90th
percentile Median Min Counts
Chemicals 220 55 12 1 43
Refinery 243 25 3 <1 59
Wheeler (1999a & 1999b): In contrast to the study above, this study determined levels of occupational dermal lead exposure in the lead crystal glass and lead battery producing industry, using the bag wash method:
Table 7: Dermal exposure to lead contaminants, summary statistics (µg/cm² except for “Counts”)
Industry sector Max 90th
percentile Median Min Counts
Crystal glass 277 90 12 <1 25
Battery 121 60 14 <1 53
HERAG FACT SHEET Page 11 of 49 Occupational dermal exposure and dermal absorption
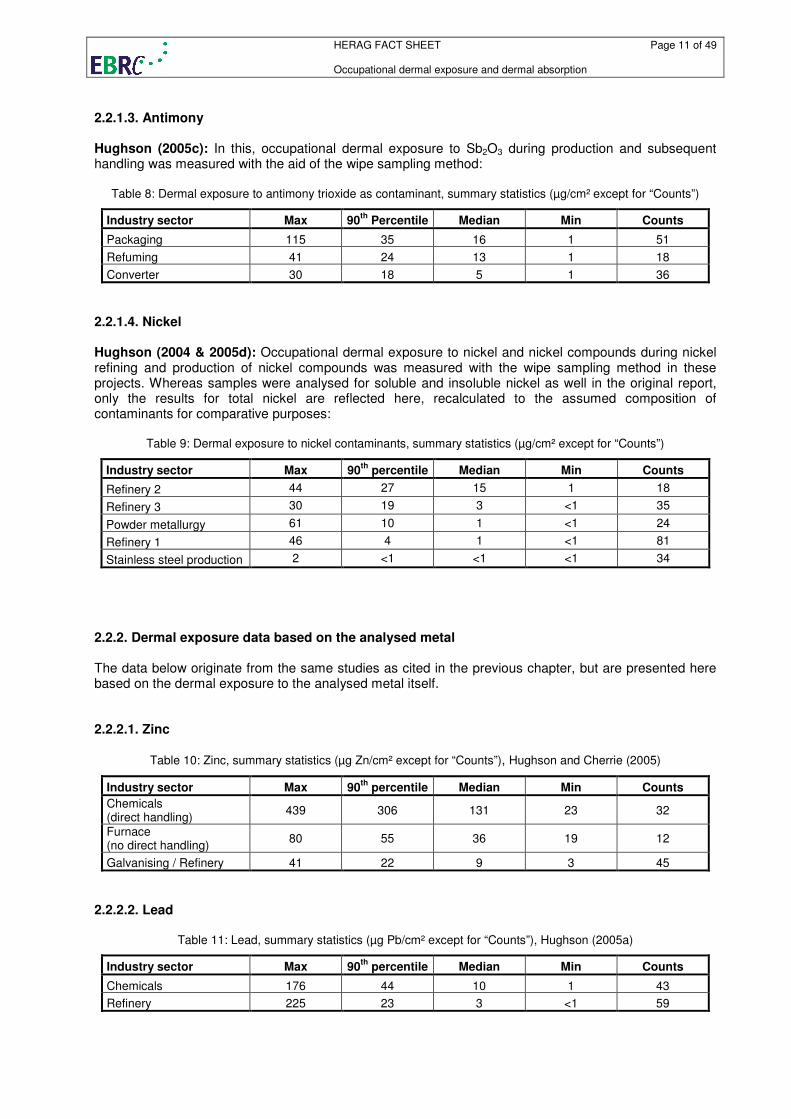
2.2.1.3. Antimony Hughson (2005c): In this, occupational dermal exposure to Sb2O3 during production and subsequent handling was measured with the aid of the wipe sampling method:
Table 8: Dermal exposure to antimony trioxide as contaminant, summary statistics (µg/cm² except for “Counts”)
Industry sector Max 90th
Percentile Median Min Counts
Packaging 115 35 16 1 51
Refuming 41 24 13 1 18
Converter 30 18 5 1 36
2.2.1.4. Nickel Hughson (2004 & 2005d): Occupational dermal exposure to nickel and nickel compounds during nickel refining and production of nickel compounds was measured with the wipe sampling method in these projects. Whereas samples were analysed for soluble and insoluble nickel as well in the original report, only the results for total nickel are reflected here, recalculated to the assumed composition of contaminants for comparative purposes:
Table 9: Dermal exposure to nickel contaminants, summary statistics (µg/cm² except for “Counts”)
Industry sector Max 90th
percentile Median Min Counts
Refinery 2 44 27 15 1 18
Refinery 3 30 19 3 <1 35
Powder metallurgy 61 10 1 <1 24
Refinery 1 46 4 1 <1 81
Stainless steel production 2 <1 <1 <1 34
2.2.2. Dermal exposure data based on the analysed metal The data below originate from the same studies as cited in the previous chapter, but are presented here based on the dermal exposure to the analysed metal itself. 2.2.2.1. Zinc
Table 10: Zinc, summary statistics (µg Zn/cm² except for “Counts”), Hughson and Cherrie (2005)
Industry sector Max 90th
percentile Median Min Counts
Chemicals (direct handling)
439 306 131 23 32
Furnace (no direct handling)
80 55 36 19 12
Galvanising / Refinery 41 22 9 3 45
2.2.2.2. Lead
Table 11: Lead, summary statistics (µg Pb/cm² except for “Counts”), Hughson (2005a)
Industry sector Max 90th
percentile Median Min Counts
Chemicals 176 44 10 1 43
Refinery 225 23 3 <1 59
HERAG FACT SHEET Page 12 of 49 Occupational dermal exposure and dermal absorption
Table 12: Lead, summary statistics (µg Pb/cm² except for “Counts”), Wheeler (1999a,b)
Industry sector Max 90th
percentile Median Min Counts
Crystal glass 256 84 11 <1 25
Battery 104 52 12 <1 53
2.2.2.3. Antimony
Table 13: Antimony, summary statistics (µg Sb/cm² except for “Counts”), Hughson (2005c)
Industry sector Max 90th
Percentile Median Min Counts
Packaging 96 29 13 1 51
Refuming 34 20 11 1 18
Converter 25 15 4 1 36
2.2.2.4. Nickel
Table 14: Nickel, summary statistics (µg Ni/cm² except for “Counts”), Hughson (2004 & 2005d)
Industry sector Max 90th
percentile Median Min Counts
Refinery 2 23 14 8 <1 18
Refinery 3 15 10 2 <1 35
Powder metallurgy 61 10 1 <1 24
Refinery 1 24 2 1 <1 81
Stainless steel production 2 <1 <1 <1 34
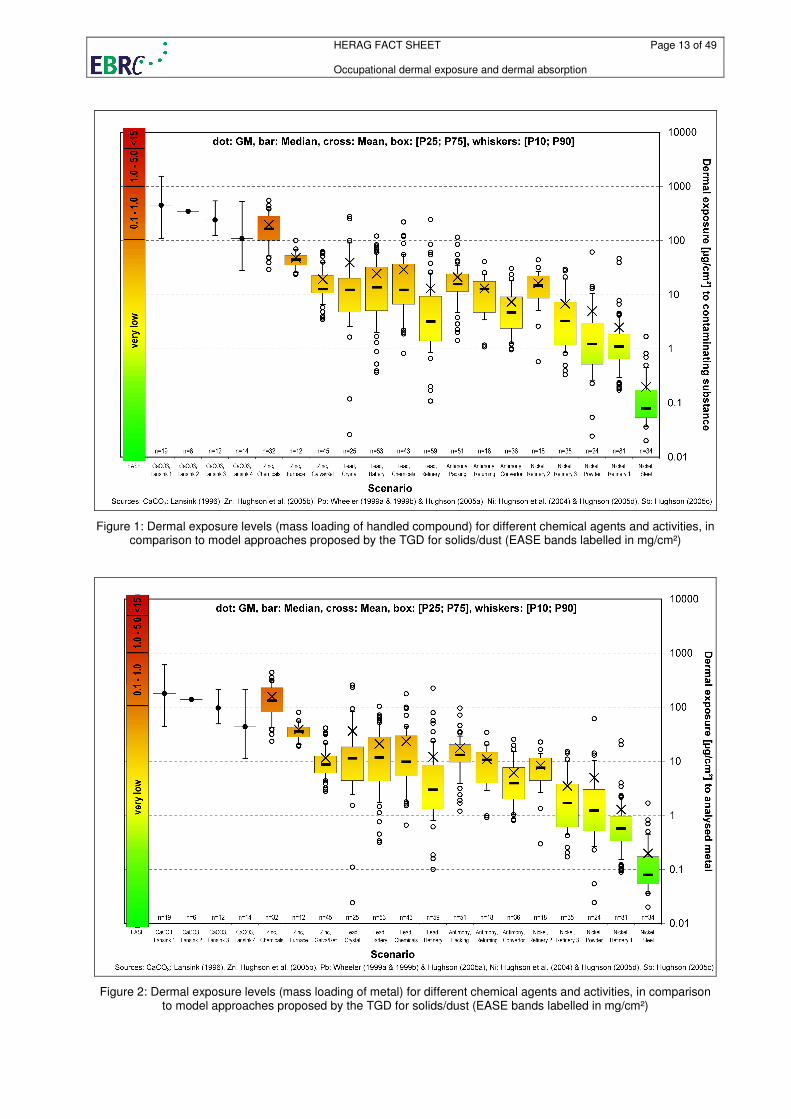
2.3. Discussion and evaluation of currently available, recent dermal exposure data 2.3.1. Overview of dermal exposure studies for metals and metal compounds The dermal exposure studies summarised above are presented graphically in the following figures on a logarithmical scale. For comparative reasons, the EASE prediction ranges for the exposure categories foreseen by the model (see Table 1) are given in the bar on the very left of the graph. All values represent full-shift, average exposure levels which include task-based data. Next, to the right of this bar, the ranges of dermal exposure during handling of calcium carbonate in the pigment industry are depicted, which are currently advocated as an “analogous” scenario in the TGD. Note that these represent potential exposures for the tasks manual dumping (Lansink 1), manual weighing (Lansink 2), collecting of raw material (Lansink 3), and collecting empty bags (Lansink 4). Finally, the ranges of actual dermal exposures measured in various zinc, lead, antimony and nickel industries are given. Figure 1 presents the data based on the mass per skin area of the actually handled substance, whereas Figure 2 shows the data based on the mass of the metal itself per skin area.
HERAG FACT SHEET Page 13 of 49 Occupational dermal exposure and dermal absorption
Figure 1: Dermal exposure levels (mass loading of handled compound) for different chemical agents and activities, in comparison to model approaches proposed by the TGD for solids/dust (EASE bands labelled in mg/cm²)
Figure 2: Dermal exposure levels (mass loading of metal) for different chemical agents and activities, in comparison to model approaches proposed by the TGD for solids/dust (EASE bands labelled in mg/cm²)
HERAG FACT SHEET Page 14 of 49 Occupational dermal exposure and dermal absorption
The following conclusions are drawn from the comparison of the various data sets: The exposures recorded for handling of CaCO3 are approximately one and three orders of magnitude above those for the contaminants in the other industries (with one exception only: ZnO production), a reflection of the fact that cotton gloves were used for sampling which is likely due to maximisation of the collection of material. The scenario of “zinc chemicals” refers to measurements of actual dermal exposure in the zinc oxide producing industry. There are no known adverse systemic or dermal health effects associated with this compound and it is therefore handled with very little protection against skin exposure, which is why exposures are general quite high. It is considered this situation may therefore be considered as a potential maximum exposure scenario under occupational conditions. We note that supplemental investigations have also been conducted which identified approx. 700 µg/cm² as a maximum dermal loading level for zinc oxide, obtained from measurements that involved volunteers immersing their hands in a bowl filled with the powder material. However, this level does not correspond to a realistic dermal “saturation” level under practical working conditions because repeated contacts with less contaminated surfaces will establish an equilibrium between (i) additional loading and (ii) losses. The majority of the other exposure scenarios (lead, nickel and zinc refineries, hot dip galvanizing, lead battery and glass production, and antimony trioxide production) are all either hot production processes or the potential adverse health risks from dermal exposure dictate the use of gloves, thus producing dermal exposures that are generally lower than for unprotected hands (such as in zinc oxide production). However, it should be noted that the gloves worn are usually of the “rigger” type and thus do not fulfil the requirements of chemical protective equipment designed to effectively minimise exposure. Finally, the utmost right box-and-whisker-plot reflects dermal exposures measured in a nickel refinery where nickel powders were packaged with fully automated machinery, so that direct handling of the materials or packaging does not occur, and any dermal loading therefore can only result from intermittent contacts with contaminated surfaces. A detailed comparison of these data sets with the EASE model is given in the following subchapter.
HERAG FACT SHEET Page 15 of 49 Occupational dermal exposure and dermal absorption
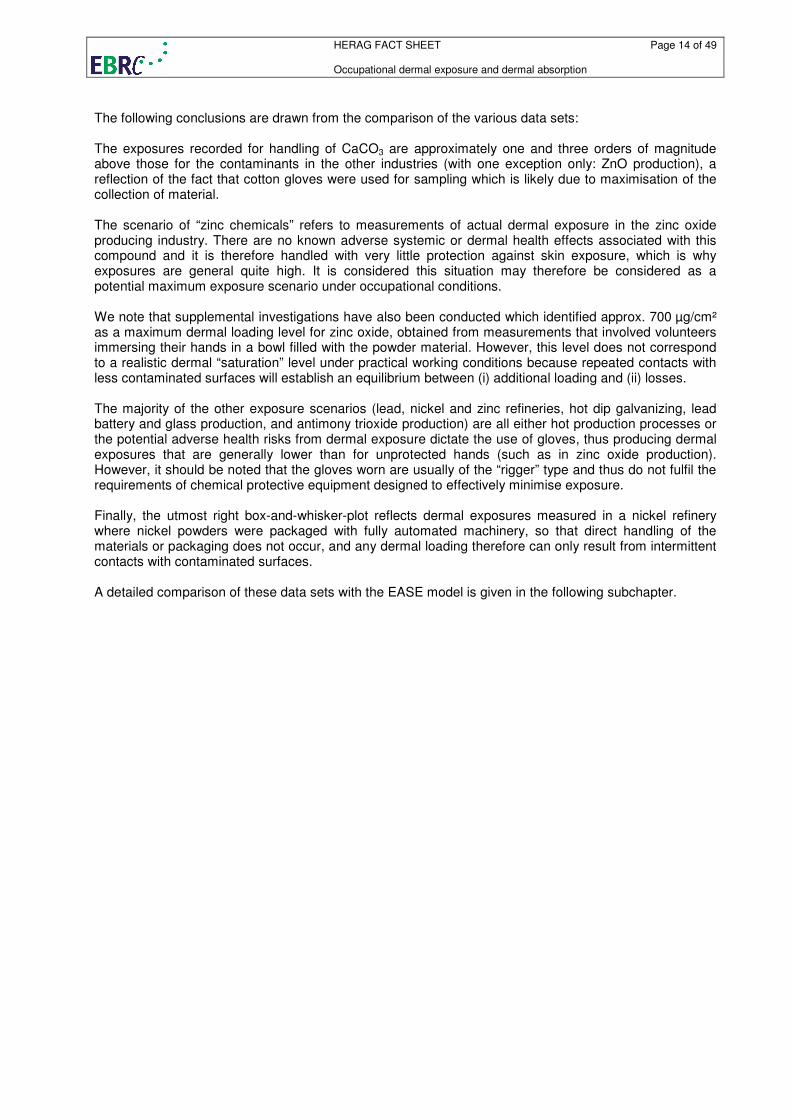
2.3.2. Comparison of dermal exposure studies based on EASE categories For comparative purposes with the EASE model, the measured task-based dermal exposure levels measured from the studies briefly summarised above can be classified according to the categories of the EASE model. The exposure descriptors relevant for the assessment of a dermal exposure range are explained in the legend to the table.
Table 15: Dermal exposure levels for different chemical agents and activities [µg/cm²]
Exposure Descriptors EASE
prediction Contaminant Metal
Scenario
PU PC CL Min Max
n
Typical P90 Typical P90
EASE 1 n.r. 1 n.r. very low
EASE 2 n.r. 2 1 very low
EASE 3 1&2&3 2 2 0 100
EASE 4 1&2&3 2 3 100 1000
EASE 5 1&2&3 2 4 1000 5000
EASE 6 4 2 2 100 1000
EASE 7 4 2 3 1000 5000
EASE 8 4 2 4 5000 15000
n.a.
CaCO3 1 4 2 2 100 1000 19 448* 1538 180* 247
CaCO3 2 n.d. n.a. 6 346* n.a. 139* 346*
CaCO3 3 n.d. n.a. 12 240* 537 96* 240*
CaCO3 4 n.d. n.a. 14 109* 524 43* 109*
Zinc 3 4 2 4 5000 15000 17 285 411 229 330
Zinc 2 4 2 3 1000 5000 27 64 130 52 105
Zinc 1 3 2 3 100 1000 39 15 38 9 21
Zinc 0 3 2 1 very low 6 11 11 33 7
Lead 2 3 2 4 1000 5000 103 14 75 12 67
Lead 1 3 2 3 100 1000 71 5 30 4 24
Lead 0 3 2 1 very low 6 1 1 2 1
Antimony 2 3 2 4 1000 5000 51 16 35 13 29
Antimony 1 3 2 3 100 1000 54 6 23 5 19
Nickel 2 3 2 4 1000 5000 33 7 25 4 13
Nickel 1 3 2 3 100 1000 159 1 5 1 3
n.r. = not relevant; n.a. = not applicable; n.d. = not determined; * = geometric mean EASE Exposure Descriptors:
Level Pattern of use (PU) Pattern of control (PC) Contact level (CL)
1 closed system not direct handling none
2 inclusion onto matrix direct handling incidental
3 non-dispersive use - intermittent 4 wide dispersive use - extensive
Comparison of EASE-predictions with measured dermal exposure value: The following table summarises the median values for the contaminating substance from the dermal exposure data bases (allocated to EASE categories), and also lists the median for the EASE-predicted exposure interval. For example, for wide dispersive use and an extensive contact level, EASE predicts a potential exposure of 5000-15,000 µg/cm²/day. For further calculations, the median of these interval limits (i.e. 10000 µg/cm²/day in this case) is used. A corresponding presentation of these results based on the analysed metal was not considered to be meaningful, because the mass of actual contaminant per unit surface area of skin is in fact the relevant model in- and output.

HERAG FACT SHEET Page 16 of 49 Occupational dermal exposure and dermal absorption
Table 16: EASE predictions (median of interval limits) vs. measured values (median values) [µg/cm²], based on
contaminating substance
Use pattern, contact level EASE prediction*
Zinc Lead Antimony Nickel
wide dispersive, extensive 10,000 285 - - - wide dispersive, intermittent; non-dispersive, extensive
3,000 64 14 16 7
non-dispersive, intermittent 550 15 5 6 1
A graphical presentation of this comparison of measured data with EASE predictions for activities with corresponding use patterns and contact levels is provided in the figure below (the mean values are depicted as horizontal bars).
Use pattern: wide and non-dispersive use; contact level (direct handling): inc=incidental, int=intermittent, ext = extensive
Figure 3: Dermal exposure levels for different chemical agents and activities, in comparison to EASE predictions, based on the contaminating substance
Based on this comparison of median values for each EASE category, ratios for the respective median values were calculated, demonstrating that EASE consistently over-predicts dermal exposure to metals and their inorganic compounds. For example, for wide dispersive use and extensive contact with a substance, EASE predicts a median exposure of 10,000 µg/cm². In contrast, at a workplace where a zinc compound was used dispersively and extensive contact occurred, the actually measured median exposure was 285 µg/cm². In this case, EASE over-predicts the actual exposure by the factor 35 (see Table 17 for further examples): Table 17: Extent of EASE over-prediction (ratio median EASE / measured value) based on contaminating substance
Use pattern, contact level Zinc Lead Antimony Nickel
wide dispersive use, extensive 35 - - - wide dispersive use, intermittent; non-dispersive use, extensive
47 214 188 429
non-dispersive use, intermittent 37 110 92 550
HERAG FACT SHEET Page 17 of 49 Occupational dermal exposure and dermal absorption
It is worthy of note that the comparisons presented above show that the level of over-prediction differs between metals, and may be interpreted as a reflection of increasing level of controls in place due to the inherent hazard of dermal exposure to these metals. The ratios within each of the three EASE categories is similar, implying that the EASE model captures some of the factors that determine exposure – only the levels of exposure that form the basis of it’s predictions are obviously inappropriate. 2.4. Dermal exposure – methodical aspects 2.4.1. Sampling techniques 2.4.1.1. Potential exposure Potential dermal exposure is commonly measured using techniques such as: (i) cotton gloves, (ii) patches, or (iii) fluorescent tracers outside the clothing and any personal protective equipment. Patches are likely to interfere with intricate work and become damaged if attached to the hands, but patches attached to any other region of the body are not likely to represent skin contact with the fabric adequately. Fluorescent tracers may be impractical to investigate workers with heavy mechanical work. Cotton gloves (as used in the experiments described by Lansink, 1996) are often employed in the monitoring of low levels of exposure to viscous low volatility liquids. Due to the porous nature of the fabric, they are intrinsically a poor surrogate for human skin, and are likely to over-estimate exposure compared wipe-sampling or bag-washing methods, particularly in conditions of exposure to dust. 2.4.1.2. Actual exposure Actual exposure is reflective of the amount of material that is recoverable from real skin under workplace conditions (measured under the clothing or any personal protective equipment). Two techniques have been used to date for such dermal sampling of metals or metal compounds: (i) a bag-washing method, and (ii) a moist wipe method. Bag-wash method: This method is based on the practice of requiring a volunteer to immerse his/her hand in a foil bag containing a suitable washing liquid, and shaking this for a pre-determined period. Laboratory experiments have indicated a recovery efficiency of over 85% for this method (Wheeler, 1997). This methodology has been used, for example, in the dermal exposure monitoring in various lead downstream user industries (Wheeler et al., 1999a/b). An obvious draw-back is that other relevant areas of the body do not lend themselves to this kind of sampling. Wiping methods: This technique has been successfully used and validated for dermal exposure monitoring in the nickel, lead, zinc and antimony trioxide industry (various studies by Hughson et al., see references). Samples are taken from various regions of the body using wet wipes. It is practicable to measure exposure on the hands, the inside of the forearms, the forehead, the neck and the chest (to assess the degree of contamination under the work clothes) or any other anatomical area of interest. The sampled surface is limited by using an acetate template with a cut-out of a defined size, and three consecutive wipes, which has been shown to give reasonable recovery efficiency. Samples are taken before every break to ensure that no contamination is lost when subjects wash their hands. Field blanks are collected in order to check for adventitious contamination. The available methods are summarised with their advantages and limitations in the following table given in an OECD guidance document (OECD, 1997):
HERAG FACT SHEET Page 18 of 49 Occupational dermal exposure and dermal absorption
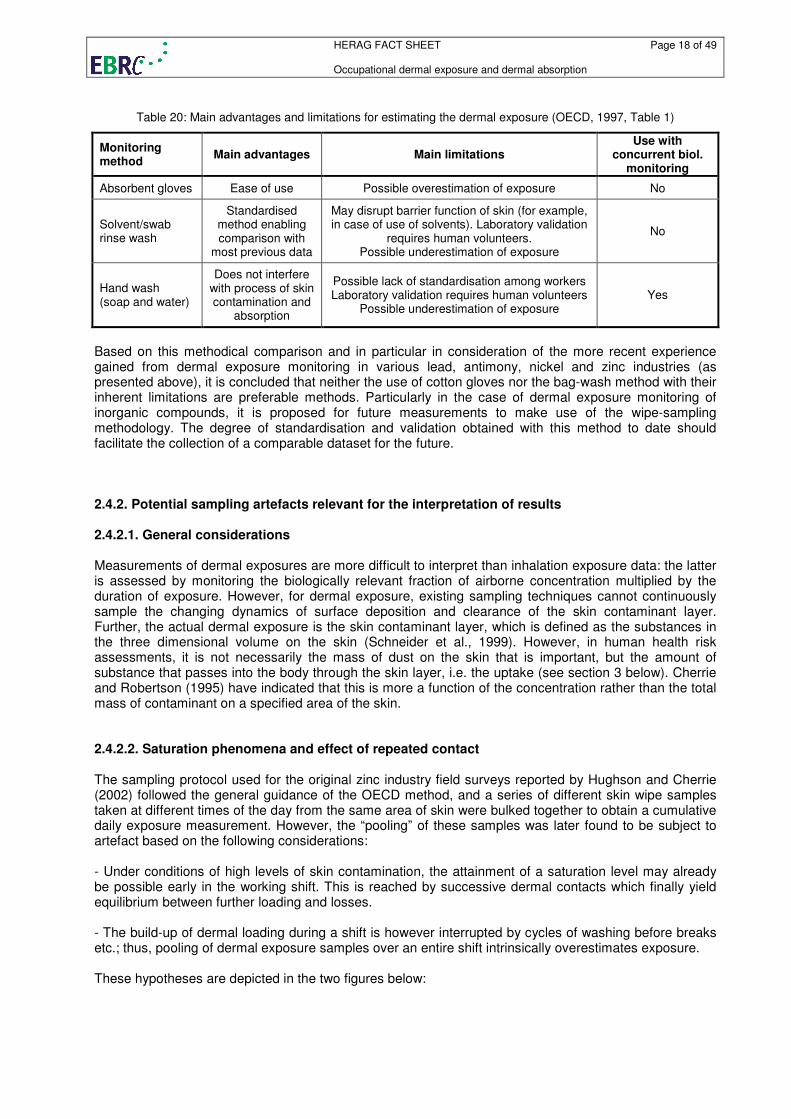
Table 20: Main advantages and limitations for estimating the dermal exposure (OECD, 1997, Table 1)
Monitoring method
Main advantages Main limitations Use with
concurrent biol. monitoring
Absorbent gloves Ease of use Possible overestimation of exposure No
Solvent/swab rinse wash
Standardised method enabling comparison with
most previous data
May disrupt barrier function of skin (for example, in case of use of solvents). Laboratory validation
requires human volunteers. Possible underestimation of exposure
No
Hand wash (soap and water)
Does not interfere with process of skin contamination and
absorption
Possible lack of standardisation among workers Laboratory validation requires human volunteers
Possible underestimation of exposure Yes
Based on this methodical comparison and in particular in consideration of the more recent experience gained from dermal exposure monitoring in various lead, antimony, nickel and zinc industries (as presented above), it is concluded that neither the use of cotton gloves nor the bag-wash method with their inherent limitations are preferable methods. Particularly in the case of dermal exposure monitoring of inorganic compounds, it is proposed for future measurements to make use of the wipe-sampling methodology. The degree of standardisation and validation obtained with this method to date should facilitate the collection of a comparable dataset for the future. 2.4.2. Potential sampling artefacts relevant for the interpretation of results 2.4.2.1. General considerations Measurements of dermal exposures are more difficult to interpret than inhalation exposure data: the latter is assessed by monitoring the biologically relevant fraction of airborne concentration multiplied by the duration of exposure. However, for dermal exposure, existing sampling techniques cannot continuously sample the changing dynamics of surface deposition and clearance of the skin contaminant layer. Further, the actual dermal exposure is the skin contaminant layer, which is defined as the substances in the three dimensional volume on the skin (Schneider et al., 1999). However, in human health risk assessments, it is not necessarily the mass of dust on the skin that is important, but the amount of substance that passes into the body through the skin layer, i.e. the uptake (see section 3 below). Cherrie and Robertson (1995) have indicated that this is more a function of the concentration rather than the total mass of contaminant on a specified area of the skin. 2.4.2.2. Saturation phenomena and effect of repeated contact The sampling protocol used for the original zinc industry field surveys reported by Hughson and Cherrie (2002) followed the general guidance of the OECD method, and a series of different skin wipe samples taken at different times of the day from the same area of skin were bulked together to obtain a cumulative daily exposure measurement. However, the “pooling” of these samples was later found to be subject to artefact based on the following considerations: - Under conditions of high levels of skin contamination, the attainment of a saturation level may already be possible early in the working shift. This is reached by successive dermal contacts which finally yield equilibrium between further loading and losses. - The build-up of dermal loading during a shift is however interrupted by cycles of washing before breaks etc.; thus, pooling of dermal exposure samples over an entire shift intrinsically overestimates exposure. These hypotheses are depicted in the two figures below:
HERAG FACT SHEET Page 19 of 49 Occupational dermal exposure and dermal absorption
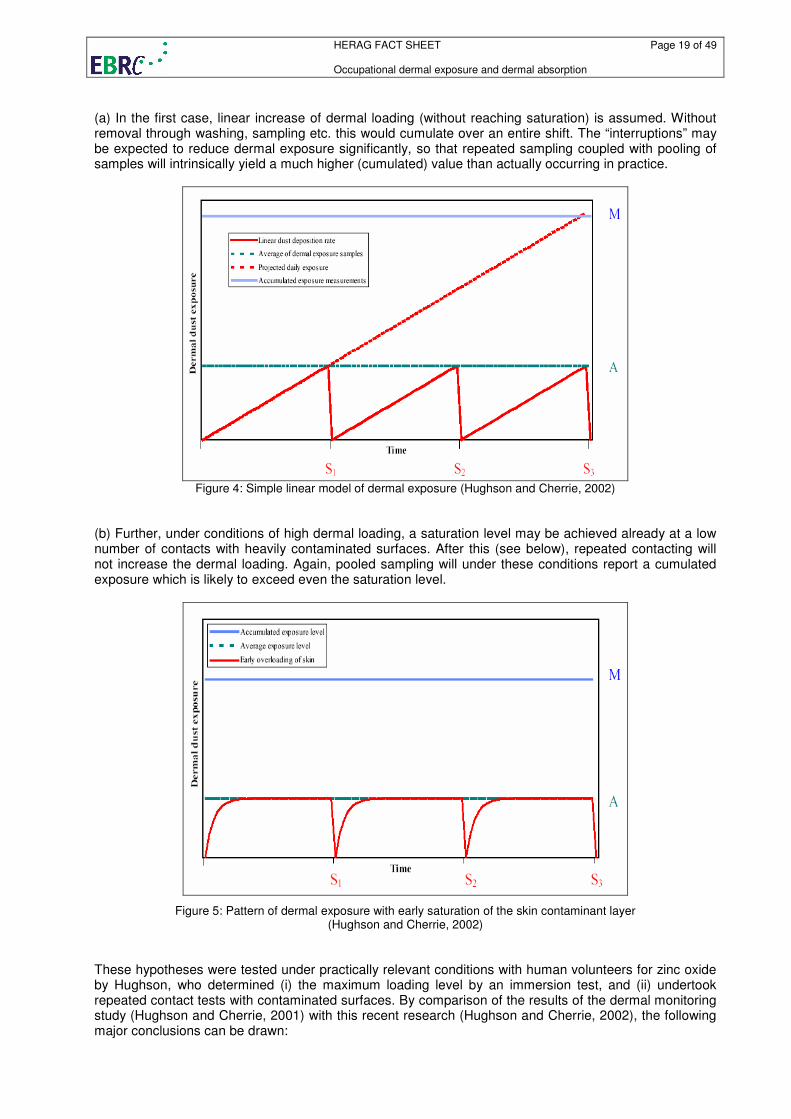
(a) In the first case, linear increase of dermal loading (without reaching saturation) is assumed. Without removal through washing, sampling etc. this would cumulate over an entire shift. The “interruptions” may be expected to reduce dermal exposure significantly, so that repeated sampling coupled with pooling of samples will intrinsically yield a much higher (cumulated) value than actually occurring in practice.
Figure 4: Simple linear model of dermal exposure (Hughson and Cherrie, 2002)
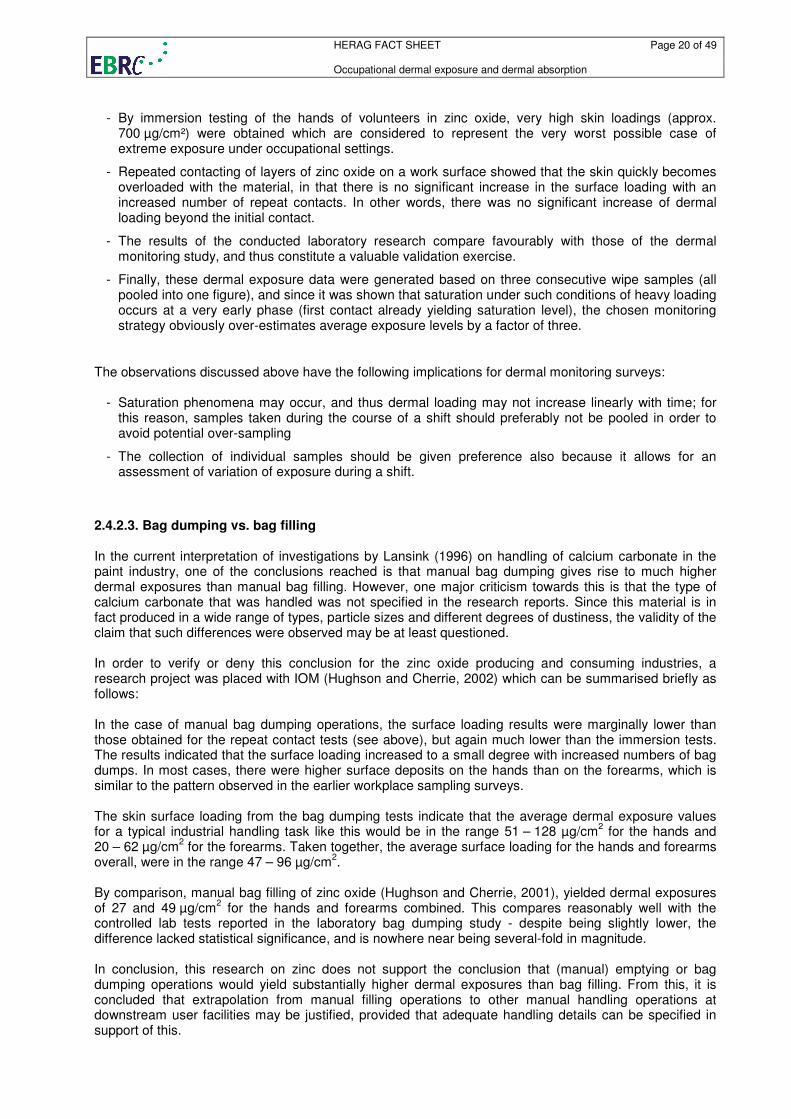
(b) Further, under conditions of high dermal loading, a saturation level may be achieved already at a low number of contacts with heavily contaminated surfaces. After this (see below), repeated contacting will not increase the dermal loading. Again, pooled sampling will under these conditions report a cumulated exposure which is likely to exceed even the saturation level.
Figure 5: Pattern of dermal exposure with early saturation of the skin contaminant layer (Hughson and Cherrie, 2002)
These hypotheses were tested under practically relevant conditions with human volunteers for zinc oxide by Hughson, who determined (i) the maximum loading level by an immersion test, and (ii) undertook repeated contact tests with contaminated surfaces. By comparison of the results of the dermal monitoring study (Hughson and Cherrie, 2001) with this recent research (Hughson and Cherrie, 2002), the following major conclusions can be drawn:
HERAG FACT SHEET Page 20 of 49 Occupational dermal exposure and dermal absorption
- By immersion testing of the hands of volunteers in zinc oxide, very high skin loadings (approx.
700 µg/cm²) were obtained which are considered to represent the very worst possible case of extreme exposure under occupational settings.
- Repeated contacting of layers of zinc oxide on a work surface showed that the skin quickly becomes overloaded with the material, in that there is no significant increase in the surface loading with an increased number of repeat contacts. In other words, there was no significant increase of dermal loading beyond the initial contact.
- The results of the conducted laboratory research compare favourably with those of the dermal monitoring study, and thus constitute a valuable validation exercise.
- Finally, these dermal exposure data were generated based on three consecutive wipe samples (all pooled into one figure), and since it was shown that saturation under such conditions of heavy loading occurs at a very early phase (first contact already yielding saturation level), the chosen monitoring strategy obviously over-estimates average exposure levels by a factor of three.
The observations discussed above have the following implications for dermal monitoring surveys:
- Saturation phenomena may occur, and thus dermal loading may not increase linearly with time; for this reason, samples taken during the course of a shift should preferably not be pooled in order to avoid potential over-sampling
- The collection of individual samples should be given preference also because it allows for an assessment of variation of exposure during a shift.
2.4.2.3. Bag dumping vs. bag filling In the current interpretation of investigations by Lansink (1996) on handling of calcium carbonate in the paint industry, one of the conclusions reached is that manual bag dumping gives rise to much higher dermal exposures than manual bag filling. However, one major criticism towards this is that the type of calcium carbonate that was handled was not specified in the research reports. Since this material is in fact produced in a wide range of types, particle sizes and different degrees of dustiness, the validity of the claim that such differences were observed may be at least questioned. In order to verify or deny this conclusion for the zinc oxide producing and consuming industries, a research project was placed with IOM (Hughson and Cherrie, 2002) which can be summarised briefly as follows: In the case of manual bag dumping operations, the surface loading results were marginally lower than those obtained for the repeat contact tests (see above), but again much lower than the immersion tests. The results indicated that the surface loading increased to a small degree with increased numbers of bag dumps. In most cases, there were higher surface deposits on the hands than on the forearms, which is similar to the pattern observed in the earlier workplace sampling surveys. The skin surface loading from the bag dumping tests indicate that the average dermal exposure values for a typical industrial handling task like this would be in the range 51 – 128 µg/cm
2 for the hands and
20 – 62 µg/cm2 for the forearms. Taken together, the average surface loading for the hands and forearms
overall, were in the range 47 – 96 µg/cm2.
By comparison, manual bag filling of zinc oxide (Hughson and Cherrie, 2001), yielded dermal exposures of 27 and 49 µg/cm
2 for the hands and forearms combined. This compares reasonably well with the
controlled lab tests reported in the laboratory bag dumping study - despite being slightly lower, the difference lacked statistical significance, and is nowhere near being several-fold in magnitude. In conclusion, this research on zinc does not support the conclusion that (manual) emptying or bag dumping operations would yield substantially higher dermal exposures than bag filling. From this, it is concluded that extrapolation from manual filling operations to other manual handling operations at downstream user facilities may be justified, provided that adequate handling details can be specified in support of this.
HERAG FACT SHEET Page 21 of 49 Occupational dermal exposure and dermal absorption
3. Dermal absorption 3.1. Current EU guidance and available models Current TGD guidance In the case of lack of any information on dermal absorption, the current guidance document on dermal absorption advocated by the TGD (2003) allows only the choice between two default values: - 10 % dermal absorption is used in cases where MW >500 and log Pow < -1 or > 4, otherwise
- 100 % dermal absorption is used. The lower limit of 10 % was chosen in consideration of published evidence that substances with MW and/or log Pow values at or beyond the extreme values given above display a limited extent of skin permeation. However, these considerations are not relevant for metals: conventional thinking requires a compound to dissolve prior to penetrating skin by diffusive mechanism. For metals and their inorganic compounds, this requires dissociation to the metal cation, for which in turn partition coefficients are irrelevant. On the other hand, the TGD does in fact suggest that where data are available (e.g. data on water solubility, ionic state, ‘molecular volume’, oral absorption and dermal area dose in exposure situations in practice) which indicate that the use of an alternative dermal absorption percentage value is appropriate, then this alternative value can be used, and scientific justification for the use of alternative values should be provided. Current models for the prediction of dermal absorption Current model concepts for skin permeation are predominantly based on considerations of diffusion-mediated processes, depending on the lipophilicity (i.e. log Pow) and molecular weight (MW) of a compound, and in some instances also to a certain degree on concentration. These models include for example:
• SKINPERM by W.F. ten Berge (Website: http://home.planet.nl/~wtberge/skinperm.html)
• QSAR Models (e.g. summarised by Corish and Fitzpatrick, 2002 and Moss et al. 2002 and references therein). More recently and based on new experimental data generated during the EDETOX Project (see section 3.4.3 below), Krüse et al (2007) published a new diffusion-based model.
• Cleek and Bunge (1993), Bunge and Cleek (1995), Bunge et al. (1995) Assuming that dissolution is a prerequisite for subsequent dermal penetration, the inevitable dissociation of inorganic metal compounds and generation of cationic species of the moiety of interest are not reflected by these models. Therefore, it is concluded that there are currently no QSAR models available that would allow prediction of the dermal absorption of metal ions resulting from dermal exposure to metals or their inorganic compounds. It may also be questioned whether the establishment of such QSARs is at all feasible, since (i) metals and their compounds may deposit on skin in many different physical forms (fine powders, coarse crystalline materials, or liquid paste or solubilised forms) which in turn will influence the availability of “free” metal ions, and (ii) the solubility in water or a physiological medium such as sweat will vary strongly, depending on the solubility product of any given metal compound and the possible anions present in such a medium. Also, as noted by Hughson and Cherrie (2005), the application of a default uptake rate to a measured or predicted dermal loading estimate may have limited applicability in estimating the actual systemic uptake of substances such as metals and metal compounds, especially when they are of limited solubility. Initial loading of the skin sufficient to cover the dermal surface provides the principle reservoir of material available for interaction with, and potential transport across, the dermis. As long as this initial deposition layer remains, additional loading will not be in contact with the dermis and will be unavailable for uptake. From a practical standpoint, application of a simple uptake rate to a measure of dermal loading will increasingly overestimate uptake as dermal loading increases. In vitro or in vivo dermal uptake studies
HERAG FACT SHEET Page 22 of 49 Occupational dermal exposure and dermal absorption
would further show uptake rates that declined once a saturation level of dermal loading has been achieved. Conceptual models that are alternatives to use of simplistic dermal loading and dermal uptake rates have been proposed (Schneider et al., 1999). Such models maintain that the mass of material that penetrates the stratum corneum will vary as a function of a metal specific permeability coefficient (akin to a diffusion coefficient), the concentration difference over the stratum corneum and the area of the contaminated skin surface. In instances where insoluble metal compounds are involved, the dissolution rate of the material may in fact be the most important factor that determines the concentration of material available for transport. Such models essentially imply that the mass of material that is transported through the stratum corneum is a function of metal concentration as opposed to the mass of dermal loading and that the rate of penetration of metals through the skin will attain a maximum value that will not increase once a given level of dermal loading has been achieved. Only now have dermal uptake systems been standardised to the point where this alternative approach to dermal exposure assessment can be evaluated. Studies of soluble vs. insoluble zinc compounds (applied in vitro at the same level of dermal loading) have confirmed that penetration of the dermis by soluble zinc sulphate is low. Still lower penetration is observed for insoluble zinc oxide and is likely indicative of uptake being limited by dissolution kinetics. Studies with lead oxide, applied with a ten-fold difference in dermal loading, observed only minimal differences in actual penetration of lead through the dermis. Future studies of metals and metal compounds could be undertaken with a view to establishing the maximum transfer rate of metal ions through skin and the extent of dermal loading required to achieve the concentration gradient that is the determinant of this maximum. Increases in dermal loading beyond this level would be of minimal significance for uptake through the dermis. This alternative approach to dermal exposure assessment would yield information of greater relevance to estimating systemic exposures than those approaches currently applied in compliance with the TGD. 3.2. Dermal absorption data for metals and their inorganic compounds Systematic investigations into the dermal absorption of metal cations have been conducted already in the 1960s, e.g. by Skog and Wahlberg (1964) and Wahlberg (1965). This group had systematically studied the absorption of radioactive metal compounds through skin of living guinea pigs by following the disappearance of the compound from the cutaneous surface (so-called "disappearance measurements"). Among the substances, which were each applied in aqueous solutions at various concentration levels, were the chlorides of cobalt, zinc, cadmium and mercury, as well as silver nitrate, sodium chromate and the organometallic methyl mercury dicyandiamide. The maximum observed relative absorption over a five hour application period was 4.5 % for methyl mercury dicyandiamide. All other compounds showed lower relative absorption rates at any concentration. Whereas the methods described in these historical publications do not meet modern standards and the exact figures are probably of limited reliability, they nevertheless indicate that inorganic metal compounds exhibit a rather low dermal absorption potential. Only more recent data on dermal absorption of metal compounds were used as the basis for risk characterisation in EU RARs (Zn, Ni, Cd, Sb) or VRAs (Cu, Pb). The information presented below largely reflects this. In other cases, information as provided by a particular industry (e.g. Al, Co) or retrieved otherwise (Ti) is considered in this fact sheet. Only in three isolated cases (Zn, Pb, Sb) were the original reports available to the authors of this fact sheet, and could therefore be evaluated in detail. In all other cases, the information was not directly available (partly for reasons of confidentiality), and was extracted from the summaries contained in the respective RA reports. It was therefore not considered possible within the scope of this fact sheet to standardise the presentation of the available data, or to subject it to a screening procedure for quality, relevance and reliability. The currently available dermal absorption data for metals and inorganic metal compounds as concluded upon within the individual EU risk assessments are summarised in the table below. In addition, some further data provided by industry were also included (without full assessment of the validity of the underlying studies). A more elaborated presentation and discussion is presented on a metal-by-metal basis in Appendix 1 to this document.
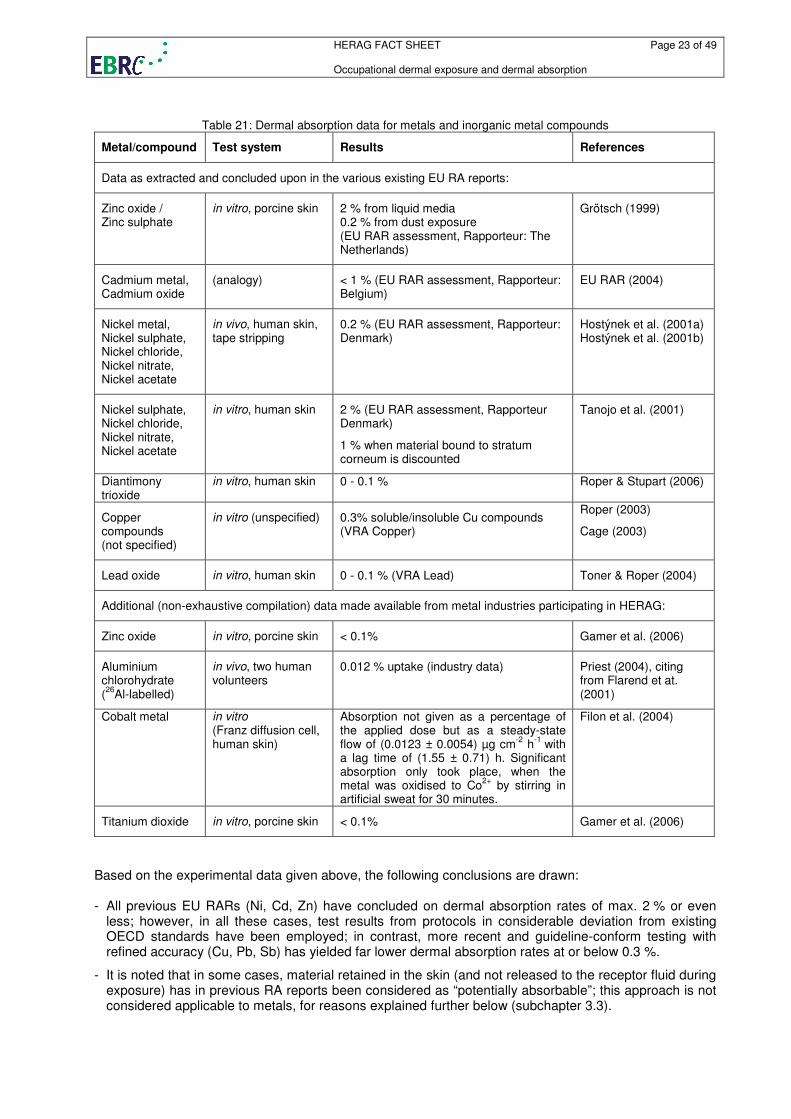
HERAG FACT SHEET Page 23 of 49 Occupational dermal exposure and dermal absorption
Table 21: Dermal absorption data for metals and inorganic metal compounds
Metal/compound Test system Results References
Data as extracted and concluded upon in the various existing EU RA reports:
Zinc oxide / Zinc sulphate
in vitro, porcine skin 2 % from liquid media 0.2 % from dust exposure (EU RAR assessment, Rapporteur: The Netherlands)
Grötsch (1999)
Cadmium metal, Cadmium oxide
(analogy) < 1 % (EU RAR assessment, Rapporteur: Belgium)
EU RAR (2004)
Nickel metal, Nickel sulphate, Nickel chloride, Nickel nitrate, Nickel acetate
in vivo, human skin, tape stripping
0.2 % (EU RAR assessment, Rapporteur: Denmark)
Hostýnek et al. (2001a) Hostýnek et al. (2001b)
Nickel sulphate, Nickel chloride, Nickel nitrate, Nickel acetate
in vitro, human skin 2 % (EU RAR assessment, Rapporteur Denmark)
1 % when material bound to stratum corneum is discounted
Tanojo et al. (2001)
Diantimony trioxide
in vitro, human skin 0 - 0.1 % Roper & Stupart (2006)
Copper compounds (not specified)
in vitro (unspecified) 0.3% soluble/insoluble Cu compounds (VRA Copper)
Roper (2003)
Cage (2003)
Lead oxide in vitro, human skin 0 - 0.1 % (VRA Lead) Toner & Roper (2004)
Additional (non-exhaustive compilation) data made available from metal industries participating in HERAG:
Zinc oxide in vitro, porcine skin < 0.1% Gamer et al. (2006)
Aluminium chlorohydrate (26
Al-labelled)
in vivo, two human volunteers
0.012 % uptake (industry data) Priest (2004), citing from Flarend et at. (2001)
Cobalt metal in vitro (Franz diffusion cell, human skin)
Absorption not given as a percentage of the applied dose but as a steady-state flow of (0.0123 ± 0.0054) µg cm
-2 h
-1 with
a lag time of (1.55 ± 0.71) h. Significant absorption only took place, when the metal was oxidised to Co
2+ by stirring in
artificial sweat for 30 minutes.
Filon et al. (2004)
Titanium dioxide in vitro, porcine skin < 0.1% Gamer et al. (2006)
Based on the experimental data given above, the following conclusions are drawn: - All previous EU RARs (Ni, Cd, Zn) have concluded on dermal absorption rates of max. 2 % or even
less; however, in all these cases, test results from protocols in considerable deviation from existing OECD standards have been employed; in contrast, more recent and guideline-conform testing with refined accuracy (Cu, Pb, Sb) has yielded far lower dermal absorption rates at or below 0.3 %.
- It is noted that in some cases, material retained in the skin (and not released to the receptor fluid during exposure) has in previous RA reports been considered as “potentially absorbable”; this approach is not considered applicable to metals, for reasons explained further below (subchapter 3.3).
HERAG FACT SHEET Page 24 of 49 Occupational dermal exposure and dermal absorption
- No clear trend on whether speciation, valency and/or water solubility of a particular compound
influences dermal absorption can be recognised: experimental data on zinc suggest that there is a difference between soluble and poorly soluble compounds, however, comparative investigations on several copper compounds did not provide evidence for any quantitatively relevant difference; in addition, the solubility of any metal dissolved on a skin surface will be subject to the ionic composition of the present process media and/or sweat, which will determine the solubility of each metal cation more than its “origin”, i.e. the compound from which it was originally derived. No data are currently available that allow any judgement on whether different valency states have an impact on this aspect.
- A discussion on the establishment of default dermal absorption factors specifically for massive metals
and their powders, and inorganic compounds derived from these should be initiated
- Organometallics are explicitly excluded from this assessment, since they can be considered to exhibit a totally different absorption behaviour, and conventional concepts based on lipophilicity are likely to be more appropriate.
3.3. Relevance of material bound in/on skin which is not released to receptor fluid during the study period A validation example for the relevance of material bound in skin (but not recovered in receptor fluid) comes from the VRA on lead and lead compounds (for details, see Appendix A 1.4): - using a modified physiologically based kinetic model calculation on a “hypothetical” worker from the lead battery industry (a 35-year old healthy male without a previous history of exposure), and - assuming a realistic maximum dermal exposure of 80 µg/cm² and hands and forearms as the exposed surface (default: 2000 cm²), a dermal exposure of 160 mg/d was predicted. Even at a dermal absorption rate of 0.1 %, the predicted rise in blood lead would be 63 µg/dL. However, by comparison, lead workers in the battery industry (period 1998-2001) have typical and worst-case (90
th
percentiles) blood lead levels of 28 and 47 µg/dL, respectively. Since relevant proportions of these blood lead levels originate from breathing and accidental ingestion (e.g. hand-to-mouth transfer, amongst others), then the assumption of any dermal absorption rate for inorganic lead cations above 0.01 % is quite unfeasible (VRAL, 2006). 3.4. Dermal absorption – methodological aspects 3.4.1. Current test methods The currently applicable test guidelines for in-vitro and in-vivo dermal absorption testing are the following: OECD 427 Skin Absorption: In Vivo Method (Original Guideline, adopted 13th April 2004) OECD 428 Skin Absorption: In Vitro Method (Original Guideline, adopted 13th April 2004) The OECD (2004c) has also provided a guidance document on the testing of dermal absorption, which provides additional information: OECD Series on Testing and Assessment, No. 28: Guidance Document for the Conduct of Skin Absorption Studies. Environmental Health and Safety Publications, ENV/JM/MONO, OECD, Paris, March 2004.
HERAG FACT SHEET Page 25 of 49 Occupational dermal exposure and dermal absorption
3.4.2. Problems likely to be encountered when testing metals/compounds Based on previous experience, the following general problems are encountered when testing dermal absorption of metals: (1) Application of test substance: Some metal compounds tested are poorly soluble, and may not be applied homogeneously as a solution in water. As a possible solution, suspension of the material in a “gel” (such aqueous hydroxypropyl methylcellulose) may be considered as a solution. (2) Mass balance: Usually, such studies are conducted with radioactive material. However, for several metals, available isotopes do not lend themselves easily to counting in conventional laboratory equipment due to high radiation energy. In all these cases, such studies need to be performed with “cold” material. (3) Endogenous metal content in skin: Because of the low absorption and the use of “cold” substances, any endogenous metal content of the skin samples and its considerable variability may give rise to a background level that needs to be controlled. In such cases, the inclusion of concurrent vehicle controls for subsequent use in background subtraction should be considered. (4) Interpretation of material retained in skin: Conventionally, this is considered to be potentially absorbed at a later phase, and thus is added to the material recovered in the receptor fluid, rendering potentially unrealistic high dermal absorption rates. The binding of metals to sulphydryl sites in the skin including follicles etc. should be considered in this context as a possible explanation for residual metal in skin after termination of the exposure phase. This would not necessarily imply subsequent uptake, but would be subject under physiological conditions to loss via replaced stratum corneum. 3.4.3. The EDETOX project In 2001-2004 a large EU founded project on the Evaluation and Prediction of Dermal Absorption of Toxic Chemicals (acronym EDETOX) was conducted (Williams, 2004). The aim of the project was to produce new knowledge that will standardise in vitro systems for predicting percutaneous penetration and compare these with relevant in vivo studies. In brief, EDETOX conducted the following tasks, divided in five work packages: 1. Testing the robustness of in vitro methodology by intra- and inter-laboratory comparisons in 10
European laboratories. The test materials were benzoic acid, caffeine and testosterone (van de Sand et al. 2004).
2. Generating of quantitative in vivo data mainly in humans that could be used for comparison with
in vitro predictive methods and mathematical models. The chemicals studied in man were aqueous solution of 2-butoxyethanol, aqueous trichloroethylene and xylene vapour. Caffeine was studied in both man and rat. Pyrene, benzo(a)pyrene and diethylhexylphthalate were studies in rats only.
3. Based on the results from the robustness testing of the in vitro methods, an extensive set of new
in vitro data on chemicals in occupationally relevant situations was generated. The data obtained was also aimed to be used in testing existing predictive models (see below). In total, the penetration of about 60 chemicals through human skin was tested. Among these chemicals there were a large number of organic substances, some of which were specifically selected with respect to their log POW to test existing QSARs over a range of this physico-chemical property. In addition 12 pesticides and three metals or metal compounds were tested (sodium chromate, cobalt powder and nickel chloride). The individual results on cobalt chloride have already been published (Filon et al., 2004) and the study is summarised in Appendix A 1.5 of this fact sheet.
HERAG FACT SHEET Page 26 of 49 Occupational dermal exposure and dermal absorption
4. A large, critically evaluated database with in vivo and in vitro data on dermal absorption / penetration
of chemicals has been established. It is available at http://edetox.ncl.ac.uk . Based on this data, existing QSARs were evaluated (Fitzpatrick et al. 2004). Furthermore new models were developed: a mechanistically-based mathematical model, which was used to interpret some of the newly generated data, a simple membrane model and a diffusion model of percutaneous absorption kinetics (Krüse et al. 2007). However, restricted by the available data, all these models have mostly been based on and applied to rather large organic molecules. Therefore they have limited relevance for assessment of metals.
5. The last work package of the EDETOX project consisted mainly of the co-ordination of results, the
preparation of the final report and the dissemination of the outcome. The latter was achieved by presenting the project at various scientific meetings and by publishing the results.
As a result from work package 1, the EDETOX team developed guidance for conduct of in vitro studies of dermal absorption/penetration which was subsequently applied in work package 3. Although mainly based on the experiences gathered with organic substances, parts of this practical guidance on conduct of such studies are also applicable to metals, metal compounds or other inorganic substances. The full guideline is contained in the “Final report for dissemination” from the EDETOX project which can be obtained via http://www.ncl.ac.uk/edetox/. Comment: A recommendation is given by EDETOX to use skin samples from at least 3 different donors in in vitro dermal absorption studies because a significant inter-skin variability in the absorption behaviour was found in the robustness test of work package 1 of the project. Variations in penetration up to eight-fold were reported for example for testosterone through human breast skin taken from different donors. However, when examining metals or other compounds whose tendency to be absorbed through skin is generally very low, the following aspect requires consideration: - Skin penetration has often observed to be so low that background levels of the compound in the skin and the receptor fluid may even exceed the amount penetrating through or residing in the skin. - Using different donor skins with varying background levels could result in increased problems to reach the detection limit for the test item using typical analytical methods like AAS or ICP-MS. - In such cases, deviation from the concept of using multiple donors may be warranted, thus necessitating the selection of a single skin source. Checking various donors for metal background during the validation phase prior to initiation of the “exposure” phase of the study is warranted.
HERAG FACT SHEET Page 27 of 49 Occupational dermal exposure and dermal absorption
4. Overall conclusions and recommendations In human health risk assessment, a correct exposure assessment is essential. For metals, a considerable improvement of existing knowledge has occurred only recently, during the evaluation of zinc, nickel, lead, copper and antimony (as trioxide). Relevant findings from this research are summarised here, and proposals for future consideration in dermal exposure assessment are made. Further, systemic exposure resulting from uptake through skin may influence the outcome of a risk characterisation in the wrong direction if not quantified correctly. This fact sheet addresses both key aspects of the assessment of systemic exposure via skin – dermal exposure and absorption. The latter section is explicitly limited to metals and inorganic metal compounds – organometals are not addressed, because of their completely different physico-chemical and toxicokinetic characteristics. Finally, while it is noted that there is currently a lot of work ongoing concerning the assessment of nano-particles, this issue is not addressed here since this is still very much under development, and consistent experimental data relevant for dermal exposure and/or absorption do not exist. 4.1. Assessment of occupational dermal exposure Conclusions from the data and comparisons presented in this document 1) Based on measurements of potential exposure using cotton gloves or patches (i.e. the calcium
carbonate dataset) which intrinsically overestimate exposure, the EASE model was found to over-predict dermal exposure by one order of magnitude. Even when actual exposure to metal compounds is measured, EASE is prone to over-predict by one to two orders of magnitude (factors ranging from 35 – 500). It is therefore concluded that the dermal module of EASE is not suitable for regulatory risk assessment.
2) The differences between zinc, lead, antimony and nickel may be hypothesised to be reflective of the
level of controls implemented in these industries, resulting from the perception of risk associated with the skin contact with these substances, which is low for zinc and zinc oxide, medium for lead and antimony compounds, and high for nickel and its compounds. This is mirrored by the observation that the correct use of gloves (low usage for zinc, higher usage for lead, antimony, nickel or the respective compounds) and even beyond this, other levels of control (automated packaging for Nickel) make a substantial impact on levels of dermal exposure.
3) The possible influence of physical properties of materials as exposure modifiers (such as particle
size, density and total dustiness) have been considered, but definitive conclusions were not possible. The use of such parameters therefore is currently restricted to a qualitative, supportive argument.
4) For future dermal exposure monitoring of inorganic compounds, it is proposed to make exclusive use
of the wipe-sampling methodology to facilitate the collection of a comparable dataset. In contrast, the use of cotton gloves or the bag-wash method should be discouraged in view of their inherent limitations.
Proposal for an alternative dermal exposure assessment strategy Considering the limitations of existing models as outlined above, a tiered approach for the assessment of dermal exposure to metals and their inorganic compounds in the absence of measured data is proposed as outlined in the scheme below:
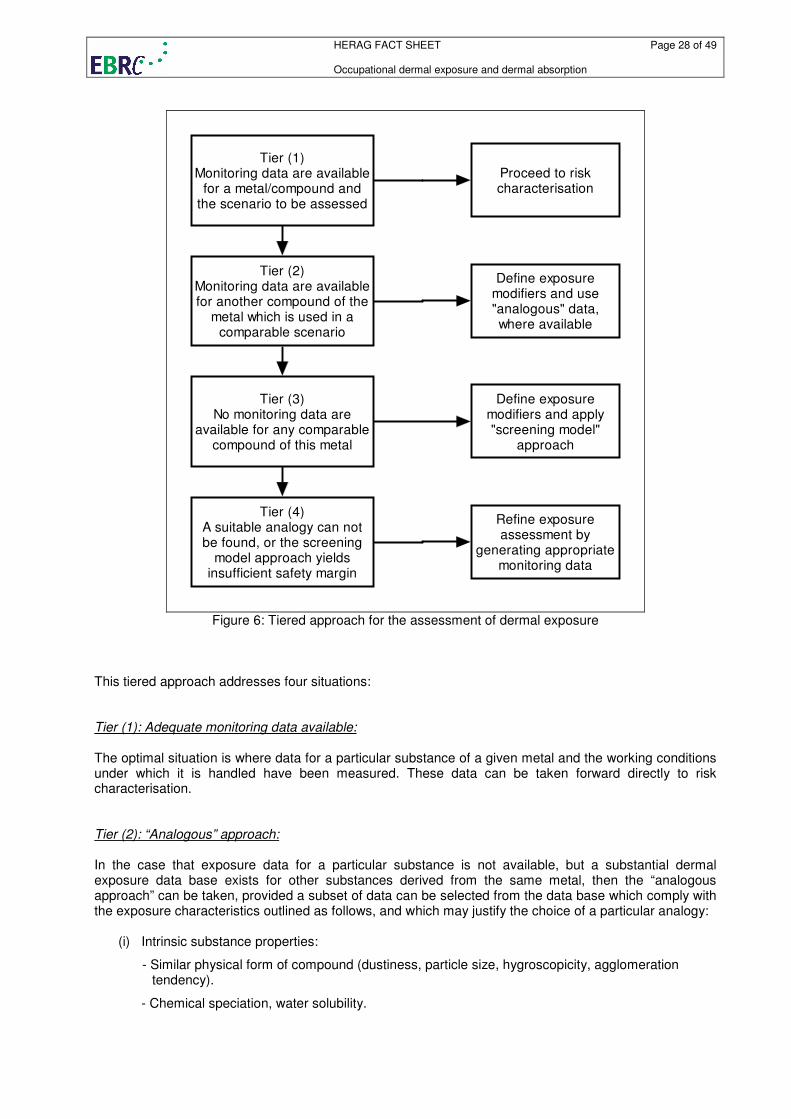
HERAG FACT SHEET Page 28 of 49 Occupational dermal exposure and dermal absorption
Tier (1)Monitoring data are available
for a metal/compound andthe scenario to be assessed
Proceed to riskcharacterisation
Tier (2)Monitoring data are availablefor another compound of the
metal which is used in acomparable scenario
Define exposuremodifiers and use"analogous" data,where available
Tier (3)No monitoring data are
available for any comparablecompound of this metal
Define exposuremodifiers and apply"screening model"
approach
Tier (4)A suitable analogy can notbe found, or the screening
model approach yieldsinsufficient safety margin
Refine exposureassessment by
generating appropriatemonitoring data
Figure 6: Tiered approach for the assessment of dermal exposure
This tiered approach addresses four situations: Tier (1): Adequate monitoring data available: The optimal situation is where data for a particular substance of a given metal and the working conditions under which it is handled have been measured. These data can be taken forward directly to risk characterisation. Tier (2): “Analogous” approach: In the case that exposure data for a particular substance is not available, but a substantial dermal exposure data base exists for other substances derived from the same metal, then the “analogous approach” can be taken, provided a subset of data can be selected from the data base which comply with the exposure characteristics outlined as follows, and which may justify the choice of a particular analogy:
(i) Intrinsic substance properties:
- Similar physical form of compound (dustiness, particle size, hygroscopicity, agglomeration tendency).
- Chemical speciation, water solubility.
HERAG FACT SHEET Page 29 of 49 Occupational dermal exposure and dermal absorption
(ii) Process conditions, pattern of control, and influence of PPE:
- Are the conditions of handling similar (dry, powder, tools used)?
- Is the degree of involvement with the process comparable, i.e.
(a) direct handling, or
(b) semi-automated packaging devices, or
I fully automated systems?
- If no direct handling of the substance occurs (and then exposure is predominantly by “indirect” processes, i.e. contact with surfaces contaminated by deposition), can a choice be substantiated by a comparison of the level of ventilation controls and resulting air?
- Is the use of gloves mandatory? Which types of gloves are used?
- Is the use of gloves for example implied in the hazardous nature of the substance (i.e., for protection against irritating, corrosive or sensitising effects)?
(iii) Perceptual factors derived from hazard assessment:
- Is the substance classified for one or several health effects, so that this may imply that workers have an increased awareness and thus make an attempt to avoid exposure where possible?
There is no single criterion that can be applied to justify on its own the extrapolation from one data set to another. Instead, a combination of the aspects above should be considered. Tier (3): “Screening model” approach: In the case that neither data for a particular substance nor for any other substance derived from the same metal are available, then the following “screening model“ approach is suggested. By using the same set of question as set forth in subsection (2) above, a decision is required to place the exposure encountered in any scenario in one of the following three discrete bands of dermal exposure (realistic worst-case, RWC and typical levels, TYP), instead of deriving a “point value”. Such a decision must consider the full extent of data available and knowledge of the occupational settings and exposure controls for the scenario to be assessed. (I) Range: 0-5 µg/cm² low dermal loading, no direct handling RWC 5 µg/cm² (analogy: Ni) TYP 1 µg/cm² (II) Range: 5-50 µg/cm² medium dermal loading, limited direct handling RWC 50 µg/cm² (analogy: Pb, Sb, etc.) TYP 10 µg/cm² (III) Range: 50-500 µg/cm² high dermal loading, direct handling RWC 500 µg/cm² (analogy: Zn compounds) TYP 100 µg/cm² The proposed typical (TYP) values were based on a level with greatest proximity to the median of a particular group of data sub-sets. The worst-case (RWC) values were selected because of proximity to the 90
th percentile of the underlying data sub-sets.
It is noted that the subset of data relating to nickel may warrant a more detailed sub-division (soluble/non-soluble) at different workplaces in the nickel industry. This approach however was not considered in the “exposure category” approach presented above, since for the purpose of extrapolating between metals and inorganic metal compounds, more emphasis has been placed on ranges of exposures collected under similar process conditions and patterns of handling/control.
HERAG FACT SHEET Page 30 of 49 Occupational dermal exposure and dermal absorption
The use of the EASE model for metals and inorganics is explicitly discouraged. However, the advantage of the above “screening model” approach is that it allocates data to several of the relevant exposure categories of EASE, thus facilitating use of conventional risk assessment considerations. Tier (4): Need to conduct monitoring: In the event that any of the above extrapolations yield insufficient safety margins in the risk characterisation, the option to conduct an appropriate monitoring study should be taken. Identification of future needs for the assessment of dermal exposure to metals The aspects discussed in this fact sheet clearly indicate that current dermal exposure models do not adequately deal with metals and their inorganic compounds. As an interim solution, the “analogous substance” approach outlined above may be used for model screening purposes, perhaps also by considering the conceptual approach set forth in the DREAM model. However, for future model development, an extension of the exposure data base using the sampling methodology advocated in this fact sheet would be desirable. 4.2. Dermal absorption for metals and inorganic metal compounds In the absence of measured data on dermal absorption, current TGD guidance merely allows an assignment of either 10% or 100% default dermal absorption rates. In contrast, the currently available scientific evidence on dermal absorption of metals (predominantly based on the experience from previous EU risk assessments) yields substantially lower figures, which can be summarised briefly as follows: - Measured dermal absorption values for metals or metal compounds in studies corresponding to the
most recent OECD test guidelines are typically 1 % or even less (section 3.2). Therefore, the use of a 10 % default absorption factor is not scientifically supported for metals.
- The feasibility of a 10 % default absorption factor further dismissed on the grounds of example calculations using the toxicokinetic model by O’Flaherty and based on real measured dermal exposure and blood lead data from the workforce in the lead acid battery industry.
- The development of any QSAR model for dermal absorption of metals does not appear feasible in view of the complex solubility products to be considered when metals or their compounds dissolve in aqueous media or physiological solutions, and the corresponding dissociation to ionic, free metal cations in solution.
Proposals for the future assessment of dermal absorption of metals Based on the findings summarised above, the following outlook can be given: (1) Previous RA (Ni, Cd, Zn) have concluded on dermal absorption rates of 2 % or less (but with considerable methodical deviations from existing OECD methods) from liquid media – more recent and guideline-conform testing with refined accuracy has even yielded dermal absorption rates at or below 0.3 % (Cu, Pb, Sb). (2) Thus, on a preliminary basis, currently a default dermal absorption rate of 1 % for absorption from liquid aqueous media would appear reasonable and adequately conservative for regulatory purposes based on a comparative assessment of the results from reliable, guideline-conform dermal absorption studies.
HERAG FACT SHEET Page 31 of 49 Occupational dermal exposure and dermal absorption
However, considering that under industrial circumstances many applications involve handling of dry powders, substances and materials, and since dissolution is a key prerequisite for any percutaneous absorption, a factor 10 lower default absorption factor may be assigned to such “dry” scenarios where handling of the product does not entail use of aqueous or other liquid media. This approach was taken in the in the EU RA on zinc. A reasoning for this is described in detail elsewhere (Cherrie and Robertson, 1995), based on the argument that dermal uptake is dependant on the concentration of the material on the skin surface rather than its mass. (3) As a matter of debate in dermal absorption testing, the assessment of material retained in the skin (and not released to the receptor fluid during the exposure period) has in previous RA reports been considered as “potentially absorbable”; this approach is not considered applicable to metals. (4) The following default dermal absorption factors for metal cations are therefore proposed (reflective of full-shift exposure, i.e. 8 hours):
From exposure to liquid/wet media: 1.0 % From dry (dust) exposure: 0.1 %
In the case that under application of these “screening factors” of 1 % (from wet media) and 0.1% (from dry media) a risk can not clearly be excluded, the need may arise to conduct relevant in vitro dermal absorption studies reflective of the occupational circumstances to be assessed. These proposed “new” defaults may be considered to already reflect an intrinsic safety margin, since they are set at a level one order of magnitude higher than recently measured values. Further work required for the establishment of the proposed revised dermal absorption factors: In order to provide a more qualified basis for the re-evaluation of a default dermal absorption factor for metals and their inorganic compounds, the following work programme is envisaged: - All reports based upon which dermal absorption rates for metal have previously been assessed would
have to be subjected to an equal data quality and reliability screening, the results of which should be documented together with a standardised reporting format of the relevant results.
- For metals already under review within the ESR or VRA programme, this exercise may be restricted to those studies already identified as relevant by the rapporteurs for these substances.
- For other metals, a screening programme of all available data would be preferable, in order to establish the same level of confidence in existing results, or to identify data of limited reliability, where applicable.
- Several issues need additional supporting data, such as the potential quantitative difference between absorption of metals under conditions of “dry” vs. “wet” skin, and the possible existence and plausibility of the binding of metals to the “outer” skin layer (thus forming a kind of “reservoir” not capable of permeating though skin and to become systemically available). In order to support this, published literature may need to be screened to identify data in further support of this beyond the argumentation set forth in this fact sheet already.
Future perspectives In the mid-term, it should be recognised that the diffusion-based concepts that attribute dermal absorption rates according to the lipophilicity of a molecule are fundamentally flawed for metals. Thus, instead of generating “conventional” dermal loading and uptake percentages, research should be pointed more in a direction that addresses: - Compound-specific loading data to define levels at which maximal dermal transfer is achieved.
- Potential adjustment factors based upon dissolution kinetics.
- Occupational dermal monitoring to determine whether actual dermal exposure is at or above the maximal transfer point – anything beyond this should not contribute to any further uptake.
HERAG FACT SHEET Page 32 of 49 Occupational dermal exposure and dermal absorption
5. References and abbreviations
References
Bunge and Cleek (1995) A New Method for Estimating Dermal Absorption from Chemical Exposure: 2. Effect of Molecular Wight and Octanol-Water Partitioning. Pharmaceutical Research. Vol. 12, No. 1, 88-95, 1995.
Bunge et al. (1995) A New Method for Estimating Dermal Absorption from Chemical Exposure: 3. Compared with Steady-State Methods for Prediction and Data Analysis. Pharmaceutical Research. Vol. 12, No. 7, 972-982, 1995.
Cage (2003) Copper compounds: In vitro dermal penetration study through human skin. Huntingdon Life Sciences, Report no. CSV 004/023929 (unpublished).
Cherrie and Robertson (1995) Biologically relevant assessment of dermal exposure, Ann. Occup. Hyg. 39, 387-392
Cleek and Bunge (1993) A New Method for Estimating Dermal Absorption from Chemical Exposure: 1. General Approach. Pharmaceutical Research Vol. 10, No. 4, 497-506, 1993.
Corish and Fitzpatrick (2002) Theoretical Models of Percutaneous Absorption. Proceedings of the International Conference on Occupational & Environmental Exposure of Skin to Chemicals: Science & Policy. Arlington, 8-11 September 2002.
Creely et al. (2004) Evaluation and Further Development of EASE Model 2.0. Annals of Occupational Hygiene, May 2004.
De Heer et al. (1999) Guidance Document on the Estimation of Dermal Absorption According to a Tiered Approach: An Update. TNO Nutrition and Food Research Institute, TNO Report V98.1237, Zeist, The Netherlands, 1999.
Filon et al. (2004) In vitro percutaneous absorption of cobalt. Int Arch Occup Environ Health Vol. 77, 85-89, 2004.
Fitzpatrick et al. (2004) Modelling skin permeability for risk assessment – the future. Chemosphere, Vol. 55, 1309-1314, 2004.
Flarend et al. (2001) A preliminary study of dermal absorption of aluminium from antiperspirants using aluminium-26. Food Chem. Toxicol., Vol. 39, 163-168, 2001.
Gamer et al. (2006) The in vitro absorption of microfine zinc oxide and titanium dioxide through porcine skin. Toxicology in vitro, Vol. 20, Issue 3, 301-307, 2006.
Grötsch (1999) Cutaneous Permeation of Zinc Oxide and Zinc Sulphate through Pig Skin In Vitro. Final Report. Study Nrs. 02073979/02073989. Labor L+S AG, Bad Bocklet, Germany, 1999.
Hostýnek et al. (2001a) Human Stratum Corneum Penetration by Nickel. Acta Derm Venerol Suppl Vol. 212, 5-10, 2001.
Hostýnek et al. (2001b) Human Stratum Corneum Adsorption of Nickel Salts – Investigation of Depth Profile by Tape Stripping In Vivo. Acta Derm Venerol Suppl Vol. 212, 11-18, 2001.
HSE (1999) The Assessment of Workplace Exposure to Substances Hazardous to Health – The EASE Model, Version 2 for Windows, UK HSE, Bootle, Liverpool (UK)
Hughson (2004) An occupational hygiene assessment of dermal nickel exposures in primary production industries, Institute of Occupational Medicine, Edinburgh, UK. Report No. TM/04/05. December 2004.
Hughson (2005a) An occupational hygiene assessment of dermal inorganic lead exposures in primary and intermediate user industries, Institute of Occupational medicine, Edinburgh, UK. Report No. TM/04/06, January 2005.
Hughson (2005b) Written communication (01.08.2005): Revised data for Phase I and II of the investigations of dermal exposure in the zinc industry (see e.g. Hughson and Cherry 2001).
Hughson (2005c) Assessment of dermal exposure and classification of workplace aerosols for the antimony trioxide production. Institute of Occupational Medicine, Edinburgh, UK. Report No. 602-00292, November 2005.
HERAG FACT SHEET Page 33 of 49 Occupational dermal exposure and dermal absorption
Hughson (2005d) An occupational hygiene assessment of dermal nickel exposures in primary production and primary user industries – Phase II report. Institute of Occupational Medicine, Edinburgh, UK. Report No. TM/05/06, October 2005.
Hughson and Cherrie (2001) Validation of the EASE model in relation to dermal zinc exposures. Institute for Occupational Medicine, Edinburgh, UK. Report No. TM/01/01, March 2001.
Hughson and Cherrie (2002) Identification of practical maximum levels of dermal dust exposure for zinc oxide and zinc metal dusts. Institute for Occupational Medicine, Edinburgh, UK. Report No. TM/02/03, September 2002.
Hughson and Cherrie (2005) Comparison of measured dermal dust exposures with predicted exposures given by the EASE expert system, Ann. Occup. Hyg., Vol. 49, No. 2, 111-123, 2005.
Krüse et al. (2007) Analysis, Interpretation, and Extrapolation of Dermal Permeation Data Using Diffusion-Based Mathematical Models. J. Pharm. Sci., Vol. 96, No. 3, 682-703, 2007.
Lansink et al. (1996) Skin exposure to calcium carbonate in the paint industry. Preliminary modelling of skin exposure levels to powders based on field data. TNO Nutrition and Food Research Institute, The Netherlands. Report No. V 96.064, June 1996.
Moss et al. (2002) Quantitative structure-permeability relationships (QSPRs) for percutaneous absorption. Toxicology In Vitro 16, 299-317, 2002.
OECD (1997) Guidance document for the conduct of studies of occupational exposure to pesticides during agricultural application. OECD series on testing and assessment – Number 9. Doc. No. OCDE/GD(97)148, Paris, 5 September 1997.
OECD (2004a) OECD Guidelines for the Testing of Chemicals No. 427: Skin Absorption: In Vivo Method (Original Guideline, adopted 13th April 2004).
OECD (2004b) OECD Guidelines for the Testing of Chemicals No. 428: Skin Absorption: In Vitro Method (Original Guideline, adopted 13
th April 2004).
OECD (2004c) OECD Series on Testing and Assessment, No. 28: Guidance Document for the Conduct of Skin Absorption Studies . Environmental Health and Safety Publications, ENV/JM/MONO, OECD, Paris, March 2004.
Priest (2004) The biological behaviour and bioavailability of aluminium in man, with special reference to studies employing aluminium-26 as a tracer: review and study update. J. Environ. Monit. 6, 375-403, 2004.
Roper (2003) The in vitro percutaneous absorption of Copper from various formulations through human skin. Inveresk Research, Report no. 22829 (unpublished).
Roper and Stupart (2006) The in vitro percutaneous absorption of diantimony trioxide through human skin, unpublished report on behalf of International Antimony Oxide Industry Association, Study Number 775440, report date 20.04.2006, Charles River Laboratories, Edinburgh, UK
Schneider et al. (1999) Conceptual model for assessment of dermal exposure. Occup. Environ. Med. Vol. 56, 765-773, 1999.
Skog and Wahlberg (1964) A comparative investigation of the percutaneous absorption of metal compounds in the guinea pig by means of the radioactive isotopes: Cr-51, Co-58, Zn-65, Ag-110m, Cd-115m, Hg-203. J. Invest. Derm. 43, 187-192, 1964.
Tanojo et al. (2001) In Vitro Permeation of Nickel Salts Through Human Stratum Corneum. Acta Derm Venerol Suppl Vol. 212, 19-23, 2001.
Toner and Roper (2004) The In Vitro Percutaneous Absorption of Lead in Three Test Preparations Through Human Skin, Report Number 24569, Inveresk Research, Tranent, Scotland, UK, 2004.
van de Sand et al. (2004) In vitro predictions of skin absorption of caffeine, testosterone and benzoic acid: a multi centre comparison study. Regulatory Pharmacology and Toxicology Vol. 39, 271-281, 2004.
van Hemmen et al. (2003) RISKOFDERM: Risk Assessment of Occupational Dermal Exposure to Chemicals. An Introduction, Ann Occup Hyg Vol. 47, 595-598, 2003.
van Wendel de Joode et al. (2003)
DREAM: A Method for Semi-quantitative Dermal Exposure Assessment, Ann. occup. Hyg. 47(1), 71-87
van Wendel de Joode et al. (2005)
Accuracy of a semiquantitative method for Dermal Exposure Assessment (DREAM), Occup. Environ. Med. 62(9), 623 - 632
HERAG FACT SHEET Page 34 of 49 Occupational dermal exposure and dermal absorption
VRAL (2006) Voluntary Risk Assessment on Lead and Lead Compounds, LDAI, London, 2006
Wahlberg (1965) Percutaneous Toxicity of Metal Compounds, Arch Environ Health, Vol 11, 201-204, August 1965.
Wheeler et al. (1997) Contamination and uptake of particles from surfaces, HSL Internal Report, IR/L/A/97/18
Wheeler et al. (1999a) Lead exposure in the crystal glass industry, HSL (Sheffield), report no. IR/A/99/01.
Wheeler et al. (1999b) Sources of lead exposure in the battery industry, HSL (Sheffield), report no. IR/A/99/02.
Williams (2004) EDETOX. Evaluations and predictions of dermal absorption of toxic chemicals. Int Arch Occup Environ Health Vol. 77, 150-151, 2004.
Abbreviations
AAS Atomic Absorption Spectroscopy
EASE A model for Estimation and Assessment of Substance Exposure, see e.g. Creely et al. (2004)
EDETOX Evaluation and Prediction of Dermal Absorption of Toxic Chemicals
EPA Environmental Protection Agency (USA)
GM geometric mean
GSD geometric standard deviation
HSE Health and Safety Executive (UK)
ICP-MS Inductively coupled plasma - mass spectrometry
IOM Institute of Occupational Medicine
MW molecular weight
OECD Organisation for Economic Co-operation and Development
QSAR Quantitative structure activity relationship
RA(R) Risk Assessment (Report)
RISKOFDERM Risk Assessment of Occupational Dermal Exposure to Chemicals. See van Hemmen et al. (2003)
SF scenario factor
TGD Technical Guidance Document
VRA Voluntary risk assessment. In contrast to risk assessments according to the existing substances regulation (ESR, see above), voluntary risk assessments are conducted by industry in response to a request from the European Commission to “start preparing the initial assessments for substances on the EU working list as these were considered as Community priorities in the context of the industry voluntary initiatives for high production volume chemicals”.
HERAG FACT SHEET Page 35 of 49 Occupational dermal exposure and dermal absorption
Appendix 1: Dermal absorption data for metals and metal compounds
A 1.1. Zinc The following text extracted as a transcript from the EU RAR summarises the key study on in-vitro dermal absorption as follows:
Industry initiated an in vitro testing programme on two representative Zinc compounds (Zinc oxide and Zinc sulphate) for percutaneous absorption (Grötsch, 1999). In this study, a solution of ZnSO4 monohydrate and a suspension of ZnO, each at a concentration of 40 mg/ml in water, were tested for cutaneous penetration and absorption through pig skin in vitro. Skin preparations measuring 1 mm in thickness with stratum corneum, stratum germinativum and blood-vessel-containing parts of the dermis were obtained from pigs using a modified dermatome. In two independent experiments for each compound seven skin preparations were mounted in Teflon flow-through diffusion chambers which were continuously rinsed with physiological receptor fluid (0.9% NaCl in aqua bidest with antibiotics). After an integrity check using the marker substance caffeine, each of the test formulations were applied to six skins at a dose of 1 mg/cm
2
for 8 hours without occlusion, and subsequently washed off with a neutral shampoo. After 0, 2, 4, 6, 8, 16, 24, 40, 48, 64 and 72 hours, the percutaneous permeation was determined by quantifying Zinc with atomic absorption spectroscopic analysis (detection limit: 10 ng/ml) in the receptor fluid. The experiment was stopped at 72 hours. Furthermore, Zinc was analysed in the skin preparations and the rinsing fluids. In addition, blanks were measured in an unloaded control chamber. Results are summarized in the following table:
Table: Dermal absorption of Zn (% of dose) through pig skin in vitro within 72 hoursa
ZnSO4 ZnO
Receptor fluid 0.3 % 0.03 % Horny layer 1.3 % 12.3 % Residual skin 0 % 2.6 % Potentially absorbed dose
1.6% 14.9%
a Corrected for background levels of Zinc in receptor fluid and skin.
Total recoveries of applied Zinc in both experiments ranged from 82.0 % to 109.6 %. The results of analysis of the receptor fluid used and of the blank chambers without topical application of Zinc compounds indicated that both the receptor fluid and porcine skin contain an intrinsic level of Zinc. The amounts of Zinc detected in receptor fluid and different layers of the skin were therefore corrected for background levels. The authors concluded that dermal penetration of Zinc was below 1 % based on the cumulative amount recovered from the receptor fluid at 72 hours. However, the amount retained in the skin should be regarded as being absorbed because it may become available at a later stage. Hence, the rapporteur concludes that the dermal absorption of Zinc from a solution of Zinc sulphate monohydrate and a suspension of Zinc oxide in this in vitro system may amount to 1.6 % and 14.9 %, respectively. However, in the risk characterisation section, and following very intensive discussions with the industry delegation including the reflection of human in-vivo data, the RAR then concludes the following: Adequate quantitative data on the absorption of Zinc following dermal exposure (relevant in both occupational and consumer settings) are not available. The human data presented are not considered valid, mainly since either wounded skin was investigated, or suction blisters were raised, impairing the intactness of the skin. Dermal absorption through the intact skin seems to be small (< 2 %), based on the results of the in vivo animals studies as well as the in vitro studies, but unfortunately shortcomings were noted in all in vivo studies and none of these studies can be used quantitatively. As for in vitro studies, it is clear that the % in receptor medium generally gives an underestimation of the % systemically available in in vivo studies. Therefore, the amount detected in the skin should be included as being absorbed by default. This ‘potentially absorbed dose’ more closely resembles the dose becoming systemically available in vivo.
HERAG FACT SHEET Page 36 of 49 Occupational dermal exposure and dermal absorption
Zinc bound to or in the skin may become systemically available at a later stage. This can be concluded from results in TPN patients, in which an expected decrease in serum Zinc levels with time was counteracted by dermal absorption of Zinc to result in steady serum Zinc levels. Unfortunately, only 3 of the 6 patients completed the 10-day study period. There are no adequate human data available to evaluate the release of Zinc from normal skin following single or repeated dermal exposure, as either blood was sampled for a too short period of time (3 hours; Derry et al., 1983) or the skin was damaged (Agren, 1990, 1991; Hallmans, 1977). Therefore, it can be concluded that following single or repeated dermal exposure Zinc can be taken up by the skin, whereas the relevance of this skin depot cannot be judged based on the available data. For example, it is not studied how a large artificial Zinc depot in the skin will affect the uptake or homeostasis of other essential ions (e.g. Cu). However, the total database available indicates that skin-bound Zinc may not become systemically available in a way that it results in high peak levels of Zinc in serum, but rather in a more gradual way. Given the efficient homeostatic mechanisms of mammals to maintain the total body Zinc and the physiologically required levels of Zinc in the various tissues constant, the anticipated slow release of Zinc from the skin is not expected to disturb the homeostatic Zinc balance of the body. The overall final conclusion then reads: By expert judgement, based on the aforementioned considerations, the default for dermal absorption of solutions or suspensions of Zinc or Zinc compounds is therefore chosen to be 2 %. Based on the physical appearance, for dust exposure to Zinc or Zinc compounds a 10-fold lower default value of 0.2 % is chosen in the risk assessment.
The authors of this fact sheet have the following criticism to this approach: The EU RAR interprets the in-vitro skin permeation study on Zinc oxide and Zinc sulphate in a way that material bound in the skin (epidermal layer and stratum corneum were not separated in this study strictly according to guideline procedures) may be available later, and as such is in-line with conventional scientific thinking. However, the test was in fact run until 72 hours past application, in which time no material whatsoever penetrated to the receptor fluid. From this, it should be possible to also conclude that the material was in fact bound to the skin, but not in a form likely to be released systemically. Further support for this comes from a human clinical study (Derry et al., 1983) where topical application of a ZnO oil/water-based ointment to large skin surfaces of volunteers failed to produce any significant rise in serum Zinc levels. Finally, very recently, a GLP and guideline-conform (OECD 428) study on the in vitro absorption of a “microfine zinc oxide” formulation (10% ZnO in an oil/water emulsion) through porcine skin was conducted by BASF (Gamer et al., 2006). The mean total recoveries of Zn were in the range from 102-107% of total Zn applied. Virtually the total amount of applied Zn was recovered in the first five tape strips. The amounts of Zn found in the skin membrane and the receptor fluid were comparable in untreated, vehicle treated or test substance treated skin preparations. According to the authors, the sensitivity of the test system is at 0.1% of the applied “dose”. For lack of any detectable penetration of zinc through porcine stratum corneum, the result was set to < 0.1%. A 1.2. Copper Dermal absorption factors for humans taken forward to risk characterisation in the Copper RA were derived from two recent, but unpublished in vitro studies which are under data protection under other regulatory schemes (EU Directives 98/8 and 91/414) and are therefore can not summarised here. Both soluble and poorly soluble Copper compounds were tested according to guideline OECD 428. Despite several methodical drawbacks in both studies (such as the lack of a mass balance), the conclusion was reached by the authors of the VRA that the data supported a “conservative” dermal absorption factor of 0.3 % for soluble and poorly soluble Copper substances. It is also stated that the available studies provide no consistent evidence that dermal absorption is greater for soluble than for poorly soluble Copper substances. Their conclusions also do not differentiate whether this absorption factor applies to a solution only, or also extends to “dry” skin exposure by dust, for example.
HERAG FACT SHEET Page 37 of 49 Occupational dermal exposure and dermal absorption
A 1.3. Nickel According to the EU Risk assessment documents, the available data indicate that absorption of Nickel following dermal contact with various Nickel compounds can take place, but to a limited extent, and with a large part of the applied dose remaining on the skin surface or in the stratum corneum. The derivation of an absorption value for the four Nickel compounds assessed as “soluble” (sulphate, chloride, nitrate and carbonate) in the RAR is based on an in vitro study of soluble Nickel compounds using human skin, which showed that about 98% of the dose remained in the donor solution, whereas 1% or less was found in the receptor fluid, and less than 1% was retained in the stratum corneum (Tanojo et al. 2001). Since according to the revised TGD, the amount absorbed in the skin but not passed into the receptor fluid should also be included in the estimate of dermal absorption, the RAR concluded on a value of 2% for the characterisation of the absorbed fraction of Nickel following dermal contact to Nickel sulphate, Nickel chloride, Nickel nitrate, and Nickel carbonate. Comment: This approach is not strictly correct, since in this study design, the investigators used trypsinised stratum corneum, not viable skin. Under current OECD-guideline considerations, material retained in the epidermal layer is considered to be potentially absorbable at a later stage (p.a.), but not the material retained in the stratum corneum. Thus, it would be more appropriate to take forward 1% to risk characterisation, provided the study was void of any deficiencies and were considered reliable. The EU Risk assessment on Nickel metal used data from a study using sequential tape stripping of humans exposed to Nickel powder to derive the absorption value (Hostynek et al. 2001a). Whereas the RA report reached the conclusion that the data were too limited for an evaluation of the absorbed fraction of Nickel following dermal contact to Nickel metal, a value of 0.2% was nevertheless taken forward to risk characterisation. Hostýnek et al. (2001b) also similarly measured in vivo penetration of nickel salts (nickel sulphate, nickel chloride, nickel nitrate and nickel acetate) in humans using tape stripping, where again most of the nickel dose applied remained on the skin surface or was adsorbed in the uppermost layers of the stratum corneum. General criticism of this approach: The RA of dermal studies was done in accordance with the TGD, which requires that all of the “absorbed” substance (i.e., contained in the epidermal layer, but without material bound to the stratum corneum) be included in the dermal permeation value, whether or not a skin reservoir exists. In that sense the risk assessment was done correctly. However, the issue of whether the amount of bound substance in the skin should be considered in the dermal permeation value is debatable. Thus, it is of prime relevance to establish whether or not Nickel (or any other metal) may be bound to a certain extent in a kind of “reservoir” in skin, from which it is not released systemically, possibly involving binding to keratin and other components of skin. A 1.4. Lead As part of the “Voluntary Risk Assessment for Lead” (VLRA) currently being conducted on behalf of the Lead Industry (represented by the Lead Development Association International, LDAI), a study was undertaken to estimate the likely dermal penetration of Lead resulting from topical exposure to Lead Oxide (Litharge). The study was conducted according to the OECD principles of Good Laboratory Practice and was performed following the OECD guideline for skin penetration studies and the OECD guidance document. Lead Oxide was applied as a suspension in a solution of hydroxypropylmethyl cellulose in water (1%, w/v), corresponding to dermal loading levels of 100 µg/cm
2 and 1000 µg/cm
2. In addition, a vehicle
blank was included, in order to correct for background (skin endogenous Lead). Split-thickness human skin from a single donor (to reduce variations in background) was selected, subject to a tritiated water barrier integrity test. The receptor fluid was phosphate buffered saline containing Streptomycin and Penicillin G. Absorption was assessed by collecting samples of receptor fluid, skin washes, skin and tape-strippings at 24-hours post exposure. The results are summarised briefly in the table below:
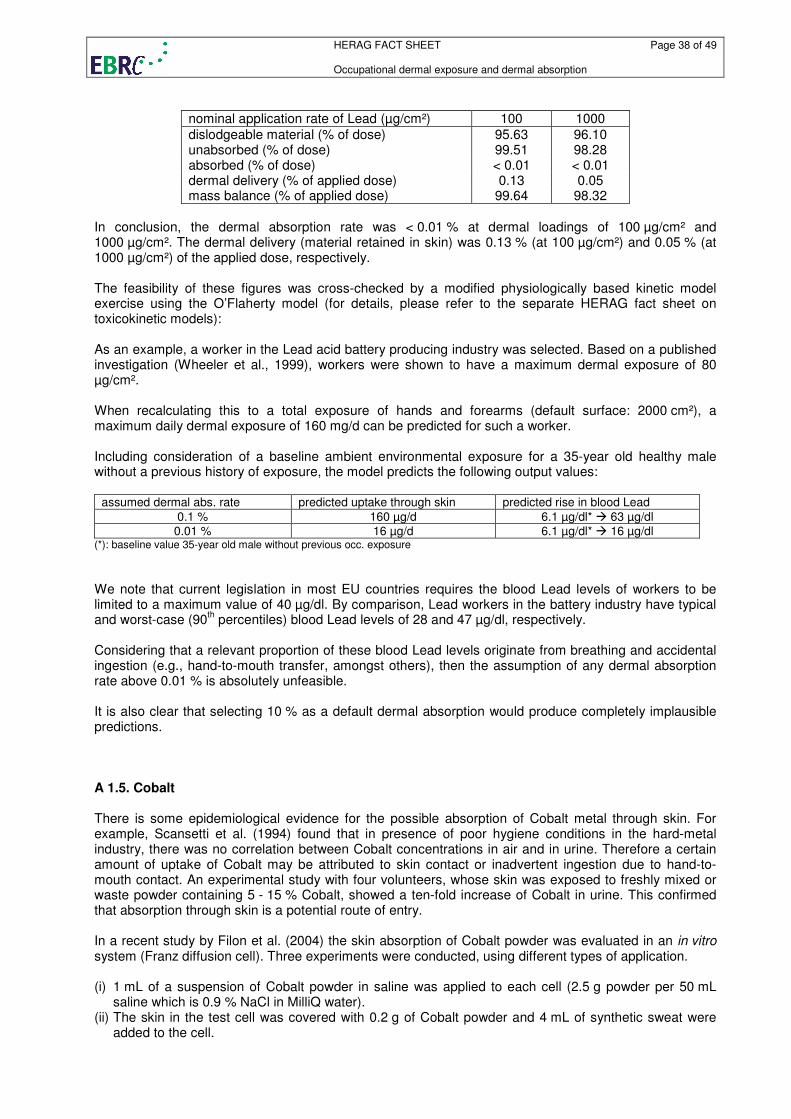
HERAG FACT SHEET Page 38 of 49 Occupational dermal exposure and dermal absorption
nominal application rate of Lead (µg/cm²) 100 1000
dislodgeable material (% of dose) 95.63 96.10 unabsorbed (% of dose) 99.51 98.28 absorbed (% of dose) < 0.01 < 0.01 dermal delivery (% of applied dose) 0.13 0.05 mass balance (% of applied dose) 99.64 98.32
In conclusion, the dermal absorption rate was < 0.01 % at dermal loadings of 100 µg/cm² and 1000 µg/cm². The dermal delivery (material retained in skin) was 0.13 % (at 100 µg/cm²) and 0.05 % (at 1000 µg/cm²) of the applied dose, respectively. The feasibility of these figures was cross-checked by a modified physiologically based kinetic model exercise using the O’Flaherty model (for details, please refer to the separate HERAG fact sheet on toxicokinetic models): As an example, a worker in the Lead acid battery producing industry was selected. Based on a published investigation (Wheeler et al., 1999), workers were shown to have a maximum dermal exposure of 80 µg/cm². When recalculating this to a total exposure of hands and forearms (default surface: 2000 cm²), a maximum daily dermal exposure of 160 mg/d can be predicted for such a worker. Including consideration of a baseline ambient environmental exposure for a 35-year old healthy male without a previous history of exposure, the model predicts the following output values:
assumed dermal abs. rate predicted uptake through skin predicted rise in blood Lead
0.1 % 160 µg/d 6.1 µg/dl* � 63 µg/dl 0.01 % 16 µg/d 6.1 µg/dl* � 16 µg/dl
(*): baseline value 35-year old male without previous occ. exposure
We note that current legislation in most EU countries requires the blood Lead levels of workers to be limited to a maximum value of 40 µg/dl. By comparison, Lead workers in the battery industry have typical and worst-case (90
th percentiles) blood Lead levels of 28 and 47 µg/dl, respectively.
Considering that a relevant proportion of these blood Lead levels originate from breathing and accidental ingestion (e.g., hand-to-mouth transfer, amongst others), then the assumption of any dermal absorption rate above 0.01 % is absolutely unfeasible. It is also clear that selecting 10 % as a default dermal absorption would produce completely implausible predictions. A 1.5. Cobalt There is some epidemiological evidence for the possible absorption of Cobalt metal through skin. For example, Scansetti et al. (1994) found that in presence of poor hygiene conditions in the hard-metal industry, there was no correlation between Cobalt concentrations in air and in urine. Therefore a certain amount of uptake of Cobalt may be attributed to skin contact or inadvertent ingestion due to hand-to-mouth contact. An experimental study with four volunteers, whose skin was exposed to freshly mixed or waste powder containing 5 - 15 % Cobalt, showed a ten-fold increase of Cobalt in urine. This confirmed that absorption through skin is a potential route of entry. In a recent study by Filon et al. (2004) the skin absorption of Cobalt powder was evaluated in an in vitro system (Franz diffusion cell). Three experiments were conducted, using different types of application. (i) 1 mL of a suspension of Cobalt powder in saline was applied to each cell (2.5 g powder per 50 mL
saline which is 0.9 % NaCl in MilliQ water). (ii) The skin in the test cell was covered with 0.2 g of Cobalt powder and 4 mL of synthetic sweat were
added to the cell.
HERAG FACT SHEET Page 39 of 49 Occupational dermal exposure and dermal absorption
(iii) 1 mL of a suspension of 2.5 g Cobalt powder in 50 mL synthetic sweat, which was stirred for 30 minutes before application, was added to each cell.
In the donor phase and the receiving phase Cobalt metal was analysed by atomic absorption spectroscopy and in parallel also the quantity of cobalt ions (Co
2+) was determined by differential pulse
polarography. The results of the three experiments are as follows: (i) “A very small amount of Co permeated the skin” (quote from Filion et al. (2004)). A mean (7 cells)
cumulative absorption after 24 hours of (0.026 ± 0.013) µg cm-2
can be calculated from a table in the publication.
(ii) The second experiment revealed a significant increase in Cobalt permeation, but the amount absorbed, as a function of time, varied in the seven different cells with inconsistent results. Individual figures were not reported.
(iii) A progressive increase in Cobalt in the receptor fluid with time is observed with good reproducibility between six analysed cells. The cumulative absorption after 24 h reached 0.27 µg cm
-2 (average of 6
cells with the standard deviation being 0.2 µg cm-2
). The data from this experiment was used to derive the steady-state flow of (0.0123 ± 0.0054) µg cm
-2 h
-1 with a lag time of (1.55 ± 0.71) h which is given
as the final result of the study. After experiment (iii) the used skin was removed from the cell and washed, and residual Cobalt in the skin was determined by AAS showing a mean concentration of (13.2 ± 4.5) µg cm
-2 (range 7.3 – 17.4).
As a final result of the study, a steady-state flow for the percutaneous cobalt permeation was calculated as (0.0123 ± 0.0054) µg cm
-2 h
-1 with a lag time of (1.55 ± 0.71) h, as derived from experiment (iii). The
absorption is not given as a percentage of the applied dose. The comparison with experiments (i) and (ii) shows, that Cobalt can pass through the skin only when it is oxidised to Co
2+ by synthetic sweat. The
percentage of dissolved Cobalt (as Co2+
) in a dispersion of Cobalt powder in synthetic sweat, which was stirred for 30 minutes, was calculated to be 0.13 %. A 1.6. Aluminium In a recent review report the author summarised the current state of knowledge about the biological behaviour and bioavailability of Aluminium in man (Priest, 2004). Special emphasis was placed on studies exploiting the radionuclide
26Al as a tracer, for which a sensitive analytical methods (AMS, accelerator
mass spectrometry) is available only since around 1990. Several studies are available exploring the bioavailability of Aluminium via oral uptake or via inhalation, but few tests seem to have been conducted on the dermal absorption of Aluminium or Aluminium compounds. One study, in which
26Al-labelled
Aluminium chlorohydrate was applied on the skin of two volunteers, showed an uptake of 0.012 % of the tracer applied (Flarend et al., 2001). It is also known that there can be intake of some Aluminium when spraying under-arm antiperspirants onto skin abraded during the process of removing axillary hair. Williams and Fremont (1984) have described granulomata as resulting from this practice. A 1.7. Cadmium Without being able to specify this in more detail, the most recent versions of the Cd RARs on Cadmium metal and Cadmium oxide state: Although specific data are not available for CdO/Cd metal, it can be deduced from experimental studies performed with soluble Cadmium salts that percutaneous absorption is likely to be significantly less than 1 % (RAR Cadmium metal and Cadmium oxide, September 2004). A 1.8. Antimony An in vitro dermal absorption study has recently been conducted with Diantimony trioxide under GLP and according to OECD guideline 428, and in consideration of the OECD (2004c) guidance document. The following preliminary results are cited from the available draft (to be amended when the final report becomes available):
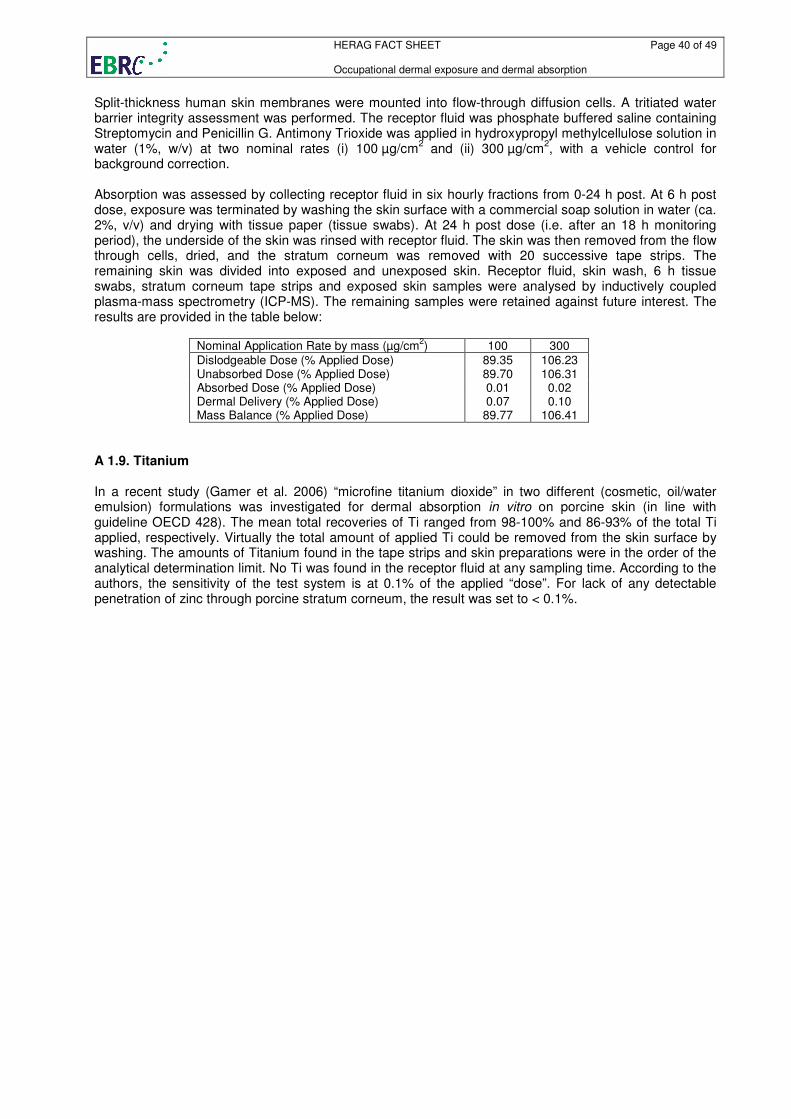
HERAG FACT SHEET Page 40 of 49 Occupational dermal exposure and dermal absorption
Split-thickness human skin membranes were mounted into flow-through diffusion cells. A tritiated water barrier integrity assessment was performed. The receptor fluid was phosphate buffered saline containing Streptomycin and Penicillin G. Antimony Trioxide was applied in hydroxypropyl methylcellulose solution in water (1%, w/v) at two nominal rates (i) 100 µg/cm
2 and (ii) 300 µg/cm
2, with a vehicle control for
background correction. Absorption was assessed by collecting receptor fluid in six hourly fractions from 0-24 h post. At 6 h post dose, exposure was terminated by washing the skin surface with a commercial soap solution in water (ca. 2%, v/v) and drying with tissue paper (tissue swabs). At 24 h post dose (i.e. after an 18 h monitoring period), the underside of the skin was rinsed with receptor fluid. The skin was then removed from the flow through cells, dried, and the stratum corneum was removed with 20 successive tape strips. The remaining skin was divided into exposed and unexposed skin. Receptor fluid, skin wash, 6 h tissue swabs, stratum corneum tape strips and exposed skin samples were analysed by inductively coupled plasma-mass spectrometry (ICP-MS). The remaining samples were retained against future interest. The results are provided in the table below:
Nominal Application Rate by mass (µg/cm2) 100 300
Dislodgeable Dose (% Applied Dose) 89.35 106.23 Unabsorbed Dose (% Applied Dose) 89.70 106.31 Absorbed Dose (% Applied Dose) 0.01 0.02 Dermal Delivery (% Applied Dose) 0.07 0.10 Mass Balance (% Applied Dose) 89.77 106.41
A 1.9. Titanium In a recent study (Gamer et al. 2006) “microfine titanium dioxide” in two different (cosmetic, oil/water emulsion) formulations was investigated for dermal absorption in vitro on porcine skin (in line with guideline OECD 428). The mean total recoveries of Ti ranged from 98-100% and 86-93% of the total Ti applied, respectively. Virtually the total amount of applied Ti could be removed from the skin surface by washing. The amounts of Titanium found in the tape strips and skin preparations were in the order of the analytical determination limit. No Ti was found in the receptor fluid at any sampling time. According to the authors, the sensitivity of the test system is at 0.1% of the applied “dose”. For lack of any detectable penetration of zinc through porcine stratum corneum, the result was set to < 0.1%.

HERAG FACT SHEET Page 41 of 49 Occupational dermal exposure and dermal absorption
Appendix 2: Raw data (dermal exposure) This table gives the raw data of measured dermal exposure in µg/cm² as used in this document. Given: figure as given in data source (report/publication); Analysed: Exposure based on the metal itself (frequently the analytical technique allowed for the quantification of the metal atom/ion, e.g. AAS, and this figures were reported); Exposed: Exposure in µg/cm² recalculated (if necessary) to the mass/area of the actually handled substance using the CF (“conversion factor”). Please refer also to chapter 2. Metal Plant Task CF Given Analysed Exposed Source Zinc ZnO production Packing 1.818 78.7 78.7 143.1 Hughson (2005b) Zinc ZnO production Packing 1.818 69.3 69.3 125.9 Hughson (2005b) Zinc ZnO production Warehouse op 1.818 66.4 66.4 120.8 Hughson (2005b) Zinc ZnO production Warehouse op 1.818 38.8 38.8 70.6 Hughson (2005b) Zinc ZnO production Warehouse operator 1 1.818 96.4 96.4 175.3 Hughson (2005b) Zinc ZnO production Warehouse operator 1 1.818 31.4 31.4 57.1 Hughson (2005b) Zinc ZnO production Warehouse operator 2 1.818 152.0 152.0 276.3 Hughson (2005b) Zinc ZnO production Warehouse operator 2 1.818 164.5 164.5 299.0 Hughson (2005b) Zinc ZnO and Zn dust production Zn dust operator 1.818 23.3 23.3 42.4 Hughson (2005b) Zinc ZnO and Zn dust production Zn dust operator 1.818 81.4 81.4 147.9 Hughson (2005b) Zinc ZnO and Zn dust production ZnO operator 1.818 38.1 38.1 69.2 Hughson (2005b) Zinc ZnO and Zn dust production ZnO operator 1.818 83.6 83.6 152.0 Hughson (2005b) Zinc ZnO and Zn dust production ZnO operator 1.818 110.1 110.1 200.2 Hughson (2005b) Zinc ZnO and Zn dust production ZnO operator 1.818 101.2 101.2 184.1 Hughson (2005b) Zinc ZnO, Zn dust and Zn powder production ZnO packing 1.818 73.4 73.4 133.4 Hughson (2005b) Zinc ZnO production Animal feed plant 1.818 255.1 255.1 463.8 Hughson (2005b) Zinc ZnO production General labourer 1 1.818 114.9 114.9 208.9 Hughson (2005b) Zinc ZnO production General labourer 1 1.818 221.2 221.2 402.1 Hughson (2005b) Zinc ZnO production General labourer 2 1.818 143.6 143.6 261.1 Hughson (2005b) Zinc ZnO production General labourer 2 1.818 241.2 241.2 438.6 Hughson (2005b) Zinc ZnO production Packing 1.818 307.1 307.1 558.2 Hughson (2005b) Zinc ZnO production Packing 1.818 353.4 353.4 642.5 Hughson (2005b) Zinc ZnO production Pelletising 1.818 295.0 295.0 536.3 Hughson (2005b) Zinc ZnO, Zn dust and Zn powder production Zn dust blender op 1.818 147.7 147.7 268.6 Hughson (2005b) Zinc ZnO, Zn dust and Zn powder production Zn dust classifier op 1.818 439.1 439.1 798.3 Hughson (2005b) Zinc ZnO, Zn dust and Zn powder production Zn dust classifier op 1.818 314.4 314.4 571.6 Hughson (2005b) Zinc ZnO and Zn dust production Zn dust operator 1.818 127.7 127.7 232.2 Hughson (2005b) Zinc ZnO and Zn dust production Zn dust operator 1.818 134.9 134.9 245.3 Hughson (2005b) Zinc ZnO, Zn dust and Zn powder production Zn dust packing 1.818 228.8 228.8 416.0 Hughson (2005b) Zinc ZnO and Zn dust production ZnO operator 1.818 97.0 97.0 176.4 Hughson (2005b) Zinc ZnO and Zn dust production ZnO operator 1.818 164.8 164.8 299.7 Hughson (2005b) Zinc ZnO, Zn dust and Zn powder production ZnO packing 1.818 233.7 233.7 425.0 Hughson (2005b) Zinc ZnO production Furnace op 1.245 19.8 19.8 24.7 Hughson (2005b) Zinc ZnO production Furnace op 1.245 40.0 40.0 49.8 Hughson (2005b) Zinc ZnO production Furnace op 1.245 26.6 26.6 33.1 Hughson (2005b) Zinc ZnO production Furnace op 1.245 80.2 80.2 99.8 Hughson (2005b) Zinc ZnO, Zn dust and Zn powder production Furnace op 1.245 55.8 55.8 69.4 Hughson (2005b) Zinc ZnO, Zn dust and Zn powder production Furnace op 1.245 51.7 51.7 64.4 Hughson (2005b) Zinc ZnO production Furnace operator 1 1.245 31.8 31.8 39.6 Hughson (2005b) Zinc ZnO production Furnace operator 1 1.245 37.2 37.2 46.4 Hughson (2005b) Zinc ZnO production Furnace operator 2 1.245 19.0 19.0 23.7 Hughson (2005b) Zinc ZnO production Furnace operator 2 1.245 28.4 28.4 35.4 Hughson (2005b) Zinc ZnO production Kiln operator 1.245 33.9 33.9 42.3 Hughson (2005b) Zinc ZnO production Kiln operator 1.245 38.3 38.3 47.7 Hughson (2005b) Zinc Galvanising Acid tank operator 1.818 5.9 5.9 10.7 Hughson (2005b) Zinc Galvanising Acid tank operator 1.818 4.3 4.3 7.9 Hughson (2005b) Zinc Zn refinery Sinter plant - cleaner 1.245 8.5 8.5 10.6 Hughson (2005b) Zinc Zn refinery Sinter plant - machine man 1.245 41.0 41.0 51.0 Hughson (2005b) Zinc Zn refinery Sinter plant - moisture 1.245 12.2 12.2 15.1 Hughson (2005b) Zinc Zn refinery Sinter plant - P/B bins 1.245 3.0 3.0 3.7 Hughson (2005b) Zinc Galvanising Deck hand - Bay 1 1.818 8.7 8.7 15.9 Hughson (2005b) Zinc Galvanising Deck hand - Bay 1 1.818 6.7 6.7 12.3 Hughson (2005b) Zinc Galvanising Deck hand - Bay 1 1.818 15.1 15.1 27.4 Hughson (2005b) Zinc Galvanising Deck hand - Bay 1 1.818 12.2 12.2 22.3 Hughson (2005b) Zinc Galvanising Deck hand - Bay 1 1.818 8.1 8.1 14.7 Hughson (2005b) Zinc Galvanising Deck hand - Bay 1 1.818 19.1 19.1 34.8 Hughson (2005b) Zinc Galvanising Deck hand - Bay 2 1.818 11.1 11.1 20.1 Hughson (2005b)
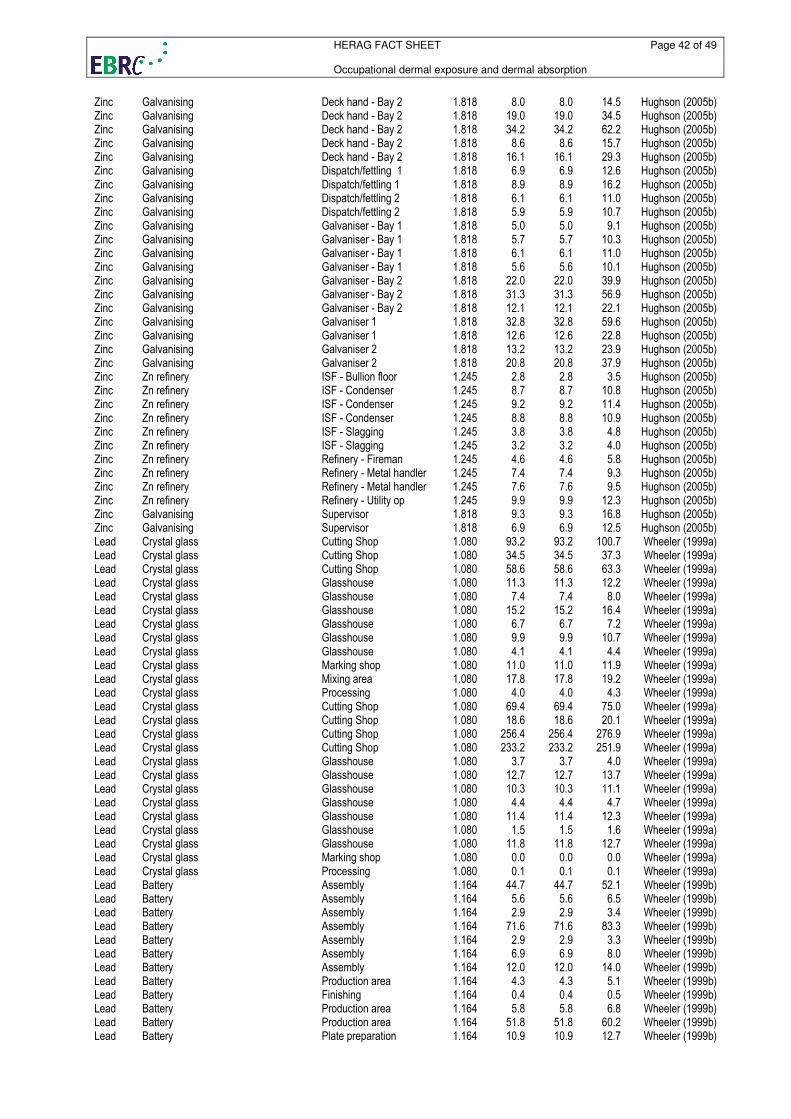
HERAG FACT SHEET Page 42 of 49 Occupational dermal exposure and dermal absorption
Zinc Galvanising Deck hand - Bay 2 1.818 8.0 8.0 14.5 Hughson (2005b) Zinc Galvanising Deck hand - Bay 2 1.818 19.0 19.0 34.5 Hughson (2005b) Zinc Galvanising Deck hand - Bay 2 1.818 34.2 34.2 62.2 Hughson (2005b) Zinc Galvanising Deck hand - Bay 2 1.818 8.6 8.6 15.7 Hughson (2005b) Zinc Galvanising Deck hand - Bay 2 1.818 16.1 16.1 29.3 Hughson (2005b) Zinc Galvanising Dispatch/fettling 1 1.818 6.9 6.9 12.6 Hughson (2005b) Zinc Galvanising Dispatch/fettling 1 1.818 8.9 8.9 16.2 Hughson (2005b) Zinc Galvanising Dispatch/fettling 2 1.818 6.1 6.1 11.0 Hughson (2005b) Zinc Galvanising Dispatch/fettling 2 1.818 5.9 5.9 10.7 Hughson (2005b) Zinc Galvanising Galvaniser - Bay 1 1.818 5.0 5.0 9.1 Hughson (2005b) Zinc Galvanising Galvaniser - Bay 1 1.818 5.7 5.7 10.3 Hughson (2005b) Zinc Galvanising Galvaniser - Bay 1 1.818 6.1 6.1 11.0 Hughson (2005b) Zinc Galvanising Galvaniser - Bay 1 1.818 5.6 5.6 10.1 Hughson (2005b) Zinc Galvanising Galvaniser - Bay 2 1.818 22.0 22.0 39.9 Hughson (2005b) Zinc Galvanising Galvaniser - Bay 2 1.818 31.3 31.3 56.9 Hughson (2005b) Zinc Galvanising Galvaniser - Bay 2 1.818 12.1 12.1 22.1 Hughson (2005b) Zinc Galvanising Galvaniser 1 1.818 32.8 32.8 59.6 Hughson (2005b) Zinc Galvanising Galvaniser 1 1.818 12.6 12.6 22.8 Hughson (2005b) Zinc Galvanising Galvaniser 2 1.818 13.2 13.2 23.9 Hughson (2005b) Zinc Galvanising Galvaniser 2 1.818 20.8 20.8 37.9 Hughson (2005b) Zinc Zn refinery ISF - Bullion floor 1.245 2.8 2.8 3.5 Hughson (2005b) Zinc Zn refinery ISF - Condenser 1.245 8.7 8.7 10.8 Hughson (2005b) Zinc Zn refinery ISF - Condenser 1.245 9.2 9.2 11.4 Hughson (2005b) Zinc Zn refinery ISF - Condenser 1.245 8.8 8.8 10.9 Hughson (2005b) Zinc Zn refinery ISF - Slagging 1.245 3.8 3.8 4.8 Hughson (2005b) Zinc Zn refinery ISF - Slagging 1.245 3.2 3.2 4.0 Hughson (2005b) Zinc Zn refinery Refinery - Fireman 1.245 4.6 4.6 5.8 Hughson (2005b) Zinc Zn refinery Refinery - Metal handler 1.245 7.4 7.4 9.3 Hughson (2005b) Zinc Zn refinery Refinery - Metal handler 1.245 7.6 7.6 9.5 Hughson (2005b) Zinc Zn refinery Refinery - Utility op 1.245 9.9 9.9 12.3 Hughson (2005b) Zinc Galvanising Supervisor 1.818 9.3 9.3 16.8 Hughson (2005b) Zinc Galvanising Supervisor 1.818 6.9 6.9 12.5 Hughson (2005b) Lead Crystal glass Cutting Shop 1.080 93.2 93.2 100.7 Wheeler (1999a) Lead Crystal glass Cutting Shop 1.080 34.5 34.5 37.3 Wheeler (1999a) Lead Crystal glass Cutting Shop 1.080 58.6 58.6 63.3 Wheeler (1999a) Lead Crystal glass Glasshouse 1.080 11.3 11.3 12.2 Wheeler (1999a) Lead Crystal glass Glasshouse 1.080 7.4 7.4 8.0 Wheeler (1999a) Lead Crystal glass Glasshouse 1.080 15.2 15.2 16.4 Wheeler (1999a) Lead Crystal glass Glasshouse 1.080 6.7 6.7 7.2 Wheeler (1999a) Lead Crystal glass Glasshouse 1.080 9.9 9.9 10.7 Wheeler (1999a) Lead Crystal glass Glasshouse 1.080 4.1 4.1 4.4 Wheeler (1999a) Lead Crystal glass Marking shop 1.080 11.0 11.0 11.9 Wheeler (1999a) Lead Crystal glass Mixing area 1.080 17.8 17.8 19.2 Wheeler (1999a) Lead Crystal glass Processing 1.080 4.0 4.0 4.3 Wheeler (1999a) Lead Crystal glass Cutting Shop 1.080 69.4 69.4 75.0 Wheeler (1999a) Lead Crystal glass Cutting Shop 1.080 18.6 18.6 20.1 Wheeler (1999a) Lead Crystal glass Cutting Shop 1.080 256.4 256.4 276.9 Wheeler (1999a) Lead Crystal glass Cutting Shop 1.080 233.2 233.2 251.9 Wheeler (1999a) Lead Crystal glass Glasshouse 1.080 3.7 3.7 4.0 Wheeler (1999a) Lead Crystal glass Glasshouse 1.080 12.7 12.7 13.7 Wheeler (1999a) Lead Crystal glass Glasshouse 1.080 10.3 10.3 11.1 Wheeler (1999a) Lead Crystal glass Glasshouse 1.080 4.4 4.4 4.7 Wheeler (1999a) Lead Crystal glass Glasshouse 1.080 11.4 11.4 12.3 Wheeler (1999a) Lead Crystal glass Glasshouse 1.080 1.5 1.5 1.6 Wheeler (1999a) Lead Crystal glass Glasshouse 1.080 11.8 11.8 12.7 Wheeler (1999a) Lead Crystal glass Marking shop 1.080 0.0 0.0 0.0 Wheeler (1999a) Lead Crystal glass Processing 1.080 0.1 0.1 0.1 Wheeler (1999a) Lead Battery Assembly 1.164 44.7 44.7 52.1 Wheeler (1999b) Lead Battery Assembly 1.164 5.6 5.6 6.5 Wheeler (1999b) Lead Battery Assembly 1.164 2.9 2.9 3.4 Wheeler (1999b) Lead Battery Assembly 1.164 71.6 71.6 83.3 Wheeler (1999b) Lead Battery Assembly 1.164 2.9 2.9 3.3 Wheeler (1999b) Lead Battery Assembly 1.164 6.9 6.9 8.0 Wheeler (1999b) Lead Battery Assembly 1.164 12.0 12.0 14.0 Wheeler (1999b) Lead Battery Production area 1.164 4.3 4.3 5.1 Wheeler (1999b) Lead Battery Finishing 1.164 0.4 0.4 0.5 Wheeler (1999b) Lead Battery Production area 1.164 5.8 5.8 6.8 Wheeler (1999b) Lead Battery Production area 1.164 51.8 51.8 60.2 Wheeler (1999b) Lead Battery Plate preparation 1.164 10.9 10.9 12.7 Wheeler (1999b)
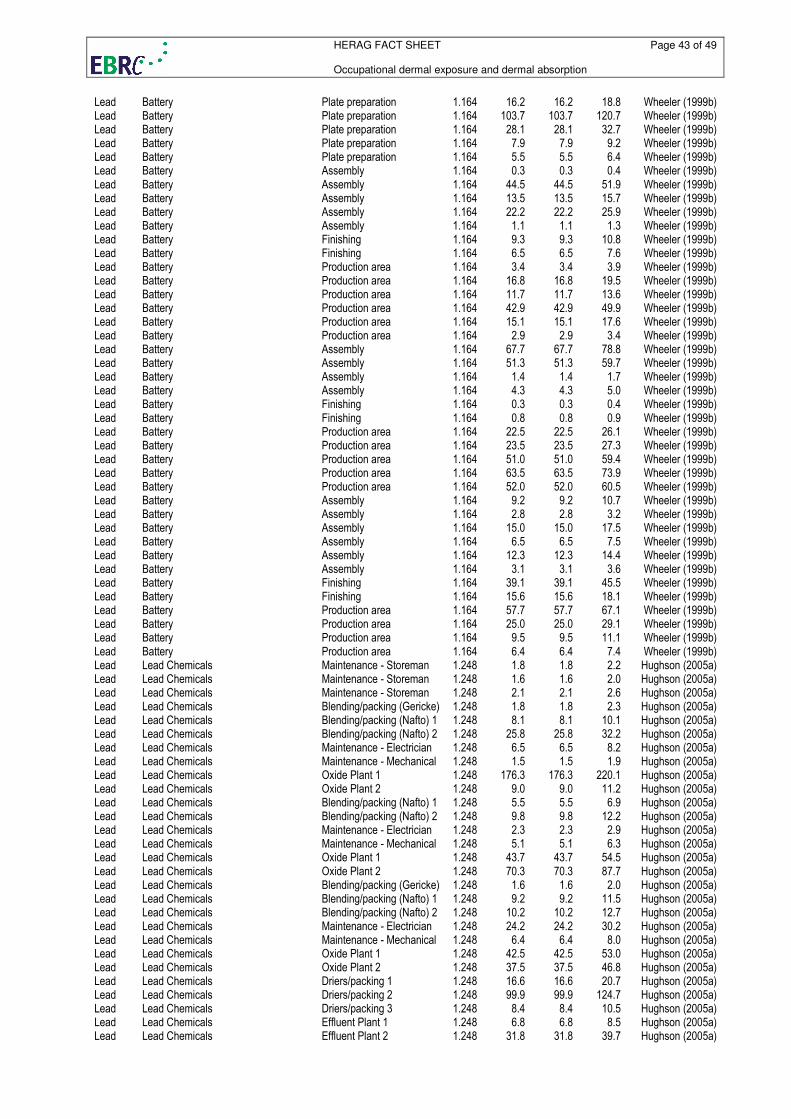
HERAG FACT SHEET Page 43 of 49 Occupational dermal exposure and dermal absorption
Lead Battery Plate preparation 1.164 16.2 16.2 18.8 Wheeler (1999b) Lead Battery Plate preparation 1.164 103.7 103.7 120.7 Wheeler (1999b) Lead Battery Plate preparation 1.164 28.1 28.1 32.7 Wheeler (1999b) Lead Battery Plate preparation 1.164 7.9 7.9 9.2 Wheeler (1999b) Lead Battery Plate preparation 1.164 5.5 5.5 6.4 Wheeler (1999b) Lead Battery Assembly 1.164 0.3 0.3 0.4 Wheeler (1999b) Lead Battery Assembly 1.164 44.5 44.5 51.9 Wheeler (1999b) Lead Battery Assembly 1.164 13.5 13.5 15.7 Wheeler (1999b) Lead Battery Assembly 1.164 22.2 22.2 25.9 Wheeler (1999b) Lead Battery Assembly 1.164 1.1 1.1 1.3 Wheeler (1999b) Lead Battery Finishing 1.164 9.3 9.3 10.8 Wheeler (1999b) Lead Battery Finishing 1.164 6.5 6.5 7.6 Wheeler (1999b) Lead Battery Production area 1.164 3.4 3.4 3.9 Wheeler (1999b) Lead Battery Production area 1.164 16.8 16.8 19.5 Wheeler (1999b) Lead Battery Production area 1.164 11.7 11.7 13.6 Wheeler (1999b) Lead Battery Production area 1.164 42.9 42.9 49.9 Wheeler (1999b) Lead Battery Production area 1.164 15.1 15.1 17.6 Wheeler (1999b) Lead Battery Production area 1.164 2.9 2.9 3.4 Wheeler (1999b) Lead Battery Assembly 1.164 67.7 67.7 78.8 Wheeler (1999b) Lead Battery Assembly 1.164 51.3 51.3 59.7 Wheeler (1999b) Lead Battery Assembly 1.164 1.4 1.4 1.7 Wheeler (1999b) Lead Battery Assembly 1.164 4.3 4.3 5.0 Wheeler (1999b) Lead Battery Finishing 1.164 0.3 0.3 0.4 Wheeler (1999b) Lead Battery Finishing 1.164 0.8 0.8 0.9 Wheeler (1999b) Lead Battery Production area 1.164 22.5 22.5 26.1 Wheeler (1999b) Lead Battery Production area 1.164 23.5 23.5 27.3 Wheeler (1999b) Lead Battery Production area 1.164 51.0 51.0 59.4 Wheeler (1999b) Lead Battery Production area 1.164 63.5 63.5 73.9 Wheeler (1999b) Lead Battery Production area 1.164 52.0 52.0 60.5 Wheeler (1999b) Lead Battery Assembly 1.164 9.2 9.2 10.7 Wheeler (1999b) Lead Battery Assembly 1.164 2.8 2.8 3.2 Wheeler (1999b) Lead Battery Assembly 1.164 15.0 15.0 17.5 Wheeler (1999b) Lead Battery Assembly 1.164 6.5 6.5 7.5 Wheeler (1999b) Lead Battery Assembly 1.164 12.3 12.3 14.4 Wheeler (1999b) Lead Battery Assembly 1.164 3.1 3.1 3.6 Wheeler (1999b) Lead Battery Finishing 1.164 39.1 39.1 45.5 Wheeler (1999b) Lead Battery Finishing 1.164 15.6 15.6 18.1 Wheeler (1999b) Lead Battery Production area 1.164 57.7 57.7 67.1 Wheeler (1999b) Lead Battery Production area 1.164 25.0 25.0 29.1 Wheeler (1999b) Lead Battery Production area 1.164 9.5 9.5 11.1 Wheeler (1999b) Lead Battery Production area 1.164 6.4 6.4 7.4 Wheeler (1999b) Lead Lead Chemicals Maintenance - Storeman 1.248 1.8 1.8 2.2 Hughson (2005a) Lead Lead Chemicals Maintenance - Storeman 1.248 1.6 1.6 2.0 Hughson (2005a) Lead Lead Chemicals Maintenance - Storeman 1.248 2.1 2.1 2.6 Hughson (2005a) Lead Lead Chemicals Blending/packing (Gericke) 1.248 1.8 1.8 2.3 Hughson (2005a) Lead Lead Chemicals Blending/packing (Nafto) 1 1.248 8.1 8.1 10.1 Hughson (2005a) Lead Lead Chemicals Blending/packing (Nafto) 2 1.248 25.8 25.8 32.2 Hughson (2005a) Lead Lead Chemicals Maintenance - Electrician 1.248 6.5 6.5 8.2 Hughson (2005a) Lead Lead Chemicals Maintenance - Mechanical 1.248 1.5 1.5 1.9 Hughson (2005a) Lead Lead Chemicals Oxide Plant 1 1.248 176.3 176.3 220.1 Hughson (2005a) Lead Lead Chemicals Oxide Plant 2 1.248 9.0 9.0 11.2 Hughson (2005a) Lead Lead Chemicals Blending/packing (Nafto) 1 1.248 5.5 5.5 6.9 Hughson (2005a) Lead Lead Chemicals Blending/packing (Nafto) 2 1.248 9.8 9.8 12.2 Hughson (2005a) Lead Lead Chemicals Maintenance - Electrician 1.248 2.3 2.3 2.9 Hughson (2005a) Lead Lead Chemicals Maintenance - Mechanical 1.248 5.1 5.1 6.3 Hughson (2005a) Lead Lead Chemicals Oxide Plant 1 1.248 43.7 43.7 54.5 Hughson (2005a) Lead Lead Chemicals Oxide Plant 2 1.248 70.3 70.3 87.7 Hughson (2005a) Lead Lead Chemicals Blending/packing (Gericke) 1.248 1.6 1.6 2.0 Hughson (2005a) Lead Lead Chemicals Blending/packing (Nafto) 1 1.248 9.2 9.2 11.5 Hughson (2005a) Lead Lead Chemicals Blending/packing (Nafto) 2 1.248 10.2 10.2 12.7 Hughson (2005a) Lead Lead Chemicals Maintenance - Electrician 1.248 24.2 24.2 30.2 Hughson (2005a) Lead Lead Chemicals Maintenance - Mechanical 1.248 6.4 6.4 8.0 Hughson (2005a) Lead Lead Chemicals Oxide Plant 1 1.248 42.5 42.5 53.0 Hughson (2005a) Lead Lead Chemicals Oxide Plant 2 1.248 37.5 37.5 46.8 Hughson (2005a) Lead Lead Chemicals Driers/packing 1 1.248 16.6 16.6 20.7 Hughson (2005a) Lead Lead Chemicals Driers/packing 2 1.248 99.9 99.9 124.7 Hughson (2005a) Lead Lead Chemicals Driers/packing 3 1.248 8.4 8.4 10.5 Hughson (2005a) Lead Lead Chemicals Effluent Plant 1 1.248 6.8 6.8 8.5 Hughson (2005a) Lead Lead Chemicals Effluent Plant 2 1.248 31.8 31.8 39.7 Hughson (2005a)
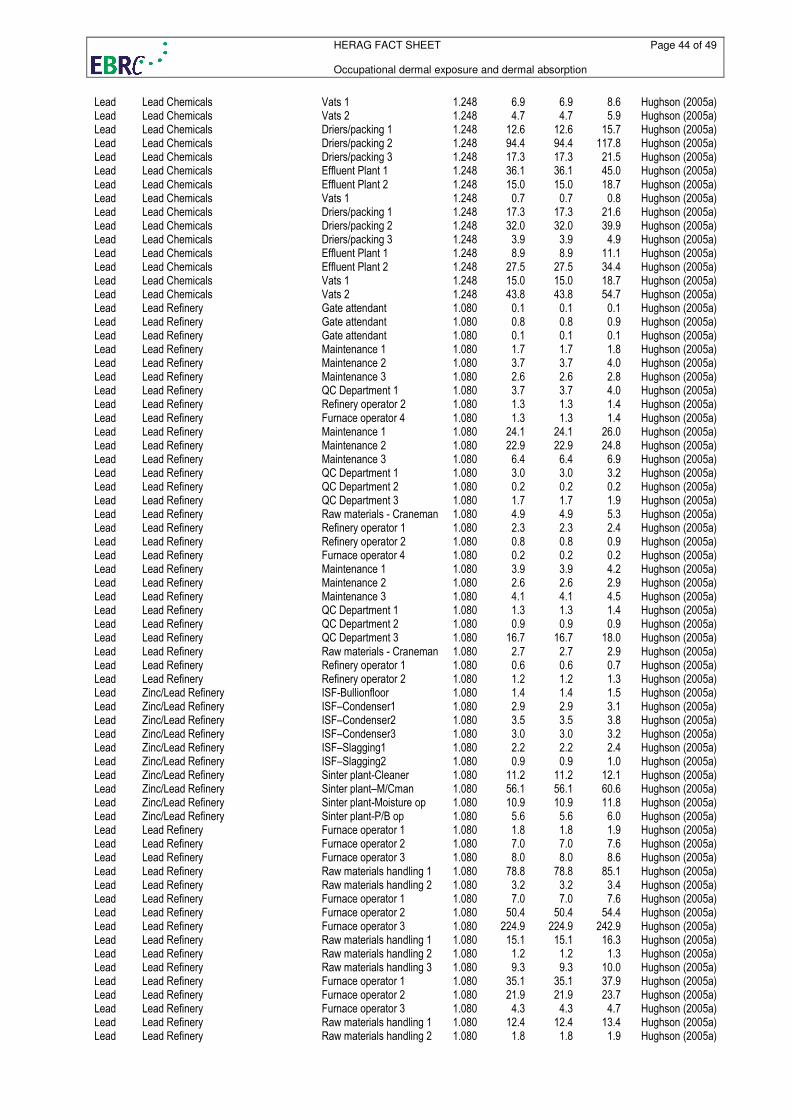
HERAG FACT SHEET Page 44 of 49 Occupational dermal exposure and dermal absorption
Lead Lead Chemicals Vats 1 1.248 6.9 6.9 8.6 Hughson (2005a) Lead Lead Chemicals Vats 2 1.248 4.7 4.7 5.9 Hughson (2005a) Lead Lead Chemicals Driers/packing 1 1.248 12.6 12.6 15.7 Hughson (2005a) Lead Lead Chemicals Driers/packing 2 1.248 94.4 94.4 117.8 Hughson (2005a) Lead Lead Chemicals Driers/packing 3 1.248 17.3 17.3 21.5 Hughson (2005a) Lead Lead Chemicals Effluent Plant 1 1.248 36.1 36.1 45.0 Hughson (2005a) Lead Lead Chemicals Effluent Plant 2 1.248 15.0 15.0 18.7 Hughson (2005a) Lead Lead Chemicals Vats 1 1.248 0.7 0.7 0.8 Hughson (2005a) Lead Lead Chemicals Driers/packing 1 1.248 17.3 17.3 21.6 Hughson (2005a) Lead Lead Chemicals Driers/packing 2 1.248 32.0 32.0 39.9 Hughson (2005a) Lead Lead Chemicals Driers/packing 3 1.248 3.9 3.9 4.9 Hughson (2005a) Lead Lead Chemicals Effluent Plant 1 1.248 8.9 8.9 11.1 Hughson (2005a) Lead Lead Chemicals Effluent Plant 2 1.248 27.5 27.5 34.4 Hughson (2005a) Lead Lead Chemicals Vats 1 1.248 15.0 15.0 18.7 Hughson (2005a) Lead Lead Chemicals Vats 2 1.248 43.8 43.8 54.7 Hughson (2005a) Lead Lead Refinery Gate attendant 1.080 0.1 0.1 0.1 Hughson (2005a) Lead Lead Refinery Gate attendant 1.080 0.8 0.8 0.9 Hughson (2005a) Lead Lead Refinery Gate attendant 1.080 0.1 0.1 0.1 Hughson (2005a) Lead Lead Refinery Maintenance 1 1.080 1.7 1.7 1.8 Hughson (2005a) Lead Lead Refinery Maintenance 2 1.080 3.7 3.7 4.0 Hughson (2005a) Lead Lead Refinery Maintenance 3 1.080 2.6 2.6 2.8 Hughson (2005a) Lead Lead Refinery QC Department 1 1.080 3.7 3.7 4.0 Hughson (2005a) Lead Lead Refinery Refinery operator 2 1.080 1.3 1.3 1.4 Hughson (2005a) Lead Lead Refinery Furnace operator 4 1.080 1.3 1.3 1.4 Hughson (2005a) Lead Lead Refinery Maintenance 1 1.080 24.1 24.1 26.0 Hughson (2005a) Lead Lead Refinery Maintenance 2 1.080 22.9 22.9 24.8 Hughson (2005a) Lead Lead Refinery Maintenance 3 1.080 6.4 6.4 6.9 Hughson (2005a) Lead Lead Refinery QC Department 1 1.080 3.0 3.0 3.2 Hughson (2005a) Lead Lead Refinery QC Department 2 1.080 0.2 0.2 0.2 Hughson (2005a) Lead Lead Refinery QC Department 3 1.080 1.7 1.7 1.9 Hughson (2005a) Lead Lead Refinery Raw materials - Craneman 1.080 4.9 4.9 5.3 Hughson (2005a) Lead Lead Refinery Refinery operator 1 1.080 2.3 2.3 2.4 Hughson (2005a) Lead Lead Refinery Refinery operator 2 1.080 0.8 0.8 0.9 Hughson (2005a) Lead Lead Refinery Furnace operator 4 1.080 0.2 0.2 0.2 Hughson (2005a) Lead Lead Refinery Maintenance 1 1.080 3.9 3.9 4.2 Hughson (2005a) Lead Lead Refinery Maintenance 2 1.080 2.6 2.6 2.9 Hughson (2005a) Lead Lead Refinery Maintenance 3 1.080 4.1 4.1 4.5 Hughson (2005a) Lead Lead Refinery QC Department 1 1.080 1.3 1.3 1.4 Hughson (2005a) Lead Lead Refinery QC Department 2 1.080 0.9 0.9 0.9 Hughson (2005a) Lead Lead Refinery QC Department 3 1.080 16.7 16.7 18.0 Hughson (2005a) Lead Lead Refinery Raw materials - Craneman 1.080 2.7 2.7 2.9 Hughson (2005a) Lead Lead Refinery Refinery operator 1 1.080 0.6 0.6 0.7 Hughson (2005a) Lead Lead Refinery Refinery operator 2 1.080 1.2 1.2 1.3 Hughson (2005a) Lead Zinc/Lead Refinery ISF-Bullionfloor 1.080 1.4 1.4 1.5 Hughson (2005a) Lead Zinc/Lead Refinery ISF–Condenser1 1.080 2.9 2.9 3.1 Hughson (2005a) Lead Zinc/Lead Refinery ISF–Condenser2 1.080 3.5 3.5 3.8 Hughson (2005a) Lead Zinc/Lead Refinery ISF–Condenser3 1.080 3.0 3.0 3.2 Hughson (2005a) Lead Zinc/Lead Refinery ISF–Slagging1 1.080 2.2 2.2 2.4 Hughson (2005a) Lead Zinc/Lead Refinery ISF–Slagging2 1.080 0.9 0.9 1.0 Hughson (2005a) Lead Zinc/Lead Refinery Sinter plant-Cleaner 1.080 11.2 11.2 12.1 Hughson (2005a) Lead Zinc/Lead Refinery Sinter plant–M/Cman 1.080 56.1 56.1 60.6 Hughson (2005a) Lead Zinc/Lead Refinery Sinter plant-Moisture op 1.080 10.9 10.9 11.8 Hughson (2005a) Lead Zinc/Lead Refinery Sinter plant-P/B op 1.080 5.6 5.6 6.0 Hughson (2005a) Lead Lead Refinery Furnace operator 1 1.080 1.8 1.8 1.9 Hughson (2005a) Lead Lead Refinery Furnace operator 2 1.080 7.0 7.0 7.6 Hughson (2005a) Lead Lead Refinery Furnace operator 3 1.080 8.0 8.0 8.6 Hughson (2005a) Lead Lead Refinery Raw materials handling 1 1.080 78.8 78.8 85.1 Hughson (2005a) Lead Lead Refinery Raw materials handling 2 1.080 3.2 3.2 3.4 Hughson (2005a) Lead Lead Refinery Furnace operator 1 1.080 7.0 7.0 7.6 Hughson (2005a) Lead Lead Refinery Furnace operator 2 1.080 50.4 50.4 54.4 Hughson (2005a) Lead Lead Refinery Furnace operator 3 1.080 224.9 224.9 242.9 Hughson (2005a) Lead Lead Refinery Raw materials handling 1 1.080 15.1 15.1 16.3 Hughson (2005a) Lead Lead Refinery Raw materials handling 2 1.080 1.2 1.2 1.3 Hughson (2005a) Lead Lead Refinery Raw materials handling 3 1.080 9.3 9.3 10.0 Hughson (2005a) Lead Lead Refinery Furnace operator 1 1.080 35.1 35.1 37.9 Hughson (2005a) Lead Lead Refinery Furnace operator 2 1.080 21.9 21.9 23.7 Hughson (2005a) Lead Lead Refinery Furnace operator 3 1.080 4.3 4.3 4.7 Hughson (2005a) Lead Lead Refinery Raw materials handling 1 1.080 12.4 12.4 13.4 Hughson (2005a) Lead Lead Refinery Raw materials handling 2 1.080 1.8 1.8 1.9 Hughson (2005a)
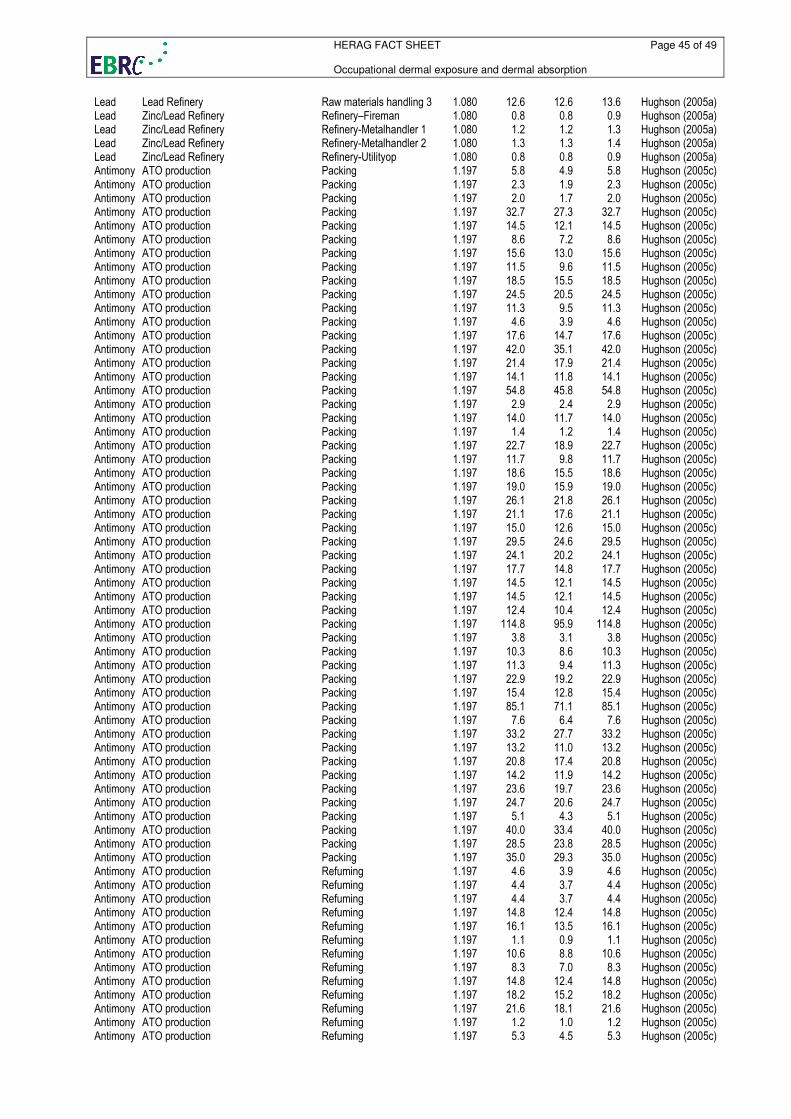
HERAG FACT SHEET Page 45 of 49 Occupational dermal exposure and dermal absorption
Lead Lead Refinery Raw materials handling 3 1.080 12.6 12.6 13.6 Hughson (2005a) Lead Zinc/Lead Refinery Refinery–Fireman 1.080 0.8 0.8 0.9 Hughson (2005a) Lead Zinc/Lead Refinery Refinery-Metalhandler 1 1.080 1.2 1.2 1.3 Hughson (2005a) Lead Zinc/Lead Refinery Refinery-Metalhandler 2 1.080 1.3 1.3 1.4 Hughson (2005a) Lead Zinc/Lead Refinery Refinery-Utilityop 1.080 0.8 0.8 0.9 Hughson (2005a) Antimony ATO production Packing 1.197 5.8 4.9 5.8 Hughson (2005c) Antimony ATO production Packing 1.197 2.3 1.9 2.3 Hughson (2005c) Antimony ATO production Packing 1.197 2.0 1.7 2.0 Hughson (2005c) Antimony ATO production Packing 1.197 32.7 27.3 32.7 Hughson (2005c) Antimony ATO production Packing 1.197 14.5 12.1 14.5 Hughson (2005c) Antimony ATO production Packing 1.197 8.6 7.2 8.6 Hughson (2005c) Antimony ATO production Packing 1.197 15.6 13.0 15.6 Hughson (2005c) Antimony ATO production Packing 1.197 11.5 9.6 11.5 Hughson (2005c) Antimony ATO production Packing 1.197 18.5 15.5 18.5 Hughson (2005c) Antimony ATO production Packing 1.197 24.5 20.5 24.5 Hughson (2005c) Antimony ATO production Packing 1.197 11.3 9.5 11.3 Hughson (2005c) Antimony ATO production Packing 1.197 4.6 3.9 4.6 Hughson (2005c) Antimony ATO production Packing 1.197 17.6 14.7 17.6 Hughson (2005c) Antimony ATO production Packing 1.197 42.0 35.1 42.0 Hughson (2005c) Antimony ATO production Packing 1.197 21.4 17.9 21.4 Hughson (2005c) Antimony ATO production Packing 1.197 14.1 11.8 14.1 Hughson (2005c) Antimony ATO production Packing 1.197 54.8 45.8 54.8 Hughson (2005c) Antimony ATO production Packing 1.197 2.9 2.4 2.9 Hughson (2005c) Antimony ATO production Packing 1.197 14.0 11.7 14.0 Hughson (2005c) Antimony ATO production Packing 1.197 1.4 1.2 1.4 Hughson (2005c) Antimony ATO production Packing 1.197 22.7 18.9 22.7 Hughson (2005c) Antimony ATO production Packing 1.197 11.7 9.8 11.7 Hughson (2005c) Antimony ATO production Packing 1.197 18.6 15.5 18.6 Hughson (2005c) Antimony ATO production Packing 1.197 19.0 15.9 19.0 Hughson (2005c) Antimony ATO production Packing 1.197 26.1 21.8 26.1 Hughson (2005c) Antimony ATO production Packing 1.197 21.1 17.6 21.1 Hughson (2005c) Antimony ATO production Packing 1.197 15.0 12.6 15.0 Hughson (2005c) Antimony ATO production Packing 1.197 29.5 24.6 29.5 Hughson (2005c) Antimony ATO production Packing 1.197 24.1 20.2 24.1 Hughson (2005c) Antimony ATO production Packing 1.197 17.7 14.8 17.7 Hughson (2005c) Antimony ATO production Packing 1.197 14.5 12.1 14.5 Hughson (2005c) Antimony ATO production Packing 1.197 14.5 12.1 14.5 Hughson (2005c) Antimony ATO production Packing 1.197 12.4 10.4 12.4 Hughson (2005c) Antimony ATO production Packing 1.197 114.8 95.9 114.8 Hughson (2005c) Antimony ATO production Packing 1.197 3.8 3.1 3.8 Hughson (2005c) Antimony ATO production Packing 1.197 10.3 8.6 10.3 Hughson (2005c) Antimony ATO production Packing 1.197 11.3 9.4 11.3 Hughson (2005c) Antimony ATO production Packing 1.197 22.9 19.2 22.9 Hughson (2005c) Antimony ATO production Packing 1.197 15.4 12.8 15.4 Hughson (2005c) Antimony ATO production Packing 1.197 85.1 71.1 85.1 Hughson (2005c) Antimony ATO production Packing 1.197 7.6 6.4 7.6 Hughson (2005c) Antimony ATO production Packing 1.197 33.2 27.7 33.2 Hughson (2005c) Antimony ATO production Packing 1.197 13.2 11.0 13.2 Hughson (2005c) Antimony ATO production Packing 1.197 20.8 17.4 20.8 Hughson (2005c) Antimony ATO production Packing 1.197 14.2 11.9 14.2 Hughson (2005c) Antimony ATO production Packing 1.197 23.6 19.7 23.6 Hughson (2005c) Antimony ATO production Packing 1.197 24.7 20.6 24.7 Hughson (2005c) Antimony ATO production Packing 1.197 5.1 4.3 5.1 Hughson (2005c) Antimony ATO production Packing 1.197 40.0 33.4 40.0 Hughson (2005c) Antimony ATO production Packing 1.197 28.5 23.8 28.5 Hughson (2005c) Antimony ATO production Packing 1.197 35.0 29.3 35.0 Hughson (2005c) Antimony ATO production Refuming 1.197 4.6 3.9 4.6 Hughson (2005c) Antimony ATO production Refuming 1.197 4.4 3.7 4.4 Hughson (2005c) Antimony ATO production Refuming 1.197 4.4 3.7 4.4 Hughson (2005c) Antimony ATO production Refuming 1.197 14.8 12.4 14.8 Hughson (2005c) Antimony ATO production Refuming 1.197 16.1 13.5 16.1 Hughson (2005c) Antimony ATO production Refuming 1.197 1.1 0.9 1.1 Hughson (2005c) Antimony ATO production Refuming 1.197 10.6 8.8 10.6 Hughson (2005c) Antimony ATO production Refuming 1.197 8.3 7.0 8.3 Hughson (2005c) Antimony ATO production Refuming 1.197 14.8 12.4 14.8 Hughson (2005c) Antimony ATO production Refuming 1.197 18.2 15.2 18.2 Hughson (2005c) Antimony ATO production Refuming 1.197 21.6 18.1 21.6 Hughson (2005c) Antimony ATO production Refuming 1.197 1.2 1.0 1.2 Hughson (2005c) Antimony ATO production Refuming 1.197 5.3 4.5 5.3 Hughson (2005c)
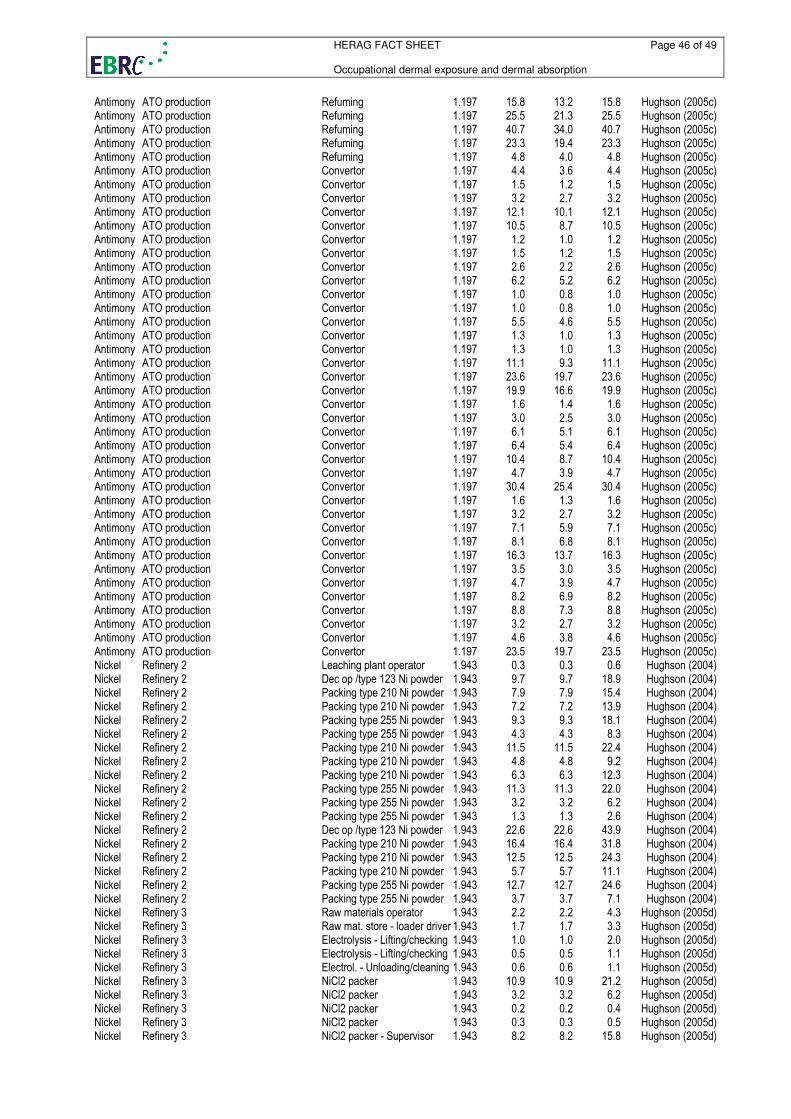
HERAG FACT SHEET Page 46 of 49 Occupational dermal exposure and dermal absorption
Antimony ATO production Refuming 1.197 15.8 13.2 15.8 Hughson (2005c) Antimony ATO production Refuming 1.197 25.5 21.3 25.5 Hughson (2005c) Antimony ATO production Refuming 1.197 40.7 34.0 40.7 Hughson (2005c) Antimony ATO production Refuming 1.197 23.3 19.4 23.3 Hughson (2005c) Antimony ATO production Refuming 1.197 4.8 4.0 4.8 Hughson (2005c) Antimony ATO production Convertor 1.197 4.4 3.6 4.4 Hughson (2005c) Antimony ATO production Convertor 1.197 1.5 1.2 1.5 Hughson (2005c) Antimony ATO production Convertor 1.197 3.2 2.7 3.2 Hughson (2005c) Antimony ATO production Convertor 1.197 12.1 10.1 12.1 Hughson (2005c) Antimony ATO production Convertor 1.197 10.5 8.7 10.5 Hughson (2005c) Antimony ATO production Convertor 1.197 1.2 1.0 1.2 Hughson (2005c) Antimony ATO production Convertor 1.197 1.5 1.2 1.5 Hughson (2005c) Antimony ATO production Convertor 1.197 2.6 2.2 2.6 Hughson (2005c) Antimony ATO production Convertor 1.197 6.2 5.2 6.2 Hughson (2005c) Antimony ATO production Convertor 1.197 1.0 0.8 1.0 Hughson (2005c) Antimony ATO production Convertor 1.197 1.0 0.8 1.0 Hughson (2005c) Antimony ATO production Convertor 1.197 5.5 4.6 5.5 Hughson (2005c) Antimony ATO production Convertor 1.197 1.3 1.0 1.3 Hughson (2005c) Antimony ATO production Convertor 1.197 1.3 1.0 1.3 Hughson (2005c) Antimony ATO production Convertor 1.197 11.1 9.3 11.1 Hughson (2005c) Antimony ATO production Convertor 1.197 23.6 19.7 23.6 Hughson (2005c) Antimony ATO production Convertor 1.197 19.9 16.6 19.9 Hughson (2005c) Antimony ATO production Convertor 1.197 1.6 1.4 1.6 Hughson (2005c) Antimony ATO production Convertor 1.197 3.0 2.5 3.0 Hughson (2005c) Antimony ATO production Convertor 1.197 6.1 5.1 6.1 Hughson (2005c) Antimony ATO production Convertor 1.197 6.4 5.4 6.4 Hughson (2005c) Antimony ATO production Convertor 1.197 10.4 8.7 10.4 Hughson (2005c) Antimony ATO production Convertor 1.197 4.7 3.9 4.7 Hughson (2005c) Antimony ATO production Convertor 1.197 30.4 25.4 30.4 Hughson (2005c) Antimony ATO production Convertor 1.197 1.6 1.3 1.6 Hughson (2005c) Antimony ATO production Convertor 1.197 3.2 2.7 3.2 Hughson (2005c) Antimony ATO production Convertor 1.197 7.1 5.9 7.1 Hughson (2005c) Antimony ATO production Convertor 1.197 8.1 6.8 8.1 Hughson (2005c) Antimony ATO production Convertor 1.197 16.3 13.7 16.3 Hughson (2005c) Antimony ATO production Convertor 1.197 3.5 3.0 3.5 Hughson (2005c) Antimony ATO production Convertor 1.197 4.7 3.9 4.7 Hughson (2005c) Antimony ATO production Convertor 1.197 8.2 6.9 8.2 Hughson (2005c) Antimony ATO production Convertor 1.197 8.8 7.3 8.8 Hughson (2005c) Antimony ATO production Convertor 1.197 3.2 2.7 3.2 Hughson (2005c) Antimony ATO production Convertor 1.197 4.6 3.8 4.6 Hughson (2005c) Antimony ATO production Convertor 1.197 23.5 19.7 23.5 Hughson (2005c) Nickel Refinery 2 Leaching plant operator 1.943 0.3 0.3 0.6 Hughson (2004) Nickel Refinery 2 Dec op /type 123 Ni powder 1.943 9.7 9.7 18.9 Hughson (2004) Nickel Refinery 2 Packing type 210 Ni powder 1.943 7.9 7.9 15.4 Hughson (2004) Nickel Refinery 2 Packing type 210 Ni powder 1.943 7.2 7.2 13.9 Hughson (2004) Nickel Refinery 2 Packing type 255 Ni powder 1.943 9.3 9.3 18.1 Hughson (2004) Nickel Refinery 2 Packing type 255 Ni powder 1.943 4.3 4.3 8.3 Hughson (2004) Nickel Refinery 2 Packing type 210 Ni powder 1.943 11.5 11.5 22.4 Hughson (2004) Nickel Refinery 2 Packing type 210 Ni powder 1.943 4.8 4.8 9.2 Hughson (2004) Nickel Refinery 2 Packing type 210 Ni powder 1.943 6.3 6.3 12.3 Hughson (2004) Nickel Refinery 2 Packing type 255 Ni powder 1.943 11.3 11.3 22.0 Hughson (2004) Nickel Refinery 2 Packing type 255 Ni powder 1.943 3.2 3.2 6.2 Hughson (2004) Nickel Refinery 2 Packing type 255 Ni powder 1.943 1.3 1.3 2.6 Hughson (2004) Nickel Refinery 2 Dec op /type 123 Ni powder 1.943 22.6 22.6 43.9 Hughson (2004) Nickel Refinery 2 Packing type 210 Ni powder 1.943 16.4 16.4 31.8 Hughson (2004) Nickel Refinery 2 Packing type 210 Ni powder 1.943 12.5 12.5 24.3 Hughson (2004) Nickel Refinery 2 Packing type 210 Ni powder 1.943 5.7 5.7 11.1 Hughson (2004) Nickel Refinery 2 Packing type 255 Ni powder 1.943 12.7 12.7 24.6 Hughson (2004) Nickel Refinery 2 Packing type 255 Ni powder 1.943 3.7 3.7 7.1 Hughson (2004) Nickel Refinery 3 Raw materials operator 1.943 2.2 2.2 4.3 Hughson (2005d) Nickel Refinery 3 Raw mat. store - loader driver 1.943 1.7 1.7 3.3 Hughson (2005d) Nickel Refinery 3 Electrolysis - Lifting/checking 1.943 1.0 1.0 2.0 Hughson (2005d) Nickel Refinery 3 Electrolysis - Lifting/checking 1.943 0.5 0.5 1.1 Hughson (2005d) Nickel Refinery 3 Electrol. - Unloading/cleaning 1.943 0.6 0.6 1.1 Hughson (2005d) Nickel Refinery 3 NiCl2 packer 1.943 10.9 10.9 21.2 Hughson (2005d) Nickel Refinery 3 NiCl2 packer 1.943 3.2 3.2 6.2 Hughson (2005d) Nickel Refinery 3 NiCl2 packer 1.943 0.2 0.2 0.4 Hughson (2005d) Nickel Refinery 3 NiCl2 packer 1.943 0.3 0.3 0.5 Hughson (2005d) Nickel Refinery 3 NiCl2 packer - Supervisor 1.943 8.2 8.2 15.8 Hughson (2005d)
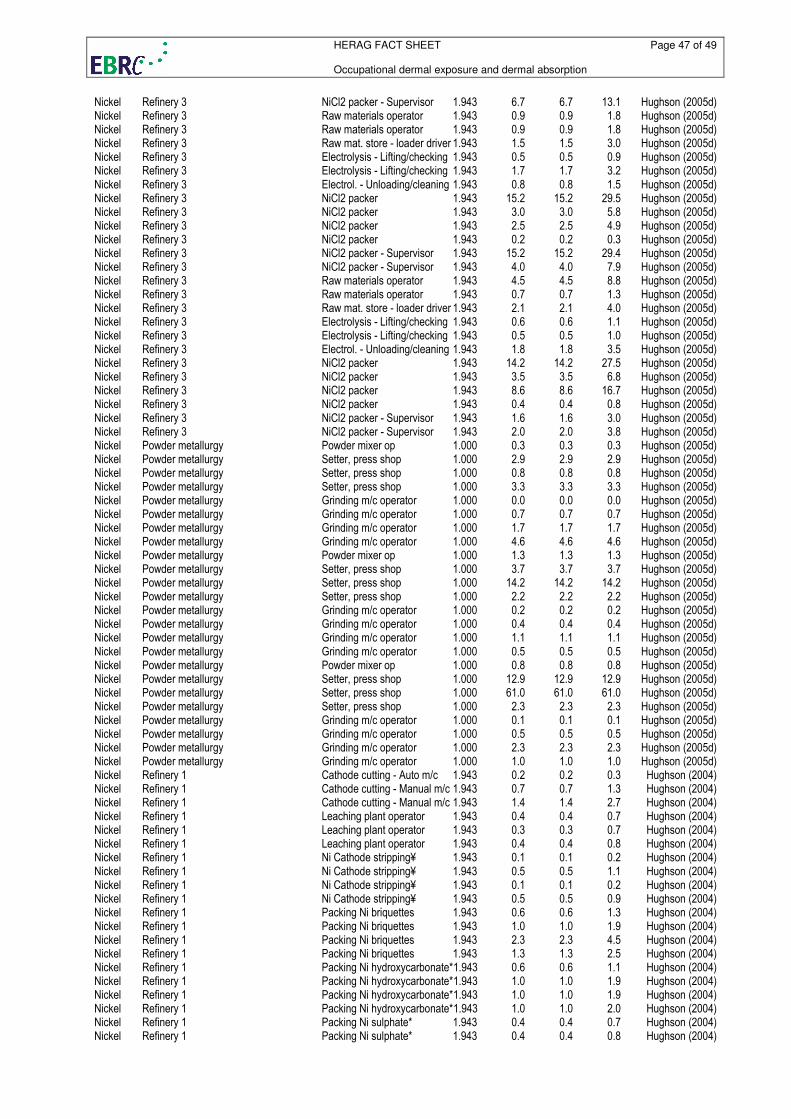
HERAG FACT SHEET Page 47 of 49 Occupational dermal exposure and dermal absorption
Nickel Refinery 3 NiCl2 packer - Supervisor 1.943 6.7 6.7 13.1 Hughson (2005d) Nickel Refinery 3 Raw materials operator 1.943 0.9 0.9 1.8 Hughson (2005d) Nickel Refinery 3 Raw materials operator 1.943 0.9 0.9 1.8 Hughson (2005d) Nickel Refinery 3 Raw mat. store - loader driver 1.943 1.5 1.5 3.0 Hughson (2005d) Nickel Refinery 3 Electrolysis - Lifting/checking 1.943 0.5 0.5 0.9 Hughson (2005d) Nickel Refinery 3 Electrolysis - Lifting/checking 1.943 1.7 1.7 3.2 Hughson (2005d) Nickel Refinery 3 Electrol. - Unloading/cleaning 1.943 0.8 0.8 1.5 Hughson (2005d) Nickel Refinery 3 NiCl2 packer 1.943 15.2 15.2 29.5 Hughson (2005d) Nickel Refinery 3 NiCl2 packer 1.943 3.0 3.0 5.8 Hughson (2005d) Nickel Refinery 3 NiCl2 packer 1.943 2.5 2.5 4.9 Hughson (2005d) Nickel Refinery 3 NiCl2 packer 1.943 0.2 0.2 0.3 Hughson (2005d) Nickel Refinery 3 NiCl2 packer - Supervisor 1.943 15.2 15.2 29.4 Hughson (2005d) Nickel Refinery 3 NiCl2 packer - Supervisor 1.943 4.0 4.0 7.9 Hughson (2005d) Nickel Refinery 3 Raw materials operator 1.943 4.5 4.5 8.8 Hughson (2005d) Nickel Refinery 3 Raw materials operator 1.943 0.7 0.7 1.3 Hughson (2005d) Nickel Refinery 3 Raw mat. store - loader driver 1.943 2.1 2.1 4.0 Hughson (2005d) Nickel Refinery 3 Electrolysis - Lifting/checking 1.943 0.6 0.6 1.1 Hughson (2005d) Nickel Refinery 3 Electrolysis - Lifting/checking 1.943 0.5 0.5 1.0 Hughson (2005d) Nickel Refinery 3 Electrol. - Unloading/cleaning 1.943 1.8 1.8 3.5 Hughson (2005d) Nickel Refinery 3 NiCl2 packer 1.943 14.2 14.2 27.5 Hughson (2005d) Nickel Refinery 3 NiCl2 packer 1.943 3.5 3.5 6.8 Hughson (2005d) Nickel Refinery 3 NiCl2 packer 1.943 8.6 8.6 16.7 Hughson (2005d) Nickel Refinery 3 NiCl2 packer 1.943 0.4 0.4 0.8 Hughson (2005d) Nickel Refinery 3 NiCl2 packer - Supervisor 1.943 1.6 1.6 3.0 Hughson (2005d) Nickel Refinery 3 NiCl2 packer - Supervisor 1.943 2.0 2.0 3.8 Hughson (2005d) Nickel Powder metallurgy Powder mixer op 1.000 0.3 0.3 0.3 Hughson (2005d) Nickel Powder metallurgy Setter, press shop 1.000 2.9 2.9 2.9 Hughson (2005d) Nickel Powder metallurgy Setter, press shop 1.000 0.8 0.8 0.8 Hughson (2005d) Nickel Powder metallurgy Setter, press shop 1.000 3.3 3.3 3.3 Hughson (2005d) Nickel Powder metallurgy Grinding m/c operator 1.000 0.0 0.0 0.0 Hughson (2005d) Nickel Powder metallurgy Grinding m/c operator 1.000 0.7 0.7 0.7 Hughson (2005d) Nickel Powder metallurgy Grinding m/c operator 1.000 1.7 1.7 1.7 Hughson (2005d) Nickel Powder metallurgy Grinding m/c operator 1.000 4.6 4.6 4.6 Hughson (2005d) Nickel Powder metallurgy Powder mixer op 1.000 1.3 1.3 1.3 Hughson (2005d) Nickel Powder metallurgy Setter, press shop 1.000 3.7 3.7 3.7 Hughson (2005d) Nickel Powder metallurgy Setter, press shop 1.000 14.2 14.2 14.2 Hughson (2005d) Nickel Powder metallurgy Setter, press shop 1.000 2.2 2.2 2.2 Hughson (2005d) Nickel Powder metallurgy Grinding m/c operator 1.000 0.2 0.2 0.2 Hughson (2005d) Nickel Powder metallurgy Grinding m/c operator 1.000 0.4 0.4 0.4 Hughson (2005d) Nickel Powder metallurgy Grinding m/c operator 1.000 1.1 1.1 1.1 Hughson (2005d) Nickel Powder metallurgy Grinding m/c operator 1.000 0.5 0.5 0.5 Hughson (2005d) Nickel Powder metallurgy Powder mixer op 1.000 0.8 0.8 0.8 Hughson (2005d) Nickel Powder metallurgy Setter, press shop 1.000 12.9 12.9 12.9 Hughson (2005d) Nickel Powder metallurgy Setter, press shop 1.000 61.0 61.0 61.0 Hughson (2005d) Nickel Powder metallurgy Setter, press shop 1.000 2.3 2.3 2.3 Hughson (2005d) Nickel Powder metallurgy Grinding m/c operator 1.000 0.1 0.1 0.1 Hughson (2005d) Nickel Powder metallurgy Grinding m/c operator 1.000 0.5 0.5 0.5 Hughson (2005d) Nickel Powder metallurgy Grinding m/c operator 1.000 2.3 2.3 2.3 Hughson (2005d) Nickel Powder metallurgy Grinding m/c operator 1.000 1.0 1.0 1.0 Hughson (2005d) Nickel Refinery 1 Cathode cutting - Auto m/c 1.943 0.2 0.2 0.3 Hughson (2004) Nickel Refinery 1 Cathode cutting - Manual m/c 1.943 0.7 0.7 1.3 Hughson (2004) Nickel Refinery 1 Cathode cutting - Manual m/c 1.943 1.4 1.4 2.7 Hughson (2004) Nickel Refinery 1 Leaching plant operator 1.943 0.4 0.4 0.7 Hughson (2004) Nickel Refinery 1 Leaching plant operator 1.943 0.3 0.3 0.7 Hughson (2004) Nickel Refinery 1 Leaching plant operator 1.943 0.4 0.4 0.8 Hughson (2004) Nickel Refinery 1 Ni Cathode stripping¥ 1.943 0.1 0.1 0.2 Hughson (2004) Nickel Refinery 1 Ni Cathode stripping¥ 1.943 0.5 0.5 1.1 Hughson (2004) Nickel Refinery 1 Ni Cathode stripping¥ 1.943 0.1 0.1 0.2 Hughson (2004) Nickel Refinery 1 Ni Cathode stripping¥ 1.943 0.5 0.5 0.9 Hughson (2004) Nickel Refinery 1 Packing Ni briquettes 1.943 0.6 0.6 1.3 Hughson (2004) Nickel Refinery 1 Packing Ni briquettes 1.943 1.0 1.0 1.9 Hughson (2004) Nickel Refinery 1 Packing Ni briquettes 1.943 2.3 2.3 4.5 Hughson (2004) Nickel Refinery 1 Packing Ni briquettes 1.943 1.3 1.3 2.5 Hughson (2004) Nickel Refinery 1 Packing Ni hydroxycarbonate*1.943 0.6 0.6 1.1 Hughson (2004) Nickel Refinery 1 Packing Ni hydroxycarbonate*1.943 1.0 1.0 1.9 Hughson (2004) Nickel Refinery 1 Packing Ni hydroxycarbonate*1.943 1.0 1.0 1.9 Hughson (2004) Nickel Refinery 1 Packing Ni hydroxycarbonate*1.943 1.0 1.0 2.0 Hughson (2004) Nickel Refinery 1 Packing Ni sulphate* 1.943 0.4 0.4 0.7 Hughson (2004) Nickel Refinery 1 Packing Ni sulphate* 1.943 0.4 0.4 0.8 Hughson (2004)
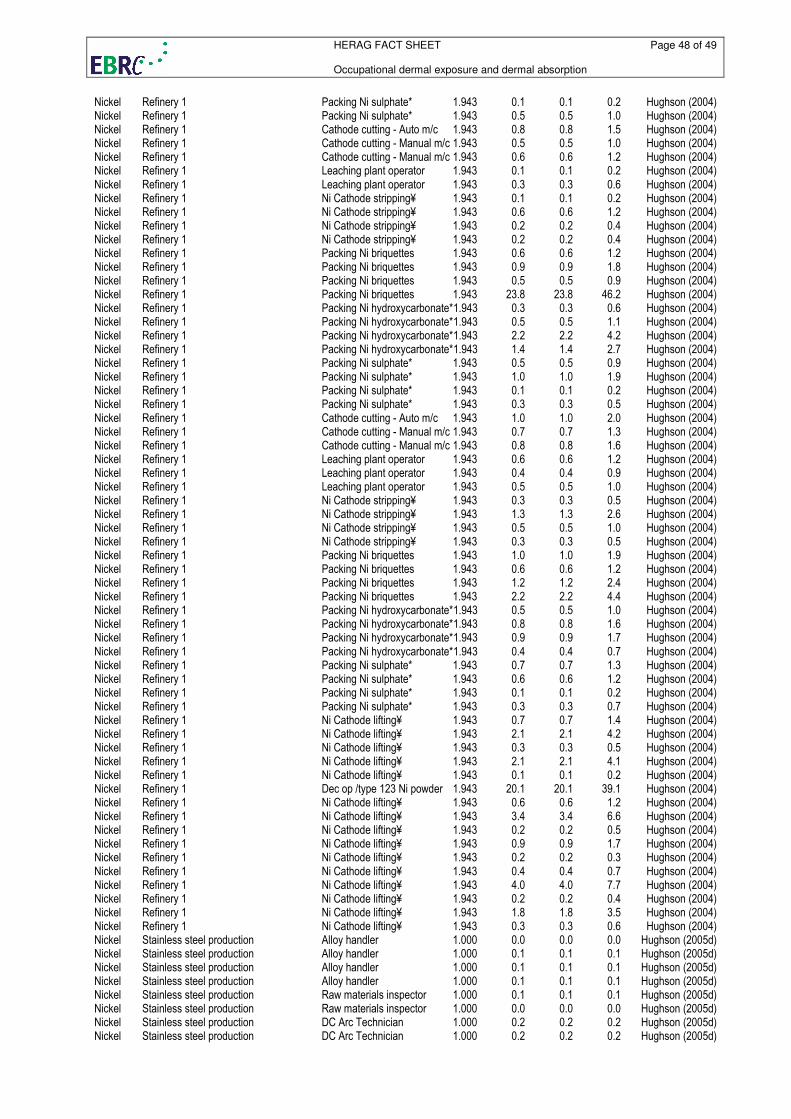
HERAG FACT SHEET Page 48 of 49 Occupational dermal exposure and dermal absorption
Nickel Refinery 1 Packing Ni sulphate* 1.943 0.1 0.1 0.2 Hughson (2004) Nickel Refinery 1 Packing Ni sulphate* 1.943 0.5 0.5 1.0 Hughson (2004) Nickel Refinery 1 Cathode cutting - Auto m/c 1.943 0.8 0.8 1.5 Hughson (2004) Nickel Refinery 1 Cathode cutting - Manual m/c 1.943 0.5 0.5 1.0 Hughson (2004) Nickel Refinery 1 Cathode cutting - Manual m/c 1.943 0.6 0.6 1.2 Hughson (2004) Nickel Refinery 1 Leaching plant operator 1.943 0.1 0.1 0.2 Hughson (2004) Nickel Refinery 1 Leaching plant operator 1.943 0.3 0.3 0.6 Hughson (2004) Nickel Refinery 1 Ni Cathode stripping¥ 1.943 0.1 0.1 0.2 Hughson (2004) Nickel Refinery 1 Ni Cathode stripping¥ 1.943 0.6 0.6 1.2 Hughson (2004) Nickel Refinery 1 Ni Cathode stripping¥ 1.943 0.2 0.2 0.4 Hughson (2004) Nickel Refinery 1 Ni Cathode stripping¥ 1.943 0.2 0.2 0.4 Hughson (2004) Nickel Refinery 1 Packing Ni briquettes 1.943 0.6 0.6 1.2 Hughson (2004) Nickel Refinery 1 Packing Ni briquettes 1.943 0.9 0.9 1.8 Hughson (2004) Nickel Refinery 1 Packing Ni briquettes 1.943 0.5 0.5 0.9 Hughson (2004) Nickel Refinery 1 Packing Ni briquettes 1.943 23.8 23.8 46.2 Hughson (2004) Nickel Refinery 1 Packing Ni hydroxycarbonate*1.943 0.3 0.3 0.6 Hughson (2004) Nickel Refinery 1 Packing Ni hydroxycarbonate*1.943 0.5 0.5 1.1 Hughson (2004) Nickel Refinery 1 Packing Ni hydroxycarbonate*1.943 2.2 2.2 4.2 Hughson (2004) Nickel Refinery 1 Packing Ni hydroxycarbonate*1.943 1.4 1.4 2.7 Hughson (2004) Nickel Refinery 1 Packing Ni sulphate* 1.943 0.5 0.5 0.9 Hughson (2004) Nickel Refinery 1 Packing Ni sulphate* 1.943 1.0 1.0 1.9 Hughson (2004) Nickel Refinery 1 Packing Ni sulphate* 1.943 0.1 0.1 0.2 Hughson (2004) Nickel Refinery 1 Packing Ni sulphate* 1.943 0.3 0.3 0.5 Hughson (2004) Nickel Refinery 1 Cathode cutting - Auto m/c 1.943 1.0 1.0 2.0 Hughson (2004) Nickel Refinery 1 Cathode cutting - Manual m/c 1.943 0.7 0.7 1.3 Hughson (2004) Nickel Refinery 1 Cathode cutting - Manual m/c 1.943 0.8 0.8 1.6 Hughson (2004) Nickel Refinery 1 Leaching plant operator 1.943 0.6 0.6 1.2 Hughson (2004) Nickel Refinery 1 Leaching plant operator 1.943 0.4 0.4 0.9 Hughson (2004) Nickel Refinery 1 Leaching plant operator 1.943 0.5 0.5 1.0 Hughson (2004) Nickel Refinery 1 Ni Cathode stripping¥ 1.943 0.3 0.3 0.5 Hughson (2004) Nickel Refinery 1 Ni Cathode stripping¥ 1.943 1.3 1.3 2.6 Hughson (2004) Nickel Refinery 1 Ni Cathode stripping¥ 1.943 0.5 0.5 1.0 Hughson (2004) Nickel Refinery 1 Ni Cathode stripping¥ 1.943 0.3 0.3 0.5 Hughson (2004) Nickel Refinery 1 Packing Ni briquettes 1.943 1.0 1.0 1.9 Hughson (2004) Nickel Refinery 1 Packing Ni briquettes 1.943 0.6 0.6 1.2 Hughson (2004) Nickel Refinery 1 Packing Ni briquettes 1.943 1.2 1.2 2.4 Hughson (2004) Nickel Refinery 1 Packing Ni briquettes 1.943 2.2 2.2 4.4 Hughson (2004) Nickel Refinery 1 Packing Ni hydroxycarbonate*1.943 0.5 0.5 1.0 Hughson (2004) Nickel Refinery 1 Packing Ni hydroxycarbonate*1.943 0.8 0.8 1.6 Hughson (2004) Nickel Refinery 1 Packing Ni hydroxycarbonate*1.943 0.9 0.9 1.7 Hughson (2004) Nickel Refinery 1 Packing Ni hydroxycarbonate*1.943 0.4 0.4 0.7 Hughson (2004) Nickel Refinery 1 Packing Ni sulphate* 1.943 0.7 0.7 1.3 Hughson (2004) Nickel Refinery 1 Packing Ni sulphate* 1.943 0.6 0.6 1.2 Hughson (2004) Nickel Refinery 1 Packing Ni sulphate* 1.943 0.1 0.1 0.2 Hughson (2004) Nickel Refinery 1 Packing Ni sulphate* 1.943 0.3 0.3 0.7 Hughson (2004) Nickel Refinery 1 Ni Cathode lifting¥ 1.943 0.7 0.7 1.4 Hughson (2004) Nickel Refinery 1 Ni Cathode lifting¥ 1.943 2.1 2.1 4.2 Hughson (2004) Nickel Refinery 1 Ni Cathode lifting¥ 1.943 0.3 0.3 0.5 Hughson (2004) Nickel Refinery 1 Ni Cathode lifting¥ 1.943 2.1 2.1 4.1 Hughson (2004) Nickel Refinery 1 Ni Cathode lifting¥ 1.943 0.1 0.1 0.2 Hughson (2004) Nickel Refinery 1 Dec op /type 123 Ni powder 1.943 20.1 20.1 39.1 Hughson (2004) Nickel Refinery 1 Ni Cathode lifting¥ 1.943 0.6 0.6 1.2 Hughson (2004) Nickel Refinery 1 Ni Cathode lifting¥ 1.943 3.4 3.4 6.6 Hughson (2004) Nickel Refinery 1 Ni Cathode lifting¥ 1.943 0.2 0.2 0.5 Hughson (2004) Nickel Refinery 1 Ni Cathode lifting¥ 1.943 0.9 0.9 1.7 Hughson (2004) Nickel Refinery 1 Ni Cathode lifting¥ 1.943 0.2 0.2 0.3 Hughson (2004) Nickel Refinery 1 Ni Cathode lifting¥ 1.943 0.4 0.4 0.7 Hughson (2004) Nickel Refinery 1 Ni Cathode lifting¥ 1.943 4.0 4.0 7.7 Hughson (2004) Nickel Refinery 1 Ni Cathode lifting¥ 1.943 0.2 0.2 0.4 Hughson (2004) Nickel Refinery 1 Ni Cathode lifting¥ 1.943 1.8 1.8 3.5 Hughson (2004) Nickel Refinery 1 Ni Cathode lifting¥ 1.943 0.3 0.3 0.6 Hughson (2004) Nickel Stainless steel production Alloy handler 1.000 0.0 0.0 0.0 Hughson (2005d) Nickel Stainless steel production Alloy handler 1.000 0.1 0.1 0.1 Hughson (2005d) Nickel Stainless steel production Alloy handler 1.000 0.1 0.1 0.1 Hughson (2005d) Nickel Stainless steel production Alloy handler 1.000 0.1 0.1 0.1 Hughson (2005d) Nickel Stainless steel production Raw materials inspector 1.000 0.1 0.1 0.1 Hughson (2005d) Nickel Stainless steel production Raw materials inspector 1.000 0.0 0.0 0.0 Hughson (2005d) Nickel Stainless steel production DC Arc Technician 1.000 0.2 0.2 0.2 Hughson (2005d) Nickel Stainless steel production DC Arc Technician 1.000 0.2 0.2 0.2 Hughson (2005d)
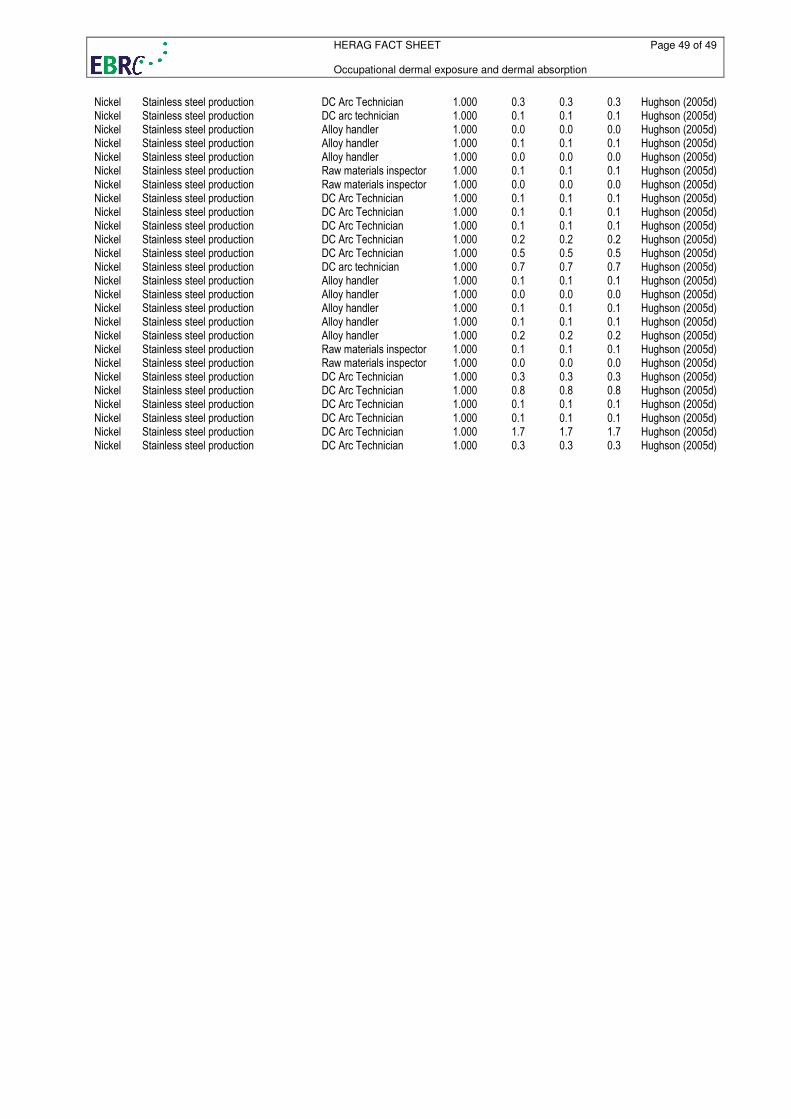
HERAG FACT SHEET Page 49 of 49 Occupational dermal exposure and dermal absorption
Nickel Stainless steel production DC Arc Technician 1.000 0.3 0.3 0.3 Hughson (2005d) Nickel Stainless steel production DC arc technician 1.000 0.1 0.1 0.1 Hughson (2005d) Nickel Stainless steel production Alloy handler 1.000 0.0 0.0 0.0 Hughson (2005d) Nickel Stainless steel production Alloy handler 1.000 0.1 0.1 0.1 Hughson (2005d) Nickel Stainless steel production Alloy handler 1.000 0.0 0.0 0.0 Hughson (2005d) Nickel Stainless steel production Raw materials inspector 1.000 0.1 0.1 0.1 Hughson (2005d) Nickel Stainless steel production Raw materials inspector 1.000 0.0 0.0 0.0 Hughson (2005d) Nickel Stainless steel production DC Arc Technician 1.000 0.1 0.1 0.1 Hughson (2005d) Nickel Stainless steel production DC Arc Technician 1.000 0.1 0.1 0.1 Hughson (2005d) Nickel Stainless steel production DC Arc Technician 1.000 0.1 0.1 0.1 Hughson (2005d) Nickel Stainless steel production DC Arc Technician 1.000 0.2 0.2 0.2 Hughson (2005d) Nickel Stainless steel production DC Arc Technician 1.000 0.5 0.5 0.5 Hughson (2005d) Nickel Stainless steel production DC arc technician 1.000 0.7 0.7 0.7 Hughson (2005d) Nickel Stainless steel production Alloy handler 1.000 0.1 0.1 0.1 Hughson (2005d) Nickel Stainless steel production Alloy handler 1.000 0.0 0.0 0.0 Hughson (2005d) Nickel Stainless steel production Alloy handler 1.000 0.1 0.1 0.1 Hughson (2005d) Nickel Stainless steel production Alloy handler 1.000 0.1 0.1 0.1 Hughson (2005d) Nickel Stainless steel production Alloy handler 1.000 0.2 0.2 0.2 Hughson (2005d) Nickel Stainless steel production Raw materials inspector 1.000 0.1 0.1 0.1 Hughson (2005d) Nickel Stainless steel production Raw materials inspector 1.000 0.0 0.0 0.0 Hughson (2005d) Nickel Stainless steel production DC Arc Technician 1.000 0.3 0.3 0.3 Hughson (2005d) Nickel Stainless steel production DC Arc Technician 1.000 0.8 0.8 0.8 Hughson (2005d) Nickel Stainless steel production DC Arc Technician 1.000 0.1 0.1 0.1 Hughson (2005d) Nickel Stainless steel production DC Arc Technician 1.000 0.1 0.1 0.1 Hughson (2005d) Nickel Stainless steel production DC Arc Technician 1.000 1.7 1.7 1.7 Hughson (2005d) Nickel Stainless steel production DC Arc Technician 1.000 0.3 0.3 0.3 Hughson (2005d)