Embed Size (px)
Citation preview
ASSESSMENT OF SAFETY AND ENVIRONMENTAL RISK IN MINES
A THESIS SUBMITTED IN PARTIAL FULFILLMENT OF THE
REQUIREMENTS FOR THE DEGREE OF
Bachelor of Technology
in Mining Engineering
By
SAGAR PATTNAIK
10505015
Department of Mining Engineering
National Institute of Technology
Rourkela-769008
2009
ASSESSMENT OF SAFETY AND ENVIRONMENTAL RISK IN MINES
A THESIS SUBMITTED IN PARTIAL FULFILLMENT OF THE
REQUIREMENTS FOR THE DEGREE OF
Bachelor of Technology
in Mining Engineering
By
SAGAR PATTNAIK
Under the Guidance of
Prof. D.P TRIPATHY
Department of Mining Engineering
National Institute of Technology
Rourkela-769008
2009

National Institute of Technology
Rourkela
CERTIFICATE
This is to certify that the thesis entitled “ASSESSMENT OF SAFETY AND
ENVIRONMENTAL RISK IN MINES” submitted by Sri Sagar Pattnaik, Roll No. 10505015 in
partial fulfillment of the requirements for the award of Bachelor of Technology degree in Mining
Engineering at the National Institute of Technology, Rourkela (Deemed University) is an authentic
work carried out by him under my supervision and guidance.
To the best of my knowledge, the matter embodied in the thesis has not been submitted to any other
University/Institute for the award of any Degree or Diploma.
Date: (Prof. D.P TRIPATHY)
Dept. of Mining Engineering
National Institute of Technology
Rourkela-7069008
ACKNOWLEDGEMENT
I wish to express my deep sense of gratitude and indebtedness to Dr. D.P.Tripathy,
Department of Mining Engineering, N.I.T., Rourkela for introducing the present topic and for his
inspiring guidance, constructive criticism and valuable suggestions throughout the project work.
.I am also thankful to all staff members of Department of Mining Engineering, NIT
Rourkela. I am also thankful to Prof. David Lawrence, University of New South Wales,
Sydney have patiently extended all sorts of help for accomplishing this undertaking. Lastly, I
would like to thank and express my gratitude towards my friends who at various stages had lent a
helping hand.
Date: ( Sagar Pattnaik)

Chapter 1
Introduction

Chapter 2
Literature Review
Chapter 3
Development of computer programs and case studies for risk assessment

Chapter 4
Conclusion

Chapter 5
References
i
ABSTRACT
Mining is a hazardous operation and consists of considerable environmental, health and safety
risk to miners. Safety risk assessment is the systematic identification of potential hazards in
workplace as a first step to controlling the possible risk involved. Unsafe conditions in mines
lead to a number of accidents and cause loss and injury to human lives, damage to property,
interruption in production etc. But the hazards cannot be completely obliterated and thus there is
a need to define and reckon with an accident risk level possible to be presented in either
quantitative or qualitative way.
Environmental risk assessment (ERA) involves the examination of risks resulting from natural
events (flooding, extreme weather events, etc.), technology, practices, processes, products,
agents (chemical, biological, radiological, etc.) and industrial activities that may pose threats to
ecosystems, animals and people. Environmental health risk assessment addresses human health
concerns and ecological risk assessment addresses environmental media and organisms. ERA is
predominantly a scientific activity and involves a critical review of available data for the purpose
of identifying and possibly quantifying the risks associated with a potential threat. Mining
industries pose serious threat to environment by causing air and water pollution, land damages
and socio-economic risks which need to be evaluated scientifically so as to minimize their long
term implication to living and non-living systems
The objective of hazards and risk analysis is to identify and analyze hazards, the event sequences
leading to hazards, and the risk of hazardous events. Many techniques, ranging from simple
qualitative methods to advanced quantitative methods, are available to help identify and analyze
hazards. The use of multiple hazard analysis techniques is recommended because each has its
own purpose, strengths, and weaknesses. Some of the more commonly used techniques for risk
assessment include: preliminary hazard analysis (PHA), failure modes and effects analysis
(FMEA), hazard and operability studies (HAZOP), fault-tree analysis (FTA), and event-tree
analysis (ETA).
ii
Objectives of the Project:
Understanding the basic concepts and methods of safety and environmental risk assessment.
Fault tree analysis using Fault tree+11 software
Development of programs in C++ for fire risk assessment in coal mines.
Development of programs in C++ for closure risk assessment in mines.
Case studies on risk assessment in coal mines of MCL
This project work discusses in detail the concept and steps in safety and environment risk
assessment and their different approaches in risk assessment (qualitative and quantitative),
various risk analysis techniques and important features of a safety management system for mines
.It emphasizes the imperativeness to assess the risks from different mining operations and the
need to adopt the cost effective suitable measures to prevent, eliminate and minimize risk.
Fault Tree+11 analysis programs for Microsoft Windows enables us to analyze the availability
and reliability of both complex and simple systems and is easy and intuitive to use. Fault Tree+
11 provides an integrated environment for performing fault tree analysis, event tree analysis and
Markov analysis. In this project, mine fire is modeled using fault tree. A program for estimation
of spontaneous fire risk potential in underground mines is carried out using TURBO C++.
Another program was developed in C++ to compute closure risk factor for mines and to evaluate
risk category. Data was collected from MCL mines to assess and quantify safety risk and suggest
appropriate risk management.
Safety and environmental risk assessment is sine quo non for ensuring mining and miners safe .It
is necessary to assess the risk from different mining operations and take cost effective suitable
measures to prevent, eliminate and minimize risk .Both qualitative and quantitative risk
approaches can be followed to assess the risk level .Risk analysis techniques like FTA, ETA
AND HAZOP etc can be used as tools for study and understanding the risk levels more
effectively and can aid in risk prevention and control.
iii
CONTENTS
Abstract…………………………………………………………………..… i
List of Tables……………………………………………………………… v
List of Figures………………………………………………………….… vi
1. INTRODUCTION………………………………………………..…….1
1.1 Need for risk assessment……………………………………………………...….. 2
1.2 Objectives..........................................................................................................…...2
2. LITERATURE REVIEW …………………………………………….…3
2.1 Risk Nomenclature………………………………………..………….……..………. 3
2.2 Interpretation of risk classes………………………………………………………....4
2.3 Definition of risk assessment………………………………………….……………..5
2.3.1 Conducting risk assessment………………………………………………….…..7
2.4 Benefits of risk assessment…………………………………………………….........10
2.5 Safety Risk Assessment…………………………….…………………………....….11
2.5.1 Introduction………………………………………………….……………….…11
2.5.2 Steps in conducting safety risk assessment ………………………………....….11
2.6 Qualitative risk analysis………………………………………………………..........12
2.7 Quantitative approach-Risk Assessment……………………………………..…....15
2.7.1 Risk evaluation………………………………………………………………....15
2.8 Risk analysis methodologies……………………………………………………….17
2.8.1 Introduction……………………………………………………………………17
2.8.2 Comparison of methods and discussion…………………………….…………17
2.8.2.1 Fault tree analysis ........................................................................................21
2.8.2.2 Event tree analysis…………………………………………….……….…..25
2.8.2.3 HAZOP…………………………….………………………………...........27
2.8.2.4 PRA (Probalistic risk analysis)………………………………….….……...32
iv
2.9 Basics of Environmental Risk assessment……… ……………………….…........36
2.9.1 Key stages………………………………………………………….….….....36
2.9.2 Fire risk assessment……………………………………….……………...….44
2.10 Impacts of mine closure…………………………………………………….……45
2.10.1 Acid mine drainage…………………………………….…….……….......…51
..
2.11 Risk Management………………………………………………………………..51
2.11.1 Safety management systems…………………………………………...……52
3. DEVELOPMENT OF COMPUTER PROGRAMS AND CASE STUDIES
FOR SAFETY AND ENVIRONMENTAL RISK ASSESSMENT IN
MINES……………………………………………………………………….54 3.1 Fault tree analysis using Fault tree +11.0………………………………………......54
3.2 Development of programs in C++ for fire risk assessment in coal mines………….57
3.2.1 Output…………………………………………………………………………..59
3.3 Development of programs in C++ for closure risk assessment in mines…………...62
3.3.1 Output……………………………………………………………………...…...67
3.4 Safety risk assessment and management at Talcher: A Case Study….……….........73
3.4.1 Hazard identification………………………………………………………..…..73
3.4.2 Risk management…………………………………………………………….....76
4.0 CONCLUSION………………………………………………………81
5.0 REFERENCES………………………………………………….83
v
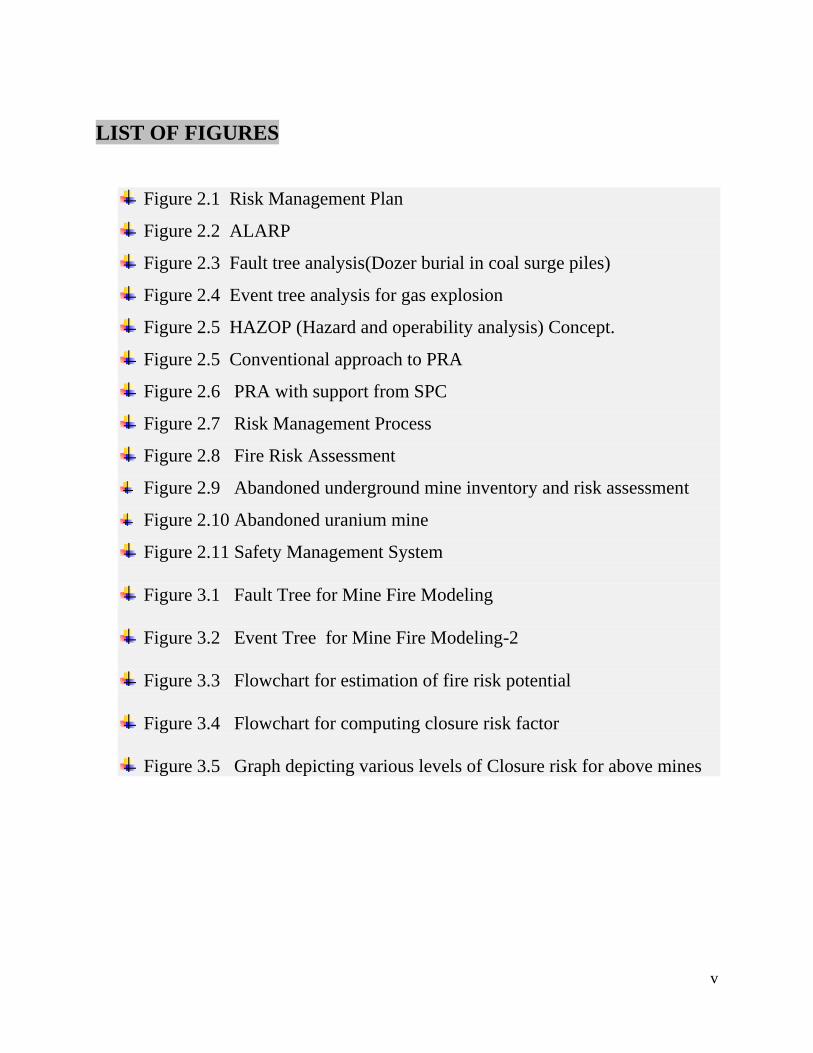
LIST OF FIGURES
Figure 2.1 Risk Management Plan
Figure 2.2 ALARP
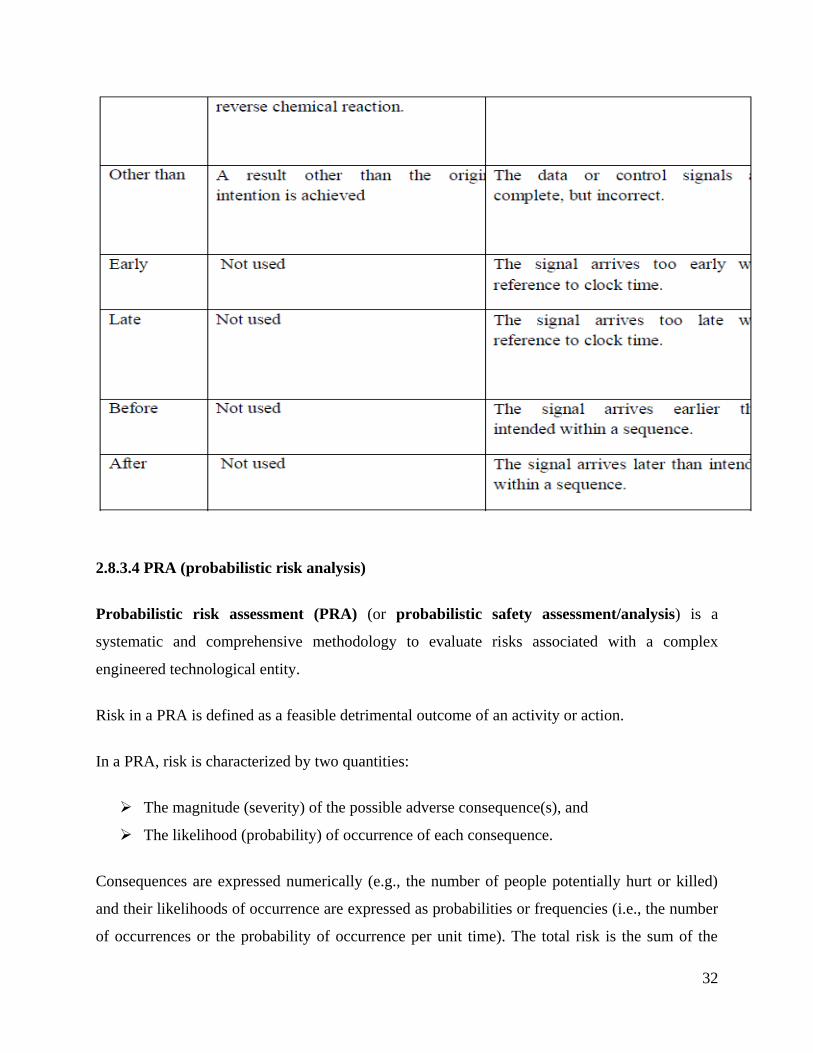
Figure 2.3 Fault tree analysis(Dozer burial in coal surge piles)
Figure 2.4 Event tree analysis for gas explosion
Figure 2.5 HAZOP (Hazard and operability analysis) Concept.
Figure 2.5 Conventional approach to PRA
Figure 2.6 PRA with support from SPC
Figure 2.7 Risk Management Process
Figure 2.8 Fire Risk Assessment
Figure 2.9 Abandoned underground mine inventory and risk assessment
Figure 2.10 Abandoned uranium mine
Figure 2.11 Safety Management System
Figure 3.1 Fault Tree for Mine Fire Modeling
Figure 3.2 Event Tree for Mine Fire Modeling-2
Figure 3.3 Flowchart for estimation of fire risk potential
Figure 3.4 Flowchart for computing closure risk factor
Figure 3.5 Graph depicting various levels of Closure risk for above mines
vi
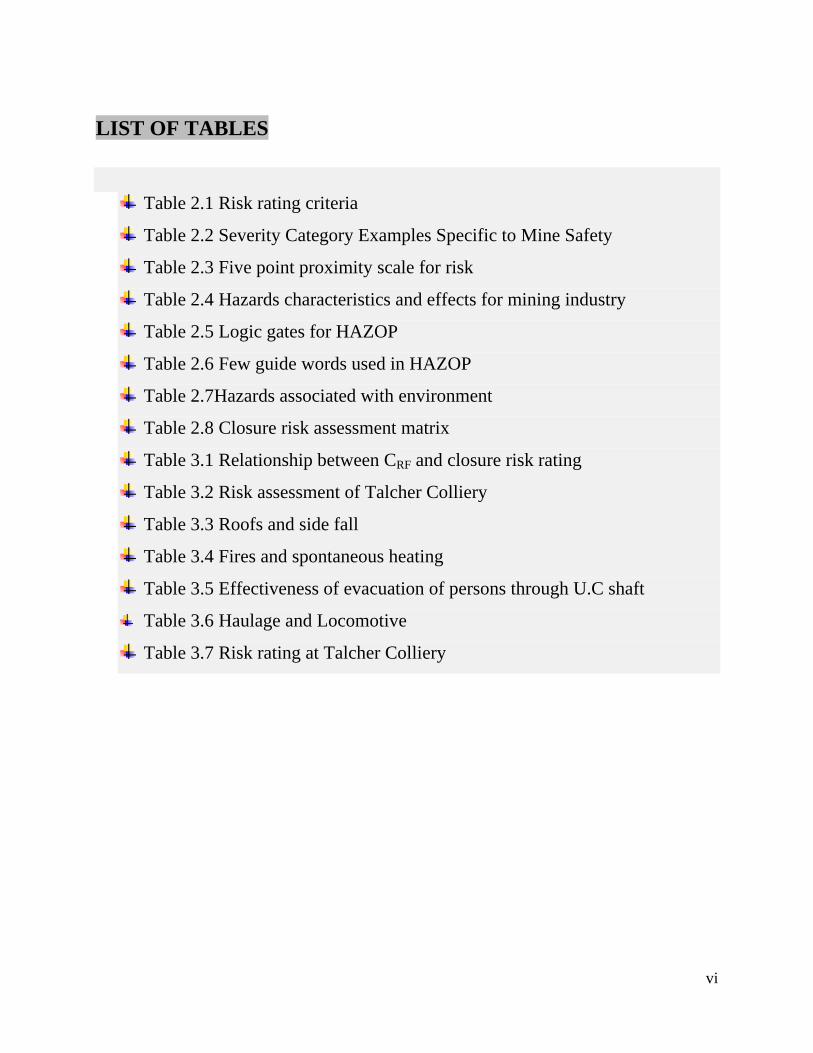
LIST OF TABLES
Table 2.1 Risk rating criteria
Table 2.2 Severity Category Examples Specific to Mine Safety
Table 2.3 Five point proximity scale for risk
Table 2.4 Hazards characteristics and effects for mining industry
Table 2.5 Logic gates for HAZOP
Table 2.6 Few guide words used in HAZOP
Table 2.7Hazards associated with environment
Table 2.8 Closure risk assessment matrix
Table 3.1 Relationship between CRF and closure risk rating
Table 3.2 Risk assessment of Talcher Colliery
Table 3.3 Roofs and side fall
Table 3.4 Fires and spontaneous heating
Table 3.5 Effectiveness of evacuation of persons through U.C shaft
Table 3.6 Haulage and Locomotive
Table 3.7 Risk rating at Talcher Colliery
1
CHAPTER 1
1. INTRODUCTION
Mining is a hazardous operation and consists of considerable environmental, health and safety
risk to miners. Safety risk assessment is the systematic identification of potential hazards in
workplace as a first step to controlling the possible risk involved. Unsafe conditions in mines
lead to a number of accidents and cause loss and injury to human lives, damage to property,
interruption in production etc. But the hazards cannot be completely obliterated and thus there is
a need to define and reckon with an accident risk level possible to be presented in either
quantitative or qualitative way.
Environmental risk assessment (ERA) involves the examination of risks resulting from natural
events (flooding, extreme weather events, etc.), technology, practices, processes, products,
agents (chemical, biological, radiological, etc.) and industrial activities that may pose threats to
ecosystems, animals and people. Environmental health risk assessment addresses human health
concerns and ecological risk assessment addresses environmental media and organisms. ERA is
predominantly a scientific activity and involves a critical review of available data for the purpose
of identifying and possibly quantifying the risks associated with a potential threat. Mining
industries pose serious threat to environment by causing air and water pollution, land damages
and socio-economic risks which need to be evaluated scientifically so as to minimize their long
term implication to living and non-living systems.
It is pertinent to assess environmental and safety risk in mines using appropriate methodology
and tools to make mine environmentally harmless and safe. Statutory requirements also put
mining companies to adopt systematic and proper risk assessment and will be the need of the
present as well as in the future. This project is an attempt in this direction.
2
1.1 NEEDS FOR RISK ASSESSMENT
➤ Identify hazards–something with the potential to cause harm,
➤ Assess the likelihood, or probability, of harm arising from the hazard,
➤ Assess the severity of harm resulting from realization of the hazard,
➤ Combine assessments of likelihood and severity to produce an assessment of risk and
➤ Use the assessment of risk as an aid to decision making.
Different types of approaches for safety in mines, various tools and appropriate steps have to be
taken to make mining safe and environment friendly .Keeping this in view, making workplace
better and safer, the project work was undertaken.
1.2 OBJECTIVES
The objectives of the projects are:
Understanding the basic concepts and methods of safety and environmental risk
assessment.
Fault tree analysis using Fault tree+11 software
Development of programs in C++ for fire risk assessment in coal mines.
Development of programs in C++ for closure risk assessment in mines.
Case studies on risk assessment in coal mines of MCL.
3
CHAPTER 2
2. LITERATURE REVIEW
2.1 RISK NOMENCLATURE
Risk is the probability that a hazard will turn into a disaster. Risk can be said to be the chance of
harmful effects to human health or to ecological systems resulting from exposure to an
environmental stressor. Now a stressor is any physical, chemical, or biological entity that can
induce an adverse response which adversely affect specific natural resources or entire
ecosystems, including plants and animals, as well as the environment with which they interact.
Risk is a combination of the frequency or probability of a specified hazardous event, and its
consequence.
Two factors of significance:
* The potential consequences of any accident that may result from the hazard;
* The frequency (or probability) of such an accident.
Risk= severity (consequence) x frequency x exposure
Probability - likelihood that the particular hazard will result in a fire.
Severity - an estimation of how serious the potential problem might be in terms of harm to people
and/or damage to property.
4
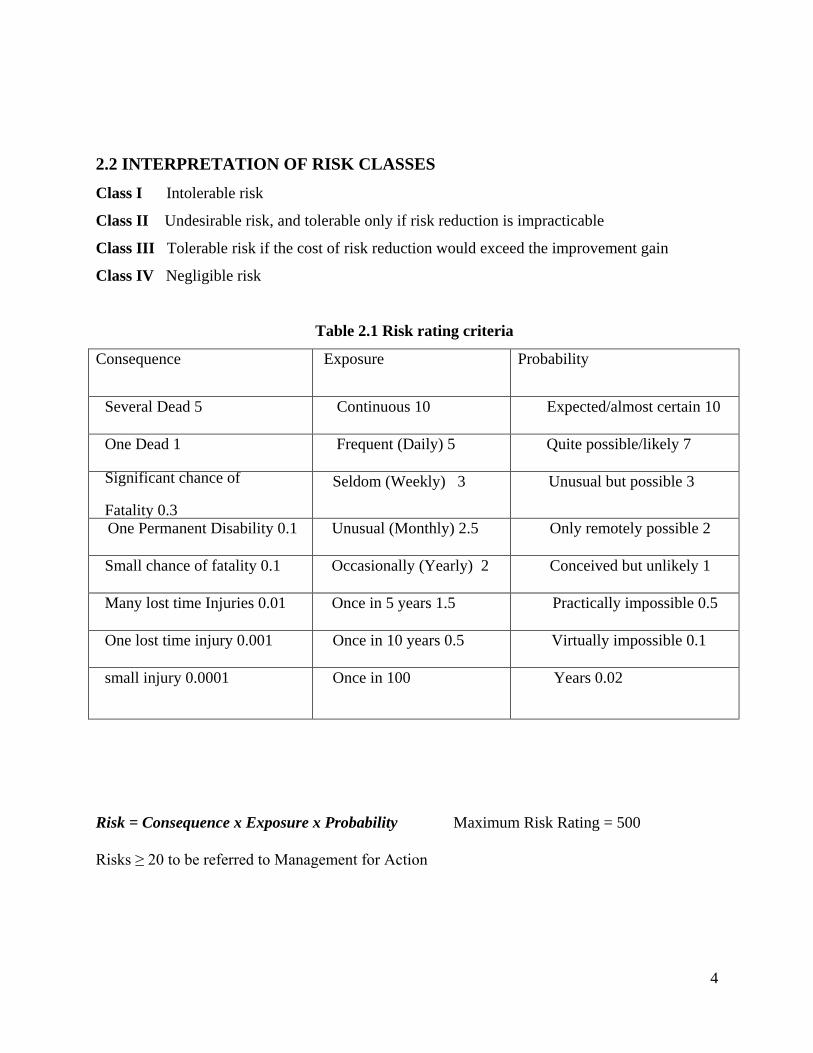
2.2 INTERPRETATION OF RISK CLASSES
Class I Intolerable risk
Class II Undesirable risk, and tolerable only if risk reduction is impracticable
Class III Tolerable risk if the cost of risk reduction would exceed the improvement gain
Class IV Negligible risk
Table 2.1 Risk rating criteria
Consequence Exposure Probability
Several Dead 5 Continuous 10 Expected/almost certain 10
One Dead 1 Frequent (Daily) 5 Quite possible/likely 7
Significant chance of
Fatality 0.3
Seldom (Weekly) 3 Unusual but possible 3
One Permanent Disability 0.1 Unusual (Monthly) 2.5 Only remotely possible 2
Small chance of fatality 0.1 Occasionally (Yearly) 2 Conceived but unlikely 1
Many lost time Injuries 0.01 Once in 5 years 1.5 Practically impossible 0.5
One lost time injury 0.001 Once in 10 years 0.5 Virtually impossible 0.1
small injury 0.0001 Once in 100 Years 0.02
Risk = Consequence x Exposure x Probability Maximum Risk Rating = 500
Risks ≥ 20 to be referred to Management for Action
5
2.3 DEFINITION OF RISK ASSESSMENT
Risk Assessment is defined as:
"A process of analysis to identify and measure risks from natural hazards that affect people,
property and the environment. This process can also encompass the assessment of available
resources to address the risks."
Or A risk assessment is the systematic identification of potential hazards in the work place as a
first step to controlling the possible risk involved.
Risk Assessment is a common first step in a risk management process. Risk assessment is the
determination of quantitative or qualitative value of risk related to a concrete situation and a
recognized threat
Risk assessment forms a crucial early phase in the disaster management planning cycle and is
essential in determining what disaster mitigation measures should be taken to reduce future
losses. Any attempt to reduce the impact of a disaster requires an analysis that indicates what
threats exist, their expected severity, who, or what they may affect, and why. Knowledge of what
makes a person or a community more vulnerable than another, added to the resources and
capacities available, determines the steps we can take to reduce their risk.
Risk assessment is carried out in a series of related activities which builds up a picture of the
hazards and vulnerabilities which explain disaster events. Information is first collected on the
specific location, severity, duration and frequency of threats that are faced by a society. This is
followed by an assessment of potential hazard impacts on the society‘s livelihoods, economy,
infrastructure and key facilities, etc. The scale of these impacts will always be conditioned by

6
those processes which either increase or decrease vulnerability, which may be economic, social,
political or environmental.
Table 2.2 Severity Category Examples Specific to Mine Safety
Risk assessment therefore has two central components:
1. Hazard analysis, understanding the scale, nature and characteristics of a hazard
2. Vulnerability analysis, the measuring of the extent to which people or buildings are likely to
suffer from a hazard occurrence.
Any change in either of these two components will correspondingly effect a change in the nature
or size of the risk faced. Once data has been collected and analyzed on both the threat and what
is at risk to it, the information has to be passed on in an appropriate format to decision makers to
determine levels of acceptable risk and what actions should be taken to reduce it. Decisions will
then be made as to whether risk reduction measures should be initiated, what level of protection
is required and whether there are other more pressing risks to address with finite resources.
7
Understanding risk and taking decisions is therefore a two part process involving both risk
evaluation and risk assessment.
risk assessment refers to the scientific quantification of risk from data and an understanding
of the nature of the hazards and the vulnerable elements to it
risk evaluation is the social and political judgments about the importance of various risks
faced by individuals and communities.
Risk assessment is therefore mainly a scientific and quantitative activity which informs the
decision making process. The utilization of the data provided and its incorporation into disaster
reduction activities will then depend on risk evaluation; the appraisal or perception of the risk in
co-ordination with other priorities and qualitative assessment of whether anything can be done to
reduce that same risk. It is therefore logical that the more accurate the diagnosis of the problem
and the resources available to meet it the better the decisions will be. Complexity of
understanding the characteristics of the threats faced and the diverse nature of vulnerability a
totally accurate and comprehensive picture will not always be possible.
2.3.1 Conducting risk assessment
The term risk refers to the expected losses from a given hazard to a given element at risk, over a
future specified time period. In order to understand and to compare different risks, scientists and
economists usually try to quantify them in terms of their probability of occurrence and secondly
the potential damage and losses they might cause. This is done by using statistical analysis to
predict the probability of future events and by gathering data on the effects of various hazards
that cause the risk. This identification of effects and the understanding of the processes of
disaster occurrence constitute the first steps in establishing a relationship between hazard and
vulnerability in order to identify the risk.
By using past historical records and an analysis of scientific data estimates can be made of the
likelihood of hazard occurrence and expected severity. When allied to estimates of what is
vulnerable to various hazards risk can be defined in terms of the probability. i.e. the likelihood of
losses and an estimation of the proportion of the population which will be affected.
8
The process of risk assessment is usually conducted in the following sequence:
1. Hazard analysis: Hazard information is needed on such matters as location, frequency,
duration and severity of each hazard type. Risk assessment should be carried out, where possible,
in relation to all the hazards in a given location.
2. Vulnerability analysis: Vulnerability analysis starts with creating an inventory of all
elements that are 'at risk' to the identified hazards such as social groups, buildings, infrastructure,
economic assets, agriculture etc. This is followed by an assessment of their susceptibility and an
estimation of damage and losses. Vulnerability analysis includes an assessment of resources or
capacities to meet and recover from hazardous events.
3. Risk Evaluation and determining levels of acceptable risk: Once data on the nature of the
hazards and vulnerability has been collected, synthesized and analyzed by technical staff in the
categories noted above it ideally has to be passed in an appropriate format to decision makers to
enable them to determine levels of acceptable risk leading to levels of protection. These
decisions will be made according to risk perception, knowledge of possibilities to reduce the
threat and other priorities.
Part of this decision making process is determining acceptable levels of safety, i.e. what level of
protection is required? For example, should shelter be built to resist an event, e.g. hurricane that
recurs every 5, 20, or 100 years of such a magnitude that it would blow away all the houses
around? A key feature of acceptability therefore is cost benefit trade off: to build a house that
withstands a once a century very strong hurricane may cost ten times more than a house which
will not, but which may last for ninety years.
Vulnerability assessment
9
Once knowledge is gained of the threats in existence, their expected severity and locations at
risk, an understanding of what can be affected by these threats is needed. This activity is termed
vulnerability assessment and is defined as:
―The analysis of the vulnerability of various sectors that are exposed to the natural hazards
identified in the hazard analysis
exercises. The sectors include social, livelihoods, economic, physical assets, agriculture, political
and administration.‖
Vulnerability is the extent to which a community, structure, service or region is likely to be
damaged or disrupted by the impact of a particular hazard. People‘s lives and health are directly
at risk from the destructive effects of hazards. Their incomes and livelihoods are also at risk
because of the destruction of the buildings, crops, livestock or equipment which they depend on.
Even if physical loss is avoided the effects on livelihood, etc., can last a long time and often
previous levels of existence are not re-attained, for example a fire in an informal market may not
kill anybody yet may destroy goods and therefore livelihoods of market traders. Thus
vulnerability assessment aims not just to recognize who is immediately affected but also who is
most or least able to recover from their disasters.
The objective of vulnerability assessment is in particular to identify who is most vulnerable and
why. The concept of vulnerability can be assessed at a variety of levels and from diverse
perspectives. The closer the analysis gets to the fundamental causes rather than the symptomatic
aspects of vulnerability, the more difficult and complex vulnerabilities are to address. However,
the more fundamental the vulnerability addressed, the more hazard resistant the vulnerable group
is likely to become as a result.
Each type of hazard puts a different set of elements at risk. Most of disaster mitigation work is
focused on reducing vulnerability, and in order to do so development planners need an
understanding and indication of which elements are most at risk from the principal hazards
which have been identified. Vulnerability assessment to hazards usually
takes place in the following two stage sequence:
10
1. Making an inventory of what is at risk: Once the hazards in any location or area have been
identified it is necessary to find out what may be affected by them. Thus base line data is
required on the following;
population; age, gender, health
livelihoods; types, locations
local economies
agriculture and fisheries
buildings
infrastructure
Cultural assets (i.e. libraries, museums, historic buildings etc.)
local institutions
2. Assessing the vulnerability of elements at risk: After an inventory has been made of the
elements at risk further examination has to be made of how they will be affected by hazards to
make an assessment of the risk. It should be noted that whilst a quantification of the elements
existing in any location is relatively straightforward, an assessment of how they will be affected
in a hazard event is harder to assess. It is important to note that it is often the case that the
‗intangible‘ aspects of vulnerability will be as important as the quantifiable aspects. These should
include the evaluating of socio-economic vulnerability and individual or societal "coping
mechanisms" as well as support systems which allow some people to cope with the impact of a
hazard and recover from them comparatively faster. The most difficult vulnerabilities to address
are based on exclusion from social, economic and political systems. These vulnerabilities may
reflect characteristics such as race, gender, religion, ethnicity, social class, age etc. These most
fundamental vulnerabilities limit people‘s access to resources, opportunities, services,
information and ultimately deny people choice in control over their lives. Vulnerability
assessment is therefore another complex data collection process to determine elements ‗at risk‘.
These include social, economic and natural and physical factors. It is always a 'site-specific‘
process with a concern for unique characteristics of a local situation and will always require local
expertise and experience.
2.4 BENEFITS OF RISK ASSESSMENT
11
To enable control measures to be devised,
To gain an idea of the relative importance of risks,
To take decisions on controls which are cost effective and appropriate,
The identification of potential future disasters,
The exploration of quality and safety failures before anyone is hurt, and
The development of a safety culture.
2.5 SAFETY RISK ASSESSMENT
2.5.1 Introduction
The risk assessment portion of the process involves three levels of site evaluation:
1) Initial Site Evaluation,
2) Detailed Site Evaluation, and
3) Priority Site Investigations and Recommendations.
The risk assessment criteria used for all levels of site evaluation take into account two basic
factors:
1) The existing site conditions and
2) The level of the traveling public's exposure to those conditions.
The Initial Site Evaluation and Detailed Site Evaluation both apply weighted criteria to existing
information and information obtained from one site visit. The Initial Site Evaluation subdivides
the initial inventory listing of sites into 5 risk assessment site groups. The Detailed Site
Evaluation risk assessment is then performed on each of the three highest risk site groups in the
order of the group priority level of risk. The result of the Detailed Site Evaluation process is a
prioritized listing of the sites within each of the three highest risk site groups.
2.5.2 Conducting a Safety/Risk Assessment in Six Steps
1) The group that will conduct the analysis is chosen first,
2) The geographic area to be included is defined,
12
3) All of the possible hazards that exist in the area selected for study is included,
4) The Risks are to be evaluated this step,
5) Hazard Ratings are used during resource allocation,and
6) The task of risk assessment is an on-going activity.
2.6 QUALITATIVE RISK ANALYSIS
The assessment of risk can be qualitative or quantitative. The latter requires significant specialist
effort, and therefore, the qualitative assessment is often used as being the simpler of the two.
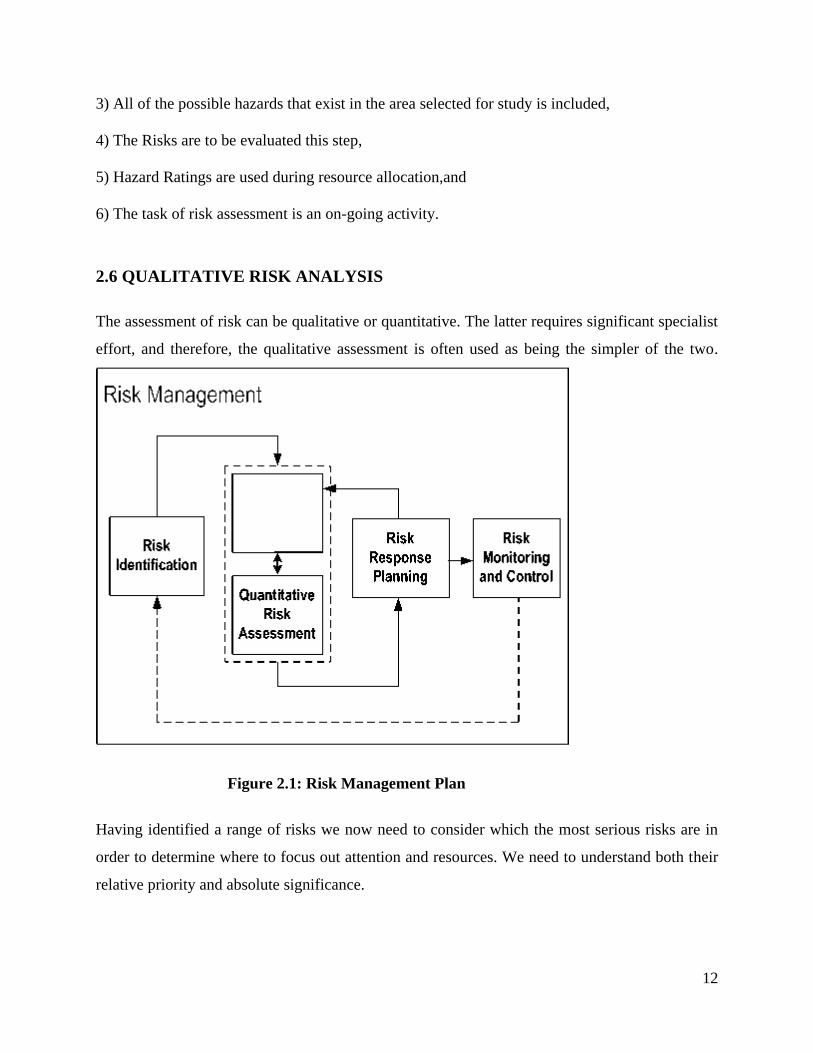
Figure 2.1: Risk Management Plan
Having identified a range of risks we now need to consider which the most serious risks are in
order to determine where to focus out attention and resources. We need to understand both their
relative priority and absolute significance.
13
People generally are not inherently good at analyzing risk. We tend to take decisions swayed by
our emotional response to a situation rather than an objective assessment of relative risk. Given
half a chance most of us will believe what we want to believe and selectively filter out
information that does not support our case. We are similarly bad at looking at probability in a
holistic way. People generally focus on risks that have occurred recently even though another
risk may have happened exactly the same number of times over the last five years.
We must nonetheless accept that most of the risk analysis done in our environment will be of a
qualitative nature. Few of us have the skills, time or resources to undertake the kind of
quantitative modeling that goes on in major projects in the commercial sector. This section aims
to show that by taking a disciplined and structured approach it is possible to improve the
objectivity of your analysis without getting into complex calculations or needing specialist
software tools.
In deciding how serious a risk is we tend to look at two parameters:
Probability - the likelihood of the risk occurring
Impact - the consequences if the risk does occur
Impact can be assessed in terms of its effect on:
Time
Cost
Quality
There is also a third parameter that needs to be considered:
Risk proximity - when will the risk occur?
Proximity is an important factor yet it is one that is often ignored. Certain risks may have a
window of time during which they will impact. A natural tendency is to focus on risks that are
immediate when in reality it is often too late to do anything about them and we remain in 'fire-
14
fighting' mode. By thinking now about risks that are 18 months away we may be able to manage
them at a fraction of the impact cost. Another critical factor relating to risk proximity is the point
at which we start to lose options. At the start of a project there may be a variety of approaches
that could be taken and as time goes on those options narrow down. We said earlier that risk
management is about making better decisions. Very often in the education sector we put off
taking decisions until the options disappear and there is only one way forward.
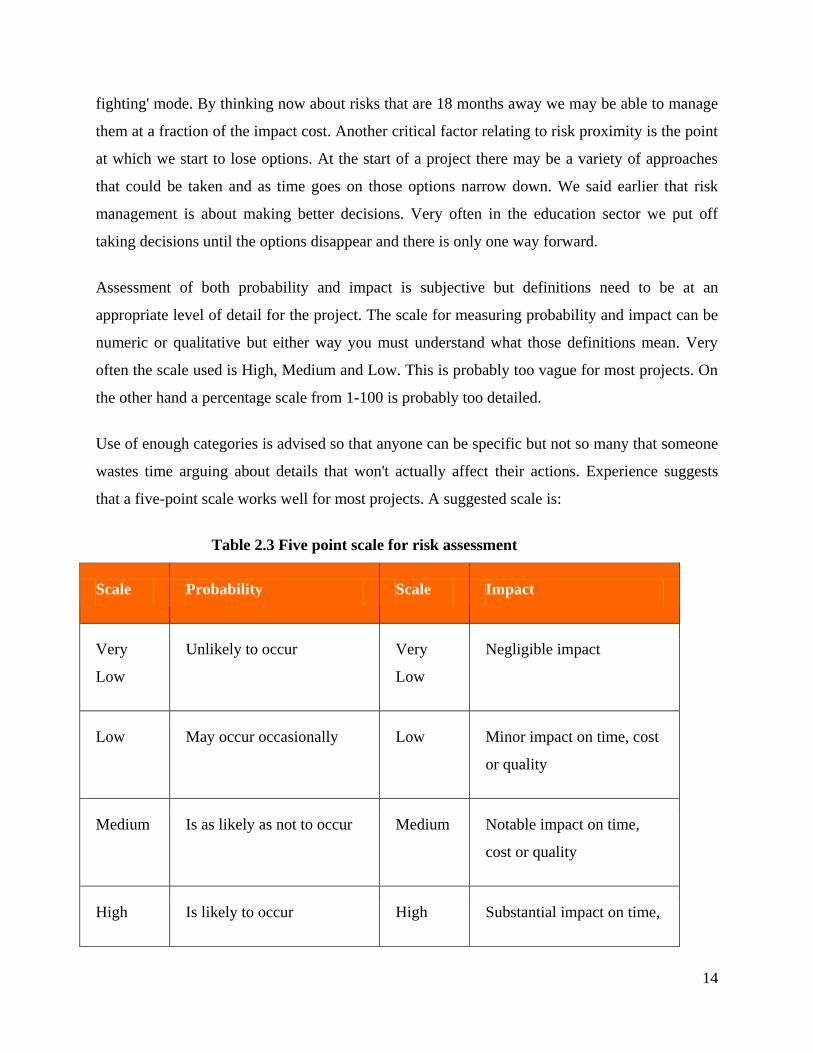
Assessment of both probability and impact is subjective but definitions need to be at an
appropriate level of detail for the project. The scale for measuring probability and impact can be
numeric or qualitative but either way you must understand what those definitions mean. Very
often the scale used is High, Medium and Low. This is probably too vague for most projects. On
the other hand a percentage scale from 1-100 is probably too detailed.
Use of enough categories is advised so that anyone can be specific but not so many that someone
wastes time arguing about details that won't actually affect their actions. Experience suggests
that a five-point scale works well for most projects. A suggested scale is:
Table 2.3 Five point scale for risk assessment
Scale Probability Scale Impact
Very
Low
Unlikely to occur Very
Low
Negligible impact
Low May occur occasionally Low Minor impact on time, cost
or quality
Medium Is as likely as not to occur Medium Notable impact on time,
cost or quality
High Is likely to occur High Substantial impact on time,
15
cost or quality
Very
High
Is almost certain to occur Very
High
Threatens the success of
the project
2.7 QUANTITATIVE APPROACH-RISK ASSESSMENT
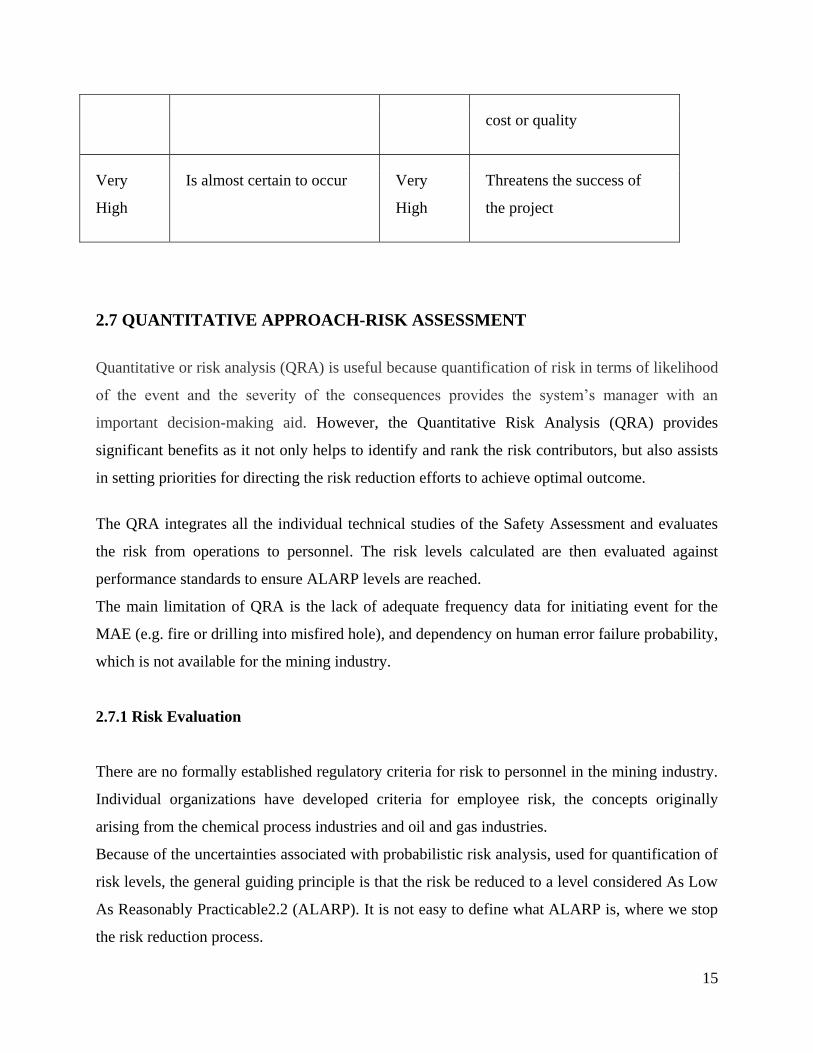
Quantitative or risk analysis (QRA) is useful because quantification of risk in terms of likelihood
of the event and the severity of the consequences provides the system‘s manager with an
important decision-making aid. However, the Quantitative Risk Analysis (QRA) provides
significant benefits as it not only helps to identify and rank the risk contributors, but also assists
in setting priorities for directing the risk reduction efforts to achieve optimal outcome.
The QRA integrates all the individual technical studies of the Safety Assessment and evaluates
the risk from operations to personnel. The risk levels calculated are then evaluated against
performance standards to ensure ALARP levels are reached.
The main limitation of QRA is the lack of adequate frequency data for initiating event for the
MAE (e.g. fire or drilling into misfired hole), and dependency on human error failure probability,
which is not available for the mining industry.
2.7.1 Risk Evaluation
There are no formally established regulatory criteria for risk to personnel in the mining industry.
Individual organizations have developed criteria for employee risk, the concepts originally
arising from the chemical process industries and oil and gas industries.
Because of the uncertainties associated with probabilistic risk analysis, used for quantification of
risk levels, the general guiding principle is that the risk be reduced to a level considered As Low
As Reasonably Practicable2.2 (ALARP). It is not easy to define what ALARP is, where we stop
the risk reduction process.
16
Figure illustrates the risk criteria. It has three tiers:
a. A Tolerable region where the risk has been shown to be negligible, and comparable with
everyday risks such as travel to work.
b. A middle tier, where it is shown the risk has been reduced to As Low As Reasonably
Practicable level and that further risk reduction is either impracticable or the cost is grossly
disproportionate to the improvement gained. This is referred as the ALARP region.
c. An ―Intolerable region where the risk cannot be justified on any grounds. The ALARP region
is kept sufficiently broad to allow for flexibility in decision making and allow for positive
Figure 2.2 ALARP
17
management initiatives, which may not be quantifiable in terms of risk reduction. Some
organizations in the process industries and oil and gas industries have set numerical criteria for
risk as demarcation between the tiers. It is not appropriate to apply the criteria from one industry
to another, as the nature of the operations and types of risks are entirely different.
For a well managed mine site, the risk values for underground mining are expected to fall within
the ALARP range. Therefore a demonstration of adequacy of control measures as part of overall
ALARP demonstration is crucial.
2.8 RISK ANALYSIS METHODOLOGIES
2.8.1 Introduction
The objective of hazards and risk analysis is to identify and analyze hazards, the event sequences
leading to hazards, and the risk of hazardous events. Many techniques, ranging from simple
qualitative methods to advanced quantitative methods, are available to help identify and analyze
hazards. The use of multiple hazard analysis techniques is recommended because each has its
own purpose, strengths, and weaknesses. Some of the more commonly used techniques include
preliminary hazard analysis (PHA), failure modes and effects analysis (FMEA), hazard and
operability studies (HAZOP), fault-tree analysis (FTA), and event-tree analysis (ETA).
Considerations in analyzing risk include.
Investigating the frequency of particular types of disasters (often versus seldom).
Determining the degree of predictability of the disaster.
Analyzing the speed of onset of the disaster (sudden versus gradual).
Determining the amount of forewarning associated with the disaster.
.Estimating the duration of the disaster.
2.8.2 Comparison of Methods and Discussion
Successful risk management hinges on comprehensive and detailed hazard mapping and
understanding of possible consequences. No specific risk analysis method should be chosen until
18
relevant hazards have been clarified. A summary comparison of hazard sources from the
described high-risk industries is attempted .The mining industry seems so different to most other
sectors, yet it utilizes a variety of technologies from other often hazardous industries and in so
doing has Involuntarily added entirely new and previously unknown hazards (and untried
solutions) to its own suite of issues, quite often at a scale much larger than found in thek, parent
industry. An example is the ongoing application of computer and software based technologies
across the entire operation, particularly in safety critical applications. This overall trend will
continue and considerably more emphasis and research needs to be applied to the elimination of
hazards arising from this area and interaction with other systems, including the mineworker.
Mining operations remain relatively people intensive and considerable effort should be applied in
evaluating and improving aspects of human reliability. Work related illness can have its origins
in classical OH+S issues such as exposure to chronic health hazards eg dust and chemical
reagents, but many mining disasters have shown to be governed by the inherent technical risks
associated with mining methods and the equipment and plant used. Apart from the shear size and
magnitude of many mining operations and its equipment, the sector is also a major consumer of
hazardous chemicals and products such as fuels, explosives and chemical reagents both for the
mining process and beneficiation stages. Accidents associated with these in the past have caused
both significant loss of life, disruption to operations and considerable and long-term destruction
of the environment.
3) The layout of many mining operations is far from static and changes continuously. Operations,
either as open-cuts, or underground mines or a combination of both have the scope to extend
over large areas in often-inhospitable regions. All mines and operations are exposed to the
danger of fire and explosions, with underground mines, particularly coal mines being extremely
vulnerable and endangered by the effects offices and explosions. Variable geological conditions
and the severity of the working environment have fundamental bearing on the operation and
influence much of the activities directly in terms of maintenance and administration of the mine.
Hazard identification usually establishes what risk assessment techniques should bemused and
care needs to be taken in the selection of a technique, as similar techniques may not necessarily
yield the same results .Risk assessment techniques may be either ‗subjective – qualitative‘ or
‗objective –quantitative‘ and both streams, ideally in combination can be very effective in the
19
process of hazards management. The mining industry is now familiar with the use of qualitative
techniques, but there i as growing recognition of the value and effectiveness of quantitative
studies particularly when assessing system hazards. Some quantitative techniques such as Fault
Tree Analysis are ideally suited for assessments of large electro-mechanical systems and effects
of human unreliability. Results from such studies can be used by safety, maintenance and
operations management to good effect. However, use of quantitative techniques will require a
more disciplined approach to recording and interpreting incident, accident and maintenance
information to provide accurate and auditable inputs to those studies.
4) Qualitative techniques are comparatively cheap and readily applied but are unable to provide
numerical estimates and therefore relative ranking of identified risks. Semi quantitative
techniques allow some relative risk ranking, but these techniques are still unable to provide
detailed assessments of system safety, effects of common cause failures and redundancy features.
Similarly neither can effectively be used in the prediction of low frequency high consequence
events – i.e. catastrophic risks. Quantitative methods overcome these shortfalls and are ideally
applied where system safety and criticality is to be assessed. Catastrophic risks can be assessed
using Fault Tree and Event Tree methods, ideally as part of a probabilistic risk analysis (PRA)
provided reliable input data exists and numerical results can be used in estimating the likely
range of risks to both employees, plant, society and the environment. Result scan also be used in
cost benefit studies and demonstration that risks are ‗ as low as reasonably practicable‘ (ALARP)
can be supported defensively only by quantitativeanalysis.Truly probabilistic methods such as
‗first order reliability methods‘ (FORM) are the most complex type of RA, and its advantage
over any other method is the ability not only to successfully cope with the statistical uncertainty
in the data but also use it to its advantage. Results from a FORM evaluation also provide further
information on system vulnerability as a function of input variables. Analysis utilizing Monte
Carlo (MC) techniques is more commonplace than FORM and has found widespread acceptance
in many professions such as engineering and finance. However, MC methods lack some of the
direct leverage that FORM provides for engineering solutions. A methods should be chosen, not
just based on the hazard, but also after consideration of the capabilities of each technique as each
may provide different outputs (or parameters) that may be particularly useful towards the
solution of theproblem.Such outputs could be simple lists of individual failures (HAZOP, ‗What
20
if‘ etc), or numerical estimates of system failure probabilities (FTA), listings of event scenarios
and their likelihoods (ETA, PRA) or numerical system failure probabilities and sensitivities to
input variables (FORM).
5) FORM methods in particular also provide numerical estimates of the most likely failure
scenario (the design point) which comprises a listing of all input variables and their estimates at
the point of system failure. FORM has the added advantage that it is able to synthesize failure
data (which is usually scarce) from basic engineering data through the adaptation of design
calculations that can then be used to supplement other techniques such as FTA.
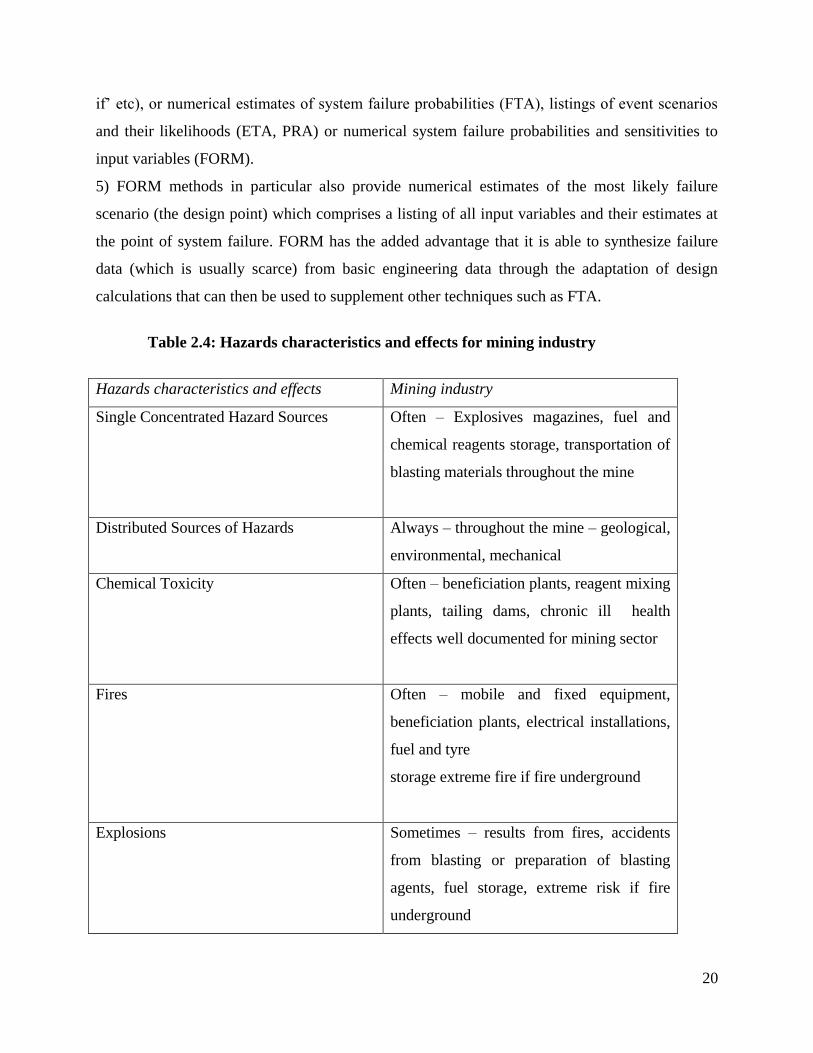
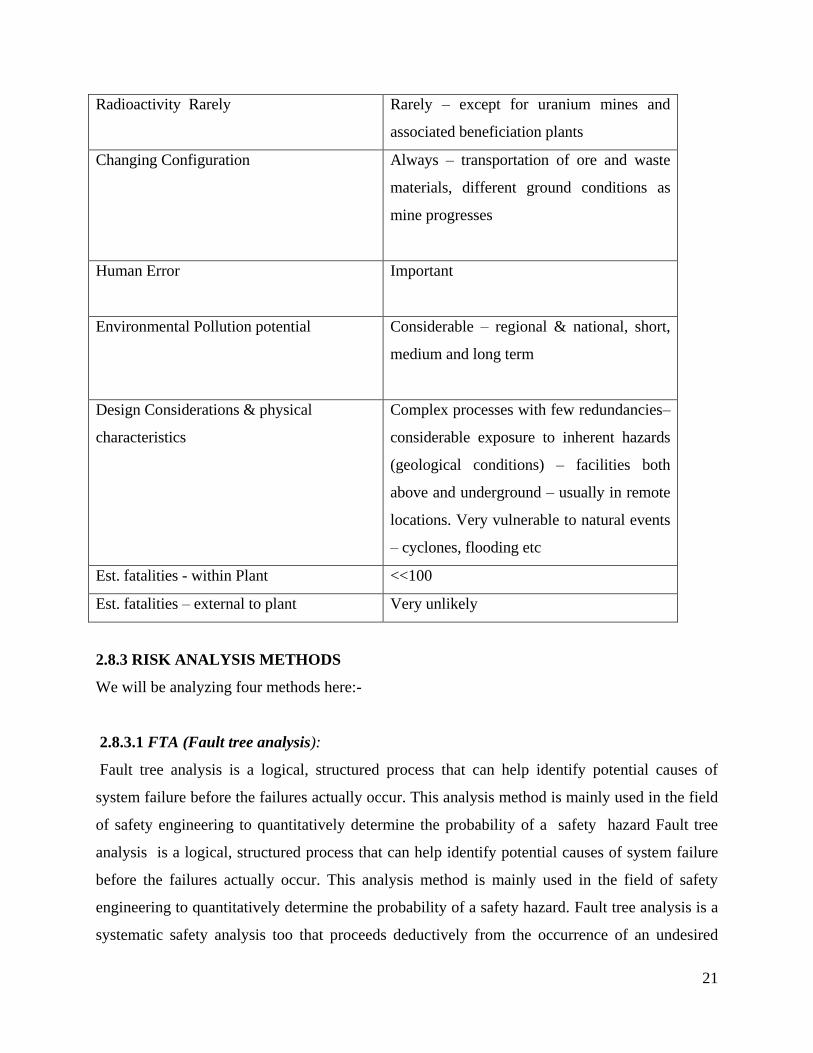
Table 2.4: Hazards characteristics and effects for mining industry
Hazards characteristics and effects Mining industry
Single Concentrated Hazard Sources
Often – Explosives magazines, fuel and
chemical reagents storage, transportation of
blasting materials throughout the mine
Distributed Sources of Hazards
Always – throughout the mine – geological,
environmental, mechanical
Chemical Toxicity
Often – beneficiation plants, reagent mixing
plants, tailing dams, chronic ill health
effects well documented for mining sector
Fires
Often – mobile and fixed equipment,
beneficiation plants, electrical installations,
fuel and tyre
storage extreme fire if fire underground
Explosions
Sometimes – results from fires, accidents
from blasting or preparation of blasting
agents, fuel storage, extreme risk if fire
underground
21
Radioactivity Rarely
Rarely – except for uranium mines and
associated beneficiation plants
Changing Configuration
Always – transportation of ore and waste
materials, different ground conditions as
mine progresses
Human Error
Important
Environmental Pollution potential
Considerable – regional & national, short,
medium and long term
Design Considerations & physical
characteristics
Complex processes with few redundancies–
considerable exposure to inherent hazards
(geological conditions) – facilities both
above and underground – usually in remote
locations. Very vulnerable to natural events
– cyclones, flooding etc
Est. fatalities - within Plant <<100
Est. fatalities – external to plant Very unlikely
2.8.3 RISK ANALYSIS METHODS
We will be analyzing four methods here:-
2.8.3.1 FTA (Fault tree analysis):
Fault tree analysis is a logical, structured process that can help identify potential causes of
system failure before the failures actually occur. This analysis method is mainly used in the field
of safety engineering to quantitatively determine the probability of a safety hazard Fault tree
analysis is a logical, structured process that can help identify potential causes of system failure
before the failures actually occur. This analysis method is mainly used in the field of safety
engineering to quantitatively determine the probability of a safety hazard. Fault tree analysis is a
systematic safety analysis too that proceeds deductively from the occurrence of an undesired
22
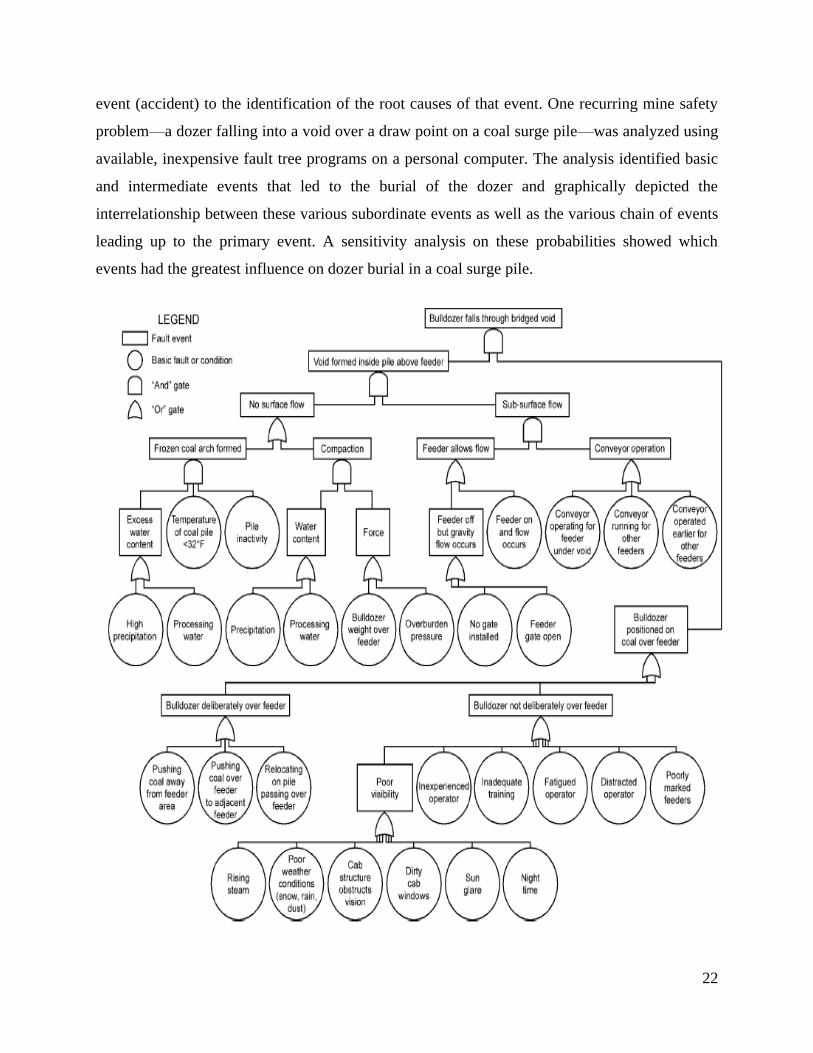
event (accident) to the identification of the root causes of that event. One recurring mine safety
problem—a dozer falling into a void over a draw point on a coal surge pile—was analyzed using
available, inexpensive fault tree programs on a personal computer. The analysis identified basic
and intermediate events that led to the burial of the dozer and graphically depicted the
interrelationship between these various subordinate events as well as the various chain of events
leading up to the primary event. A sensitivity analysis on these probabilities showed which
events had the greatest influence on dozer burial in a coal surge pile.
23
Figure 2.3 Fault tree analysis(Dozer burial in coal surge piles)
Advantages:
• Identifies multiple failures,
• Identifies multiple events and sequences leading to a hazard,
• Identifies common causes,
• Provides valuable documentation to aid investigations of mishaps, and
• Suitable for hardware or software.
Disadvantages:
• Can become time-consuming if trees grow very large.
• Not suited for timing (dynamic) situations.
The fault tree is constructed by first identifying the top fault event, which, in this case, is a dozer
falling into a void on a coal surge pile. A secondary event (A) that contributes directly to the top
fault event occurs when the dozer operator positions the dozer directly over the hazardous feeder
zone. The only other secondary event (B) required to trigger the top fault event is the formation
of a void within the coal pile between the feeder and the surface. These two secondary events are
further broken down to determine the root causes. Figure 2.3 shows the completed fault tree for a
dozer falling into a void on a coal surge pile. In secondary event A, where the dozer is driven
directly over or near the feeder, the question arises as to why the operator put him- or herself in
this hazardous position. Either the operator has unintentionally driven over the feeder or feels
confident that no void exists at the feeder. For the former, six reasons were proposed: poor
visibility, inexperience, inadequate training, fatigue, distractions, and inadequate feeder markers.
In this fault tree, only the poor visibility event was further explored. Six reasons were then
developed for the poor visibility response: that the dozer was being driven at night, the cab
windows were dirty, the sun caused a glare on the windows, the cab structure obstructed vision,
weather conditions (such as rain, snow, or blowing dust) were poor, and steam was rising from
the pile. If the operator had intentionally positioned the dozer over the feeder, confident that no
void existed but putting him- or herself at risk, the only feasible reason was to save time by
24
taking a more direct route during dozing. Three types of actions that favor a direct route are
driving over or backing up to the hazardous feeder zone while pushing coal away from the feeder
area when expanding the pile, pushing coal to an active feeder but passing over an adjacent
feeder or backing up to the hazardous zone, and passing over a feeder when relocating and
moving onto or off the pile .In secondary event (B), a void is formed over a feeder when there is
subsurface flow at the same time there is no surface flow. Subsurface flow or flow from the
feeder happens normally when the conveyor is on and the feeder allows flow. If the feeder is
energized and the belt is on, flow will occur. Flow may also occur when the feeder is turned off
if there are changes in coal properties, such as the angle of repose of the coal. (A safety gate may
be installed to prevent such flow. However, an additional condition maybe set up if a safety gate
is installed but is open.)
A contradiction is faced in the question ―How can surface flow not occur when
subsurface flow occurs?‖ A basic understanding of flow in a surge pile is important for
understanding why surface flow does not take place even when there is subsurface flow. A
typical opening dimension of 5 by 5 ft at the base of a pile will only allow vertical movement in
a column of coal having the same dimensions. As the flow column reaches the surface, a void or
hole will form. The upper sides of the hole will fail at the angle of repose as the column is drawn
down. However, if the upper layer of coal is held together by cohesive force acting between coal
particles, then the strength of this layer may prevent surface flow, and a void will form below the
surface to a depth comparable to the amount of coal drawn from the feeder. In the fault tree
analysis, two cohesive conditions were proposed: simple compaction and binding of coal
particles by freezing water. In order for freezing water to bind the coal together, a water source is
needed. Because a coal surge pile is open to the elements, rain and/or snow will provide that
source. In clean coal piles, moisture will also be left over from the cleaning operation. During
fall, winter, and spring, low temperatures may result in freezing water binding the coal particles
so no surface flow can take place, even though above-freezing temperatures are present in the
coal below the surface. Time is also a factor, and an inactive pile will be more prone to surface
freezing. Compaction of coal near the surface of the pile can also prevent surface flow.
Compaction requires that a force be applied over an area of the coal. The degree of compaction
will vary depending on water content. If no moisture is present, then the likelihood of cohesive
strength and therefore compaction diminishes. As discussed above, moisture may come from rain
25
or snow or from the cleaning plant. The force applied to the coal at the surface over the feeder is
most likely the result of the weight and vibration of the dozer. A less likely source is coal
overburden pressure. According to the MSHA accident report for the fatality in November of
1998, compacted layers were observed overhanging less-compacted layers below in the void
.Here again; the dozer must be positioned over the feeder to compact the coal.
Quantification of the Fault Tree
The qualitative construction of the fault tree shows the interdependence of events. It does not,
however, depict the amount of influence the basic events have on the top fault event. A
quantified fault tree does show the influence of a basic event on the top fault event and ranks the
basic events in terms of this influence. The practicality of a fault tree approach becomes apparent
in such a construction. A quantifiedfault tree is a strategy, a plan of action, for it shows which
events have the most influence on the occurrence of the top fault event and therefore which
events should bead dressed first in any type of efficient and effective remedial action. A
quantified fault tree analysis can show where to act first to generate the most results for the least
amount ofwork.The first step in quantifying a fault tree is to assign initial probabilities to the
basic events. This step was taken by gathering information from a focus group familiar with coal
surge piles. The group was given the graphic of the fault tree and then asked to assign qualitative
ratings for the probabilities of occurrence of the basic events using their experience and best
judgment.
2.8.3.2 Event Tree Analysis
An event tree analysis (ETA) is an inductive procedure that shows all possible outcomes
resulting from an accidental (initiating) event , taking into account whether installed safety
barriers are functioning or not, and additional events and factors. Or An event tree is a graphical
representation of the logic model that identifies and quantifies the possible outcomes following
an initiating event By studying all relevant accidental events (that have been identified by a
preliminary hazard analysis, a HAZOP, or some other technique), the ETA can be used to
identify all potential accident scenarios and sequences in a complex system. Design and
procedural weaknesses can be identified, and probabilities of the various outcomes from an
accidental event can be determined. Event tree analysis provides an inductive approach to
26
reliability assessment as they are constructed using forward logic. Fault trees use a deductive
approach as they are constructed by defining TOP events and then use backward logic to define
causes.
Event tree analysis (Fig. 2.3) and fault tree analysis are, however, closely linked. Fault trees are
often used to quantify system events that are part of event tree sequences. The logical processes
employed to evaluate event tree sequences and quantify the consequences are the same as those
used in fault tree analyses.
Advantages:
• Well suited for single events with multiple outcomes
• Suited for high risks not amenable to simpler analysis methods
Disadvantages: • Trees can grow large very quickly
• Probabilities may be difficult to estimate
• Can be extremely time-consuming
Figure 2.4 Event tree analysis
27
Fig 2.4 Event tree analysis for gas explosion
2.8.3.3 HAZOP
A HazOp study identifies hazards and operability problems. The concept involves investigating
how the plant might deviate from the design intent. If, in the process of identifying problems
during a HazOp study, a solution becomes apparent, it is recorded as part of the HazOp result;
however, care must be taken to avoid trying to find solutions which are not so apparent, because
the prime objective for the HazOp is problem identification. Although the HazOp study was
developed to supplement experience-based practices when a new design or technology is
involved, its use has expanded to almost all phases of a plant's life. HazOp is based on the
principle that several experts with different backgrounds can interact and identify more problems
when working together than when working separately and combining their results.
28
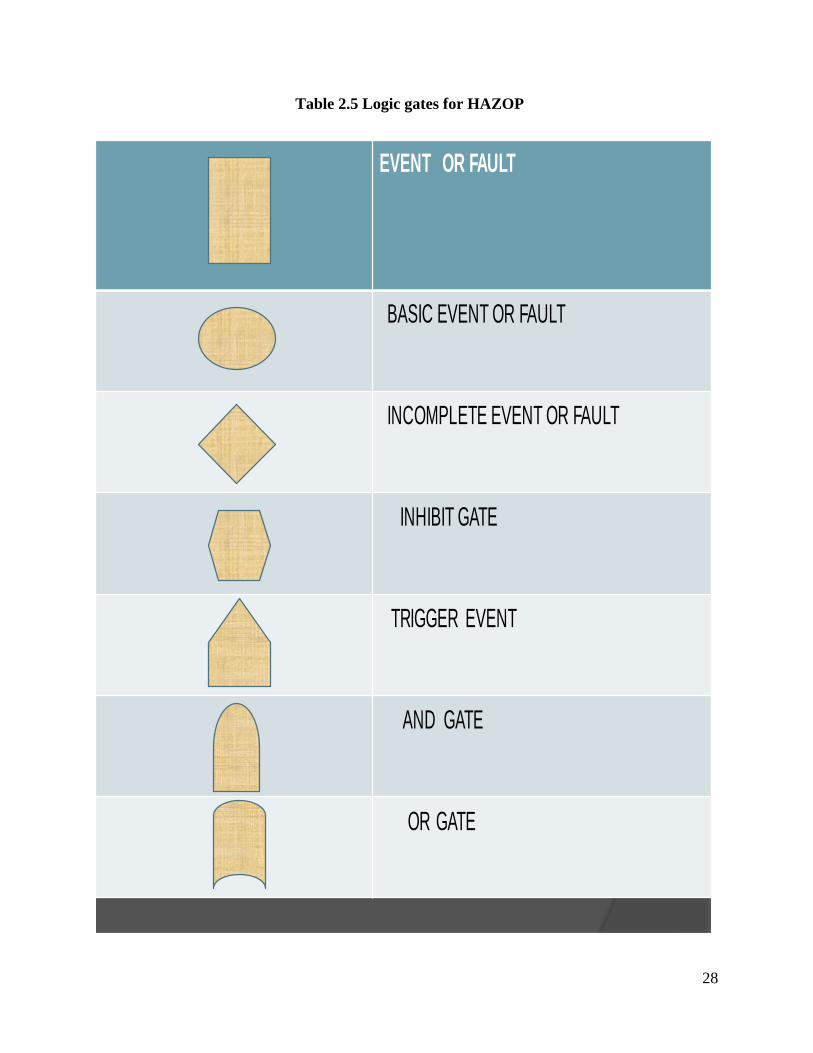
Table 2.5 Logic gates for HAZOP
EVENT OR FAULT
BASIC EVENT OR FAULT
INCOMPLETE EVENT OR FAULT
INHIBIT GATE
TRIGGER EVENT
AND GATE
OR GATE
29
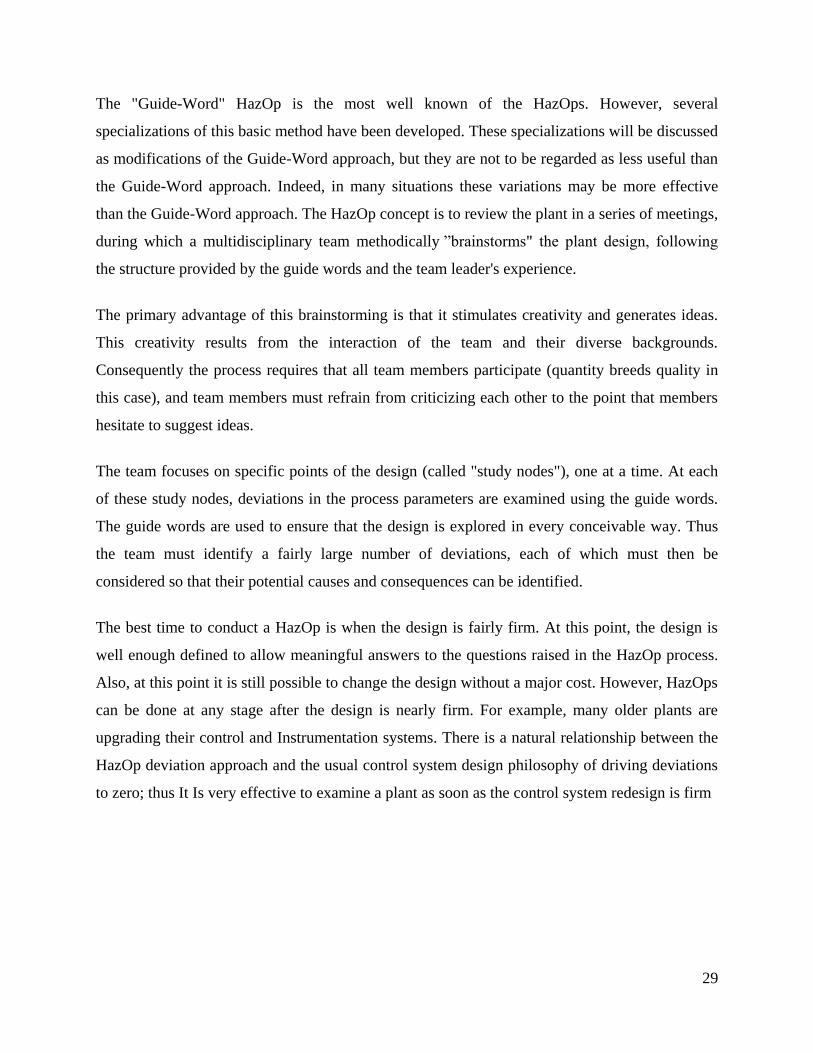
The "Guide-Word" HazOp is the most well known of the HazOps. However, several
specializations of this basic method have been developed. These specializations will be discussed
as modifications of the Guide-Word approach, but they are not to be regarded as less useful than
the Guide-Word approach. Indeed, in many situations these variations may be more effective
than the Guide-Word approach. The HazOp concept is to review the plant in a series of meetings,
during which a multidisciplinary team methodically ‖brainstorms" the plant design, following
the structure provided by the guide words and the team leader's experience.
The primary advantage of this brainstorming is that it stimulates creativity and generates ideas.
This creativity results from the interaction of the team and their diverse backgrounds.
Consequently the process requires that all team members participate (quantity breeds quality in
this case), and team members must refrain from criticizing each other to the point that members
hesitate to suggest ideas.
The team focuses on specific points of the design (called "study nodes"), one at a time. At each
of these study nodes, deviations in the process parameters are examined using the guide words.
The guide words are used to ensure that the design is explored in every conceivable way. Thus
the team must identify a fairly large number of deviations, each of which must then be
considered so that their potential causes and consequences can be identified.
The best time to conduct a HazOp is when the design is fairly firm. At this point, the design is
well enough defined to allow meaningful answers to the questions raised in the HazOp process.
Also, at this point it is still possible to change the design without a major cost. However, HazOps
can be done at any stage after the design is nearly firm. For example, many older plants are
upgrading their control and Instrumentation systems. There is a natural relationship between the
HazOp deviation approach and the usual control system design philosophy of driving deviations
to zero; thus It Is very effective to examine a plant as soon as the control system redesign is firm
30
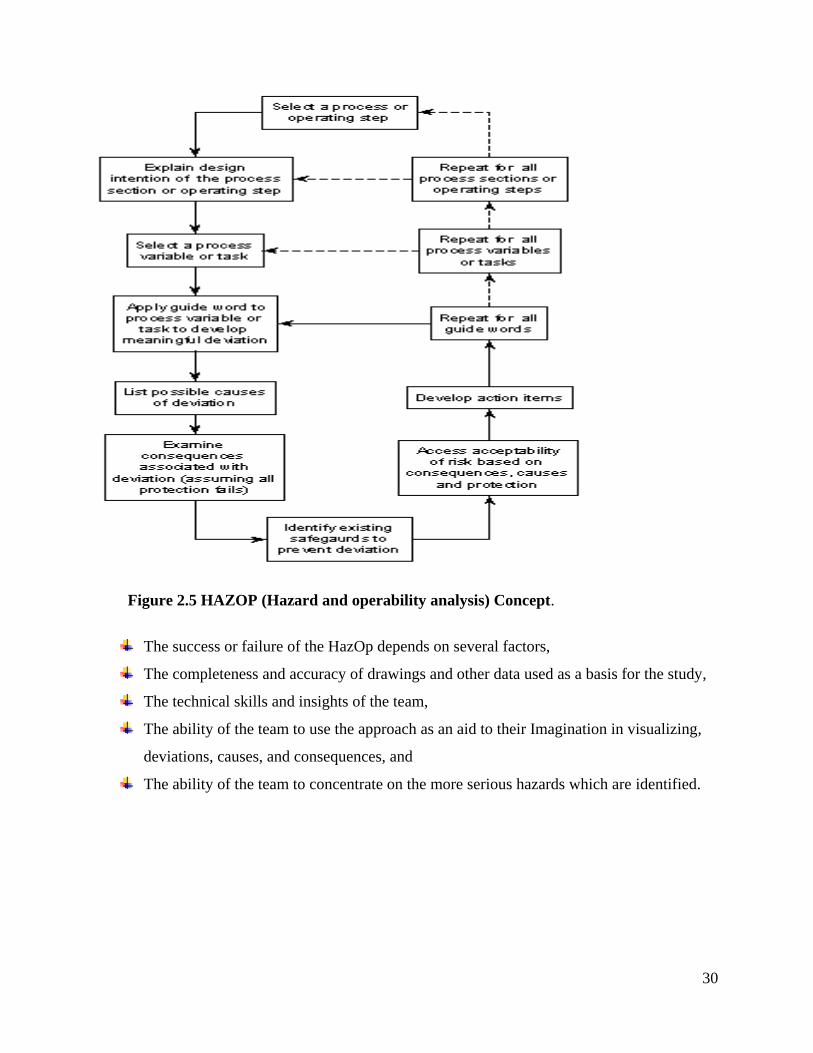
Figure 2.5 HAZOP (Hazard and operability analysis) Concept.
The success or failure of the HazOp depends on several factors,
The completeness and accuracy of drawings and other data used as a basis for the study,
The technical skills and insights of the team,
The ability of the team to use the approach as an aid to their Imagination in visualizing,
deviations, causes, and consequences, and
The ability of the team to concentrate on the more serious hazards which are identified.
31
The concepts presented above are put into practice in the following steps:
Define the purpose, objectives, and scope of the study,
Select the team,
Prepare for the study,
Carry out the team review, and
Record the results.
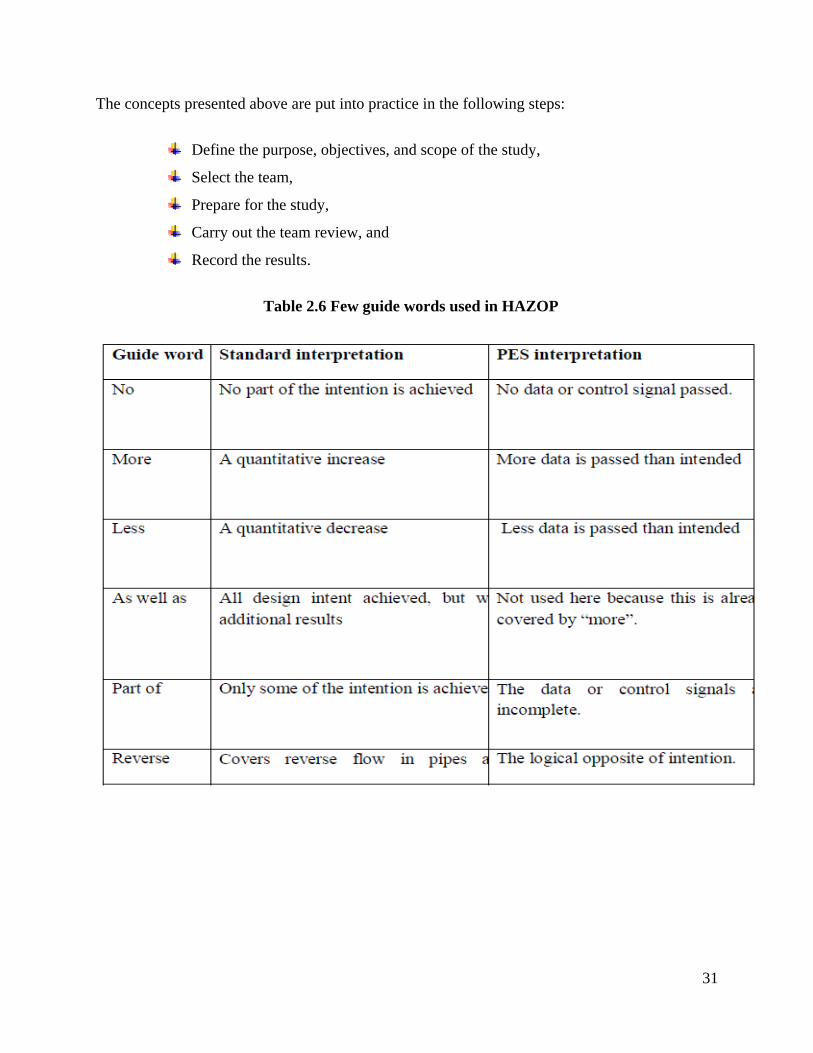
Table 2.6 Few guide words used in HAZOP
32
2.8.3.4 PRA (probabilistic risk analysis)
Probabilistic risk assessment (PRA) (or probabilistic safety assessment/analysis) is a
systematic and comprehensive methodology to evaluate risks associated with a complex
engineered technological entity.
Risk in a PRA is defined as a feasible detrimental outcome of an activity or action.
In a PRA, risk is characterized by two quantities:
The magnitude (severity) of the possible adverse consequence(s), and
The likelihood (probability) of occurrence of each consequence.
Consequences are expressed numerically (e.g., the number of people potentially hurt or killed)
and their likelihoods of occurrence are expressed as probabilities or frequencies (i.e., the number
of occurrences or the probability of occurrence per unit time). The total risk is the sum of the
33
products of the consequences multiplied by their probabilities. The spectrums of risks across
classes of events are also of concern, and are usually controlled in licensing processes - (it would
be of concern if rare but high consequence events were found to dominate the overall risk.)
Probabilistic Risk Assessment usually answers three basic questions:
What can go wrong with the studied technological entity, or what are the initiators or
initiating events (undesirable starting events) that lead to adverse consequence(s)?
What and how severe are the potential detriments, or the adverse consequences that the
technological entity may be eventually subjected to as a result of the occurrence of the
initiator?
How likely to occur are these undesirable consequences, or what are their probabilities or
frequencies?
The common paradigm of Probabilistic Risk Analysis (PRA) is to analyze a system so as to
express a complex hazard as a logical function (structure function) of a set of elementary events
whose probabilities can be inferred, so as to derive a probability for the occurrence of the hazard.
Probabilities for elementary events typically come from historical data, test data or expert
opinion, everything in steps 1-3 in unexceptional. However, as we have seen, step 4 may not be
possible. If there are special causes of failure, and in general there will be, then we can make no
reliable prediction of future frequency. From the bayesian standpoint, the future occurrence of
special causes is not encoded in our historical experience and we must not expect our inferences
to be well calibrated.
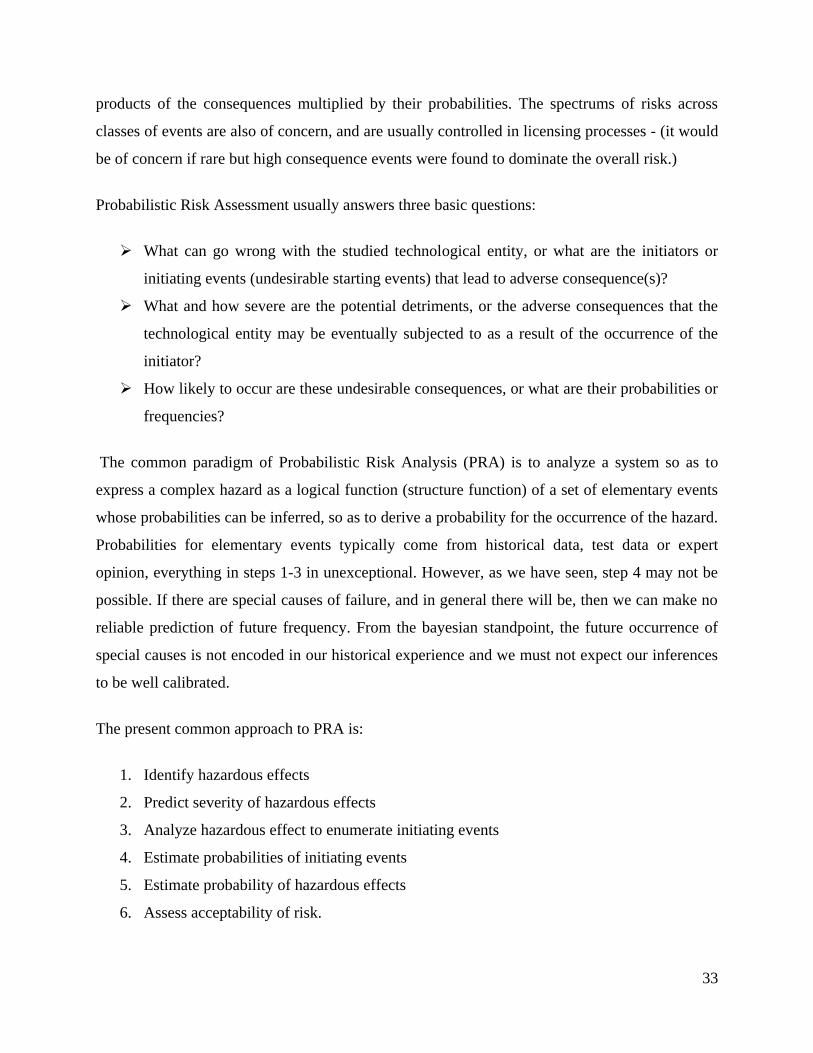
The present common approach to PRA is:
1. Identify hazardous effects
2. Predict severity of hazardous effects
3. Analyze hazardous effect to enumerate initiating events
4. Estimate probabilities of initiating events
5. Estimate probability of hazardous effects
6. Assess acceptability of risk.
34
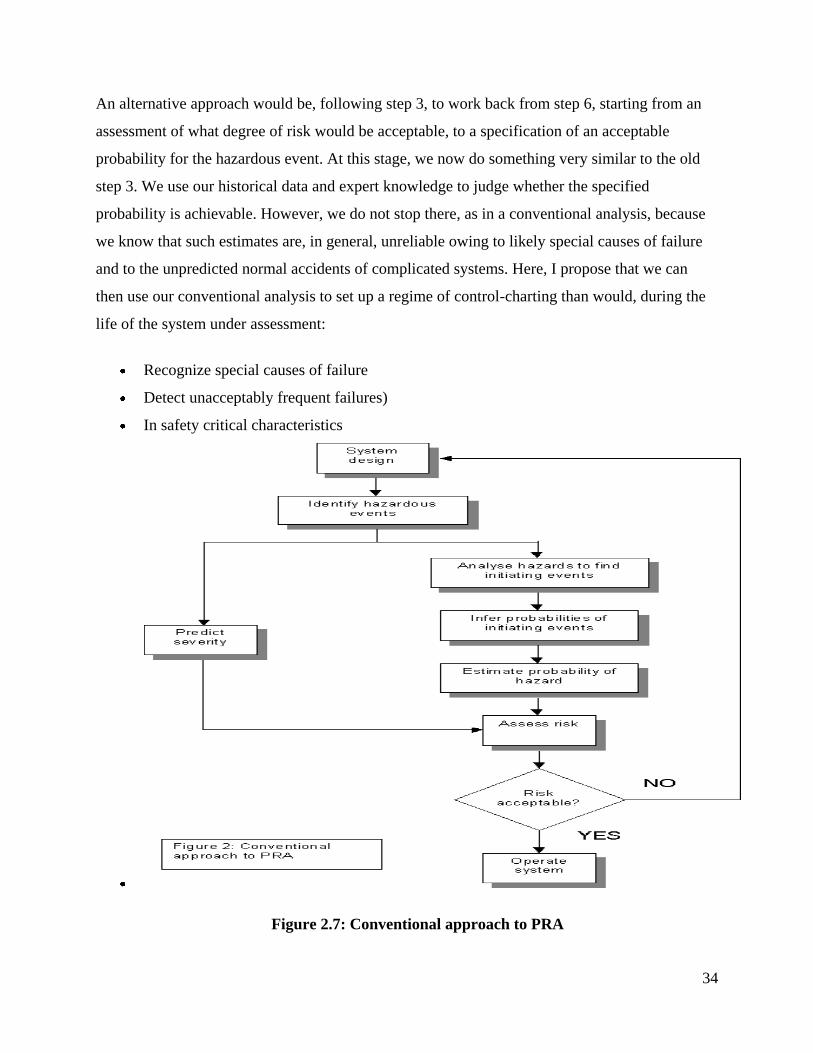
An alternative approach would be, following step 3, to work back from step 6, starting from an
assessment of what degree of risk would be acceptable, to a specification of an acceptable
probability for the hazardous event. At this stage, we now do something very similar to the old
step 3. We use our historical data and expert knowledge to judge whether the specified
probability is achievable. However, we do not stop there, as in a conventional analysis, because
we know that such estimates are, in general, unreliable owing to likely special causes of failure
and to the unpredicted normal accidents of complicated systems. Here, I propose that we can
then use our conventional analysis to set up a regime of control-charting than would, during the
life of the system under assessment:
Recognize special causes of failure
Detect unacceptably frequent failures)
In safety critical characteristics
Figure 2.7: Conventional approach to PRA
35
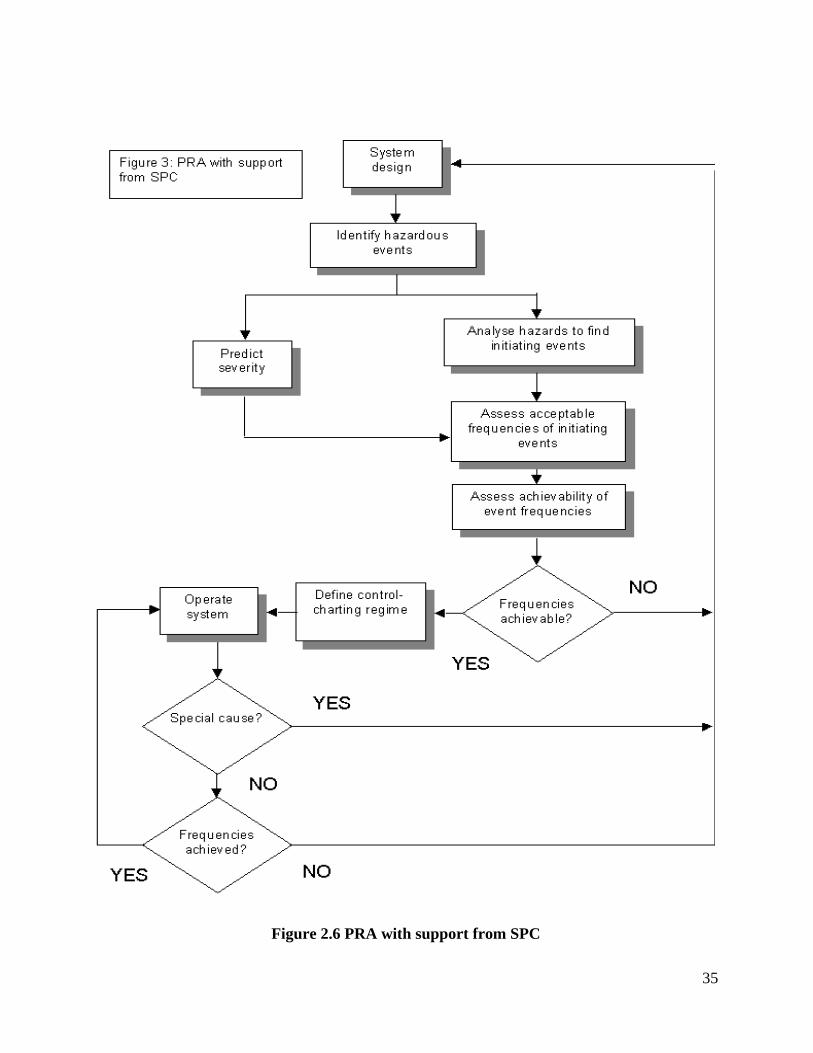
Figure 2.6 PRA with support from SPC
36
2.9 Basics of Environmental risk assessment
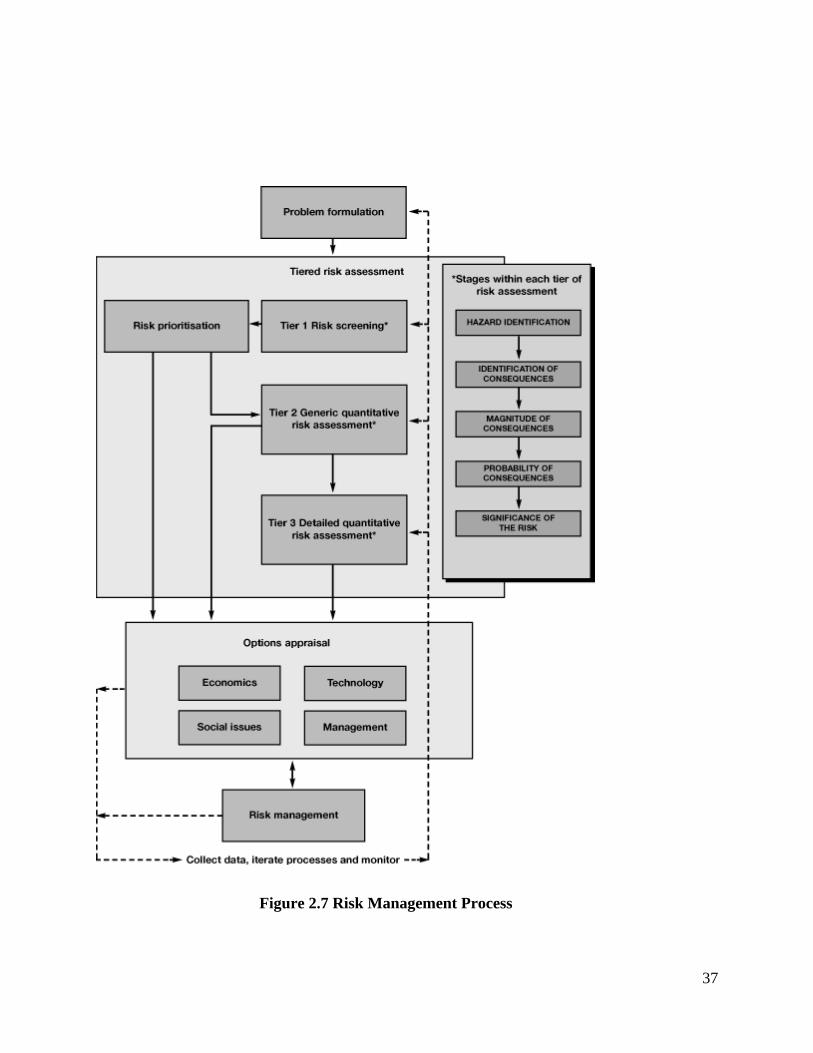
A pragmatic approach to environmental risk assessment can transform what may sometimes
appear to be an extremely detailed, complex and resource-intensive process into a practical aid to
decision-making. The figure provides a framework for a tiered approach to environmental risk
assessment and management where the level of effort put into assessing each risk is
proportionate to its priority (in relation to other risks) and its complexity (in relation to an
understanding of the likely impacts). This framework also illustrates
The importance of correctly defining the actual problem at hand,
The need to screen and prioritise all risks before quantification,
The need to consider all risks in the options appraisal stage, and
The iterative nature of the process.
2.9.1 Key stages
Key stages in each tier of environmental risk assessment
1>Identifying the hazard
These guidelines define hazard as a property or situation that in particular circumstances could
lead to harm. This may be determined by properties or circumstances and could include, for
example, the release of chlorofluorocarbons (CFCs), a tidal surge along a stretch of the coast, a
dry summer leading to low river flows, or the planting of a genetically modified crop. Where risk
assessment is to be applied at the policy level, the hazard may be as broad as the adverse impacts
of road transport on the environment, or the adverse impacts of induced climate change from the
contribution of fossil fuel-derived carbon dioxide emissions.
The identification of hazards, both in the problem formulation stage, and in subsequent tiers in
the process, will have an important bearing on the breadth of the overall assessment and the
credibility of the final output. If these sediments were to be contaminated, they might pose an
additional hazard.
37
Figure 2.7 Risk Management Process
38
2> Identification of consequences
The potential consequences that may arise from any given hazard are inherent to that hazard.
Although the full range of potential consequences must be considered at this stage, no account is
taken of likely exposure and therefore likely consequences. For example, while the potential
consequences of a discharge of toxic metals to a watercourse may be self-evident, a flood may
have additional, non-obvious consequences such as pollution arising from an over-stretched
sewerage system, or loss of habitats due to river scouring.
These examples serve to highlight why it is necessary to take a broad look at the potential
environmental damage that may occur, if only to be clear why some potential consequences are
rejected for further assessment.
3> Estimation of the magnitude of consequences
The consequences of a particular hazard may be actual or potential harm to human health,
property or the natural environment (the issue of probability of occurrence is covered below).
The magnitude of such consequences can be determined in different ways depending on whether
they are being considered as part of a risk screening process, or as part of a more detailed
quantification of risk. At all stages of risk assessment several key features need to be considered,
as described below.
The spatial scale of the consequences
The geographical scale of harm resulting from an environmental impact will often extend
considerably beyond the boundaries of the source of the hazard. Failure to consider this at an
early stage may result in the scope of the risk assessment being too limited. For example, a major
accident in a chemical plant is likely to have significant effects on the environment well beyond
the perimeter of the site.
The temporal scale of the consequences
The duration of the harm that results may raise issues of intergenerational equity or may be so
prolonged that the damage can be assumed to be permanent and the environment beyond
39
recovery. For example, should the release of a genetically modified crop result in extensive
cross-breeding with adjacent indigenous flora, any harmful environmental impacts could extend
far into the future.
The time to onset of the consequences
A further factor to consider is how quickly harmful effects might be seen. Standard economic
techniques tend to discount impacts that will happen in the future but sustainable development
emphasises the need to protect the interests of future generations. Risk assessment and
management must therefore pay as much attention to long-term problems as to the more
immediate risks. For example, the spillage of a solvent on porous ground may not result in an
impact on the underlying aquifer for decades. Once realised, however, the duration of the harm is
likely to be of the order of decades and will compromise the value of that aquifer as a source of
water for future generations.
The ability to forecast the time-scale and magnitude of the environmental impact through robust
and long-term modelling is therefore valuable, particularly at the quantifiable end of the risk
spectrum.
Stage 4: Estimation of the probability of the consequences
All stages to this point have assumed that realisation of the hazard will lead to environmental
harm. However, the probability of the consequences occurring must also be taken into account.
This has three components:
The probability of the hazard occurring
The probability of the receptors being exposed to the hazard
The probability of harm resulting from exposure to the hazard
The probability of the hazard occurring
Depending on the circumstances, assigning probabilities may be quite straightforward or may
require some sophistication in approach. For example, at a screening level, it might be as simple
as stating, on the basis of experience, that on a scale of 1 (low) to 5 (high) a pin-hole leak in a
40
particular pipe in a chemical plant has a probability of, say, 4. Floods can be categorised by their
return period (eg one in a hundred years) based on historical records. On the other hand, there
will be situations in which it is necessary to assign a probability distribution to the likelihood of
the event occurring - for example, that a non-genetically modified crop will be widely pollinated
by a genetically modified crop. In many instances this information can be obtained from
monitoring data, or based on 'worst-case' or 'reasonable worst-case' scenario estimates.
The probability of the receptors being exposed to the hazard
It is important to establish, at an early stage in the process, whether or not a pathway exists
between the hazard and the receptor. If it can be shown that no actual or potential connection
exists, then the risk requires no further attention. For example, soil contamination will not pose a
risk to farm animals if the land is not used for agricultural purposes. But care is needed not to
overlook less obvious pathways, or changes in future circumstances.
Having established one or more pathways, the degree of exposure via those pathways should be
quantified. A range of factors will affect the probability and degree of exposure. For example,
the exposure of a receptor to an atmospheric emission of sulphur dioxide will depend on the
direction and strength of the prevailing wind at the time of release. The impact of a coastal flood
in a tourist area may be dictated by the time of the year at which the flood occurs; the loss of
property may be greater in summer when caravan parks are occupied than during the winter
season when occupancy is likely to be low.
The probability of harm resulting from exposure to the hazard
Even following exposure, the likelihood of harm resulting is probabilistic and will depend on the
likely susceptibility of an individual receptor to the hazard and the amount and duration of
exposure. This is often simplified in terms of a dose-response relationship, which directly relates
exposure to the magnitude of harm for certain receptor types. Such relationships frequently
embody 'safety' or uncertainty factors to account for the extrapolation of data from experimental
or generalised studies. In flood damage assessment, for example, standard depth-damage curves
are used to relate the depth of flood waters to the amount of damage sustained by a building or
its contents, again according to the duration of exposure to the flood waters. These relationships
41
simplify the probabilistic nature of harm, because for any exposure, the likelihood of harm at a
certain magnitude will be dependent on many individual factors. Few risk assessments allow for
this level of sophistication, and the magnitude of harm is usually taken as a direct result of
exposure.
Stage 5: Evaluating the significance of a risk
This stage is often referred to as risk characterization, although this terminology tends to hide the
true goal of the activities involved. Having determined the probability and magnitude of the
consequences that may arise as a result of the hazard, it is important to place them in some sort
of context. It is at this point, therefore, that some value judgments are made, either through
reference to some pre-existing measure, such as a toxicological threshold, environmental quality
standard or flood defense standard, or by reference to social, ethical, or political standards. In
some circumstances, a formalized quantitative approach to determining significance may be
possible, for example the tolerability of risk (TOR) framework developed by the Health and
Safety Executive. In other instances, the risks of various options might be compared against one
another.
42
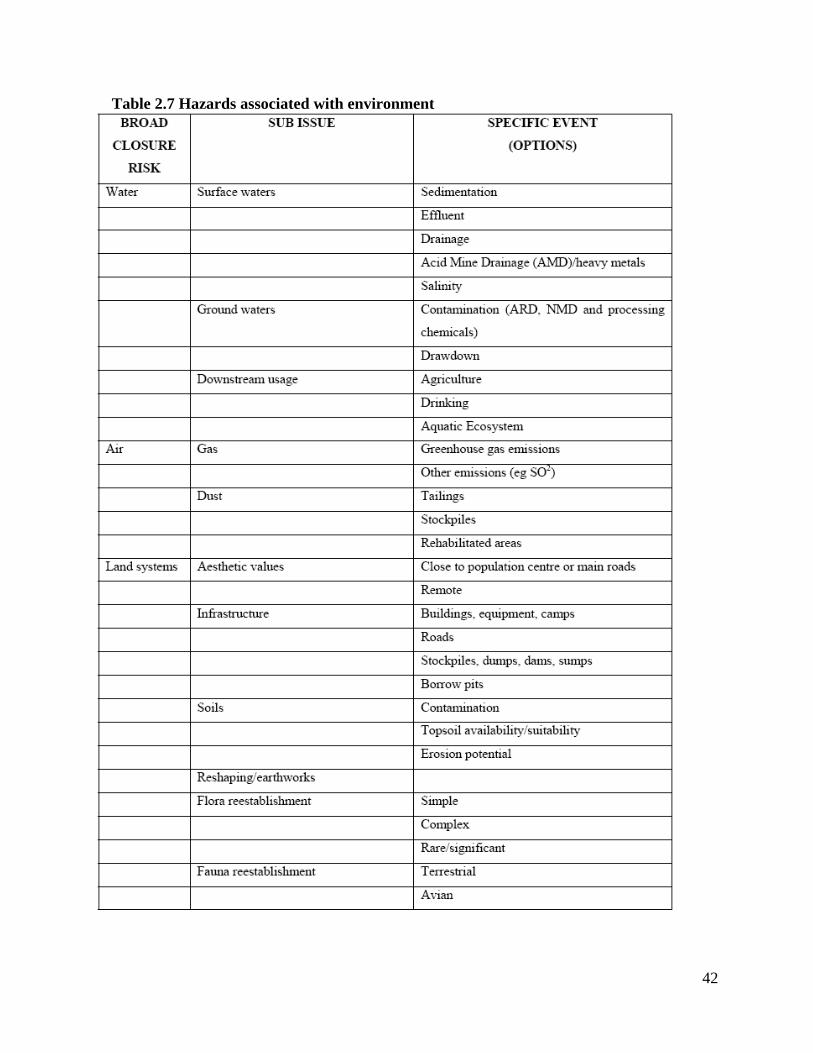
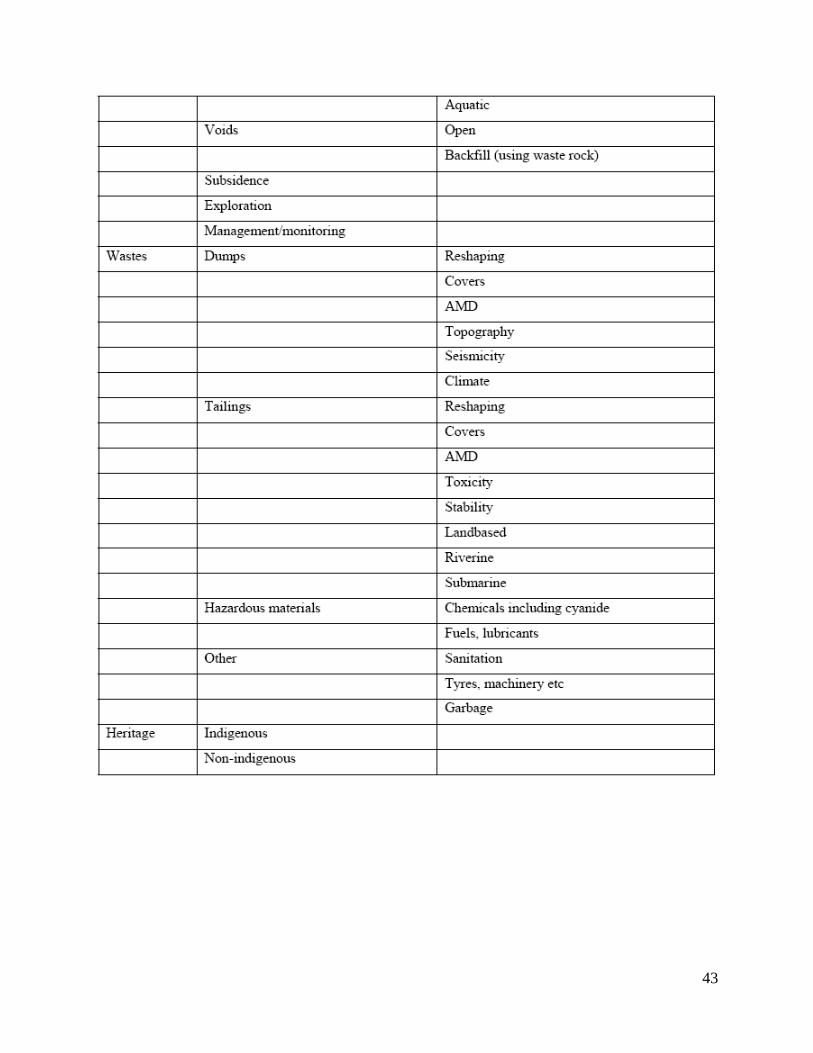
Table 2.7 Hazards associated with environment
43
44
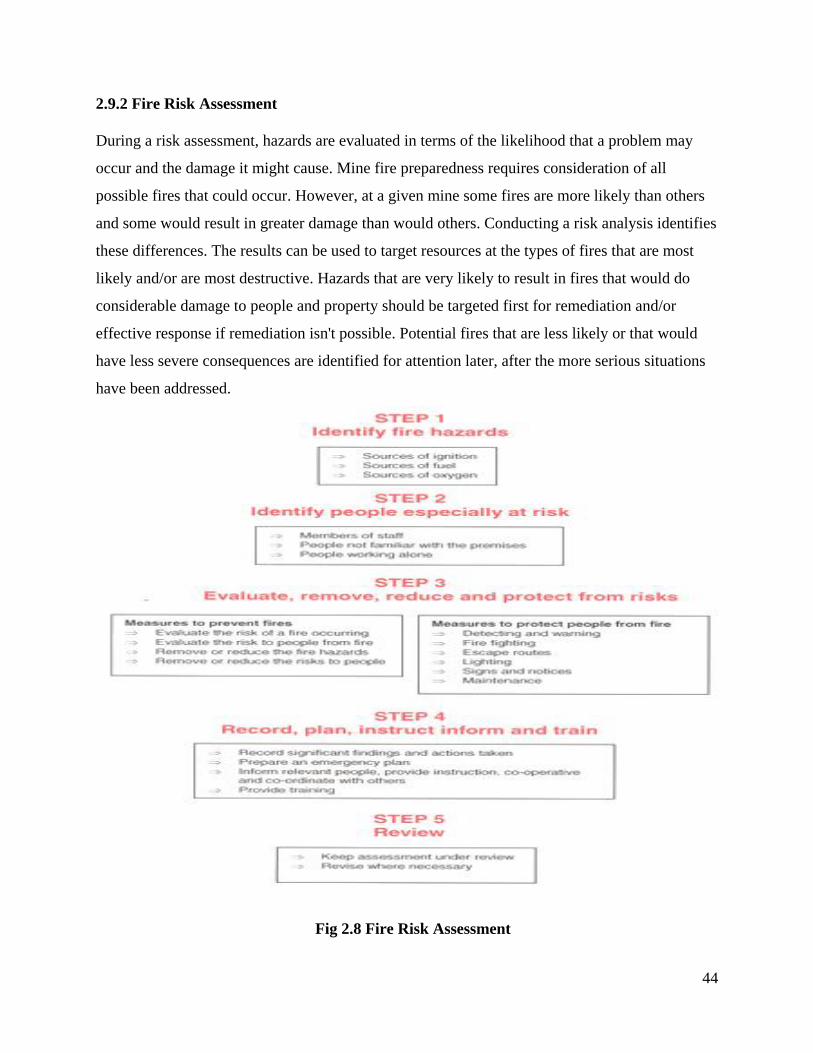
2.9.2 Fire Risk Assessment
During a risk assessment, hazards are evaluated in terms of the likelihood that a problem may
occur and the damage it might cause. Mine fire preparedness requires consideration of all
possible fires that could occur. However, at a given mine some fires are more likely than others
and some would result in greater damage than would others. Conducting a risk analysis identifies
these differences. The results can be used to target resources at the types of fires that are most
likely and/or are most destructive. Hazards that are very likely to result in fires that would do
considerable damage to people and property should be targeted first for remediation and/or
effective response if remediation isn't possible. Potential fires that are less likely or that would
have less severe consequences are identified for attention later, after the more serious situations
have been addressed.
Fig 2.8 Fire Risk Assessment
45
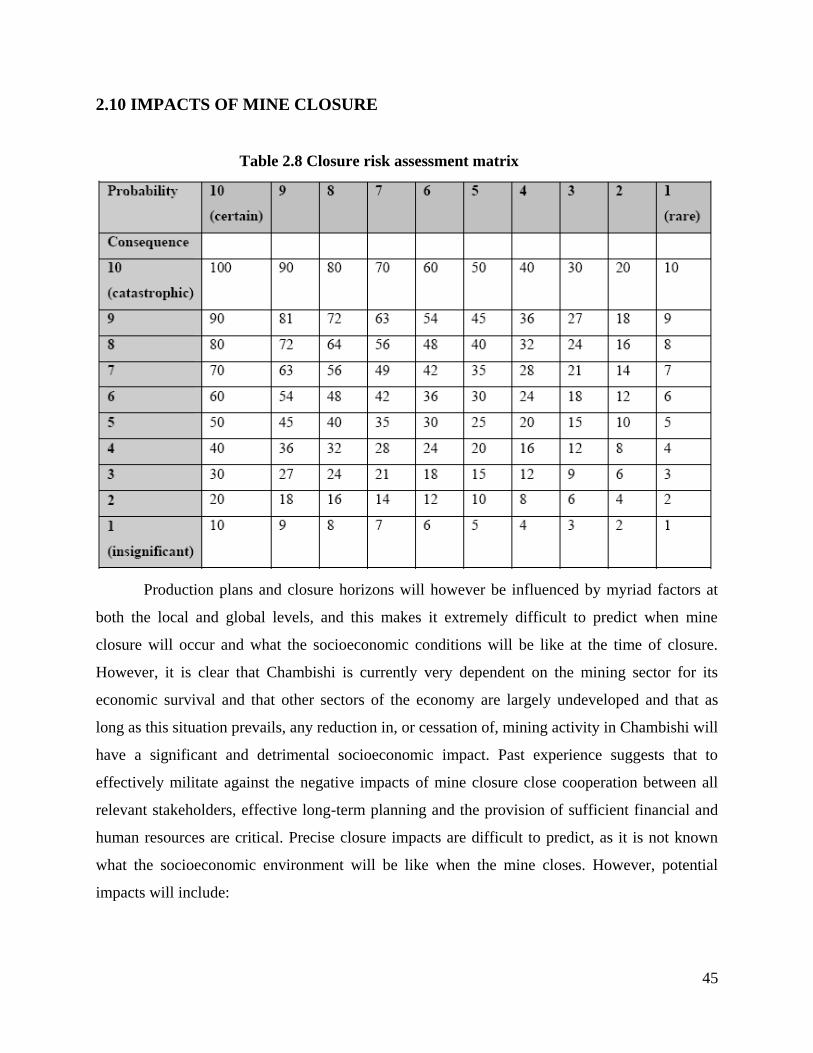
2.10 IMPACTS OF MINE CLOSURE
Table 2.8 Closure risk assessment matrix
Production plans and closure horizons will however be influenced by myriad factors at
both the local and global levels, and this makes it extremely difficult to predict when mine
closure will occur and what the socioeconomic conditions will be like at the time of closure.
However, it is clear that Chambishi is currently very dependent on the mining sector for its
economic survival and that other sectors of the economy are largely undeveloped and that as
long as this situation prevails, any reduction in, or cessation of, mining activity in Chambishi will
have a significant and detrimental socioeconomic impact. Past experience suggests that to
effectively militate against the negative impacts of mine closure close cooperation between all
relevant stakeholders, effective long-term planning and the provision of sufficient financial and
human resources are critical. Precise closure impacts are difficult to predict, as it is not known
what the socioeconomic environment will be like when the mine closes. However, potential
impacts will include:
46
Loss of mining jobs and consequent loss of income for individuals and dependents,
Loss of benefits to mine employees,
Closure or shrinkage of local business, both formal and informal, those are reliant directly on
the mine or on mine employees for their business,
Loss of jobs in sectors serving the mine,
Increased unemployment due to the lack of employment opportunities in other sectors,
Increase in informal business and land-based livelihood activities,
Increased poverty if ex mine workers, and others deriving an income from the mine, do not
find alternative livelihoods to provide equivalent incomes,
Growth in informal settlements,
Deterioration in condition of housing stock,
Disruption to or deterioration in health care facilities and services currently run by NFCA if
there is insufficient planning for hand-over to suitable authorities prior to mine closure,
Out migration of skilled professionals, and
Disruptions to water supply and sanitation services if there is insufficient planning of water
supply management prior to mine closure.
Tailings dumps from past mining activities around Johannesburg in South Africa, which
are a source of dust affecting the health of neighboring populations. In some cases the
responsibility for the rehabilitation of the dumps can be attributed, but economic conditions have
prevented rehabilitation.
The major impacts of abandoned mine sites are acid mine drainage, loss of productive
land, visual effects, surface and groundwater pollution, soil contamination, siltation,
contamination of aquatic sediments and fauna, air pollution from dust, risks posed by abandoned
shafts and pits, and landslides due to collapse of waste and tailings dumps.
Impacts that change conditions affecting these objectives are often broadly discussed as
the 'impacts' or the environmental impacts of a site or a closure plan. It is convenient to consider
potential impacts in four groupings:
47
1. Physical stability - Buildings, structures, workings, pit slopes, underground openings
etc. must be stable and not move so as to eliminate any hazard to the public health and
safety or material erosion to the terrestrial or aquatic receiving environment at
concentrations that are harmful. Engineered structures must not deteriorate and fail.
2. Geochemical stability - Minerals, metals and 'other' contaminants must be stable, that is,
must not leach and/or migrate into the receiving environment at concentrations that are
harmful. Weathering oxidation and leaching processes must not transport contaminants,
in excessive concentrations, into the environment. Surface waters and groundwater must
be protected against adverse environmental impacts resulting from mining and processing
activities.
3. Land use - The closed mine site should be rehabilitated to pre-mining conditions or
conditions that are compatible with the surrounding lands or achieves an agreed
alternative productive land use. Generally the former requires the land to be aesthetically
similar to the surroundings and capable of supporting a self-sustaining ecosystem typical
of the area.
4. Sustainable development - Elements of mine development that contribute to (impact)
the sustainability of social and economic benefit, post mining, should be maintained and
transferred to succeeding custodians.
Clearly the assessment of these types of impacts and closure requirements must address
components of the site as well as the region and must select measures and allocate resources to
address the major issues of impact. In order to minimize the various impacts, risks and
liabilities, it is necessary to anticipate, as early in the process as possible, potential future
liabilities and risks, and to plan for their elimination or minimization. In many areas, much of
the liability or risk is associated with the uncertainty of the requirements for closure and
rehabilitation from the succeeding custodian (be it a government agency, community
organization or corporate entity). Early identification of the succeeding custodian and their
involvement in the development of the closure plan enables the closure requirements to be
established and agreed and considered in the closure plan development.
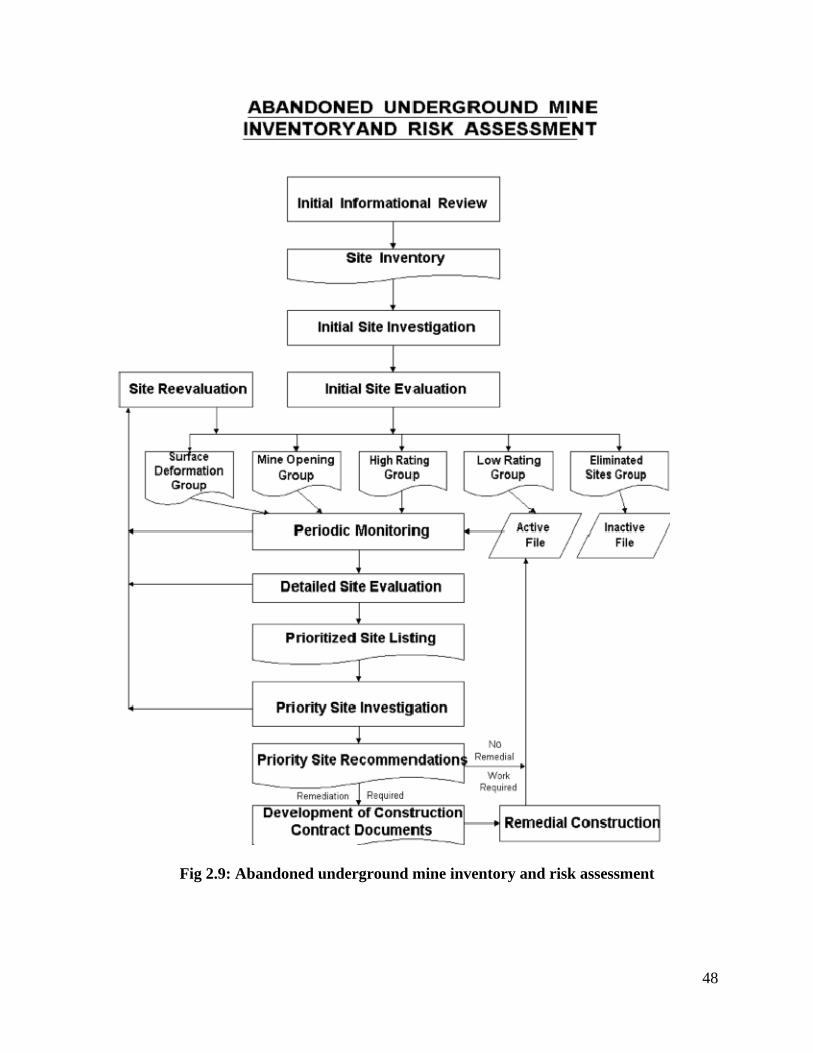
48
Fig 2.9: Abandoned underground mine inventory and risk assessment
49
This allows the mining company to determine, and provide for, the requirements of the
succeeding custodians, gain their support for the closure plan and minimize the risks and
liabilities that may derive from succeeding custodian rejection or objection to the closure
measures at the time of mine closure.
Landscape degradation
Alpine environment is extremely sensitive regarding the interference in the natural ecosystem.
Open pits, mining dumps, and tailing dams are a severe degradation of the environment. Due to
the specific climatic and topographic conditions in an Alpine environment nature's self-healing
capabilities are considerably reduced. As in this area the economy relies on tourism to a
considerable extent, human support is needed to minimize the negative effects of mining
activities and to speed up the process of mining site re-naturation.
Landslides - dump slope stability
Not stabilized mining dumps are potential thread because of the possibility of dump slides,
endangering people, infrastructure, and the environment. Dump stability depends on many
factors, e.g. type of material, grain or block size, slope angle, thickness, water content, and type
of cover (uncovered material, different types of vegetation). Mining dumps can be stabilized by
means of landscaping and reforestation, thus regulating water balance within the tailings.
Contamination
Because of the relatively pure carbonatic iron ore mined at Erzberg, direct contamination by
toxic material is not a major problem in this case. However in general mining dumps are a
potential thread to the environment because of leaching of toxic elements by precipitation, or
dust blow-out from the tailings. These effects can be reduced by targeted remediation activities,
reforestation being an effective method to inhibit excessive percolation of dumps by
precipitation. Therefore methods for environmental monitoring developed at Erzberg test site
will be applicable also to mining sites with serious contamination problems.

50
Physical Impact
Beyond the potential for pollutant impacts on human and aquatic life, physical impacts are
associated with the sedimentation, including the filling of deep pools resulting in the loss of
habitat for fish and an increase in temperature. The sedimentation an also result in the filling of
downstream reservoirs reducing the capacity for both flood control and power generation. The
sedimentation can also cause the channel to widen and become shallower, which may increase
the frequency of over bank flow.
Impact of Uranium Mining
In many respects uranium mining is much the same as any other mining. Projects must
have environmental approvals prior to commencing, and must comply with all environmental,
safety and occupational health conditions applicable. Increasingly, these are governed by
international standards, with external audits. Once approved, open pits or shafts and drives are
dug, waste rock and overburden is placed in engineered dumps. Tailings from the ore processing
must be placed in engineered dams or underground. Finally the whole site must be rehabilitated
at the end of the project. Meanwhile air and water pollution must be avoided. These processes
are common to all metalliferous mining, and are well recognized and understood.
Figure 2.10 Abandoned uranium mine
51
2.10.1 Acid Mine Drainage (AMD):
Acid mine drainage, results when the mineral pyrite (FeS2) is exposed to air and water, resulting
in the formation of sulfuric acid and iron hydroxide For chemists, the equation for AMD
formation is:
FeS2 + 3.75 O2 + 3.5 H2O Û Fe(OH)3 + 2 H2SO4
Pyrite is commonly present in coal seams and in the rock layers overlying coal seams. AMD
formation occurs during surface mining when the overlying rocks are broken and removed to get
at the coal. It can also occur in deep mines which allow the entry of oxygen to pyrite-bearing
coal seams. One leading method of reclamation that has been used in other parts of the world,
and which could also be used in the Amazon, is the creation of special artificial wetlands. These
wetlands can survive in acidic conditions, and they support microbes that can actually convert
the acid into less toxic compounds.
Water that is discharged from mining or mine-related operations which contains high levels of
dissolved iron and aluminum sulfates in conjunction with pH values less than 4.5 (acidic). It is
produced when oxygen dissolved in water reacts with pyritic (iron sulfide) materials found in
association with most coal deposits. Acid mine drainage (AMD) degrades the water quality of
streams and water supplies, often to the point of eliminating all biological activity within the
stream contaminated with AMD.
Treatment of AMD could also involve chemical neutralization of the acidity, followed by
precipitation of iron and other suspended solids. Such treatment systems include:
1. Equipment for feeding the neutralizing agent to the acid mine drainage,
2. Means for mixing the two streams (acid mine drainage and neutralizing agent),
3. Procedures for ensuring iron oxidation, and
4. Settling ponds for removing iron, manganese, and other co-precipitates.
52
Many factors dictate the level of sophistication that the treatment system must have to
ensure that effluent standards will be met. These factors include: the quantity of AMD to be
treated, the chemical characteristics of the AMD, climate, terrain, sludge characteristics, and
projected life of the mining plant. The chemicals which are usually used for AMD treatment
include limestone, hydrated lime, soda ash, caustic soda, and ammonia.
2.7 RISK MANAGEMENT:
2.7.1 Safety Management Systems
A Safety Management System (SMS) consists of comprehensive sets of policies, procedures and
practices designed to ensure that barriers to unwanted incidents are in place, in use and are
effective. An integrated SMS focuses on both the traditional OHS area and on management of
engineering safety. The SMS tends to integrate all aspects of safety into the ongoing activities of
everyone involved in the operations—from the operator to the chief executive officer. The
responsibility for safety is both individual and collective.
Characteristics of Safety Management Systems
The major characteristics of SMS are:
• It is the principal vehicle for day to day management of all aspects of safety in the operations.
• Its focus is not only on personnel safety, but also ensuring operational integrity and minimizing
business interruptions, even if no one was injured.
• It outlines a set of procedures for everyone to follow (depending on their roles and
responsibilities, a select set of procedures may apply to each operating group), is system-
dependent and NOT individual-dependent.
• It contains a list of safety critical equipment, and how these are maintained to required
operational integrity through safety critical activities. The activities, procedures, schedules and
responsibilities are defined.
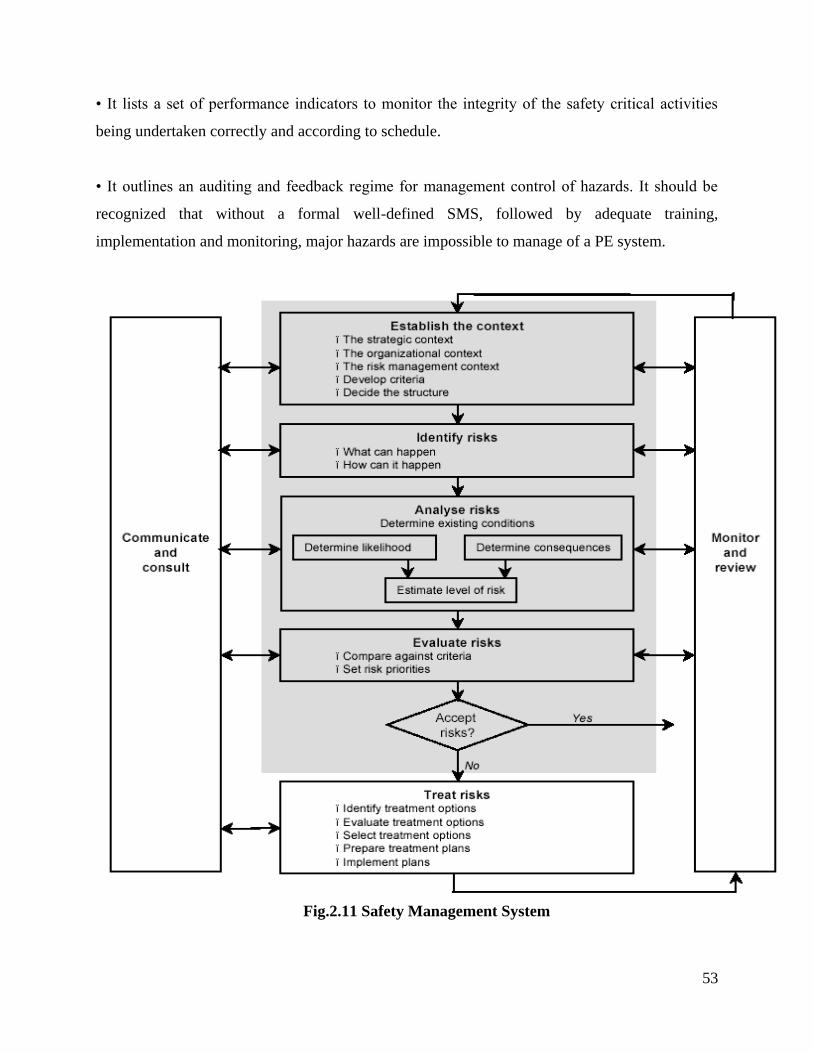
53
• It lists a set of performance indicators to monitor the integrity of the safety critical activities
being undertaken correctly and according to schedule.
• It outlines an auditing and feedback regime for management control of hazards. It should be
recognized that without a formal well-defined SMS, followed by adequate training,
implementation and monitoring, major hazards are impossible to manage of a PE system.
Fig.2.11 Safety Management System
54
CHAPTER 3
DEVELOPMENT OF COMPUTER PROGRAMS AND CASE
STUDIES FOR SAFETY AND ENVIRONMENTAL RISK
ASSESSMENT IN MINES
Computer modeling in Risk Assessment is a relatively new process. Risk Assessment for mines
is even scarce and rare to be found in application using computers. In today‘s world we have the
availability of good software‗s and fast machines. It is possible to quantify and compile many of
the nuances of Risk hazards in mines, the only problem being that no suitable methodology
exists. Even in professional Disaster management institutes, Risk Assessment and Disaster
Management Plans for mine workings are not undertaken, so the need for it has to be
emphasized.
3.1 FAULT TREE+ 11.0
FaultTree+11.0 analysis program for Microsoft Windows enables us to analyse the availability
and reliability of both complex and simple systems and is easy and intuitive to use. Fault tree
provides an integrated environment for performing fault tree analysis, event tree analysis and
Markov analysis. The program is rich in features and can model a wide range of scenarios. The
Fault Tree+ 11.0 program is a powerful systems reliability analysis tool that allows fault and
event tree analyses to be performed in an integrated environment. Customized Markov models
may also be linked to events in the fault or event tree diagram. The program may also be used to
analyze fault trees, event trees and Markov models independently.
Fault tree software was studied and used for drawing of Fault Tree and Event Trees. It was used
to construct a fault tree for fire risk assessment (Fig.3.1).
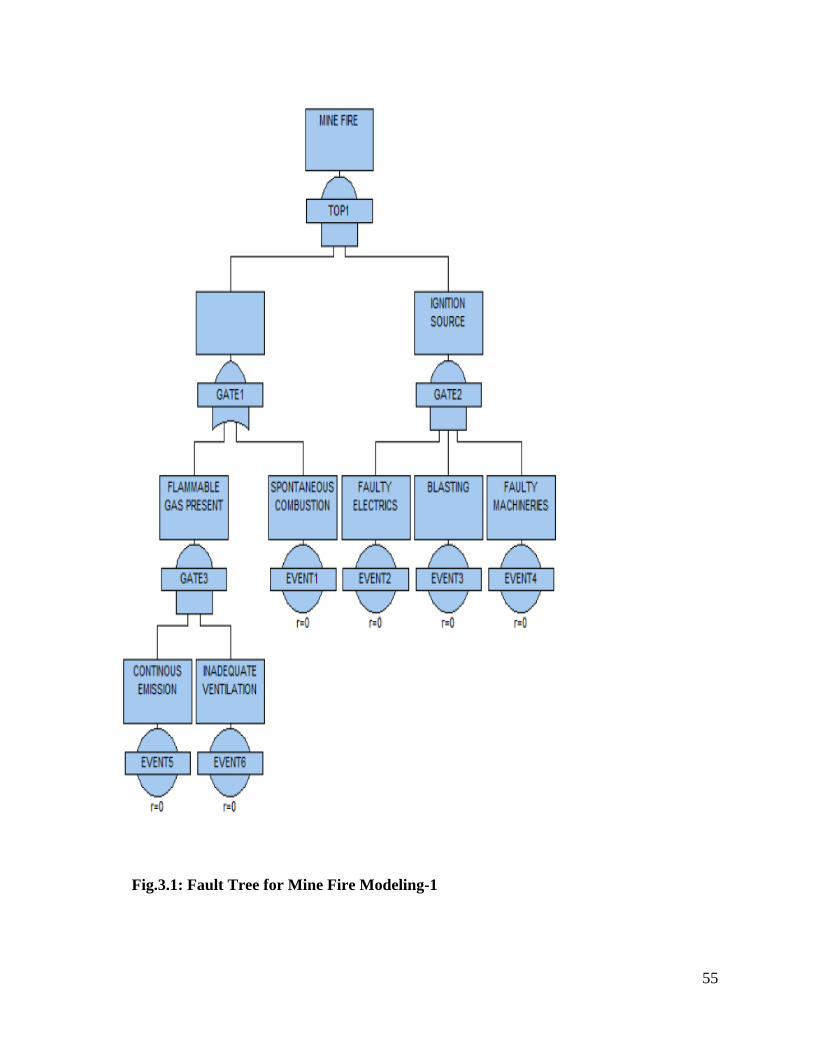
55
Fig.3.1: Fault Tree for Mine Fire Modeling-1
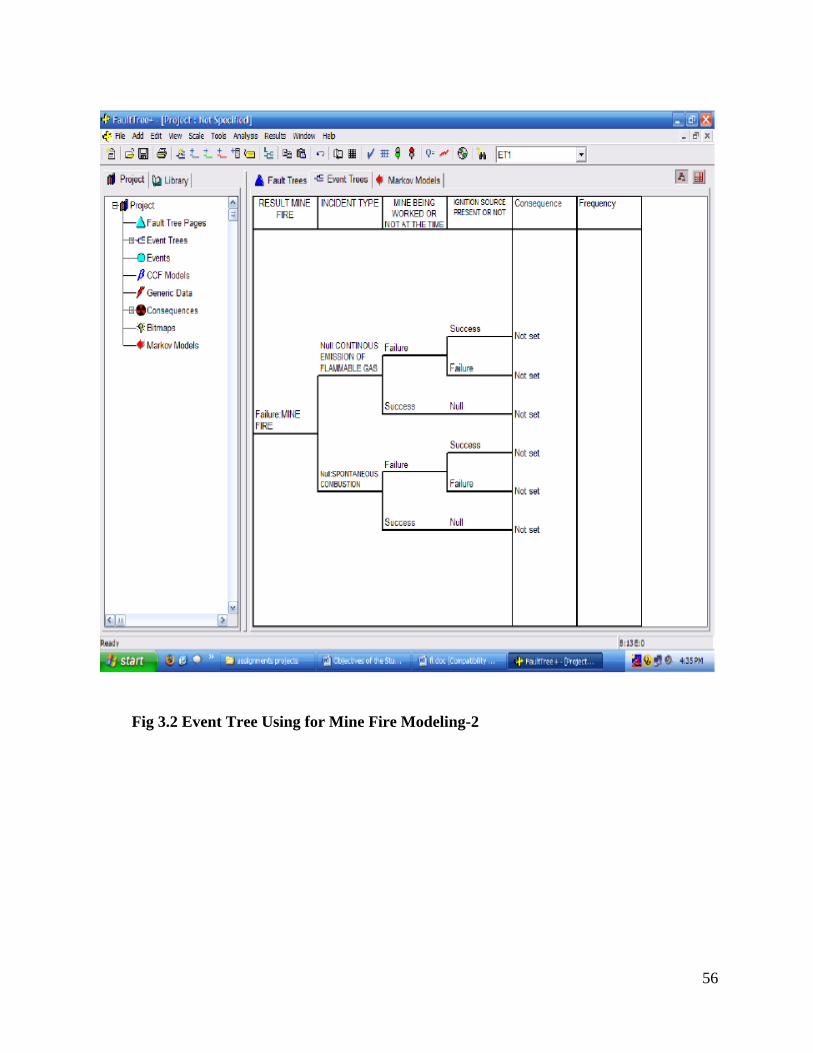
56
Fig 3.2 Event Tree Using for Mine Fire Modeling-2
57
3.2 PROGRAMMING MODEL FOR SPONTANEOUS FIRE RISK POTENTIAL
IN UNDERGROUND MINES
Problem of fire due to spontaneous hating in underground panels is of great concern to mine
personnel. Apart from the intrinsic characteristics of coal, the environment originated from the
mining operations is also responsible for the fire .There are several models developed in different
countries for estimation of fire risk potential of mine panels. In this project, computer program
was written in C++ for estimation of spontaneous fire risk potential of underground Bord and
Pillar workings. The program was developed based on the approach suggested by Roy( 2006).
Assign each of the major mine parameters that can influence underground panel fire, an
appropriate fire risk value and then to estimate overall fire risk rating of the panel.
The no of parameters was divided under 3 groups.
1) Panel specific group
-State of extraction
- Nature of extraction
-Existence of coal in roof and crushed pillars
-Frequency of roof fall
-Size of panel
2) Environment group of parameters
-geological disturbances, quality of overburden, existence of subsidence, improper ventilation,
leakage of air through isolation stoppings, incubation period of seam,etc
3) Coal and seam characteristicsgroup of parameters
-Crossing point temperature
-Wetness of mines
-Existence of pyrite band
-Particle size distribution
Flowchart for the same model is shown below:-
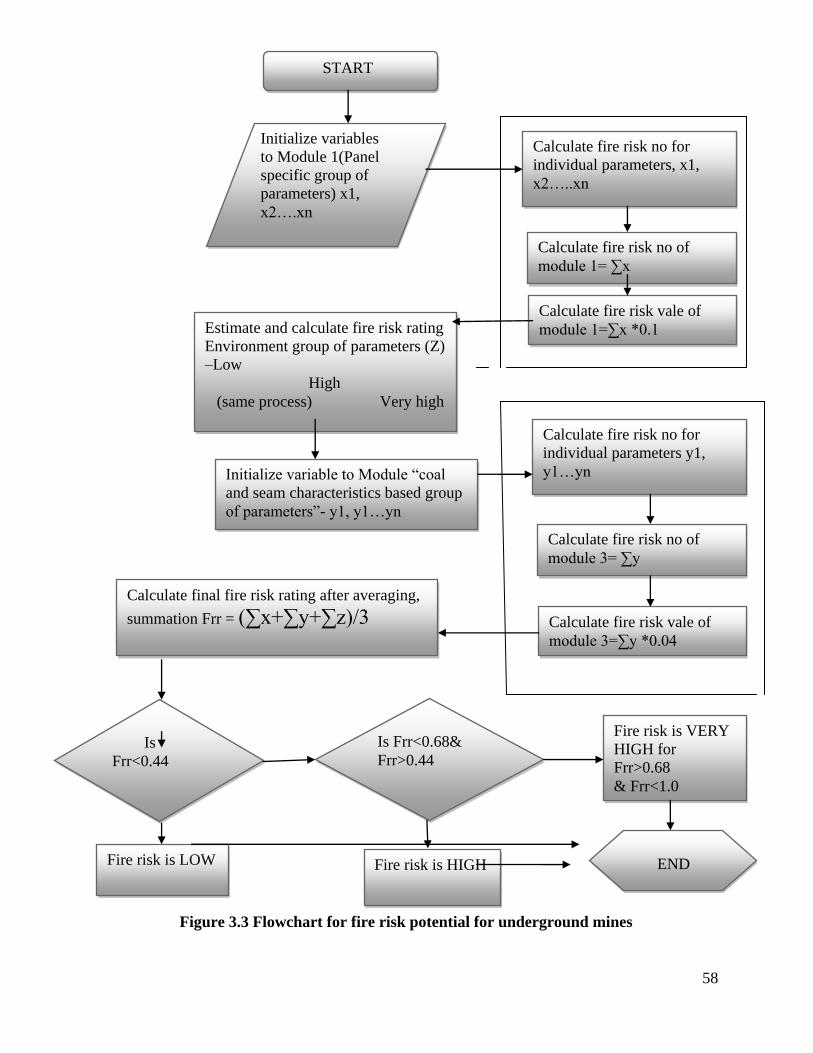
58
Figure 3.3 Flowchart for fire risk potential for underground mines
START
Initialize variables
to Module 1(Panel
specific group of
parameters) x1,
x2….xn
Calculate fire risk no for
individual parameters, x1,
x2…..xn
Calculate fire risk no of
module 1= ∑x
Calculate fire risk vale of
module 1=∑x *0.1 Estimate and calculate fire risk rating
Environment group of parameters (Z)
–Low
High
(same process) Very high
Initialize variable to Module ―coal
and seam characteristics based group
of parameters‖- y1, y1…yn
Calculate fire risk no for
individual parameters y1,
y1…yn
Calculate fire risk no of
module 3= ∑y
Calculate fire risk vale of
module 3=∑y *0.04
Calculate final fire risk rating after averaging,
summation Frr = (∑x+∑y+∑z)/3
Is
Frr<0.44
Fire risk is LOW
Is Frr<0.68&
Frr>0.44
Fire risk is HIGH
Fire risk is VERY
HIGH for
Frr>0.68
& Frr<1.0
END
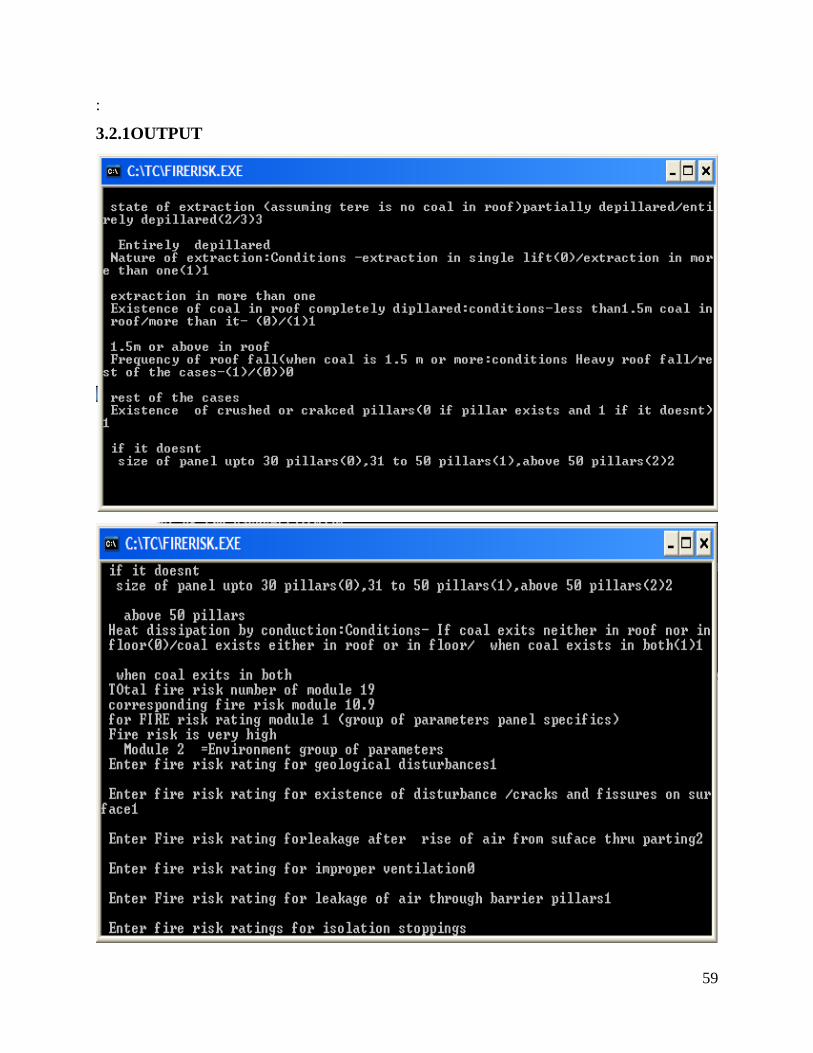
59
:
3.2.1OUTPUT
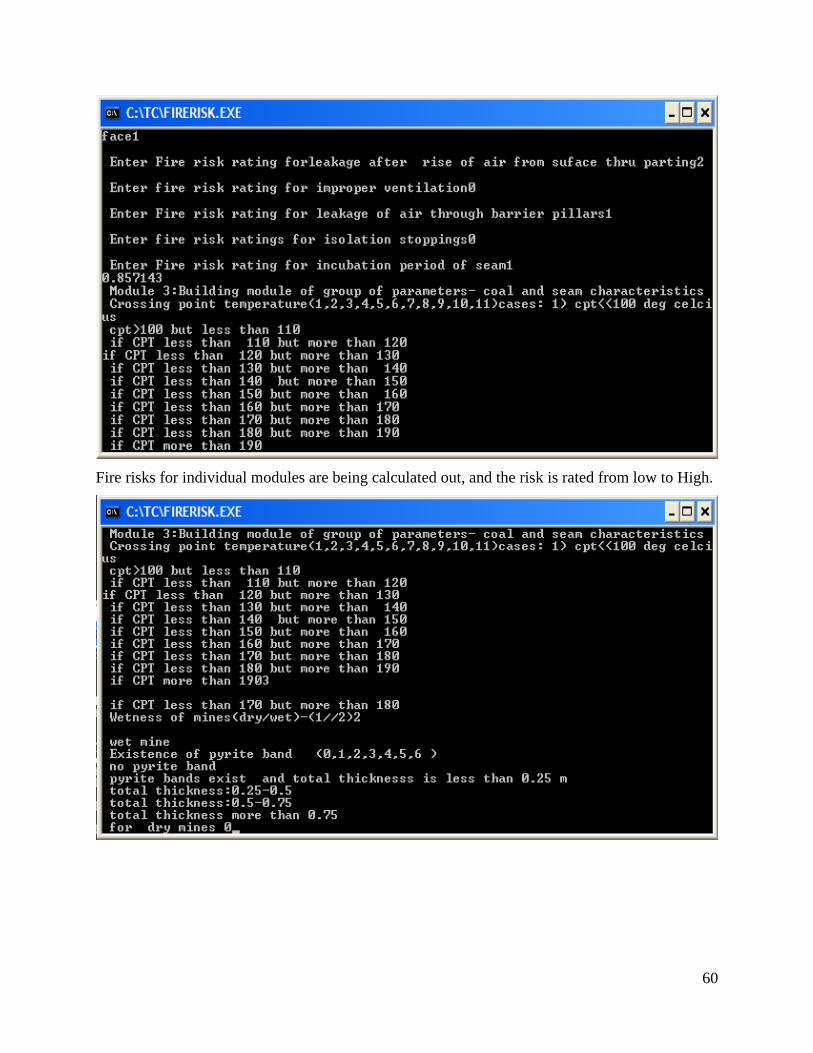
60
Fire risks for individual modules are being calculated out, and the risk is rated from low to High.
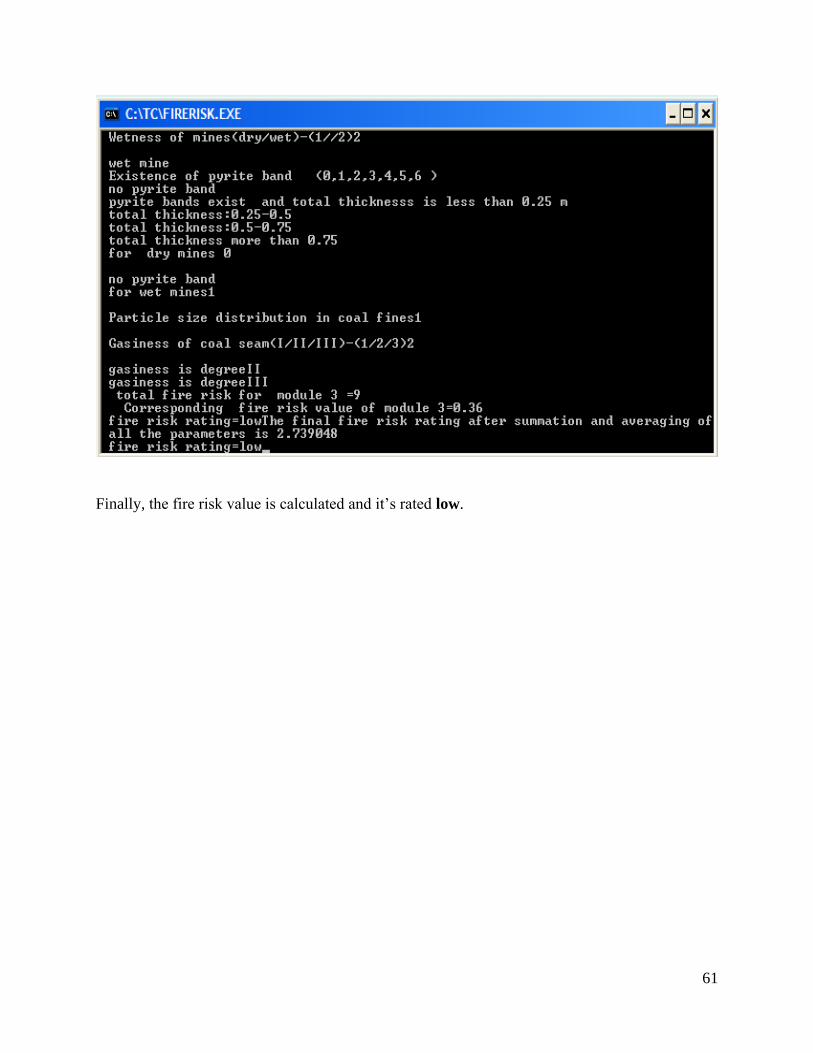
61
Finally, the fire risk value is calculated and it‘s rated low.
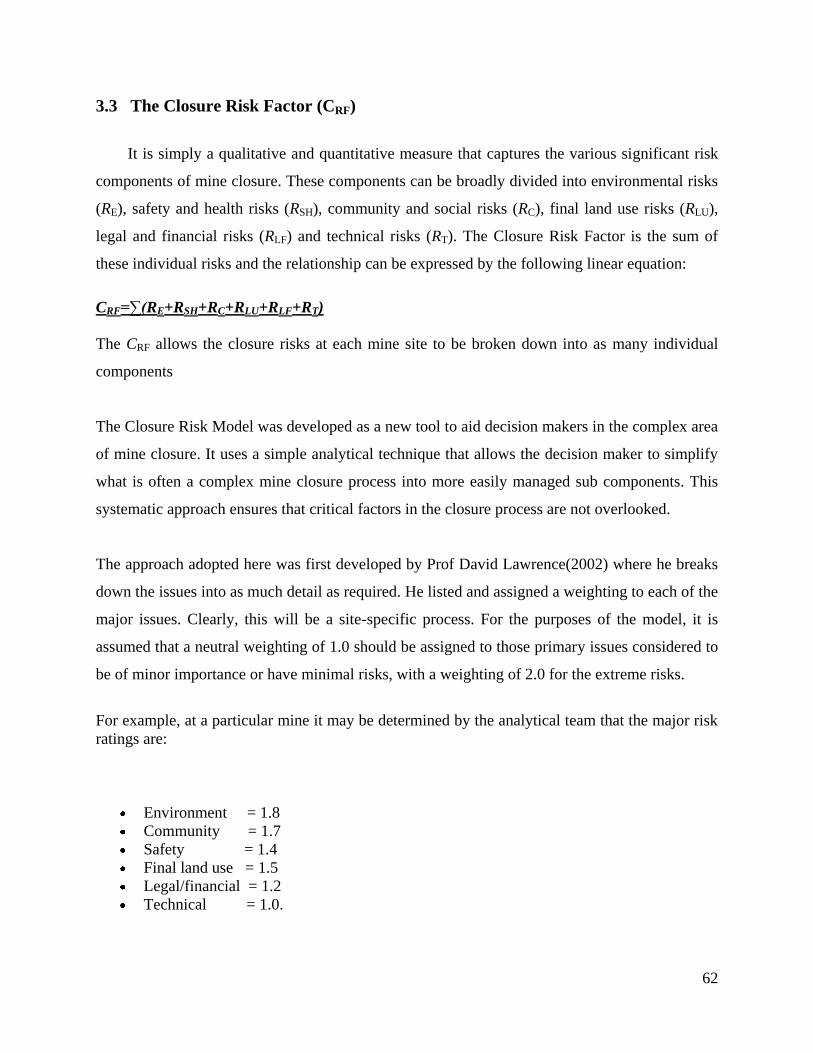
62
3.3 The Closure Risk Factor (CRF)
It is simply a qualitative and quantitative measure that captures the various significant risk
components of mine closure. These components can be broadly divided into environmental risks
(RE), safety and health risks (RSH), community and social risks (RC), final land use risks (RLU),
legal and financial risks (RLF) and technical risks (RT). The Closure Risk Factor is the sum of
these individual risks and the relationship can be expressed by the following linear equation:
CRF=∑(RE+RSH+RC+RLU+RLF+RT)
The CRF allows the closure risks at each mine site to be broken down into as many individual
components
The Closure Risk Model was developed as a new tool to aid decision makers in the complex area
of mine closure. It uses a simple analytical technique that allows the decision maker to simplify
what is often a complex mine closure process into more easily managed sub components. This
systematic approach ensures that critical factors in the closure process are not overlooked.
The approach adopted here was first developed by Prof David Lawrence(2002) where he breaks
down the issues into as much detail as required. He listed and assigned a weighting to each of the
major issues. Clearly, this will be a site-specific process. For the purposes of the model, it is
assumed that a neutral weighting of 1.0 should be assigned to those primary issues considered to
be of minor importance or have minimal risks, with a weighting of 2.0 for the extreme risks.
For example, at a particular mine it may be determined by the analytical team that the major risk
ratings are:
Environment = 1.8
Community = 1.7
Safety = 1.4
Final land use = 1.5
Legal/financial = 1.2
Technical = 1.0.
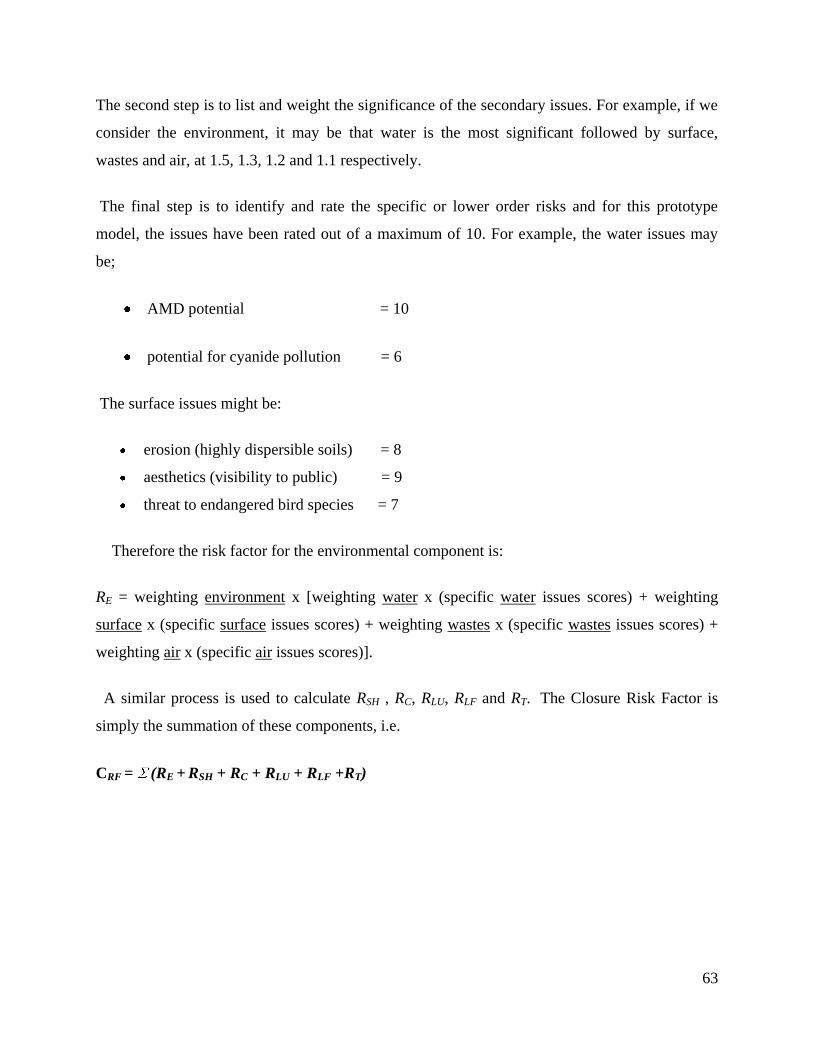
63
The second step is to list and weight the significance of the secondary issues. For example, if we
consider the environment, it may be that water is the most significant followed by surface,
wastes and air, at 1.5, 1.3, 1.2 and 1.1 respectively.
The final step is to identify and rate the specific or lower order risks and for this prototype
model, the issues have been rated out of a maximum of 10. For example, the water issues may
be;
AMD potential = 10
potential for cyanide pollution = 6
The surface issues might be:
erosion (highly dispersible soils) = 8
aesthetics (visibility to public) = 9
threat to endangered bird species = 7
Therefore the risk factor for the environmental component is:
RE = weighting environment x [weighting water x (specific water issues scores) + weighting
surface x (specific surface issues scores) + weighting wastes x (specific wastes issues scores) +
weighting air x (specific air issues scores)].
A similar process is used to calculate RSH , RC, RLU, RLF and RT. The Closure Risk Factor is
simply the summation of these components, i.e.
CRF = (RE + RSH + RC + RLU + RLF +RT)
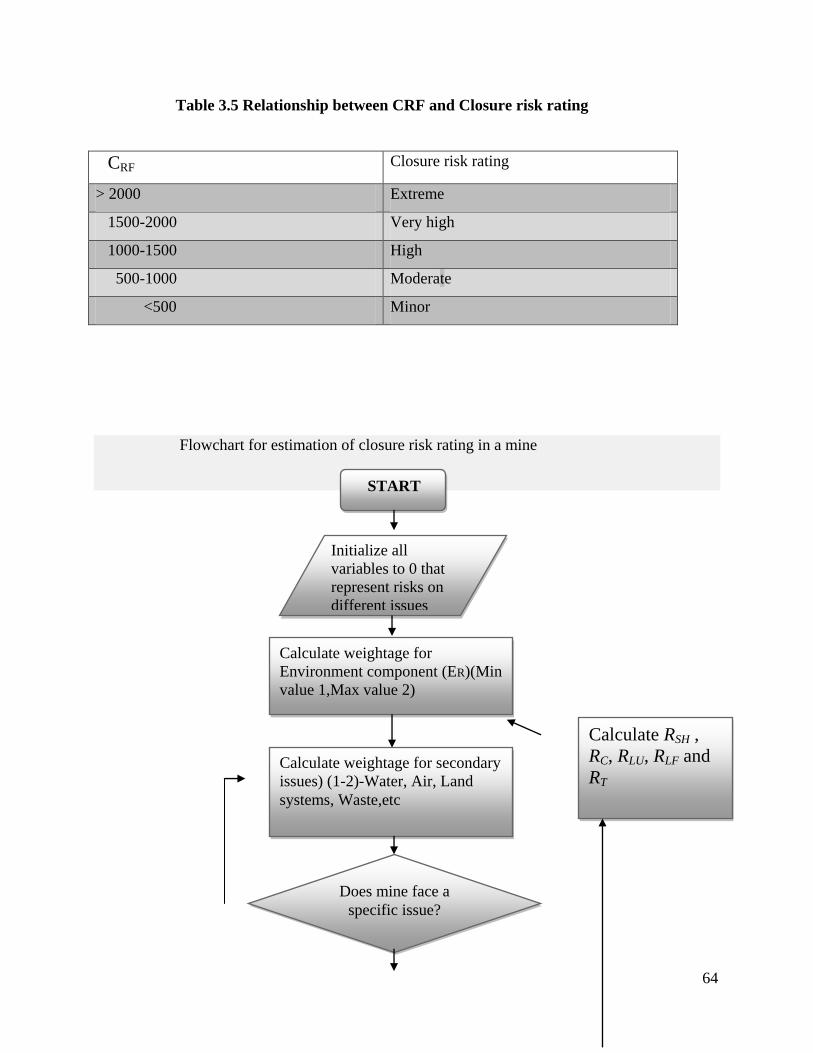
64
Table 3.5 Relationship between CRF and Closure risk rating
CRF Closure risk rating
> 2000 Extreme
1500-2000 Very high
1000-1500 High
500-1000 Moderate
<500 Minor
Flowchart for estimation of closure risk rating in a mine
START
Calculate weightage for secondary
issues) (1-2)-Water, Air, Land
systems, Waste,etc
Calculate weightage for
Environment component (ER)(Min
value 1,Max value 2)
Initialize all
variables to 0 that
represent risks on
different issues
Does mine face a
specific issue?
Calculate RSH ,
RC, RLU, RLF and
RT
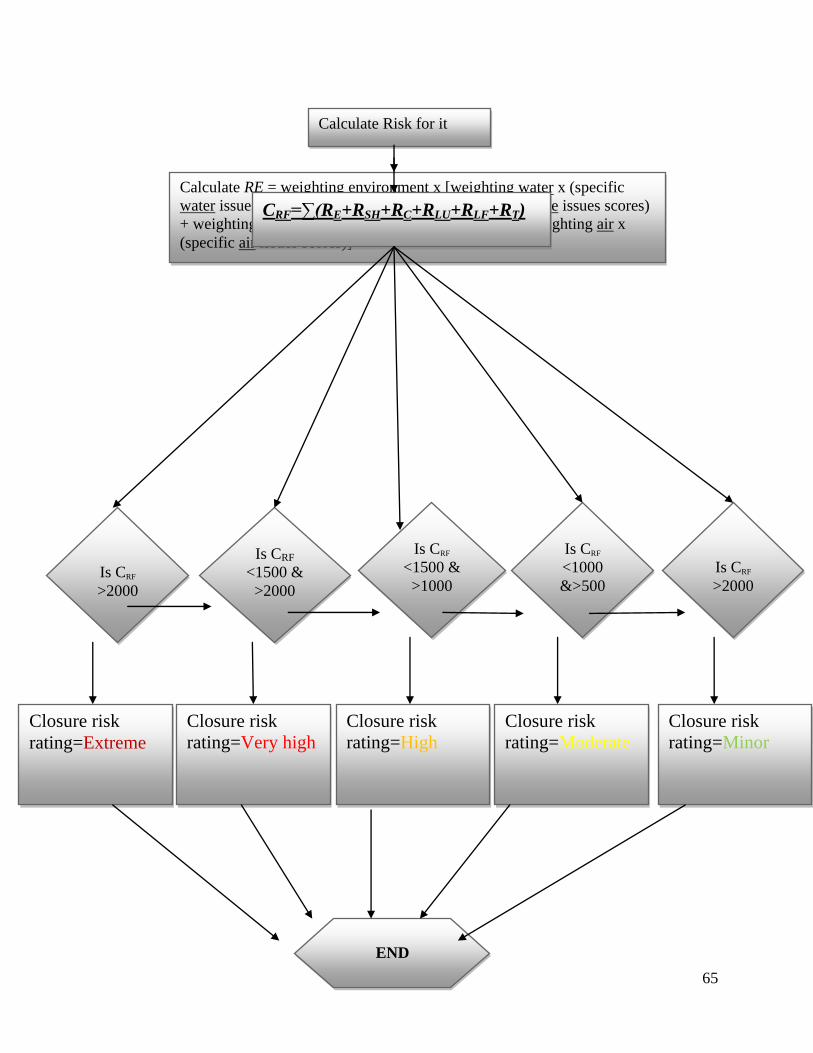
65
Calculate Risk for it
Calculate RE = weighting environment x [weighting water x (specific
water issues scores) + weighting surface x (specific surface issues scores)
+ weighting wastes x (specific wastes issues scores) + weighting air x
(specific air issues scores)]
CRF=∑(RE+RSH+RC+RLU+RLF+RT)
vcxvxcvcxvcvcvxcv==++++++RT)
END
Is CRF
>2000
Is CRF
<1500 &
>2000
Is CRF
<1500 &
>1000
Is CRF
<1000
&>500
Is CRF
>2000
Closure risk
rating=Minor
Closure risk
rating=Moderate
Closure risk
rating=High
Closure risk
rating=Very high
Closure risk
rating=Extreme

66
Figure 3.4 Flowchart for computing Closure risk factor
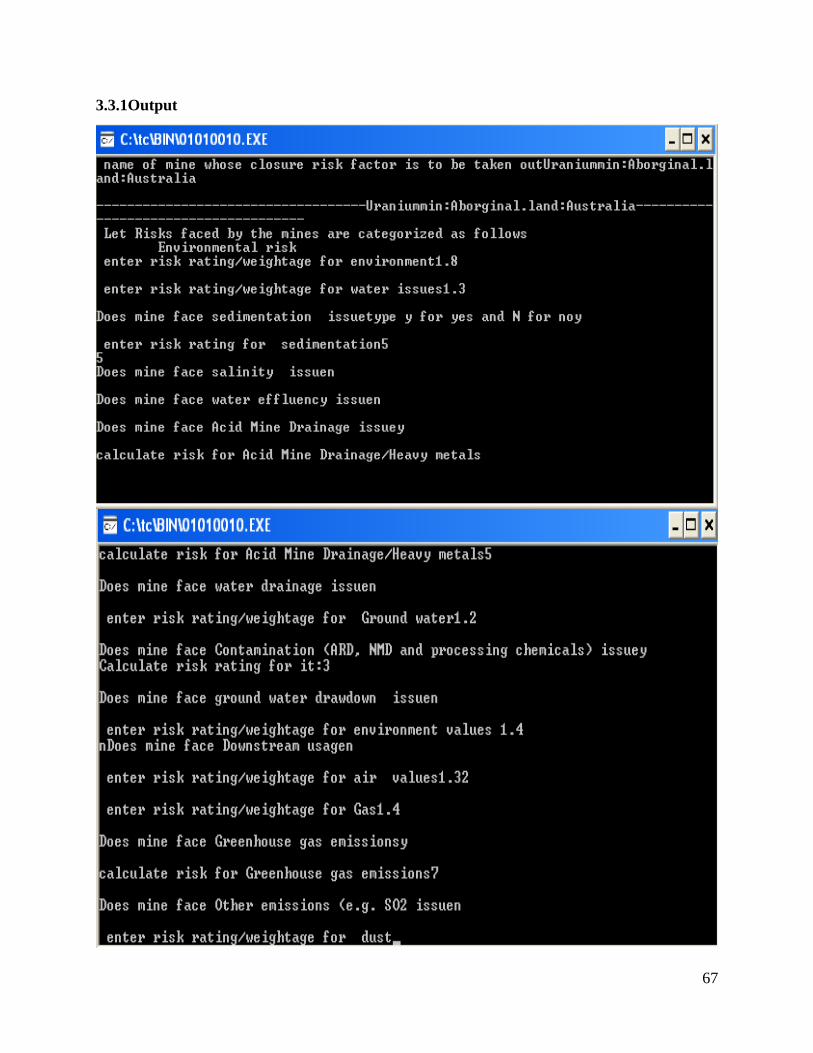
67
3.3.1Output
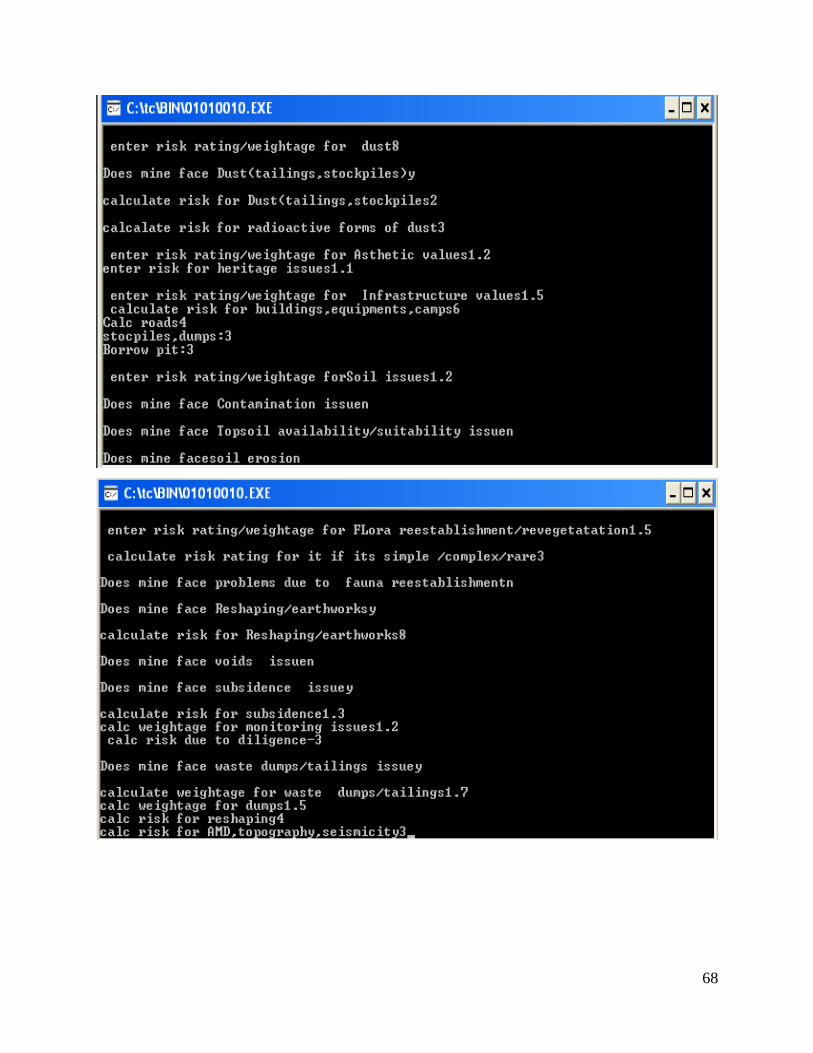
68
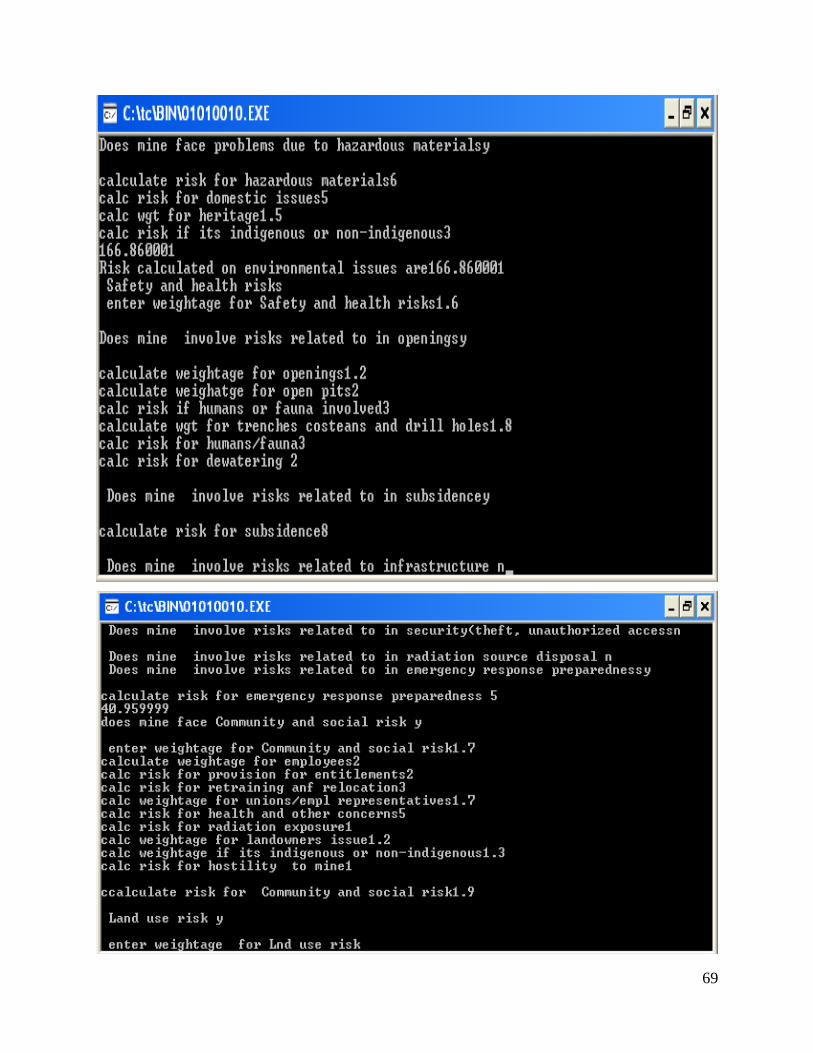
69
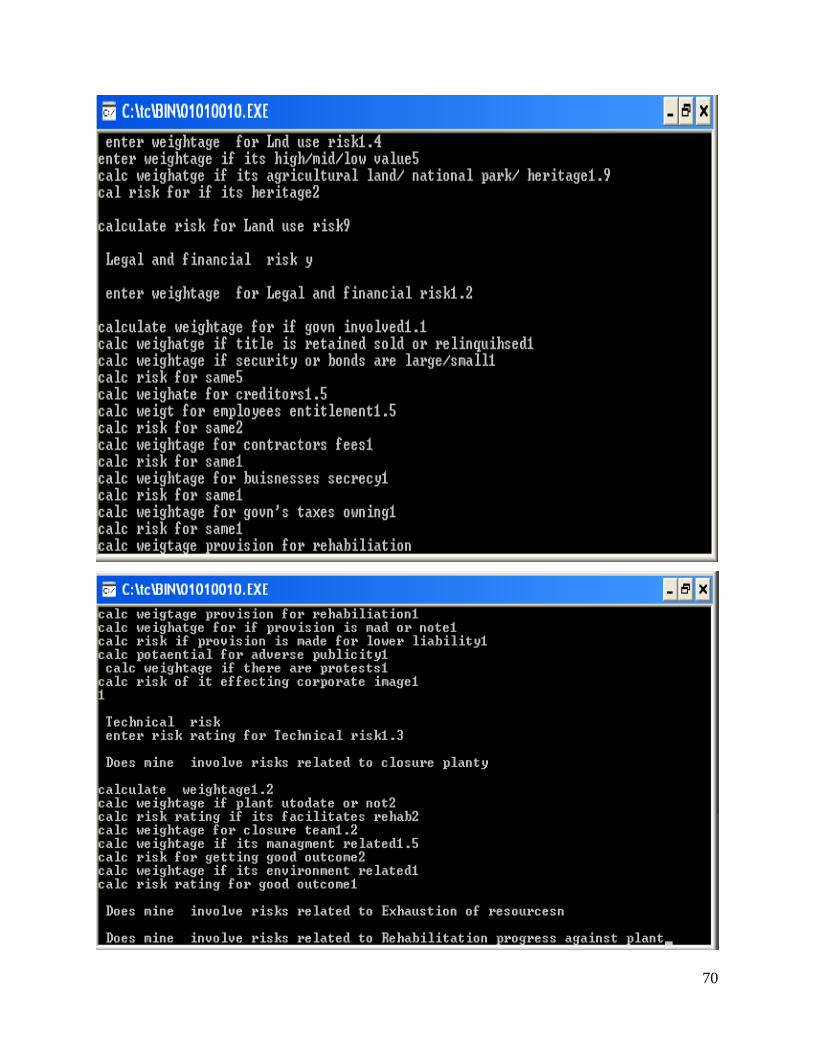
70
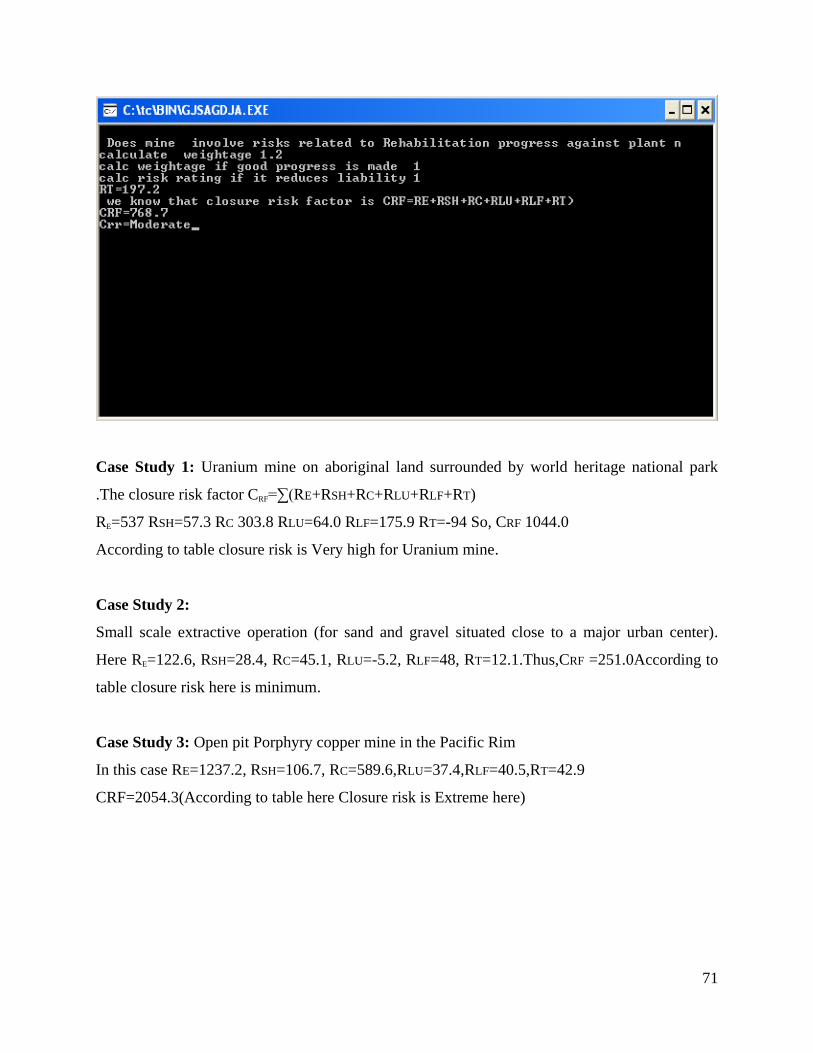
71
Case Study 1: Uranium mine on aboriginal land surrounded by world heritage national park
.The closure risk factor CRF=∑(RE+RSH+RC+RLU+RLF+RT)
RE=537 RSH=57.3 RC 303.8 RLU=64.0 RLF=175.9 RT=-94 So, CRF 1044.0
According to table closure risk is Very high for Uranium mine.
Case Study 2:
Small scale extractive operation (for sand and gravel situated close to a major urban center).
Here RE=122.6, RSH=28.4, RC=45.1, RLU=-5.2, RLF=48, RT=12.1.Thus,CRF =251.0According to
table closure risk here is minimum.
Case Study 3: Open pit Porphyry copper mine in the Pacific Rim
In this case RE=1237.2, RSH=106.7, RC=589.6,RLU=37.4,RLF=40.5,RT=42.9
CRF=2054.3(According to table here Closure risk is Extreme here)
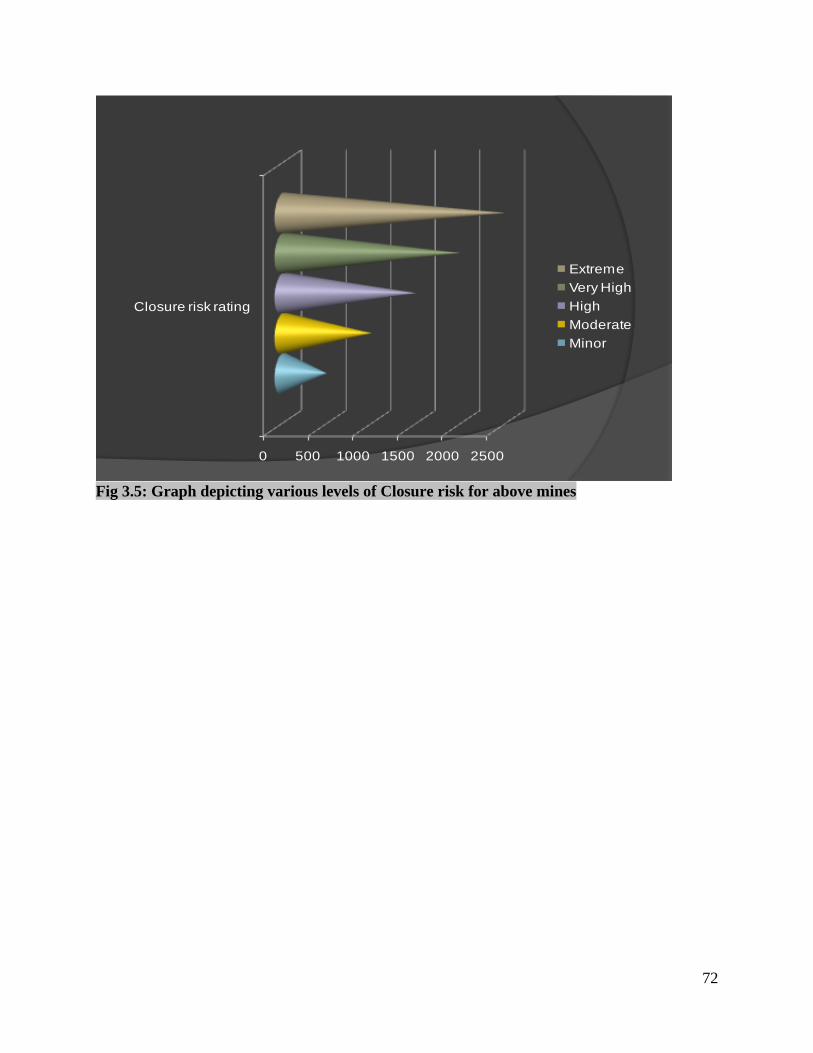
72
0 500 1000 1500 2000 2500
Closure risk rating
Extreme
Very High
High
Moderate
Minor
Fig 3.5: Graph depicting various levels of Closure risk for above mines
73
3.4 A CASE STUDY OF RISK ASSESSMENT AND RISK MANAGEMENT AT
TALCHER COLLIERY, MCL
The steps we would be following for for risk assessment and risk management in Talcher
Colliery are as follows:-
Hazards identification
Ranking of hazards as per their probability, consequence and exposure
Management of hazards as per their ranking
The risk assessment and risk management of Talcher Colliery is as below:-
3.4.1 Hazards identifications
Fire/spontaneous heating
Inundation
Explosion
Roof/Side fall
Haulage/Locomotive
Conveyor systems
Electrical
Heat and Humidity
Effectiveness of evacuation of work person through upcast shaft.
Shaft Drainage
Emergency Exit through coal winder/skip
Travelling through loco roadways
Inspection route of Isolation stopping
Explosives and Blasting
Underground gas cutting operations
3.4.2 Calculation of risk for the hazards that were identified
1) Risk Assessment
1) Fire/Spontaneous heating
a) Consequence - Catastrophe – 100
b) Exposure - Once in 10 years - 0.5
c) Probabability - Unusual but possible – 3 Risk Assessment Points 100 x 0.5 x 3 = 150

74
2) Inundation
a) Consequence - Catastrophe - 100
b) Exposure - Occasional - 2
c) Probability - Practically Impossible - 0.5 Risk Assessment Points 100 x 2 x 0.5 = 100
3) Explosion
a) Consequence - Catastrophe - 100
b) Exposure - Once in 100 years - 0.02
c) Probability-Practically impossible-0.50 Risk Assessment Points 100 x 0.02 x 0.05 =0.1
4) Roof//Side fall
a) Consequence - Disaster - 40
b) Exposure - Daily - 05
c) Probability - Between remotely possible and Conceivable but unlikely - 01.5
Risk Assessment Points 40 x 5 x 1.5 = 300
5) Haulage/Locomotive
a) Consequence - Very serious - 15
b) Exposure - Daily - 05
c) Probability - Remotely Possible - 02
Risk Assessment Points 15 x 5 x 1 = 150
6) Conveyer systems
a) Consequence - Serious - 05
b) Exposure - Daily - 05
c) Probability - Conceivable but unlikely – 01 Risk Assessment Points 5 x 5 x 1 = 25
7) Electricals
a) Consequence - Serious - 05
b) Exposure - Daily - 05
c) Probability - Conceivable but unlikely – 01 Risk Assessment Points 5 x 5 x 1 = 25
8) Heat and Humidity
a) Consequence - Minor - 2
b) Exposure - Unusual (Monthly) - 2.5
c) Probability - Conceivable but unlikely– 01 Risk Assessment Points 2 x 2.5 x 1 = 5
9) Effectiveness of Evacuation of work persons through upcast Shaft
a) Consequence - Catastrophe - 100
b) Exposure - Occasional - 2
c) Probability - Practically impossible - 0.5 Risk Assessment Points 100 x 2 x 0.5 = 100
10) Shaft Drainage
a) Consequence - Catastrophe - 100.0
b) Exposure - Once in 10 years - 0.5
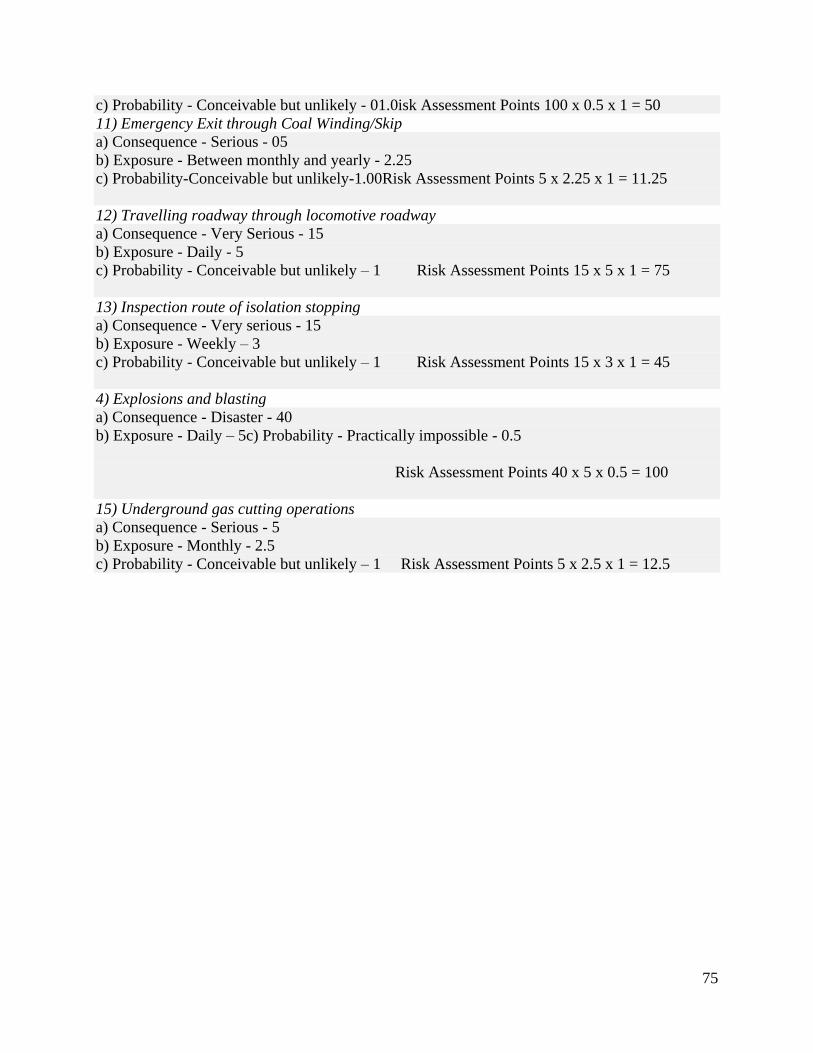
75
c) Probability - Conceivable but unlikely - 01.0isk Assessment Points 100 x 0.5 x 1 = 50
11) Emergency Exit through Coal Winding/Skip
a) Consequence - Serious - 05
b) Exposure - Between monthly and yearly - 2.25
c) Probability-Conceivable but unlikely-1.00Risk Assessment Points 5 x 2.25 x 1 = 11.25
12) Travelling roadway through locomotive roadway
a) Consequence - Very Serious - 15
b) Exposure - Daily - 5
c) Probability - Conceivable but unlikely – 1 Risk Assessment Points 15 x 5 x 1 = 75
13) Inspection route of isolation stopping
a) Consequence - Very serious - 15
b) Exposure - Weekly – 3
c) Probability - Conceivable but unlikely – 1 Risk Assessment Points 15 x 3 x 1 = 45
4) Explosions and blasting
a) Consequence - Disaster - 40
b) Exposure - Daily – 5c) Probability - Practically impossible - 0.5
Risk Assessment Points 40 x 5 x 0.5 = 100
15) Underground gas cutting operations
a) Consequence - Serious - 5
b) Exposure - Monthly - 2.5
c) Probability - Conceivable but unlikely – 1 Risk Assessment Points 5 x 2.5 x 1 = 12.5
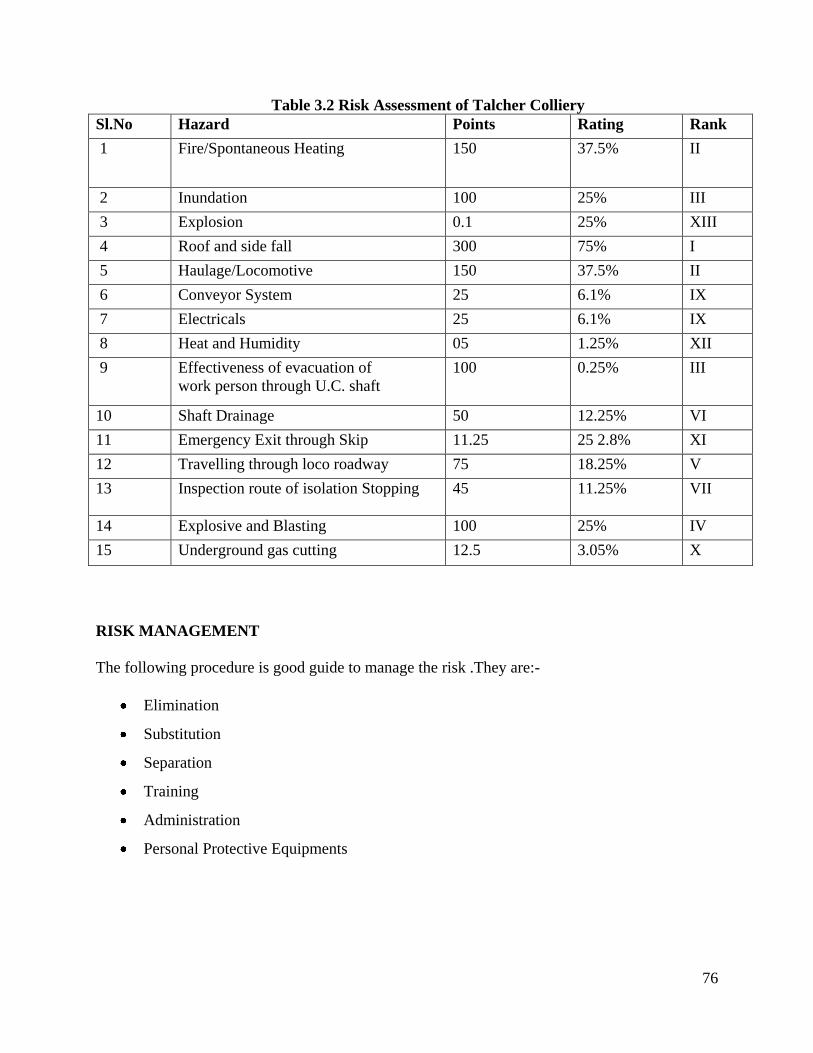
76
Table 3.2 Risk Assessment of Talcher Colliery
Sl.No Hazard Points Rating Rank
1 Fire/Spontaneous Heating 150 37.5% II
2 Inundation 100 25% III
3 Explosion 0.1 25% XIII
4 Roof and side fall 300 75% I
5 Haulage/Locomotive 150 37.5% II
6 Conveyor System 25 6.1% IX
7 Electricals 25 6.1% IX
8 Heat and Humidity 05 1.25% XII
9 Effectiveness of evacuation of
work person through U.C. shaft
100 0.25% III
10 Shaft Drainage 50 12.25% VI
11 Emergency Exit through Skip 11.25 25 2.8% XI
12 Travelling through loco roadway 75 18.25% V
13 Inspection route of isolation Stopping 45 11.25% VII
14 Explosive and Blasting 100 25% IV
15 Underground gas cutting 12.5 3.05% X
RISK MANAGEMENT
The following procedure is good guide to manage the risk .They are:-
Elimination
Substitution
Separation
Training
Administration
Personal Protective Equipments
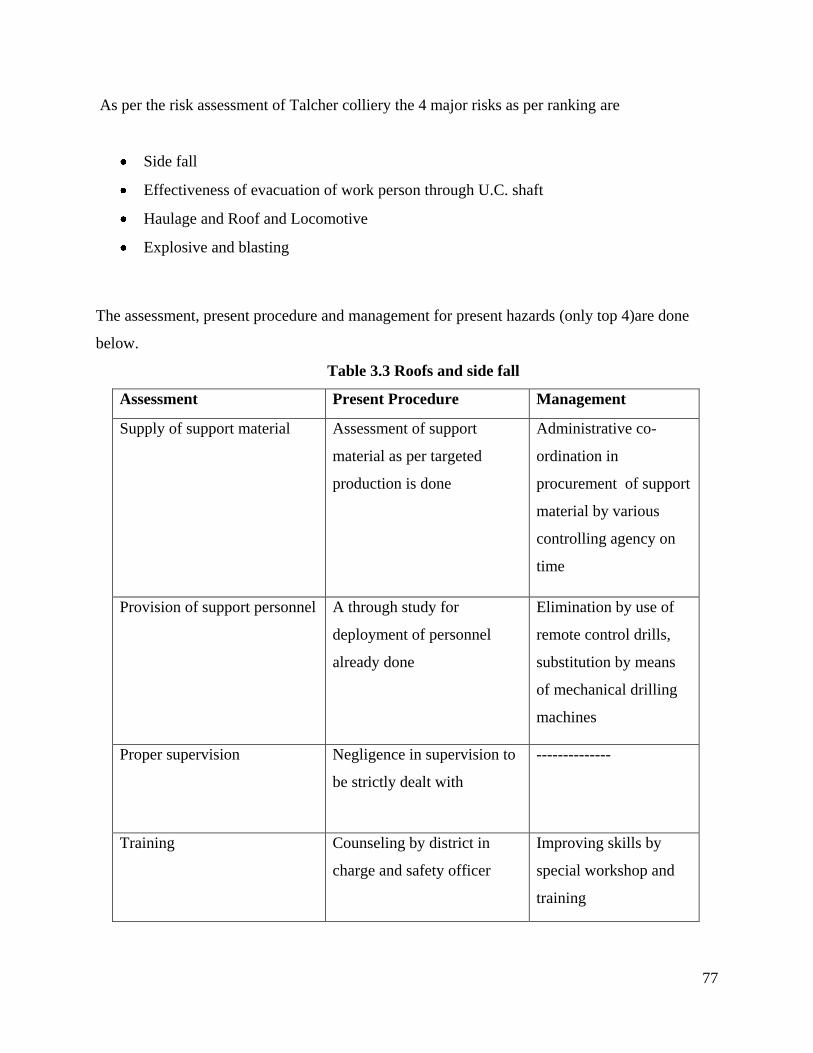
77
As per the risk assessment of Talcher colliery the 4 major risks as per ranking are
Side fall
Effectiveness of evacuation of work person through U.C. shaft
Haulage and Roof and Locomotive
Explosive and blasting
The assessment, present procedure and management for present hazards (only top 4)are done
below.
Table 3.3 Roofs and side fall
Assessment Present Procedure Management
Supply of support material Assessment of support
material as per targeted
production is done
Administrative co-
ordination in
procurement of support
material by various
controlling agency on
time
Provision of support personnel A through study for
deployment of personnel
already done
Elimination by use of
remote control drills,
substitution by means
of mechanical drilling
machines
Proper supervision Negligence in supervision to
be strictly dealt with
--------------
Training Counseling by district in
charge and safety officer
Improving skills by
special workshop and
training

78
Support designing Design of support system for
each panel done as RMR
and duly approved by DGMS
Design substitution for
change of RMR to be
studied for various in-
situ geological
phenomena
Quality control Quality of supports
monitored
To be checked by
anchorage testing at
various stages
Table 3.4 Fires and spontaneous heating
Assessment Present procedure Management
Conditions favorable for fire
and spontaneous heating
Weekly monitoring and
proper ventilation
Elimination by cleaning of
coal in 27th
area and 5nw
Personal protective
equipment
Self rescuer provided Self contained rescuer to be
provided
Supervision by competent
person
Done once in a week and
record maintained
Continous site monitoring to
be done by modern methods
Organisation to deal with fire Proper procedure for dealing
with fire/safe withdrawal of
persons have been framed
Training and mock rehearsal
ofpersons to keep th eperson
informed about the procedure
Communication Simex provided but nit
effective during power
failure
A more reliable and DMGS
approved type of
communication system to be
provided
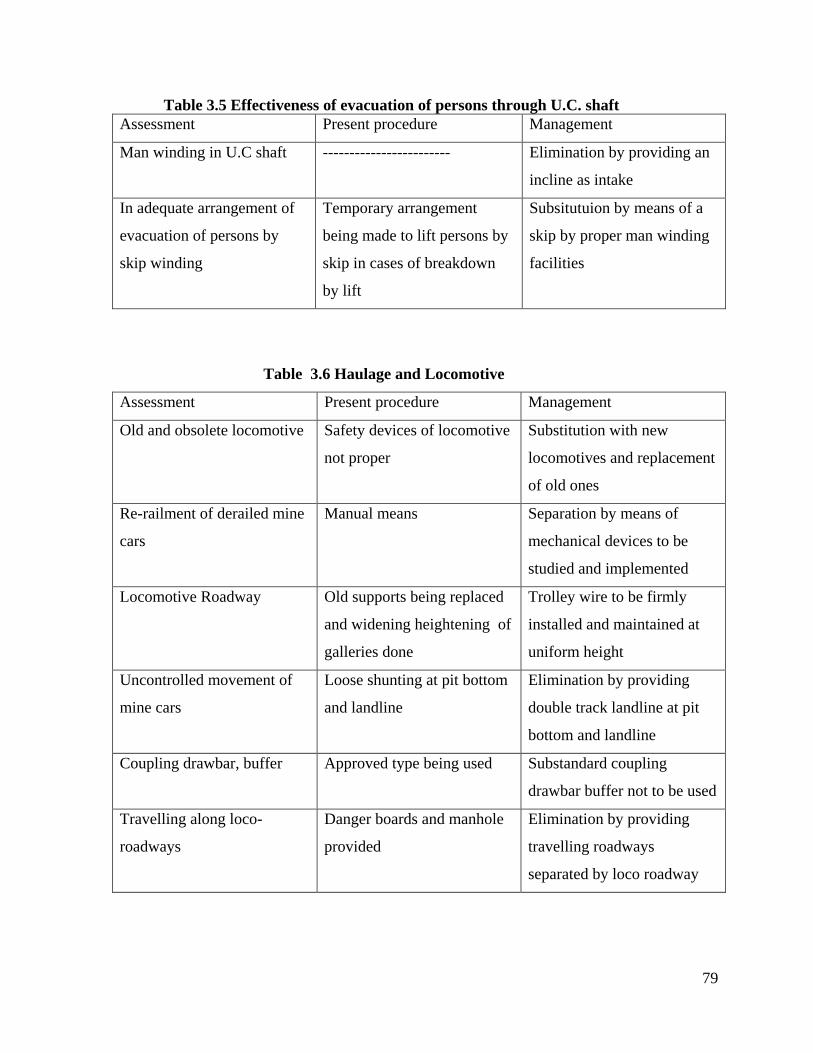
79
Table 3.5 Effectiveness of evacuation of persons through U.C. shaft
Assessment Present procedure Management
Man winding in U.C shaft ------------------------ Elimination by providing an
incline as intake
In adequate arrangement of
evacuation of persons by
skip winding
Temporary arrangement
being made to lift persons by
skip in cases of breakdown
by lift
Subsitutuion by means of a
skip by proper man winding
facilities
Table 3.6 Haulage and Locomotive
Assessment Present procedure Management
Old and obsolete locomotive Safety devices of locomotive
not proper
Substitution with new
locomotives and replacement
of old ones
Re-railment of derailed mine
cars
Manual means Separation by means of
mechanical devices to be
studied and implemented
Locomotive Roadway Old supports being replaced
and widening heightening of
galleries done
Trolley wire to be firmly
installed and maintained at
uniform height
Uncontrolled movement of
mine cars
Loose shunting at pit bottom
and landline
Elimination by providing
double track landline at pit
bottom and landline
Coupling drawbar, buffer Approved type being used Substandard coupling
drawbar buffer not to be used
Travelling along loco-
roadways
Danger boards and manhole
provided
Elimination by providing
travelling roadways
separated by loco roadway
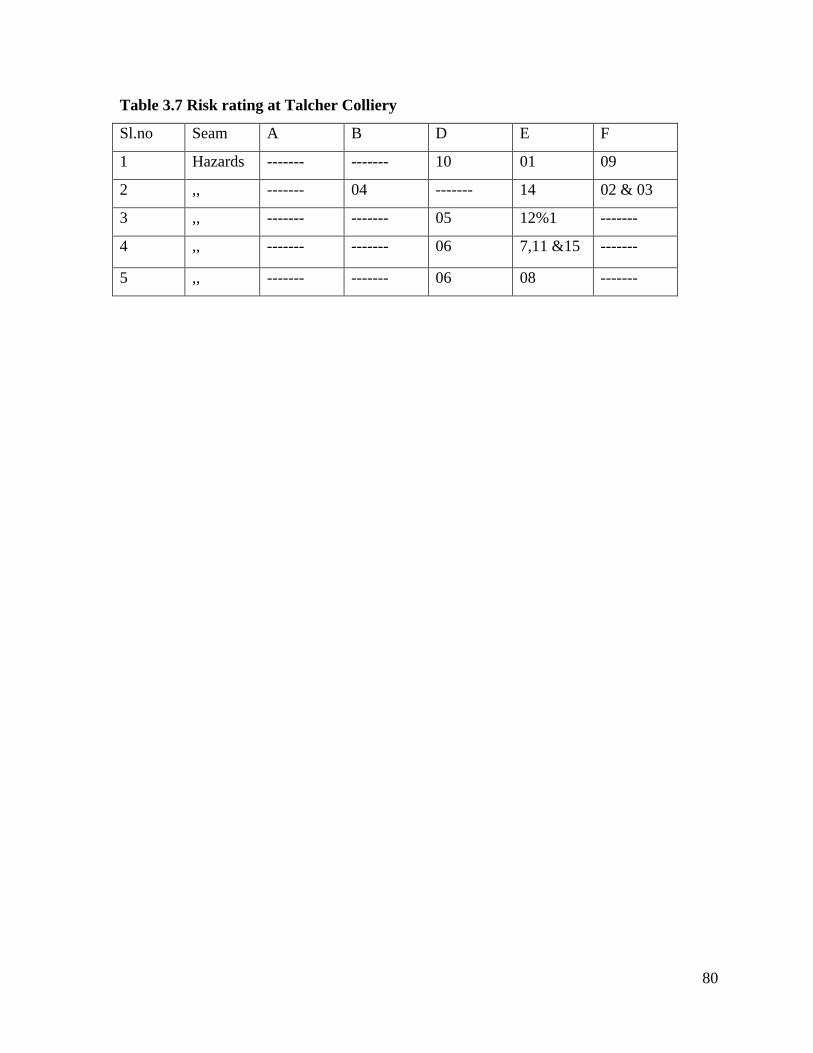
80
Table 3.7 Risk rating at Talcher Colliery
Sl.no Seam A B D E F
1 Hazards ------- ------- 10 01 09
2 ,, ------- 04 ------- 14 02 & 03
3 ,, ------- ------- 05 12%1 -------
4 ,, ------- ------- 06 7,11 &15 -------
5 ,, ------- ------- 06 08 -------
81
CHAPTER 4
4. CONCLUSION
Safety and environmental risk assessment is sine quo non for ensuring mine and miners safe .It is
necessary to assess the risk from different mining operations and take cost effective suitable
measures to prevent, eliminate and minimize risk. Both qualitative and quantitative risk
approaches can is followed to assess the risk level. Risk analysis techniques like FTA, ETA and
HAZOP etc can be used as tools as study and understanding the risk levels more effectively and
can aid in risk prevention and control.
It was perceived during the study of the project that the present condition of mine environment
and safety risk‘ is at a low. It was found that mine risk assessment techniques and
implementations are more popular in the developed nations like Australia, USA, Canada,
European countries etc. and are yet to gain a definite and precise foothold in the Indian mining
scenario. Some Indian mines are employing risk assessment techniques although much work has
to be done in terms of successful application and identifiable results. It the 9th
and 10th
Safety
Conferences held in New Delhi as well draft Coal Mines Regulations, 2006, emphasis is being
laid to conduct safety risk assessment and management in mines. Thus, it is statutorily
mandatory to conduct safety risk assessment using suitable risk assessment methodology.
Further, as per ISO-14010, mining companies have to conduct environment audit for
environmental compliance. It is thus pertinent to carry out both safety and environmental risk
assessment with due diligence to minimize risk to miners and make mine environmentally
sustainable and friendly.
Fault Tree+11 analysis programs for Microsoft Windows enables us to analyze the availability
and reliability of both complex and simple systems and is easy and intuitive to use. Fault Tree+
11 provides an integrated environment for performing fault tree analysis, event tree analysis and
Markov analysis. In this case mine fire is modeled using fault tree. A program for estimation of
spontaneous fire risk potential in underground mines is carried out using TURBO C++ using
82
Linux as the platform. The program is user friendly and can help in classifying Bord and Pillar
workings into low/high/very high category. Another program was developed in TURBO C++ to
compute closure risk factor for mines and to evaluate risk category based on the concept
proposed by Laurence (2002). Data was also collected from MCL mines to assess and quantify
safety risk and suggest appropriate risk management. Risk assessment and management for
ensuring better safety at work place and eliminating health hazards in the mining industry is an
important tool for assessment, prioritize and control hazards. Conduct of environmental and
safety risk assessment in Indian mines is new and lacks expertise; hence effort is made by
different mining companies and statutory agencies to train man power in this field to make risk
assessment scientific, prudent and realistic and a fruitful exercise so that suitable corrective
actions can be taken in a timely manner to minimize the hazards.
83
REFERENCES
Maiti, J. (2005), The Basics of Risk Assessment, Conference on Technological Advancements and
Environmental challenges in Mining and Allied Industries in the 21st Century, NIT, Rourkela, pp. 295-
300 .
Tripathy,D.P. (2008), Analysis and Assessment of Safety Risk in Mines, The Indian Mining and
Engineering Journal,NIT,Rourkela,pp.21-30.
Paliwal, Rakesh (2006), Assessment and Management of Trucking Risk – A Case Study, ENTMS, The
Indian Mineral Industry Journal, Bhubaneswar, pp. 64-67.
Tripathy, D.P. (2001). Qualitative and Quantitative Approaches to Risk Assessment, Mining Engineers
Journal, Hyderabad.
Raman, Raghu (2003), Underground Mine Safety- Are We Doing Enough?, Kellogg Brown & Root Pty
Ltd, Sydney, pp.12-16 .
U.S. EPA Region 5 (1991), Environmental Risk: Your Guide to Analyzing and Reducing Risk,
Publication Number 905/9-91/017, pp. 1-5. www.epa.gov/region5/publications/risk.pdf
Sammarco, John J., (2005), Programmable Electronic Mining Systems: Best Practice Recommendations,
Information Circular 9480, Department of Health and Human Services, Pittsburgh, pp. 22-28
World Health Organization, (2004), IPCS Harmonization projects: IPCS Risk Assessment Terminology,
ISBN 92 4 1562676, Geneva, pp. 3-6.
Environmental Risk Assessment, Five Winds International
www.fivewinds.com/uploadedfiles_shared/EnvironmentalRiskAssessment040127.pdf
Rashe Tilman,(2001),Risk Assessment Methods-A Brief Review, MISHC,pp. 4-15.
Laurence, D.C. (2002) ―Optimizing Mine Closure Outcomes for the Community – Lessons Learnt‖,
Minerals and Energy, Raw Materials Group, Vol. 17 No.1, pp. 27-34.
Laurence, D.C. (2003) ―Reducing the Risk of Mine Closure – A Team Based Approach‖, Proc. Mining
Risk Management, AusIMM, Sydney.
Roy, T.R. (2006) ―A Handy Objective Model for Estimation of Spontaneous Fire Risk Potential of
Underground Panels in Bord and Pillar Method of Mining‖, Journal of Mines, Metals and Fuels, pp. 491-
499.

84