Embed Size (px)
Citation preview
UNIVERSITY OF NAIROBI
Department of Civil Engineering
bullKSSSuLregiampasgjjASSESSMENT OF SA WDUST POTENTIAL IN THE REMOVAL
OF DYE COLOUR FROM TEXTILE WASTEWATER
University ol NAIRO BI Library
0369800 8
WAIRURI JK
RegNo F56817199
Supervisor Professor BNK Njoroge
ASSESSMENT OF SA WDUST POTENTIAL IN THE REMOVAL
OF DYE COLOUR FROM TEXTILE WASTEWATER
Candidate WAIRURI JK
RegNoF56817199
Supervisor Professor BNK Njoroge
A thesis submitted in partial fulfillment for the award of Master of
Science in Civil Engineering
II
Declaration
This Thesis is my original work and has not been submitted for a degree in
any other University
JK Wairuri
Candidate
Date
This thesis has been submitted for examination with my approval as
University supervisor
ProfessorB o il l i l t
TABLE OF CONTENTS
Declaration
ACRONYMS
III
VI
DEDICATION vrdquoAcknowledgementvuiL ist of Figures xL ist of appendices_XlA bstract X11
CHAPTER 1 INTRODUCTION bull bull bull bull bull bull bull bull bull bull a I
10 Backgroundl l Problems associated with Dyes and Textile Industry
12 Research objectives313 Research Justification 4
CHAPTER 2
LITERATURE REVIEW 620 PROPERTIES OF DYES621 Introduction 622 Absorption Spectra of Dyes 10
221 Why are dyes ColouredI I23 Classification of Dyes 1124 Solubility of dyes 13
241 The Congo red dye 1425 Measurement of dye concentration in a dye bath1526 Nature of Colour in aquatic and Marine Environment 1827 Effects of Colour in Aquatic and Marine Environment18281 Forces and Mechanisms of adsorption25282 T hermodynamics of adsorption Equilibra29283 PROPERTIES OF WOOD AS AN ADSORBENT30284 Desorption process 3329 Characteristics of Wood34
291 Hardwoods 34292 Soft woods34
CHAPTER 3 EXPERIMENTAL SETUP 36
MATERIALS AND METHODS 36
31 Introduction3632 Materials3633 Methods36
331 Introduction 36332 Sample Preparation37333 Experimental Procedure37
CHAPTER 4 43
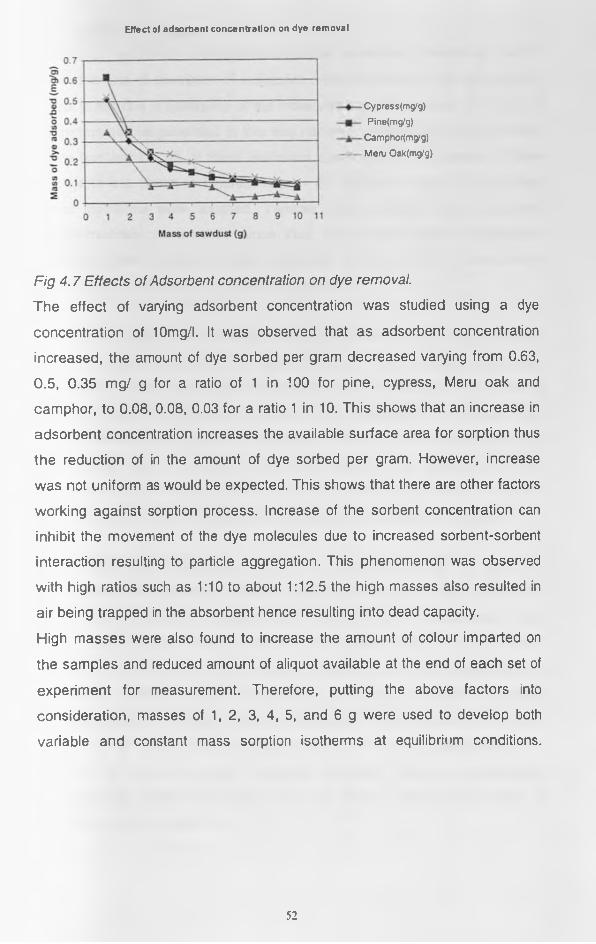
40 RESULTS AND DISCUSSION 43
4 l Ph ysical and Chemical properties of Sawdust4342 v ariation of Absorbance with Dye Concentration 4443 Variation of Absorbance w it h Wavelengt h4644 Effect of shaking on Dye removal 4845 Variation of Dye removal W ith T ime (Equilibrium time) 4846 Effect of Particle size on dye removal 5047 Effect of adsorbent concentration on removal 5148 Equilibrium Studies5349 Relationship between sawdust properties and Sorption data 64
IV
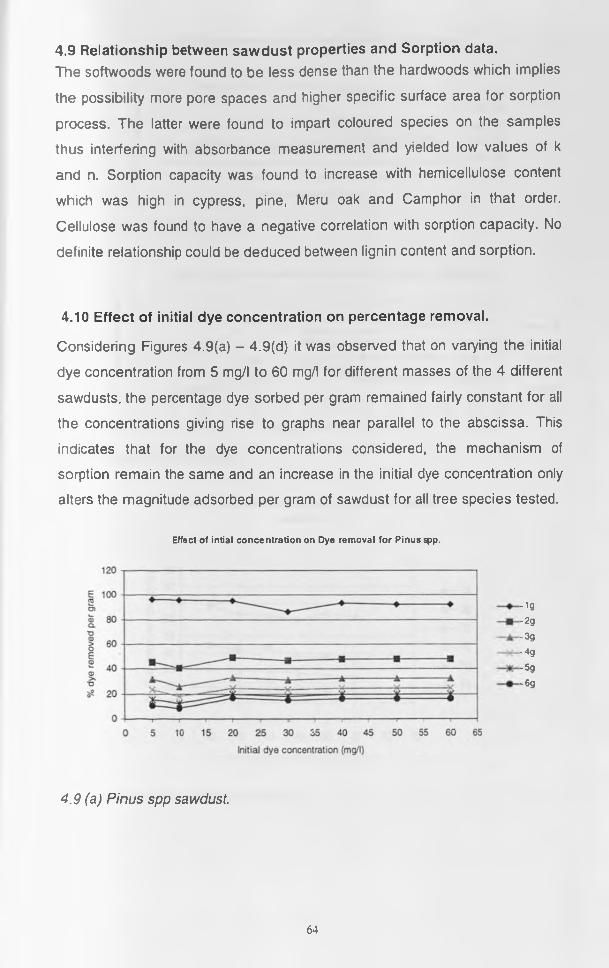
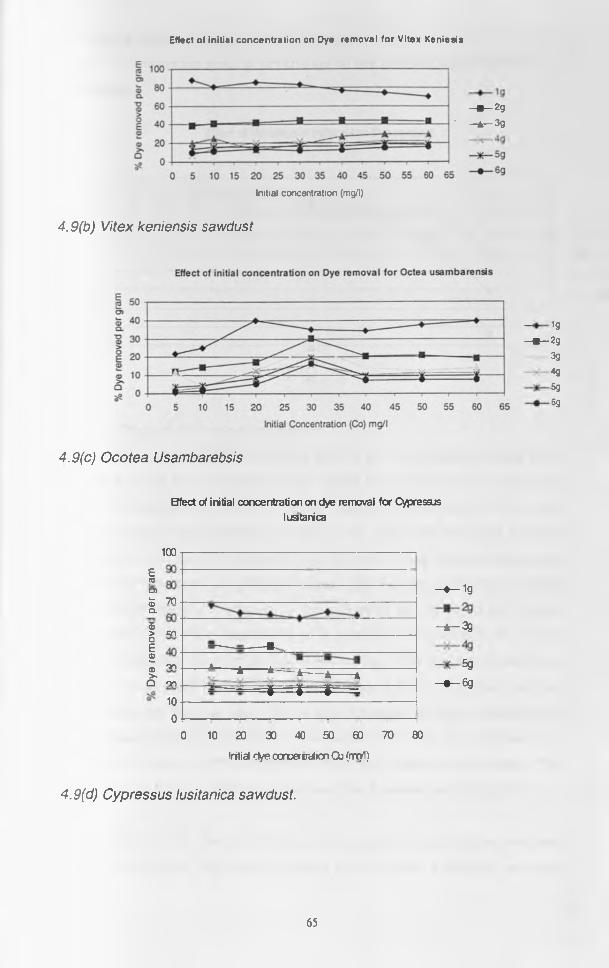
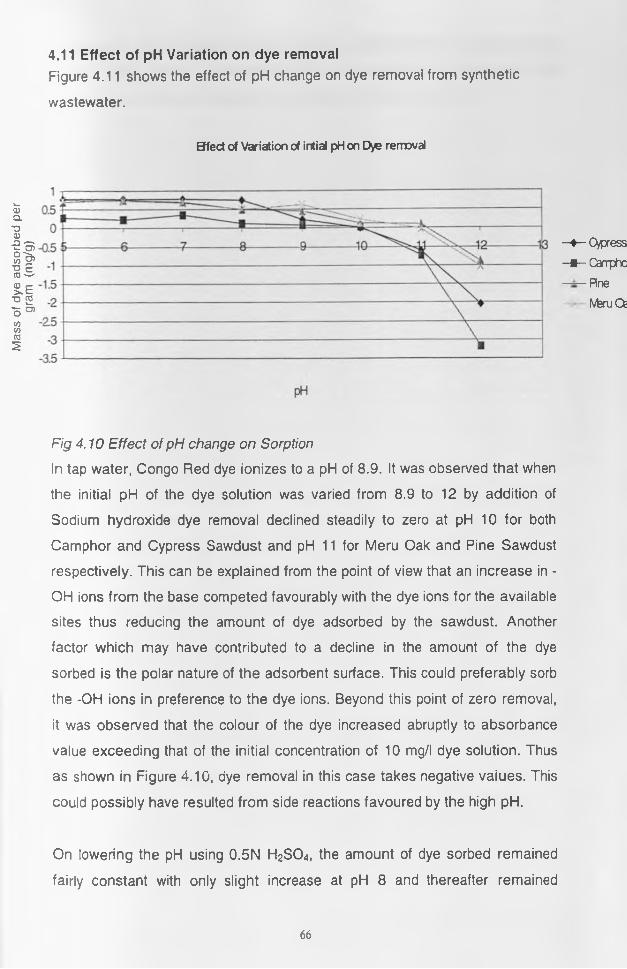
410 Effect of iNmAL dye concentration on percentage removal64411 Effect of pH Variation on dye removal66
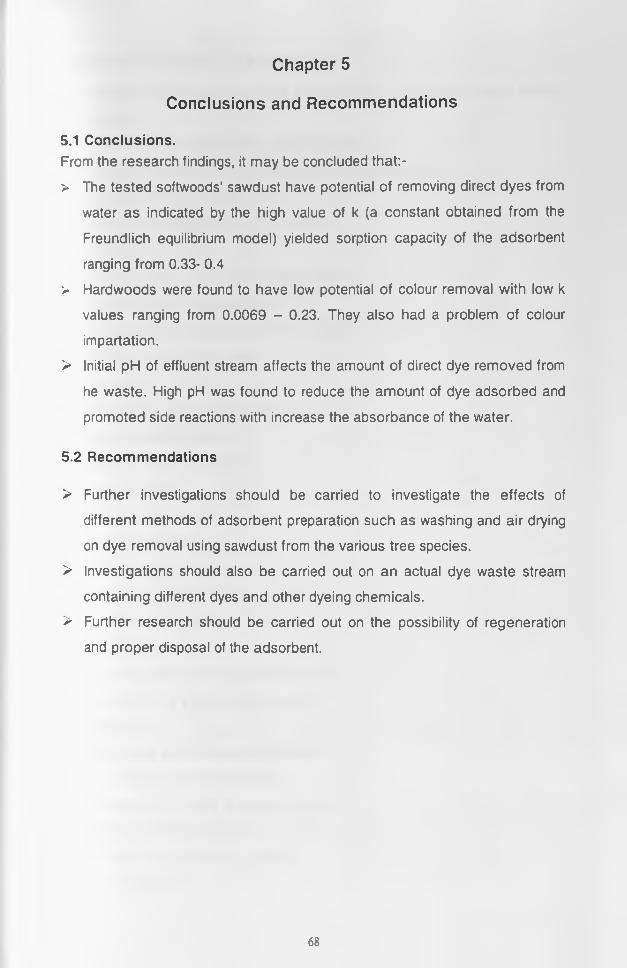
CHAPTER 5 68
CONCLUSIONS AND RECOMMENDATIONS 68
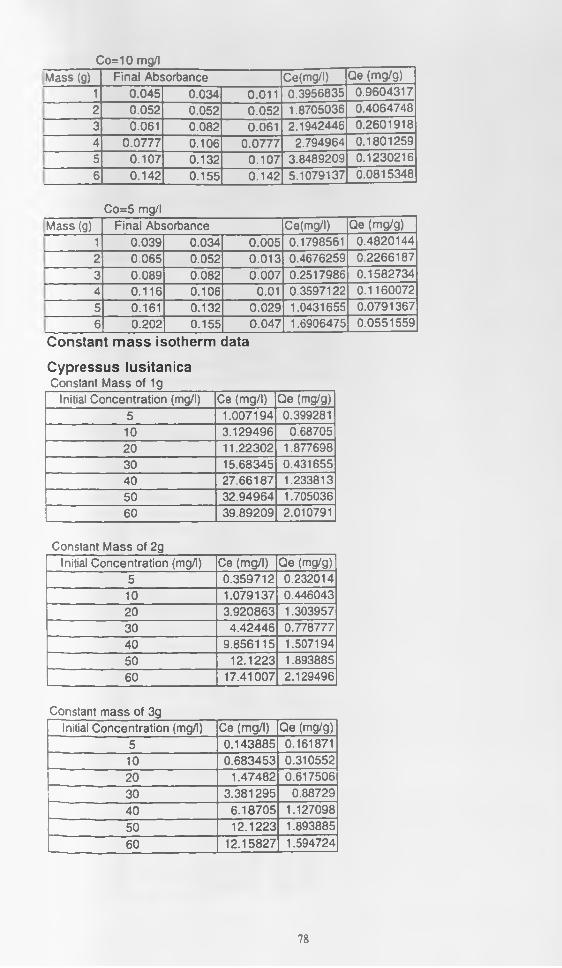
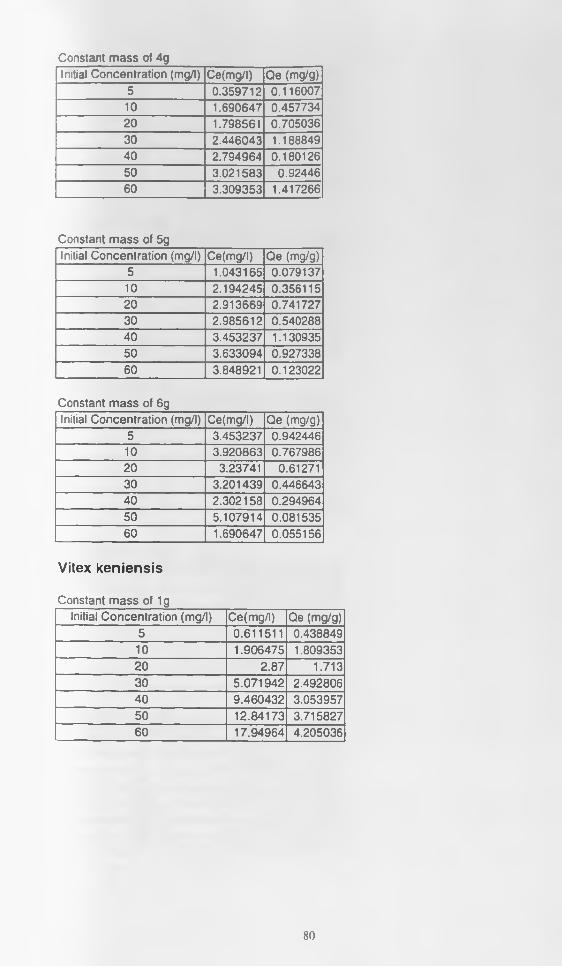
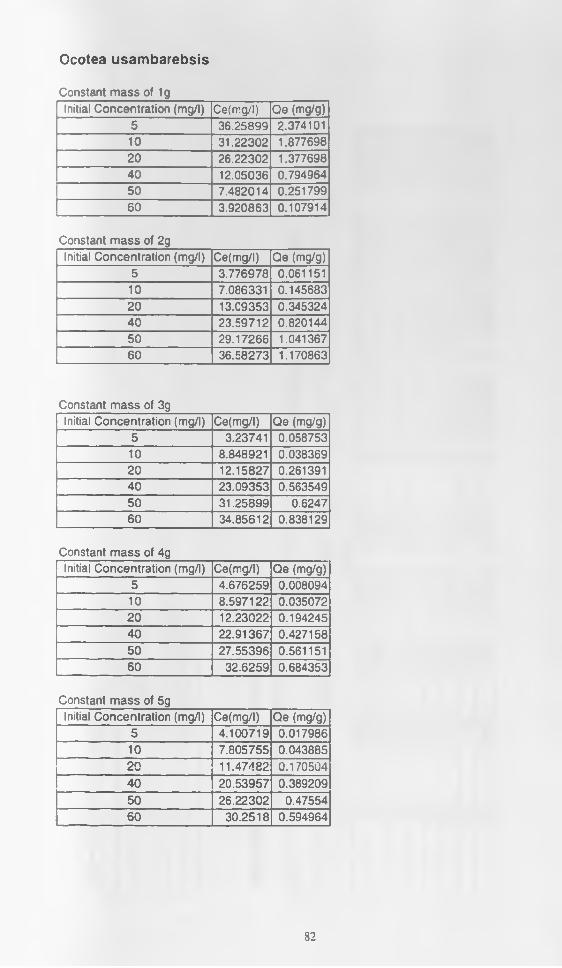
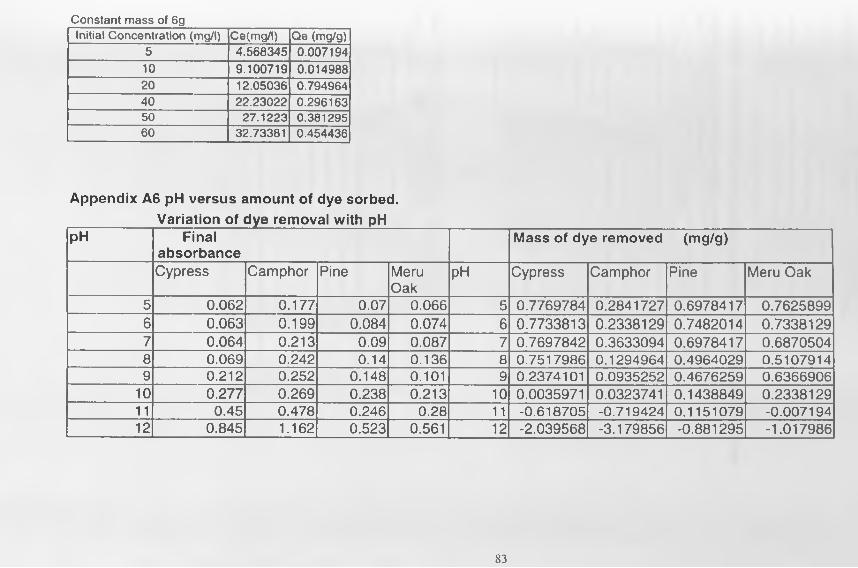
51 Conclusions 6852 Recommendations 68Appendix A I Reagents a n d Equipment69appendix A2 Chemical composition of Sawdust 71appendix A3 Variation of Absorbance with concentration72Appendix A4 Specific Gravity of Sawdust (G )72appendix A5 Variable mass Isotherm data72Appendix A6 pH versus amount of dye sorbed83appendix A7 Mean Particle size Versus dye removal at equilibrium 84appendix A8 Number of revolutions per minute versus Dye removal 84appendix A9 Freundlich constants85Appendix A 10 Initial concentration versus dye removal for Pinus spp Vitex kiniensis Octea usambrensis and Cypressus lusitanica85
V
Acronyms
ADF Acid Detergent Fibre
ADL Acid Detergent Lignin
APHA America Public Health Association
BET Breunner Emmet Teller
EDTA Ethylenediaminetetracetic Acid
CWC Cell Wall Contents
NDF Neutral Detergent Fibre
NPN Non Protein Nitrogen
UNEP United Nation Environmental
Programme
VI
DEDICATION
I dedicate this work to all men and women whom in the time past and now
have and continue to give their best in time effort and other unquantifiable
resources selflessly in stewarding Godrsquos magnificent creation
vii
Acknowledgement
In writing this research I am greatly indebted to a number of people without
who this work could not have been possible
First and foremost I greatly acknowledge ProfessorBNK Njoroge for being
my supervisor and guiding me through the entire project He gave thoughtful
insights in experimentation analysis and discussion of the results
Technical staffs in the Public Health Engineering laboratory for technical
advise availing themselves to be consulted when necessary Chairman and
technical staff of Department of Biochemistry for extending some of their
facilities and equipment for uses in this projectTechnical staff Department of
Animal production for the help extended in part of the experimentation
Staff of Woodmakers Limited for freely availing different varieties of sawdust
Fellow colleagues in the Department of Civil Engineering for their positive
critique and sincere encouragement
Thank you all may the Lord God always bless you for what you have done for
me
viii
List of Tables
Table 11 The economic evaluation of various adsorbents in dye removal
Table 21 Wavelengths of the more important colours of the visible spectrum
Table 22 Characteristics of Congo Red dye
Table 23 Average Chemical composition of softwood and hardwoods
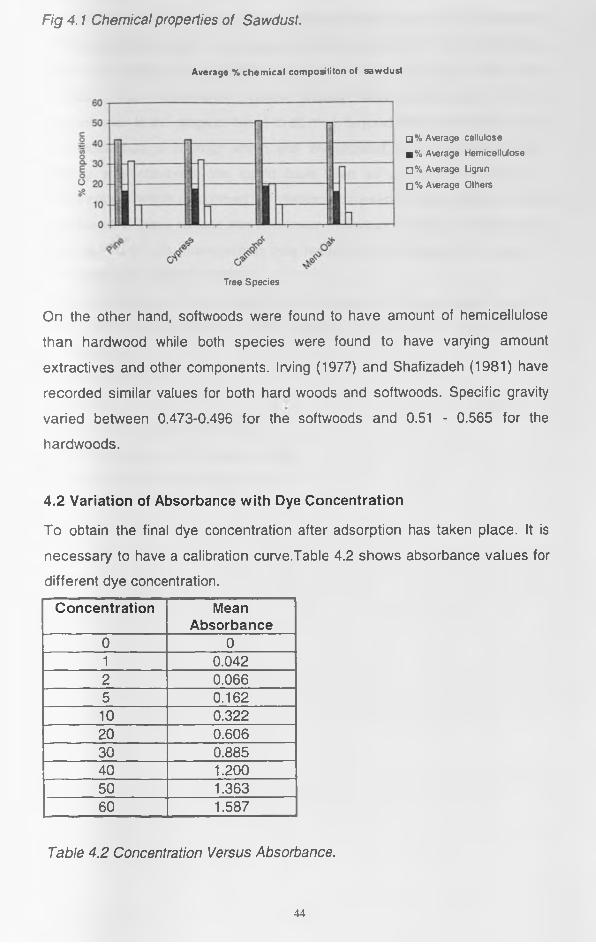
Table 41 Chemical and physical properties of sawdust
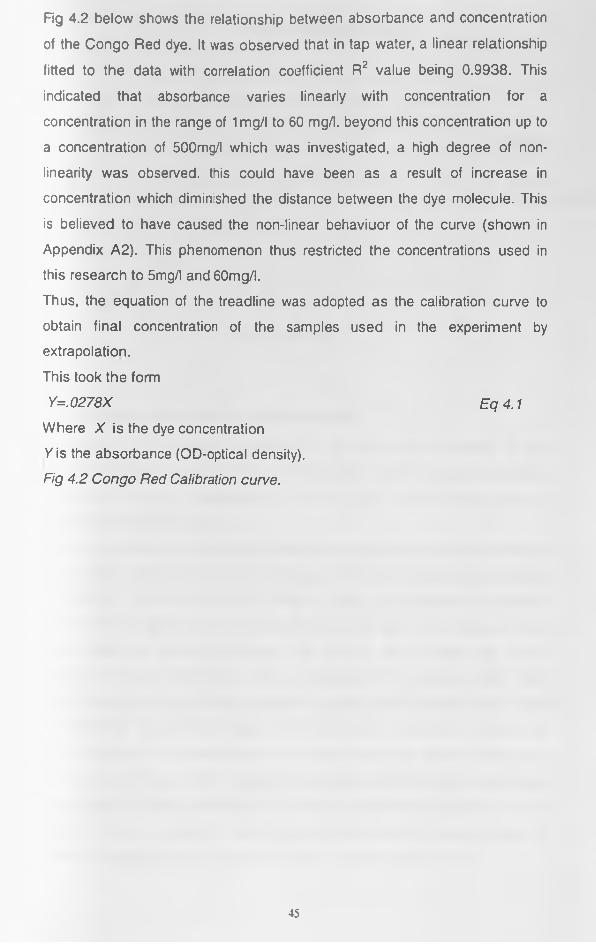
Table 42 Concentration versus Absorbance
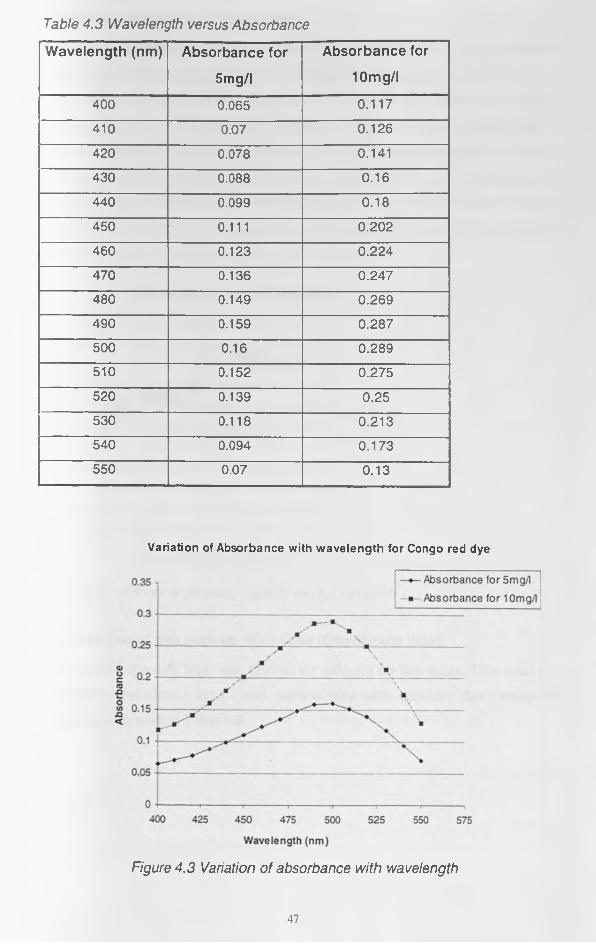
Table 43 Wavelength versus Absorbance
Table 44 Shaking speed versus mass of dye removed
Table 45 Dye removal versus time
Table 46 Particle size versus removal
Table 47 Adsorbent Concentration versus Dye removal
IX
List of FiguresFigure 21 Classification of Dyes by Colligators
Figure 22 Structure of Congo Red dye Molecule
Figure 23 Structure of Congo red Dye ion
Figure 24 Balanced and unbalanced atoms
Figure 25 Freundlich Isotherm model
Figure 26 Linearized BET Isotherm
Figure 27 Distribution of ions near a charged surface
Figure 28 Formation of monomolecular and polymolecular water layers on
wood surface
Figure 31 Schematic representation of Van Soest Procedures
Figure 41 Chemical composition of Sawdust
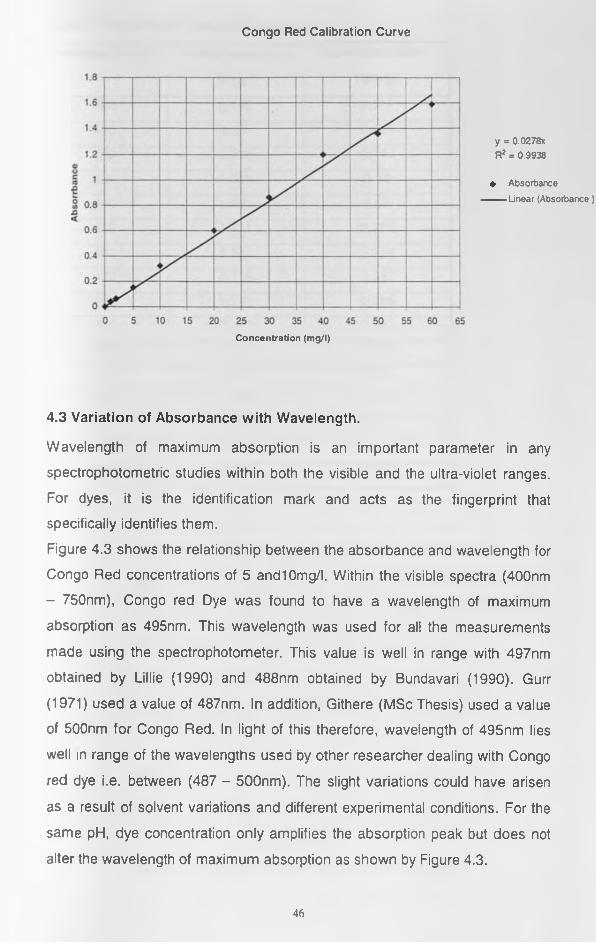
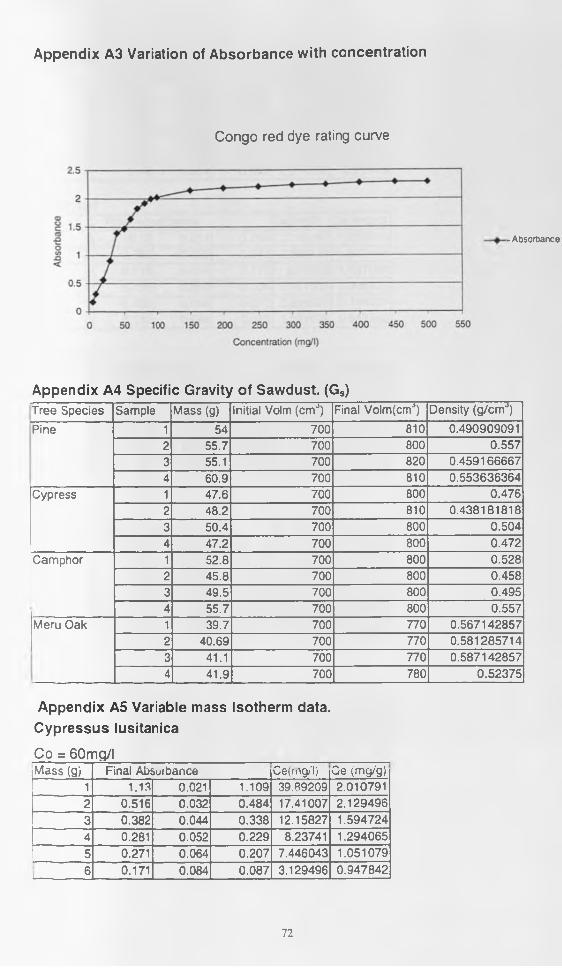
Figure 42 Calibration Curve of Congo Red dye
Figure 43 Variation of absorbance with wavelength
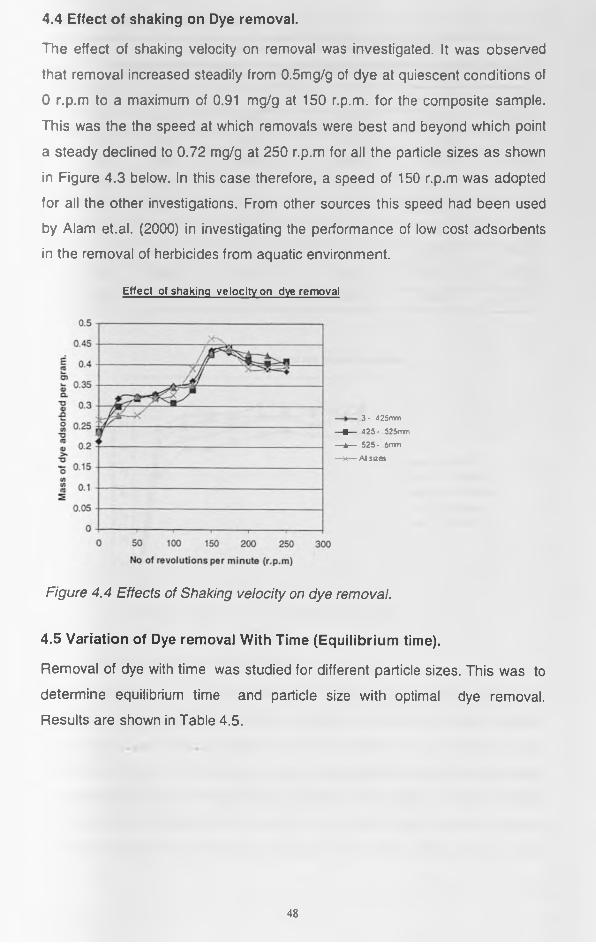
Figure 44 Effect of shaking speed on dye removal
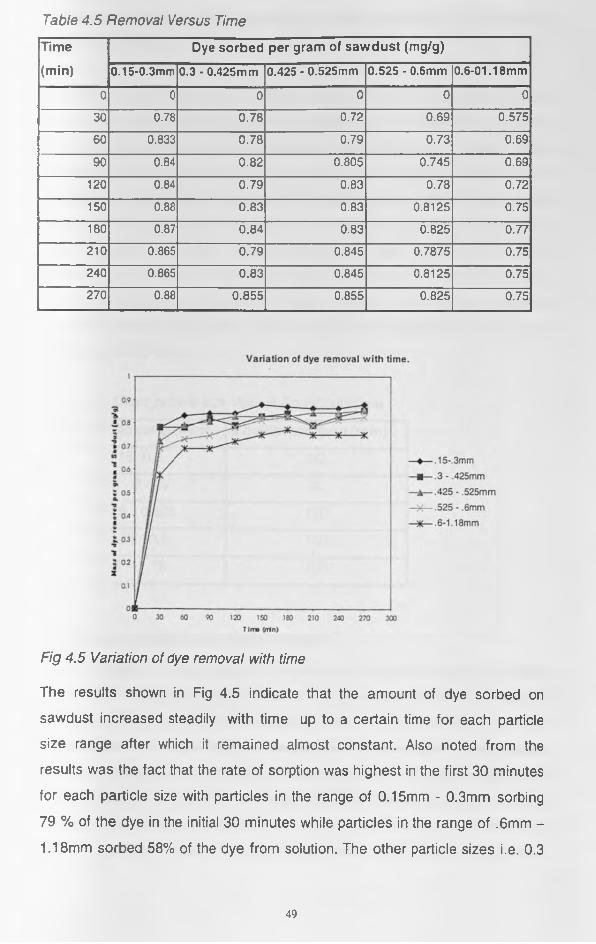
Figure 45 Variation of dye removal with time
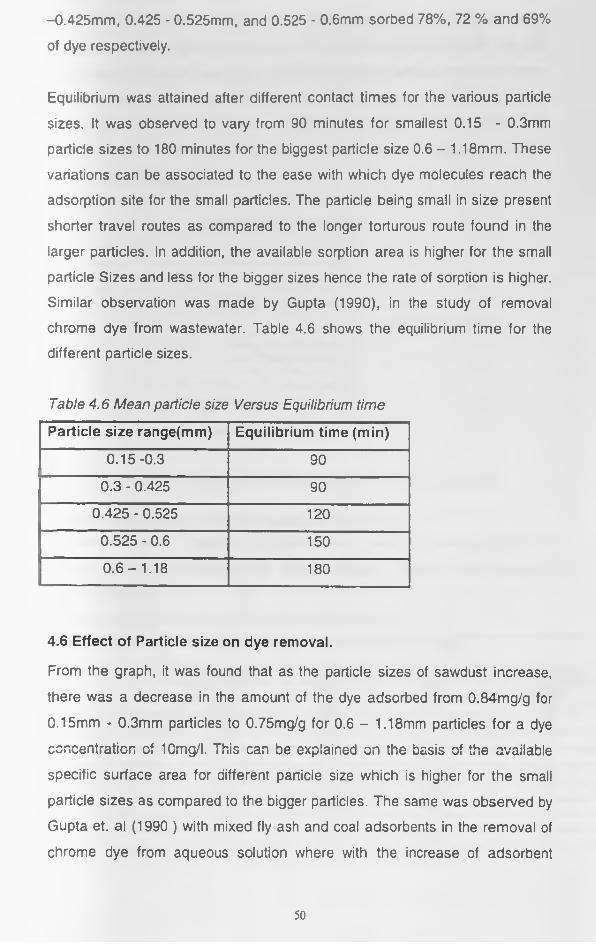
Figure 46 Effect of particle size on dye removal
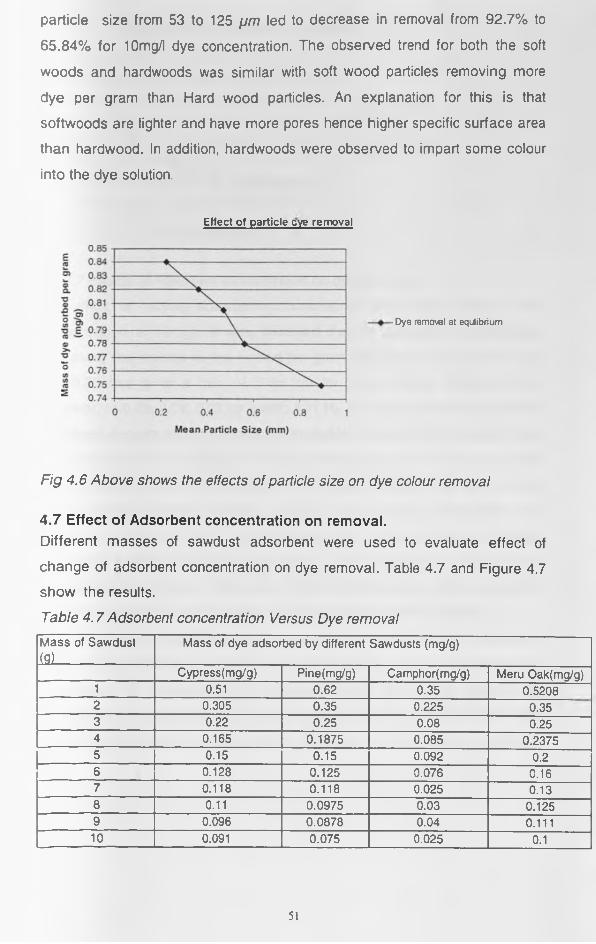
Figure 47 Effect of adsorbent concentration on Dye removal
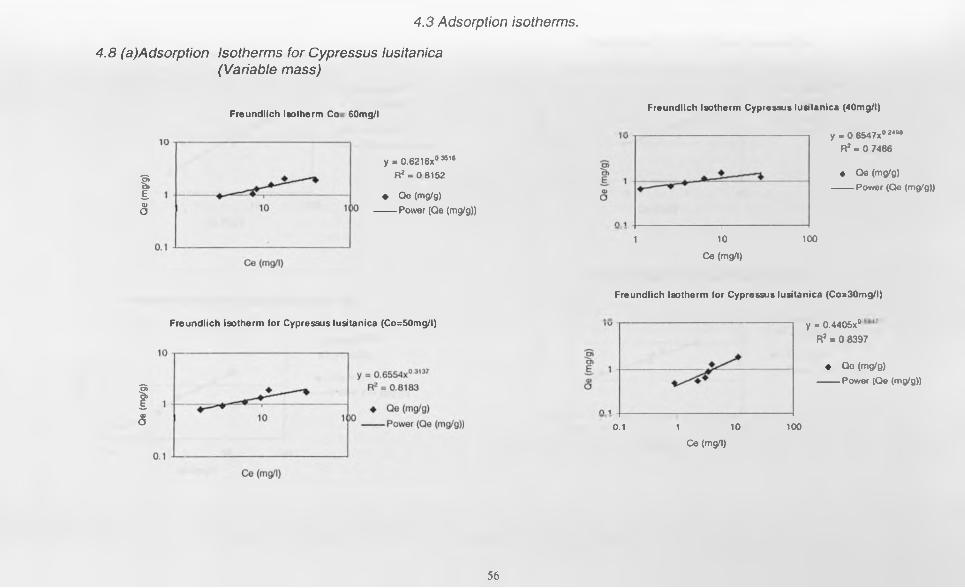
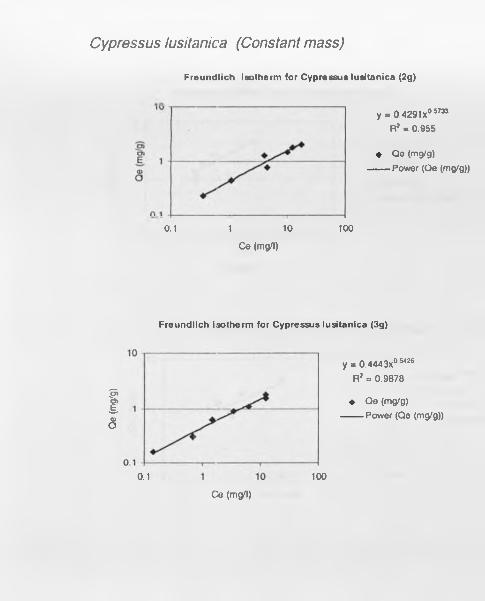
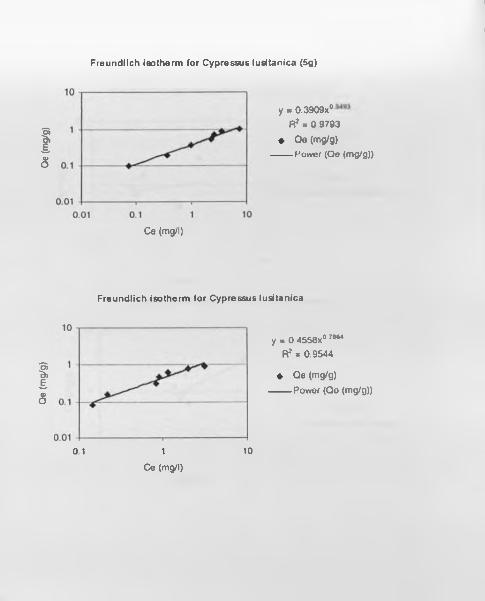
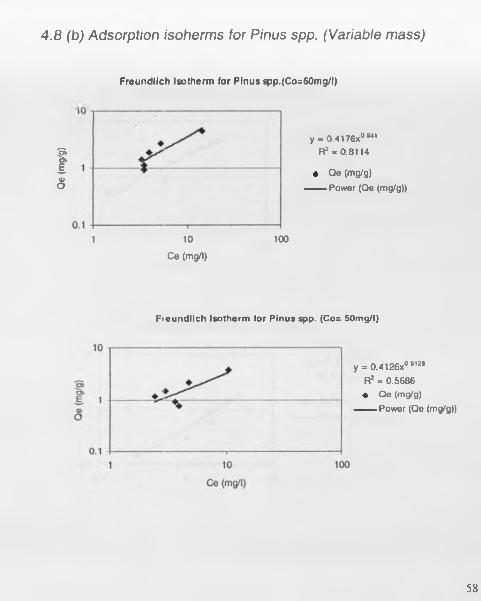
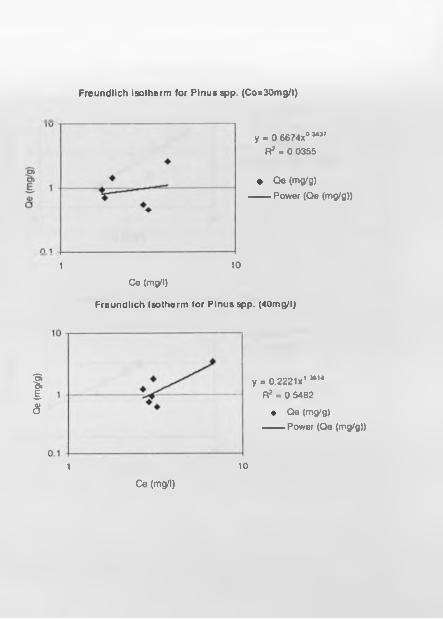
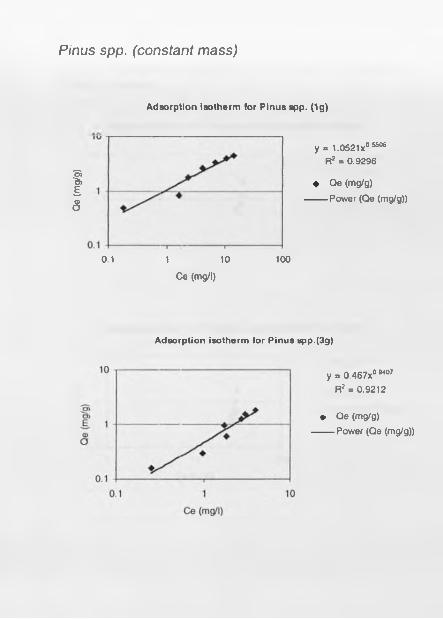
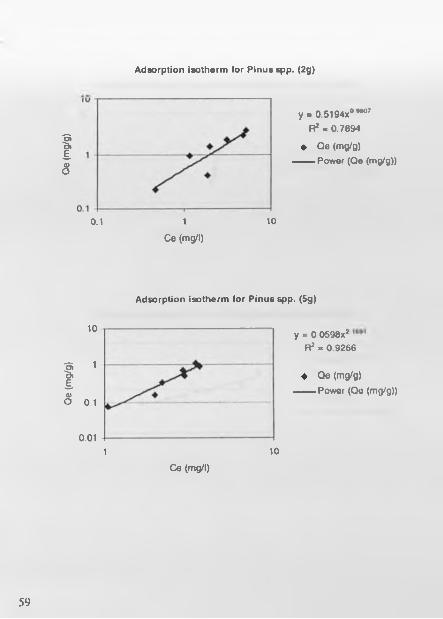
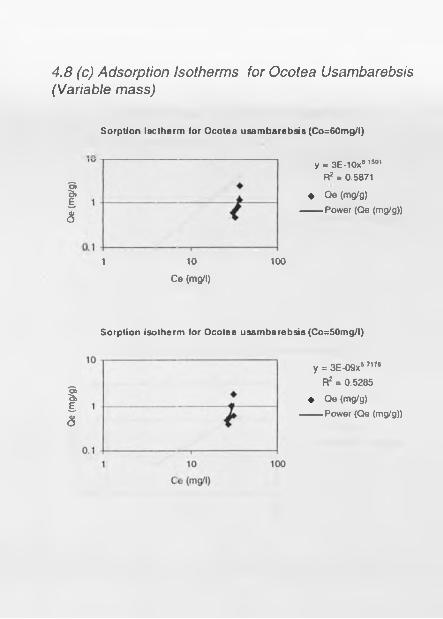
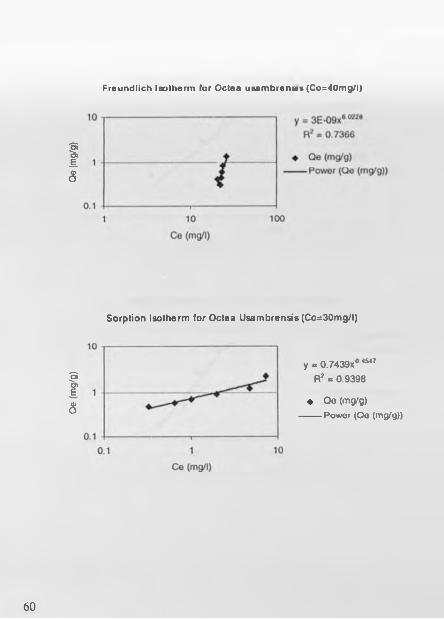
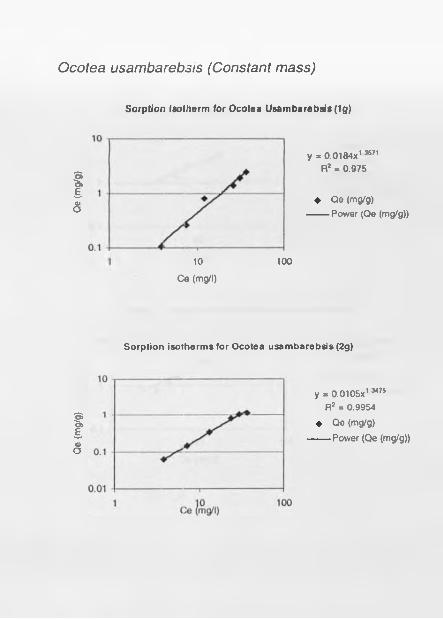
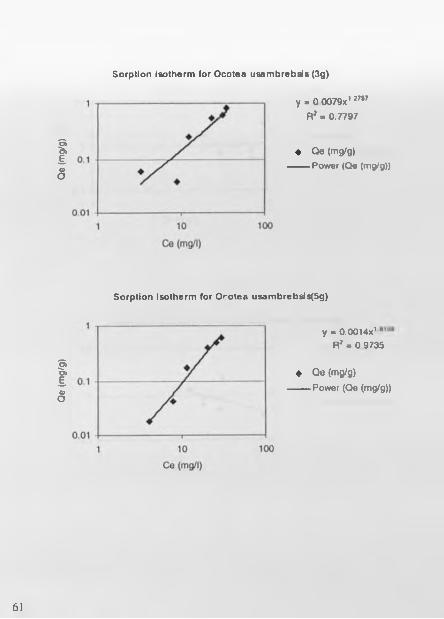
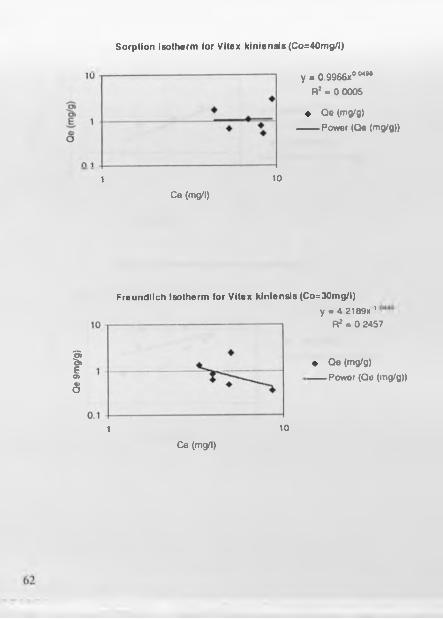
Figures 48(a)mdash-48(d) Adsorption isotherms for Cypressus lusitanica Pinus
spp Ocotea usambarebsis and Vitex keniensis
Figure 49(a) - 49(d) Effect of initial dye concentration on dye removal
Figure 410 Effect of initial pH on removal
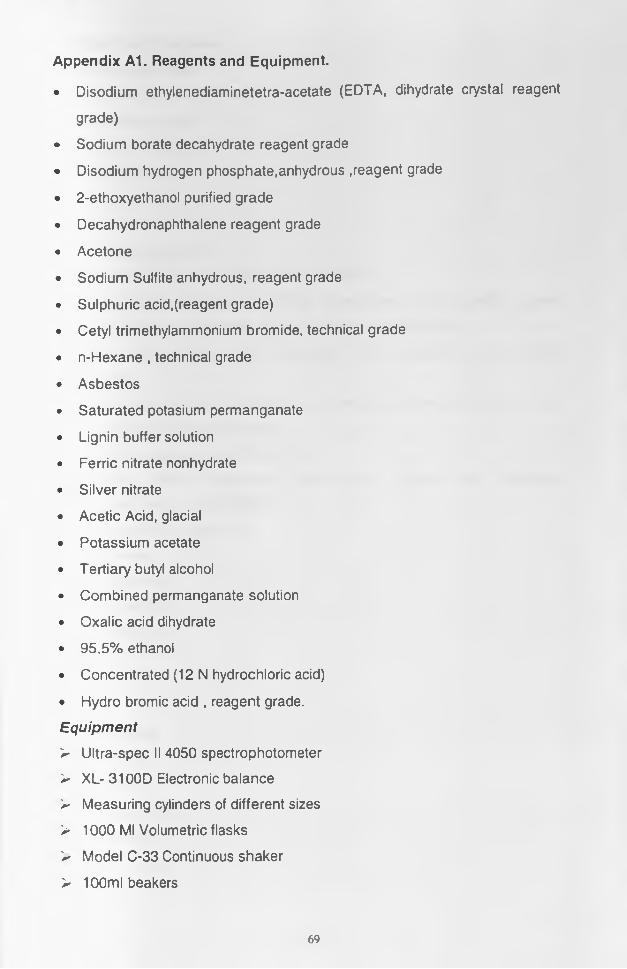
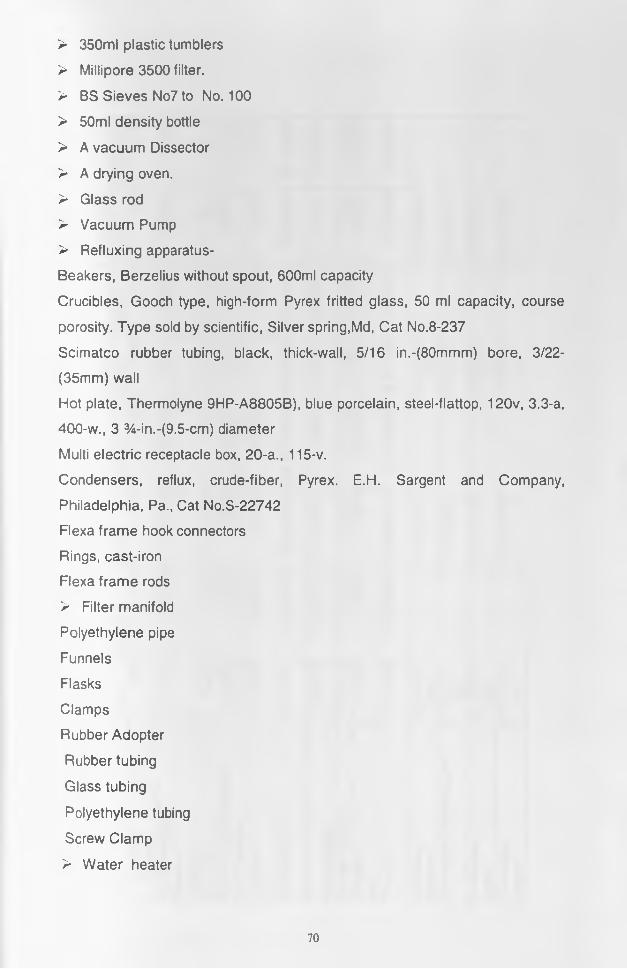
List of AppendicesAppendix A 1 Chemicals and Equipment
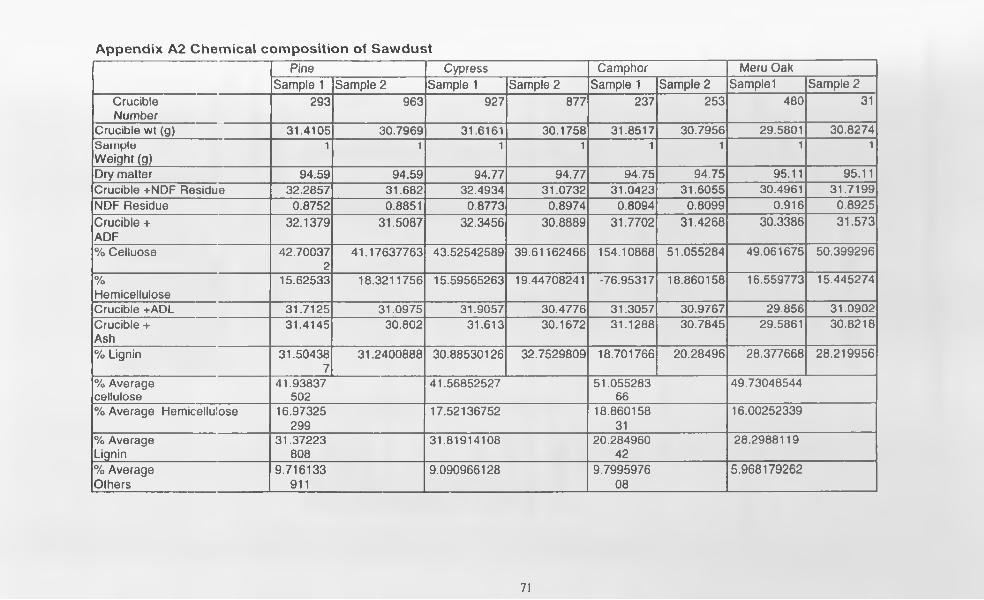
Appendix A2 Chemical composition of Sawdust
Appendix A3Variation of absorbance with concentration
Appendix A4 Specific Gravity of Sawdust (Gs)
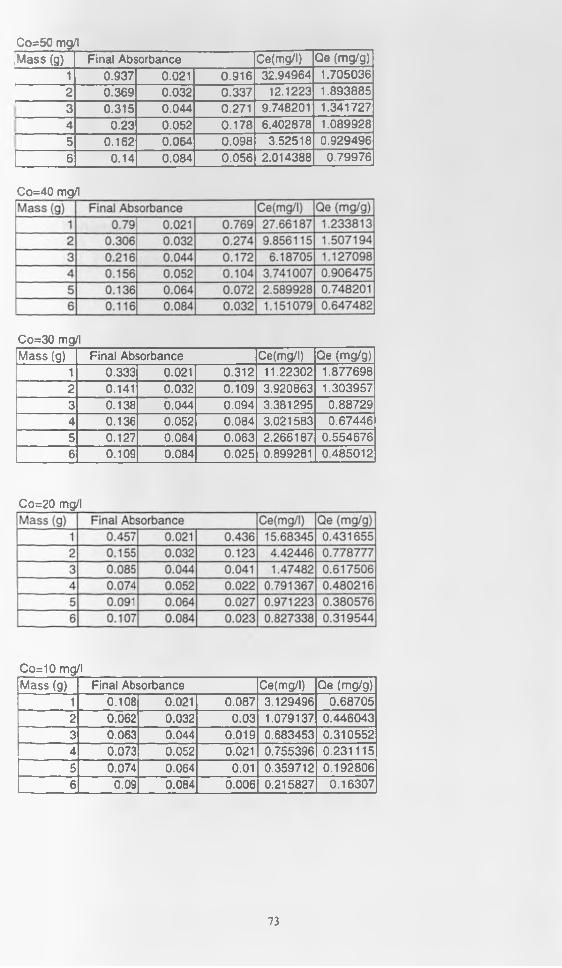
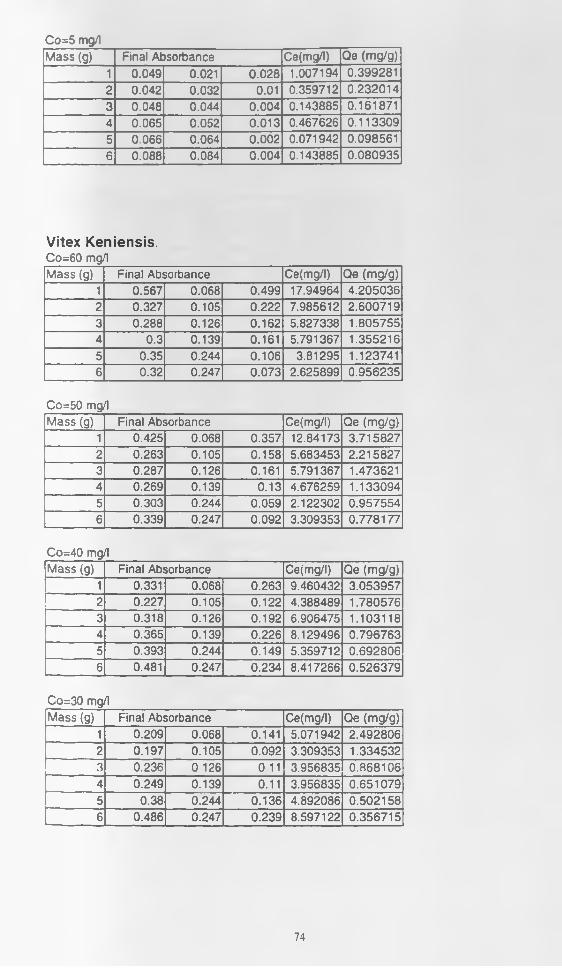
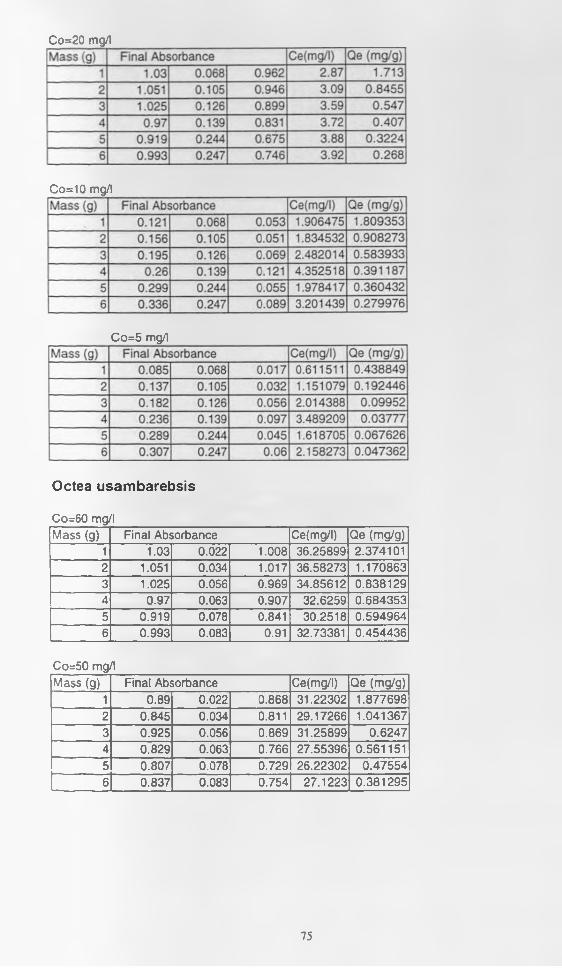
Appendix A5 Adsorption Isotherm data
Appendix A6 pH versus amount of dye sorbed
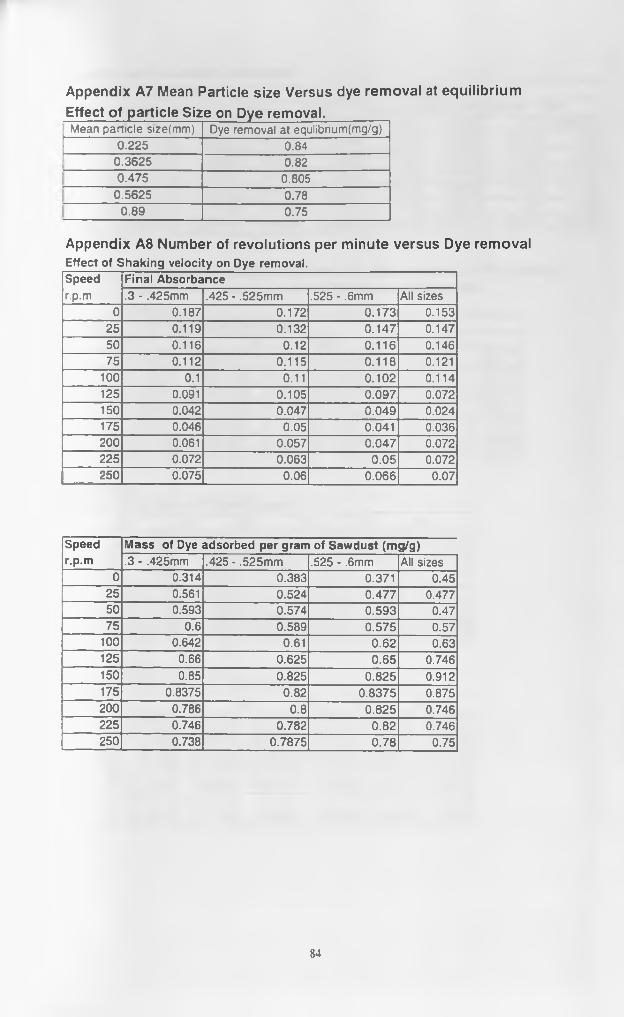
Appendix A7 Mean Particle size Versus dye removal at equilibrium
Appendix A8 Number of revolutions per minute versus Dye removal
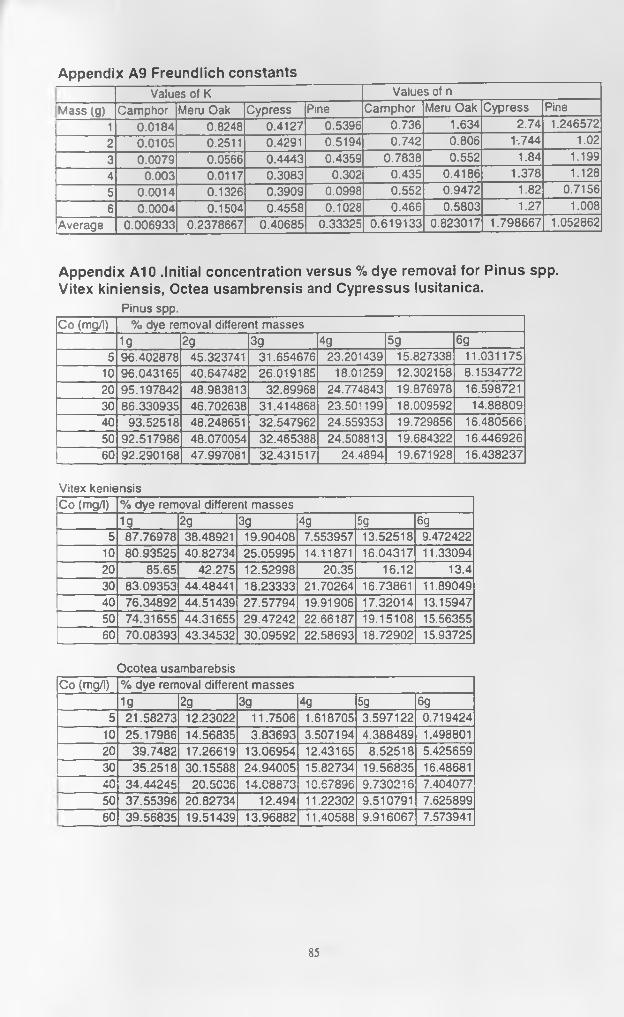
Appendix A9 Freundlich constants
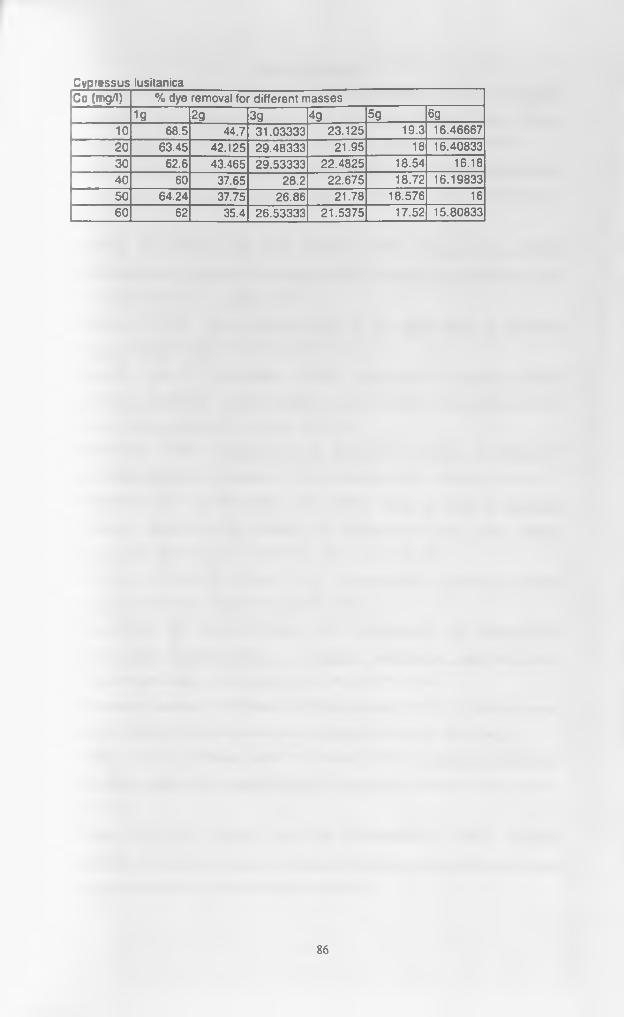
Appendix A 10 Initial concentration versus dye removal for Pinus spp Vitex
kiniensis Octea usambrensis and Cypressus lusitanica
XI
Abstract
The potential of hardwood and softwood sawdust as low cost adsorbents in
the removal of a disazo dye (Congo Red) from water was evaluated Two
softwoods Cypress (Cypressus lusitanica) and Pine (Pinus spp) and two
hardwoods Camphor (Ocotea usambarebsis) and Meru oak (Vitex keniensis)
were used in the studies Those materials were selected on the basis of their
relative abundance as a waste in the timber mills industry
Sawdust was found to have potential in removing Congo red dye from
wastewater The interaction of dye and the sawdust conform to Freundlich
adsorption model with softwoods showing a higher potential both in capacity
and intensity of removing Congo red dye from wastewater than hardwoods
The coefficients of Freundlich equilibrium model k and n show that Cypress
(Cypressus lusitanica) had the highest potential having k and n values of 040
and 179 respectively followed Pine (Pinus spp) with k and n values of 033
and 105 while Meru oak and Camphor had the two values being 023 and
0823 and 00069 and 0619 respectively
The higher dye uptake by softwood sawdust is attributable to more pore
spaces and high specific surface area for adsorption than hardwood The
softwoods had lower densities than hardwoods and thus the far more porous
The adsorption correlated positively with the hemicellulose extract of the
sawdust which was high in cypress pine Meru oak and Camphor in that
order Cellulose and lignin content correlated negatively with the adsorption
capacity and intensity
Xll
CHAPTER 1 Introduction
10 BackgroundColour removal is a pertinent problem for all categories of textile effluents due
to the variety of chemicals used in fabric dyeing and printing Apart from the
deterioration in the aesthetic value of the receiving water bodies the presence
of colour makes water reuse difficult (UNEP 1993)
When colour removal is necessary the following provides useful treatment
technology
bull Segregation of all print wastes and disposal of each separately to landfill
bull Reduction of colour shop losses by careful hand cleaning of all brushes
troughs doctors blades cans tanks screens
bull In all weaving mills reduce use of fugitive tints in weaving
bull Exhaustion of dye thoroughly in the dyeing process
bull Use of dye processes that can cause less colour losses eg solvent pad
and stream microfoam methanol and ammonia dyeing method
Incase dye colour finds way into waste stream removal may be achieved by
techniques such as
1 Chemical coagulation It is generally applied to remove colour arising from
dyes such as dispersed vat and sulphur dyes Coagulants such as alum
and ferric sulphate applied at a dose of 300 - 600 mgl and lime at a dose
approximately 300 - 600 mgl will remove 75 -90 of colour (UNEP 1993)
These dosages are very high making chemical coagulation an expensive
colour removal technique Chemical coagulation cannot however achieve
satisfactory removal of soluble dyes
2 Adsorption It is an efficient and popular method of colour removal Several
adsorbents are known to be capable of removing dyes from textile effluent
These include activated carbon fullers earth fly ash fired clay baggasse
pith wood peat etc (Poots et al 1978) Techniques to regenerate
adsorbents include the use of bouler water organic solvents and catalytic
oxidation The pH must be adjusted to near neutral and suspended
particulates must be removed for adsorption unit to function properly
i
3 Colour removal in biological treatment It can be improved by addition of
powdered carbon (as a catalyst) to the aeration basin in activated sludge
system ( UNEP 1993) This system will not remove colour as efficiently as
adsorption However an additional 20-55 reduction in colour can be
realised from this process
Other promising techniques for colour removal are ozonation and
hyperfiltration (UNEP 1993)
11 Problems associated w ith Dyes and Textile Industry
Dyes have been reported to be among the different pollutants of aquatic
ecosystems with world production estimated at 640000 tonnes in 1978(Clarke
and Anliker 1980) Dyes used contain many compounds whose
environmental behaviour is largely unknown (Baughman and Perinich1988)
Although most dyes are considered inert or nontoxic Some are not totally
innocuous (Liang 1991) Anliker etal (1981) showed that dispersed dyes
have high partition coefficient and solubility suggesting significant potential for
bioconcentration
In addition to this it has been reported that the bulk of these are used in
textile industry Textile industries have the markets demanding better
performance each year (Jones 1974) Dyes have to be resistant to ozone
nitric oxides light hydrolysis and other degradative environments (Pagga and
Taeger1994) Studies on biological degradation of dyestuffs yields negative
results as indicated above since the dyes themselves are designed to resist
this type of treatment The high colour value or absoptivity needed for a
commercial dye is not an advantage when it ends up in a wastestream
Although some dyes are biologically degradable as noted by Pratt (1968)
most that are present in wastewater are objectionable for their colouration
Dyes are too refractory to undergo degradation in the time required for
conventional treatment The auxiliary chemicals used in aqueous dyeing can
also present a problem to biological processes Carriers such as methyl
naphthalene chloro-benzenes biphenols orthophenyl phenol and benzyl
alcohol are used to speed up the dyeing process These chemicals may
eventually find their way into the receiving waters when the dyeing process is
completed (Jones 1974)
Also untreated effluents from dyestuff production and dyeing mills may be
highly coloured and thus particularly objectionable if discharged into open
waters The concentration of the dye may be much less than 1 ppm but the
dye is visible even in small concentrations the transparency of streams would
also be reduced Because dyes absorb sunlight plants in the drainage stream
may perish thus the ecosystem of the streams may be seriously affected
Possible chronic risks of colourants and their intermediaries are
carcinogenicity and to a lesser extent sensitization and allergies (Huang and
Jang 1993)
In the past Kenya has experienced serious pollution problems resulting from
discharge of dye waste into municipal waste treatment works Investigations
carried out on industrial effluents in Eldoret by OMS-Klaranlagen in 1985
confirmed that damage had occurred to the Eldoret sewage stabilization
ponds due to high pH of the influent dye stuff from textile industries and lack
of pretreatment of industrial wastewater especially those from textile
industries (Sewe 1986) Presently textile dyeing by industries in Kenyarsquos
Export Processing Zone (EPZ) present give rise to coloured effluent which is
discharged untreated to open streams This poses a real challenge to the
ecological balance in the streams
12 Research objectives
The objectives of the research were-
1 To establish the properties of Cypress (Cypressus lusitanica) Camphor
(Ocotea usambarebsis) Pine (Pinus spp) and Meru Oak (Vitex keniensis)
wood sawdust as adsorbents
2 To assess the potential of sawdust in removal of Congo Red dye from
simulated wastewater
3
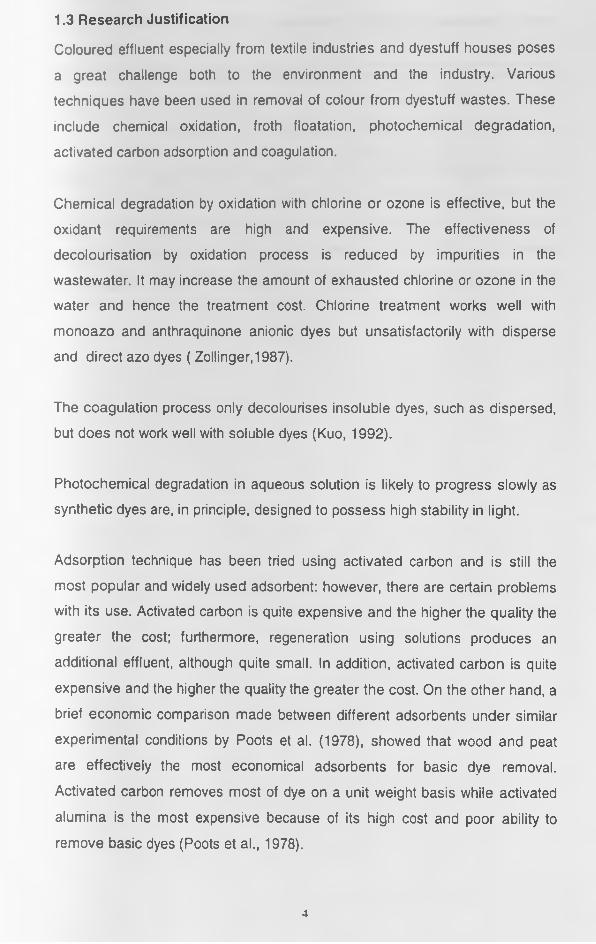
13 Research Justification
Coloured effluent especially from textile industries and dyestuff houses poses
a great challenge both to the environment and the industry Various
techniques have been used in removal of colour from dyestuff wastes These
include chemical oxidation froth floatation photochemical degradation
activated carbon adsorption and coagulation
Chemical degradation by oxidation with chlorine or ozone is effective but the
oxidant requirements are high and expensive The effectiveness of
decolourisation by oxidation process is reduced by impurities in the
wastewater It may increase the amount of exhausted chlorine or ozone in the
water and hence the treatment cost Chlorine treatment works well with
monoazo and anthraquinone anionic dyes but unsatisfactorily with disperse
and direct azo dyes ( Zollinger 1987)
The coagulation process only decolourises insoluble dyes such as dispersed
but does not work vell with soluble dyes (Kuo 1992)
Photochemical degradation in aqueous solution is likely to progress slowly as
synthetic dyes are in principle designed to possess high stability in light
Adsorption technique has been tried using activated carbon and is still the
most popular and widely used adsorbent however there are certain problems
with its use Activated carbon is quite expensive and the higher the quality the
greater the cost furthermore regeneration using solutions produces an
additional effluent although quite small In addition activated carbon is quite
expensive and the higher the quality the greater the cost On the other hand a
brief economic comparison made between different adsorbents under similar
experimental conditions by Poots et al (1978) showed that wood and peat
are effectively the most economical adsorbents for basic dye removal
Activated carbon removes most of dye on a unit weight basis while activated
alumina is the most expensive because of its high cost and poor ability to
remove basic dyes (Poots et al 1978)
4
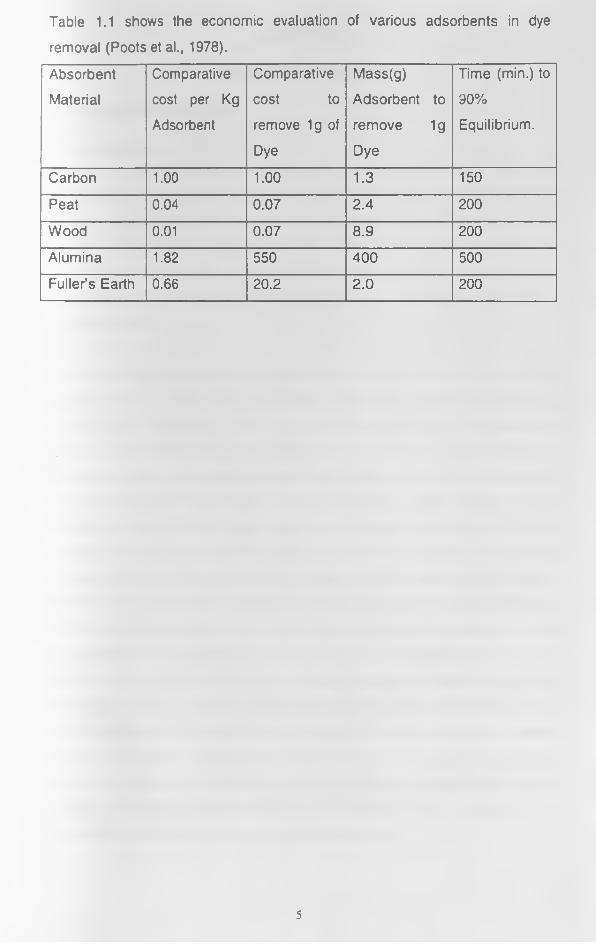
Table 11 shows the economic evaluation of various adsorbents in dye
removal (Poots et al 1978)
Absorbent
Material
Comparative
cost per Kg
Adsorbent
Comparative
cost to
remove 1g of
Dye
Mass(g)
Adsorbent to
remove 1 g
Dye
Time (min) to
90
Equilibrium
Carbon 100 100 13 150
Peat 004 007 24 200
Wood 001 007 89 200
Alumina 182 550 400 500
Fullerrsquos Earth 066 202 20 200
5
CHAPTER 2
LITERATURE REVIEW
20 PROPERTIES OF DYES
21 IntroductionWith few exceptions all dyes are aromatic organic compounds They are
divide into three main groups non-ionic anionic and cationic The molecules
of ionic (anionic or cationic) dyes are composed of two main parts one of
which is a complex aryl radical This is the colour-imparting ion If the balance
of the charge on the latter is negative then the dye is classed as anionic On
the other hand if the balance of charge on the ion is positive then the dye is
classed cationic
The second part of an ionic dye molecule is an inorganic ion (an aliphatic
organic ion or in a few cases an aryl ion) The former is called the gegen-ion
and the latter the dye ion The function of the gegen-ion is to balance the
charge on the dye-ion and to render the dye soluble in water With few
exceptions anionic dyes are manufactured as metallic salts The vast majority
of anionic dyes are sodium salts of carboxylic acids uranine being the most
notable In case of cationic dyes gegen ion is usually the chloride ion In vast
majority of cases the gegen-ion could be replaced by another of the same
charge without seriously effecting the functioning of the dye For example a
calcium salt might be less soluble in water than a sodium salt Similarly a
sulphate might be less soluble in water than a chloride When dyes are used
as reagents for the detection of certain ions due consideration has to be
given to the gegen-ion of the dyes However unless the gegen-ion itself is
coloured it has no influence whatever upon the colour of the dye ion in
aqueous solution For example pararosanaline chloride or sulphate or acetate
exhibits exactly the same colour in solution On the other hand the dye ion
cannot be replaced by another ion without profound changes in the nature
and the functioning of the dye molecule The individual chemical physical and
tinctorial characteristics of a dye are due to its dye ion
6
The simple gegen-ion of a dye could be replaced by another dye-ion of the
same charge as the original gegen-ion and of opposite charge to that of the
first dye-ion This would result in the formation of a polychrome compound
dye Such dyes are prepared for special purposes and their molecules
consists of an electro-positively charged dye-ion and a negatively charged
dye-ion Dyes of this kind are insoluble in water but soluble in absolute and
aqueous alcohol Partial dissociation takes place in the latter Such dyes are
used in biological micro-technique for differential staining of acidic and basic
elements of cells and tissues
The colour index gives the structures of about 2100 anionic dyes and
classifies them variously as ldquoacid ldquobasicrdquo ldquodirectrdquo and mordantrdquo according to
the manner of usage in the textile-dyeing industry About 1400 of these
anionic dyes are amino dyes or imino amino acids The remainder are wholly
acid in that they have no basic side-chains
By definition an ldquoacidrdquo dye is one which dyes wool from a dye bath which
contains acid Such dyes now however find their application not only for wool
but also for silk polyamide acrylic and regenerated protein fibres They are
applied from dye baths containing sulphuric or formic or acetic acid or
ammonium sulphate sometimes from a neutral and occasionally from a
slightly alkaline bath
According to colour index rsquorsquodirect dyes are originally designed and marketed
for the primary purpose of dyeing celiulosic fibres such dyes having being
defined as lsquoAnionic dyes having affinity for celiulosic fibres when applied from
an aqueous dyebath containing electrolyte Direct dyes provide the simplest
means of colouring celiulosic materials as they are normally applied in the
textile dyeing industry from a neutral to a slightly alkaline dyebath at or near
boiling point to which sodium chloride and sodium sulphate is added Direct
dyes are anionic- most are amphoteric since they possess side chains which
are basic in reaction
7
Mordant dyes are described as dyes having the property of combining with
metallic oxides and salts to form metallic complexes Dyes of this class are
however very difficult to define The colour Index states that the make-up of
this class not as a matter of strict definition but of a convention which has
grown up over the years and which has no logical basis The majority of dyes
are used with the acid of the mordants in the textile industry mainly for
dyeing wool the secondary application being for dyeing silk and nylon and for
printing on cellulose silk and wool fabrics The major classification of dyes by
colligators is shown in Figure 21
8
Synthetic Organic Dyes
GROUP 1
NON-IONIC DYES
Class 1
Acidic
Class 2
Basic
Class 3
Neutral
Class 4
Amphoteric
GROUP 2
CATIONIC DYES
Class 1
Wholly basic dyes
Class 2
Basic dyes having
acidic side-chains
GROUP 3
ANIONIC DYES
Sub-Group 1
Wholly acid dyes
Class 1 Class 2 Class 3
Carboxylated dyes Carboxylated dyes Sulphonated dyes
OH
Without -OH with -OH groups
as
groups
only
Class 4 Class 5 Class 6
Sulphonated dyes Sulphonated dyes With -
without -OH groups with -OH groups with carboxyl groups groups
and -OH groups their
colligators
Sub-Group 2 Sub-Group 3
Weahly amphoteric dyes_____ Moderately or strongly amphoteric dyes
Class 1 Class 2 Class 1 Class 2 Class 3
Without -OH groups With -OH groups Without -OH groups With -OH groups With -
OH
groups as
their
only acidic
colligators
Figure 21 Classification of Dyes by Colligators
9
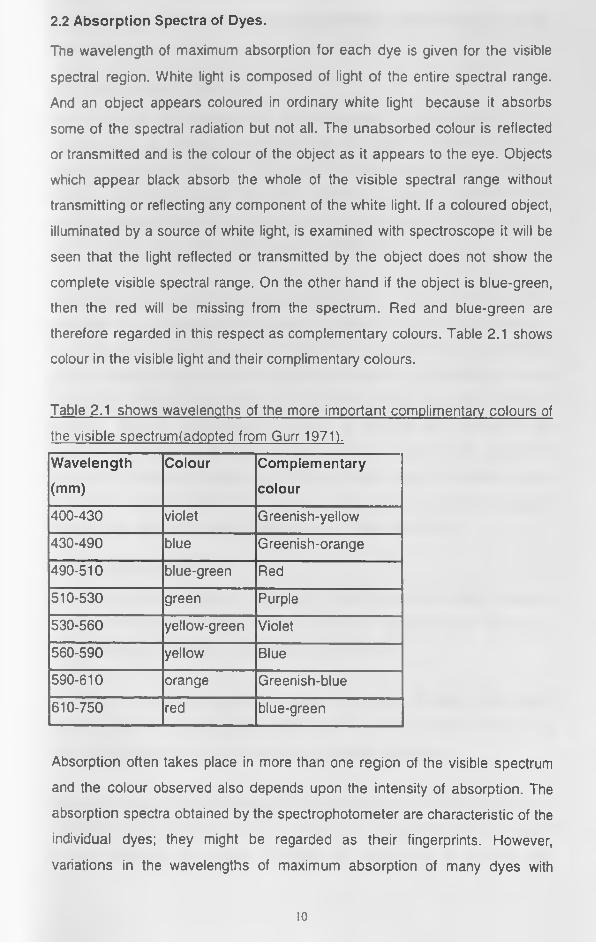
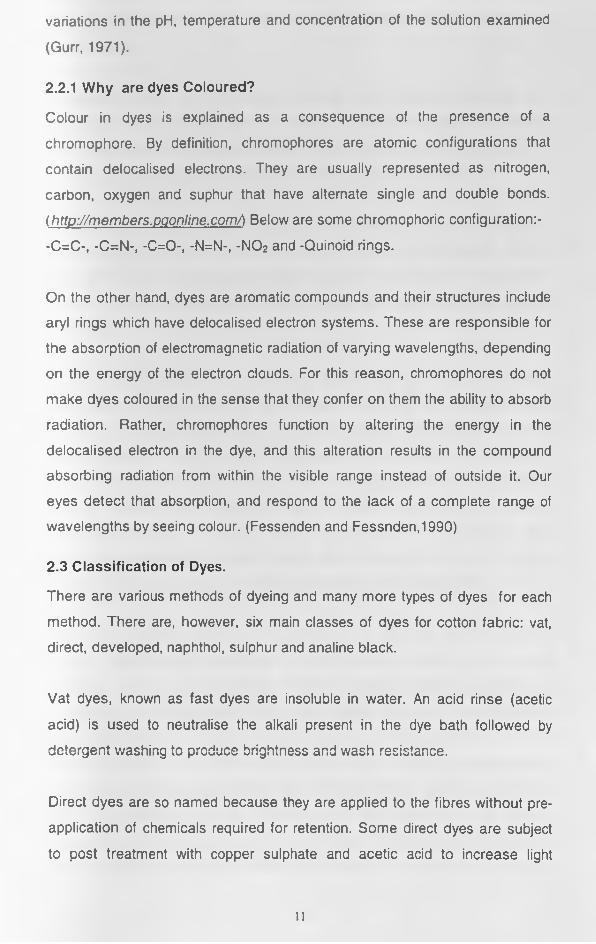
22 Absorption Spectra of Dyes
The wavelength of maximum absorption for each dye is given for the visible
spectral region White light is composed of light of the entire spectral range
And an object appears coloured in ordinary white light because it absorbs
some of the spectral radiation but not all The unabsorbed colour is reflected
or transmitted and is the colour of the object as it appears to the eye Objects
which appear black absorb the whole of the visible spectral range without
transmitting or reflecting any component of the white light If a coloured object
illuminated by a source of white light is examined with spectroscope it will be
seen that the light reflected or transmitted by the object does not show the
complete visible spectral range On the other hand if the object is blue-green
then the red will be missing from the spectrum Red and blue-green are
therefore regarded in this respect as complementary colours Table 21 shows
colour in the visible light and their complimentary colours
Table 21 shows wavelengths of the more important complimentary colours of
the visible spectrumfadopted from Gurr 1971)
Wavelength
(mm)
Colour Complementary
colour
400-430 violet Greenish-yellow
430-490 blue Greenish-orange
490-510 blue-green Red
510-530 green Purple
530-560 yellow-green Violet
560-590 yellow Blue
590-610 orange Greenish-blue
610-750 red blue-green
Absorption often takes place in more than one region of the visible spectrum
and the colour observed also depends upon the intensity of absorption The
absorption spectra obtained by the spectrophotometer are characteristic of the
individual dyes they might be regarded as their fingerprints However
variations in the wavelengths of maximum absorption of many dyes with
10
variations in the pH temperature and concentration of the solution examined
(Gurr 1971)
221 Why are dyes Coloured
Colour in dyes is explained as a consequence of the presence of a
chromophore By definition chromophores are atomic configurations that
contain delocalised electrons They are usually represented as nitrogen
carbon oxygen and suphur that have alternate single and double bonds
(httpmembersDaonlinecom) Below are some chromophoric configuration-
-C=C- -C=N- -C=0- -N=N- -N 02 and -Quinoid rings
On the other hand dyes are aromatic compounds and their structures include
aryl rings which have delocalised electron systems These are responsible for
the absorption of electromagnetic radiation of varying wavelengths depending
on the energy of the electron clouds For this reason chromophores do not
make dyes coloured in the sense that they confer on them the ability to absorb
radiation Rather chromophores function by altering the energy in the
delocalised electron in the dye and this alteration results in the compound
absorbing radiation from within the visible range instead of outside it Our
eyes detect that absorption and respond to the lack of a complete range of
wavelengths by seeing colour (Fessenden and Fessnden1990)
23 Classification of Dyes
There are various methods of dyeing and many more types of dyes for each
method There are however six main classes of dyes for cotton fabric vat
direct developed naphthol sulphur and analine black
Vat dyes known as fast dyes are insoluble in water An acid rinse (acetic
acid) is used to neutralise the alkali present in the dye bath followed by
detergent washing to produce brightness and wash resistance
Direct dyes are so named because they are applied to the fibres without preshy
application of chemicals required for retention Some direct dyes are subject
to post treatment with copper sulphate and acetic acid to increase light
11
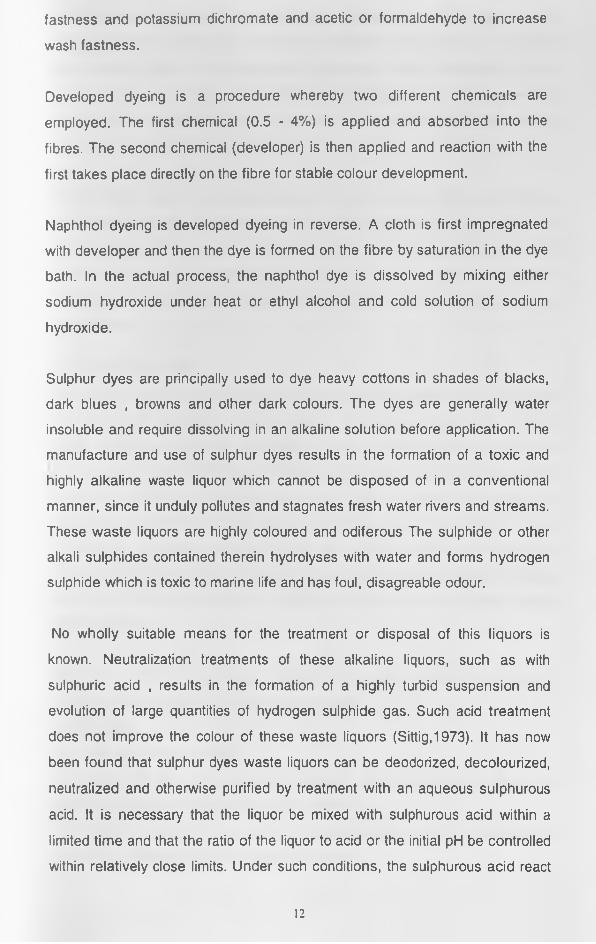
fastness and potassium dichromate and acetic or formaldehyde to increase
wash fastness
Developed dyeing is a procedure whereby two different chemicals are
employed The first chemical (05 - 4) is applied and absorbed into the
fibres The second chemical (developer) is then applied and reaction with the
first takes place directly on the fibre for stable colour development
Naphthol dyeing is developed dyeing in reverse A cloth is first impregnated
with developer and then the dye is formed on the fibre by saturation in the dye
bath In the actual process the naphthol dye is dissolved by mixing either
sodium hydroxide under heat or ethyl alcohol and cold solution of sodium
hydroxide
Sulphur dyes are principally used to dye heavy cottons in shades of blacks
dark blues browns and other dark colours The dyes are generally water
insoluble and require dissolving in an alkaline solution before application The
manufacture and use of sulphur dyes results in the formation of a toxic and
highly alkaline waste liquor which cannot be disposed of in a conventional
manner since it unduly pollutes and stagnates fresh water rivers and streams
These waste liquors are highly coloured and odiferous The sulphide or other
alkali sulphides contained therein hydrolyses with water and forms hydrogen
sulphide which is toxic to marine life and has foul disagreable odour
No wholly suitable means for the treatment or disposal of this liquors is
known Neutralization treatments of these alkaline liquors such as with
sulphuric acid results in the formation of a highly turbid suspension and
evolution of large quantities of hydrogen sulphide gas Such acid treatment
does not improve the colour of these waste liquors (Sittig1973) It has now
been found that sulphur dyes waste liquors can be deodorized decolourized
neutralized and otherwise purified by treatment with an aqueous sulphurous
acid It is necessary that the liquor be mixed with sulphurous acid within a
limited time and that the ratio of the liquor to acid or the initial pH be controlled
within relatively close limits Under such conditions the sulphurous acid react
12
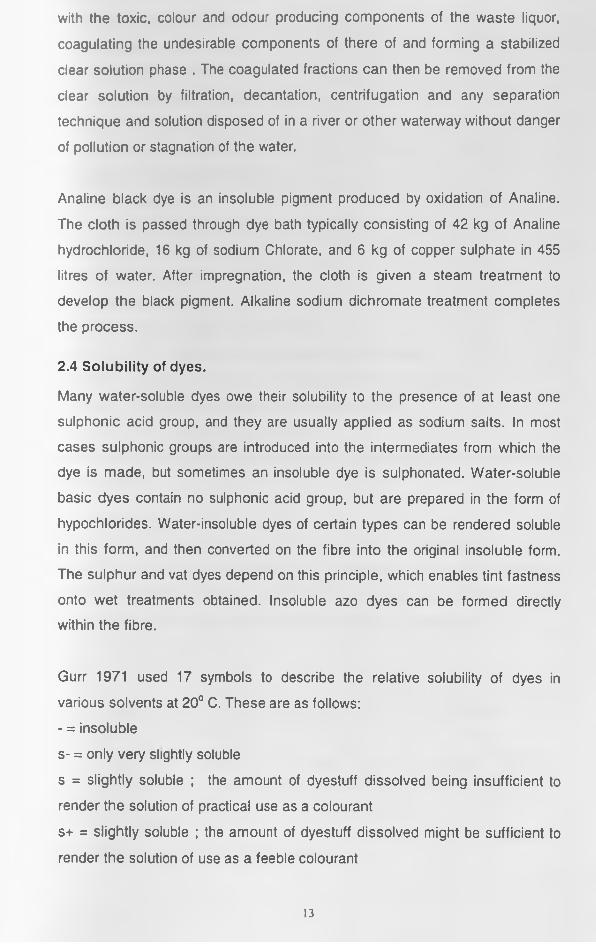
with the toxic colour and odour producing components of the waste liquor
coagulating the undesirable components of there of and forming a stabilized
clear solution phase The coagulated fractions can then be removed from the
clear solution by filtration decantation centrifugation and any separation
technique and solution disposed of in a river or other waterway without danger
of pollution or stagnation of the water
Analine black dye is an insoluble pigment produced by oxidation of Analine
The cloth is passed through dye bath typically consisting of 42 kg of Analine
hydrochloride 16 kg of sodium Chlorate and 6 kg of copper sulphate in 455
litres of water After impregnation the cloth is given a steam treatment to
develop the black pigment Alkaline sodium dichromate treatment completes
the process
24 Solubility of dyes
Many water-soluble dyes owe their solubility to the presence of at least one
sulphonic acid group and they are usually applied as sodium salts In most
cases sulphonic groups are introduced into the intermediates from which the
dye is made but sometimes an insoluble dye is sulphonated Water-soluble
basic dyes contain no sulphonic acid group but are prepared in the form of
hypochlorides Water-insoluble dyes of certain types can be rendered soluble
in this form and then converted on the fibre into the original insoluble form
The sulphur and vat dyes depend on this principle which enables tint fastness
onto wet treatments obtained Insoluble azo dyes can be formed directly
within the fibre
Gurr 1971 used 17 symbols to describe the relative solubility of dyes in
various solvents at 20deg C These are as follows
- = insoluble
s- = only very slightly soluble
s = slightly soluble the amount of dyestuff dissolved being insufficient to
render the solution of practical use as a colourant
s+ = slightly soluble the amount of dyestuff dissolved might be sufficient to
render the solution of use as a feeble colourant
13
P- = slightly more soluble than s+
P = slightly more soluble than p-
P+ = slightly more soluble than p
M- = moderately soluble (around 1 )
M = slightly more soluble than m-
M+ = slightly more soluble than m
R- = slightly more soluble than M+
R = readily soluble
R+ = very readily soluble (to the extent of around 5- 7 )
V- = slightly more soluble than R+
V = more soluble than V-
V+= more soluble than V
H = highly soluble (usually around 20 )
s- s s+ P- P P+ denote varying degrees of low solubility
M-t M M+ denote three different degrees of moderate solubility
R- R R+ denote varying degrees of good solubility
V- V V+ and H denote high solubility
In this regard Congo Red was found to have good solubility in water and was
classified as R-
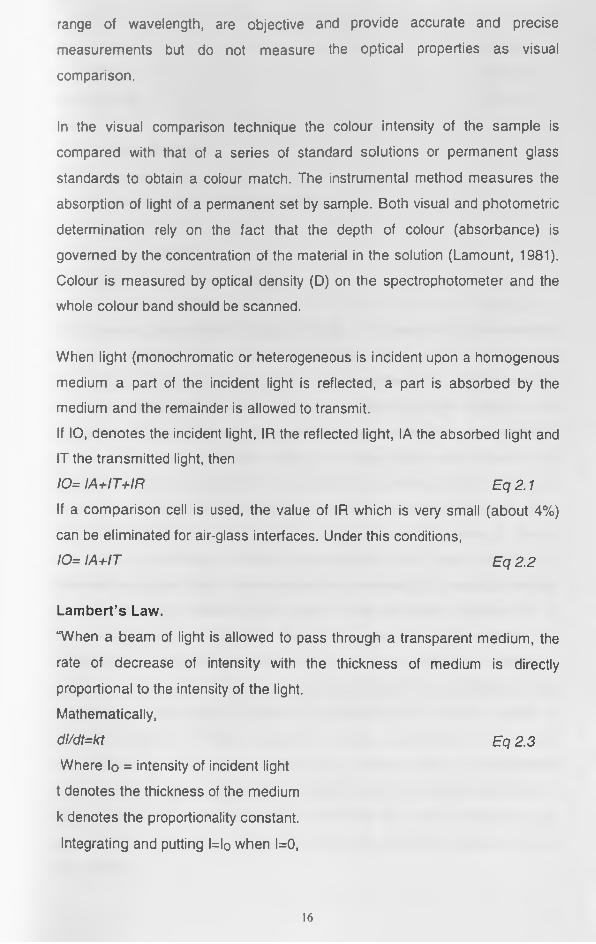
241 The Congo red dyeCongo red is an example of a diazo dye This is characterised by the
presence of two azo groups (-N=N-) as a chromophore This dye is made by
coupling a diazonium salt with an amine The structures are shown in Figures
22 and 23 Other characteristics of the dye are given in Table 22
n h 2
N = N-
Fig 22 Structure of Conge Fled dye Molecule
14
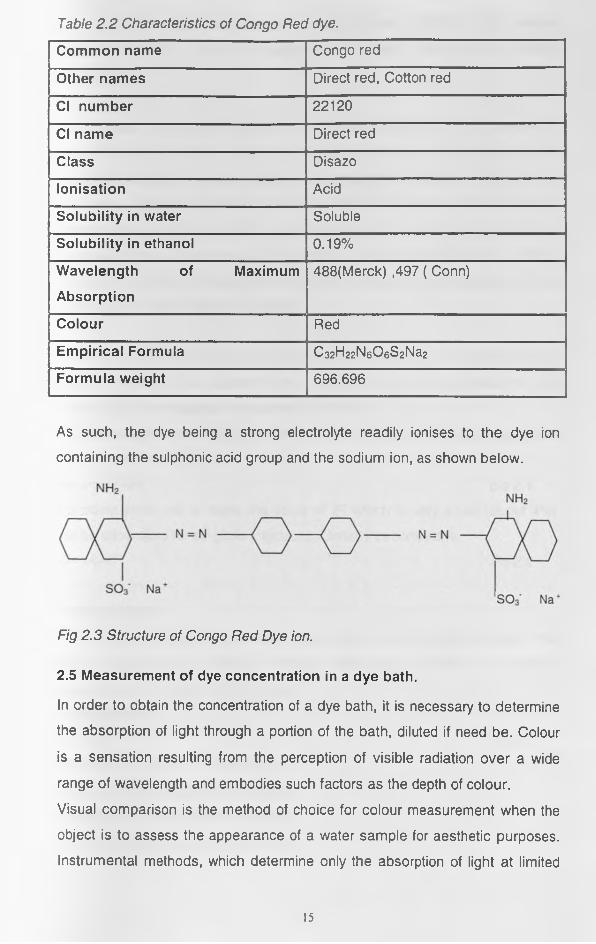
Table 22 Characteristics of Congo Red dye
Common name Congo red
Other names Direct red Cotton red
Cl number 22120
Cl name Direct red
Class Disazo
Ionisation Acid
Solubility in water Soluble
Solubility in ethanol 019
Wavelength of Maximum
Absorption
488(Merck) 497 ( Conn)
Colour Red
Empirical Formula C32H22N60 6S2Na2
Formula weight 696696
As such the dye being a strong electrolyte readily ionises to the dye ion
containing the sulphonic acid group and the sodium ion as shown below
Fig 23 Structure of Congo Red Dye ion
25 Measurement of dye concentration in a dye bath
In order to obtain the concentration of a dye bath it is necessary to determine
the absorption of light through a portion of the bath diluted if need be Colour
is a sensation resulting from the perception of visible radiation over a wide
range of wavelength and embodies such factors as the depth of colour
Visual comparison is the method of choice for colour measurement when the
object is to assess the appearance of a water sample for aesthetic purposes
Instrumental methods which determine only the absorption of light at limited
15
range of wavelength are objective and provide accurate and precise
measurements but do not measure the optical properties as visual
comparison
In the visual comparison technique the colour intensity of the sample is
compared with that of a series of standard solutions or permanent glass
standards to obtain a colour match The instrumental method measures the
absorption of light of a permanent set by sample Both visual and photometric
determination rely on the fact that the depth of colour (absorbance) is
governed by the concentration of the material in the solution (Lamount 1981)
Colour is measured by optical density (D) on the spectrophotometer and the
whole colour band should be scanned
When light (monochromatic or heterogeneous is incident upon a homogenous
medium a part of the incident light is reflected a part is absorbed by the
medium and the remainder is allowed to transmit
If IO denotes the incident light IR the reflected light IA the absorbed light and
IT the transmitted light then
IO= IA+IT+IR Eq 21
If a comparison cell is used the value of IR which is very small (about 4)
can be eliminated for air-glass interfaces Under this conditions
IO= IA+IT Eq 22
Lambertrsquos Law
ldquoWhen a beam of light is allowed to pass through a transparent medium the
rate of decrease of intensity with the thickness of medium is directly
proportional to the intensity of the light
Mathematically
dldt=kt Eq 23
Where lo = intensity of incident light
t denotes the thickness of the medium
k denotes the proportionality constant
Integrating and putting l=lo when l=0
16
we get
In Iolr = Kt
It = lo 6 kt
It= l0exp(-kcl)
Eq 24
Eq 25
Eq 26
Where
IT = the transmitted light
IO = the incident light
c = concentration of the absorbing species
= cell length
k = extinction coefficient
The optical density D is by definition
D = logio (IoIt) = 0434kcl Eq 27
D is therefore proportional to the cell length and dependent on wavelength
through coefficient k (Environmental Technology letters 1986) The first step
in photometric or spectrophotometric analysis involves the establishment of
working conditions and the preparation of a calibration curve relating to the
absorbance Spectrophotometric absorbance measurements are ordinarily
made at a wavelength corresponding to an absorption peak because the
change in absorbance per unit concentration is greatest at this point the
maximum sensitivity is thus realised In addition the absorption curve is often
flat in this region under these circumstances a good adherence to Beerrsquos
Law can be expected Finally measurements are less sensitive to
uncertainties arising from failure to reproduce precisely the wavelength setting
of the instrument Variables that influence the absorption spectrum of a
substance include the nature of the solvent the pH of the solution the
temperature high electrolyte concentration and the presence of interfering
substances The effect of these substances must be known conditions for the
analysis it is necessary to prepare a calibration curve from a series of
standard solutions These standards should approximate the overall
composition of the actual samples and should cover a reasonable
concentration range of the analyte It is safe to assume adherence to Beers
Law and use only a single standard to determine the molar absorptivity The
results of the analysis should never be based on a literature value for molar
absorptivity
17
26 Nature of Colour in Aquatic and Marine Environment
The observed colour in water is the result of light back scattered upward from
a water body after it has passed through the water to various depths and
undergone selective absorption The colour of light (ie wavelength) and the
turbidity of water determines the depth to which light penetrates in the water
system (Canadian Council of Ministers of Environment 2001) In pure water
light is highly absorbed in the infra-red region of the light spectrum and poorly
absorbed in the blue region Thus blue light is refracted reflected andor reshy
emitted back causing the visible colour of the water to be blue (Jerome 1994)
The colour of water is characterised as true or apparent True colour depends
on dissolve fraction in water which can include natural minerals such as ferric
hydroxide and dissolved substances such as humic or fulvic acid (Hongre and
Akesson 1996) Dyes (eg Acid blue toilet flush) wood preservatives
antisapstains and various other dissolved organic substances from
anthropogenic sources may also contribute to water colouration
(McCrum 1984 Brown 1987 Boegeding and Hites 1994) Colour also
depends on factors that affect the solubility and stability of the dissolved and
particulate fractions of water such as pH and temperature True Colour is
measured by comparator and calorimetric methods
Apparent colour is a function of dissolved and suspended material such as
organic plant debris phytoplanton and zooplanktons and inorganic
suspended sediments (Effler and Aver 1987 APHA 1992 Bennett and Drikas
1993) Apparent color is commonly estimated by light
transmittanceabsorbance through water
27 Effects of Colour in Aquatic and Marine Environment
Numerous studies have demonstrated a strong positive correlation between
primary production and water colour in fresh water (Henebry and Cairns 1984
Arvola 1986 llmarvia and Hutte 1989 Del Giorgio and Peters 1994) The
colour of water may affect algal species composition as photosynthetic
efficiency at various wavelengths differs markedly among algal groups
18
according to the amounts of accessory pigments accompanying chlorophyll a
( Atlas and Bannister 1980 Arvola 1986 Sheath et al1986 Vegas-Vilarrubia
1995)
Wetzel (1975) and Juarez (1987) in the Canadian Water Quality Guidelines
for protection of aquatic life Colour state that many invertebrate species
possess visual receptors and absorption spectrum peaks that correspond to
the spectral quality of their preferred habitats (Canadian Council of Ministers
of Environment 2001) Thus changes in the spectral quality of water
therefore could have profound effects on the behavour of some invertabrates
and fish species
Mierle and Ingram (1991) Nilsson and Hakanson 1992 Haine etal 1995
record that Mercury availability bioaccumulation and hence toxicity increases
as water colour increases The reason for this relationship in part is that
mercury brought from the surrounding environment is attached to coloured
substances(opcit)
28 ADSORPTION PHENOMENA
Adsorption is the accumulation of a solute to a surface or interface between
the solution and the adsorbent Adsorption processes generally yield surface
or interface concentrations of solute greater than those in the bulk phase The
driving forces for attainment of chemical equilibrium in the homogenous
phases relate to the reduction of the free energies of the bulk system
whereas the driving force for a surface reaction is a reduction in surface
energy (Weber et al 1991)
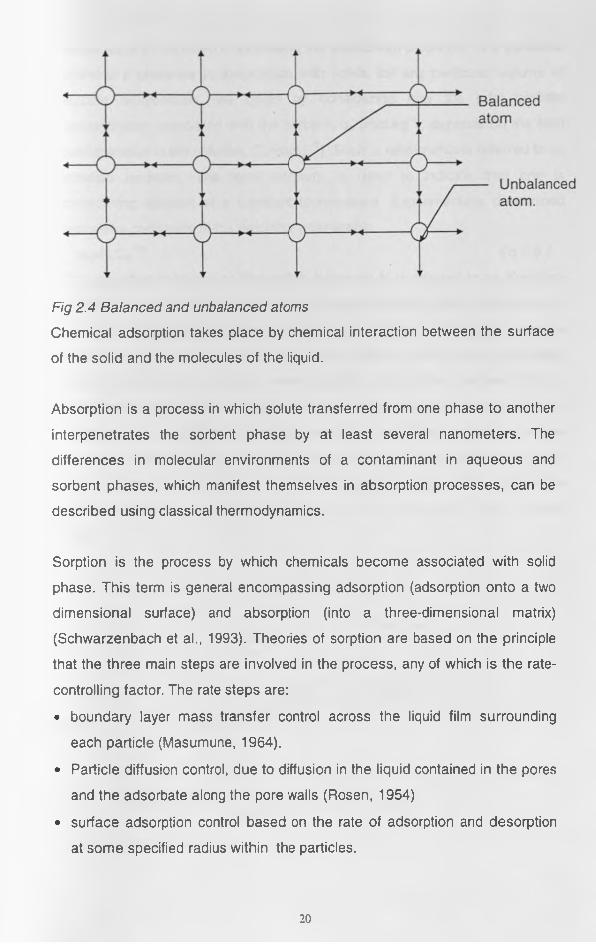
There are two types of adsorption Physical adsorption may be explained in
terms of the energy per unit area of the solid Molecules in the interior of any
solid are subjected to equal forces in all directions whereas molecules on the
surface of the solid are subjected to unbalanced forces as shown in Figure
24 Other molecules becoming attached to the surface can balance these
forces The attractive forces are relatively weak and are of Van der Waals
type
19
Fig 24 Balanced and unbalanced atoms
Chemical adsorption takes place by chemical interaction between the surface
of the solid and the molecules of the liquid
Absorption is a process in which solute transferred from one phase to another
interpenetrates the sorbent phase by at least several nanometers The
differences in molecular environments of a contaminant in aqueous and
sorbent phases which manifest themselves in absorption processes can be
described using classical thermodynamics
Sorption is the process by which chemicals become associated with solid
phase This term is general encompassing adsorption (adsorption onto a two
dimensional surface) and absorption (into a three-dimensional matrix)
(Schwarzenbach et al 1993) Theories of sorption are based on the principle
that the three main steps are involved in the process any of which is the rateshy
controlling factor The rate steps are
bull boundary layer mass transfer control across the liquid film surrounding
each particle (Masumune 1964)
bull Particle diffusion control due to diffusion in the liquid contained in the pores
and the adsorbate along the pore walls (Rosen 1954)
bull surface adsorption control based on the rate of adsorption and desorption
at some specified radius within the particles
20
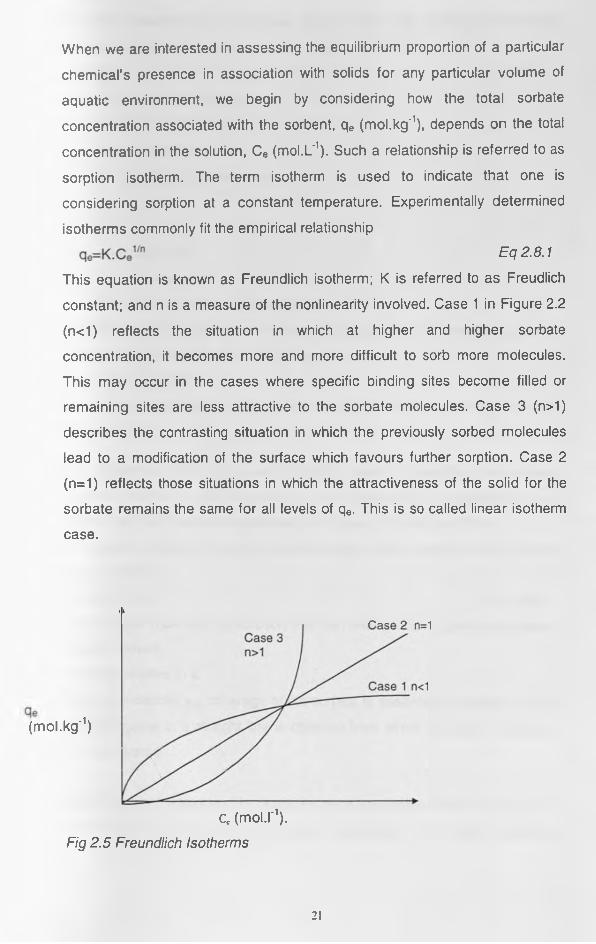
When we are interested in assessing the equilibrium proportion of a particular
chemicalrsquos presence in association with solids for any particular volume of
aquatic environment we begin by considering how the total sorbate
concentration associated with the sorbent qe (molkg1) depends on the total
concentration in the solution Ce (molL1) Such a relationship is referred to as
sorption isotherm The term isotherm is used to indicate that one is
considering sorption at a constant temperature Experimentally determined
isotherms commonly fit the empirical relationship
This equation is known as Freundlich isotherm K is referred to as Freudlich
constant and n is a measure of the nonlinearity involved Case 1 in Figure 22
(nlt1) reflects the situation in which at higher and higher sorbate
concentration it becomes more and more difficult to sorb more molecules
This may occur in the cases where specific binding sites become filled or
remaining sites are less attractive to the sorbate molecules Case 3 (ngt1)
describes the contrasting situation in which the previously sorbed molecules
lead to a modification of the surface which favours further sorption Case 2
(n=1) reflects those situations in which the attractiveness of the solid for the
sorbate remains the same for all levels of qe This is so called linear isotherm
case
Eq 281
i iCase 2 n=1
(molkg1)
cc (moll1)
Fig 25 Freundlich Isotherms
21
The rate of adsorption of a molecule onto a surface can be expressed in the
same manner as any kinetic expression ie
Rads = kC Eq 282
Where Rads -rate of adsorption
x- Kinetic order
k - rate constant
C - gas phase concentration
or
Rads = k rsquoP Eq 283
Where x - kinetic order
krsquo - rate constant
P - partial pressure of the molecule
If the rate constant in either of the above expressions in an Arrhenius form
then we obtain kinetic equation of the form
Rads = ACexp(-EaRT) Eq 284
Where Ea is the activation energy for adsorption and A the pre-exponential
(frequency) factor
Other equations which are used frequently used in describing adsorption
isotherms and which can be derived from fundamental considerations are
Langmuir and BET isotherm developed by Bruneur Emmett and Teller
The Langmuir isotherm is used to describe single layer adsorption and can be
written as follows
Cy =aym +cym Eq 285
ym -represents maximum adsorption that can take place in grams adsorbate
per gram sorbent
C - is large relative to a
When y approaches ym coverage of the surface is essentially complete If Cy
is plotted against c a straight line is obtained from which constants a and ym
can be evaluated
The BET type of adsorption is generally more applicable than the Langmuir
isotherm and it corresponds to multi-layer adsorption The model assumes
22
that a number of layers of adsorbate accumulate at the surface and that the
Langmuir isotherm applies to each layer It takes the form
Ce(Cle)[1 CsCe)]=1BQmax+(B-1 )BQmax)(CeCs) EC|286
Where Qmax represents maximum adsorbate per mass of adsorbent Cs is
saturation concentration and B is a constant
23
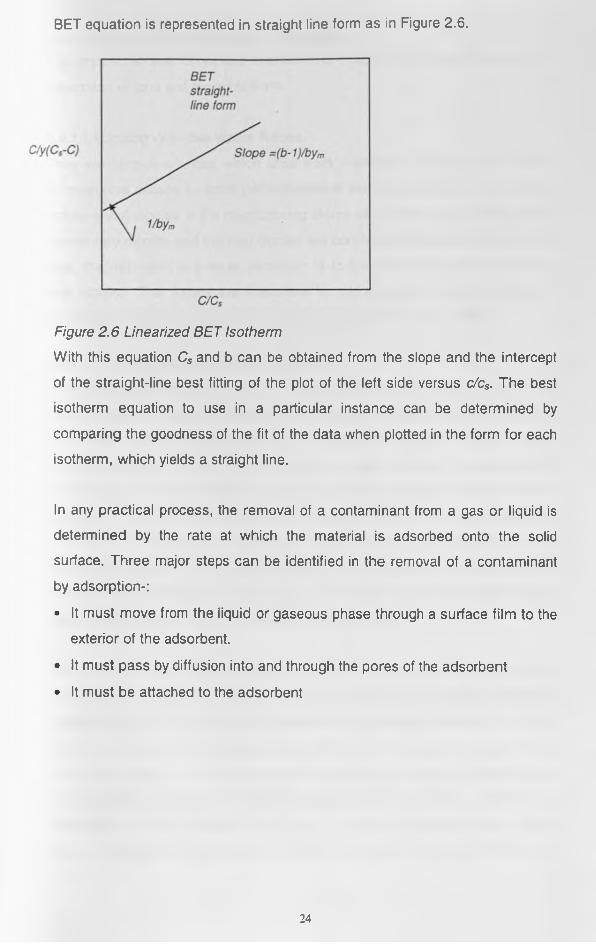
BET equation is represented in straight line form as in Figure 26
Figure 26 Linearized BET Isotherm
With this equation Cs and b can be obtained from the slope and the intercept
of the straight-line best fitting of the plot of the left side versus ccs The best
isotherm equation to use in a particular instance can be determined by
comparing the goodness of the fit of the data when plotted in the form for each
isotherm which yields a straight line
In any practical process the removal of a contaminant from a gas or liquid is
determined by the rate at which the material is adsorbed onto the solid
surface Three major steps can be identified in the removal of a contaminant
by adsorption-
bull It must move from the liquid or gaseous phase through a surface film to the
exterior of the adsorbent
bull It must pass by diffusion into and through the pores of the adsorbent
bull It must be attached to the adsorbent
24
281 Forces and Mechanisms of adsorptionThe physiochemical forces and mechanisms thought to be responsible for the
adsorption of ions and molecules are-
2811 London -Van der Waals forces
They are attractive forces which arise from momentary dipoles about atoms
or molecules caused by small perturbations of electronic motions The dipoles
induce small dipoles in the neighbouring atoms of opposite sign Although the
momentary dipoles and induced dipoles are constantly changing positions and
sign the net result is a weak attraction (4 to 8 kJ mol) for small molecules
and atoms) The forces are important in adsorption of organics and are
generally attributed to non-ideal behaviour in gases( Roy et al 1992)
2812 Coulombic-electrostatic-chemical
An electrostatic force results from a charged surface due to substitution in the
mineral lattice (permanent charge) or protonation of surface oxygen and OH
group (pH dependent charge) and an oppositely charged species which
maintains electro-neutrality of the surface In layer silicates substitution of
octahedrally or tetrahedrally coordinated cations by cations of lower valence
results in a net negative charge This excess charge can bring about the
formation of a diffuse layer of positively charged atoms or molecules about the
colloid the density of this layer is greater at the surface and the decreases
exponentially to the level of bulk solution This type of reaction is important in
adsorption of inorganic and ionized organic molecules
When the adsorbent and the adsorbate bear a charge ie both are ionised
then attractive forces are inversely related to the distance between the charge
centres Dyes may be anionic or cationic and adsorbing substrates such as
proteins carbohydrates and polyamides may be charged also Even if the
adsorbent bears no formal charge before adsorption of a dye ion the process
of adsorption produces a surface charge and the surface potential is
determined by the adsorbed dye ions Coloumbic interactions can either
favour or disfavour dye adsorption so that they may be regarded as binding or
25
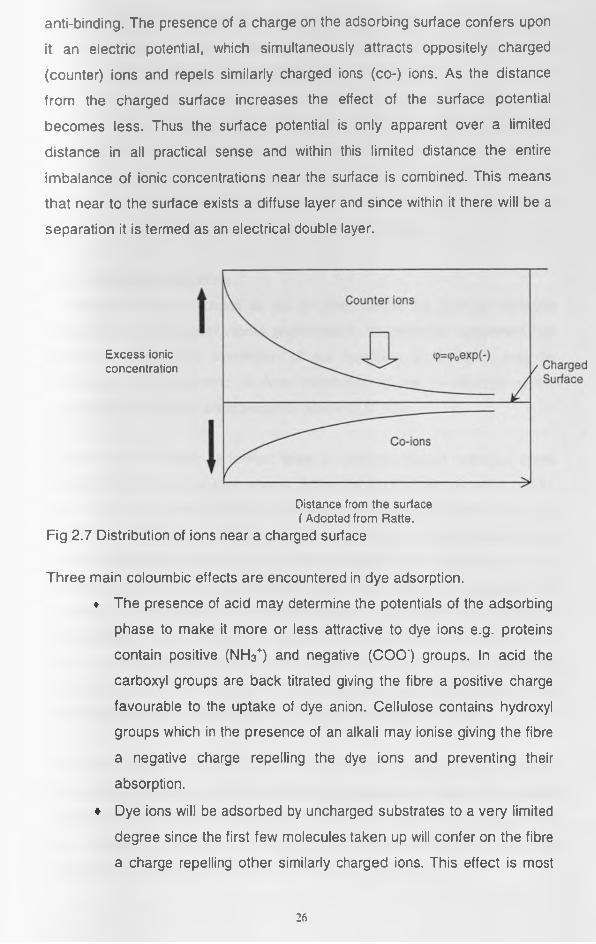
anti-binding The presence of a charge on the adsorbing surface confers upon
it an electric potential which simultaneously attracts oppositely charged
(counter) ions and repels similarly charged ions (co-) ions As the distance
from the charged surface increases the effect of the surface potential
becomes less Thus the surface potential is only apparent over a limited
distance in all practical sense and within this limited distance the entire
imbalance of ionic concentrations near the surface is combined This means
that near to the surface exists a diffuse layer and since within it there will be a
separation it is termed as an electrical double layer
Excess ionic concentration
Distance from the surface ( AdoDted from Ratte
Fig 27 Distribution of ions near a charged surface
Three main coloumbic effects are encountered in dye adsorption
diams The presence of acid may determine the potentials of the adsorbing
phase to make it more or less attractive to dye ions eg proteins
contain positive (NH3+) and negative (COO) groups In acid the
carboxyl groups are back titrated giving the fibre a positive charge
favourable to the uptake of dye anion Cellulose contains hydroxyl
groups which in the presence of an alkali may ionise giving the fibre
a negative charge repelling the dye ions and preventing their
absorption
diams Dye ions will be adsorbed by uncharged substrates to a very limited
degree since the first few molecules taken up will confer on the fibre
a charge repelling other similarly charged ions This effect is most
26
marked in relatively hydrophobic fibres since the volume of water
taken up broadly corresponds to the double layer volume and when
this is small the charge effects will be concentrated
diams Dye ions will be taken up without hindrance by a substrate of
opposite charge but in doing so they will reduce the potential of the
substrate eventually to zero when the adsorbed ion concentration
equals that of fixed charges Since further absorption will meet
constraints mentioned above the substrate may appear to be
saturated with dye ion at this point (Ratte 1974)
2813 Hydrogen Bonding
A hydrogen atom is bonded to two or more atoms the bond is generally
conceived as an induced dipole phenomenon No universal agreement has
been reached on the description of the hydrogen bond but it may be
considered as asymmetric electron distribution of the 1s electron of the
hydrogen atom by very electronegative atoms (FO C l)
A hydrogen bond may be formed when a covalently bound hydrogen exists
between two electronegative atoms Since the appropriate groups eg OH
NHR CF3 are fairly common in dye molecules and substrates it is not
surprising that hydrogen bonding should be postulated as a potential binding
force for dyes in aggregates and with substrates The hydrogen bond is
relatively weak one the bond energy lying in the range 2-10 Kcalmole Its
formation involves also low activation energy The strength of a hydrogen
bond depends upon the Electro-negativity of the bound atoms so that fluorine
forms much stronger hydrogen bonds than chlorine The hydrogen bonding
power of an atom can be enhanced by inductive effects and substitution so
that RNH3+contains a more powerful hydrogen bonding than R-NH2
When we consider a dye molecule and substrate in aqueous medium then if
there is any possibility of the two becoming associated through a hydrogen
bond then the relevant residues will be hydrogen bonded with water prior to
the anticipated association Hydrogen bonding between the dye and the
substrate will then require breaking the water hydrogen bonds
27
Alternatively hydrogen bonding groups in the substance may be associated
with one another (intra-molecular hydrogen bonding) so that involvement with
the dye molecule will again require two hydrogen bonds to be broken for each
one formed in the adsorption Where the two broken hydrogen bonds involves
water it is possible for the two water molecules freed to bond together and
with an intra-molecular hydrogen bond for the free group to bond with water
so that there is no net charge in the number of bonds
Another form of hydrogen bonding is one in which the delocalised electrons of
a conjugated ring system provide an electronegative centre for involvement in
a bond eg benzene will interact with proton donor substances eg methanol
to form a hydrogen bond
2814 Ligand exchange -anion penetration-coordination
Many atoms or molecules for coordinated complexes with ligands that range
in complexity from simple molecules to extensive chelate complexes The
coordinated complexes may carry a net negative charge that may be localized
on some part of the complex These complexes may inturn be bonded to the
surfaces by hydrogen bonding or by polyvalent cation linking the complex to a
charged surface The bonded coordinated complexes may be displaced by
other coordinated complexes that better satisfy electro-neutrality requirements
(ie are stronger complexing agents) while being restrand by steric limitations
The energy of ligand exchange reactions with inorganic ion ranges from 8 to
60 kJmol
2815 Chemisorption
In this adsorption process an actual chemical bond usually covalent is
formed between the molecules and surface atoms A molecule undergoing
chemisorption may loose its identity as the atoms are rearranged forming
new compounds at the demand of the unsatisfied valencies of the surface
atoms The enthalpy of chemisorption (h gt29KJMol) is much greater than for
physical adsorption -ligand exchange reactions are forms of chemisorption
28
2816 Dipole-dipole or orientation Energy
This interaction results from the attraction of a permanent dipole for another
dipole The resulting energy of attraction is less than 8 kJmole
2817 Induction or dipole induced dipole
This type of interaction results from the attractions of an induced dipole about
by either - a permanent dipole or a charged site or species The energy of
attraction is less than 8 kJmol
2818 Hydrophobic effect
The exact nature of adsorption mechanism is uncertain Some investigators
believe that hydrophobic adsorption is primarily an entropic driven mechanism
brought about by the destruction of the physical cavity occupied by the solute
in the solvent and from the partial loss of structured water molecules about
the solute ordered by Van der-waals forces (Horvath et al 1976 Sinanoglu
and Abdulnur 1965) Other researchers postulate that the hydrophobic effect
is the result of simple partitioning Non polar organic solutes tend to migrate
from the aqueous phase to hydrophobic surfaces on the adsorbent ( Dzombak
and Luthy 1984 Chiou et al 1979 1983 Griffin and Roy 1985)
282 Thermodynamics of adsorption EquilibraAdsorption equilibria can well be described in terms of thermodynamics
Accordingly at equilibrium in a system
fJs= Psdeg + RTInas Eq 287
Ri= ideg + RTInaf Eq 288
Where ps and pf are the chemical potentials of the adsorbate in the external
and adsorbent surfaces respectively as and at are the corresponding
activities psdeg and pdeg are the corresponding standard state chemical
potentials At equilibrium the chemical potentials in the two phases must be
equal so that
qsdeg - = -A pdeg = RTInafas Eq 289
29
The term -A pdeg represents the change in standard chemical potential or
standard molal free energy in the transfer from the external to the adsorbant
phase and is thus the affinity
The free energy per mole p is given by
fj= H - TAS= E + PV -TS Eq 290
Where
q = is the free energy per mole
H =is the enthalpy
T= is the Absolute temperature
AS = Change in Entropy
P = Partial Pressure
V =Volume
E in terna l energy
283 PROPERTIES OF WOOD AS AN ADSORBENTA great variety of alternative low cost materials like fly ash soil wood
chippings tyre cuttings coconut shell powder hair coal etc are being tried in
place of activated carbon for sorption of different pollutants like pesticides
detergents heavy metals dyes etc(Chu etal 1978 Emig 1973 Huang and
Liao 1970 Aga 1983 Mckay and Poots 1980 Michelson et al 1975)The
chemical and physical characteristics of sorbent materials as well as those of
sorbates vary widely
Wood industry bi-products such as bark and sawdusts have been widely used
for their property of metal adsorption and metal removal from contaminated
effluents Concerning the utilisation of sawdusts many researchers have
studied metal adsorption of materials from species such as red fir mango
lime pine ceda teak Japanese redpine and Japanese beech As regards
wood barks several species were studied in particular pine oak and spruce (
Fiset etal 2000)
2831 Hygroscopicity
rlygroscopicity is the property of wood to attract moisture from the
surrounding atmosphere and hold it in the form of liquid water or water
vapour This property originates from the chemical composition of wood
cellulose hemicelluloses pectins lignin and certain extractives are
30
hygroscopic substances (Tsoumis 1991) To understand the properties of
wood as an adsorbent it is first important to understand the mechanism of
moisture adsorption onto wood
2832 How moisture is held in wood
Moisture is found in wood in two forms as liquid water in cell walls and as
liquid andor vapour in cell cavities In saturated conditions there is only liquid
water The basic reason for moisture entering into the mass of wood is the
attraction of water molecules by the hydroxyls of its chemical constituents
mainly cellulose A monomolecular layer of water shown in Figure 28 is
formed and held by these hydroxyls with strong hydrogen bonds The
formation of this layer results in pushing apart chains of cellulose molecules in
the amorphous regions and between the chrystalites of microfibrils so the
wood starts to swell Under the effect of secondary attractive forces more
water molecules enters and form a polymolecular layer
I Gradual formation of monomolecular layer by breaking the hydrogen bonding between adjacent cellulose molecules
Fig 28 Formation of monomolecular and polymolecular water layers on wood
surface
An additional part may enter by capillarity condensation in the cell wall voids
and pit features ( pit membrane small pit mouths)
31
2833 Desorption and adsorption
Loss of moisture is called desorption and gain adsorption Desorption begins
by evaporation from an exposed surface of wood If the walls are saturated
evaporation of water from the cavities need little more energy than that
required to evaporate water from the free surface (Tsumois 1991) Reduced
relative vapour pressure in the atmosphere (lower than unity) represents an
attractive force holding water in the walls and depending on its magnitude
causing less desorption To replace desorbed water other water moves from
the interior to the surface of the wood
Adsorption is the process by which dry wood exposed to an atmosphere
containing water vapour is adsorbed through its surface At the beginning a
monomolecular layer is formed then polymolecular and if the relative
pressure in the atmosphere is high (close to unity) capillary condensation
may take place Movement of moisture from the exterior to the interior of the
wood is attained by diffusion When dry wood is immersed in water there is
active movement of water through cell cavities Long immersion results in
near saturation of cavities
2834 Density
The density and specific gravity of wood are influenced by moisture content
structure extractives and chemical composition There are certain conditions
under which wood attains constant weight and volume and these are oven-
dry weight (weight at zero moisture content) oven-dry volume and fully
swollen volume
Density is determined by measuring mass (weight) and volume or by other
methods Dry (oven dry) mass is measured by placing the chosen specimen
of wood in an oven at 103degC until its weight becomes constant 12-48 hours
are needed for specimen about 100g in weight volume is determined by
measuring dimensions if the shape permits
32
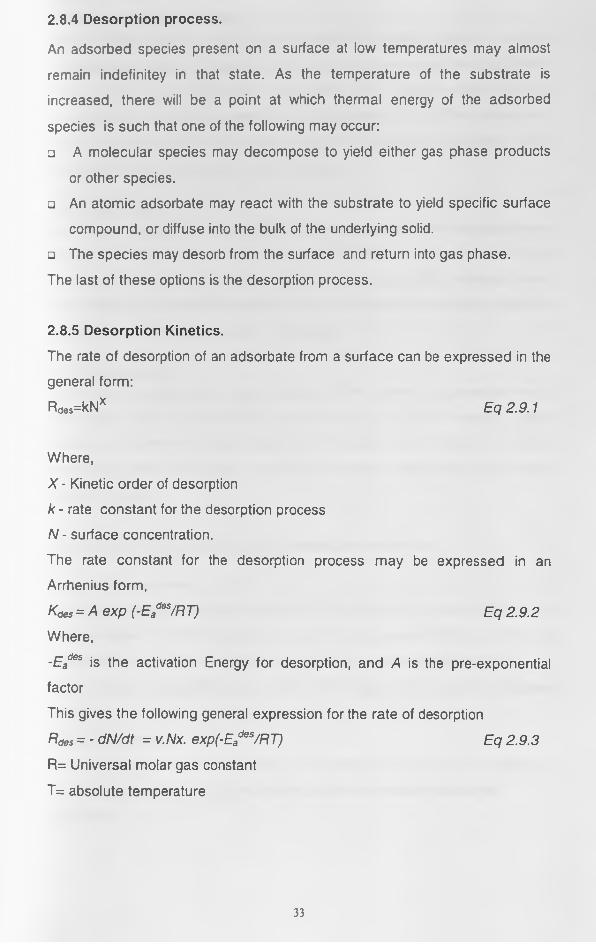
284 Desorption process
An adsorbed species present on a surface at low temperatures may almost
remain indefinitey in that state As the temperature of the substrate is
increased there will be a point at which thermal energy of the adsorbed
species is such that one of the following may occur
o A molecular species may decompose to yield either gas phase products
or other species
An atomic adsorbate may react with the substrate to yield specific surface
compound or diffuse into the bulk of the underlying solid
The species may desorb from the surface and return into gas phase
The last of these options is the desorption process
285 Desorption Kinetics
The rate of desorption of an adsorbate from a surface can be expressed in the
general form
Rdes=kNx Eq 291
Where
X - Kinetic order of desorption
k - rate constant for the desorption process
N - surface concentration
The rate constant for the desorption process may be expressed in an
Arrhenius form
Kdes = A exp (-EadesRT) Eq 292
Where
-Eades is the activation Energy for desorption and A is the pre-exponential
factor
This gives the following general expression for the rate of desorption
Rdes = - dNdt = vNx exp(-EadesRT) Eq 293
R= Universal molar gas constant
T= absolute temperature
33
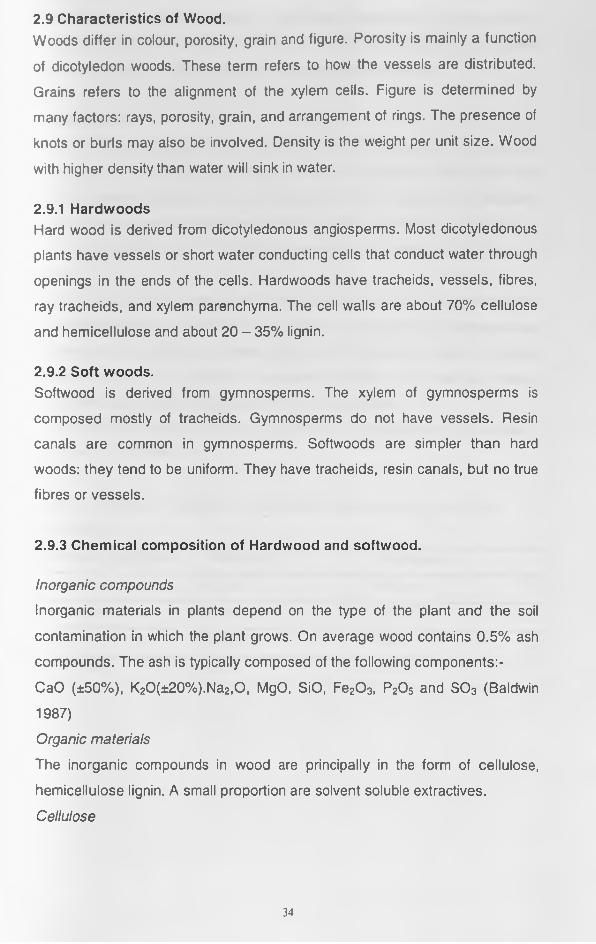
29 Characteristics of WoodWoods differ in colour porosity grain and figure Porosity is mainly a function
of dicotyledon woods These term refers to how the vessels are distributed
Grains refers to the alignment of the xylem cells Figure is determined by
many factors rays porosity grain and arrangement of rings The presence of
knots or burls may also be involved Density is the weight per unit size Wood
with higher density than water will sink in water
291 HardwoodsHard wood is derived from dicotyledonous angiosperms Most dicotyledonous
plants have vessels or short water conducting cells that conduct water through
openings in the ends of the cells Hardwoods have tracheids vessels fibres
ray tracheids and xylem parenchyma The cell walls are about 70 cellulose
and hemicellulose and about 20 - 35 lignin
292 Soft woodsSoftwood is derived from gymnosperms The xylem of gymnosperms is
composed mostly of tracheids Gymnosperms do not have vessels Resin
canals are common in gymnosperms Softwoods are simpler than hard
woods they tend to be uniform They have tracheids resin canals but no true
fibres or vessels
293 Chemical composition of Hardwood and softwood
Inorganic compounds
Inorganic materials in plants depend on the type of the plant and the soil
contamination in which the plant grows On average wood contains 05 ash
compounds The ash is typically composed of the following components-
CaO (plusmn50) K2O(plusmn20)Na2O MgO SiO Fe20 3 P2Os and SO3 (Baldwin
1987)
Organic materials
The inorganic compounds in wood are principally in the form of cellulose
hemicellulose lignin A small proportion are solvent soluble extractives
Cellulose
34
It is composed of D-glucopyranose units linked linearly with a b-(1-4) links It
is the main component of wood Principal component of cellulose is a polymer
of glucose (about 10000) glucose units per cellulose molecule
Hemicellulose
Acetyl-4-0-methylglucoronoxylan forms the main hemicellulose of hardwood
Glucomannan forms the main hemucellulose of softwoods Hardwoods also
have a greater proportion of methoxyl group than softwoods In addition
hemicellulose contain several molecules of water [C6(H20)5]n or [C5(H20)4]n
occurs in shorter chain of 150- 200 glucose units as compared to cellulose
Lignin
It has an approximate analysis of C10H11O2 for both softwood and hardwoods
(Shafizadeh1981) In addition to the same compounds as hemicellulose
hardwoods have syringl propane units and softwoods contain guaiacyl
propane units It is a phenolic compound (benzene with attached methyl
propyl and hydroxyl groups) tightly bound to the cellulose
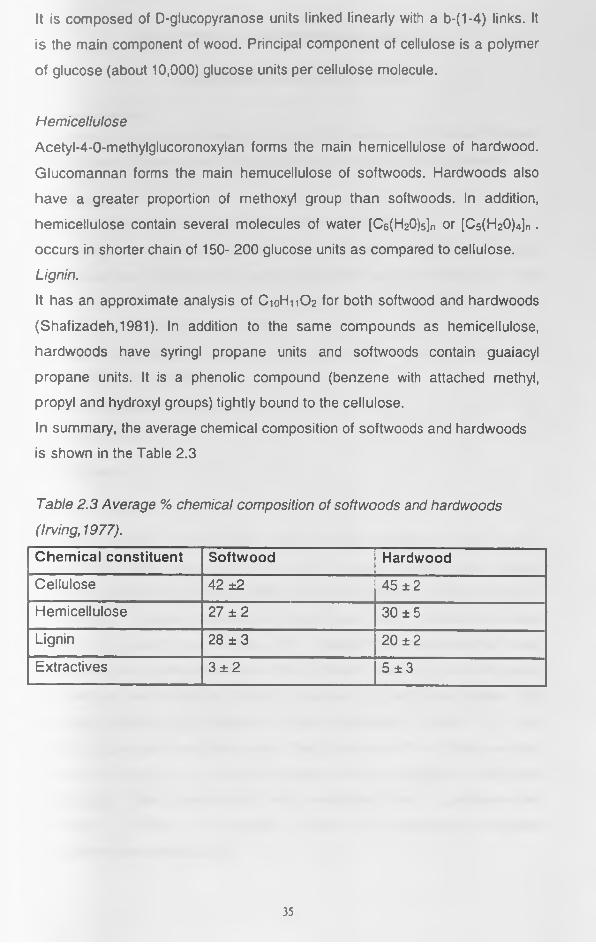
In summary the average chemical composition of softwoods and hardwoods
is shown in the Table 23
Table 23 Average chemical composition of softwoods and hardwoods
(Irving 1977)
Chemical constituent Softwood Hardwood
Cellulose 42 plusmn2 45 plusmn2
Hemicellulose 27 plusmn 2 30 plusmn5
Lignin 28 plusmn 3 20 plusmn2
Extractives 3 plusmn 2 5 plusmn 3
35
CHAPTER 3 EXPERIMENTAL SETUP
MATERIALS AND METHODS
31 IntroductionTo assess the potential of sawdust in dye colour removal from water different
materials and equipment were used at different stages of experimentation
32 MaterialsThe consumable materials used in the research included
bull Hardwood and Softwood Sawdust from 4 different tree species namely-
Cypress and Pine for the softwoods Meru oak and Campor for the
Hardwoods The sawdust was obtained from Wood Makers Limited
located in Nairobirsquos Industrial area
bull Congo Red dye powder obtained from Industrial Chemical supplier located
in Nairobirsquos Industrial Area
bull 55mm Whatman Filter papers
bull Distilled water
33 Methods
331 Introduction
The performance of sawdust as an adsorbent was assessed on the basis of
removal of a direct disazo dye (Congo red) The dye is widely used in direct
dyeing of textile fabrics such as cotton paper dyeing and in staining biological
specimens in various microbiological techniques Batch experiments were
conducted in which dye samples with predetermined concentration were
placed in 350ml-plastic tumblers and then different masses of sawdust added
The mixture was thoroughly mixed by means of a continuous shaker On
reaching equilibrium the mixture was then separated by means of a filter
funnel using a pre-soaked filter paper The absorbance of the filtrate was then
obtained by means of a spectrophotometer at the wavelength of maximum
absorbance Final concentration was determined from a predetermined
equation of Congo red calibration showing the relationship between
absorbance and concentration
36
332 Sample Preparation
3321 Congo red dye
The dye that used in this research was obtained from Industrial Chemical
distributors located in Nairobirsquos Industrial area A stock solution of the dye
with a concentration of 1000mgl was prepared by dissolving 1 g of the dye in
1000cm3 of distilled water From this stock solution different concentrations
were prepared by diluting required volumes with tap water
3322 Sawdust
Sawdust used in this research was obtained from a local timber dealer Wood
Makers Limited located in Nairobirsquos Industrial area Different types of sawdust
species were obtained These included-cypress camphor Meru Oak and
African pine These tree species were chosen since they were the most used
hard and softwood in timber factories around Nairobi The sawdust was oven-
dried for 24 hrs The other main preparation carried out for the sawdust
involved sieving using different sieve sizes ranging from BS sieve No 14 to
No 100 This was meant to obtain different particle sizes for the determination
of the effect of particle sizes on the contact time and overall dye removal
Also included in this study was the determination of cellulose lignin and
Hemicellulose contents of the different sawdust species This was done using
the Van soest procedure In addition the specific gravities were determined
333 Experimental Procedure
3331 Specific gravity of wood
To obtain the specific gravity of wood samples of oven dry timber specimen
measuring 100 mm long were used The samples were weighed (M) and then
immersed in a cylinder of water (Vi) by pushing them below the water surface
with a piece of wire The new volume of water (V2) was taken quickly as
timber easily absorbs moisture Two samples of each species were tested for
each tree species and the average specific gravity obtained The specific
gravity was then obtained as follows
Gs= M(VrV)) Eq 31
The values obtained are recorded in Table 41
37
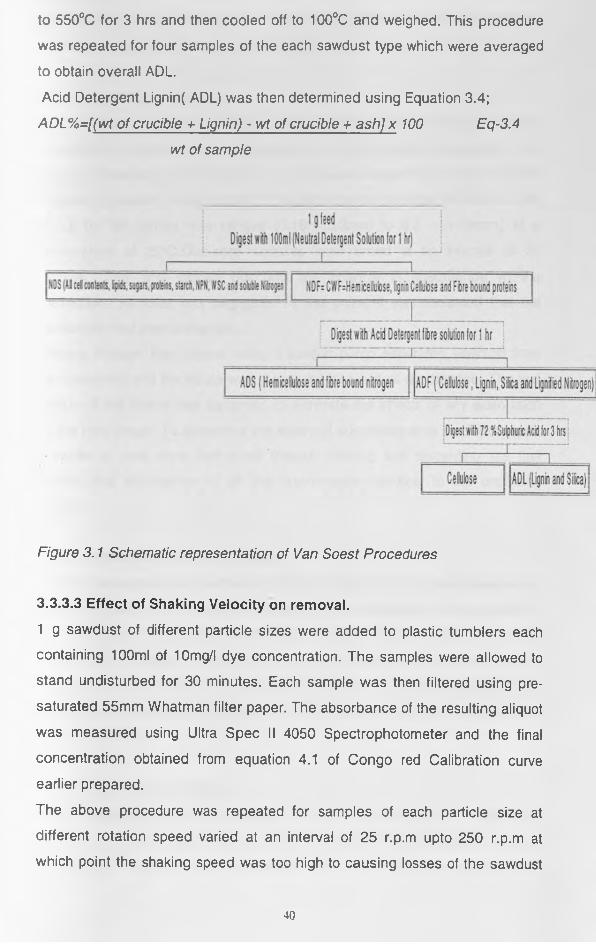
3332 Determination of Chemical composition of Sawdust
Wood can be analysed by breaking it down into structural components (called
Proximate Analysis) or into chemical elements (Ultimate Analysis) In carrying
out this research Van Soest procedure which is a form of proximate analysis
was used (Van Soest and Goering 1994)
a) Determination of Cellulose content (Neutral-Detergent Method)
The Neutral Detergent procedure for cell-wall was used to determine the
cellulose content in the different sawdust species
1 g of air-dried sample was weighed into a beaker of the refluxing apparatus
and 100ml cold neutral detergent solution followed by 2ml
decahydronaphthalene and 5g sodium sulphite were added in that order with
a calibrated scoop The mixture was heated to boiling in 5 to 10 minutes with
the heat being reduced at the onset of boiling to avoid foaming The boiling
was adjusted to an even level and reflux continued for 60 minutes timed from
onset of boiling
Tared Gooch crucibles were placed on filter manifold The beaker was swirled
to suspend the solids and content used to fill the crucibles The sample was
rinsed into crucible with minimum of hot (90-100degC) water Vacuum was
removed and mat broken up The crucible was then filled with hot water The
liquid was filtered and washing procedure repeated In a similar manner the
content was washed twice with acetone and sucked dry The crucibles were
dried at 100degC for 8 hrs and afterwards weighed This procedure was
repeated for four samples of the each sawdust type Which were averaged to
obtain overall NDF
Neutral Detergent Fibre (NDF) was determined using Equation 32-
NDF= Cell Wall Content(CWC) = Hemicellulose Lignin Cutin Cellulose
Silica and firbre bound nitrogen
(NDF) =[(wt of crucible + cell contents) - wt of crucible x 100 Eq-32
wt of sample
38
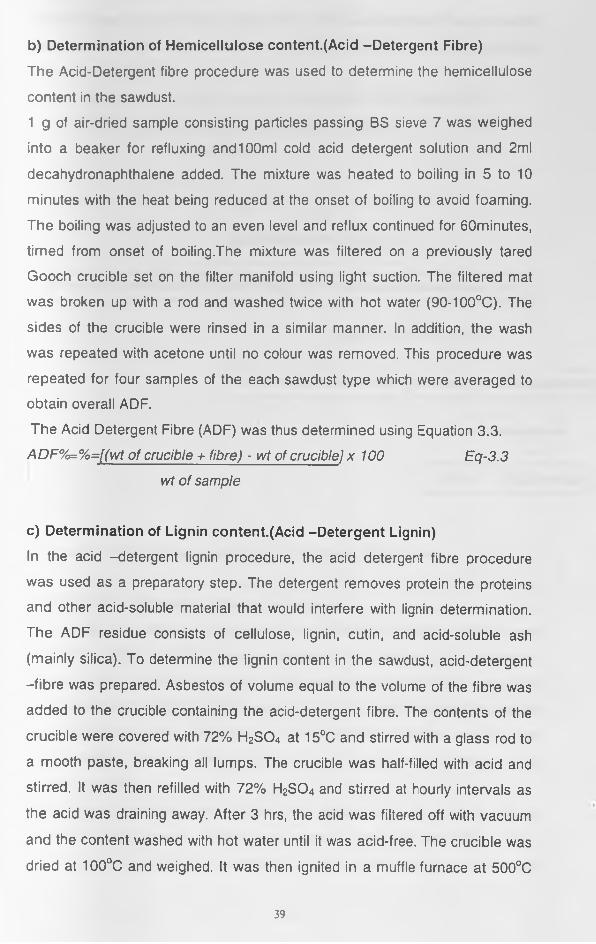
b) Determination of Hemicellulose content(Acid -Detergent Fibre)
The Acid-Detergent fibre procedure was used to determine the hemicellulose
content in the sawdust
1 g of air-dried sample consisting particles passing BS sieve 7 was weighed
into a beaker for refluxing andlOOml cold acid detergent solution and 2ml
decahydronaphthalene added The mixture was heated to boiling in 5 to 10
minutes with the heat being reduced at the onset of boiling to avoid foaming
The boiling was adjusted to an even level and reflux continued for 60minutes
timed from onset of boilingThe mixture was filtered on a previously tared
Gooch crucible set on the filter manifold using light suction The filtered mat
was broken up with a rod and washed twice with hot water (90-100degC) The
sides of the crucible were rinsed in a similar manner In addition the wash
was repeated with acetone until no colour was removed This procedure was
repeated for four samples of the each sawdust type which were averaged to
obtain overall ADF
The Acid Detergent Fibre (ADF) was thus determined using Equation 33
ADF==[(wt of crucible + fibre) - wt of crucible] x 100 Eq-33
wt of sample
c) Determination of Lignin content(Acid -Detergent Lignin)
In the acid -detergent lignin procedure the acid detergent fibre procedure
was used as a preparatory step The detergent removes protein the proteins
and other acid-soluble material that would interfere with lignin determination
The ADF residue consists of cellulose lignin cutin and acid-soluble ash
(mainly silica) To determine the lignin content in the sawdust acid-detergent
-fibre was prepared Asbestos of volume equal to the volume of the fibre was
added to the crucible containing the acid-detergent fibre The contents of the
crucible were covered with 72 H2S 04 at 15degC and stirred with a glass rod to
a mooth paste breaking all lumps The crucible was half-filled with acid and
stirred It was then refilled with 72 H2S 04 and stirred at hourly intervals as
the acid was draining away After 3 hrs the acid was filtered off with vacuum
and the content washed with hot water until it was acid-free The crucible was
dried at 100degC and weighed It was then ignited in a muffle furnace at 500degC
39
to 550degC for 3 hrs and then cooled off to 100degC and weighed This procedure
was repeated for four samples of the each sawdust type which were averaged
to obtain overall ADL
Acid Detergent Lignin( ADL) was then determined using Equation 34
ADL=[(wt of crucible + Lignin) - wt of crucible + ash] x 100 Eq-34
wt of sample
Figure 31 Schematic representation of Van Soest Procedures
3333 Effect of Shaking Velocity on removal
1 g sawdust of different particle sizes were added to plastic tumblers each
containing 100ml of 10mgl dye concentration The samples were allowed to
stand undisturbed for 30 minutes Each sample was then filtered using preshy
saturated 55mm Whatman filter paper The absorbance of the resulting aliquot
was measured using Ultra Spec II 4050 Spectrophotometer and the final
concentration obtained from equation 41 of Congo red Calibration curve
earlier prepared
The above procedure was repeated for samples of each particle size at
different rotation speed varied at an interval of 25 rpm upto 250 rpm at
which point the shaking speed was too high to causing losses of the sawdust
40
and the dye through spillage Removals were plotted against the speed of
revolution as shown in Table 43 and Fig 43
3334 Equilibrium time
Synthetic water samples (100 ml) of 10mgl concentration of Congo Red dye
were taken in separate set of containers and 1 g of sawdust was added The
sample containers were shaken on a continuous shaker at 150 rpm a speed
obtained in section 3433 above The experiments were carried out at a pH
of 89 for all particle size ranges (015 - 03mm to 06 - 118mm) at a
temperature of 22degCDuplicate samples were timed at an interval of 30
minutes This was carried out until the change in absorbance in the
subsequent samples was negligible At this point it was assumed that the
equilibrium had been achieved
Filtering through filter papers using a suction pump separated sawdust from
the containers and the filtrate was measured for residual absorbance The first
portion of the filtrate was discarded to eliminate the effects of any adsorption
on the filter paper To determine the extent of adsorption onto the filter paper
a series of runs were performed through filtering and discarding the first
portion the absorbance of all the results were identical to the unfiltered
sample
3335 Effect of pH on dye removal
For the investigation of the effect of pH a pH range of 5 to 12 was selected A
sample solution of 10 mgl was prepared 100 ml samples were adjusted to
the required pH using either 05 N NaOH to raise the pH or 05 N H2S 04 to
lower the pH 1 gram of sawdust (015 - 03mm) then added to the solutions
The samples were shaken at a speed of 150 rpm for 90 minutes (equilibrium
time for the particles) The samples were filtered and the concentration of
each determined
3336 Equilibrium Studies
Batch experiments were conducted for the development of adsorption
isotherms using the particle sizes of 015 -03 mm which showed best removal
and shorter equilibrium time (reported in the rate studies) Containers of
41
300ml capacities were used in all the experiments Duplicate 100ml samples
of 5 10 2030 40 50 and 60mgI concentration were taken in different
containers and 1 grams of each type of sawdust were added to it The sample
containers were shaken on the continuous shaker at 150 rpm After an
equilibrium time of 90 minutes the samples were withdrawn from the shaker
and the adsorbent from the sample containers was separated by filtration The
filtrate was then measured for the dye concentration Dosages of 10 20 30
5 and 6 grams of Sawdust were used A room temperature of 22degC and
constant pH of 89 were maintained in all the experiments
42
Chapter 4
40 Results and Discussion
41 Physical and Chemical properties of SawdustThe laboratory tests were carried out to establish the characteristics of the 4
different sawdusts The results shown in Table 41 below summarise
chemical and physical properties of the sawdusts studied The percentage
composition of cellulose was found to be within the range shown in Table 23
for softwood Hard woods had values higher than those in the table Other
lignin content was lower in the test samples both for softwood and hardwood
while hemicellulose content was within range Extractives were high in both
sawdust species tested
Table 41 Chemical and Physical properties of sawdust
Property composition for each Sawdust Species
Pine Cypress Camphor Meru Oak
Cellulose 4194 4157 5106 4973
Lignin 1697 1752 1886 1600
Hemicellulose 3137 3182 2028 283
Others 972 909 98 597
Pine Cypress Camphor Meru Oak
Specific
Gravity
0496 0472 051 0565
Figure 41 shows the major chemical components of the different sawdust
species used in the research Camphor and Meru oak were found to have
higher amount of cellulose than Cypress and Pine this is inherent of
hardwoods which have been reported elsewhere in literature by Irving (1977)
43
Fig 41 Chemical properties of Sawdust
Average chemical composititon of sawdust
Average cellulose
m Average Hemicellulose
Average Lignin
Average Others
Tree Species
On the other hand softwoods were found to have amount of hemicellulose
than hardwood while both species were found to have varying amount
extractives and other components Irving (1977) and Shafizadeh (1981) have
recorded similar values for both hard woods and softwoods Specific gravity
varied between 0473-0496 for the softwoods and 051 - 0565 for the
hardwoods
42 Variation of Absorbance with Dye Concentration
To obtain the final dye concentration after adsorption has taken place It is
necessary to have a calibration curveTable 42 shows absorbance values for
different dye concentration
Concentration MeanAbsorbance
0 01 00422 00665 016210 032220 060630 088540 120050 136360 1587
Table 42 Concentration Versus Absorbance
44
Fig 42 below shows the relationship between absorbance and concentration
of the Congo Red dye It was observed that in tap water a linear relationship
fitted to the data with correlation coefficient R2 value being 09938 This
indicated that absorbance varies linearly with concentration for a
concentration in the range of 1mgl to 60 mgl beyond this concentration up to
a concentration of 500mgl which was investigated a high degree of nonshy
linearity was observed this could have been as a result of increase in
concentration which diminished the distance between the dye molecule This
is believed to have caused the non-linear behaviuor of the curve (shown in
Appendix A2) This phenomenon thus restricted the concentrations used in
this research to 5mgl and 60mgl
Thus the equation of the treadline was adopted as the calibration curve to
obtain final concentration of the samples used in the experiment by
extrapolation
This took the form
Y=0278X Eq 41
Where X is the dye concentration
Vis the absorbance (OD-optical density)
Fig 42 Congo Red Calibration curve
45
Congo Red Calibration Curve
Concentration (mgl)
y = 00278X R2 = 09938
diams Absorbance
------Linear (Absorbance)
43 Variation of Absorbance w ith Wavelength
Wavelength of maximum absorption is an important parameter in any
spectrophotometric studies within both the visible and the ultra-violet ranges
For dyes it is the identification mark and acts as the fingerprint that
specifically identifies them
Figure 43 shows the relationship between the absorbance and wavelength for
Congo Red concentrations of 5 and10mgl Within the visible spectra (400nm
- 750nm) Congo red Dye was found to have a wavelength of maximum
absorption as 495nm This wavelength was used for all the measurements
made using the spectrophotometer This value is well in range with 497nm
obtained by Lillie (1990) and 488nm obtained by Bundavari (1990) Gurr
(1971) used a value of 487nm In addition Githere (MSc Thesis) used a value
of 500nm for Congo Red In light of this therefore wavelength of 495nm lies
well in range of the wavelengths used by other researcher dealing with Congo
red dye ie between (487 - 500nm) The slight variations could have arisen
as a result of solvent variations and different experimental conditions For the
same pH dye concentration only amplifies the absorption peak but does not
alter the wavelength of maximum absorption as shown by Figure 43
46
Table 43 Wavelength versus Absorbance
Wavelength (nm) Absorbance for
5mgl
Absorbance for
10m gl
400 0065 0117
410 007 0126
420 0078 0141
430 0088 016
440 0099 018
450 0111 0202
460 0123 0224
470 0136 0247
480 0149 0269
490 0159 0287
500 016 0289
510 0152 0275
520 0139 025
530 0118 0213
540 0094 0173
550 007 013
Variation of Absorbance with wavelength for Congo red dye
Figure 43 Variation of absorbance with wavelength
47
44 Effect of shaking on Dye removal
The effect of shaking velocity on removal was investigated It was observed
that removal increased steadily from 05mgg of dye at quiescent conditions of
0 rpm to a maximum of 091 mgg at 150 rpm for the composite sample
This was the the speed at which removals were best and beyond which point
a steady declined to 072 mgg at 250 rpm for all the particle sizes as shown
in Figure 43 below In this case therefore a speed of 150 rpm was adopted
for all the other investigations From other sources this speed had been used
by Alam etal (2000) in investigating the performance of low cost adsorbents
in the removal of herbicides from aquatic environment
E ffect of shaking v e lo c ity on dye rem oval
mdash 3 bull 425mm
mdashmdash 425 bull 525mm
mdash mdash 525 6mm mdash mdash A lisa e s
Figure 44 Effects of Shaking velocity on dye removal
45 Variation of Dye removal With Time (Equilibrium time)
Removal of dye with time was studied for different particle sizes This was to
determine equilibrium time and particle size with optimal dye removal
Results are shown in Table 45
48
Table 45 Removal Versus Time
Time Dye sorbed per gram of sawdust (mgg)
(min) 015-03mm 03 - 0425mm 0425 - 0525mm 0525 - 06mm 06-0118mm
0 0 0 0 0 0
30 078 078 072 069 0575
60 0833 078 079 073 069
90 084 082 0805 0745 069
120 084 079 083 078 072
150 088 083 083 08125 075
180 087 084 083 0825 077
210 0865 079 0845 07875 075
240 0865 083 0845 08125 075
270 088 0855 0855 0825 075
Fig 45 Variation of dye removal with time
The results shown in Fig 45 indicate that the amount of dye sorbed on
sawdust increased steadily with time up to a certain time for each particle
size range after which it remained almost constant Also noted from the
results was the fact that the rate of sorption was highest in the first 30 minutes
for each particle size with particles in the range of 015mm - 03mm sorbing
79 of the dye in the initial 30 minutes while particles in the range of 6mm -
118mm sorbed 58 of the dye from solution The other particle sizes ie 03
49
-0425mm 0425 - 0525mm and 0525 - 06mm sorbed 78 72 and 69
of dye respectively
Equilibrium was attained after different contact times for the various particle
sizes It was observed to vary from 90 minutes for smallest 015 - 03mm
particle sizes to 180 minutes for the biggest particle size 06 - 118mm These
variations can be associated to the ease with which dye molecules reach the
adsorption site for the small particles The particle being small in size present
shorter travel routes as compared to the longer torturous route found in the
larger particles In addition the available sorption area is higher for the small
particle Sizes and less for the bigger sizes hence the rate of sorption is higher
Similar observation was made by Gupta (1990) in the study of removal
chrome dye from wastewater Table 46 shows the equilibrium time for the
different particle sizes
Table 46 Mean particle size Versus Equilibrium time
Particle size range(mm) Equilibrium time (min)
015-03 90
03 - 0425 90
0425 - 0525 120
0525 - 06 150
0 6 -1 18 180
46 Effect of Particle size on dye removal
From the graph it was found that as the particle sizes of sawdust increase
there was a decrease in the amount of the dye adsorbed from 084mgg for
015mm - 03mm particles to 075mgg for 06 - 118mm particles for a dye
concentration of 1Cmgl This can be explained on the basis of the available
specific surface area for different panicie size which is higher for the small
particle sizes as compared to the bigger particles The same was observed by
Gupta et al (1990 ) with mixed fly ash and coal adsorbents in the removal of
chrome dye from aqueous solution where with the increase of adsorbent
50
particle size from 53 to 125 pm led to decrease in removal from 927 to
6584 for 10mgl dye concentration The observed trend for both the soft
woods and hardwoods was similar with soft wood particles removing more
dye per gram than Hard wood particles An explanation for this is that
softwoods are lighter and have more pores hence higher specific surface area
than hardwood In addition hardwoods were observed to impart some colour
into the dye solution
Effect of particle eye removal
- Dye removal at equilibrium
Fig 46 Above shows the effects of particle size on dye colour removal
47 Effect of Adsorbent concentration on removalDifferent masses of sawdust adsorbent were used to evaluate effect of
change of adsorbent concentration on dye removal Table 47 and Figure 47
show the results
Table 47 Adsorbent concentration Versus Dye removal
Mass of Sawdustis ]_________________
Mass of dye adsorbed by different Sawdusts (mgg)
Cypress(mgg) Pine(mgg) Camphor(mgg) Meru Oak(mgg)1 051 062 035 052082 0305 035 0225 0353 022 025 008 0254 0165 01875 0085 023755 015 015 0092 026 0128 0125 0076 0167 0118 0118 0025 0138 011 00975 003 01259 0096 00878 004 011110 0091 0075 0025 01
51
Effect of adsorbent concentration on dye removal
-Cypress(mgg)
- Pine(mgfg)Campbor(mgg)
Meru Oak(mgg)
Fig 47 Effects of Adsorbent concentration on dye removal
The effect of varying adsorbent concentration was studied using a dye
concentration of 10mgl It was observed that as adsorbent concentration
increased the amount of dye sorbed per gram decreased varying from 063
05 035 mg g for a ratio of 1 in 100 for pine cypress Meru oak and
camphor to 008 008 003 for a ratio 1 in 10 This shows that an increase in
adsorbent concentration increases the available surface area for sorption thus
the reduction of in the amount of dye sorbed per gram However increase
was not uniform as would be expected This shows that there are other factors
working against sorption process Increase of the sorbent concentration can
inhibit the movement of the dye molecules due to increased sorbent-sorbent
interaction resulting to particle aggregation This phenomenon was observed
with high ratios such as 110 to about 1125 the high masses also resulted in
air being trapped in the absorbent hence resulting into dead capacity
High masses were also found to increase the amount of colour imparted on
the samples and reduced amount of aliquot available at the end of each set of
experiment for measurement Therefore putting the above factors into
consideration masses of 1 2 3 4 5 and 6 g were used to develop both
variable and constant mass sorption isotherms at equilibrium conditions
52
48 Equilibrium StudiesAdsorption isotherms are determined under equilibrium conditions that is
when the rate of adsorption of molecules onto the surface of the adsorbent is
equal to the rate of adsorption of the molecules from the surface Two types of
isotherms can be generated in this way namely- Variable mass and constant
mass isotherms Both of these isotherms were used in this research These
isotherms are shown in Figures 48(a) - 48 (d) both variable and constant
mass isotherms were adopted Variable mass isotherms are considered
environmentally conservative since they yield lower values of adsorption
constants than constant mass isotherms Environmentally conservative
isotherms are thus used for prediction purposes
In the data analysis the equilibrium data was plotted on log - log scale and
fitted to a power function which takes the form of the empirical Freundlich
equilibrium model The model yields values of k (constant) and 1n (power of
function) where k gives sorption capacity of the adsorbent for the equilibrium
concentrations and n gives an idea about intensity of the capacity Since all
experiments were conducted under same experimental condition (pH 89
adsorbent size (015 -03 mm and temperature 23degC) the value of k is taken
as a measure of maximum adsorption capacity for comparison purposes
On considering variable mass isotherms it was observed that the value of k
for Cypressus lusitanica indicated that the amount of dye sorbed at
equilibrium by sawdust decreased with increase in dye concentration in the
liquid The value of n was also found to be greater than 1 which indicates
unlimited sorption for the dye The other sawdusts showed poor adherence to
Freundlich model at low concentrations (5-30mgl) however for higher
concentrations (40 -60mgl) it was observed that the k values were greater
than 1 for Meru oak (Vitex keniesis) and Pine (Pinus spp) giving rise to a
scenario of unlimited sorption capacity Camphor (Ocotea usambarebsis)
sawdust was observed to values of n less than 1 giving an indication of
saturation and low values of k
53
These isotherms had very low correlation coefficients indicating poor
adherence to the model proposed A number of reasons can be associated
with this behaviour but the mainly experimental artifacts such as the
variations of both concentration and the adsorbent masses (with the attendant
air trapping tendencies) could have contributed to these data skews For the
hardwoods colour impartation on the samples could have resulted to increase
of the competing species in the bulk solution and hence alter the
measurements of absorbance of the aliquot
Constant mass isotherms showed fitted well into the data with high correlation
values and hence good fit For Cypressus lusitanica R2 values range between
087 - 0987 with K value being 040 mgg and n value of 179 Pinus spp had
R2 values of 0 6 -0 94 and k value of 045 and n value of 118
Camphor (Ocotea usambarebsis) had R2 values of 06 - 099 k value of
0006 and n value of 069 Meru Oak (Vitex keniensis) on the other had R2
values in the range of 01 - 09 k value of 024 and n value of 0823
The above figures of k and n show distinctly that both softwoods have a high
intensity of sorption and they show a possibility of unlimited sorption capacity
It can also be deduced that the hardwoods have low sorption capacity as
evidenced by the low values of k The values of n indicate that these two
hardwoods have the possibility of experiencing dye saturation after sometime
For the hardwoods this can be attributed to limitation in the number of sites
on the adsorbent or from the fact that hardwood produce colour which could
give rise to a false situation of saturation The latter was also attributed to the
great variability of R2
The softwoods show a high sorption capacity than the hard wood due to the
high number of sites available This can be deduced from the low densities
which indicate more pores and hence a larger surface area for the softwood
than the hardwoods The values of n show the possibility of unlimited sorption
capacity This is a feasible explanation as shown by Tsoumis (1990) that
wood is able to adsorb moisture by way of formation of a mono molecular
54
layer and then eventually polymolecular layers which cause wood to expand
This same scenario can be said to be true for the softwoods
55
Qe
(mg
g)
Qe
(mg
g)
43 Adsorption isotherms
48 (a)Adsorption Isotherms for Cypressus lusitanica (Variable mass)
Freundlich Isotherm Co- 60mgl
y = 06216x0356 R2 = 0 8152
laquo Qe (mgg)------- Power (Qe (mgg))
Freundlich isotherm for Cypressus lusitanica (Co=50mgI)
Freundlich Isotherm Cypressus lusitanica (40mgl)
y - 06547xdeg 2498 R2 raquo 0 7486
laquo Qo (mgg)------- Power (Qo (mgrg))
1 10 100
Ce (mgl)
Freundlich Isotherm for Cypressus lusitanica (Co=30mgI)
y 04405XregR2 = 0 8397
diams Qe (mgg)------- Power (Qe (mgg))
01 1 10 100
Ce (mgl)
56
Oe
(mg
g)
Cypressus lusitanica (Constant mass)
Froundlich Isotherm for Cypressus lusitanica (2g)
y = 04291xOS733 R2 raquo 0955
laquo Qe (mgg)------- Power (Qe (mgg))
01 1 10 100
Ce (mgl)
Freundlich isotherm lor Cypressus lusitanica (3g)
y a 04443xos26 R2 = 09878
diams Qe (mgg)------- Power (Qe (mgg))
01Ce (mgl)
100
Qe
(mg
g)
Qe
(mg
g)
Freundlich isotherm (or Cypressus lusitanica (5g)
Ce (mgl)
y = 03909xdeg fC - 0 9793
diams Qe (mgg)------- Power (Qe (mgg))
Freundlich isotherm lor Cypressus lusitanica
y = 0 4558xdeg 7e6R = 09544
diams Qe (mgg)------- Powor (Qo (mgg))
01 1Ce (mgl)
10
Qe
(mg
g)
48 (b) Adsorption isoherms for Pinus spp (Variable mass)
Freundlich Isotherm lor Pinus spp(Co=60mgl)
y raquo 04176xdeg 941 R2 = 08114
laquo Qe (mgg)------- Power (Qe (mgg))
1 10 100
Ce (mgl)
F ieundlich Isotherm lor Pinus spp (Co= 50mgl)
y = 04126x0929 R2 = 05686 laquo Qe (mgg)
------- Power (Qe (mgg))
58
Oe
(mg
g)
Freundlich isotherm ior Pinus spp (Co=30mgI)
y = 0 6674xdeg3437 R2 laquo 0 0355
diams Qe (mgg)------- Power (Qe (mgg))
1 10
Ce (mgl)
Freundlich Isotherm lor Pinus spp (40mgl)
y = 02221xldquo 4 R2 = 0 5482
diams Qo (mgg)------- Power (Qe (mgg))
1Ce (mgl)
10
Qe
(mg
g)
Pinus spp (constant mass)
Adsorption isotherm lor Pinus spp (1g)
y = 10521xdeg 5506 R2 raquo 09296
diams Qe (mgg)
------- Power (Qe (mgg))
01 1 10 100
Ce (mgl)
Adsorption isotherm for Pinus spp(3g)
y = 0467xomo7 R2 = 09212
diams Qe (mgg)------- Power (Qe (mgg))
Qe
(mg
g)
Qe
(mg
g)Adsorption isotherm lor Pinus spp (2g)
y = 05194X0 ltgt7 R2 = 07894
laquo Oe (mgg)------- Power (Qe (mgg))
01 1 10
Ce (mgl)
Adsorption isotherm for Pinus spp (5g)
10
1
01
0011 10
Ce (mgl)
y = 0 0598x2 R2 = 09266
diams Qe (mgg)------- Power (Qe (mgg))
59
Qe
(mg
g)
Qe
(mg
g)45 (c) Adsorption Isotherms for Ocotea Usambarebsis(Variable mass)
Sorption Isotherm for Ocotea usambarebsis (Co=60mgI)
y = 3E-10x6 50R2 raquo 05871
diams Qe (mgg)------- Power (Qe (mgg))
1 10 100
Ce (mgl)
Sorption isotherm lor Ocotea usambarebsis (Co=50mgl)
y = 3E-09X5 7 76 R2 = 05285
diams Qe (mgg)------- Power (Qo (mgg))
Oe
(mg
g)
Qe
(mg
g)
Freundlich Isotherm lor Octea usambrensas (Co=40mgI)
Sorption Isotherm (or Octea (Jsambrensis (Co=30mgI)
y = 07439X0 4W7 RJ = 09398
laquo Qe (mgg)------- Powor (Qo (mgg))
60
Qe
(mg
g)
Qe
(mg
g)Ocotea usambarebsis (Constant mass)
Sorplion Isotherm for Ocotea Usambarebsis (1g)
10Ce (mgl)
y = 00184x3571 R2 = 0975
diams Qe (mgg)------- Power (Qe (mgg))
100
Sorplion isotherms for Ocotea usambarebsis (2g)
y = 00105xrsquo 375 R2 = 09954
laquo Qe (mgg)
------- Power (Qe (mgg))
Qe
(mg
g)
Oe
(mg
g)Sorption isotherm lor Ocotea usambrebsis (3g)
y = 0 0079x 2757 R2 - 07797
diams Qe (mgg)------- Power (Qe (mgg))
Sorption Isotherm tor Ocotea usambrebsis(5g)
y gt 000t4xR2 = 0 9735
diams Qe (mgg)------- Power (Oe (mgg))
61
Qe
(mg
g)
Qe
(mg
g)48 (d) Adsorption isotherms for Vitex Keniensis (Variablemass)
Sorption Isotherm for Vitex Kiniensis(Co=60mgl)
y raquo 04005xdeg1003 R2 = 09412
diams Qe (mgg)------- Power (Qe (mgg))
Sorption Isotherm lor Vitex kiniensis (Co=50mgI)
y = 03764X085reg6 R2 = 0803
diams Qe (mgg)------- Power (Qe (mgg))
1 10
Ce (mgl)
100
Qe
9mg
g)
Sorption isotherm lor Vitex kiniensis (Co=40mgI)
y = 09966X0 rdquoR2 = 0 0005
diams Qo (mgg)------- Power (Qe (mgg))
1 toCe (mgl)
Freundlich Isotherm lor Vitex kiniensis(Co=30mg1)y = 4 2t89x 1
R2 a 0 2457
laquo Qe (mgg)------Powor (Qo (mgg))
1Ce (mgl)
10
Qe
(mg
g)
Vitex keniensis (Constant mass)
Sorption isotherm tor Vitex Kiniensis (1 g)
y = 0 8248xdeglsquo 7 R2 = 09117
diams Qe (mgg)------- Power (Q e (mgg))
Ce (mgl)
Sorption isotherm lo r Vitex kiniensis (2g)
y = 02511xrsquo 2403 R2 = 08664
diams Qe (mgg)------- Power (Qe (mgg))
1Ce (mgl)
10
Qe
(mg
g)Sorption isotherm for Vitex Kiniensis (3g)
y = 0 0566x bull10R2 = 0 7524
laquo Oe (mgg)------- Power (Qe (mgg))
Sorption isotherm for Vitex Kiniensis(5g)
y = 01326xOM7 R2 = 0285
diams Qe (mgg)
------- Power (Qe (mgg))
63
49 Relationship between sawdust properties and Sorption dataThe softwoods were found to be less dense than the hardwoods which implies
the possibility more pore spaces and higher specific surface area for sorption
process The latter were found to impart coloured species on the samples
thus interfering with absorbance measurement and yielded low values of k
and n Sorption capacity was found to increase with hemicellulose content
which was high in cypress pine Meru oak and Camphor in that order
Cellulose was found to have a negative correlation with sorption capacity No
definite relationship could be deduced between lignin content and sorption
410 Effect of initial dye concentration on percentage removal
Considering Figures 49(a) - 49(d) it was observed that on varying the initial
dye concentration from 5 mgl to 60 mgl for different masses of the 4 different
sawdusts the percentage dye sorbed per gram remained fairly constant for all
the concentrations giving rise to graphs near parallel to the abscissa This
indicates that for the dye concentrations considered the mechanism of
sorption remain the same and an increase in the initial dye concentration only
alters the magnitude adsorbed per gram of sawdust for all tree species tested
Effect of intial concentration on Dye removal for Pinus spp
-ig-23-33-4g
-5g-6g
49 (a) Pinus spp sawdust
64
Effect of initial concentration on Dye removal fo r Vitex Keniesis
initial concentration (mgfl)
-m-2g- - 3 g
49(b) Vitex keniensis sawdust
mdash gmdashmdash2g
49(c) Ocotea Usambarebsis
Effect of initial concentration on dye removal for Cypressus luatanica
E3ogtk_0)CL
8gtoE0)x_
ltDgtNQ
100
7D
c n
mdash
on i -
on ------ ------- --------A
10 -
0 -
mdash x atmdash
0 10 2 0 3 0 4 0 5 0 6 0 7 0 8 0
- diams - ig
-plusmn-3g
mdash 5g
--6g
Initial tye ccrcer ration Gu (rrryl)
49(d) Cypressus lusitanica sawdust
65
S pound
pound pound
Ma
ss o
f d
ye a
dso
rbe
d p
er
gra
m
(mg
g)
411 Effect of pH Variation on dye removalFigure 411 shows the effect of pH change on dye removal from synthetic
wastewater
Effect o f Variation of intial pH on C^e removal
mdashdiamsmdash Cypress
--CanphoRne
fvferuCe
Fig 410 Effect of pH change on Sorption
In tap water Congo Red dye ionizes to a pH of 89 It was observed that when
the initial pH of the dye solution was varied from 89 to 12 by addition of
Sodium hydroxide dye removal declined steadily to zero at pH 10 for both
Camphor and Cypress Sawdust and pH 11 for Meru Oak and Pine Sawdust
respectively This can be explained from the point of view that an increase in -
OH ions from the base competed favourably with the dye ions for the available
sites thus reducing the amount of dye adsorbed by the sawdust Another
factor which may have contributed to a decline in the amount of the dye
sorbed is the polar nature of the adsorbent surface This could preferably sorb
the -OH ions in preference to the dye ions Beyond this point of zero removal
it was observed that the colour of the dye increased abruptly to absorbance
value exceeding that of the initial concentration of 10 mgl dye solution Thus
as shown in Figure 410 dye removal in this case takes negative vaiues This
could possibly have resulted from side reactions favoured by the high pH
On lowering the pH using 05N H2S04 the amount of dye sorbed remained
fairly constant with only slight increase at pH 8 and thereafter remained
66
constant for all the species tested A similar phenomenon was observed by
Gupta (1991) where an increase in the pH resulted in a decrease of the
amount of chrome dye adsorbed on a mixture of fly ash and coal
67
Chapter 5
Conclusions and Recommendations
51 ConclusionsFrom the research findings it may be concluded that-
gt The tested softwoodsrsquo sawdust have potential of removing direct dyes from
water as indicated by the high value of k (a constant obtained from the
Freundlich equilibrium model) yielded sorption capacity of the adsorbent
ranging from 033- 04
gt Hardwoods were found to have low potential of colour removal with low k
values ranging from 00069 - 023 They also had a problem of colour
impartation
gt Initial pH of effluent stream affects the amount of direct dye removed from
he waste High pH was found to reduce the amount of dye adsorbed and
promoted side reactions with increase the absorbance of the water
52 Recommendations
gt Further investigations should be carried to investigate the effects of
different methods of adsorbent preparation such as washing and air drying
on dye removal using sawdust from the various tree species
gt Investigations should also be carried out on an actual dye waste stream
containing different dyes and other dyeing chemicals
gt Further research should be carried out on the possibility of regeneration
and proper disposal of the adsorbent
68
bull Disodium ethylenediaminetetra-acetate (EDTA dihydrate crystal reagent
grade)
bull Sodium borate decahydrate reagent grade
bull Disodium hydrogen phosphateanhydrous reagent grade
bull 2-ethoxyethanol purified grade
bull Decahydronaphthalene reagent grade
bull Acetone
bull Sodium Sulfite anhydrous reagent grade
bull Sulphuric acid(reagent grade)
bull Cetyl trimethylammonium bromide technical grade
bull n-Hexane technical grade
bull Asbestos
bull Saturated potasium permanganate
bull Lignin buffer solution
bull Ferric nitrate nonhydrate
bull Silver nitrate
bull Acetic Acid glacial
bull Potassium acetate
bull Tertiary butyl alcohol
bull Combined permanganate solution
bull Oxalic acid dihydrate
bull 955 ethanol
bull Concentrated (12 N hydrochloric acid)
bull Hydro bromic acid reagent grade
Equipment
gt Ultra-spec II 4050 spectrophotometer
gt XL- 3100D Electronic balance
gt Measuring cylinders of different sizes
gt 1000 Ml Volumetric flasks
gt Model C-33 Continuous shaker
gt 100ml beakers
Appendix A1 Reagents and Equipment
69
gt 350ml plastic tumblers
gt Millipore 3500 filter
gt BS Sieves No7 to No 100
gt 50ml density bottle
gt A vacuum Dissector
gt A drying oven
gt Glass rod
gt Vacuum Pump
gt Refluxing apparatus-
Beakers Berzelius without spout 600ml capacity
Crucibles Gooch type high-form Pyrex fritted glass 50 ml capacity course
porosity Type sold by scientific Silver springMd Cat No8-237
Scimatco rubber tubing black thick-wall 516 in-(80mmm) bore 322-
(35mm) wall
Hot plate Thermolyne 9HP-A8805B) blue porcelain steel-flattop 120v 33-a
400-w 3 -in-(95-cm) diameter
Multi electric receptacle box 20-a 115-v
Condensers reflux crude-fiber Pyrex EH Sargent and Company
Philadelphia Pa Cat NoS-22742
Flexa frame hook connectors
Rings cast-iron
Flexa frame rods
gt Filter manifold
Polyethylene pipe
Funnels
Flasks
Clamps
Rubber Adopter
Rubber tubing
Glass tubing
Polyethylene tubing
Screw Clamp
gt Water heater
70
Appendix A2 Chemical composition of SawdustPine Cypress C am phor M eru O ak
Sam ple 1 Sam ple 2 Sam ple 1 Sam ple 2 Sam ple 1 Sam ple 2 S a m p le l S am ple 2
C ruc ib leNumber
293 963 927 877 237 253 480 31
C ruc ib le w t (g) 314105 307969 316161 301758 318517 307956 295801 308274S am ple W e ig h t (g)
1 1 1 1 1 1 1 1
D ry m a tte r 9459 9459 9477 9477 9475 9475 9511 9511C ruc ib le +N D F R esidue 322857 31682 324934 310732 310423 316055 304961 317199
N D F R esidue 08752 08851 08773 08974 08094 08099 0916 0 8925
C ruc ib le + A DF
321379 315087 323456 308889 317702 314268 303386 31573
C e lluose 42700372
4117637763 4352542589 3961162466 15410868 51055284 49061675 50399296
H em ice llu lose
1562533 183211756 1559565263 1944708241 -7695317 18860158 16559773 15445274
C ruc ib le +AD L 317125 310975 319057 304776 313057 309767 29856 310902C ruc ib le + Ash
314145 30802 31613 301672 311288 307845 295861 308218
L ign in 31504387
312400888 3088530126 327529809 18701766 2028496 28377668 28 219956
A verage ce llu lose
4193837502
4156852527 5105528366
4973048544
A verage H em ice llu lose 1697325299
1752136752 1886015831
1600252339
A verage L ign in
31 37223808
3181914108 2028496042
282988119
A verage O thers
9 716133911
9090966128 9799597608
5968179262
71
Appendix A3 Variation of Absorbance with concentration
Congo red dye rating curve
-Absorbance
Appendix A4 Specific Gravity of Sawdust (Gs)Tree Species Sample M ass (g) In itia l Volm (cm J) Final Volm (cm J) D ensity (g c m J)
P ine 1 54 700 810 0490909091
2 557 700 800 0557
3 551 700 820 0459166667
4 609 700 810 0553636364
Cypress 1 476 700 800 0476
2 482 700 810 0 438181818
3 504 700 800 0504
4 472 700 800 0472C am phor 1 528 700 8001 0528
2 458 700 800 0458
3 495 700 800 04954 557 700 800 0557
M eru O ak 1 397 700 770 0567142857
2 4069 700 770 0581285714
3 411 700 770 0587142857
4 419 700 780 052375
Appendix A5 Variable mass Isotherm data Cypressus lusitanicaCo = 60mglM ass (g) F inai Absoibance Ce(mgI) Ge (mgg)
1 113 0021 1109 3989209 2010791
2 0516 0032 0484 1741007 2129496
3 0382 0044 0338 1215827 1594724
4 0281 0052 0229 823741 1294065
5 0271 0064 0207 7446043 1051079
l_________6 0171 0084 0 087 3129496 0947842
72
Co=50 mglM ass (g) F ina l Absorbance Ce(mgI) Qe (m gg)
1 0937 0021 0 916 3294964 1705036
2 0369 0032 0 337 121223 1893885
3 0315 0044 0271 9748201 1341727
4 023 0052 0 178 6402878 1089928
5 0162 0064 0 098 352518 0929496
6 014 0084 0 056 2014388 079976
C o=40 m gl
C o=30 mgl
M ass (g) F ina l Absorbance Ce(mgI) Qe (m gg )
1 0333 0021 0312 1122302 1877698
2 0141 0032 0109 3920863 1303957
3 0138 0044 0094 3381295 088729
4 0136 0052 0084 3021583 067446
5 0127 0064 0 063 2266187 0554676
6 0109 0084 0025 0899281 0485012
C o=20 mgl
C o=10 m gl
M ass (g) F inal Absorbance Ce(mgI) Qe (m gg)
1 0108 0021 0087 3129496 0 68705
2 0062 0032 003 1079137 0446043
3 0063 0044 0019 0683453 0310552
4l 0073 0052 0021 0755396 0231115
5 0074 0064 001 0359712 0192806
6 009 0084 0006 0215827 016307
73
Co=5 mglM ass (g) Final Absorbance Ce(mgI) Qe (m gg )
1 0049 0021 0 028 1007194 0399281
2 0042 0032 001 0359712 0 232014
3 0048 0044 0004 0143885 0161871
4 0065 0052 0013 0467626 0 113309
5 0066 0064 0002 0071942 0098561
6 0088 0084 0 004 0143885 0 080935
Vitex KeniensisC o=60 mgl_________
M ass (g) F ina l Absorbance Ce(mgI) Qe (m gg )
1 0567 0068 0499 1794964 4 205036
2 0327 0105 0222 7985612 2 600719
3 0288 0126 0162 5827338 18057554 03 0139 0161 5791367 1355216
5 035 0244 0106 381295 1123741
6 032 0247 0073 2625899 0956235
C o=50 mgl
M ass (g) F inal Absorbance Ce(mgI) Qe (m gg )1 0425 0068 0357 1284173 3 7158272 0263 0105 0158 5683453 2 215827
3 0287 0126 0161 5791367 14736214 0269 0139 013 4676259 1133094
5 0303 0244 0059 2122302 0 9575546 0339 0247 0092 3309353 0 778177
C o=40 mglM ass (g) F inal Absorbance Ce(mgI) Qe (m gg)
1 0331 0068 0263 9460432 3 0539572 0227 0105 0122 4388489 17805763 0318 0126 0192 6906475 11031184 0365 0139 0226 8129496 0 7967635 0393 0244 0149 5359712 06928066 0481 0247 0234 8417266 0 526379
Co=30 mglM ass (g) F inal Absorbance Ce(mgI) Qe (m gg)
1 0209 0068 0141 5071942 24928062 0197 0105 0092 3309353 1334532
3 0236 0 126 0 11 3956835 0 8681064 0249 0139 011 3956835 0 651079
5 038 0244 0136 4892086 0 5021586 0486 0247 0239 8597122 0 356715
74
Co=20 mgl
C o=10 m gl
C o = 5 mgl
Octea usambarebsis
Co=60 m glM ass (g) F inal Absorbance Ce(mgI) Qe (m gg)
1 103 0022 1008 3625899 2374101
2 1051 0034 1017 3658273 1170863
3 1025 0056 0969 3485612 08381294 097 0063 0907 326259 0684353
5 0919 0078 0841 302518 0594964
6 0993 0083 091 3273381 0454436
C o=50 m gl
Mass (g) F ina l Absorbance Ce(mgI) Qe (m gg)
1 089 0022 0868 3122302 1877698
2 0845 0034 0811 2917266 1041367
3 0925 0056 0869 3125899 0 62474 0829 0063 0766 2755396 0561151
5l 0807 0078 0729 2622302 047554
6 0837 0083 0754 271223 0381295
75
Co=40 mglM ass (g) F ina l Absorbance C em gI) Qe (m g g )
1 0751 0022 0729 2622302 1377698
2 069 0034 0656 2359712 0820144
3 0698 0056 0642 2309353 0563549
4 07 0063 0637 2291367 0427158
5 0649 0078 0571 2053957 0389209
6 0701 0083 0618 2223022 0296163
C o=30 mgl
Co=20 mq1M ass (g) F ina l Absorbance Ce(mgI) Qe (m gg )
1 0357 0022 0335 1205036 0794964
2 0398 0034 0364 1309353 0345324
3 0394 0056 0338 1215827 0261391
4 0403 0063 034 1223022 0194245
5 0397 0078 0319 1147482 0170504
6 0458 0083 0375 1348921 0108513
Co=10 mgl
M ass (g) F ina l Absorbance Ce(mgI) Qe (m gg )
1 023 0022 0208 7482014 0251799
2 0231 0034 0197 7086331 0145683
3 0302 0056 0246 8848921 0038369
4 0302 0063 0239 8597122 0035072
5 0295 0078 0217 7805755 0043885
6 0336 0083 0253 9100719 0014988
Co=5m gl
M ass (g) F ina l Absorbance Ce(mgI) Qe (m gg )
1 0131 0022 0109 3920863 0107914
2 0139 0034 0105 3776978 0061151
3 0146 0056 009 323741 0 058753
4 0193 0063 013 4676259 0008094
5 0192 0078 0114 4100719 0017986
6 021 0083 0127 4568345 0007194
76
Pinus sppCo=60 mg1
|M ass (g) F ina l Absorbance Ce(mgI) Qe (m gg )
1 0419 0021 0 398 14316547 45683453
2 0176 0032 0 144 51798561 27410072
3 0154 0044 011 39568345 18681055
4 0144 0052 0 092 33093525 14172662
5 016 0064 0 096 34532374 11309353
I 6 018 0084 0 096 34532374 0 942446
C o= 50 m glM ass (g) F ina l Absorbance Ce(m gI) Qe (m gg )
1 0309 0021 0 288 10359712 39640288
2 0163 0032 0131 47122302 22643885
3 0127 0044 0 083 29856115 156714634 012 0052 0 068 24460432 11888489
5 0165 0064 0101 36330935 09273381
6 0193 0084 0 109 39208633 07679856
C o=40 mg1
M ass (g) F ina l Absorbance Ce(mgI) Qe (m gg)
1 0208 0021 0 187 67266187 33273381
2 0118 0032 0 086 30935252 18453237
3 0119 0044 0075 26978417 124340534 0136 0052 0 084 30215827 09244604
5 0145 0064 0081 29136691 07417266
6 0174 0084 009 32374101 06127098
C o= 30 mg1
C o=20 mg1
77
Co=10 mgljM ass (g) F ina l Absorbance Ce(mgI) Qe (m gg)
1 0 045 0034 0011 03956835 09604317
2 0052 0052 0 052 18705036 04064748
3 0061 0082 0061 21942446 02601918
4 0 0777 0106 0 0777 2794964 01801259
5 0107 0132 0 1 0 7 38489209 01230216
6 0142 0155 0 142 51079137 00815348
C o=5 m glM ass (g) F ina l Absorbance Ce(mgI) Qe (m gg)
1 0 039 0034 0 005 01798561 04820144
2 0065 0052 0 0 1 3 04676259 02266187
3 0089 0082 0 007 02517986 01582734
4 0116 0106 001 03597122 01160072
5 0161 0132 0 029 10431655 00791367
________ 6 0202 0155 0 0 4 7 16906475 00551559
Constant mass isotherm data
Cypressus lusitanicaConstant M ass o f 1g
Initial C oncen tra tion (mgl) Ce (m gl) Qe (mgg)
5 1007194 0399281
10 3129496 068705
20 1122302 1877698
30 1568345 0431655
40 2766187 1233813
50 3294964 1705036
60 3989209 2010791
Constant M ass o f 2gInitial C oncen tra tion (mgl) Ce (m gl) Q e (mgg)
5 0 359712 0232014
10 1079137 0446043
20 3920863 1303957
30 442446 0778777
40 9856115 1507194
50 121223 1893885
60 1741007 2129496
Constant m ass o f 3gInitial C oncen tra tion (mgl) Ce (m gl) Qe (mgg)
5 0 143885 0161871
10 0 683453 0310552
20 147482 0617506
30 3 381295 088729
40 6 18705 1127098
50 121223 1893885
60 1215827 1594724
78
Constant mass of 5gInitial Concentration (mg1) Ce (m gl) Qe (m gg )
5 0071942 009856110 0359712 0 19280620 0 971223 0 380576
30 2 266187 0 55467640 2 589928 0748201
50 352518 0 92949660 7 446043 1051079
Constant m ass of 6g
Initial C oncentration (m gl) Ce (m gl) Qe (m gg )
5 0143885 0 080935
10 0 215827 0 1630720 0827338 0 319544
30 0899231 048501240 1151079 064748250 2 014388 0 79976
60 3 129496 0947842
Pinus spp
Constant m ass of 1 gInitial Concentration (m gl) Ce(mgI) Qe (m gg)
5 0179856 0482014
10 0395683 096043220 2302158 176978430 4100719 258992840 6726619 332733850 1035971 396402960 1431655 4568345
Constant m ass o f 2gInitial Concentration (m gl) Ce(m gI) Qe (m gg)
5 0 467626 022661910 1151079 0942446
20 1870504 040647530 1978417 140107940 3093525 1845324
50 471223 2264388
60 5179856 2741007
Constant mass of 3gInitial C oncentration (m gl) Ce(m gI) Qe (m gg)
5 0251799 0 158273
10 1726619 0942446
20 1834532 0605516
30 2194245 0260192
40 2697842 1243405
50 2985612 1567146
60 3956835 1868106
79
Constant mass of 4gInitial C oncentra tion (mgl) Ce(mgI) Qe (mgg)
5 0359712 0116007
10 1690647 0457734
20 1798561 070503630 2446043 118884940 2794964 018012650 3021583 09244660 3309353 1417266
Constant m ass of 5gInitial C oncentra tion (mgl) Ce(mgI) Qe (mgg)
5 1043165 007913710 2194245 035611520 2913669 074172730 2985612 054028840 3453237 113093550 3633094 092733860 3848921 0123022
Constant m ass of 6gInitial C oncentra tion (mgl) Ce(mgI) Qe (mgg)
5 3453237 094244610 3920863 076798620 323741 06127130 3201439 044664340 2302158 029496450 5107914 008153560 1690647 0055156
Vitex keniensis
Constant m ass of 1gInitial C oncentra tion (m gl) Ce(m gI) Qe (mgg)
5 0611511 043884910 1906475 180935320 287 171330 5071942 249280640 9460432 305395750 1284173 371582760 1794964 4205036
80
Constant mass of 2gInitial C oncentra tion (mgl) Ce(m gI) Qe (m gg)
5 1151079 019244610 1834532 090827320 309 08455
30 3309353 1334532
40 4388489 178057650 5683453 221582760 7985612 2600719
Constant m ass of 3gInitial C oncentra tion (mgl) Ce(m gI) Qe (m gg)
5 2 014388 00995210 2482014 058393320 359 054730 3956835 086810640 5791367 147362150 5827338 180575560 6906475 1103118
Constant m ass of 4g
Initial C oncentra tion (mgl) Ce(m gI) Qe (m gg)5 3 489209 00377710 372 040720 3956835 065107930 4352518 039118740 4676259 113309450 5791367 135521660 8129496 0796763
Constant m ass of 5gInitial C oncentra tion (mgl) Ce(m gI) Qe (m gg)
5 1618705 005762610 1978417 036043220 2122302 095755430 3 81295 112374140 388 0322450 4892086 050215860 5359712 0692806
Constant m ass of 6gInitial C oncentra tion (mgl) C e(m gI) Qe (m gg)
5 2158273 004736210 2625899 095623520 3201439 027997630 3309353 077817740 392 026850 8417266 0526379
60 8597122 0356715
81
Ocotea usambarebsis
Constant m ass of 1 g
Initial C oncentra tion (m gl) Ce(mgI) Qe (mgg)5 3625899 237410110 3122302 1877698
20 2622302 137769840 1205036 079496450 7482014 025179960 3920863 0107914
Constant m ass of 2gInitial C oncentra tion (m gl) Ce(mgI) Qe (mgg)
5 3776978 006115110 7086331 0145683
20 1309353 0345324
40 2359712 0820144
50 2917266 104136760 3658273 1170863
Constant m ass of 3gInitial C oncentra tion (m gl) Ce(mgI) Qe (mgg)
5 323741 005875310 8848921 003836920 1215827 026139140 2309353 056354950 3125899 0624760 3485612 0838129
Constant m ass of 4gInitial C oncentra tion (m gl) Ce(mgI) Qe (mgg)
5 4676259 000809410 8597122 003507220 1223022 019424540 2291367 042715850 2755396 056115160 326259 0684353
Constant m ass of 5gInitial C oncentra tion (m gl) Ce(mgI) Qe (mgg)
5 4100719 001798610 7805755 0043885
20 1147482 0170504
40 2053957 038920950 2622302 047554
60 302518 0594964
82
Constant mass of 6gIn itia l C oncen tra tion (m gl) C e(m gI) Q e (m gg)
5 4 568345 000719410 9 100719 001498820 1205036 079496440 22 23022 029616350 271223 038129560 3273381 0454436
Appendix A6 pH versus amount of dye sorbedVariation of dye removal with pH
pH Finalabsorbance
Mass of dye removed (mgg)
Cypress Camphor Pine MeruOak
pH Cypress Camphor Pine Meru Oak
5 0062 0177 007 0066 5 07769784 02841727 06978417 076258996 0063 0199 0084 0074 6 07733813 02338129 07482014 073381297 0064 0213 009 0087 7 07697842 03633094 06978417 068705048 0069 0242 014 0136 8 07517986 01294964 04964029 051079149 0212 0252 0148 0101 9 02374101 00935252 04676259 06366906
10 0277 0269 0238 0213 10 00035971 00323741 01438849 0233812911 045 0478 0246 028 11 -0618705 -0719424 01151079 -000719412 0845 1162 0523 0561 12 -2039568 -3179856 -0881295 -1017986
83
Appendix A7 Mean Particle size Versus dye removal at equilibriumEffect of particle Size on Dye removalMean pa rtic le size(mm) Dye rem oval at equlibrium (m gg)
0 225 0840 3625 0820 475 0805
0 5625 0780 89 075
Appendix A8 Number of revolutions per minute versus Dye removalE ffe c t o f S h a k in g v e lo c ity on Dye rem ova lSpeed
rpmF in a l A b so rb a n ce3 - 425mm 425 - 525m m 525 - 6mm All sizes
0 0187 0172 0 173 015325 0119 0132 0 147 014750 0116 012 0 116 014675 0112 0115 0 118 0121
100 01 011 0 102 0114125 0091 0105 0 097 0072150 0042 0047 0 049 0024175 0046 005 0041 0036200 0061 0057 0 047 0072225 0072 0063 0 05 0072250 0075 006 0 066 007
Speedrp m
M ass o f Dye a d so rb e d p e r g ram o f S a w d u s t (m g g )
3 - 425mm 425 - 525m m 525 - 6mm All sizes0 0314 0383 0371 045
25 0561 0524 0 477 047750 0593 0574 0 593 04775 06 0589 0 575 057
100 0642 061 062 063125 066 0625 0 65 0746150 085 0825 0 825 0912175 08375 082 08375 0875200 0786 08 0 825 0746225 0746 0782 082 0746250 0738 07875 0 78 075
84
Appendix A9 Freundlich constantsValues of K Values of n
M ass (g) C am phor Meru Oak C ypress Pine C am phor Meru O ak C ypress Pine
1 0 0184 08248 04127 05396 0736 1634 274 1246572
2 00105 02511 04291 05194 0742 0806 1-744 102
3 00079 00566 04443 04359 07838 0552 184 1199
4 0003 00117 03083 0302 0435 04186 1378 1128
5 00014 01326 03909 00998 0552 09472 182 07156
6 00004 01504 04558 01028 0466 05803 127 1008
A verage 0006933 02378667 040685 033325 0 619133 0823017 1798667 1052862
Appendix A10 Initial concentration versus dye removal for Pinus spp Vitex kiniensis Octea usambrensis and Cypressus lusitanica
P inus sppC o (mg1) dye rem oval d ifferent m asses
ig 2g 3g 4g 5g eg5 96402878 45323741 31654676 23201439 15827338 11031175
10 96043165 40647482 26019185 1801259 12302158 81534772
20 95197842 48983813 3289968 24774843 19876978 16598721
30 86330935 46702638 31414868 23501199 18009592 1488809
40 9352518 48248651 32547962 24559353 19729856 16480566
50 92517986 48070054 32465388 24508813 19684322 16446926
60 92290168 47997081 32431517 244894 19671928 16438237
V itex ken iens isC o (m gl) dye rem oval d ifferent m asses
ig 2g 3g 4g 5g eg5 8776978 3848921 1990408 7553957 1352518 9472422
10 8093525 4082734 2505995 1411871 1604317 1133094
20 8565 42275 1252998 2035 1612 134
30 8309353 4448441 1823333 2170264 1673861 118904940 7634892 4451439 2757794 1991906 1732014 131594750 7431655 4431655 2947242 2266187 1915108 155635560 7008393 4334532 3009592 2258693 1872902 1593725
O co tea usam barebsisC o (m gl) dye rem oval d ifferent m asses
ig 2g 3g 4g 5g eg5 2158273 1223022 117506 1618705 3597122 0719424
10 2517986 1456835 383693 3507194 4388489 149880120 397482 1726619 1306954 1243165 852518 5425659
30 352518 3015588 24 94005 1582734 1956835 164868140 3444245 205C36 1408873 1067896 9730216 740407750 3755396 2082734 12494 1122302 9510791 7625899
60 3956835 1951439 1396882 1140588 9916067 7573941
85
Cvpressus lusitanicaCo (mg1) dye removal fo r d iffe ren t masses
19 2g 3g 4g 5g 6g10 685 447 3103333 23125 193 1646667
20 6345 42125 2948333 2195 18 1640833
30 626 43465 2953333 224825 1854 1618
40 60 3765 282 22675 1872 1619833
50 6424 3775 2686 2178 18576 16
60 62 354 2653333 215375 1752 1580833
86
Bibliography1 Alam JB Dikshit AK and M Bandyopadhyay (2000) Efficacy of
adsorbents for removal 24-D and Atrazine removal from Water
Environment Global Nest the Inti Journal Vol 2 No 2 pp 139-148
2 APHA (American Public Health Association)(1992) Standard Methods
for examination of water and Wastewater 18th Edition APHA Washington
DC
3 Anliker R Clarke EA and MoserP (1981) Use of the partition
coefficient as an indicator of bioaccumulation tendency of dyestuffs in fish
Chemosphere Vol 10 pp263 - 274
4 Arvola L (1986) Spring phytoplankton of 54 small lakes in Southern
Finland Hydrobilogia Vol 137pp125- 134
5 AtlasG and TT Bannister (1980) Deoedence on mean spectral
extinction coefficient of phytoplankton depth water colour and species
Limnol Oceanography Vol 25 pp 157-159
6 BaldwinS (1987) Biomass stoves Engineering Design Development
and Dissemination Volunteers in Technical assistance Arlington Virginia
7 BaughmannG and Perenich TA (1988) Fate of Dyes in agueous
systems Solubility and partition of hydrophobic dyes and related
compounds EnvironToxic Chemical Vol 7 pp 188-199
8 Bennett LE and M Drikas (1993) The evaluation of colour in natural
waters Water Res Volume 27pp1209-1208
9 Boegerding AJ and RA Hites (1994) Identification and measurement
of food and cosmetic dves in a municipal wastewater treatment plant
Environment Science Technology Vol 28pp1278-1284
10 Canadian Council of Ministers of Environment (2001) Canadian water
quality guidelines for the protection of aquatic life Colour Winnipeg
11 Chiou CT LJ Peters and VH Freed (1979) A physical concept of
soii-water equilibria for nonionic organic compounds Science Vol206 pp
831-832
12 Chiou CT PE Porter and DW Schmeddling (1983) Partition
equilibria of nonionic organic compounds between soil organic matter and
water Environmental Science and Technology
87
13 Clarke EA and Anliker R (1980) Organic Dyes and pigments in The
Handbook of Environmental Chemistry Vol 3 Part A Anthropogenic
Compounds Hutzinger O (Ed) Springer-Verlag Hiedelberg pp 181- 215
14 Del Giorgio PA and RH Peters (1994) Patterns in Planktonic PR
ratios in lakes Influence of lake trophy and dissolved organic carbon
Limnol Oceanography Volume 39 pp 772-787
15 Dzombak DA and R G Luthy (1984) Estimating adsorption of
polvacvclic aromatic hydrocarbons on soils Soil science Vol 137 p 292-
308
16 EfflerSW and MT Auer (1987) Optical heteroqenisity in Green Bay
Water Resource Bulletin Vol 23pp 937-942
17 Emig DK (1973) Removal of Heavy metals from acid bath plating by soil
Phd Thesis Perdue University
18 Fessenden RJ and Fessenden JS (1990) Organic Chemistry 4th
Edition Brooks Cole Publishing Company Pacific Grove California
19 FisetJF Blais JFBen Cheikh R and RDTyagi (2000)Review on
metal removal from effluents by adsorption and wood barks Rev Sci Eau
Vol 13 pp325- 349
20 Environmental technology Letters (1986) Vol 7 No8 pp 415
21 Githere PG (MSc Thesis) Potential of ground Charcoal In removal of
synthetic dye from water MSc Thesis University of Nairobi
22 Griffin RA and WR Roy (1985) Interaction of organic solvents with
saturated soil-water systems Environmental Institute for waste
management Studies Open File Report 3 University of Alabama pp86
23 GuptaGS PrasadG and Singh VN (1990) Removal of Chrome dve
from aqueous solutions by mixed adsorbents Fly ash and coal Wat Res
Vol 24 No 1pp45-50
24 Gurr E (1971) Synthetic Dyes in Biology Medicine and Chemistry
Academic Press London amp New York
25 Haines TA TVKomov VE Matey and CH Jagoe (1995) Perch
Mercury content is related to acidity and colour in 26 Russian Lakes Water
Air Soil Pollution Vol 85 pp823-828
88
26 Henebry MS ad J CairnsJr(1984) Protozoan colonization rates in
trophic status ot some freshwater wetlands lakes Journal of Protozool Vol
31 pp456-467
27 Horvart C Melander W and Molnar I ( 1976) Solvophobic interactions
in Liquid Chromatography with nonpolar stationary phases Journal of
chromatography Vol 125 pp 129 - 156
28 httpwwwpgonlinecom
29 Huang JC and Liao CS (1970) Adsorption of pesticides by clay minerals
Journal of Sanitation Eng Div American Society of Civil Eng Vol 96 pp
1057- 1078
30lrving S Goldstein(1977) Wood Technology Chemical Aspect ACS
Symposium series 43 American Chemical Society Washington
31llmavirta V and P Huttunen (1989) Water chemistry and
phytoplankton communities acidic clear and brown-water lakes in eastern
Finland Water Air Soil Pollution Vol 46pp415-432
32 Jang-Yeun Horng and Shang-Da Huang (1993) Removal of organic dye
(Direct Blue) from synthetic Wastewater by adsorptive bubble techniques
Environmental science Technology Vol 27 pp 1169-1175
33 Jerome JH R P Bukata PH Whitfield and N Rousseau (1994)
Colour in natural Waters 2 Observations of Spectral variations in British
Columbia Rivers Northwest Science Volume 68pp53-64
34 Jerome JH R P Bukata PH Whitfield and N Rousseau (1994)
Colour in natural Waters 1 Factors controlling the dominant wavelength
Northwest Science Volume 68pp43 -52
35 Jones HR (1974) Pollution Control in the Textile Industry
36 Juarez LM KH Holtschmit JJ Salmeron and MK Smith (1987)
The effects of chemical and visual communication space availability and
substratum colour on growth of juvenile fresh water prawn Macrobrachium
rosebergii Journal of marine Biology and ecology Vol 110 pp285- 295
37 Kuo W G (1992) Decolorizing Dye Waste-water with Fenton Reagent
Water resources Vol26 pp 881
38 Lamount IM (1981) Water Research topics Ellis Horwood London Vol
1 PP- 222
89
3 9 Liang IG (1991) The impact of effluent regulations on dyeing industry
Rev Pro Colouration Vol 21pp56-71
4 0 Lillie R Connrsquos Biological stains Williams amp Wilkins Baltimore MD USA
4 1 Masumune S and Smith JM (1976) Adsorption Rate Stud ie s ^
significance of pore diffusion America Institute of Chemical Engineers
Journal Vol 10No 2 pp246
4 2 McCrum WA (1984) The use of second-order derivative spectroscopy
in investigation of sources of coloured pollutants in water Water Res Vol
18pp 1249-1252
43 Mierle G and R Ingram (1991) The role of Humic substances in
mobilization of Mercury from watersheds Water Air Soil Pollution Vol 56
pp349-357
44 Michelson DL (1975) Removal of soluble mercury from water by
complexinq techniques US D1 Office of water Research and Technology
Bulletin No 74 Virginia Polytechnique Institute Blackburg Va
45 Nilsson A and I Hakanson (1992) Relationship between Mercury in
lake water water colour and mercury in fish Hydrobiologia Vol
235236pp675-683
46 PaggaUMand TaegerK(1994) Development of a method for
adsorption of dyestuffs on activated sludge Water Resources Vol
28pp1051-1057
47 PootsVJP Healy JJ and Mckay G (1976) Removal of basic dve
from effluent using wood as an adsorbent Water Pollution Control
Federation Journal pp 926-934
48 Ratte ID and Bruener MM (1974) The physical chemistry of Dve
adsorption Academic Press New York and London
49 Rosen JB (1954) General Numerical Solution for Solid diffusion in Fixed
Beds Ind Eng Chem Vol 46 1590
50 Roy WR Krapac IG Chou SFJ and Griffin RA (1992) Batch-Tvne
Procedures for Estimating Soil adsorption of chemicals Illinois State
Geological Survey Chapaign Illinois 61820
51 Sawyer C N and McCarty PL (1978) Chemistry for Environmental
Engineering M c G ra w -H il l book Company
90
52 Schwarzenbach RP GsechwaldPM and Imboden DM (1993)
Environmental Organic Chemistry John Wiley and Son Inc New York
53 Sewe PO 1986(MSc Thesis) Textile wastewater Treatment and
management in Eldoret Kenya
54 Shafizadeh (1981) Thermal deterioration of wood ACS Synposium Vol
43 pp57 - 81
55 Sheath RG MO Morison JE Korch D Kaczmarczyk and KM
Cole (1986) Distribution of macroalgae in South-central Alaska USA
Hydrobiologia vol135 pp259-270
56 Sinanoglu 0 and Abdulnur S (1965) Effect of water and other solvents
on the structure of biopolvmers Federation Proceedings Vol 29 Part II pp
512-523
57 Sittig Mbdquo (19731 Pollutant Removal Handbook Noyes Patal Corporation
London England
58 Susan Budavari (1990) The Merck Index 12th Edition Merck amp Company
NJ USA
59 Tsoumis Gbdquo (1991) Science and Technology of wood Structure
Properties Utilization Chapman and Hall
60 UNEP (1993) The Textile Industry and The Environment Technical Report
No 16 pp 65-66
61 UNEP (1996) Cleaner Production in textile wet processing A Workbook
for trainers 1st Edition Paris
62 Van Soest PJ and Goering HK (1994) Forage fibre Analysis
Handbook on Animal husbandry Research Division Beltsville Maryland
20705
63 Weber WJ McGinley PM and Katz LE (1991) Sorption Phenomena in
subsurface Systems Concepts Models and effects of contaminant fate and
Transport Water Res Volm 25 No 5 pp 499-528
64 Wetzel RG (1975) Limnology WB Saunders Company Philadelphia
65 Zollinger H (1987) Colour Chemistry - Syntheses Properties and
Application of Organic Dves and Pigments VCH New York 92-102
91
ASSESSMENT OF SA WDUST POTENTIAL IN THE REMOVAL
OF DYE COLOUR FROM TEXTILE WASTEWATER
Candidate WAIRURI JK
RegNoF56817199
Supervisor Professor BNK Njoroge
A thesis submitted in partial fulfillment for the award of Master of
Science in Civil Engineering
II
Declaration
This Thesis is my original work and has not been submitted for a degree in
any other University
JK Wairuri
Candidate
Date
This thesis has been submitted for examination with my approval as
University supervisor
ProfessorB o il l i l t
TABLE OF CONTENTS
Declaration
ACRONYMS
III
VI
DEDICATION vrdquoAcknowledgementvuiL ist of Figures xL ist of appendices_XlA bstract X11
CHAPTER 1 INTRODUCTION bull bull bull bull bull bull bull bull bull bull a I
10 Backgroundl l Problems associated with Dyes and Textile Industry
12 Research objectives313 Research Justification 4
CHAPTER 2
LITERATURE REVIEW 620 PROPERTIES OF DYES621 Introduction 622 Absorption Spectra of Dyes 10
221 Why are dyes ColouredI I23 Classification of Dyes 1124 Solubility of dyes 13
241 The Congo red dye 1425 Measurement of dye concentration in a dye bath1526 Nature of Colour in aquatic and Marine Environment 1827 Effects of Colour in Aquatic and Marine Environment18281 Forces and Mechanisms of adsorption25282 T hermodynamics of adsorption Equilibra29283 PROPERTIES OF WOOD AS AN ADSORBENT30284 Desorption process 3329 Characteristics of Wood34
291 Hardwoods 34292 Soft woods34
CHAPTER 3 EXPERIMENTAL SETUP 36
MATERIALS AND METHODS 36
31 Introduction3632 Materials3633 Methods36
331 Introduction 36332 Sample Preparation37333 Experimental Procedure37
CHAPTER 4 43
40 RESULTS AND DISCUSSION 43
4 l Ph ysical and Chemical properties of Sawdust4342 v ariation of Absorbance with Dye Concentration 4443 Variation of Absorbance w it h Wavelengt h4644 Effect of shaking on Dye removal 4845 Variation of Dye removal W ith T ime (Equilibrium time) 4846 Effect of Particle size on dye removal 5047 Effect of adsorbent concentration on removal 5148 Equilibrium Studies5349 Relationship between sawdust properties and Sorption data 64
IV
410 Effect of iNmAL dye concentration on percentage removal64411 Effect of pH Variation on dye removal66
CHAPTER 5 68
CONCLUSIONS AND RECOMMENDATIONS 68
51 Conclusions 6852 Recommendations 68Appendix A I Reagents a n d Equipment69appendix A2 Chemical composition of Sawdust 71appendix A3 Variation of Absorbance with concentration72Appendix A4 Specific Gravity of Sawdust (G )72appendix A5 Variable mass Isotherm data72Appendix A6 pH versus amount of dye sorbed83appendix A7 Mean Particle size Versus dye removal at equilibrium 84appendix A8 Number of revolutions per minute versus Dye removal 84appendix A9 Freundlich constants85Appendix A 10 Initial concentration versus dye removal for Pinus spp Vitex kiniensis Octea usambrensis and Cypressus lusitanica85
V
Acronyms
ADF Acid Detergent Fibre
ADL Acid Detergent Lignin
APHA America Public Health Association
BET Breunner Emmet Teller
EDTA Ethylenediaminetetracetic Acid
CWC Cell Wall Contents
NDF Neutral Detergent Fibre
NPN Non Protein Nitrogen
UNEP United Nation Environmental
Programme
VI
DEDICATION
I dedicate this work to all men and women whom in the time past and now
have and continue to give their best in time effort and other unquantifiable
resources selflessly in stewarding Godrsquos magnificent creation
vii
Acknowledgement
In writing this research I am greatly indebted to a number of people without
who this work could not have been possible
First and foremost I greatly acknowledge ProfessorBNK Njoroge for being
my supervisor and guiding me through the entire project He gave thoughtful
insights in experimentation analysis and discussion of the results
Technical staffs in the Public Health Engineering laboratory for technical
advise availing themselves to be consulted when necessary Chairman and
technical staff of Department of Biochemistry for extending some of their
facilities and equipment for uses in this projectTechnical staff Department of
Animal production for the help extended in part of the experimentation
Staff of Woodmakers Limited for freely availing different varieties of sawdust
Fellow colleagues in the Department of Civil Engineering for their positive
critique and sincere encouragement
Thank you all may the Lord God always bless you for what you have done for
me
viii
List of Tables
Table 11 The economic evaluation of various adsorbents in dye removal
Table 21 Wavelengths of the more important colours of the visible spectrum
Table 22 Characteristics of Congo Red dye
Table 23 Average Chemical composition of softwood and hardwoods
Table 41 Chemical and physical properties of sawdust
Table 42 Concentration versus Absorbance
Table 43 Wavelength versus Absorbance
Table 44 Shaking speed versus mass of dye removed
Table 45 Dye removal versus time
Table 46 Particle size versus removal
Table 47 Adsorbent Concentration versus Dye removal
IX
List of FiguresFigure 21 Classification of Dyes by Colligators
Figure 22 Structure of Congo Red dye Molecule
Figure 23 Structure of Congo red Dye ion
Figure 24 Balanced and unbalanced atoms
Figure 25 Freundlich Isotherm model
Figure 26 Linearized BET Isotherm
Figure 27 Distribution of ions near a charged surface
Figure 28 Formation of monomolecular and polymolecular water layers on
wood surface
Figure 31 Schematic representation of Van Soest Procedures
Figure 41 Chemical composition of Sawdust
Figure 42 Calibration Curve of Congo Red dye
Figure 43 Variation of absorbance with wavelength
Figure 44 Effect of shaking speed on dye removal
Figure 45 Variation of dye removal with time
Figure 46 Effect of particle size on dye removal
Figure 47 Effect of adsorbent concentration on Dye removal
Figures 48(a)mdash-48(d) Adsorption isotherms for Cypressus lusitanica Pinus
spp Ocotea usambarebsis and Vitex keniensis
Figure 49(a) - 49(d) Effect of initial dye concentration on dye removal
Figure 410 Effect of initial pH on removal
List of AppendicesAppendix A 1 Chemicals and Equipment
Appendix A2 Chemical composition of Sawdust
Appendix A3Variation of absorbance with concentration
Appendix A4 Specific Gravity of Sawdust (Gs)
Appendix A5 Adsorption Isotherm data
Appendix A6 pH versus amount of dye sorbed
Appendix A7 Mean Particle size Versus dye removal at equilibrium
Appendix A8 Number of revolutions per minute versus Dye removal
Appendix A9 Freundlich constants
Appendix A 10 Initial concentration versus dye removal for Pinus spp Vitex
kiniensis Octea usambrensis and Cypressus lusitanica
XI
Abstract
The potential of hardwood and softwood sawdust as low cost adsorbents in
the removal of a disazo dye (Congo Red) from water was evaluated Two
softwoods Cypress (Cypressus lusitanica) and Pine (Pinus spp) and two
hardwoods Camphor (Ocotea usambarebsis) and Meru oak (Vitex keniensis)
were used in the studies Those materials were selected on the basis of their
relative abundance as a waste in the timber mills industry
Sawdust was found to have potential in removing Congo red dye from
wastewater The interaction of dye and the sawdust conform to Freundlich
adsorption model with softwoods showing a higher potential both in capacity
and intensity of removing Congo red dye from wastewater than hardwoods
The coefficients of Freundlich equilibrium model k and n show that Cypress
(Cypressus lusitanica) had the highest potential having k and n values of 040
and 179 respectively followed Pine (Pinus spp) with k and n values of 033
and 105 while Meru oak and Camphor had the two values being 023 and
0823 and 00069 and 0619 respectively
The higher dye uptake by softwood sawdust is attributable to more pore
spaces and high specific surface area for adsorption than hardwood The
softwoods had lower densities than hardwoods and thus the far more porous
The adsorption correlated positively with the hemicellulose extract of the
sawdust which was high in cypress pine Meru oak and Camphor in that
order Cellulose and lignin content correlated negatively with the adsorption
capacity and intensity
Xll
CHAPTER 1 Introduction
10 BackgroundColour removal is a pertinent problem for all categories of textile effluents due
to the variety of chemicals used in fabric dyeing and printing Apart from the
deterioration in the aesthetic value of the receiving water bodies the presence
of colour makes water reuse difficult (UNEP 1993)
When colour removal is necessary the following provides useful treatment
technology
bull Segregation of all print wastes and disposal of each separately to landfill
bull Reduction of colour shop losses by careful hand cleaning of all brushes
troughs doctors blades cans tanks screens
bull In all weaving mills reduce use of fugitive tints in weaving
bull Exhaustion of dye thoroughly in the dyeing process
bull Use of dye processes that can cause less colour losses eg solvent pad
and stream microfoam methanol and ammonia dyeing method
Incase dye colour finds way into waste stream removal may be achieved by
techniques such as
1 Chemical coagulation It is generally applied to remove colour arising from
dyes such as dispersed vat and sulphur dyes Coagulants such as alum
and ferric sulphate applied at a dose of 300 - 600 mgl and lime at a dose
approximately 300 - 600 mgl will remove 75 -90 of colour (UNEP 1993)
These dosages are very high making chemical coagulation an expensive
colour removal technique Chemical coagulation cannot however achieve
satisfactory removal of soluble dyes
2 Adsorption It is an efficient and popular method of colour removal Several
adsorbents are known to be capable of removing dyes from textile effluent
These include activated carbon fullers earth fly ash fired clay baggasse
pith wood peat etc (Poots et al 1978) Techniques to regenerate
adsorbents include the use of bouler water organic solvents and catalytic
oxidation The pH must be adjusted to near neutral and suspended
particulates must be removed for adsorption unit to function properly
i
3 Colour removal in biological treatment It can be improved by addition of
powdered carbon (as a catalyst) to the aeration basin in activated sludge
system ( UNEP 1993) This system will not remove colour as efficiently as
adsorption However an additional 20-55 reduction in colour can be
realised from this process
Other promising techniques for colour removal are ozonation and
hyperfiltration (UNEP 1993)
11 Problems associated w ith Dyes and Textile Industry
Dyes have been reported to be among the different pollutants of aquatic
ecosystems with world production estimated at 640000 tonnes in 1978(Clarke
and Anliker 1980) Dyes used contain many compounds whose
environmental behaviour is largely unknown (Baughman and Perinich1988)
Although most dyes are considered inert or nontoxic Some are not totally
innocuous (Liang 1991) Anliker etal (1981) showed that dispersed dyes
have high partition coefficient and solubility suggesting significant potential for
bioconcentration
In addition to this it has been reported that the bulk of these are used in
textile industry Textile industries have the markets demanding better
performance each year (Jones 1974) Dyes have to be resistant to ozone
nitric oxides light hydrolysis and other degradative environments (Pagga and
Taeger1994) Studies on biological degradation of dyestuffs yields negative
results as indicated above since the dyes themselves are designed to resist
this type of treatment The high colour value or absoptivity needed for a
commercial dye is not an advantage when it ends up in a wastestream
Although some dyes are biologically degradable as noted by Pratt (1968)
most that are present in wastewater are objectionable for their colouration
Dyes are too refractory to undergo degradation in the time required for
conventional treatment The auxiliary chemicals used in aqueous dyeing can
also present a problem to biological processes Carriers such as methyl
naphthalene chloro-benzenes biphenols orthophenyl phenol and benzyl
alcohol are used to speed up the dyeing process These chemicals may
eventually find their way into the receiving waters when the dyeing process is
completed (Jones 1974)
Also untreated effluents from dyestuff production and dyeing mills may be
highly coloured and thus particularly objectionable if discharged into open
waters The concentration of the dye may be much less than 1 ppm but the
dye is visible even in small concentrations the transparency of streams would
also be reduced Because dyes absorb sunlight plants in the drainage stream
may perish thus the ecosystem of the streams may be seriously affected
Possible chronic risks of colourants and their intermediaries are
carcinogenicity and to a lesser extent sensitization and allergies (Huang and
Jang 1993)
In the past Kenya has experienced serious pollution problems resulting from
discharge of dye waste into municipal waste treatment works Investigations
carried out on industrial effluents in Eldoret by OMS-Klaranlagen in 1985
confirmed that damage had occurred to the Eldoret sewage stabilization
ponds due to high pH of the influent dye stuff from textile industries and lack
of pretreatment of industrial wastewater especially those from textile
industries (Sewe 1986) Presently textile dyeing by industries in Kenyarsquos
Export Processing Zone (EPZ) present give rise to coloured effluent which is
discharged untreated to open streams This poses a real challenge to the
ecological balance in the streams
12 Research objectives
The objectives of the research were-
1 To establish the properties of Cypress (Cypressus lusitanica) Camphor
(Ocotea usambarebsis) Pine (Pinus spp) and Meru Oak (Vitex keniensis)
wood sawdust as adsorbents
2 To assess the potential of sawdust in removal of Congo Red dye from
simulated wastewater
3
13 Research Justification
Coloured effluent especially from textile industries and dyestuff houses poses
a great challenge both to the environment and the industry Various
techniques have been used in removal of colour from dyestuff wastes These
include chemical oxidation froth floatation photochemical degradation
activated carbon adsorption and coagulation
Chemical degradation by oxidation with chlorine or ozone is effective but the
oxidant requirements are high and expensive The effectiveness of
decolourisation by oxidation process is reduced by impurities in the
wastewater It may increase the amount of exhausted chlorine or ozone in the
water and hence the treatment cost Chlorine treatment works well with
monoazo and anthraquinone anionic dyes but unsatisfactorily with disperse
and direct azo dyes ( Zollinger 1987)
The coagulation process only decolourises insoluble dyes such as dispersed
but does not work vell with soluble dyes (Kuo 1992)
Photochemical degradation in aqueous solution is likely to progress slowly as
synthetic dyes are in principle designed to possess high stability in light
Adsorption technique has been tried using activated carbon and is still the
most popular and widely used adsorbent however there are certain problems
with its use Activated carbon is quite expensive and the higher the quality the
greater the cost furthermore regeneration using solutions produces an
additional effluent although quite small In addition activated carbon is quite
expensive and the higher the quality the greater the cost On the other hand a
brief economic comparison made between different adsorbents under similar
experimental conditions by Poots et al (1978) showed that wood and peat
are effectively the most economical adsorbents for basic dye removal
Activated carbon removes most of dye on a unit weight basis while activated
alumina is the most expensive because of its high cost and poor ability to
remove basic dyes (Poots et al 1978)
4
Table 11 shows the economic evaluation of various adsorbents in dye
removal (Poots et al 1978)
Absorbent
Material
Comparative
cost per Kg
Adsorbent
Comparative
cost to
remove 1g of
Dye
Mass(g)
Adsorbent to
remove 1 g
Dye
Time (min) to
90
Equilibrium
Carbon 100 100 13 150
Peat 004 007 24 200
Wood 001 007 89 200
Alumina 182 550 400 500
Fullerrsquos Earth 066 202 20 200
5
CHAPTER 2
LITERATURE REVIEW
20 PROPERTIES OF DYES
21 IntroductionWith few exceptions all dyes are aromatic organic compounds They are
divide into three main groups non-ionic anionic and cationic The molecules
of ionic (anionic or cationic) dyes are composed of two main parts one of
which is a complex aryl radical This is the colour-imparting ion If the balance
of the charge on the latter is negative then the dye is classed as anionic On
the other hand if the balance of charge on the ion is positive then the dye is
classed cationic
The second part of an ionic dye molecule is an inorganic ion (an aliphatic
organic ion or in a few cases an aryl ion) The former is called the gegen-ion
and the latter the dye ion The function of the gegen-ion is to balance the
charge on the dye-ion and to render the dye soluble in water With few
exceptions anionic dyes are manufactured as metallic salts The vast majority
of anionic dyes are sodium salts of carboxylic acids uranine being the most
notable In case of cationic dyes gegen ion is usually the chloride ion In vast
majority of cases the gegen-ion could be replaced by another of the same
charge without seriously effecting the functioning of the dye For example a
calcium salt might be less soluble in water than a sodium salt Similarly a
sulphate might be less soluble in water than a chloride When dyes are used
as reagents for the detection of certain ions due consideration has to be
given to the gegen-ion of the dyes However unless the gegen-ion itself is
coloured it has no influence whatever upon the colour of the dye ion in
aqueous solution For example pararosanaline chloride or sulphate or acetate
exhibits exactly the same colour in solution On the other hand the dye ion
cannot be replaced by another ion without profound changes in the nature
and the functioning of the dye molecule The individual chemical physical and
tinctorial characteristics of a dye are due to its dye ion
6
The simple gegen-ion of a dye could be replaced by another dye-ion of the
same charge as the original gegen-ion and of opposite charge to that of the
first dye-ion This would result in the formation of a polychrome compound
dye Such dyes are prepared for special purposes and their molecules
consists of an electro-positively charged dye-ion and a negatively charged
dye-ion Dyes of this kind are insoluble in water but soluble in absolute and
aqueous alcohol Partial dissociation takes place in the latter Such dyes are
used in biological micro-technique for differential staining of acidic and basic
elements of cells and tissues
The colour index gives the structures of about 2100 anionic dyes and
classifies them variously as ldquoacid ldquobasicrdquo ldquodirectrdquo and mordantrdquo according to
the manner of usage in the textile-dyeing industry About 1400 of these
anionic dyes are amino dyes or imino amino acids The remainder are wholly
acid in that they have no basic side-chains
By definition an ldquoacidrdquo dye is one which dyes wool from a dye bath which
contains acid Such dyes now however find their application not only for wool
but also for silk polyamide acrylic and regenerated protein fibres They are
applied from dye baths containing sulphuric or formic or acetic acid or
ammonium sulphate sometimes from a neutral and occasionally from a
slightly alkaline bath
According to colour index rsquorsquodirect dyes are originally designed and marketed
for the primary purpose of dyeing celiulosic fibres such dyes having being
defined as lsquoAnionic dyes having affinity for celiulosic fibres when applied from
an aqueous dyebath containing electrolyte Direct dyes provide the simplest
means of colouring celiulosic materials as they are normally applied in the
textile dyeing industry from a neutral to a slightly alkaline dyebath at or near
boiling point to which sodium chloride and sodium sulphate is added Direct
dyes are anionic- most are amphoteric since they possess side chains which
are basic in reaction
7
Mordant dyes are described as dyes having the property of combining with
metallic oxides and salts to form metallic complexes Dyes of this class are
however very difficult to define The colour Index states that the make-up of
this class not as a matter of strict definition but of a convention which has
grown up over the years and which has no logical basis The majority of dyes
are used with the acid of the mordants in the textile industry mainly for
dyeing wool the secondary application being for dyeing silk and nylon and for
printing on cellulose silk and wool fabrics The major classification of dyes by
colligators is shown in Figure 21
8
Synthetic Organic Dyes
GROUP 1
NON-IONIC DYES
Class 1
Acidic
Class 2
Basic
Class 3
Neutral
Class 4
Amphoteric
GROUP 2
CATIONIC DYES
Class 1
Wholly basic dyes
Class 2
Basic dyes having
acidic side-chains
GROUP 3
ANIONIC DYES
Sub-Group 1
Wholly acid dyes
Class 1 Class 2 Class 3
Carboxylated dyes Carboxylated dyes Sulphonated dyes
OH
Without -OH with -OH groups
as
groups
only
Class 4 Class 5 Class 6
Sulphonated dyes Sulphonated dyes With -
without -OH groups with -OH groups with carboxyl groups groups
and -OH groups their
colligators
Sub-Group 2 Sub-Group 3
Weahly amphoteric dyes_____ Moderately or strongly amphoteric dyes
Class 1 Class 2 Class 1 Class 2 Class 3
Without -OH groups With -OH groups Without -OH groups With -OH groups With -
OH
groups as
their
only acidic
colligators
Figure 21 Classification of Dyes by Colligators
9
22 Absorption Spectra of Dyes
The wavelength of maximum absorption for each dye is given for the visible
spectral region White light is composed of light of the entire spectral range
And an object appears coloured in ordinary white light because it absorbs
some of the spectral radiation but not all The unabsorbed colour is reflected
or transmitted and is the colour of the object as it appears to the eye Objects
which appear black absorb the whole of the visible spectral range without
transmitting or reflecting any component of the white light If a coloured object
illuminated by a source of white light is examined with spectroscope it will be
seen that the light reflected or transmitted by the object does not show the
complete visible spectral range On the other hand if the object is blue-green
then the red will be missing from the spectrum Red and blue-green are
therefore regarded in this respect as complementary colours Table 21 shows
colour in the visible light and their complimentary colours
Table 21 shows wavelengths of the more important complimentary colours of
the visible spectrumfadopted from Gurr 1971)
Wavelength
(mm)
Colour Complementary
colour
400-430 violet Greenish-yellow
430-490 blue Greenish-orange
490-510 blue-green Red
510-530 green Purple
530-560 yellow-green Violet
560-590 yellow Blue
590-610 orange Greenish-blue
610-750 red blue-green
Absorption often takes place in more than one region of the visible spectrum
and the colour observed also depends upon the intensity of absorption The
absorption spectra obtained by the spectrophotometer are characteristic of the
individual dyes they might be regarded as their fingerprints However
variations in the wavelengths of maximum absorption of many dyes with
10
variations in the pH temperature and concentration of the solution examined
(Gurr 1971)
221 Why are dyes Coloured
Colour in dyes is explained as a consequence of the presence of a
chromophore By definition chromophores are atomic configurations that
contain delocalised electrons They are usually represented as nitrogen
carbon oxygen and suphur that have alternate single and double bonds
(httpmembersDaonlinecom) Below are some chromophoric configuration-
-C=C- -C=N- -C=0- -N=N- -N 02 and -Quinoid rings
On the other hand dyes are aromatic compounds and their structures include
aryl rings which have delocalised electron systems These are responsible for
the absorption of electromagnetic radiation of varying wavelengths depending
on the energy of the electron clouds For this reason chromophores do not
make dyes coloured in the sense that they confer on them the ability to absorb
radiation Rather chromophores function by altering the energy in the
delocalised electron in the dye and this alteration results in the compound
absorbing radiation from within the visible range instead of outside it Our
eyes detect that absorption and respond to the lack of a complete range of
wavelengths by seeing colour (Fessenden and Fessnden1990)
23 Classification of Dyes
There are various methods of dyeing and many more types of dyes for each
method There are however six main classes of dyes for cotton fabric vat
direct developed naphthol sulphur and analine black
Vat dyes known as fast dyes are insoluble in water An acid rinse (acetic
acid) is used to neutralise the alkali present in the dye bath followed by
detergent washing to produce brightness and wash resistance
Direct dyes are so named because they are applied to the fibres without preshy
application of chemicals required for retention Some direct dyes are subject
to post treatment with copper sulphate and acetic acid to increase light
11
fastness and potassium dichromate and acetic or formaldehyde to increase
wash fastness
Developed dyeing is a procedure whereby two different chemicals are
employed The first chemical (05 - 4) is applied and absorbed into the
fibres The second chemical (developer) is then applied and reaction with the
first takes place directly on the fibre for stable colour development
Naphthol dyeing is developed dyeing in reverse A cloth is first impregnated
with developer and then the dye is formed on the fibre by saturation in the dye
bath In the actual process the naphthol dye is dissolved by mixing either
sodium hydroxide under heat or ethyl alcohol and cold solution of sodium
hydroxide
Sulphur dyes are principally used to dye heavy cottons in shades of blacks
dark blues browns and other dark colours The dyes are generally water
insoluble and require dissolving in an alkaline solution before application The
manufacture and use of sulphur dyes results in the formation of a toxic and
highly alkaline waste liquor which cannot be disposed of in a conventional
manner since it unduly pollutes and stagnates fresh water rivers and streams
These waste liquors are highly coloured and odiferous The sulphide or other
alkali sulphides contained therein hydrolyses with water and forms hydrogen
sulphide which is toxic to marine life and has foul disagreable odour
No wholly suitable means for the treatment or disposal of this liquors is
known Neutralization treatments of these alkaline liquors such as with
sulphuric acid results in the formation of a highly turbid suspension and
evolution of large quantities of hydrogen sulphide gas Such acid treatment
does not improve the colour of these waste liquors (Sittig1973) It has now
been found that sulphur dyes waste liquors can be deodorized decolourized
neutralized and otherwise purified by treatment with an aqueous sulphurous
acid It is necessary that the liquor be mixed with sulphurous acid within a
limited time and that the ratio of the liquor to acid or the initial pH be controlled
within relatively close limits Under such conditions the sulphurous acid react
12
with the toxic colour and odour producing components of the waste liquor
coagulating the undesirable components of there of and forming a stabilized
clear solution phase The coagulated fractions can then be removed from the
clear solution by filtration decantation centrifugation and any separation
technique and solution disposed of in a river or other waterway without danger
of pollution or stagnation of the water
Analine black dye is an insoluble pigment produced by oxidation of Analine
The cloth is passed through dye bath typically consisting of 42 kg of Analine
hydrochloride 16 kg of sodium Chlorate and 6 kg of copper sulphate in 455
litres of water After impregnation the cloth is given a steam treatment to
develop the black pigment Alkaline sodium dichromate treatment completes
the process
24 Solubility of dyes
Many water-soluble dyes owe their solubility to the presence of at least one
sulphonic acid group and they are usually applied as sodium salts In most
cases sulphonic groups are introduced into the intermediates from which the
dye is made but sometimes an insoluble dye is sulphonated Water-soluble
basic dyes contain no sulphonic acid group but are prepared in the form of
hypochlorides Water-insoluble dyes of certain types can be rendered soluble
in this form and then converted on the fibre into the original insoluble form
The sulphur and vat dyes depend on this principle which enables tint fastness
onto wet treatments obtained Insoluble azo dyes can be formed directly
within the fibre
Gurr 1971 used 17 symbols to describe the relative solubility of dyes in
various solvents at 20deg C These are as follows
- = insoluble
s- = only very slightly soluble
s = slightly soluble the amount of dyestuff dissolved being insufficient to
render the solution of practical use as a colourant
s+ = slightly soluble the amount of dyestuff dissolved might be sufficient to
render the solution of use as a feeble colourant
13
P- = slightly more soluble than s+
P = slightly more soluble than p-
P+ = slightly more soluble than p
M- = moderately soluble (around 1 )
M = slightly more soluble than m-
M+ = slightly more soluble than m
R- = slightly more soluble than M+
R = readily soluble
R+ = very readily soluble (to the extent of around 5- 7 )
V- = slightly more soluble than R+
V = more soluble than V-
V+= more soluble than V
H = highly soluble (usually around 20 )
s- s s+ P- P P+ denote varying degrees of low solubility
M-t M M+ denote three different degrees of moderate solubility
R- R R+ denote varying degrees of good solubility
V- V V+ and H denote high solubility
In this regard Congo Red was found to have good solubility in water and was
classified as R-
241 The Congo red dyeCongo red is an example of a diazo dye This is characterised by the
presence of two azo groups (-N=N-) as a chromophore This dye is made by
coupling a diazonium salt with an amine The structures are shown in Figures
22 and 23 Other characteristics of the dye are given in Table 22
n h 2
N = N-
Fig 22 Structure of Conge Fled dye Molecule
14
Table 22 Characteristics of Congo Red dye
Common name Congo red
Other names Direct red Cotton red
Cl number 22120
Cl name Direct red
Class Disazo
Ionisation Acid
Solubility in water Soluble
Solubility in ethanol 019
Wavelength of Maximum
Absorption
488(Merck) 497 ( Conn)
Colour Red
Empirical Formula C32H22N60 6S2Na2
Formula weight 696696
As such the dye being a strong electrolyte readily ionises to the dye ion
containing the sulphonic acid group and the sodium ion as shown below
Fig 23 Structure of Congo Red Dye ion
25 Measurement of dye concentration in a dye bath
In order to obtain the concentration of a dye bath it is necessary to determine
the absorption of light through a portion of the bath diluted if need be Colour
is a sensation resulting from the perception of visible radiation over a wide
range of wavelength and embodies such factors as the depth of colour
Visual comparison is the method of choice for colour measurement when the
object is to assess the appearance of a water sample for aesthetic purposes
Instrumental methods which determine only the absorption of light at limited
15
range of wavelength are objective and provide accurate and precise
measurements but do not measure the optical properties as visual
comparison
In the visual comparison technique the colour intensity of the sample is
compared with that of a series of standard solutions or permanent glass
standards to obtain a colour match The instrumental method measures the
absorption of light of a permanent set by sample Both visual and photometric
determination rely on the fact that the depth of colour (absorbance) is
governed by the concentration of the material in the solution (Lamount 1981)
Colour is measured by optical density (D) on the spectrophotometer and the
whole colour band should be scanned
When light (monochromatic or heterogeneous is incident upon a homogenous
medium a part of the incident light is reflected a part is absorbed by the
medium and the remainder is allowed to transmit
If IO denotes the incident light IR the reflected light IA the absorbed light and
IT the transmitted light then
IO= IA+IT+IR Eq 21
If a comparison cell is used the value of IR which is very small (about 4)
can be eliminated for air-glass interfaces Under this conditions
IO= IA+IT Eq 22
Lambertrsquos Law
ldquoWhen a beam of light is allowed to pass through a transparent medium the
rate of decrease of intensity with the thickness of medium is directly
proportional to the intensity of the light
Mathematically
dldt=kt Eq 23
Where lo = intensity of incident light
t denotes the thickness of the medium
k denotes the proportionality constant
Integrating and putting l=lo when l=0
16
we get
In Iolr = Kt
It = lo 6 kt
It= l0exp(-kcl)
Eq 24
Eq 25
Eq 26
Where
IT = the transmitted light
IO = the incident light
c = concentration of the absorbing species
= cell length
k = extinction coefficient
The optical density D is by definition
D = logio (IoIt) = 0434kcl Eq 27
D is therefore proportional to the cell length and dependent on wavelength
through coefficient k (Environmental Technology letters 1986) The first step
in photometric or spectrophotometric analysis involves the establishment of
working conditions and the preparation of a calibration curve relating to the
absorbance Spectrophotometric absorbance measurements are ordinarily
made at a wavelength corresponding to an absorption peak because the
change in absorbance per unit concentration is greatest at this point the
maximum sensitivity is thus realised In addition the absorption curve is often
flat in this region under these circumstances a good adherence to Beerrsquos
Law can be expected Finally measurements are less sensitive to
uncertainties arising from failure to reproduce precisely the wavelength setting
of the instrument Variables that influence the absorption spectrum of a
substance include the nature of the solvent the pH of the solution the
temperature high electrolyte concentration and the presence of interfering
substances The effect of these substances must be known conditions for the
analysis it is necessary to prepare a calibration curve from a series of
standard solutions These standards should approximate the overall
composition of the actual samples and should cover a reasonable
concentration range of the analyte It is safe to assume adherence to Beers
Law and use only a single standard to determine the molar absorptivity The
results of the analysis should never be based on a literature value for molar
absorptivity
17
26 Nature of Colour in Aquatic and Marine Environment
The observed colour in water is the result of light back scattered upward from
a water body after it has passed through the water to various depths and
undergone selective absorption The colour of light (ie wavelength) and the
turbidity of water determines the depth to which light penetrates in the water
system (Canadian Council of Ministers of Environment 2001) In pure water
light is highly absorbed in the infra-red region of the light spectrum and poorly
absorbed in the blue region Thus blue light is refracted reflected andor reshy
emitted back causing the visible colour of the water to be blue (Jerome 1994)
The colour of water is characterised as true or apparent True colour depends
on dissolve fraction in water which can include natural minerals such as ferric
hydroxide and dissolved substances such as humic or fulvic acid (Hongre and
Akesson 1996) Dyes (eg Acid blue toilet flush) wood preservatives
antisapstains and various other dissolved organic substances from
anthropogenic sources may also contribute to water colouration
(McCrum 1984 Brown 1987 Boegeding and Hites 1994) Colour also
depends on factors that affect the solubility and stability of the dissolved and
particulate fractions of water such as pH and temperature True Colour is
measured by comparator and calorimetric methods
Apparent colour is a function of dissolved and suspended material such as
organic plant debris phytoplanton and zooplanktons and inorganic
suspended sediments (Effler and Aver 1987 APHA 1992 Bennett and Drikas
1993) Apparent color is commonly estimated by light
transmittanceabsorbance through water
27 Effects of Colour in Aquatic and Marine Environment
Numerous studies have demonstrated a strong positive correlation between
primary production and water colour in fresh water (Henebry and Cairns 1984
Arvola 1986 llmarvia and Hutte 1989 Del Giorgio and Peters 1994) The
colour of water may affect algal species composition as photosynthetic
efficiency at various wavelengths differs markedly among algal groups
18
according to the amounts of accessory pigments accompanying chlorophyll a
( Atlas and Bannister 1980 Arvola 1986 Sheath et al1986 Vegas-Vilarrubia
1995)
Wetzel (1975) and Juarez (1987) in the Canadian Water Quality Guidelines
for protection of aquatic life Colour state that many invertebrate species
possess visual receptors and absorption spectrum peaks that correspond to
the spectral quality of their preferred habitats (Canadian Council of Ministers
of Environment 2001) Thus changes in the spectral quality of water
therefore could have profound effects on the behavour of some invertabrates
and fish species
Mierle and Ingram (1991) Nilsson and Hakanson 1992 Haine etal 1995
record that Mercury availability bioaccumulation and hence toxicity increases
as water colour increases The reason for this relationship in part is that
mercury brought from the surrounding environment is attached to coloured
substances(opcit)
28 ADSORPTION PHENOMENA
Adsorption is the accumulation of a solute to a surface or interface between
the solution and the adsorbent Adsorption processes generally yield surface
or interface concentrations of solute greater than those in the bulk phase The
driving forces for attainment of chemical equilibrium in the homogenous
phases relate to the reduction of the free energies of the bulk system
whereas the driving force for a surface reaction is a reduction in surface
energy (Weber et al 1991)
There are two types of adsorption Physical adsorption may be explained in
terms of the energy per unit area of the solid Molecules in the interior of any
solid are subjected to equal forces in all directions whereas molecules on the
surface of the solid are subjected to unbalanced forces as shown in Figure
24 Other molecules becoming attached to the surface can balance these
forces The attractive forces are relatively weak and are of Van der Waals
type
19
Fig 24 Balanced and unbalanced atoms
Chemical adsorption takes place by chemical interaction between the surface
of the solid and the molecules of the liquid
Absorption is a process in which solute transferred from one phase to another
interpenetrates the sorbent phase by at least several nanometers The
differences in molecular environments of a contaminant in aqueous and
sorbent phases which manifest themselves in absorption processes can be
described using classical thermodynamics
Sorption is the process by which chemicals become associated with solid
phase This term is general encompassing adsorption (adsorption onto a two
dimensional surface) and absorption (into a three-dimensional matrix)
(Schwarzenbach et al 1993) Theories of sorption are based on the principle
that the three main steps are involved in the process any of which is the rateshy
controlling factor The rate steps are
bull boundary layer mass transfer control across the liquid film surrounding
each particle (Masumune 1964)
bull Particle diffusion control due to diffusion in the liquid contained in the pores
and the adsorbate along the pore walls (Rosen 1954)
bull surface adsorption control based on the rate of adsorption and desorption
at some specified radius within the particles
20
When we are interested in assessing the equilibrium proportion of a particular
chemicalrsquos presence in association with solids for any particular volume of
aquatic environment we begin by considering how the total sorbate
concentration associated with the sorbent qe (molkg1) depends on the total
concentration in the solution Ce (molL1) Such a relationship is referred to as
sorption isotherm The term isotherm is used to indicate that one is
considering sorption at a constant temperature Experimentally determined
isotherms commonly fit the empirical relationship
This equation is known as Freundlich isotherm K is referred to as Freudlich
constant and n is a measure of the nonlinearity involved Case 1 in Figure 22
(nlt1) reflects the situation in which at higher and higher sorbate
concentration it becomes more and more difficult to sorb more molecules
This may occur in the cases where specific binding sites become filled or
remaining sites are less attractive to the sorbate molecules Case 3 (ngt1)
describes the contrasting situation in which the previously sorbed molecules
lead to a modification of the surface which favours further sorption Case 2
(n=1) reflects those situations in which the attractiveness of the solid for the
sorbate remains the same for all levels of qe This is so called linear isotherm
case
Eq 281
i iCase 2 n=1
(molkg1)
cc (moll1)
Fig 25 Freundlich Isotherms
21
The rate of adsorption of a molecule onto a surface can be expressed in the
same manner as any kinetic expression ie
Rads = kC Eq 282
Where Rads -rate of adsorption
x- Kinetic order
k - rate constant
C - gas phase concentration
or
Rads = k rsquoP Eq 283
Where x - kinetic order
krsquo - rate constant
P - partial pressure of the molecule
If the rate constant in either of the above expressions in an Arrhenius form
then we obtain kinetic equation of the form
Rads = ACexp(-EaRT) Eq 284
Where Ea is the activation energy for adsorption and A the pre-exponential
(frequency) factor
Other equations which are used frequently used in describing adsorption
isotherms and which can be derived from fundamental considerations are
Langmuir and BET isotherm developed by Bruneur Emmett and Teller
The Langmuir isotherm is used to describe single layer adsorption and can be
written as follows
Cy =aym +cym Eq 285
ym -represents maximum adsorption that can take place in grams adsorbate
per gram sorbent
C - is large relative to a
When y approaches ym coverage of the surface is essentially complete If Cy
is plotted against c a straight line is obtained from which constants a and ym
can be evaluated
The BET type of adsorption is generally more applicable than the Langmuir
isotherm and it corresponds to multi-layer adsorption The model assumes
22
that a number of layers of adsorbate accumulate at the surface and that the
Langmuir isotherm applies to each layer It takes the form
Ce(Cle)[1 CsCe)]=1BQmax+(B-1 )BQmax)(CeCs) EC|286
Where Qmax represents maximum adsorbate per mass of adsorbent Cs is
saturation concentration and B is a constant
23
BET equation is represented in straight line form as in Figure 26
Figure 26 Linearized BET Isotherm
With this equation Cs and b can be obtained from the slope and the intercept
of the straight-line best fitting of the plot of the left side versus ccs The best
isotherm equation to use in a particular instance can be determined by
comparing the goodness of the fit of the data when plotted in the form for each
isotherm which yields a straight line
In any practical process the removal of a contaminant from a gas or liquid is
determined by the rate at which the material is adsorbed onto the solid
surface Three major steps can be identified in the removal of a contaminant
by adsorption-
bull It must move from the liquid or gaseous phase through a surface film to the
exterior of the adsorbent
bull It must pass by diffusion into and through the pores of the adsorbent
bull It must be attached to the adsorbent
24
281 Forces and Mechanisms of adsorptionThe physiochemical forces and mechanisms thought to be responsible for the
adsorption of ions and molecules are-
2811 London -Van der Waals forces
They are attractive forces which arise from momentary dipoles about atoms
or molecules caused by small perturbations of electronic motions The dipoles
induce small dipoles in the neighbouring atoms of opposite sign Although the
momentary dipoles and induced dipoles are constantly changing positions and
sign the net result is a weak attraction (4 to 8 kJ mol) for small molecules
and atoms) The forces are important in adsorption of organics and are
generally attributed to non-ideal behaviour in gases( Roy et al 1992)
2812 Coulombic-electrostatic-chemical
An electrostatic force results from a charged surface due to substitution in the
mineral lattice (permanent charge) or protonation of surface oxygen and OH
group (pH dependent charge) and an oppositely charged species which
maintains electro-neutrality of the surface In layer silicates substitution of
octahedrally or tetrahedrally coordinated cations by cations of lower valence
results in a net negative charge This excess charge can bring about the
formation of a diffuse layer of positively charged atoms or molecules about the
colloid the density of this layer is greater at the surface and the decreases
exponentially to the level of bulk solution This type of reaction is important in
adsorption of inorganic and ionized organic molecules
When the adsorbent and the adsorbate bear a charge ie both are ionised
then attractive forces are inversely related to the distance between the charge
centres Dyes may be anionic or cationic and adsorbing substrates such as
proteins carbohydrates and polyamides may be charged also Even if the
adsorbent bears no formal charge before adsorption of a dye ion the process
of adsorption produces a surface charge and the surface potential is
determined by the adsorbed dye ions Coloumbic interactions can either
favour or disfavour dye adsorption so that they may be regarded as binding or
25
anti-binding The presence of a charge on the adsorbing surface confers upon
it an electric potential which simultaneously attracts oppositely charged
(counter) ions and repels similarly charged ions (co-) ions As the distance
from the charged surface increases the effect of the surface potential
becomes less Thus the surface potential is only apparent over a limited
distance in all practical sense and within this limited distance the entire
imbalance of ionic concentrations near the surface is combined This means
that near to the surface exists a diffuse layer and since within it there will be a
separation it is termed as an electrical double layer
Excess ionic concentration
Distance from the surface ( AdoDted from Ratte
Fig 27 Distribution of ions near a charged surface
Three main coloumbic effects are encountered in dye adsorption
diams The presence of acid may determine the potentials of the adsorbing
phase to make it more or less attractive to dye ions eg proteins
contain positive (NH3+) and negative (COO) groups In acid the
carboxyl groups are back titrated giving the fibre a positive charge
favourable to the uptake of dye anion Cellulose contains hydroxyl
groups which in the presence of an alkali may ionise giving the fibre
a negative charge repelling the dye ions and preventing their
absorption
diams Dye ions will be adsorbed by uncharged substrates to a very limited
degree since the first few molecules taken up will confer on the fibre
a charge repelling other similarly charged ions This effect is most
26
marked in relatively hydrophobic fibres since the volume of water
taken up broadly corresponds to the double layer volume and when
this is small the charge effects will be concentrated
diams Dye ions will be taken up without hindrance by a substrate of
opposite charge but in doing so they will reduce the potential of the
substrate eventually to zero when the adsorbed ion concentration
equals that of fixed charges Since further absorption will meet
constraints mentioned above the substrate may appear to be
saturated with dye ion at this point (Ratte 1974)
2813 Hydrogen Bonding
A hydrogen atom is bonded to two or more atoms the bond is generally
conceived as an induced dipole phenomenon No universal agreement has
been reached on the description of the hydrogen bond but it may be
considered as asymmetric electron distribution of the 1s electron of the
hydrogen atom by very electronegative atoms (FO C l)
A hydrogen bond may be formed when a covalently bound hydrogen exists
between two electronegative atoms Since the appropriate groups eg OH
NHR CF3 are fairly common in dye molecules and substrates it is not
surprising that hydrogen bonding should be postulated as a potential binding
force for dyes in aggregates and with substrates The hydrogen bond is
relatively weak one the bond energy lying in the range 2-10 Kcalmole Its
formation involves also low activation energy The strength of a hydrogen
bond depends upon the Electro-negativity of the bound atoms so that fluorine
forms much stronger hydrogen bonds than chlorine The hydrogen bonding
power of an atom can be enhanced by inductive effects and substitution so
that RNH3+contains a more powerful hydrogen bonding than R-NH2
When we consider a dye molecule and substrate in aqueous medium then if
there is any possibility of the two becoming associated through a hydrogen
bond then the relevant residues will be hydrogen bonded with water prior to
the anticipated association Hydrogen bonding between the dye and the
substrate will then require breaking the water hydrogen bonds
27
Alternatively hydrogen bonding groups in the substance may be associated
with one another (intra-molecular hydrogen bonding) so that involvement with
the dye molecule will again require two hydrogen bonds to be broken for each
one formed in the adsorption Where the two broken hydrogen bonds involves
water it is possible for the two water molecules freed to bond together and
with an intra-molecular hydrogen bond for the free group to bond with water
so that there is no net charge in the number of bonds
Another form of hydrogen bonding is one in which the delocalised electrons of
a conjugated ring system provide an electronegative centre for involvement in
a bond eg benzene will interact with proton donor substances eg methanol
to form a hydrogen bond
2814 Ligand exchange -anion penetration-coordination
Many atoms or molecules for coordinated complexes with ligands that range
in complexity from simple molecules to extensive chelate complexes The
coordinated complexes may carry a net negative charge that may be localized
on some part of the complex These complexes may inturn be bonded to the
surfaces by hydrogen bonding or by polyvalent cation linking the complex to a
charged surface The bonded coordinated complexes may be displaced by
other coordinated complexes that better satisfy electro-neutrality requirements
(ie are stronger complexing agents) while being restrand by steric limitations
The energy of ligand exchange reactions with inorganic ion ranges from 8 to
60 kJmol
2815 Chemisorption
In this adsorption process an actual chemical bond usually covalent is
formed between the molecules and surface atoms A molecule undergoing
chemisorption may loose its identity as the atoms are rearranged forming
new compounds at the demand of the unsatisfied valencies of the surface
atoms The enthalpy of chemisorption (h gt29KJMol) is much greater than for
physical adsorption -ligand exchange reactions are forms of chemisorption
28
2816 Dipole-dipole or orientation Energy
This interaction results from the attraction of a permanent dipole for another
dipole The resulting energy of attraction is less than 8 kJmole
2817 Induction or dipole induced dipole
This type of interaction results from the attractions of an induced dipole about
by either - a permanent dipole or a charged site or species The energy of
attraction is less than 8 kJmol
2818 Hydrophobic effect
The exact nature of adsorption mechanism is uncertain Some investigators
believe that hydrophobic adsorption is primarily an entropic driven mechanism
brought about by the destruction of the physical cavity occupied by the solute
in the solvent and from the partial loss of structured water molecules about
the solute ordered by Van der-waals forces (Horvath et al 1976 Sinanoglu
and Abdulnur 1965) Other researchers postulate that the hydrophobic effect
is the result of simple partitioning Non polar organic solutes tend to migrate
from the aqueous phase to hydrophobic surfaces on the adsorbent ( Dzombak
and Luthy 1984 Chiou et al 1979 1983 Griffin and Roy 1985)
282 Thermodynamics of adsorption EquilibraAdsorption equilibria can well be described in terms of thermodynamics
Accordingly at equilibrium in a system
fJs= Psdeg + RTInas Eq 287
Ri= ideg + RTInaf Eq 288
Where ps and pf are the chemical potentials of the adsorbate in the external
and adsorbent surfaces respectively as and at are the corresponding
activities psdeg and pdeg are the corresponding standard state chemical
potentials At equilibrium the chemical potentials in the two phases must be
equal so that
qsdeg - = -A pdeg = RTInafas Eq 289
29
The term -A pdeg represents the change in standard chemical potential or
standard molal free energy in the transfer from the external to the adsorbant
phase and is thus the affinity
The free energy per mole p is given by
fj= H - TAS= E + PV -TS Eq 290
Where
q = is the free energy per mole
H =is the enthalpy
T= is the Absolute temperature
AS = Change in Entropy
P = Partial Pressure
V =Volume
E in terna l energy
283 PROPERTIES OF WOOD AS AN ADSORBENTA great variety of alternative low cost materials like fly ash soil wood
chippings tyre cuttings coconut shell powder hair coal etc are being tried in
place of activated carbon for sorption of different pollutants like pesticides
detergents heavy metals dyes etc(Chu etal 1978 Emig 1973 Huang and
Liao 1970 Aga 1983 Mckay and Poots 1980 Michelson et al 1975)The
chemical and physical characteristics of sorbent materials as well as those of
sorbates vary widely
Wood industry bi-products such as bark and sawdusts have been widely used
for their property of metal adsorption and metal removal from contaminated
effluents Concerning the utilisation of sawdusts many researchers have
studied metal adsorption of materials from species such as red fir mango
lime pine ceda teak Japanese redpine and Japanese beech As regards
wood barks several species were studied in particular pine oak and spruce (
Fiset etal 2000)
2831 Hygroscopicity
rlygroscopicity is the property of wood to attract moisture from the
surrounding atmosphere and hold it in the form of liquid water or water
vapour This property originates from the chemical composition of wood
cellulose hemicelluloses pectins lignin and certain extractives are
30
hygroscopic substances (Tsoumis 1991) To understand the properties of
wood as an adsorbent it is first important to understand the mechanism of
moisture adsorption onto wood
2832 How moisture is held in wood
Moisture is found in wood in two forms as liquid water in cell walls and as
liquid andor vapour in cell cavities In saturated conditions there is only liquid
water The basic reason for moisture entering into the mass of wood is the
attraction of water molecules by the hydroxyls of its chemical constituents
mainly cellulose A monomolecular layer of water shown in Figure 28 is
formed and held by these hydroxyls with strong hydrogen bonds The
formation of this layer results in pushing apart chains of cellulose molecules in
the amorphous regions and between the chrystalites of microfibrils so the
wood starts to swell Under the effect of secondary attractive forces more
water molecules enters and form a polymolecular layer
I Gradual formation of monomolecular layer by breaking the hydrogen bonding between adjacent cellulose molecules
Fig 28 Formation of monomolecular and polymolecular water layers on wood
surface
An additional part may enter by capillarity condensation in the cell wall voids
and pit features ( pit membrane small pit mouths)
31
2833 Desorption and adsorption
Loss of moisture is called desorption and gain adsorption Desorption begins
by evaporation from an exposed surface of wood If the walls are saturated
evaporation of water from the cavities need little more energy than that
required to evaporate water from the free surface (Tsumois 1991) Reduced
relative vapour pressure in the atmosphere (lower than unity) represents an
attractive force holding water in the walls and depending on its magnitude
causing less desorption To replace desorbed water other water moves from
the interior to the surface of the wood
Adsorption is the process by which dry wood exposed to an atmosphere
containing water vapour is adsorbed through its surface At the beginning a
monomolecular layer is formed then polymolecular and if the relative
pressure in the atmosphere is high (close to unity) capillary condensation
may take place Movement of moisture from the exterior to the interior of the
wood is attained by diffusion When dry wood is immersed in water there is
active movement of water through cell cavities Long immersion results in
near saturation of cavities
2834 Density
The density and specific gravity of wood are influenced by moisture content
structure extractives and chemical composition There are certain conditions
under which wood attains constant weight and volume and these are oven-
dry weight (weight at zero moisture content) oven-dry volume and fully
swollen volume
Density is determined by measuring mass (weight) and volume or by other
methods Dry (oven dry) mass is measured by placing the chosen specimen
of wood in an oven at 103degC until its weight becomes constant 12-48 hours
are needed for specimen about 100g in weight volume is determined by
measuring dimensions if the shape permits
32
284 Desorption process
An adsorbed species present on a surface at low temperatures may almost
remain indefinitey in that state As the temperature of the substrate is
increased there will be a point at which thermal energy of the adsorbed
species is such that one of the following may occur
o A molecular species may decompose to yield either gas phase products
or other species
An atomic adsorbate may react with the substrate to yield specific surface
compound or diffuse into the bulk of the underlying solid
The species may desorb from the surface and return into gas phase
The last of these options is the desorption process
285 Desorption Kinetics
The rate of desorption of an adsorbate from a surface can be expressed in the
general form
Rdes=kNx Eq 291
Where
X - Kinetic order of desorption
k - rate constant for the desorption process
N - surface concentration
The rate constant for the desorption process may be expressed in an
Arrhenius form
Kdes = A exp (-EadesRT) Eq 292
Where
-Eades is the activation Energy for desorption and A is the pre-exponential
factor
This gives the following general expression for the rate of desorption
Rdes = - dNdt = vNx exp(-EadesRT) Eq 293
R= Universal molar gas constant
T= absolute temperature
33
29 Characteristics of WoodWoods differ in colour porosity grain and figure Porosity is mainly a function
of dicotyledon woods These term refers to how the vessels are distributed
Grains refers to the alignment of the xylem cells Figure is determined by
many factors rays porosity grain and arrangement of rings The presence of
knots or burls may also be involved Density is the weight per unit size Wood
with higher density than water will sink in water
291 HardwoodsHard wood is derived from dicotyledonous angiosperms Most dicotyledonous
plants have vessels or short water conducting cells that conduct water through
openings in the ends of the cells Hardwoods have tracheids vessels fibres
ray tracheids and xylem parenchyma The cell walls are about 70 cellulose
and hemicellulose and about 20 - 35 lignin
292 Soft woodsSoftwood is derived from gymnosperms The xylem of gymnosperms is
composed mostly of tracheids Gymnosperms do not have vessels Resin
canals are common in gymnosperms Softwoods are simpler than hard
woods they tend to be uniform They have tracheids resin canals but no true
fibres or vessels
293 Chemical composition of Hardwood and softwood
Inorganic compounds
Inorganic materials in plants depend on the type of the plant and the soil
contamination in which the plant grows On average wood contains 05 ash
compounds The ash is typically composed of the following components-
CaO (plusmn50) K2O(plusmn20)Na2O MgO SiO Fe20 3 P2Os and SO3 (Baldwin
1987)
Organic materials
The inorganic compounds in wood are principally in the form of cellulose
hemicellulose lignin A small proportion are solvent soluble extractives
Cellulose
34
It is composed of D-glucopyranose units linked linearly with a b-(1-4) links It
is the main component of wood Principal component of cellulose is a polymer
of glucose (about 10000) glucose units per cellulose molecule
Hemicellulose
Acetyl-4-0-methylglucoronoxylan forms the main hemicellulose of hardwood
Glucomannan forms the main hemucellulose of softwoods Hardwoods also
have a greater proportion of methoxyl group than softwoods In addition
hemicellulose contain several molecules of water [C6(H20)5]n or [C5(H20)4]n
occurs in shorter chain of 150- 200 glucose units as compared to cellulose
Lignin
It has an approximate analysis of C10H11O2 for both softwood and hardwoods
(Shafizadeh1981) In addition to the same compounds as hemicellulose
hardwoods have syringl propane units and softwoods contain guaiacyl
propane units It is a phenolic compound (benzene with attached methyl
propyl and hydroxyl groups) tightly bound to the cellulose
In summary the average chemical composition of softwoods and hardwoods
is shown in the Table 23
Table 23 Average chemical composition of softwoods and hardwoods
(Irving 1977)
Chemical constituent Softwood Hardwood
Cellulose 42 plusmn2 45 plusmn2
Hemicellulose 27 plusmn 2 30 plusmn5
Lignin 28 plusmn 3 20 plusmn2
Extractives 3 plusmn 2 5 plusmn 3
35
CHAPTER 3 EXPERIMENTAL SETUP
MATERIALS AND METHODS
31 IntroductionTo assess the potential of sawdust in dye colour removal from water different
materials and equipment were used at different stages of experimentation
32 MaterialsThe consumable materials used in the research included
bull Hardwood and Softwood Sawdust from 4 different tree species namely-
Cypress and Pine for the softwoods Meru oak and Campor for the
Hardwoods The sawdust was obtained from Wood Makers Limited
located in Nairobirsquos Industrial area
bull Congo Red dye powder obtained from Industrial Chemical supplier located
in Nairobirsquos Industrial Area
bull 55mm Whatman Filter papers
bull Distilled water
33 Methods
331 Introduction
The performance of sawdust as an adsorbent was assessed on the basis of
removal of a direct disazo dye (Congo red) The dye is widely used in direct
dyeing of textile fabrics such as cotton paper dyeing and in staining biological
specimens in various microbiological techniques Batch experiments were
conducted in which dye samples with predetermined concentration were
placed in 350ml-plastic tumblers and then different masses of sawdust added
The mixture was thoroughly mixed by means of a continuous shaker On
reaching equilibrium the mixture was then separated by means of a filter
funnel using a pre-soaked filter paper The absorbance of the filtrate was then
obtained by means of a spectrophotometer at the wavelength of maximum
absorbance Final concentration was determined from a predetermined
equation of Congo red calibration showing the relationship between
absorbance and concentration
36
332 Sample Preparation
3321 Congo red dye
The dye that used in this research was obtained from Industrial Chemical
distributors located in Nairobirsquos Industrial area A stock solution of the dye
with a concentration of 1000mgl was prepared by dissolving 1 g of the dye in
1000cm3 of distilled water From this stock solution different concentrations
were prepared by diluting required volumes with tap water
3322 Sawdust
Sawdust used in this research was obtained from a local timber dealer Wood
Makers Limited located in Nairobirsquos Industrial area Different types of sawdust
species were obtained These included-cypress camphor Meru Oak and
African pine These tree species were chosen since they were the most used
hard and softwood in timber factories around Nairobi The sawdust was oven-
dried for 24 hrs The other main preparation carried out for the sawdust
involved sieving using different sieve sizes ranging from BS sieve No 14 to
No 100 This was meant to obtain different particle sizes for the determination
of the effect of particle sizes on the contact time and overall dye removal
Also included in this study was the determination of cellulose lignin and
Hemicellulose contents of the different sawdust species This was done using
the Van soest procedure In addition the specific gravities were determined
333 Experimental Procedure
3331 Specific gravity of wood
To obtain the specific gravity of wood samples of oven dry timber specimen
measuring 100 mm long were used The samples were weighed (M) and then
immersed in a cylinder of water (Vi) by pushing them below the water surface
with a piece of wire The new volume of water (V2) was taken quickly as
timber easily absorbs moisture Two samples of each species were tested for
each tree species and the average specific gravity obtained The specific
gravity was then obtained as follows
Gs= M(VrV)) Eq 31
The values obtained are recorded in Table 41
37
3332 Determination of Chemical composition of Sawdust
Wood can be analysed by breaking it down into structural components (called
Proximate Analysis) or into chemical elements (Ultimate Analysis) In carrying
out this research Van Soest procedure which is a form of proximate analysis
was used (Van Soest and Goering 1994)
a) Determination of Cellulose content (Neutral-Detergent Method)
The Neutral Detergent procedure for cell-wall was used to determine the
cellulose content in the different sawdust species
1 g of air-dried sample was weighed into a beaker of the refluxing apparatus
and 100ml cold neutral detergent solution followed by 2ml
decahydronaphthalene and 5g sodium sulphite were added in that order with
a calibrated scoop The mixture was heated to boiling in 5 to 10 minutes with
the heat being reduced at the onset of boiling to avoid foaming The boiling
was adjusted to an even level and reflux continued for 60 minutes timed from
onset of boiling
Tared Gooch crucibles were placed on filter manifold The beaker was swirled
to suspend the solids and content used to fill the crucibles The sample was
rinsed into crucible with minimum of hot (90-100degC) water Vacuum was
removed and mat broken up The crucible was then filled with hot water The
liquid was filtered and washing procedure repeated In a similar manner the
content was washed twice with acetone and sucked dry The crucibles were
dried at 100degC for 8 hrs and afterwards weighed This procedure was
repeated for four samples of the each sawdust type Which were averaged to
obtain overall NDF
Neutral Detergent Fibre (NDF) was determined using Equation 32-
NDF= Cell Wall Content(CWC) = Hemicellulose Lignin Cutin Cellulose
Silica and firbre bound nitrogen
(NDF) =[(wt of crucible + cell contents) - wt of crucible x 100 Eq-32
wt of sample
38
b) Determination of Hemicellulose content(Acid -Detergent Fibre)
The Acid-Detergent fibre procedure was used to determine the hemicellulose
content in the sawdust
1 g of air-dried sample consisting particles passing BS sieve 7 was weighed
into a beaker for refluxing andlOOml cold acid detergent solution and 2ml
decahydronaphthalene added The mixture was heated to boiling in 5 to 10
minutes with the heat being reduced at the onset of boiling to avoid foaming
The boiling was adjusted to an even level and reflux continued for 60minutes
timed from onset of boilingThe mixture was filtered on a previously tared
Gooch crucible set on the filter manifold using light suction The filtered mat
was broken up with a rod and washed twice with hot water (90-100degC) The
sides of the crucible were rinsed in a similar manner In addition the wash
was repeated with acetone until no colour was removed This procedure was
repeated for four samples of the each sawdust type which were averaged to
obtain overall ADF
The Acid Detergent Fibre (ADF) was thus determined using Equation 33
ADF==[(wt of crucible + fibre) - wt of crucible] x 100 Eq-33
wt of sample
c) Determination of Lignin content(Acid -Detergent Lignin)
In the acid -detergent lignin procedure the acid detergent fibre procedure
was used as a preparatory step The detergent removes protein the proteins
and other acid-soluble material that would interfere with lignin determination
The ADF residue consists of cellulose lignin cutin and acid-soluble ash
(mainly silica) To determine the lignin content in the sawdust acid-detergent
-fibre was prepared Asbestos of volume equal to the volume of the fibre was
added to the crucible containing the acid-detergent fibre The contents of the
crucible were covered with 72 H2S 04 at 15degC and stirred with a glass rod to
a mooth paste breaking all lumps The crucible was half-filled with acid and
stirred It was then refilled with 72 H2S 04 and stirred at hourly intervals as
the acid was draining away After 3 hrs the acid was filtered off with vacuum
and the content washed with hot water until it was acid-free The crucible was
dried at 100degC and weighed It was then ignited in a muffle furnace at 500degC
39
to 550degC for 3 hrs and then cooled off to 100degC and weighed This procedure
was repeated for four samples of the each sawdust type which were averaged
to obtain overall ADL
Acid Detergent Lignin( ADL) was then determined using Equation 34
ADL=[(wt of crucible + Lignin) - wt of crucible + ash] x 100 Eq-34
wt of sample
Figure 31 Schematic representation of Van Soest Procedures
3333 Effect of Shaking Velocity on removal
1 g sawdust of different particle sizes were added to plastic tumblers each
containing 100ml of 10mgl dye concentration The samples were allowed to
stand undisturbed for 30 minutes Each sample was then filtered using preshy
saturated 55mm Whatman filter paper The absorbance of the resulting aliquot
was measured using Ultra Spec II 4050 Spectrophotometer and the final
concentration obtained from equation 41 of Congo red Calibration curve
earlier prepared
The above procedure was repeated for samples of each particle size at
different rotation speed varied at an interval of 25 rpm upto 250 rpm at
which point the shaking speed was too high to causing losses of the sawdust
40
and the dye through spillage Removals were plotted against the speed of
revolution as shown in Table 43 and Fig 43
3334 Equilibrium time
Synthetic water samples (100 ml) of 10mgl concentration of Congo Red dye
were taken in separate set of containers and 1 g of sawdust was added The
sample containers were shaken on a continuous shaker at 150 rpm a speed
obtained in section 3433 above The experiments were carried out at a pH
of 89 for all particle size ranges (015 - 03mm to 06 - 118mm) at a
temperature of 22degCDuplicate samples were timed at an interval of 30
minutes This was carried out until the change in absorbance in the
subsequent samples was negligible At this point it was assumed that the
equilibrium had been achieved
Filtering through filter papers using a suction pump separated sawdust from
the containers and the filtrate was measured for residual absorbance The first
portion of the filtrate was discarded to eliminate the effects of any adsorption
on the filter paper To determine the extent of adsorption onto the filter paper
a series of runs were performed through filtering and discarding the first
portion the absorbance of all the results were identical to the unfiltered
sample
3335 Effect of pH on dye removal
For the investigation of the effect of pH a pH range of 5 to 12 was selected A
sample solution of 10 mgl was prepared 100 ml samples were adjusted to
the required pH using either 05 N NaOH to raise the pH or 05 N H2S 04 to
lower the pH 1 gram of sawdust (015 - 03mm) then added to the solutions
The samples were shaken at a speed of 150 rpm for 90 minutes (equilibrium
time for the particles) The samples were filtered and the concentration of
each determined
3336 Equilibrium Studies
Batch experiments were conducted for the development of adsorption
isotherms using the particle sizes of 015 -03 mm which showed best removal
and shorter equilibrium time (reported in the rate studies) Containers of
41
300ml capacities were used in all the experiments Duplicate 100ml samples
of 5 10 2030 40 50 and 60mgI concentration were taken in different
containers and 1 grams of each type of sawdust were added to it The sample
containers were shaken on the continuous shaker at 150 rpm After an
equilibrium time of 90 minutes the samples were withdrawn from the shaker
and the adsorbent from the sample containers was separated by filtration The
filtrate was then measured for the dye concentration Dosages of 10 20 30
5 and 6 grams of Sawdust were used A room temperature of 22degC and
constant pH of 89 were maintained in all the experiments
42
Chapter 4
40 Results and Discussion
41 Physical and Chemical properties of SawdustThe laboratory tests were carried out to establish the characteristics of the 4
different sawdusts The results shown in Table 41 below summarise
chemical and physical properties of the sawdusts studied The percentage
composition of cellulose was found to be within the range shown in Table 23
for softwood Hard woods had values higher than those in the table Other
lignin content was lower in the test samples both for softwood and hardwood
while hemicellulose content was within range Extractives were high in both
sawdust species tested
Table 41 Chemical and Physical properties of sawdust
Property composition for each Sawdust Species
Pine Cypress Camphor Meru Oak
Cellulose 4194 4157 5106 4973
Lignin 1697 1752 1886 1600
Hemicellulose 3137 3182 2028 283
Others 972 909 98 597
Pine Cypress Camphor Meru Oak
Specific
Gravity
0496 0472 051 0565
Figure 41 shows the major chemical components of the different sawdust
species used in the research Camphor and Meru oak were found to have
higher amount of cellulose than Cypress and Pine this is inherent of
hardwoods which have been reported elsewhere in literature by Irving (1977)
43
Fig 41 Chemical properties of Sawdust
Average chemical composititon of sawdust
Average cellulose
m Average Hemicellulose
Average Lignin
Average Others
Tree Species
On the other hand softwoods were found to have amount of hemicellulose
than hardwood while both species were found to have varying amount
extractives and other components Irving (1977) and Shafizadeh (1981) have
recorded similar values for both hard woods and softwoods Specific gravity
varied between 0473-0496 for the softwoods and 051 - 0565 for the
hardwoods
42 Variation of Absorbance with Dye Concentration
To obtain the final dye concentration after adsorption has taken place It is
necessary to have a calibration curveTable 42 shows absorbance values for
different dye concentration
Concentration MeanAbsorbance
0 01 00422 00665 016210 032220 060630 088540 120050 136360 1587
Table 42 Concentration Versus Absorbance
44
Fig 42 below shows the relationship between absorbance and concentration
of the Congo Red dye It was observed that in tap water a linear relationship
fitted to the data with correlation coefficient R2 value being 09938 This
indicated that absorbance varies linearly with concentration for a
concentration in the range of 1mgl to 60 mgl beyond this concentration up to
a concentration of 500mgl which was investigated a high degree of nonshy
linearity was observed this could have been as a result of increase in
concentration which diminished the distance between the dye molecule This
is believed to have caused the non-linear behaviuor of the curve (shown in
Appendix A2) This phenomenon thus restricted the concentrations used in
this research to 5mgl and 60mgl
Thus the equation of the treadline was adopted as the calibration curve to
obtain final concentration of the samples used in the experiment by
extrapolation
This took the form
Y=0278X Eq 41
Where X is the dye concentration
Vis the absorbance (OD-optical density)
Fig 42 Congo Red Calibration curve
45
Congo Red Calibration Curve
Concentration (mgl)
y = 00278X R2 = 09938
diams Absorbance
------Linear (Absorbance)
43 Variation of Absorbance w ith Wavelength
Wavelength of maximum absorption is an important parameter in any
spectrophotometric studies within both the visible and the ultra-violet ranges
For dyes it is the identification mark and acts as the fingerprint that
specifically identifies them
Figure 43 shows the relationship between the absorbance and wavelength for
Congo Red concentrations of 5 and10mgl Within the visible spectra (400nm
- 750nm) Congo red Dye was found to have a wavelength of maximum
absorption as 495nm This wavelength was used for all the measurements
made using the spectrophotometer This value is well in range with 497nm
obtained by Lillie (1990) and 488nm obtained by Bundavari (1990) Gurr
(1971) used a value of 487nm In addition Githere (MSc Thesis) used a value
of 500nm for Congo Red In light of this therefore wavelength of 495nm lies
well in range of the wavelengths used by other researcher dealing with Congo
red dye ie between (487 - 500nm) The slight variations could have arisen
as a result of solvent variations and different experimental conditions For the
same pH dye concentration only amplifies the absorption peak but does not
alter the wavelength of maximum absorption as shown by Figure 43
46
Table 43 Wavelength versus Absorbance
Wavelength (nm) Absorbance for
5mgl
Absorbance for
10m gl
400 0065 0117
410 007 0126
420 0078 0141
430 0088 016
440 0099 018
450 0111 0202
460 0123 0224
470 0136 0247
480 0149 0269
490 0159 0287
500 016 0289
510 0152 0275
520 0139 025
530 0118 0213
540 0094 0173
550 007 013
Variation of Absorbance with wavelength for Congo red dye
Figure 43 Variation of absorbance with wavelength
47
44 Effect of shaking on Dye removal
The effect of shaking velocity on removal was investigated It was observed
that removal increased steadily from 05mgg of dye at quiescent conditions of
0 rpm to a maximum of 091 mgg at 150 rpm for the composite sample
This was the the speed at which removals were best and beyond which point
a steady declined to 072 mgg at 250 rpm for all the particle sizes as shown
in Figure 43 below In this case therefore a speed of 150 rpm was adopted
for all the other investigations From other sources this speed had been used
by Alam etal (2000) in investigating the performance of low cost adsorbents
in the removal of herbicides from aquatic environment
E ffect of shaking v e lo c ity on dye rem oval
mdash 3 bull 425mm
mdashmdash 425 bull 525mm
mdash mdash 525 6mm mdash mdash A lisa e s
Figure 44 Effects of Shaking velocity on dye removal
45 Variation of Dye removal With Time (Equilibrium time)
Removal of dye with time was studied for different particle sizes This was to
determine equilibrium time and particle size with optimal dye removal
Results are shown in Table 45
48
Table 45 Removal Versus Time
Time Dye sorbed per gram of sawdust (mgg)
(min) 015-03mm 03 - 0425mm 0425 - 0525mm 0525 - 06mm 06-0118mm
0 0 0 0 0 0
30 078 078 072 069 0575
60 0833 078 079 073 069
90 084 082 0805 0745 069
120 084 079 083 078 072
150 088 083 083 08125 075
180 087 084 083 0825 077
210 0865 079 0845 07875 075
240 0865 083 0845 08125 075
270 088 0855 0855 0825 075
Fig 45 Variation of dye removal with time
The results shown in Fig 45 indicate that the amount of dye sorbed on
sawdust increased steadily with time up to a certain time for each particle
size range after which it remained almost constant Also noted from the
results was the fact that the rate of sorption was highest in the first 30 minutes
for each particle size with particles in the range of 015mm - 03mm sorbing
79 of the dye in the initial 30 minutes while particles in the range of 6mm -
118mm sorbed 58 of the dye from solution The other particle sizes ie 03
49
-0425mm 0425 - 0525mm and 0525 - 06mm sorbed 78 72 and 69
of dye respectively
Equilibrium was attained after different contact times for the various particle
sizes It was observed to vary from 90 minutes for smallest 015 - 03mm
particle sizes to 180 minutes for the biggest particle size 06 - 118mm These
variations can be associated to the ease with which dye molecules reach the
adsorption site for the small particles The particle being small in size present
shorter travel routes as compared to the longer torturous route found in the
larger particles In addition the available sorption area is higher for the small
particle Sizes and less for the bigger sizes hence the rate of sorption is higher
Similar observation was made by Gupta (1990) in the study of removal
chrome dye from wastewater Table 46 shows the equilibrium time for the
different particle sizes
Table 46 Mean particle size Versus Equilibrium time
Particle size range(mm) Equilibrium time (min)
015-03 90
03 - 0425 90
0425 - 0525 120
0525 - 06 150
0 6 -1 18 180
46 Effect of Particle size on dye removal
From the graph it was found that as the particle sizes of sawdust increase
there was a decrease in the amount of the dye adsorbed from 084mgg for
015mm - 03mm particles to 075mgg for 06 - 118mm particles for a dye
concentration of 1Cmgl This can be explained on the basis of the available
specific surface area for different panicie size which is higher for the small
particle sizes as compared to the bigger particles The same was observed by
Gupta et al (1990 ) with mixed fly ash and coal adsorbents in the removal of
chrome dye from aqueous solution where with the increase of adsorbent
50
particle size from 53 to 125 pm led to decrease in removal from 927 to
6584 for 10mgl dye concentration The observed trend for both the soft
woods and hardwoods was similar with soft wood particles removing more
dye per gram than Hard wood particles An explanation for this is that
softwoods are lighter and have more pores hence higher specific surface area
than hardwood In addition hardwoods were observed to impart some colour
into the dye solution
Effect of particle eye removal
- Dye removal at equilibrium
Fig 46 Above shows the effects of particle size on dye colour removal
47 Effect of Adsorbent concentration on removalDifferent masses of sawdust adsorbent were used to evaluate effect of
change of adsorbent concentration on dye removal Table 47 and Figure 47
show the results
Table 47 Adsorbent concentration Versus Dye removal
Mass of Sawdustis ]_________________
Mass of dye adsorbed by different Sawdusts (mgg)
Cypress(mgg) Pine(mgg) Camphor(mgg) Meru Oak(mgg)1 051 062 035 052082 0305 035 0225 0353 022 025 008 0254 0165 01875 0085 023755 015 015 0092 026 0128 0125 0076 0167 0118 0118 0025 0138 011 00975 003 01259 0096 00878 004 011110 0091 0075 0025 01
51
Effect of adsorbent concentration on dye removal
-Cypress(mgg)
- Pine(mgfg)Campbor(mgg)
Meru Oak(mgg)
Fig 47 Effects of Adsorbent concentration on dye removal
The effect of varying adsorbent concentration was studied using a dye
concentration of 10mgl It was observed that as adsorbent concentration
increased the amount of dye sorbed per gram decreased varying from 063
05 035 mg g for a ratio of 1 in 100 for pine cypress Meru oak and
camphor to 008 008 003 for a ratio 1 in 10 This shows that an increase in
adsorbent concentration increases the available surface area for sorption thus
the reduction of in the amount of dye sorbed per gram However increase
was not uniform as would be expected This shows that there are other factors
working against sorption process Increase of the sorbent concentration can
inhibit the movement of the dye molecules due to increased sorbent-sorbent
interaction resulting to particle aggregation This phenomenon was observed
with high ratios such as 110 to about 1125 the high masses also resulted in
air being trapped in the absorbent hence resulting into dead capacity
High masses were also found to increase the amount of colour imparted on
the samples and reduced amount of aliquot available at the end of each set of
experiment for measurement Therefore putting the above factors into
consideration masses of 1 2 3 4 5 and 6 g were used to develop both
variable and constant mass sorption isotherms at equilibrium conditions
52
48 Equilibrium StudiesAdsorption isotherms are determined under equilibrium conditions that is
when the rate of adsorption of molecules onto the surface of the adsorbent is
equal to the rate of adsorption of the molecules from the surface Two types of
isotherms can be generated in this way namely- Variable mass and constant
mass isotherms Both of these isotherms were used in this research These
isotherms are shown in Figures 48(a) - 48 (d) both variable and constant
mass isotherms were adopted Variable mass isotherms are considered
environmentally conservative since they yield lower values of adsorption
constants than constant mass isotherms Environmentally conservative
isotherms are thus used for prediction purposes
In the data analysis the equilibrium data was plotted on log - log scale and
fitted to a power function which takes the form of the empirical Freundlich
equilibrium model The model yields values of k (constant) and 1n (power of
function) where k gives sorption capacity of the adsorbent for the equilibrium
concentrations and n gives an idea about intensity of the capacity Since all
experiments were conducted under same experimental condition (pH 89
adsorbent size (015 -03 mm and temperature 23degC) the value of k is taken
as a measure of maximum adsorption capacity for comparison purposes
On considering variable mass isotherms it was observed that the value of k
for Cypressus lusitanica indicated that the amount of dye sorbed at
equilibrium by sawdust decreased with increase in dye concentration in the
liquid The value of n was also found to be greater than 1 which indicates
unlimited sorption for the dye The other sawdusts showed poor adherence to
Freundlich model at low concentrations (5-30mgl) however for higher
concentrations (40 -60mgl) it was observed that the k values were greater
than 1 for Meru oak (Vitex keniesis) and Pine (Pinus spp) giving rise to a
scenario of unlimited sorption capacity Camphor (Ocotea usambarebsis)
sawdust was observed to values of n less than 1 giving an indication of
saturation and low values of k
53
These isotherms had very low correlation coefficients indicating poor
adherence to the model proposed A number of reasons can be associated
with this behaviour but the mainly experimental artifacts such as the
variations of both concentration and the adsorbent masses (with the attendant
air trapping tendencies) could have contributed to these data skews For the
hardwoods colour impartation on the samples could have resulted to increase
of the competing species in the bulk solution and hence alter the
measurements of absorbance of the aliquot
Constant mass isotherms showed fitted well into the data with high correlation
values and hence good fit For Cypressus lusitanica R2 values range between
087 - 0987 with K value being 040 mgg and n value of 179 Pinus spp had
R2 values of 0 6 -0 94 and k value of 045 and n value of 118
Camphor (Ocotea usambarebsis) had R2 values of 06 - 099 k value of
0006 and n value of 069 Meru Oak (Vitex keniensis) on the other had R2
values in the range of 01 - 09 k value of 024 and n value of 0823
The above figures of k and n show distinctly that both softwoods have a high
intensity of sorption and they show a possibility of unlimited sorption capacity
It can also be deduced that the hardwoods have low sorption capacity as
evidenced by the low values of k The values of n indicate that these two
hardwoods have the possibility of experiencing dye saturation after sometime
For the hardwoods this can be attributed to limitation in the number of sites
on the adsorbent or from the fact that hardwood produce colour which could
give rise to a false situation of saturation The latter was also attributed to the
great variability of R2
The softwoods show a high sorption capacity than the hard wood due to the
high number of sites available This can be deduced from the low densities
which indicate more pores and hence a larger surface area for the softwood
than the hardwoods The values of n show the possibility of unlimited sorption
capacity This is a feasible explanation as shown by Tsoumis (1990) that
wood is able to adsorb moisture by way of formation of a mono molecular
54
layer and then eventually polymolecular layers which cause wood to expand
This same scenario can be said to be true for the softwoods
55
Qe
(mg
g)
Qe
(mg
g)
43 Adsorption isotherms
48 (a)Adsorption Isotherms for Cypressus lusitanica (Variable mass)
Freundlich Isotherm Co- 60mgl
y = 06216x0356 R2 = 0 8152
laquo Qe (mgg)------- Power (Qe (mgg))
Freundlich isotherm for Cypressus lusitanica (Co=50mgI)
Freundlich Isotherm Cypressus lusitanica (40mgl)
y - 06547xdeg 2498 R2 raquo 0 7486
laquo Qo (mgg)------- Power (Qo (mgrg))
1 10 100
Ce (mgl)
Freundlich Isotherm for Cypressus lusitanica (Co=30mgI)
y 04405XregR2 = 0 8397
diams Qe (mgg)------- Power (Qe (mgg))
01 1 10 100
Ce (mgl)
56
Oe
(mg
g)
Cypressus lusitanica (Constant mass)
Froundlich Isotherm for Cypressus lusitanica (2g)
y = 04291xOS733 R2 raquo 0955
laquo Qe (mgg)------- Power (Qe (mgg))
01 1 10 100
Ce (mgl)
Freundlich isotherm lor Cypressus lusitanica (3g)
y a 04443xos26 R2 = 09878
diams Qe (mgg)------- Power (Qe (mgg))
01Ce (mgl)
100
Qe
(mg
g)
Qe
(mg
g)
Freundlich isotherm (or Cypressus lusitanica (5g)
Ce (mgl)
y = 03909xdeg fC - 0 9793
diams Qe (mgg)------- Power (Qe (mgg))
Freundlich isotherm lor Cypressus lusitanica
y = 0 4558xdeg 7e6R = 09544
diams Qe (mgg)------- Powor (Qo (mgg))
01 1Ce (mgl)
10
Qe
(mg
g)
48 (b) Adsorption isoherms for Pinus spp (Variable mass)
Freundlich Isotherm lor Pinus spp(Co=60mgl)
y raquo 04176xdeg 941 R2 = 08114
laquo Qe (mgg)------- Power (Qe (mgg))
1 10 100
Ce (mgl)
F ieundlich Isotherm lor Pinus spp (Co= 50mgl)
y = 04126x0929 R2 = 05686 laquo Qe (mgg)
------- Power (Qe (mgg))
58
Oe
(mg
g)
Freundlich isotherm ior Pinus spp (Co=30mgI)
y = 0 6674xdeg3437 R2 laquo 0 0355
diams Qe (mgg)------- Power (Qe (mgg))
1 10
Ce (mgl)
Freundlich Isotherm lor Pinus spp (40mgl)
y = 02221xldquo 4 R2 = 0 5482
diams Qo (mgg)------- Power (Qe (mgg))
1Ce (mgl)
10
Qe
(mg
g)
Pinus spp (constant mass)
Adsorption isotherm lor Pinus spp (1g)
y = 10521xdeg 5506 R2 raquo 09296
diams Qe (mgg)
------- Power (Qe (mgg))
01 1 10 100
Ce (mgl)
Adsorption isotherm for Pinus spp(3g)
y = 0467xomo7 R2 = 09212
diams Qe (mgg)------- Power (Qe (mgg))
Qe
(mg
g)
Qe
(mg
g)Adsorption isotherm lor Pinus spp (2g)
y = 05194X0 ltgt7 R2 = 07894
laquo Oe (mgg)------- Power (Qe (mgg))
01 1 10
Ce (mgl)
Adsorption isotherm for Pinus spp (5g)
10
1
01
0011 10
Ce (mgl)
y = 0 0598x2 R2 = 09266
diams Qe (mgg)------- Power (Qe (mgg))
59
Qe
(mg
g)
Qe
(mg
g)45 (c) Adsorption Isotherms for Ocotea Usambarebsis(Variable mass)
Sorption Isotherm for Ocotea usambarebsis (Co=60mgI)
y = 3E-10x6 50R2 raquo 05871
diams Qe (mgg)------- Power (Qe (mgg))
1 10 100
Ce (mgl)
Sorption isotherm lor Ocotea usambarebsis (Co=50mgl)
y = 3E-09X5 7 76 R2 = 05285
diams Qe (mgg)------- Power (Qo (mgg))
Oe
(mg
g)
Qe
(mg
g)
Freundlich Isotherm lor Octea usambrensas (Co=40mgI)
Sorption Isotherm (or Octea (Jsambrensis (Co=30mgI)
y = 07439X0 4W7 RJ = 09398
laquo Qe (mgg)------- Powor (Qo (mgg))
60
Qe
(mg
g)
Qe
(mg
g)Ocotea usambarebsis (Constant mass)
Sorplion Isotherm for Ocotea Usambarebsis (1g)
10Ce (mgl)
y = 00184x3571 R2 = 0975
diams Qe (mgg)------- Power (Qe (mgg))
100
Sorplion isotherms for Ocotea usambarebsis (2g)
y = 00105xrsquo 375 R2 = 09954
laquo Qe (mgg)
------- Power (Qe (mgg))
Qe
(mg
g)
Oe
(mg
g)Sorption isotherm lor Ocotea usambrebsis (3g)
y = 0 0079x 2757 R2 - 07797
diams Qe (mgg)------- Power (Qe (mgg))
Sorption Isotherm tor Ocotea usambrebsis(5g)
y gt 000t4xR2 = 0 9735
diams Qe (mgg)------- Power (Oe (mgg))
61
Qe
(mg
g)
Qe
(mg
g)48 (d) Adsorption isotherms for Vitex Keniensis (Variablemass)
Sorption Isotherm for Vitex Kiniensis(Co=60mgl)
y raquo 04005xdeg1003 R2 = 09412
diams Qe (mgg)------- Power (Qe (mgg))
Sorption Isotherm lor Vitex kiniensis (Co=50mgI)
y = 03764X085reg6 R2 = 0803
diams Qe (mgg)------- Power (Qe (mgg))
1 10
Ce (mgl)
100
Qe
9mg
g)
Sorption isotherm lor Vitex kiniensis (Co=40mgI)
y = 09966X0 rdquoR2 = 0 0005
diams Qo (mgg)------- Power (Qe (mgg))
1 toCe (mgl)
Freundlich Isotherm lor Vitex kiniensis(Co=30mg1)y = 4 2t89x 1
R2 a 0 2457
laquo Qe (mgg)------Powor (Qo (mgg))
1Ce (mgl)
10
Qe
(mg
g)
Vitex keniensis (Constant mass)
Sorption isotherm tor Vitex Kiniensis (1 g)
y = 0 8248xdeglsquo 7 R2 = 09117
diams Qe (mgg)------- Power (Q e (mgg))
Ce (mgl)
Sorption isotherm lo r Vitex kiniensis (2g)
y = 02511xrsquo 2403 R2 = 08664
diams Qe (mgg)------- Power (Qe (mgg))
1Ce (mgl)
10
Qe
(mg
g)Sorption isotherm for Vitex Kiniensis (3g)
y = 0 0566x bull10R2 = 0 7524
laquo Oe (mgg)------- Power (Qe (mgg))
Sorption isotherm for Vitex Kiniensis(5g)
y = 01326xOM7 R2 = 0285
diams Qe (mgg)
------- Power (Qe (mgg))
63
49 Relationship between sawdust properties and Sorption dataThe softwoods were found to be less dense than the hardwoods which implies
the possibility more pore spaces and higher specific surface area for sorption
process The latter were found to impart coloured species on the samples
thus interfering with absorbance measurement and yielded low values of k
and n Sorption capacity was found to increase with hemicellulose content
which was high in cypress pine Meru oak and Camphor in that order
Cellulose was found to have a negative correlation with sorption capacity No
definite relationship could be deduced between lignin content and sorption
410 Effect of initial dye concentration on percentage removal
Considering Figures 49(a) - 49(d) it was observed that on varying the initial
dye concentration from 5 mgl to 60 mgl for different masses of the 4 different
sawdusts the percentage dye sorbed per gram remained fairly constant for all
the concentrations giving rise to graphs near parallel to the abscissa This
indicates that for the dye concentrations considered the mechanism of
sorption remain the same and an increase in the initial dye concentration only
alters the magnitude adsorbed per gram of sawdust for all tree species tested
Effect of intial concentration on Dye removal for Pinus spp
-ig-23-33-4g
-5g-6g
49 (a) Pinus spp sawdust
64
Effect of initial concentration on Dye removal fo r Vitex Keniesis
initial concentration (mgfl)
-m-2g- - 3 g
49(b) Vitex keniensis sawdust
mdash gmdashmdash2g
49(c) Ocotea Usambarebsis
Effect of initial concentration on dye removal for Cypressus luatanica
E3ogtk_0)CL
8gtoE0)x_
ltDgtNQ
100
7D
c n
mdash
on i -
on ------ ------- --------A
10 -
0 -
mdash x atmdash
0 10 2 0 3 0 4 0 5 0 6 0 7 0 8 0
- diams - ig
-plusmn-3g
mdash 5g
--6g
Initial tye ccrcer ration Gu (rrryl)
49(d) Cypressus lusitanica sawdust
65
S pound
pound pound
Ma
ss o
f d
ye a
dso
rbe
d p
er
gra
m
(mg
g)
411 Effect of pH Variation on dye removalFigure 411 shows the effect of pH change on dye removal from synthetic
wastewater
Effect o f Variation of intial pH on C^e removal
mdashdiamsmdash Cypress
--CanphoRne
fvferuCe
Fig 410 Effect of pH change on Sorption
In tap water Congo Red dye ionizes to a pH of 89 It was observed that when
the initial pH of the dye solution was varied from 89 to 12 by addition of
Sodium hydroxide dye removal declined steadily to zero at pH 10 for both
Camphor and Cypress Sawdust and pH 11 for Meru Oak and Pine Sawdust
respectively This can be explained from the point of view that an increase in -
OH ions from the base competed favourably with the dye ions for the available
sites thus reducing the amount of dye adsorbed by the sawdust Another
factor which may have contributed to a decline in the amount of the dye
sorbed is the polar nature of the adsorbent surface This could preferably sorb
the -OH ions in preference to the dye ions Beyond this point of zero removal
it was observed that the colour of the dye increased abruptly to absorbance
value exceeding that of the initial concentration of 10 mgl dye solution Thus
as shown in Figure 410 dye removal in this case takes negative vaiues This
could possibly have resulted from side reactions favoured by the high pH
On lowering the pH using 05N H2S04 the amount of dye sorbed remained
fairly constant with only slight increase at pH 8 and thereafter remained
66
constant for all the species tested A similar phenomenon was observed by
Gupta (1991) where an increase in the pH resulted in a decrease of the
amount of chrome dye adsorbed on a mixture of fly ash and coal
67
Chapter 5
Conclusions and Recommendations
51 ConclusionsFrom the research findings it may be concluded that-
gt The tested softwoodsrsquo sawdust have potential of removing direct dyes from
water as indicated by the high value of k (a constant obtained from the
Freundlich equilibrium model) yielded sorption capacity of the adsorbent
ranging from 033- 04
gt Hardwoods were found to have low potential of colour removal with low k
values ranging from 00069 - 023 They also had a problem of colour
impartation
gt Initial pH of effluent stream affects the amount of direct dye removed from
he waste High pH was found to reduce the amount of dye adsorbed and
promoted side reactions with increase the absorbance of the water
52 Recommendations
gt Further investigations should be carried to investigate the effects of
different methods of adsorbent preparation such as washing and air drying
on dye removal using sawdust from the various tree species
gt Investigations should also be carried out on an actual dye waste stream
containing different dyes and other dyeing chemicals
gt Further research should be carried out on the possibility of regeneration
and proper disposal of the adsorbent
68
bull Disodium ethylenediaminetetra-acetate (EDTA dihydrate crystal reagent
grade)
bull Sodium borate decahydrate reagent grade
bull Disodium hydrogen phosphateanhydrous reagent grade
bull 2-ethoxyethanol purified grade
bull Decahydronaphthalene reagent grade
bull Acetone
bull Sodium Sulfite anhydrous reagent grade
bull Sulphuric acid(reagent grade)
bull Cetyl trimethylammonium bromide technical grade
bull n-Hexane technical grade
bull Asbestos
bull Saturated potasium permanganate
bull Lignin buffer solution
bull Ferric nitrate nonhydrate
bull Silver nitrate
bull Acetic Acid glacial
bull Potassium acetate
bull Tertiary butyl alcohol
bull Combined permanganate solution
bull Oxalic acid dihydrate
bull 955 ethanol
bull Concentrated (12 N hydrochloric acid)
bull Hydro bromic acid reagent grade
Equipment
gt Ultra-spec II 4050 spectrophotometer
gt XL- 3100D Electronic balance
gt Measuring cylinders of different sizes
gt 1000 Ml Volumetric flasks
gt Model C-33 Continuous shaker
gt 100ml beakers
Appendix A1 Reagents and Equipment
69
gt 350ml plastic tumblers
gt Millipore 3500 filter
gt BS Sieves No7 to No 100
gt 50ml density bottle
gt A vacuum Dissector
gt A drying oven
gt Glass rod
gt Vacuum Pump
gt Refluxing apparatus-
Beakers Berzelius without spout 600ml capacity
Crucibles Gooch type high-form Pyrex fritted glass 50 ml capacity course
porosity Type sold by scientific Silver springMd Cat No8-237
Scimatco rubber tubing black thick-wall 516 in-(80mmm) bore 322-
(35mm) wall
Hot plate Thermolyne 9HP-A8805B) blue porcelain steel-flattop 120v 33-a
400-w 3 -in-(95-cm) diameter
Multi electric receptacle box 20-a 115-v
Condensers reflux crude-fiber Pyrex EH Sargent and Company
Philadelphia Pa Cat NoS-22742
Flexa frame hook connectors
Rings cast-iron
Flexa frame rods
gt Filter manifold
Polyethylene pipe
Funnels
Flasks
Clamps
Rubber Adopter
Rubber tubing
Glass tubing
Polyethylene tubing
Screw Clamp
gt Water heater
70
Appendix A2 Chemical composition of SawdustPine Cypress C am phor M eru O ak
Sam ple 1 Sam ple 2 Sam ple 1 Sam ple 2 Sam ple 1 Sam ple 2 S a m p le l S am ple 2
C ruc ib leNumber
293 963 927 877 237 253 480 31
C ruc ib le w t (g) 314105 307969 316161 301758 318517 307956 295801 308274S am ple W e ig h t (g)
1 1 1 1 1 1 1 1
D ry m a tte r 9459 9459 9477 9477 9475 9475 9511 9511C ruc ib le +N D F R esidue 322857 31682 324934 310732 310423 316055 304961 317199
N D F R esidue 08752 08851 08773 08974 08094 08099 0916 0 8925
C ruc ib le + A DF
321379 315087 323456 308889 317702 314268 303386 31573
C e lluose 42700372
4117637763 4352542589 3961162466 15410868 51055284 49061675 50399296
H em ice llu lose
1562533 183211756 1559565263 1944708241 -7695317 18860158 16559773 15445274
C ruc ib le +AD L 317125 310975 319057 304776 313057 309767 29856 310902C ruc ib le + Ash
314145 30802 31613 301672 311288 307845 295861 308218
L ign in 31504387
312400888 3088530126 327529809 18701766 2028496 28377668 28 219956
A verage ce llu lose
4193837502
4156852527 5105528366
4973048544
A verage H em ice llu lose 1697325299
1752136752 1886015831
1600252339
A verage L ign in
31 37223808
3181914108 2028496042
282988119
A verage O thers
9 716133911
9090966128 9799597608
5968179262
71
Appendix A3 Variation of Absorbance with concentration
Congo red dye rating curve
-Absorbance
Appendix A4 Specific Gravity of Sawdust (Gs)Tree Species Sample M ass (g) In itia l Volm (cm J) Final Volm (cm J) D ensity (g c m J)
P ine 1 54 700 810 0490909091
2 557 700 800 0557
3 551 700 820 0459166667
4 609 700 810 0553636364
Cypress 1 476 700 800 0476
2 482 700 810 0 438181818
3 504 700 800 0504
4 472 700 800 0472C am phor 1 528 700 8001 0528
2 458 700 800 0458
3 495 700 800 04954 557 700 800 0557
M eru O ak 1 397 700 770 0567142857
2 4069 700 770 0581285714
3 411 700 770 0587142857
4 419 700 780 052375
Appendix A5 Variable mass Isotherm data Cypressus lusitanicaCo = 60mglM ass (g) F inai Absoibance Ce(mgI) Ge (mgg)
1 113 0021 1109 3989209 2010791
2 0516 0032 0484 1741007 2129496
3 0382 0044 0338 1215827 1594724
4 0281 0052 0229 823741 1294065
5 0271 0064 0207 7446043 1051079
l_________6 0171 0084 0 087 3129496 0947842
72
Co=50 mglM ass (g) F ina l Absorbance Ce(mgI) Qe (m gg)
1 0937 0021 0 916 3294964 1705036
2 0369 0032 0 337 121223 1893885
3 0315 0044 0271 9748201 1341727
4 023 0052 0 178 6402878 1089928
5 0162 0064 0 098 352518 0929496
6 014 0084 0 056 2014388 079976
C o=40 m gl
C o=30 mgl
M ass (g) F ina l Absorbance Ce(mgI) Qe (m gg )
1 0333 0021 0312 1122302 1877698
2 0141 0032 0109 3920863 1303957
3 0138 0044 0094 3381295 088729
4 0136 0052 0084 3021583 067446
5 0127 0064 0 063 2266187 0554676
6 0109 0084 0025 0899281 0485012
C o=20 mgl
C o=10 m gl
M ass (g) F inal Absorbance Ce(mgI) Qe (m gg)
1 0108 0021 0087 3129496 0 68705
2 0062 0032 003 1079137 0446043
3 0063 0044 0019 0683453 0310552
4l 0073 0052 0021 0755396 0231115
5 0074 0064 001 0359712 0192806
6 009 0084 0006 0215827 016307
73
Co=5 mglM ass (g) Final Absorbance Ce(mgI) Qe (m gg )
1 0049 0021 0 028 1007194 0399281
2 0042 0032 001 0359712 0 232014
3 0048 0044 0004 0143885 0161871
4 0065 0052 0013 0467626 0 113309
5 0066 0064 0002 0071942 0098561
6 0088 0084 0 004 0143885 0 080935
Vitex KeniensisC o=60 mgl_________
M ass (g) F ina l Absorbance Ce(mgI) Qe (m gg )
1 0567 0068 0499 1794964 4 205036
2 0327 0105 0222 7985612 2 600719
3 0288 0126 0162 5827338 18057554 03 0139 0161 5791367 1355216
5 035 0244 0106 381295 1123741
6 032 0247 0073 2625899 0956235
C o=50 mgl
M ass (g) F inal Absorbance Ce(mgI) Qe (m gg )1 0425 0068 0357 1284173 3 7158272 0263 0105 0158 5683453 2 215827
3 0287 0126 0161 5791367 14736214 0269 0139 013 4676259 1133094
5 0303 0244 0059 2122302 0 9575546 0339 0247 0092 3309353 0 778177
C o=40 mglM ass (g) F inal Absorbance Ce(mgI) Qe (m gg)
1 0331 0068 0263 9460432 3 0539572 0227 0105 0122 4388489 17805763 0318 0126 0192 6906475 11031184 0365 0139 0226 8129496 0 7967635 0393 0244 0149 5359712 06928066 0481 0247 0234 8417266 0 526379
Co=30 mglM ass (g) F inal Absorbance Ce(mgI) Qe (m gg)
1 0209 0068 0141 5071942 24928062 0197 0105 0092 3309353 1334532
3 0236 0 126 0 11 3956835 0 8681064 0249 0139 011 3956835 0 651079
5 038 0244 0136 4892086 0 5021586 0486 0247 0239 8597122 0 356715
74
Co=20 mgl
C o=10 m gl
C o = 5 mgl
Octea usambarebsis
Co=60 m glM ass (g) F inal Absorbance Ce(mgI) Qe (m gg)
1 103 0022 1008 3625899 2374101
2 1051 0034 1017 3658273 1170863
3 1025 0056 0969 3485612 08381294 097 0063 0907 326259 0684353
5 0919 0078 0841 302518 0594964
6 0993 0083 091 3273381 0454436
C o=50 m gl
Mass (g) F ina l Absorbance Ce(mgI) Qe (m gg)
1 089 0022 0868 3122302 1877698
2 0845 0034 0811 2917266 1041367
3 0925 0056 0869 3125899 0 62474 0829 0063 0766 2755396 0561151
5l 0807 0078 0729 2622302 047554
6 0837 0083 0754 271223 0381295
75
Co=40 mglM ass (g) F ina l Absorbance C em gI) Qe (m g g )
1 0751 0022 0729 2622302 1377698
2 069 0034 0656 2359712 0820144
3 0698 0056 0642 2309353 0563549
4 07 0063 0637 2291367 0427158
5 0649 0078 0571 2053957 0389209
6 0701 0083 0618 2223022 0296163
C o=30 mgl
Co=20 mq1M ass (g) F ina l Absorbance Ce(mgI) Qe (m gg )
1 0357 0022 0335 1205036 0794964
2 0398 0034 0364 1309353 0345324
3 0394 0056 0338 1215827 0261391
4 0403 0063 034 1223022 0194245
5 0397 0078 0319 1147482 0170504
6 0458 0083 0375 1348921 0108513
Co=10 mgl
M ass (g) F ina l Absorbance Ce(mgI) Qe (m gg )
1 023 0022 0208 7482014 0251799
2 0231 0034 0197 7086331 0145683
3 0302 0056 0246 8848921 0038369
4 0302 0063 0239 8597122 0035072
5 0295 0078 0217 7805755 0043885
6 0336 0083 0253 9100719 0014988
Co=5m gl
M ass (g) F ina l Absorbance Ce(mgI) Qe (m gg )
1 0131 0022 0109 3920863 0107914
2 0139 0034 0105 3776978 0061151
3 0146 0056 009 323741 0 058753
4 0193 0063 013 4676259 0008094
5 0192 0078 0114 4100719 0017986
6 021 0083 0127 4568345 0007194
76
Pinus sppCo=60 mg1
|M ass (g) F ina l Absorbance Ce(mgI) Qe (m gg )
1 0419 0021 0 398 14316547 45683453
2 0176 0032 0 144 51798561 27410072
3 0154 0044 011 39568345 18681055
4 0144 0052 0 092 33093525 14172662
5 016 0064 0 096 34532374 11309353
I 6 018 0084 0 096 34532374 0 942446
C o= 50 m glM ass (g) F ina l Absorbance Ce(m gI) Qe (m gg )
1 0309 0021 0 288 10359712 39640288
2 0163 0032 0131 47122302 22643885
3 0127 0044 0 083 29856115 156714634 012 0052 0 068 24460432 11888489
5 0165 0064 0101 36330935 09273381
6 0193 0084 0 109 39208633 07679856
C o=40 mg1
M ass (g) F ina l Absorbance Ce(mgI) Qe (m gg)
1 0208 0021 0 187 67266187 33273381
2 0118 0032 0 086 30935252 18453237
3 0119 0044 0075 26978417 124340534 0136 0052 0 084 30215827 09244604
5 0145 0064 0081 29136691 07417266
6 0174 0084 009 32374101 06127098
C o= 30 mg1
C o=20 mg1
77
Co=10 mgljM ass (g) F ina l Absorbance Ce(mgI) Qe (m gg)
1 0 045 0034 0011 03956835 09604317
2 0052 0052 0 052 18705036 04064748
3 0061 0082 0061 21942446 02601918
4 0 0777 0106 0 0777 2794964 01801259
5 0107 0132 0 1 0 7 38489209 01230216
6 0142 0155 0 142 51079137 00815348
C o=5 m glM ass (g) F ina l Absorbance Ce(mgI) Qe (m gg)
1 0 039 0034 0 005 01798561 04820144
2 0065 0052 0 0 1 3 04676259 02266187
3 0089 0082 0 007 02517986 01582734
4 0116 0106 001 03597122 01160072
5 0161 0132 0 029 10431655 00791367
________ 6 0202 0155 0 0 4 7 16906475 00551559
Constant mass isotherm data
Cypressus lusitanicaConstant M ass o f 1g
Initial C oncen tra tion (mgl) Ce (m gl) Qe (mgg)
5 1007194 0399281
10 3129496 068705
20 1122302 1877698
30 1568345 0431655
40 2766187 1233813
50 3294964 1705036
60 3989209 2010791
Constant M ass o f 2gInitial C oncen tra tion (mgl) Ce (m gl) Q e (mgg)
5 0 359712 0232014
10 1079137 0446043
20 3920863 1303957
30 442446 0778777
40 9856115 1507194
50 121223 1893885
60 1741007 2129496
Constant m ass o f 3gInitial C oncen tra tion (mgl) Ce (m gl) Qe (mgg)
5 0 143885 0161871
10 0 683453 0310552
20 147482 0617506
30 3 381295 088729
40 6 18705 1127098
50 121223 1893885
60 1215827 1594724
78
Constant mass of 5gInitial Concentration (mg1) Ce (m gl) Qe (m gg )
5 0071942 009856110 0359712 0 19280620 0 971223 0 380576
30 2 266187 0 55467640 2 589928 0748201
50 352518 0 92949660 7 446043 1051079
Constant m ass of 6g
Initial C oncentration (m gl) Ce (m gl) Qe (m gg )
5 0143885 0 080935
10 0 215827 0 1630720 0827338 0 319544
30 0899231 048501240 1151079 064748250 2 014388 0 79976
60 3 129496 0947842
Pinus spp
Constant m ass of 1 gInitial Concentration (m gl) Ce(mgI) Qe (m gg)
5 0179856 0482014
10 0395683 096043220 2302158 176978430 4100719 258992840 6726619 332733850 1035971 396402960 1431655 4568345
Constant m ass o f 2gInitial Concentration (m gl) Ce(m gI) Qe (m gg)
5 0 467626 022661910 1151079 0942446
20 1870504 040647530 1978417 140107940 3093525 1845324
50 471223 2264388
60 5179856 2741007
Constant mass of 3gInitial C oncentration (m gl) Ce(m gI) Qe (m gg)
5 0251799 0 158273
10 1726619 0942446
20 1834532 0605516
30 2194245 0260192
40 2697842 1243405
50 2985612 1567146
60 3956835 1868106
79
Constant mass of 4gInitial C oncentra tion (mgl) Ce(mgI) Qe (mgg)
5 0359712 0116007
10 1690647 0457734
20 1798561 070503630 2446043 118884940 2794964 018012650 3021583 09244660 3309353 1417266
Constant m ass of 5gInitial C oncentra tion (mgl) Ce(mgI) Qe (mgg)
5 1043165 007913710 2194245 035611520 2913669 074172730 2985612 054028840 3453237 113093550 3633094 092733860 3848921 0123022
Constant m ass of 6gInitial C oncentra tion (mgl) Ce(mgI) Qe (mgg)
5 3453237 094244610 3920863 076798620 323741 06127130 3201439 044664340 2302158 029496450 5107914 008153560 1690647 0055156
Vitex keniensis
Constant m ass of 1gInitial C oncentra tion (m gl) Ce(m gI) Qe (mgg)
5 0611511 043884910 1906475 180935320 287 171330 5071942 249280640 9460432 305395750 1284173 371582760 1794964 4205036
80
Constant mass of 2gInitial C oncentra tion (mgl) Ce(m gI) Qe (m gg)
5 1151079 019244610 1834532 090827320 309 08455
30 3309353 1334532
40 4388489 178057650 5683453 221582760 7985612 2600719
Constant m ass of 3gInitial C oncentra tion (mgl) Ce(m gI) Qe (m gg)
5 2 014388 00995210 2482014 058393320 359 054730 3956835 086810640 5791367 147362150 5827338 180575560 6906475 1103118
Constant m ass of 4g
Initial C oncentra tion (mgl) Ce(m gI) Qe (m gg)5 3 489209 00377710 372 040720 3956835 065107930 4352518 039118740 4676259 113309450 5791367 135521660 8129496 0796763
Constant m ass of 5gInitial C oncentra tion (mgl) Ce(m gI) Qe (m gg)
5 1618705 005762610 1978417 036043220 2122302 095755430 3 81295 112374140 388 0322450 4892086 050215860 5359712 0692806
Constant m ass of 6gInitial C oncentra tion (mgl) C e(m gI) Qe (m gg)
5 2158273 004736210 2625899 095623520 3201439 027997630 3309353 077817740 392 026850 8417266 0526379
60 8597122 0356715
81
Ocotea usambarebsis
Constant m ass of 1 g
Initial C oncentra tion (m gl) Ce(mgI) Qe (mgg)5 3625899 237410110 3122302 1877698
20 2622302 137769840 1205036 079496450 7482014 025179960 3920863 0107914
Constant m ass of 2gInitial C oncentra tion (m gl) Ce(mgI) Qe (mgg)
5 3776978 006115110 7086331 0145683
20 1309353 0345324
40 2359712 0820144
50 2917266 104136760 3658273 1170863
Constant m ass of 3gInitial C oncentra tion (m gl) Ce(mgI) Qe (mgg)
5 323741 005875310 8848921 003836920 1215827 026139140 2309353 056354950 3125899 0624760 3485612 0838129
Constant m ass of 4gInitial C oncentra tion (m gl) Ce(mgI) Qe (mgg)
5 4676259 000809410 8597122 003507220 1223022 019424540 2291367 042715850 2755396 056115160 326259 0684353
Constant m ass of 5gInitial C oncentra tion (m gl) Ce(mgI) Qe (mgg)
5 4100719 001798610 7805755 0043885
20 1147482 0170504
40 2053957 038920950 2622302 047554
60 302518 0594964
82
Constant mass of 6gIn itia l C oncen tra tion (m gl) C e(m gI) Q e (m gg)
5 4 568345 000719410 9 100719 001498820 1205036 079496440 22 23022 029616350 271223 038129560 3273381 0454436
Appendix A6 pH versus amount of dye sorbedVariation of dye removal with pH
pH Finalabsorbance
Mass of dye removed (mgg)
Cypress Camphor Pine MeruOak
pH Cypress Camphor Pine Meru Oak
5 0062 0177 007 0066 5 07769784 02841727 06978417 076258996 0063 0199 0084 0074 6 07733813 02338129 07482014 073381297 0064 0213 009 0087 7 07697842 03633094 06978417 068705048 0069 0242 014 0136 8 07517986 01294964 04964029 051079149 0212 0252 0148 0101 9 02374101 00935252 04676259 06366906
10 0277 0269 0238 0213 10 00035971 00323741 01438849 0233812911 045 0478 0246 028 11 -0618705 -0719424 01151079 -000719412 0845 1162 0523 0561 12 -2039568 -3179856 -0881295 -1017986
83
Appendix A7 Mean Particle size Versus dye removal at equilibriumEffect of particle Size on Dye removalMean pa rtic le size(mm) Dye rem oval at equlibrium (m gg)
0 225 0840 3625 0820 475 0805
0 5625 0780 89 075
Appendix A8 Number of revolutions per minute versus Dye removalE ffe c t o f S h a k in g v e lo c ity on Dye rem ova lSpeed
rpmF in a l A b so rb a n ce3 - 425mm 425 - 525m m 525 - 6mm All sizes
0 0187 0172 0 173 015325 0119 0132 0 147 014750 0116 012 0 116 014675 0112 0115 0 118 0121
100 01 011 0 102 0114125 0091 0105 0 097 0072150 0042 0047 0 049 0024175 0046 005 0041 0036200 0061 0057 0 047 0072225 0072 0063 0 05 0072250 0075 006 0 066 007
Speedrp m
M ass o f Dye a d so rb e d p e r g ram o f S a w d u s t (m g g )
3 - 425mm 425 - 525m m 525 - 6mm All sizes0 0314 0383 0371 045
25 0561 0524 0 477 047750 0593 0574 0 593 04775 06 0589 0 575 057
100 0642 061 062 063125 066 0625 0 65 0746150 085 0825 0 825 0912175 08375 082 08375 0875200 0786 08 0 825 0746225 0746 0782 082 0746250 0738 07875 0 78 075
84
Appendix A9 Freundlich constantsValues of K Values of n
M ass (g) C am phor Meru Oak C ypress Pine C am phor Meru O ak C ypress Pine
1 0 0184 08248 04127 05396 0736 1634 274 1246572
2 00105 02511 04291 05194 0742 0806 1-744 102
3 00079 00566 04443 04359 07838 0552 184 1199
4 0003 00117 03083 0302 0435 04186 1378 1128
5 00014 01326 03909 00998 0552 09472 182 07156
6 00004 01504 04558 01028 0466 05803 127 1008
A verage 0006933 02378667 040685 033325 0 619133 0823017 1798667 1052862
Appendix A10 Initial concentration versus dye removal for Pinus spp Vitex kiniensis Octea usambrensis and Cypressus lusitanica
P inus sppC o (mg1) dye rem oval d ifferent m asses
ig 2g 3g 4g 5g eg5 96402878 45323741 31654676 23201439 15827338 11031175
10 96043165 40647482 26019185 1801259 12302158 81534772
20 95197842 48983813 3289968 24774843 19876978 16598721
30 86330935 46702638 31414868 23501199 18009592 1488809
40 9352518 48248651 32547962 24559353 19729856 16480566
50 92517986 48070054 32465388 24508813 19684322 16446926
60 92290168 47997081 32431517 244894 19671928 16438237
V itex ken iens isC o (m gl) dye rem oval d ifferent m asses
ig 2g 3g 4g 5g eg5 8776978 3848921 1990408 7553957 1352518 9472422
10 8093525 4082734 2505995 1411871 1604317 1133094
20 8565 42275 1252998 2035 1612 134
30 8309353 4448441 1823333 2170264 1673861 118904940 7634892 4451439 2757794 1991906 1732014 131594750 7431655 4431655 2947242 2266187 1915108 155635560 7008393 4334532 3009592 2258693 1872902 1593725
O co tea usam barebsisC o (m gl) dye rem oval d ifferent m asses
ig 2g 3g 4g 5g eg5 2158273 1223022 117506 1618705 3597122 0719424
10 2517986 1456835 383693 3507194 4388489 149880120 397482 1726619 1306954 1243165 852518 5425659
30 352518 3015588 24 94005 1582734 1956835 164868140 3444245 205C36 1408873 1067896 9730216 740407750 3755396 2082734 12494 1122302 9510791 7625899
60 3956835 1951439 1396882 1140588 9916067 7573941
85
Cvpressus lusitanicaCo (mg1) dye removal fo r d iffe ren t masses
19 2g 3g 4g 5g 6g10 685 447 3103333 23125 193 1646667
20 6345 42125 2948333 2195 18 1640833
30 626 43465 2953333 224825 1854 1618
40 60 3765 282 22675 1872 1619833
50 6424 3775 2686 2178 18576 16
60 62 354 2653333 215375 1752 1580833
86
Bibliography1 Alam JB Dikshit AK and M Bandyopadhyay (2000) Efficacy of
adsorbents for removal 24-D and Atrazine removal from Water
Environment Global Nest the Inti Journal Vol 2 No 2 pp 139-148
2 APHA (American Public Health Association)(1992) Standard Methods
for examination of water and Wastewater 18th Edition APHA Washington
DC
3 Anliker R Clarke EA and MoserP (1981) Use of the partition
coefficient as an indicator of bioaccumulation tendency of dyestuffs in fish
Chemosphere Vol 10 pp263 - 274
4 Arvola L (1986) Spring phytoplankton of 54 small lakes in Southern
Finland Hydrobilogia Vol 137pp125- 134
5 AtlasG and TT Bannister (1980) Deoedence on mean spectral
extinction coefficient of phytoplankton depth water colour and species
Limnol Oceanography Vol 25 pp 157-159
6 BaldwinS (1987) Biomass stoves Engineering Design Development
and Dissemination Volunteers in Technical assistance Arlington Virginia
7 BaughmannG and Perenich TA (1988) Fate of Dyes in agueous
systems Solubility and partition of hydrophobic dyes and related
compounds EnvironToxic Chemical Vol 7 pp 188-199
8 Bennett LE and M Drikas (1993) The evaluation of colour in natural
waters Water Res Volume 27pp1209-1208
9 Boegerding AJ and RA Hites (1994) Identification and measurement
of food and cosmetic dves in a municipal wastewater treatment plant
Environment Science Technology Vol 28pp1278-1284
10 Canadian Council of Ministers of Environment (2001) Canadian water
quality guidelines for the protection of aquatic life Colour Winnipeg
11 Chiou CT LJ Peters and VH Freed (1979) A physical concept of
soii-water equilibria for nonionic organic compounds Science Vol206 pp
831-832
12 Chiou CT PE Porter and DW Schmeddling (1983) Partition
equilibria of nonionic organic compounds between soil organic matter and
water Environmental Science and Technology
87
13 Clarke EA and Anliker R (1980) Organic Dyes and pigments in The
Handbook of Environmental Chemistry Vol 3 Part A Anthropogenic
Compounds Hutzinger O (Ed) Springer-Verlag Hiedelberg pp 181- 215
14 Del Giorgio PA and RH Peters (1994) Patterns in Planktonic PR
ratios in lakes Influence of lake trophy and dissolved organic carbon
Limnol Oceanography Volume 39 pp 772-787
15 Dzombak DA and R G Luthy (1984) Estimating adsorption of
polvacvclic aromatic hydrocarbons on soils Soil science Vol 137 p 292-
308
16 EfflerSW and MT Auer (1987) Optical heteroqenisity in Green Bay
Water Resource Bulletin Vol 23pp 937-942
17 Emig DK (1973) Removal of Heavy metals from acid bath plating by soil
Phd Thesis Perdue University
18 Fessenden RJ and Fessenden JS (1990) Organic Chemistry 4th
Edition Brooks Cole Publishing Company Pacific Grove California
19 FisetJF Blais JFBen Cheikh R and RDTyagi (2000)Review on
metal removal from effluents by adsorption and wood barks Rev Sci Eau
Vol 13 pp325- 349
20 Environmental technology Letters (1986) Vol 7 No8 pp 415
21 Githere PG (MSc Thesis) Potential of ground Charcoal In removal of
synthetic dye from water MSc Thesis University of Nairobi
22 Griffin RA and WR Roy (1985) Interaction of organic solvents with
saturated soil-water systems Environmental Institute for waste
management Studies Open File Report 3 University of Alabama pp86
23 GuptaGS PrasadG and Singh VN (1990) Removal of Chrome dve
from aqueous solutions by mixed adsorbents Fly ash and coal Wat Res
Vol 24 No 1pp45-50
24 Gurr E (1971) Synthetic Dyes in Biology Medicine and Chemistry
Academic Press London amp New York
25 Haines TA TVKomov VE Matey and CH Jagoe (1995) Perch
Mercury content is related to acidity and colour in 26 Russian Lakes Water
Air Soil Pollution Vol 85 pp823-828
88
26 Henebry MS ad J CairnsJr(1984) Protozoan colonization rates in
trophic status ot some freshwater wetlands lakes Journal of Protozool Vol
31 pp456-467
27 Horvart C Melander W and Molnar I ( 1976) Solvophobic interactions
in Liquid Chromatography with nonpolar stationary phases Journal of
chromatography Vol 125 pp 129 - 156
28 httpwwwpgonlinecom
29 Huang JC and Liao CS (1970) Adsorption of pesticides by clay minerals
Journal of Sanitation Eng Div American Society of Civil Eng Vol 96 pp
1057- 1078
30lrving S Goldstein(1977) Wood Technology Chemical Aspect ACS
Symposium series 43 American Chemical Society Washington
31llmavirta V and P Huttunen (1989) Water chemistry and
phytoplankton communities acidic clear and brown-water lakes in eastern
Finland Water Air Soil Pollution Vol 46pp415-432
32 Jang-Yeun Horng and Shang-Da Huang (1993) Removal of organic dye
(Direct Blue) from synthetic Wastewater by adsorptive bubble techniques
Environmental science Technology Vol 27 pp 1169-1175
33 Jerome JH R P Bukata PH Whitfield and N Rousseau (1994)
Colour in natural Waters 2 Observations of Spectral variations in British
Columbia Rivers Northwest Science Volume 68pp53-64
34 Jerome JH R P Bukata PH Whitfield and N Rousseau (1994)
Colour in natural Waters 1 Factors controlling the dominant wavelength
Northwest Science Volume 68pp43 -52
35 Jones HR (1974) Pollution Control in the Textile Industry
36 Juarez LM KH Holtschmit JJ Salmeron and MK Smith (1987)
The effects of chemical and visual communication space availability and
substratum colour on growth of juvenile fresh water prawn Macrobrachium
rosebergii Journal of marine Biology and ecology Vol 110 pp285- 295
37 Kuo W G (1992) Decolorizing Dye Waste-water with Fenton Reagent
Water resources Vol26 pp 881
38 Lamount IM (1981) Water Research topics Ellis Horwood London Vol
1 PP- 222
89
3 9 Liang IG (1991) The impact of effluent regulations on dyeing industry
Rev Pro Colouration Vol 21pp56-71
4 0 Lillie R Connrsquos Biological stains Williams amp Wilkins Baltimore MD USA
4 1 Masumune S and Smith JM (1976) Adsorption Rate Stud ie s ^
significance of pore diffusion America Institute of Chemical Engineers
Journal Vol 10No 2 pp246
4 2 McCrum WA (1984) The use of second-order derivative spectroscopy
in investigation of sources of coloured pollutants in water Water Res Vol
18pp 1249-1252
43 Mierle G and R Ingram (1991) The role of Humic substances in
mobilization of Mercury from watersheds Water Air Soil Pollution Vol 56
pp349-357
44 Michelson DL (1975) Removal of soluble mercury from water by
complexinq techniques US D1 Office of water Research and Technology
Bulletin No 74 Virginia Polytechnique Institute Blackburg Va
45 Nilsson A and I Hakanson (1992) Relationship between Mercury in
lake water water colour and mercury in fish Hydrobiologia Vol
235236pp675-683
46 PaggaUMand TaegerK(1994) Development of a method for
adsorption of dyestuffs on activated sludge Water Resources Vol
28pp1051-1057
47 PootsVJP Healy JJ and Mckay G (1976) Removal of basic dve
from effluent using wood as an adsorbent Water Pollution Control
Federation Journal pp 926-934
48 Ratte ID and Bruener MM (1974) The physical chemistry of Dve
adsorption Academic Press New York and London
49 Rosen JB (1954) General Numerical Solution for Solid diffusion in Fixed
Beds Ind Eng Chem Vol 46 1590
50 Roy WR Krapac IG Chou SFJ and Griffin RA (1992) Batch-Tvne
Procedures for Estimating Soil adsorption of chemicals Illinois State
Geological Survey Chapaign Illinois 61820
51 Sawyer C N and McCarty PL (1978) Chemistry for Environmental
Engineering M c G ra w -H il l book Company
90
52 Schwarzenbach RP GsechwaldPM and Imboden DM (1993)
Environmental Organic Chemistry John Wiley and Son Inc New York
53 Sewe PO 1986(MSc Thesis) Textile wastewater Treatment and
management in Eldoret Kenya
54 Shafizadeh (1981) Thermal deterioration of wood ACS Synposium Vol
43 pp57 - 81
55 Sheath RG MO Morison JE Korch D Kaczmarczyk and KM
Cole (1986) Distribution of macroalgae in South-central Alaska USA
Hydrobiologia vol135 pp259-270
56 Sinanoglu 0 and Abdulnur S (1965) Effect of water and other solvents
on the structure of biopolvmers Federation Proceedings Vol 29 Part II pp
512-523
57 Sittig Mbdquo (19731 Pollutant Removal Handbook Noyes Patal Corporation
London England
58 Susan Budavari (1990) The Merck Index 12th Edition Merck amp Company
NJ USA
59 Tsoumis Gbdquo (1991) Science and Technology of wood Structure
Properties Utilization Chapman and Hall
60 UNEP (1993) The Textile Industry and The Environment Technical Report
No 16 pp 65-66
61 UNEP (1996) Cleaner Production in textile wet processing A Workbook
for trainers 1st Edition Paris
62 Van Soest PJ and Goering HK (1994) Forage fibre Analysis
Handbook on Animal husbandry Research Division Beltsville Maryland
20705
63 Weber WJ McGinley PM and Katz LE (1991) Sorption Phenomena in
subsurface Systems Concepts Models and effects of contaminant fate and
Transport Water Res Volm 25 No 5 pp 499-528
64 Wetzel RG (1975) Limnology WB Saunders Company Philadelphia
65 Zollinger H (1987) Colour Chemistry - Syntheses Properties and
Application of Organic Dves and Pigments VCH New York 92-102
91

Declaration
This Thesis is my original work and has not been submitted for a degree in
any other University
JK Wairuri
Candidate
Date
This thesis has been submitted for examination with my approval as
University supervisor
ProfessorB o il l i l t
TABLE OF CONTENTS
Declaration
ACRONYMS
III
VI
DEDICATION vrdquoAcknowledgementvuiL ist of Figures xL ist of appendices_XlA bstract X11
CHAPTER 1 INTRODUCTION bull bull bull bull bull bull bull bull bull bull a I
10 Backgroundl l Problems associated with Dyes and Textile Industry
12 Research objectives313 Research Justification 4
CHAPTER 2
LITERATURE REVIEW 620 PROPERTIES OF DYES621 Introduction 622 Absorption Spectra of Dyes 10
221 Why are dyes ColouredI I23 Classification of Dyes 1124 Solubility of dyes 13
241 The Congo red dye 1425 Measurement of dye concentration in a dye bath1526 Nature of Colour in aquatic and Marine Environment 1827 Effects of Colour in Aquatic and Marine Environment18281 Forces and Mechanisms of adsorption25282 T hermodynamics of adsorption Equilibra29283 PROPERTIES OF WOOD AS AN ADSORBENT30284 Desorption process 3329 Characteristics of Wood34
291 Hardwoods 34292 Soft woods34
CHAPTER 3 EXPERIMENTAL SETUP 36
MATERIALS AND METHODS 36
31 Introduction3632 Materials3633 Methods36
331 Introduction 36332 Sample Preparation37333 Experimental Procedure37
CHAPTER 4 43
40 RESULTS AND DISCUSSION 43
4 l Ph ysical and Chemical properties of Sawdust4342 v ariation of Absorbance with Dye Concentration 4443 Variation of Absorbance w it h Wavelengt h4644 Effect of shaking on Dye removal 4845 Variation of Dye removal W ith T ime (Equilibrium time) 4846 Effect of Particle size on dye removal 5047 Effect of adsorbent concentration on removal 5148 Equilibrium Studies5349 Relationship between sawdust properties and Sorption data 64
IV
410 Effect of iNmAL dye concentration on percentage removal64411 Effect of pH Variation on dye removal66
CHAPTER 5 68
CONCLUSIONS AND RECOMMENDATIONS 68
51 Conclusions 6852 Recommendations 68Appendix A I Reagents a n d Equipment69appendix A2 Chemical composition of Sawdust 71appendix A3 Variation of Absorbance with concentration72Appendix A4 Specific Gravity of Sawdust (G )72appendix A5 Variable mass Isotherm data72Appendix A6 pH versus amount of dye sorbed83appendix A7 Mean Particle size Versus dye removal at equilibrium 84appendix A8 Number of revolutions per minute versus Dye removal 84appendix A9 Freundlich constants85Appendix A 10 Initial concentration versus dye removal for Pinus spp Vitex kiniensis Octea usambrensis and Cypressus lusitanica85
V
Acronyms
ADF Acid Detergent Fibre
ADL Acid Detergent Lignin
APHA America Public Health Association
BET Breunner Emmet Teller
EDTA Ethylenediaminetetracetic Acid
CWC Cell Wall Contents
NDF Neutral Detergent Fibre
NPN Non Protein Nitrogen
UNEP United Nation Environmental
Programme
VI
DEDICATION
I dedicate this work to all men and women whom in the time past and now
have and continue to give their best in time effort and other unquantifiable
resources selflessly in stewarding Godrsquos magnificent creation
vii
Acknowledgement
In writing this research I am greatly indebted to a number of people without
who this work could not have been possible
First and foremost I greatly acknowledge ProfessorBNK Njoroge for being
my supervisor and guiding me through the entire project He gave thoughtful
insights in experimentation analysis and discussion of the results
Technical staffs in the Public Health Engineering laboratory for technical
advise availing themselves to be consulted when necessary Chairman and
technical staff of Department of Biochemistry for extending some of their
facilities and equipment for uses in this projectTechnical staff Department of
Animal production for the help extended in part of the experimentation
Staff of Woodmakers Limited for freely availing different varieties of sawdust
Fellow colleagues in the Department of Civil Engineering for their positive
critique and sincere encouragement
Thank you all may the Lord God always bless you for what you have done for
me
viii
List of Tables
Table 11 The economic evaluation of various adsorbents in dye removal
Table 21 Wavelengths of the more important colours of the visible spectrum
Table 22 Characteristics of Congo Red dye
Table 23 Average Chemical composition of softwood and hardwoods
Table 41 Chemical and physical properties of sawdust
Table 42 Concentration versus Absorbance
Table 43 Wavelength versus Absorbance
Table 44 Shaking speed versus mass of dye removed
Table 45 Dye removal versus time
Table 46 Particle size versus removal
Table 47 Adsorbent Concentration versus Dye removal
IX
List of FiguresFigure 21 Classification of Dyes by Colligators
Figure 22 Structure of Congo Red dye Molecule
Figure 23 Structure of Congo red Dye ion
Figure 24 Balanced and unbalanced atoms
Figure 25 Freundlich Isotherm model
Figure 26 Linearized BET Isotherm
Figure 27 Distribution of ions near a charged surface
Figure 28 Formation of monomolecular and polymolecular water layers on
wood surface
Figure 31 Schematic representation of Van Soest Procedures
Figure 41 Chemical composition of Sawdust
Figure 42 Calibration Curve of Congo Red dye
Figure 43 Variation of absorbance with wavelength
Figure 44 Effect of shaking speed on dye removal
Figure 45 Variation of dye removal with time
Figure 46 Effect of particle size on dye removal
Figure 47 Effect of adsorbent concentration on Dye removal
Figures 48(a)mdash-48(d) Adsorption isotherms for Cypressus lusitanica Pinus
spp Ocotea usambarebsis and Vitex keniensis
Figure 49(a) - 49(d) Effect of initial dye concentration on dye removal
Figure 410 Effect of initial pH on removal
List of AppendicesAppendix A 1 Chemicals and Equipment
Appendix A2 Chemical composition of Sawdust
Appendix A3Variation of absorbance with concentration
Appendix A4 Specific Gravity of Sawdust (Gs)
Appendix A5 Adsorption Isotherm data
Appendix A6 pH versus amount of dye sorbed
Appendix A7 Mean Particle size Versus dye removal at equilibrium
Appendix A8 Number of revolutions per minute versus Dye removal
Appendix A9 Freundlich constants
Appendix A 10 Initial concentration versus dye removal for Pinus spp Vitex
kiniensis Octea usambrensis and Cypressus lusitanica
XI
Abstract
The potential of hardwood and softwood sawdust as low cost adsorbents in
the removal of a disazo dye (Congo Red) from water was evaluated Two
softwoods Cypress (Cypressus lusitanica) and Pine (Pinus spp) and two
hardwoods Camphor (Ocotea usambarebsis) and Meru oak (Vitex keniensis)
were used in the studies Those materials were selected on the basis of their
relative abundance as a waste in the timber mills industry
Sawdust was found to have potential in removing Congo red dye from
wastewater The interaction of dye and the sawdust conform to Freundlich
adsorption model with softwoods showing a higher potential both in capacity
and intensity of removing Congo red dye from wastewater than hardwoods
The coefficients of Freundlich equilibrium model k and n show that Cypress
(Cypressus lusitanica) had the highest potential having k and n values of 040
and 179 respectively followed Pine (Pinus spp) with k and n values of 033
and 105 while Meru oak and Camphor had the two values being 023 and
0823 and 00069 and 0619 respectively
The higher dye uptake by softwood sawdust is attributable to more pore
spaces and high specific surface area for adsorption than hardwood The
softwoods had lower densities than hardwoods and thus the far more porous
The adsorption correlated positively with the hemicellulose extract of the
sawdust which was high in cypress pine Meru oak and Camphor in that
order Cellulose and lignin content correlated negatively with the adsorption
capacity and intensity
Xll
CHAPTER 1 Introduction
10 BackgroundColour removal is a pertinent problem for all categories of textile effluents due
to the variety of chemicals used in fabric dyeing and printing Apart from the
deterioration in the aesthetic value of the receiving water bodies the presence
of colour makes water reuse difficult (UNEP 1993)
When colour removal is necessary the following provides useful treatment
technology
bull Segregation of all print wastes and disposal of each separately to landfill
bull Reduction of colour shop losses by careful hand cleaning of all brushes
troughs doctors blades cans tanks screens
bull In all weaving mills reduce use of fugitive tints in weaving
bull Exhaustion of dye thoroughly in the dyeing process
bull Use of dye processes that can cause less colour losses eg solvent pad
and stream microfoam methanol and ammonia dyeing method
Incase dye colour finds way into waste stream removal may be achieved by
techniques such as
1 Chemical coagulation It is generally applied to remove colour arising from
dyes such as dispersed vat and sulphur dyes Coagulants such as alum
and ferric sulphate applied at a dose of 300 - 600 mgl and lime at a dose
approximately 300 - 600 mgl will remove 75 -90 of colour (UNEP 1993)
These dosages are very high making chemical coagulation an expensive
colour removal technique Chemical coagulation cannot however achieve
satisfactory removal of soluble dyes
2 Adsorption It is an efficient and popular method of colour removal Several
adsorbents are known to be capable of removing dyes from textile effluent
These include activated carbon fullers earth fly ash fired clay baggasse
pith wood peat etc (Poots et al 1978) Techniques to regenerate
adsorbents include the use of bouler water organic solvents and catalytic
oxidation The pH must be adjusted to near neutral and suspended
particulates must be removed for adsorption unit to function properly
i
3 Colour removal in biological treatment It can be improved by addition of
powdered carbon (as a catalyst) to the aeration basin in activated sludge
system ( UNEP 1993) This system will not remove colour as efficiently as
adsorption However an additional 20-55 reduction in colour can be
realised from this process
Other promising techniques for colour removal are ozonation and
hyperfiltration (UNEP 1993)
11 Problems associated w ith Dyes and Textile Industry
Dyes have been reported to be among the different pollutants of aquatic
ecosystems with world production estimated at 640000 tonnes in 1978(Clarke
and Anliker 1980) Dyes used contain many compounds whose
environmental behaviour is largely unknown (Baughman and Perinich1988)
Although most dyes are considered inert or nontoxic Some are not totally
innocuous (Liang 1991) Anliker etal (1981) showed that dispersed dyes
have high partition coefficient and solubility suggesting significant potential for
bioconcentration
In addition to this it has been reported that the bulk of these are used in
textile industry Textile industries have the markets demanding better
performance each year (Jones 1974) Dyes have to be resistant to ozone
nitric oxides light hydrolysis and other degradative environments (Pagga and
Taeger1994) Studies on biological degradation of dyestuffs yields negative
results as indicated above since the dyes themselves are designed to resist
this type of treatment The high colour value or absoptivity needed for a
commercial dye is not an advantage when it ends up in a wastestream
Although some dyes are biologically degradable as noted by Pratt (1968)
most that are present in wastewater are objectionable for their colouration
Dyes are too refractory to undergo degradation in the time required for
conventional treatment The auxiliary chemicals used in aqueous dyeing can
also present a problem to biological processes Carriers such as methyl
naphthalene chloro-benzenes biphenols orthophenyl phenol and benzyl
alcohol are used to speed up the dyeing process These chemicals may
eventually find their way into the receiving waters when the dyeing process is
completed (Jones 1974)
Also untreated effluents from dyestuff production and dyeing mills may be
highly coloured and thus particularly objectionable if discharged into open
waters The concentration of the dye may be much less than 1 ppm but the
dye is visible even in small concentrations the transparency of streams would
also be reduced Because dyes absorb sunlight plants in the drainage stream
may perish thus the ecosystem of the streams may be seriously affected
Possible chronic risks of colourants and their intermediaries are
carcinogenicity and to a lesser extent sensitization and allergies (Huang and
Jang 1993)
In the past Kenya has experienced serious pollution problems resulting from
discharge of dye waste into municipal waste treatment works Investigations
carried out on industrial effluents in Eldoret by OMS-Klaranlagen in 1985
confirmed that damage had occurred to the Eldoret sewage stabilization
ponds due to high pH of the influent dye stuff from textile industries and lack
of pretreatment of industrial wastewater especially those from textile
industries (Sewe 1986) Presently textile dyeing by industries in Kenyarsquos
Export Processing Zone (EPZ) present give rise to coloured effluent which is
discharged untreated to open streams This poses a real challenge to the
ecological balance in the streams
12 Research objectives
The objectives of the research were-
1 To establish the properties of Cypress (Cypressus lusitanica) Camphor
(Ocotea usambarebsis) Pine (Pinus spp) and Meru Oak (Vitex keniensis)
wood sawdust as adsorbents
2 To assess the potential of sawdust in removal of Congo Red dye from
simulated wastewater
3
13 Research Justification
Coloured effluent especially from textile industries and dyestuff houses poses
a great challenge both to the environment and the industry Various
techniques have been used in removal of colour from dyestuff wastes These
include chemical oxidation froth floatation photochemical degradation
activated carbon adsorption and coagulation
Chemical degradation by oxidation with chlorine or ozone is effective but the
oxidant requirements are high and expensive The effectiveness of
decolourisation by oxidation process is reduced by impurities in the
wastewater It may increase the amount of exhausted chlorine or ozone in the
water and hence the treatment cost Chlorine treatment works well with
monoazo and anthraquinone anionic dyes but unsatisfactorily with disperse
and direct azo dyes ( Zollinger 1987)
The coagulation process only decolourises insoluble dyes such as dispersed
but does not work vell with soluble dyes (Kuo 1992)
Photochemical degradation in aqueous solution is likely to progress slowly as
synthetic dyes are in principle designed to possess high stability in light
Adsorption technique has been tried using activated carbon and is still the
most popular and widely used adsorbent however there are certain problems
with its use Activated carbon is quite expensive and the higher the quality the
greater the cost furthermore regeneration using solutions produces an
additional effluent although quite small In addition activated carbon is quite
expensive and the higher the quality the greater the cost On the other hand a
brief economic comparison made between different adsorbents under similar
experimental conditions by Poots et al (1978) showed that wood and peat
are effectively the most economical adsorbents for basic dye removal
Activated carbon removes most of dye on a unit weight basis while activated
alumina is the most expensive because of its high cost and poor ability to
remove basic dyes (Poots et al 1978)
4
Table 11 shows the economic evaluation of various adsorbents in dye
removal (Poots et al 1978)
Absorbent
Material
Comparative
cost per Kg
Adsorbent
Comparative
cost to
remove 1g of
Dye
Mass(g)
Adsorbent to
remove 1 g
Dye
Time (min) to
90
Equilibrium
Carbon 100 100 13 150
Peat 004 007 24 200
Wood 001 007 89 200
Alumina 182 550 400 500
Fullerrsquos Earth 066 202 20 200
5
CHAPTER 2
LITERATURE REVIEW
20 PROPERTIES OF DYES
21 IntroductionWith few exceptions all dyes are aromatic organic compounds They are
divide into three main groups non-ionic anionic and cationic The molecules
of ionic (anionic or cationic) dyes are composed of two main parts one of
which is a complex aryl radical This is the colour-imparting ion If the balance
of the charge on the latter is negative then the dye is classed as anionic On
the other hand if the balance of charge on the ion is positive then the dye is
classed cationic
The second part of an ionic dye molecule is an inorganic ion (an aliphatic
organic ion or in a few cases an aryl ion) The former is called the gegen-ion
and the latter the dye ion The function of the gegen-ion is to balance the
charge on the dye-ion and to render the dye soluble in water With few
exceptions anionic dyes are manufactured as metallic salts The vast majority
of anionic dyes are sodium salts of carboxylic acids uranine being the most
notable In case of cationic dyes gegen ion is usually the chloride ion In vast
majority of cases the gegen-ion could be replaced by another of the same
charge without seriously effecting the functioning of the dye For example a
calcium salt might be less soluble in water than a sodium salt Similarly a
sulphate might be less soluble in water than a chloride When dyes are used
as reagents for the detection of certain ions due consideration has to be
given to the gegen-ion of the dyes However unless the gegen-ion itself is
coloured it has no influence whatever upon the colour of the dye ion in
aqueous solution For example pararosanaline chloride or sulphate or acetate
exhibits exactly the same colour in solution On the other hand the dye ion
cannot be replaced by another ion without profound changes in the nature
and the functioning of the dye molecule The individual chemical physical and
tinctorial characteristics of a dye are due to its dye ion
6
The simple gegen-ion of a dye could be replaced by another dye-ion of the
same charge as the original gegen-ion and of opposite charge to that of the
first dye-ion This would result in the formation of a polychrome compound
dye Such dyes are prepared for special purposes and their molecules
consists of an electro-positively charged dye-ion and a negatively charged
dye-ion Dyes of this kind are insoluble in water but soluble in absolute and
aqueous alcohol Partial dissociation takes place in the latter Such dyes are
used in biological micro-technique for differential staining of acidic and basic
elements of cells and tissues
The colour index gives the structures of about 2100 anionic dyes and
classifies them variously as ldquoacid ldquobasicrdquo ldquodirectrdquo and mordantrdquo according to
the manner of usage in the textile-dyeing industry About 1400 of these
anionic dyes are amino dyes or imino amino acids The remainder are wholly
acid in that they have no basic side-chains
By definition an ldquoacidrdquo dye is one which dyes wool from a dye bath which
contains acid Such dyes now however find their application not only for wool
but also for silk polyamide acrylic and regenerated protein fibres They are
applied from dye baths containing sulphuric or formic or acetic acid or
ammonium sulphate sometimes from a neutral and occasionally from a
slightly alkaline bath
According to colour index rsquorsquodirect dyes are originally designed and marketed
for the primary purpose of dyeing celiulosic fibres such dyes having being
defined as lsquoAnionic dyes having affinity for celiulosic fibres when applied from
an aqueous dyebath containing electrolyte Direct dyes provide the simplest
means of colouring celiulosic materials as they are normally applied in the
textile dyeing industry from a neutral to a slightly alkaline dyebath at or near
boiling point to which sodium chloride and sodium sulphate is added Direct
dyes are anionic- most are amphoteric since they possess side chains which
are basic in reaction
7
Mordant dyes are described as dyes having the property of combining with
metallic oxides and salts to form metallic complexes Dyes of this class are
however very difficult to define The colour Index states that the make-up of
this class not as a matter of strict definition but of a convention which has
grown up over the years and which has no logical basis The majority of dyes
are used with the acid of the mordants in the textile industry mainly for
dyeing wool the secondary application being for dyeing silk and nylon and for
printing on cellulose silk and wool fabrics The major classification of dyes by
colligators is shown in Figure 21
8
Synthetic Organic Dyes
GROUP 1
NON-IONIC DYES
Class 1
Acidic
Class 2
Basic
Class 3
Neutral
Class 4
Amphoteric
GROUP 2
CATIONIC DYES
Class 1
Wholly basic dyes
Class 2
Basic dyes having
acidic side-chains
GROUP 3
ANIONIC DYES
Sub-Group 1
Wholly acid dyes
Class 1 Class 2 Class 3
Carboxylated dyes Carboxylated dyes Sulphonated dyes
OH
Without -OH with -OH groups
as
groups
only
Class 4 Class 5 Class 6
Sulphonated dyes Sulphonated dyes With -
without -OH groups with -OH groups with carboxyl groups groups
and -OH groups their
colligators
Sub-Group 2 Sub-Group 3
Weahly amphoteric dyes_____ Moderately or strongly amphoteric dyes
Class 1 Class 2 Class 1 Class 2 Class 3
Without -OH groups With -OH groups Without -OH groups With -OH groups With -
OH
groups as
their
only acidic
colligators
Figure 21 Classification of Dyes by Colligators
9
22 Absorption Spectra of Dyes
The wavelength of maximum absorption for each dye is given for the visible
spectral region White light is composed of light of the entire spectral range
And an object appears coloured in ordinary white light because it absorbs
some of the spectral radiation but not all The unabsorbed colour is reflected
or transmitted and is the colour of the object as it appears to the eye Objects
which appear black absorb the whole of the visible spectral range without
transmitting or reflecting any component of the white light If a coloured object
illuminated by a source of white light is examined with spectroscope it will be
seen that the light reflected or transmitted by the object does not show the
complete visible spectral range On the other hand if the object is blue-green
then the red will be missing from the spectrum Red and blue-green are
therefore regarded in this respect as complementary colours Table 21 shows
colour in the visible light and their complimentary colours
Table 21 shows wavelengths of the more important complimentary colours of
the visible spectrumfadopted from Gurr 1971)
Wavelength
(mm)
Colour Complementary
colour
400-430 violet Greenish-yellow
430-490 blue Greenish-orange
490-510 blue-green Red
510-530 green Purple
530-560 yellow-green Violet
560-590 yellow Blue
590-610 orange Greenish-blue
610-750 red blue-green
Absorption often takes place in more than one region of the visible spectrum
and the colour observed also depends upon the intensity of absorption The
absorption spectra obtained by the spectrophotometer are characteristic of the
individual dyes they might be regarded as their fingerprints However
variations in the wavelengths of maximum absorption of many dyes with
10
variations in the pH temperature and concentration of the solution examined
(Gurr 1971)
221 Why are dyes Coloured
Colour in dyes is explained as a consequence of the presence of a
chromophore By definition chromophores are atomic configurations that
contain delocalised electrons They are usually represented as nitrogen
carbon oxygen and suphur that have alternate single and double bonds
(httpmembersDaonlinecom) Below are some chromophoric configuration-
-C=C- -C=N- -C=0- -N=N- -N 02 and -Quinoid rings
On the other hand dyes are aromatic compounds and their structures include
aryl rings which have delocalised electron systems These are responsible for
the absorption of electromagnetic radiation of varying wavelengths depending
on the energy of the electron clouds For this reason chromophores do not
make dyes coloured in the sense that they confer on them the ability to absorb
radiation Rather chromophores function by altering the energy in the
delocalised electron in the dye and this alteration results in the compound
absorbing radiation from within the visible range instead of outside it Our
eyes detect that absorption and respond to the lack of a complete range of
wavelengths by seeing colour (Fessenden and Fessnden1990)
23 Classification of Dyes
There are various methods of dyeing and many more types of dyes for each
method There are however six main classes of dyes for cotton fabric vat
direct developed naphthol sulphur and analine black
Vat dyes known as fast dyes are insoluble in water An acid rinse (acetic
acid) is used to neutralise the alkali present in the dye bath followed by
detergent washing to produce brightness and wash resistance
Direct dyes are so named because they are applied to the fibres without preshy
application of chemicals required for retention Some direct dyes are subject
to post treatment with copper sulphate and acetic acid to increase light
11
fastness and potassium dichromate and acetic or formaldehyde to increase
wash fastness
Developed dyeing is a procedure whereby two different chemicals are
employed The first chemical (05 - 4) is applied and absorbed into the
fibres The second chemical (developer) is then applied and reaction with the
first takes place directly on the fibre for stable colour development
Naphthol dyeing is developed dyeing in reverse A cloth is first impregnated
with developer and then the dye is formed on the fibre by saturation in the dye
bath In the actual process the naphthol dye is dissolved by mixing either
sodium hydroxide under heat or ethyl alcohol and cold solution of sodium
hydroxide
Sulphur dyes are principally used to dye heavy cottons in shades of blacks
dark blues browns and other dark colours The dyes are generally water
insoluble and require dissolving in an alkaline solution before application The
manufacture and use of sulphur dyes results in the formation of a toxic and
highly alkaline waste liquor which cannot be disposed of in a conventional
manner since it unduly pollutes and stagnates fresh water rivers and streams
These waste liquors are highly coloured and odiferous The sulphide or other
alkali sulphides contained therein hydrolyses with water and forms hydrogen
sulphide which is toxic to marine life and has foul disagreable odour
No wholly suitable means for the treatment or disposal of this liquors is
known Neutralization treatments of these alkaline liquors such as with
sulphuric acid results in the formation of a highly turbid suspension and
evolution of large quantities of hydrogen sulphide gas Such acid treatment
does not improve the colour of these waste liquors (Sittig1973) It has now
been found that sulphur dyes waste liquors can be deodorized decolourized
neutralized and otherwise purified by treatment with an aqueous sulphurous
acid It is necessary that the liquor be mixed with sulphurous acid within a
limited time and that the ratio of the liquor to acid or the initial pH be controlled
within relatively close limits Under such conditions the sulphurous acid react
12
with the toxic colour and odour producing components of the waste liquor
coagulating the undesirable components of there of and forming a stabilized
clear solution phase The coagulated fractions can then be removed from the
clear solution by filtration decantation centrifugation and any separation
technique and solution disposed of in a river or other waterway without danger
of pollution or stagnation of the water
Analine black dye is an insoluble pigment produced by oxidation of Analine
The cloth is passed through dye bath typically consisting of 42 kg of Analine
hydrochloride 16 kg of sodium Chlorate and 6 kg of copper sulphate in 455
litres of water After impregnation the cloth is given a steam treatment to
develop the black pigment Alkaline sodium dichromate treatment completes
the process
24 Solubility of dyes
Many water-soluble dyes owe their solubility to the presence of at least one
sulphonic acid group and they are usually applied as sodium salts In most
cases sulphonic groups are introduced into the intermediates from which the
dye is made but sometimes an insoluble dye is sulphonated Water-soluble
basic dyes contain no sulphonic acid group but are prepared in the form of
hypochlorides Water-insoluble dyes of certain types can be rendered soluble
in this form and then converted on the fibre into the original insoluble form
The sulphur and vat dyes depend on this principle which enables tint fastness
onto wet treatments obtained Insoluble azo dyes can be formed directly
within the fibre
Gurr 1971 used 17 symbols to describe the relative solubility of dyes in
various solvents at 20deg C These are as follows
- = insoluble
s- = only very slightly soluble
s = slightly soluble the amount of dyestuff dissolved being insufficient to
render the solution of practical use as a colourant
s+ = slightly soluble the amount of dyestuff dissolved might be sufficient to
render the solution of use as a feeble colourant
13
P- = slightly more soluble than s+
P = slightly more soluble than p-
P+ = slightly more soluble than p
M- = moderately soluble (around 1 )
M = slightly more soluble than m-
M+ = slightly more soluble than m
R- = slightly more soluble than M+
R = readily soluble
R+ = very readily soluble (to the extent of around 5- 7 )
V- = slightly more soluble than R+
V = more soluble than V-
V+= more soluble than V
H = highly soluble (usually around 20 )
s- s s+ P- P P+ denote varying degrees of low solubility
M-t M M+ denote three different degrees of moderate solubility
R- R R+ denote varying degrees of good solubility
V- V V+ and H denote high solubility
In this regard Congo Red was found to have good solubility in water and was
classified as R-
241 The Congo red dyeCongo red is an example of a diazo dye This is characterised by the
presence of two azo groups (-N=N-) as a chromophore This dye is made by
coupling a diazonium salt with an amine The structures are shown in Figures
22 and 23 Other characteristics of the dye are given in Table 22
n h 2
N = N-
Fig 22 Structure of Conge Fled dye Molecule
14
Table 22 Characteristics of Congo Red dye
Common name Congo red
Other names Direct red Cotton red
Cl number 22120
Cl name Direct red
Class Disazo
Ionisation Acid
Solubility in water Soluble
Solubility in ethanol 019
Wavelength of Maximum
Absorption
488(Merck) 497 ( Conn)
Colour Red
Empirical Formula C32H22N60 6S2Na2
Formula weight 696696
As such the dye being a strong electrolyte readily ionises to the dye ion
containing the sulphonic acid group and the sodium ion as shown below
Fig 23 Structure of Congo Red Dye ion
25 Measurement of dye concentration in a dye bath
In order to obtain the concentration of a dye bath it is necessary to determine
the absorption of light through a portion of the bath diluted if need be Colour
is a sensation resulting from the perception of visible radiation over a wide
range of wavelength and embodies such factors as the depth of colour
Visual comparison is the method of choice for colour measurement when the
object is to assess the appearance of a water sample for aesthetic purposes
Instrumental methods which determine only the absorption of light at limited
15
range of wavelength are objective and provide accurate and precise
measurements but do not measure the optical properties as visual
comparison
In the visual comparison technique the colour intensity of the sample is
compared with that of a series of standard solutions or permanent glass
standards to obtain a colour match The instrumental method measures the
absorption of light of a permanent set by sample Both visual and photometric
determination rely on the fact that the depth of colour (absorbance) is
governed by the concentration of the material in the solution (Lamount 1981)
Colour is measured by optical density (D) on the spectrophotometer and the
whole colour band should be scanned
When light (monochromatic or heterogeneous is incident upon a homogenous
medium a part of the incident light is reflected a part is absorbed by the
medium and the remainder is allowed to transmit
If IO denotes the incident light IR the reflected light IA the absorbed light and
IT the transmitted light then
IO= IA+IT+IR Eq 21
If a comparison cell is used the value of IR which is very small (about 4)
can be eliminated for air-glass interfaces Under this conditions
IO= IA+IT Eq 22
Lambertrsquos Law
ldquoWhen a beam of light is allowed to pass through a transparent medium the
rate of decrease of intensity with the thickness of medium is directly
proportional to the intensity of the light
Mathematically
dldt=kt Eq 23
Where lo = intensity of incident light
t denotes the thickness of the medium
k denotes the proportionality constant
Integrating and putting l=lo when l=0
16
we get
In Iolr = Kt
It = lo 6 kt
It= l0exp(-kcl)
Eq 24
Eq 25
Eq 26
Where
IT = the transmitted light
IO = the incident light
c = concentration of the absorbing species
= cell length
k = extinction coefficient
The optical density D is by definition
D = logio (IoIt) = 0434kcl Eq 27
D is therefore proportional to the cell length and dependent on wavelength
through coefficient k (Environmental Technology letters 1986) The first step
in photometric or spectrophotometric analysis involves the establishment of
working conditions and the preparation of a calibration curve relating to the
absorbance Spectrophotometric absorbance measurements are ordinarily
made at a wavelength corresponding to an absorption peak because the
change in absorbance per unit concentration is greatest at this point the
maximum sensitivity is thus realised In addition the absorption curve is often
flat in this region under these circumstances a good adherence to Beerrsquos
Law can be expected Finally measurements are less sensitive to
uncertainties arising from failure to reproduce precisely the wavelength setting
of the instrument Variables that influence the absorption spectrum of a
substance include the nature of the solvent the pH of the solution the
temperature high electrolyte concentration and the presence of interfering
substances The effect of these substances must be known conditions for the
analysis it is necessary to prepare a calibration curve from a series of
standard solutions These standards should approximate the overall
composition of the actual samples and should cover a reasonable
concentration range of the analyte It is safe to assume adherence to Beers
Law and use only a single standard to determine the molar absorptivity The
results of the analysis should never be based on a literature value for molar
absorptivity
17
26 Nature of Colour in Aquatic and Marine Environment
The observed colour in water is the result of light back scattered upward from
a water body after it has passed through the water to various depths and
undergone selective absorption The colour of light (ie wavelength) and the
turbidity of water determines the depth to which light penetrates in the water
system (Canadian Council of Ministers of Environment 2001) In pure water
light is highly absorbed in the infra-red region of the light spectrum and poorly
absorbed in the blue region Thus blue light is refracted reflected andor reshy
emitted back causing the visible colour of the water to be blue (Jerome 1994)
The colour of water is characterised as true or apparent True colour depends
on dissolve fraction in water which can include natural minerals such as ferric
hydroxide and dissolved substances such as humic or fulvic acid (Hongre and
Akesson 1996) Dyes (eg Acid blue toilet flush) wood preservatives
antisapstains and various other dissolved organic substances from
anthropogenic sources may also contribute to water colouration
(McCrum 1984 Brown 1987 Boegeding and Hites 1994) Colour also
depends on factors that affect the solubility and stability of the dissolved and
particulate fractions of water such as pH and temperature True Colour is
measured by comparator and calorimetric methods
Apparent colour is a function of dissolved and suspended material such as
organic plant debris phytoplanton and zooplanktons and inorganic
suspended sediments (Effler and Aver 1987 APHA 1992 Bennett and Drikas
1993) Apparent color is commonly estimated by light
transmittanceabsorbance through water
27 Effects of Colour in Aquatic and Marine Environment
Numerous studies have demonstrated a strong positive correlation between
primary production and water colour in fresh water (Henebry and Cairns 1984
Arvola 1986 llmarvia and Hutte 1989 Del Giorgio and Peters 1994) The
colour of water may affect algal species composition as photosynthetic
efficiency at various wavelengths differs markedly among algal groups
18
according to the amounts of accessory pigments accompanying chlorophyll a
( Atlas and Bannister 1980 Arvola 1986 Sheath et al1986 Vegas-Vilarrubia
1995)
Wetzel (1975) and Juarez (1987) in the Canadian Water Quality Guidelines
for protection of aquatic life Colour state that many invertebrate species
possess visual receptors and absorption spectrum peaks that correspond to
the spectral quality of their preferred habitats (Canadian Council of Ministers
of Environment 2001) Thus changes in the spectral quality of water
therefore could have profound effects on the behavour of some invertabrates
and fish species
Mierle and Ingram (1991) Nilsson and Hakanson 1992 Haine etal 1995
record that Mercury availability bioaccumulation and hence toxicity increases
as water colour increases The reason for this relationship in part is that
mercury brought from the surrounding environment is attached to coloured
substances(opcit)
28 ADSORPTION PHENOMENA
Adsorption is the accumulation of a solute to a surface or interface between
the solution and the adsorbent Adsorption processes generally yield surface
or interface concentrations of solute greater than those in the bulk phase The
driving forces for attainment of chemical equilibrium in the homogenous
phases relate to the reduction of the free energies of the bulk system
whereas the driving force for a surface reaction is a reduction in surface
energy (Weber et al 1991)
There are two types of adsorption Physical adsorption may be explained in
terms of the energy per unit area of the solid Molecules in the interior of any
solid are subjected to equal forces in all directions whereas molecules on the
surface of the solid are subjected to unbalanced forces as shown in Figure
24 Other molecules becoming attached to the surface can balance these
forces The attractive forces are relatively weak and are of Van der Waals
type
19
Fig 24 Balanced and unbalanced atoms
Chemical adsorption takes place by chemical interaction between the surface
of the solid and the molecules of the liquid
Absorption is a process in which solute transferred from one phase to another
interpenetrates the sorbent phase by at least several nanometers The
differences in molecular environments of a contaminant in aqueous and
sorbent phases which manifest themselves in absorption processes can be
described using classical thermodynamics
Sorption is the process by which chemicals become associated with solid
phase This term is general encompassing adsorption (adsorption onto a two
dimensional surface) and absorption (into a three-dimensional matrix)
(Schwarzenbach et al 1993) Theories of sorption are based on the principle
that the three main steps are involved in the process any of which is the rateshy
controlling factor The rate steps are
bull boundary layer mass transfer control across the liquid film surrounding
each particle (Masumune 1964)
bull Particle diffusion control due to diffusion in the liquid contained in the pores
and the adsorbate along the pore walls (Rosen 1954)
bull surface adsorption control based on the rate of adsorption and desorption
at some specified radius within the particles
20
When we are interested in assessing the equilibrium proportion of a particular
chemicalrsquos presence in association with solids for any particular volume of
aquatic environment we begin by considering how the total sorbate
concentration associated with the sorbent qe (molkg1) depends on the total
concentration in the solution Ce (molL1) Such a relationship is referred to as
sorption isotherm The term isotherm is used to indicate that one is
considering sorption at a constant temperature Experimentally determined
isotherms commonly fit the empirical relationship
This equation is known as Freundlich isotherm K is referred to as Freudlich
constant and n is a measure of the nonlinearity involved Case 1 in Figure 22
(nlt1) reflects the situation in which at higher and higher sorbate
concentration it becomes more and more difficult to sorb more molecules
This may occur in the cases where specific binding sites become filled or
remaining sites are less attractive to the sorbate molecules Case 3 (ngt1)
describes the contrasting situation in which the previously sorbed molecules
lead to a modification of the surface which favours further sorption Case 2
(n=1) reflects those situations in which the attractiveness of the solid for the
sorbate remains the same for all levels of qe This is so called linear isotherm
case
Eq 281
i iCase 2 n=1
(molkg1)
cc (moll1)
Fig 25 Freundlich Isotherms
21
The rate of adsorption of a molecule onto a surface can be expressed in the
same manner as any kinetic expression ie
Rads = kC Eq 282
Where Rads -rate of adsorption
x- Kinetic order
k - rate constant
C - gas phase concentration
or
Rads = k rsquoP Eq 283
Where x - kinetic order
krsquo - rate constant
P - partial pressure of the molecule
If the rate constant in either of the above expressions in an Arrhenius form
then we obtain kinetic equation of the form
Rads = ACexp(-EaRT) Eq 284
Where Ea is the activation energy for adsorption and A the pre-exponential
(frequency) factor
Other equations which are used frequently used in describing adsorption
isotherms and which can be derived from fundamental considerations are
Langmuir and BET isotherm developed by Bruneur Emmett and Teller
The Langmuir isotherm is used to describe single layer adsorption and can be
written as follows
Cy =aym +cym Eq 285
ym -represents maximum adsorption that can take place in grams adsorbate
per gram sorbent
C - is large relative to a
When y approaches ym coverage of the surface is essentially complete If Cy
is plotted against c a straight line is obtained from which constants a and ym
can be evaluated
The BET type of adsorption is generally more applicable than the Langmuir
isotherm and it corresponds to multi-layer adsorption The model assumes
22
that a number of layers of adsorbate accumulate at the surface and that the
Langmuir isotherm applies to each layer It takes the form
Ce(Cle)[1 CsCe)]=1BQmax+(B-1 )BQmax)(CeCs) EC|286
Where Qmax represents maximum adsorbate per mass of adsorbent Cs is
saturation concentration and B is a constant
23
BET equation is represented in straight line form as in Figure 26
Figure 26 Linearized BET Isotherm
With this equation Cs and b can be obtained from the slope and the intercept
of the straight-line best fitting of the plot of the left side versus ccs The best
isotherm equation to use in a particular instance can be determined by
comparing the goodness of the fit of the data when plotted in the form for each
isotherm which yields a straight line
In any practical process the removal of a contaminant from a gas or liquid is
determined by the rate at which the material is adsorbed onto the solid
surface Three major steps can be identified in the removal of a contaminant
by adsorption-
bull It must move from the liquid or gaseous phase through a surface film to the
exterior of the adsorbent
bull It must pass by diffusion into and through the pores of the adsorbent
bull It must be attached to the adsorbent
24
281 Forces and Mechanisms of adsorptionThe physiochemical forces and mechanisms thought to be responsible for the
adsorption of ions and molecules are-
2811 London -Van der Waals forces
They are attractive forces which arise from momentary dipoles about atoms
or molecules caused by small perturbations of electronic motions The dipoles
induce small dipoles in the neighbouring atoms of opposite sign Although the
momentary dipoles and induced dipoles are constantly changing positions and
sign the net result is a weak attraction (4 to 8 kJ mol) for small molecules
and atoms) The forces are important in adsorption of organics and are
generally attributed to non-ideal behaviour in gases( Roy et al 1992)
2812 Coulombic-electrostatic-chemical
An electrostatic force results from a charged surface due to substitution in the
mineral lattice (permanent charge) or protonation of surface oxygen and OH
group (pH dependent charge) and an oppositely charged species which
maintains electro-neutrality of the surface In layer silicates substitution of
octahedrally or tetrahedrally coordinated cations by cations of lower valence
results in a net negative charge This excess charge can bring about the
formation of a diffuse layer of positively charged atoms or molecules about the
colloid the density of this layer is greater at the surface and the decreases
exponentially to the level of bulk solution This type of reaction is important in
adsorption of inorganic and ionized organic molecules
When the adsorbent and the adsorbate bear a charge ie both are ionised
then attractive forces are inversely related to the distance between the charge
centres Dyes may be anionic or cationic and adsorbing substrates such as
proteins carbohydrates and polyamides may be charged also Even if the
adsorbent bears no formal charge before adsorption of a dye ion the process
of adsorption produces a surface charge and the surface potential is
determined by the adsorbed dye ions Coloumbic interactions can either
favour or disfavour dye adsorption so that they may be regarded as binding or
25
anti-binding The presence of a charge on the adsorbing surface confers upon
it an electric potential which simultaneously attracts oppositely charged
(counter) ions and repels similarly charged ions (co-) ions As the distance
from the charged surface increases the effect of the surface potential
becomes less Thus the surface potential is only apparent over a limited
distance in all practical sense and within this limited distance the entire
imbalance of ionic concentrations near the surface is combined This means
that near to the surface exists a diffuse layer and since within it there will be a
separation it is termed as an electrical double layer
Excess ionic concentration
Distance from the surface ( AdoDted from Ratte
Fig 27 Distribution of ions near a charged surface
Three main coloumbic effects are encountered in dye adsorption
diams The presence of acid may determine the potentials of the adsorbing
phase to make it more or less attractive to dye ions eg proteins
contain positive (NH3+) and negative (COO) groups In acid the
carboxyl groups are back titrated giving the fibre a positive charge
favourable to the uptake of dye anion Cellulose contains hydroxyl
groups which in the presence of an alkali may ionise giving the fibre
a negative charge repelling the dye ions and preventing their
absorption
diams Dye ions will be adsorbed by uncharged substrates to a very limited
degree since the first few molecules taken up will confer on the fibre
a charge repelling other similarly charged ions This effect is most
26
marked in relatively hydrophobic fibres since the volume of water
taken up broadly corresponds to the double layer volume and when
this is small the charge effects will be concentrated
diams Dye ions will be taken up without hindrance by a substrate of
opposite charge but in doing so they will reduce the potential of the
substrate eventually to zero when the adsorbed ion concentration
equals that of fixed charges Since further absorption will meet
constraints mentioned above the substrate may appear to be
saturated with dye ion at this point (Ratte 1974)
2813 Hydrogen Bonding
A hydrogen atom is bonded to two or more atoms the bond is generally
conceived as an induced dipole phenomenon No universal agreement has
been reached on the description of the hydrogen bond but it may be
considered as asymmetric electron distribution of the 1s electron of the
hydrogen atom by very electronegative atoms (FO C l)
A hydrogen bond may be formed when a covalently bound hydrogen exists
between two electronegative atoms Since the appropriate groups eg OH
NHR CF3 are fairly common in dye molecules and substrates it is not
surprising that hydrogen bonding should be postulated as a potential binding
force for dyes in aggregates and with substrates The hydrogen bond is
relatively weak one the bond energy lying in the range 2-10 Kcalmole Its
formation involves also low activation energy The strength of a hydrogen
bond depends upon the Electro-negativity of the bound atoms so that fluorine
forms much stronger hydrogen bonds than chlorine The hydrogen bonding
power of an atom can be enhanced by inductive effects and substitution so
that RNH3+contains a more powerful hydrogen bonding than R-NH2
When we consider a dye molecule and substrate in aqueous medium then if
there is any possibility of the two becoming associated through a hydrogen
bond then the relevant residues will be hydrogen bonded with water prior to
the anticipated association Hydrogen bonding between the dye and the
substrate will then require breaking the water hydrogen bonds
27
Alternatively hydrogen bonding groups in the substance may be associated
with one another (intra-molecular hydrogen bonding) so that involvement with
the dye molecule will again require two hydrogen bonds to be broken for each
one formed in the adsorption Where the two broken hydrogen bonds involves
water it is possible for the two water molecules freed to bond together and
with an intra-molecular hydrogen bond for the free group to bond with water
so that there is no net charge in the number of bonds
Another form of hydrogen bonding is one in which the delocalised electrons of
a conjugated ring system provide an electronegative centre for involvement in
a bond eg benzene will interact with proton donor substances eg methanol
to form a hydrogen bond
2814 Ligand exchange -anion penetration-coordination
Many atoms or molecules for coordinated complexes with ligands that range
in complexity from simple molecules to extensive chelate complexes The
coordinated complexes may carry a net negative charge that may be localized
on some part of the complex These complexes may inturn be bonded to the
surfaces by hydrogen bonding or by polyvalent cation linking the complex to a
charged surface The bonded coordinated complexes may be displaced by
other coordinated complexes that better satisfy electro-neutrality requirements
(ie are stronger complexing agents) while being restrand by steric limitations
The energy of ligand exchange reactions with inorganic ion ranges from 8 to
60 kJmol
2815 Chemisorption
In this adsorption process an actual chemical bond usually covalent is
formed between the molecules and surface atoms A molecule undergoing
chemisorption may loose its identity as the atoms are rearranged forming
new compounds at the demand of the unsatisfied valencies of the surface
atoms The enthalpy of chemisorption (h gt29KJMol) is much greater than for
physical adsorption -ligand exchange reactions are forms of chemisorption
28
2816 Dipole-dipole or orientation Energy
This interaction results from the attraction of a permanent dipole for another
dipole The resulting energy of attraction is less than 8 kJmole
2817 Induction or dipole induced dipole
This type of interaction results from the attractions of an induced dipole about
by either - a permanent dipole or a charged site or species The energy of
attraction is less than 8 kJmol
2818 Hydrophobic effect
The exact nature of adsorption mechanism is uncertain Some investigators
believe that hydrophobic adsorption is primarily an entropic driven mechanism
brought about by the destruction of the physical cavity occupied by the solute
in the solvent and from the partial loss of structured water molecules about
the solute ordered by Van der-waals forces (Horvath et al 1976 Sinanoglu
and Abdulnur 1965) Other researchers postulate that the hydrophobic effect
is the result of simple partitioning Non polar organic solutes tend to migrate
from the aqueous phase to hydrophobic surfaces on the adsorbent ( Dzombak
and Luthy 1984 Chiou et al 1979 1983 Griffin and Roy 1985)
282 Thermodynamics of adsorption EquilibraAdsorption equilibria can well be described in terms of thermodynamics
Accordingly at equilibrium in a system
fJs= Psdeg + RTInas Eq 287
Ri= ideg + RTInaf Eq 288
Where ps and pf are the chemical potentials of the adsorbate in the external
and adsorbent surfaces respectively as and at are the corresponding
activities psdeg and pdeg are the corresponding standard state chemical
potentials At equilibrium the chemical potentials in the two phases must be
equal so that
qsdeg - = -A pdeg = RTInafas Eq 289
29
The term -A pdeg represents the change in standard chemical potential or
standard molal free energy in the transfer from the external to the adsorbant
phase and is thus the affinity
The free energy per mole p is given by
fj= H - TAS= E + PV -TS Eq 290
Where
q = is the free energy per mole
H =is the enthalpy
T= is the Absolute temperature
AS = Change in Entropy
P = Partial Pressure
V =Volume
E in terna l energy
283 PROPERTIES OF WOOD AS AN ADSORBENTA great variety of alternative low cost materials like fly ash soil wood
chippings tyre cuttings coconut shell powder hair coal etc are being tried in
place of activated carbon for sorption of different pollutants like pesticides
detergents heavy metals dyes etc(Chu etal 1978 Emig 1973 Huang and
Liao 1970 Aga 1983 Mckay and Poots 1980 Michelson et al 1975)The
chemical and physical characteristics of sorbent materials as well as those of
sorbates vary widely
Wood industry bi-products such as bark and sawdusts have been widely used
for their property of metal adsorption and metal removal from contaminated
effluents Concerning the utilisation of sawdusts many researchers have
studied metal adsorption of materials from species such as red fir mango
lime pine ceda teak Japanese redpine and Japanese beech As regards
wood barks several species were studied in particular pine oak and spruce (
Fiset etal 2000)
2831 Hygroscopicity
rlygroscopicity is the property of wood to attract moisture from the
surrounding atmosphere and hold it in the form of liquid water or water
vapour This property originates from the chemical composition of wood
cellulose hemicelluloses pectins lignin and certain extractives are
30
hygroscopic substances (Tsoumis 1991) To understand the properties of
wood as an adsorbent it is first important to understand the mechanism of
moisture adsorption onto wood
2832 How moisture is held in wood
Moisture is found in wood in two forms as liquid water in cell walls and as
liquid andor vapour in cell cavities In saturated conditions there is only liquid
water The basic reason for moisture entering into the mass of wood is the
attraction of water molecules by the hydroxyls of its chemical constituents
mainly cellulose A monomolecular layer of water shown in Figure 28 is
formed and held by these hydroxyls with strong hydrogen bonds The
formation of this layer results in pushing apart chains of cellulose molecules in
the amorphous regions and between the chrystalites of microfibrils so the
wood starts to swell Under the effect of secondary attractive forces more
water molecules enters and form a polymolecular layer
I Gradual formation of monomolecular layer by breaking the hydrogen bonding between adjacent cellulose molecules
Fig 28 Formation of monomolecular and polymolecular water layers on wood
surface
An additional part may enter by capillarity condensation in the cell wall voids
and pit features ( pit membrane small pit mouths)
31
2833 Desorption and adsorption
Loss of moisture is called desorption and gain adsorption Desorption begins
by evaporation from an exposed surface of wood If the walls are saturated
evaporation of water from the cavities need little more energy than that
required to evaporate water from the free surface (Tsumois 1991) Reduced
relative vapour pressure in the atmosphere (lower than unity) represents an
attractive force holding water in the walls and depending on its magnitude
causing less desorption To replace desorbed water other water moves from
the interior to the surface of the wood
Adsorption is the process by which dry wood exposed to an atmosphere
containing water vapour is adsorbed through its surface At the beginning a
monomolecular layer is formed then polymolecular and if the relative
pressure in the atmosphere is high (close to unity) capillary condensation
may take place Movement of moisture from the exterior to the interior of the
wood is attained by diffusion When dry wood is immersed in water there is
active movement of water through cell cavities Long immersion results in
near saturation of cavities
2834 Density
The density and specific gravity of wood are influenced by moisture content
structure extractives and chemical composition There are certain conditions
under which wood attains constant weight and volume and these are oven-
dry weight (weight at zero moisture content) oven-dry volume and fully
swollen volume
Density is determined by measuring mass (weight) and volume or by other
methods Dry (oven dry) mass is measured by placing the chosen specimen
of wood in an oven at 103degC until its weight becomes constant 12-48 hours
are needed for specimen about 100g in weight volume is determined by
measuring dimensions if the shape permits
32
284 Desorption process
An adsorbed species present on a surface at low temperatures may almost
remain indefinitey in that state As the temperature of the substrate is
increased there will be a point at which thermal energy of the adsorbed
species is such that one of the following may occur
o A molecular species may decompose to yield either gas phase products
or other species
An atomic adsorbate may react with the substrate to yield specific surface
compound or diffuse into the bulk of the underlying solid
The species may desorb from the surface and return into gas phase
The last of these options is the desorption process
285 Desorption Kinetics
The rate of desorption of an adsorbate from a surface can be expressed in the
general form
Rdes=kNx Eq 291
Where
X - Kinetic order of desorption
k - rate constant for the desorption process
N - surface concentration
The rate constant for the desorption process may be expressed in an
Arrhenius form
Kdes = A exp (-EadesRT) Eq 292
Where
-Eades is the activation Energy for desorption and A is the pre-exponential
factor
This gives the following general expression for the rate of desorption
Rdes = - dNdt = vNx exp(-EadesRT) Eq 293
R= Universal molar gas constant
T= absolute temperature
33
29 Characteristics of WoodWoods differ in colour porosity grain and figure Porosity is mainly a function
of dicotyledon woods These term refers to how the vessels are distributed
Grains refers to the alignment of the xylem cells Figure is determined by
many factors rays porosity grain and arrangement of rings The presence of
knots or burls may also be involved Density is the weight per unit size Wood
with higher density than water will sink in water
291 HardwoodsHard wood is derived from dicotyledonous angiosperms Most dicotyledonous
plants have vessels or short water conducting cells that conduct water through
openings in the ends of the cells Hardwoods have tracheids vessels fibres
ray tracheids and xylem parenchyma The cell walls are about 70 cellulose
and hemicellulose and about 20 - 35 lignin
292 Soft woodsSoftwood is derived from gymnosperms The xylem of gymnosperms is
composed mostly of tracheids Gymnosperms do not have vessels Resin
canals are common in gymnosperms Softwoods are simpler than hard
woods they tend to be uniform They have tracheids resin canals but no true
fibres or vessels
293 Chemical composition of Hardwood and softwood
Inorganic compounds
Inorganic materials in plants depend on the type of the plant and the soil
contamination in which the plant grows On average wood contains 05 ash
compounds The ash is typically composed of the following components-
CaO (plusmn50) K2O(plusmn20)Na2O MgO SiO Fe20 3 P2Os and SO3 (Baldwin
1987)
Organic materials
The inorganic compounds in wood are principally in the form of cellulose
hemicellulose lignin A small proportion are solvent soluble extractives
Cellulose
34
It is composed of D-glucopyranose units linked linearly with a b-(1-4) links It
is the main component of wood Principal component of cellulose is a polymer
of glucose (about 10000) glucose units per cellulose molecule
Hemicellulose
Acetyl-4-0-methylglucoronoxylan forms the main hemicellulose of hardwood
Glucomannan forms the main hemucellulose of softwoods Hardwoods also
have a greater proportion of methoxyl group than softwoods In addition
hemicellulose contain several molecules of water [C6(H20)5]n or [C5(H20)4]n
occurs in shorter chain of 150- 200 glucose units as compared to cellulose
Lignin
It has an approximate analysis of C10H11O2 for both softwood and hardwoods
(Shafizadeh1981) In addition to the same compounds as hemicellulose
hardwoods have syringl propane units and softwoods contain guaiacyl
propane units It is a phenolic compound (benzene with attached methyl
propyl and hydroxyl groups) tightly bound to the cellulose
In summary the average chemical composition of softwoods and hardwoods
is shown in the Table 23
Table 23 Average chemical composition of softwoods and hardwoods
(Irving 1977)
Chemical constituent Softwood Hardwood
Cellulose 42 plusmn2 45 plusmn2
Hemicellulose 27 plusmn 2 30 plusmn5
Lignin 28 plusmn 3 20 plusmn2
Extractives 3 plusmn 2 5 plusmn 3
35
CHAPTER 3 EXPERIMENTAL SETUP
MATERIALS AND METHODS
31 IntroductionTo assess the potential of sawdust in dye colour removal from water different
materials and equipment were used at different stages of experimentation
32 MaterialsThe consumable materials used in the research included
bull Hardwood and Softwood Sawdust from 4 different tree species namely-
Cypress and Pine for the softwoods Meru oak and Campor for the
Hardwoods The sawdust was obtained from Wood Makers Limited
located in Nairobirsquos Industrial area
bull Congo Red dye powder obtained from Industrial Chemical supplier located
in Nairobirsquos Industrial Area
bull 55mm Whatman Filter papers
bull Distilled water
33 Methods
331 Introduction
The performance of sawdust as an adsorbent was assessed on the basis of
removal of a direct disazo dye (Congo red) The dye is widely used in direct
dyeing of textile fabrics such as cotton paper dyeing and in staining biological
specimens in various microbiological techniques Batch experiments were
conducted in which dye samples with predetermined concentration were
placed in 350ml-plastic tumblers and then different masses of sawdust added
The mixture was thoroughly mixed by means of a continuous shaker On
reaching equilibrium the mixture was then separated by means of a filter
funnel using a pre-soaked filter paper The absorbance of the filtrate was then
obtained by means of a spectrophotometer at the wavelength of maximum
absorbance Final concentration was determined from a predetermined
equation of Congo red calibration showing the relationship between
absorbance and concentration
36
332 Sample Preparation
3321 Congo red dye
The dye that used in this research was obtained from Industrial Chemical
distributors located in Nairobirsquos Industrial area A stock solution of the dye
with a concentration of 1000mgl was prepared by dissolving 1 g of the dye in
1000cm3 of distilled water From this stock solution different concentrations
were prepared by diluting required volumes with tap water
3322 Sawdust
Sawdust used in this research was obtained from a local timber dealer Wood
Makers Limited located in Nairobirsquos Industrial area Different types of sawdust
species were obtained These included-cypress camphor Meru Oak and
African pine These tree species were chosen since they were the most used
hard and softwood in timber factories around Nairobi The sawdust was oven-
dried for 24 hrs The other main preparation carried out for the sawdust
involved sieving using different sieve sizes ranging from BS sieve No 14 to
No 100 This was meant to obtain different particle sizes for the determination
of the effect of particle sizes on the contact time and overall dye removal
Also included in this study was the determination of cellulose lignin and
Hemicellulose contents of the different sawdust species This was done using
the Van soest procedure In addition the specific gravities were determined
333 Experimental Procedure
3331 Specific gravity of wood
To obtain the specific gravity of wood samples of oven dry timber specimen
measuring 100 mm long were used The samples were weighed (M) and then
immersed in a cylinder of water (Vi) by pushing them below the water surface
with a piece of wire The new volume of water (V2) was taken quickly as
timber easily absorbs moisture Two samples of each species were tested for
each tree species and the average specific gravity obtained The specific
gravity was then obtained as follows
Gs= M(VrV)) Eq 31
The values obtained are recorded in Table 41
37
3332 Determination of Chemical composition of Sawdust
Wood can be analysed by breaking it down into structural components (called
Proximate Analysis) or into chemical elements (Ultimate Analysis) In carrying
out this research Van Soest procedure which is a form of proximate analysis
was used (Van Soest and Goering 1994)
a) Determination of Cellulose content (Neutral-Detergent Method)
The Neutral Detergent procedure for cell-wall was used to determine the
cellulose content in the different sawdust species
1 g of air-dried sample was weighed into a beaker of the refluxing apparatus
and 100ml cold neutral detergent solution followed by 2ml
decahydronaphthalene and 5g sodium sulphite were added in that order with
a calibrated scoop The mixture was heated to boiling in 5 to 10 minutes with
the heat being reduced at the onset of boiling to avoid foaming The boiling
was adjusted to an even level and reflux continued for 60 minutes timed from
onset of boiling
Tared Gooch crucibles were placed on filter manifold The beaker was swirled
to suspend the solids and content used to fill the crucibles The sample was
rinsed into crucible with minimum of hot (90-100degC) water Vacuum was
removed and mat broken up The crucible was then filled with hot water The
liquid was filtered and washing procedure repeated In a similar manner the
content was washed twice with acetone and sucked dry The crucibles were
dried at 100degC for 8 hrs and afterwards weighed This procedure was
repeated for four samples of the each sawdust type Which were averaged to
obtain overall NDF
Neutral Detergent Fibre (NDF) was determined using Equation 32-
NDF= Cell Wall Content(CWC) = Hemicellulose Lignin Cutin Cellulose
Silica and firbre bound nitrogen
(NDF) =[(wt of crucible + cell contents) - wt of crucible x 100 Eq-32
wt of sample
38
b) Determination of Hemicellulose content(Acid -Detergent Fibre)
The Acid-Detergent fibre procedure was used to determine the hemicellulose
content in the sawdust
1 g of air-dried sample consisting particles passing BS sieve 7 was weighed
into a beaker for refluxing andlOOml cold acid detergent solution and 2ml
decahydronaphthalene added The mixture was heated to boiling in 5 to 10
minutes with the heat being reduced at the onset of boiling to avoid foaming
The boiling was adjusted to an even level and reflux continued for 60minutes
timed from onset of boilingThe mixture was filtered on a previously tared
Gooch crucible set on the filter manifold using light suction The filtered mat
was broken up with a rod and washed twice with hot water (90-100degC) The
sides of the crucible were rinsed in a similar manner In addition the wash
was repeated with acetone until no colour was removed This procedure was
repeated for four samples of the each sawdust type which were averaged to
obtain overall ADF
The Acid Detergent Fibre (ADF) was thus determined using Equation 33
ADF==[(wt of crucible + fibre) - wt of crucible] x 100 Eq-33
wt of sample
c) Determination of Lignin content(Acid -Detergent Lignin)
In the acid -detergent lignin procedure the acid detergent fibre procedure
was used as a preparatory step The detergent removes protein the proteins
and other acid-soluble material that would interfere with lignin determination
The ADF residue consists of cellulose lignin cutin and acid-soluble ash
(mainly silica) To determine the lignin content in the sawdust acid-detergent
-fibre was prepared Asbestos of volume equal to the volume of the fibre was
added to the crucible containing the acid-detergent fibre The contents of the
crucible were covered with 72 H2S 04 at 15degC and stirred with a glass rod to
a mooth paste breaking all lumps The crucible was half-filled with acid and
stirred It was then refilled with 72 H2S 04 and stirred at hourly intervals as
the acid was draining away After 3 hrs the acid was filtered off with vacuum
and the content washed with hot water until it was acid-free The crucible was
dried at 100degC and weighed It was then ignited in a muffle furnace at 500degC
39
to 550degC for 3 hrs and then cooled off to 100degC and weighed This procedure
was repeated for four samples of the each sawdust type which were averaged
to obtain overall ADL
Acid Detergent Lignin( ADL) was then determined using Equation 34
ADL=[(wt of crucible + Lignin) - wt of crucible + ash] x 100 Eq-34
wt of sample
Figure 31 Schematic representation of Van Soest Procedures
3333 Effect of Shaking Velocity on removal
1 g sawdust of different particle sizes were added to plastic tumblers each
containing 100ml of 10mgl dye concentration The samples were allowed to
stand undisturbed for 30 minutes Each sample was then filtered using preshy
saturated 55mm Whatman filter paper The absorbance of the resulting aliquot
was measured using Ultra Spec II 4050 Spectrophotometer and the final
concentration obtained from equation 41 of Congo red Calibration curve
earlier prepared
The above procedure was repeated for samples of each particle size at
different rotation speed varied at an interval of 25 rpm upto 250 rpm at
which point the shaking speed was too high to causing losses of the sawdust
40
and the dye through spillage Removals were plotted against the speed of
revolution as shown in Table 43 and Fig 43
3334 Equilibrium time
Synthetic water samples (100 ml) of 10mgl concentration of Congo Red dye
were taken in separate set of containers and 1 g of sawdust was added The
sample containers were shaken on a continuous shaker at 150 rpm a speed
obtained in section 3433 above The experiments were carried out at a pH
of 89 for all particle size ranges (015 - 03mm to 06 - 118mm) at a
temperature of 22degCDuplicate samples were timed at an interval of 30
minutes This was carried out until the change in absorbance in the
subsequent samples was negligible At this point it was assumed that the
equilibrium had been achieved
Filtering through filter papers using a suction pump separated sawdust from
the containers and the filtrate was measured for residual absorbance The first
portion of the filtrate was discarded to eliminate the effects of any adsorption
on the filter paper To determine the extent of adsorption onto the filter paper
a series of runs were performed through filtering and discarding the first
portion the absorbance of all the results were identical to the unfiltered
sample
3335 Effect of pH on dye removal
For the investigation of the effect of pH a pH range of 5 to 12 was selected A
sample solution of 10 mgl was prepared 100 ml samples were adjusted to
the required pH using either 05 N NaOH to raise the pH or 05 N H2S 04 to
lower the pH 1 gram of sawdust (015 - 03mm) then added to the solutions
The samples were shaken at a speed of 150 rpm for 90 minutes (equilibrium
time for the particles) The samples were filtered and the concentration of
each determined
3336 Equilibrium Studies
Batch experiments were conducted for the development of adsorption
isotherms using the particle sizes of 015 -03 mm which showed best removal
and shorter equilibrium time (reported in the rate studies) Containers of
41
300ml capacities were used in all the experiments Duplicate 100ml samples
of 5 10 2030 40 50 and 60mgI concentration were taken in different
containers and 1 grams of each type of sawdust were added to it The sample
containers were shaken on the continuous shaker at 150 rpm After an
equilibrium time of 90 minutes the samples were withdrawn from the shaker
and the adsorbent from the sample containers was separated by filtration The
filtrate was then measured for the dye concentration Dosages of 10 20 30
5 and 6 grams of Sawdust were used A room temperature of 22degC and
constant pH of 89 were maintained in all the experiments
42
Chapter 4
40 Results and Discussion
41 Physical and Chemical properties of SawdustThe laboratory tests were carried out to establish the characteristics of the 4
different sawdusts The results shown in Table 41 below summarise
chemical and physical properties of the sawdusts studied The percentage
composition of cellulose was found to be within the range shown in Table 23
for softwood Hard woods had values higher than those in the table Other
lignin content was lower in the test samples both for softwood and hardwood
while hemicellulose content was within range Extractives were high in both
sawdust species tested
Table 41 Chemical and Physical properties of sawdust
Property composition for each Sawdust Species
Pine Cypress Camphor Meru Oak
Cellulose 4194 4157 5106 4973
Lignin 1697 1752 1886 1600
Hemicellulose 3137 3182 2028 283
Others 972 909 98 597
Pine Cypress Camphor Meru Oak
Specific
Gravity
0496 0472 051 0565
Figure 41 shows the major chemical components of the different sawdust
species used in the research Camphor and Meru oak were found to have
higher amount of cellulose than Cypress and Pine this is inherent of
hardwoods which have been reported elsewhere in literature by Irving (1977)
43
Fig 41 Chemical properties of Sawdust
Average chemical composititon of sawdust
Average cellulose
m Average Hemicellulose
Average Lignin
Average Others
Tree Species
On the other hand softwoods were found to have amount of hemicellulose
than hardwood while both species were found to have varying amount
extractives and other components Irving (1977) and Shafizadeh (1981) have
recorded similar values for both hard woods and softwoods Specific gravity
varied between 0473-0496 for the softwoods and 051 - 0565 for the
hardwoods
42 Variation of Absorbance with Dye Concentration
To obtain the final dye concentration after adsorption has taken place It is
necessary to have a calibration curveTable 42 shows absorbance values for
different dye concentration
Concentration MeanAbsorbance
0 01 00422 00665 016210 032220 060630 088540 120050 136360 1587
Table 42 Concentration Versus Absorbance
44
Fig 42 below shows the relationship between absorbance and concentration
of the Congo Red dye It was observed that in tap water a linear relationship
fitted to the data with correlation coefficient R2 value being 09938 This
indicated that absorbance varies linearly with concentration for a
concentration in the range of 1mgl to 60 mgl beyond this concentration up to
a concentration of 500mgl which was investigated a high degree of nonshy
linearity was observed this could have been as a result of increase in
concentration which diminished the distance between the dye molecule This
is believed to have caused the non-linear behaviuor of the curve (shown in
Appendix A2) This phenomenon thus restricted the concentrations used in
this research to 5mgl and 60mgl
Thus the equation of the treadline was adopted as the calibration curve to
obtain final concentration of the samples used in the experiment by
extrapolation
This took the form
Y=0278X Eq 41
Where X is the dye concentration
Vis the absorbance (OD-optical density)
Fig 42 Congo Red Calibration curve
45
Congo Red Calibration Curve
Concentration (mgl)
y = 00278X R2 = 09938
diams Absorbance
------Linear (Absorbance)
43 Variation of Absorbance w ith Wavelength
Wavelength of maximum absorption is an important parameter in any
spectrophotometric studies within both the visible and the ultra-violet ranges
For dyes it is the identification mark and acts as the fingerprint that
specifically identifies them
Figure 43 shows the relationship between the absorbance and wavelength for
Congo Red concentrations of 5 and10mgl Within the visible spectra (400nm
- 750nm) Congo red Dye was found to have a wavelength of maximum
absorption as 495nm This wavelength was used for all the measurements
made using the spectrophotometer This value is well in range with 497nm
obtained by Lillie (1990) and 488nm obtained by Bundavari (1990) Gurr
(1971) used a value of 487nm In addition Githere (MSc Thesis) used a value
of 500nm for Congo Red In light of this therefore wavelength of 495nm lies
well in range of the wavelengths used by other researcher dealing with Congo
red dye ie between (487 - 500nm) The slight variations could have arisen
as a result of solvent variations and different experimental conditions For the
same pH dye concentration only amplifies the absorption peak but does not
alter the wavelength of maximum absorption as shown by Figure 43
46
Table 43 Wavelength versus Absorbance
Wavelength (nm) Absorbance for
5mgl
Absorbance for
10m gl
400 0065 0117
410 007 0126
420 0078 0141
430 0088 016
440 0099 018
450 0111 0202
460 0123 0224
470 0136 0247
480 0149 0269
490 0159 0287
500 016 0289
510 0152 0275
520 0139 025
530 0118 0213
540 0094 0173
550 007 013
Variation of Absorbance with wavelength for Congo red dye
Figure 43 Variation of absorbance with wavelength
47
44 Effect of shaking on Dye removal
The effect of shaking velocity on removal was investigated It was observed
that removal increased steadily from 05mgg of dye at quiescent conditions of
0 rpm to a maximum of 091 mgg at 150 rpm for the composite sample
This was the the speed at which removals were best and beyond which point
a steady declined to 072 mgg at 250 rpm for all the particle sizes as shown
in Figure 43 below In this case therefore a speed of 150 rpm was adopted
for all the other investigations From other sources this speed had been used
by Alam etal (2000) in investigating the performance of low cost adsorbents
in the removal of herbicides from aquatic environment
E ffect of shaking v e lo c ity on dye rem oval
mdash 3 bull 425mm
mdashmdash 425 bull 525mm
mdash mdash 525 6mm mdash mdash A lisa e s
Figure 44 Effects of Shaking velocity on dye removal
45 Variation of Dye removal With Time (Equilibrium time)
Removal of dye with time was studied for different particle sizes This was to
determine equilibrium time and particle size with optimal dye removal
Results are shown in Table 45
48
Table 45 Removal Versus Time
Time Dye sorbed per gram of sawdust (mgg)
(min) 015-03mm 03 - 0425mm 0425 - 0525mm 0525 - 06mm 06-0118mm
0 0 0 0 0 0
30 078 078 072 069 0575
60 0833 078 079 073 069
90 084 082 0805 0745 069
120 084 079 083 078 072
150 088 083 083 08125 075
180 087 084 083 0825 077
210 0865 079 0845 07875 075
240 0865 083 0845 08125 075
270 088 0855 0855 0825 075
Fig 45 Variation of dye removal with time
The results shown in Fig 45 indicate that the amount of dye sorbed on
sawdust increased steadily with time up to a certain time for each particle
size range after which it remained almost constant Also noted from the
results was the fact that the rate of sorption was highest in the first 30 minutes
for each particle size with particles in the range of 015mm - 03mm sorbing
79 of the dye in the initial 30 minutes while particles in the range of 6mm -
118mm sorbed 58 of the dye from solution The other particle sizes ie 03
49
-0425mm 0425 - 0525mm and 0525 - 06mm sorbed 78 72 and 69
of dye respectively
Equilibrium was attained after different contact times for the various particle
sizes It was observed to vary from 90 minutes for smallest 015 - 03mm
particle sizes to 180 minutes for the biggest particle size 06 - 118mm These
variations can be associated to the ease with which dye molecules reach the
adsorption site for the small particles The particle being small in size present
shorter travel routes as compared to the longer torturous route found in the
larger particles In addition the available sorption area is higher for the small
particle Sizes and less for the bigger sizes hence the rate of sorption is higher
Similar observation was made by Gupta (1990) in the study of removal
chrome dye from wastewater Table 46 shows the equilibrium time for the
different particle sizes
Table 46 Mean particle size Versus Equilibrium time
Particle size range(mm) Equilibrium time (min)
015-03 90
03 - 0425 90
0425 - 0525 120
0525 - 06 150
0 6 -1 18 180
46 Effect of Particle size on dye removal
From the graph it was found that as the particle sizes of sawdust increase
there was a decrease in the amount of the dye adsorbed from 084mgg for
015mm - 03mm particles to 075mgg for 06 - 118mm particles for a dye
concentration of 1Cmgl This can be explained on the basis of the available
specific surface area for different panicie size which is higher for the small
particle sizes as compared to the bigger particles The same was observed by
Gupta et al (1990 ) with mixed fly ash and coal adsorbents in the removal of
chrome dye from aqueous solution where with the increase of adsorbent
50
particle size from 53 to 125 pm led to decrease in removal from 927 to
6584 for 10mgl dye concentration The observed trend for both the soft
woods and hardwoods was similar with soft wood particles removing more
dye per gram than Hard wood particles An explanation for this is that
softwoods are lighter and have more pores hence higher specific surface area
than hardwood In addition hardwoods were observed to impart some colour
into the dye solution
Effect of particle eye removal
- Dye removal at equilibrium
Fig 46 Above shows the effects of particle size on dye colour removal
47 Effect of Adsorbent concentration on removalDifferent masses of sawdust adsorbent were used to evaluate effect of
change of adsorbent concentration on dye removal Table 47 and Figure 47
show the results
Table 47 Adsorbent concentration Versus Dye removal
Mass of Sawdustis ]_________________
Mass of dye adsorbed by different Sawdusts (mgg)
Cypress(mgg) Pine(mgg) Camphor(mgg) Meru Oak(mgg)1 051 062 035 052082 0305 035 0225 0353 022 025 008 0254 0165 01875 0085 023755 015 015 0092 026 0128 0125 0076 0167 0118 0118 0025 0138 011 00975 003 01259 0096 00878 004 011110 0091 0075 0025 01
51
Effect of adsorbent concentration on dye removal
-Cypress(mgg)
- Pine(mgfg)Campbor(mgg)
Meru Oak(mgg)
Fig 47 Effects of Adsorbent concentration on dye removal
The effect of varying adsorbent concentration was studied using a dye
concentration of 10mgl It was observed that as adsorbent concentration
increased the amount of dye sorbed per gram decreased varying from 063
05 035 mg g for a ratio of 1 in 100 for pine cypress Meru oak and
camphor to 008 008 003 for a ratio 1 in 10 This shows that an increase in
adsorbent concentration increases the available surface area for sorption thus
the reduction of in the amount of dye sorbed per gram However increase
was not uniform as would be expected This shows that there are other factors
working against sorption process Increase of the sorbent concentration can
inhibit the movement of the dye molecules due to increased sorbent-sorbent
interaction resulting to particle aggregation This phenomenon was observed
with high ratios such as 110 to about 1125 the high masses also resulted in
air being trapped in the absorbent hence resulting into dead capacity
High masses were also found to increase the amount of colour imparted on
the samples and reduced amount of aliquot available at the end of each set of
experiment for measurement Therefore putting the above factors into
consideration masses of 1 2 3 4 5 and 6 g were used to develop both
variable and constant mass sorption isotherms at equilibrium conditions
52
48 Equilibrium StudiesAdsorption isotherms are determined under equilibrium conditions that is
when the rate of adsorption of molecules onto the surface of the adsorbent is
equal to the rate of adsorption of the molecules from the surface Two types of
isotherms can be generated in this way namely- Variable mass and constant
mass isotherms Both of these isotherms were used in this research These
isotherms are shown in Figures 48(a) - 48 (d) both variable and constant
mass isotherms were adopted Variable mass isotherms are considered
environmentally conservative since they yield lower values of adsorption
constants than constant mass isotherms Environmentally conservative
isotherms are thus used for prediction purposes
In the data analysis the equilibrium data was plotted on log - log scale and
fitted to a power function which takes the form of the empirical Freundlich
equilibrium model The model yields values of k (constant) and 1n (power of
function) where k gives sorption capacity of the adsorbent for the equilibrium
concentrations and n gives an idea about intensity of the capacity Since all
experiments were conducted under same experimental condition (pH 89
adsorbent size (015 -03 mm and temperature 23degC) the value of k is taken
as a measure of maximum adsorption capacity for comparison purposes
On considering variable mass isotherms it was observed that the value of k
for Cypressus lusitanica indicated that the amount of dye sorbed at
equilibrium by sawdust decreased with increase in dye concentration in the
liquid The value of n was also found to be greater than 1 which indicates
unlimited sorption for the dye The other sawdusts showed poor adherence to
Freundlich model at low concentrations (5-30mgl) however for higher
concentrations (40 -60mgl) it was observed that the k values were greater
than 1 for Meru oak (Vitex keniesis) and Pine (Pinus spp) giving rise to a
scenario of unlimited sorption capacity Camphor (Ocotea usambarebsis)
sawdust was observed to values of n less than 1 giving an indication of
saturation and low values of k
53
These isotherms had very low correlation coefficients indicating poor
adherence to the model proposed A number of reasons can be associated
with this behaviour but the mainly experimental artifacts such as the
variations of both concentration and the adsorbent masses (with the attendant
air trapping tendencies) could have contributed to these data skews For the
hardwoods colour impartation on the samples could have resulted to increase
of the competing species in the bulk solution and hence alter the
measurements of absorbance of the aliquot
Constant mass isotherms showed fitted well into the data with high correlation
values and hence good fit For Cypressus lusitanica R2 values range between
087 - 0987 with K value being 040 mgg and n value of 179 Pinus spp had
R2 values of 0 6 -0 94 and k value of 045 and n value of 118
Camphor (Ocotea usambarebsis) had R2 values of 06 - 099 k value of
0006 and n value of 069 Meru Oak (Vitex keniensis) on the other had R2
values in the range of 01 - 09 k value of 024 and n value of 0823
The above figures of k and n show distinctly that both softwoods have a high
intensity of sorption and they show a possibility of unlimited sorption capacity
It can also be deduced that the hardwoods have low sorption capacity as
evidenced by the low values of k The values of n indicate that these two
hardwoods have the possibility of experiencing dye saturation after sometime
For the hardwoods this can be attributed to limitation in the number of sites
on the adsorbent or from the fact that hardwood produce colour which could
give rise to a false situation of saturation The latter was also attributed to the
great variability of R2
The softwoods show a high sorption capacity than the hard wood due to the
high number of sites available This can be deduced from the low densities
which indicate more pores and hence a larger surface area for the softwood
than the hardwoods The values of n show the possibility of unlimited sorption
capacity This is a feasible explanation as shown by Tsoumis (1990) that
wood is able to adsorb moisture by way of formation of a mono molecular
54
layer and then eventually polymolecular layers which cause wood to expand
This same scenario can be said to be true for the softwoods
55
Qe
(mg
g)
Qe
(mg
g)
43 Adsorption isotherms
48 (a)Adsorption Isotherms for Cypressus lusitanica (Variable mass)
Freundlich Isotherm Co- 60mgl
y = 06216x0356 R2 = 0 8152
laquo Qe (mgg)------- Power (Qe (mgg))
Freundlich isotherm for Cypressus lusitanica (Co=50mgI)
Freundlich Isotherm Cypressus lusitanica (40mgl)
y - 06547xdeg 2498 R2 raquo 0 7486
laquo Qo (mgg)------- Power (Qo (mgrg))
1 10 100
Ce (mgl)
Freundlich Isotherm for Cypressus lusitanica (Co=30mgI)
y 04405XregR2 = 0 8397
diams Qe (mgg)------- Power (Qe (mgg))
01 1 10 100
Ce (mgl)
56
Oe
(mg
g)
Cypressus lusitanica (Constant mass)
Froundlich Isotherm for Cypressus lusitanica (2g)
y = 04291xOS733 R2 raquo 0955
laquo Qe (mgg)------- Power (Qe (mgg))
01 1 10 100
Ce (mgl)
Freundlich isotherm lor Cypressus lusitanica (3g)
y a 04443xos26 R2 = 09878
diams Qe (mgg)------- Power (Qe (mgg))
01Ce (mgl)
100
Qe
(mg
g)
Qe
(mg
g)
Freundlich isotherm (or Cypressus lusitanica (5g)
Ce (mgl)
y = 03909xdeg fC - 0 9793
diams Qe (mgg)------- Power (Qe (mgg))
Freundlich isotherm lor Cypressus lusitanica
y = 0 4558xdeg 7e6R = 09544
diams Qe (mgg)------- Powor (Qo (mgg))
01 1Ce (mgl)
10
Qe
(mg
g)
48 (b) Adsorption isoherms for Pinus spp (Variable mass)
Freundlich Isotherm lor Pinus spp(Co=60mgl)
y raquo 04176xdeg 941 R2 = 08114
laquo Qe (mgg)------- Power (Qe (mgg))
1 10 100
Ce (mgl)
F ieundlich Isotherm lor Pinus spp (Co= 50mgl)
y = 04126x0929 R2 = 05686 laquo Qe (mgg)
------- Power (Qe (mgg))
58
Oe
(mg
g)
Freundlich isotherm ior Pinus spp (Co=30mgI)
y = 0 6674xdeg3437 R2 laquo 0 0355
diams Qe (mgg)------- Power (Qe (mgg))
1 10
Ce (mgl)
Freundlich Isotherm lor Pinus spp (40mgl)
y = 02221xldquo 4 R2 = 0 5482
diams Qo (mgg)------- Power (Qe (mgg))
1Ce (mgl)
10
Qe
(mg
g)
Pinus spp (constant mass)
Adsorption isotherm lor Pinus spp (1g)
y = 10521xdeg 5506 R2 raquo 09296
diams Qe (mgg)
------- Power (Qe (mgg))
01 1 10 100
Ce (mgl)
Adsorption isotherm for Pinus spp(3g)
y = 0467xomo7 R2 = 09212
diams Qe (mgg)------- Power (Qe (mgg))
Qe
(mg
g)
Qe
(mg
g)Adsorption isotherm lor Pinus spp (2g)
y = 05194X0 ltgt7 R2 = 07894
laquo Oe (mgg)------- Power (Qe (mgg))
01 1 10
Ce (mgl)
Adsorption isotherm for Pinus spp (5g)
10
1
01
0011 10
Ce (mgl)
y = 0 0598x2 R2 = 09266
diams Qe (mgg)------- Power (Qe (mgg))
59
Qe
(mg
g)
Qe
(mg
g)45 (c) Adsorption Isotherms for Ocotea Usambarebsis(Variable mass)
Sorption Isotherm for Ocotea usambarebsis (Co=60mgI)
y = 3E-10x6 50R2 raquo 05871
diams Qe (mgg)------- Power (Qe (mgg))
1 10 100
Ce (mgl)
Sorption isotherm lor Ocotea usambarebsis (Co=50mgl)
y = 3E-09X5 7 76 R2 = 05285
diams Qe (mgg)------- Power (Qo (mgg))
Oe
(mg
g)
Qe
(mg
g)
Freundlich Isotherm lor Octea usambrensas (Co=40mgI)
Sorption Isotherm (or Octea (Jsambrensis (Co=30mgI)
y = 07439X0 4W7 RJ = 09398
laquo Qe (mgg)------- Powor (Qo (mgg))
60
Qe
(mg
g)
Qe
(mg
g)Ocotea usambarebsis (Constant mass)
Sorplion Isotherm for Ocotea Usambarebsis (1g)
10Ce (mgl)
y = 00184x3571 R2 = 0975
diams Qe (mgg)------- Power (Qe (mgg))
100
Sorplion isotherms for Ocotea usambarebsis (2g)
y = 00105xrsquo 375 R2 = 09954
laquo Qe (mgg)
------- Power (Qe (mgg))
Qe
(mg
g)
Oe
(mg
g)Sorption isotherm lor Ocotea usambrebsis (3g)
y = 0 0079x 2757 R2 - 07797
diams Qe (mgg)------- Power (Qe (mgg))
Sorption Isotherm tor Ocotea usambrebsis(5g)
y gt 000t4xR2 = 0 9735
diams Qe (mgg)------- Power (Oe (mgg))
61
Qe
(mg
g)
Qe
(mg
g)48 (d) Adsorption isotherms for Vitex Keniensis (Variablemass)
Sorption Isotherm for Vitex Kiniensis(Co=60mgl)
y raquo 04005xdeg1003 R2 = 09412
diams Qe (mgg)------- Power (Qe (mgg))
Sorption Isotherm lor Vitex kiniensis (Co=50mgI)
y = 03764X085reg6 R2 = 0803
diams Qe (mgg)------- Power (Qe (mgg))
1 10
Ce (mgl)
100
Qe
9mg
g)
Sorption isotherm lor Vitex kiniensis (Co=40mgI)
y = 09966X0 rdquoR2 = 0 0005
diams Qo (mgg)------- Power (Qe (mgg))
1 toCe (mgl)
Freundlich Isotherm lor Vitex kiniensis(Co=30mg1)y = 4 2t89x 1
R2 a 0 2457
laquo Qe (mgg)------Powor (Qo (mgg))
1Ce (mgl)
10
Qe
(mg
g)
Vitex keniensis (Constant mass)
Sorption isotherm tor Vitex Kiniensis (1 g)
y = 0 8248xdeglsquo 7 R2 = 09117
diams Qe (mgg)------- Power (Q e (mgg))
Ce (mgl)
Sorption isotherm lo r Vitex kiniensis (2g)
y = 02511xrsquo 2403 R2 = 08664
diams Qe (mgg)------- Power (Qe (mgg))
1Ce (mgl)
10
Qe
(mg
g)Sorption isotherm for Vitex Kiniensis (3g)
y = 0 0566x bull10R2 = 0 7524
laquo Oe (mgg)------- Power (Qe (mgg))
Sorption isotherm for Vitex Kiniensis(5g)
y = 01326xOM7 R2 = 0285
diams Qe (mgg)
------- Power (Qe (mgg))
63
49 Relationship between sawdust properties and Sorption dataThe softwoods were found to be less dense than the hardwoods which implies
the possibility more pore spaces and higher specific surface area for sorption
process The latter were found to impart coloured species on the samples
thus interfering with absorbance measurement and yielded low values of k
and n Sorption capacity was found to increase with hemicellulose content
which was high in cypress pine Meru oak and Camphor in that order
Cellulose was found to have a negative correlation with sorption capacity No
definite relationship could be deduced between lignin content and sorption
410 Effect of initial dye concentration on percentage removal
Considering Figures 49(a) - 49(d) it was observed that on varying the initial
dye concentration from 5 mgl to 60 mgl for different masses of the 4 different
sawdusts the percentage dye sorbed per gram remained fairly constant for all
the concentrations giving rise to graphs near parallel to the abscissa This
indicates that for the dye concentrations considered the mechanism of
sorption remain the same and an increase in the initial dye concentration only
alters the magnitude adsorbed per gram of sawdust for all tree species tested
Effect of intial concentration on Dye removal for Pinus spp
-ig-23-33-4g
-5g-6g
49 (a) Pinus spp sawdust
64
Effect of initial concentration on Dye removal fo r Vitex Keniesis
initial concentration (mgfl)
-m-2g- - 3 g
49(b) Vitex keniensis sawdust
mdash gmdashmdash2g
49(c) Ocotea Usambarebsis
Effect of initial concentration on dye removal for Cypressus luatanica
E3ogtk_0)CL
8gtoE0)x_
ltDgtNQ
100
7D
c n
mdash
on i -
on ------ ------- --------A
10 -
0 -
mdash x atmdash
0 10 2 0 3 0 4 0 5 0 6 0 7 0 8 0
- diams - ig
-plusmn-3g
mdash 5g
--6g
Initial tye ccrcer ration Gu (rrryl)
49(d) Cypressus lusitanica sawdust
65
S pound
pound pound
Ma
ss o
f d
ye a
dso
rbe
d p
er
gra
m
(mg
g)
411 Effect of pH Variation on dye removalFigure 411 shows the effect of pH change on dye removal from synthetic
wastewater
Effect o f Variation of intial pH on C^e removal
mdashdiamsmdash Cypress
--CanphoRne
fvferuCe
Fig 410 Effect of pH change on Sorption
In tap water Congo Red dye ionizes to a pH of 89 It was observed that when
the initial pH of the dye solution was varied from 89 to 12 by addition of
Sodium hydroxide dye removal declined steadily to zero at pH 10 for both
Camphor and Cypress Sawdust and pH 11 for Meru Oak and Pine Sawdust
respectively This can be explained from the point of view that an increase in -
OH ions from the base competed favourably with the dye ions for the available
sites thus reducing the amount of dye adsorbed by the sawdust Another
factor which may have contributed to a decline in the amount of the dye
sorbed is the polar nature of the adsorbent surface This could preferably sorb
the -OH ions in preference to the dye ions Beyond this point of zero removal
it was observed that the colour of the dye increased abruptly to absorbance
value exceeding that of the initial concentration of 10 mgl dye solution Thus
as shown in Figure 410 dye removal in this case takes negative vaiues This
could possibly have resulted from side reactions favoured by the high pH
On lowering the pH using 05N H2S04 the amount of dye sorbed remained
fairly constant with only slight increase at pH 8 and thereafter remained
66
constant for all the species tested A similar phenomenon was observed by
Gupta (1991) where an increase in the pH resulted in a decrease of the
amount of chrome dye adsorbed on a mixture of fly ash and coal
67
Chapter 5
Conclusions and Recommendations
51 ConclusionsFrom the research findings it may be concluded that-
gt The tested softwoodsrsquo sawdust have potential of removing direct dyes from
water as indicated by the high value of k (a constant obtained from the
Freundlich equilibrium model) yielded sorption capacity of the adsorbent
ranging from 033- 04
gt Hardwoods were found to have low potential of colour removal with low k
values ranging from 00069 - 023 They also had a problem of colour
impartation
gt Initial pH of effluent stream affects the amount of direct dye removed from
he waste High pH was found to reduce the amount of dye adsorbed and
promoted side reactions with increase the absorbance of the water
52 Recommendations
gt Further investigations should be carried to investigate the effects of
different methods of adsorbent preparation such as washing and air drying
on dye removal using sawdust from the various tree species
gt Investigations should also be carried out on an actual dye waste stream
containing different dyes and other dyeing chemicals
gt Further research should be carried out on the possibility of regeneration
and proper disposal of the adsorbent
68
bull Disodium ethylenediaminetetra-acetate (EDTA dihydrate crystal reagent
grade)
bull Sodium borate decahydrate reagent grade
bull Disodium hydrogen phosphateanhydrous reagent grade
bull 2-ethoxyethanol purified grade
bull Decahydronaphthalene reagent grade
bull Acetone
bull Sodium Sulfite anhydrous reagent grade
bull Sulphuric acid(reagent grade)
bull Cetyl trimethylammonium bromide technical grade
bull n-Hexane technical grade
bull Asbestos
bull Saturated potasium permanganate
bull Lignin buffer solution
bull Ferric nitrate nonhydrate
bull Silver nitrate
bull Acetic Acid glacial
bull Potassium acetate
bull Tertiary butyl alcohol
bull Combined permanganate solution
bull Oxalic acid dihydrate
bull 955 ethanol
bull Concentrated (12 N hydrochloric acid)
bull Hydro bromic acid reagent grade
Equipment
gt Ultra-spec II 4050 spectrophotometer
gt XL- 3100D Electronic balance
gt Measuring cylinders of different sizes
gt 1000 Ml Volumetric flasks
gt Model C-33 Continuous shaker
gt 100ml beakers
Appendix A1 Reagents and Equipment
69
gt 350ml plastic tumblers
gt Millipore 3500 filter
gt BS Sieves No7 to No 100
gt 50ml density bottle
gt A vacuum Dissector
gt A drying oven
gt Glass rod
gt Vacuum Pump
gt Refluxing apparatus-
Beakers Berzelius without spout 600ml capacity
Crucibles Gooch type high-form Pyrex fritted glass 50 ml capacity course
porosity Type sold by scientific Silver springMd Cat No8-237
Scimatco rubber tubing black thick-wall 516 in-(80mmm) bore 322-
(35mm) wall
Hot plate Thermolyne 9HP-A8805B) blue porcelain steel-flattop 120v 33-a
400-w 3 -in-(95-cm) diameter
Multi electric receptacle box 20-a 115-v
Condensers reflux crude-fiber Pyrex EH Sargent and Company
Philadelphia Pa Cat NoS-22742
Flexa frame hook connectors
Rings cast-iron
Flexa frame rods
gt Filter manifold
Polyethylene pipe
Funnels
Flasks
Clamps
Rubber Adopter
Rubber tubing
Glass tubing
Polyethylene tubing
Screw Clamp
gt Water heater
70
Appendix A2 Chemical composition of SawdustPine Cypress C am phor M eru O ak
Sam ple 1 Sam ple 2 Sam ple 1 Sam ple 2 Sam ple 1 Sam ple 2 S a m p le l S am ple 2
C ruc ib leNumber
293 963 927 877 237 253 480 31
C ruc ib le w t (g) 314105 307969 316161 301758 318517 307956 295801 308274S am ple W e ig h t (g)
1 1 1 1 1 1 1 1
D ry m a tte r 9459 9459 9477 9477 9475 9475 9511 9511C ruc ib le +N D F R esidue 322857 31682 324934 310732 310423 316055 304961 317199
N D F R esidue 08752 08851 08773 08974 08094 08099 0916 0 8925
C ruc ib le + A DF
321379 315087 323456 308889 317702 314268 303386 31573
C e lluose 42700372
4117637763 4352542589 3961162466 15410868 51055284 49061675 50399296
H em ice llu lose
1562533 183211756 1559565263 1944708241 -7695317 18860158 16559773 15445274
C ruc ib le +AD L 317125 310975 319057 304776 313057 309767 29856 310902C ruc ib le + Ash
314145 30802 31613 301672 311288 307845 295861 308218
L ign in 31504387
312400888 3088530126 327529809 18701766 2028496 28377668 28 219956
A verage ce llu lose
4193837502
4156852527 5105528366
4973048544
A verage H em ice llu lose 1697325299
1752136752 1886015831
1600252339
A verage L ign in
31 37223808
3181914108 2028496042
282988119
A verage O thers
9 716133911
9090966128 9799597608
5968179262
71
Appendix A3 Variation of Absorbance with concentration
Congo red dye rating curve
-Absorbance
Appendix A4 Specific Gravity of Sawdust (Gs)Tree Species Sample M ass (g) In itia l Volm (cm J) Final Volm (cm J) D ensity (g c m J)
P ine 1 54 700 810 0490909091
2 557 700 800 0557
3 551 700 820 0459166667
4 609 700 810 0553636364
Cypress 1 476 700 800 0476
2 482 700 810 0 438181818
3 504 700 800 0504
4 472 700 800 0472C am phor 1 528 700 8001 0528
2 458 700 800 0458
3 495 700 800 04954 557 700 800 0557
M eru O ak 1 397 700 770 0567142857
2 4069 700 770 0581285714
3 411 700 770 0587142857
4 419 700 780 052375
Appendix A5 Variable mass Isotherm data Cypressus lusitanicaCo = 60mglM ass (g) F inai Absoibance Ce(mgI) Ge (mgg)
1 113 0021 1109 3989209 2010791
2 0516 0032 0484 1741007 2129496
3 0382 0044 0338 1215827 1594724
4 0281 0052 0229 823741 1294065
5 0271 0064 0207 7446043 1051079
l_________6 0171 0084 0 087 3129496 0947842
72
Co=50 mglM ass (g) F ina l Absorbance Ce(mgI) Qe (m gg)
1 0937 0021 0 916 3294964 1705036
2 0369 0032 0 337 121223 1893885
3 0315 0044 0271 9748201 1341727
4 023 0052 0 178 6402878 1089928
5 0162 0064 0 098 352518 0929496
6 014 0084 0 056 2014388 079976
C o=40 m gl
C o=30 mgl
M ass (g) F ina l Absorbance Ce(mgI) Qe (m gg )
1 0333 0021 0312 1122302 1877698
2 0141 0032 0109 3920863 1303957
3 0138 0044 0094 3381295 088729
4 0136 0052 0084 3021583 067446
5 0127 0064 0 063 2266187 0554676
6 0109 0084 0025 0899281 0485012
C o=20 mgl
C o=10 m gl
M ass (g) F inal Absorbance Ce(mgI) Qe (m gg)
1 0108 0021 0087 3129496 0 68705
2 0062 0032 003 1079137 0446043
3 0063 0044 0019 0683453 0310552
4l 0073 0052 0021 0755396 0231115
5 0074 0064 001 0359712 0192806
6 009 0084 0006 0215827 016307
73
Co=5 mglM ass (g) Final Absorbance Ce(mgI) Qe (m gg )
1 0049 0021 0 028 1007194 0399281
2 0042 0032 001 0359712 0 232014
3 0048 0044 0004 0143885 0161871
4 0065 0052 0013 0467626 0 113309
5 0066 0064 0002 0071942 0098561
6 0088 0084 0 004 0143885 0 080935
Vitex KeniensisC o=60 mgl_________
M ass (g) F ina l Absorbance Ce(mgI) Qe (m gg )
1 0567 0068 0499 1794964 4 205036
2 0327 0105 0222 7985612 2 600719
3 0288 0126 0162 5827338 18057554 03 0139 0161 5791367 1355216
5 035 0244 0106 381295 1123741
6 032 0247 0073 2625899 0956235
C o=50 mgl
M ass (g) F inal Absorbance Ce(mgI) Qe (m gg )1 0425 0068 0357 1284173 3 7158272 0263 0105 0158 5683453 2 215827
3 0287 0126 0161 5791367 14736214 0269 0139 013 4676259 1133094
5 0303 0244 0059 2122302 0 9575546 0339 0247 0092 3309353 0 778177
C o=40 mglM ass (g) F inal Absorbance Ce(mgI) Qe (m gg)
1 0331 0068 0263 9460432 3 0539572 0227 0105 0122 4388489 17805763 0318 0126 0192 6906475 11031184 0365 0139 0226 8129496 0 7967635 0393 0244 0149 5359712 06928066 0481 0247 0234 8417266 0 526379
Co=30 mglM ass (g) F inal Absorbance Ce(mgI) Qe (m gg)
1 0209 0068 0141 5071942 24928062 0197 0105 0092 3309353 1334532
3 0236 0 126 0 11 3956835 0 8681064 0249 0139 011 3956835 0 651079
5 038 0244 0136 4892086 0 5021586 0486 0247 0239 8597122 0 356715
74
Co=20 mgl
C o=10 m gl
C o = 5 mgl
Octea usambarebsis
Co=60 m glM ass (g) F inal Absorbance Ce(mgI) Qe (m gg)
1 103 0022 1008 3625899 2374101
2 1051 0034 1017 3658273 1170863
3 1025 0056 0969 3485612 08381294 097 0063 0907 326259 0684353
5 0919 0078 0841 302518 0594964
6 0993 0083 091 3273381 0454436
C o=50 m gl
Mass (g) F ina l Absorbance Ce(mgI) Qe (m gg)
1 089 0022 0868 3122302 1877698
2 0845 0034 0811 2917266 1041367
3 0925 0056 0869 3125899 0 62474 0829 0063 0766 2755396 0561151
5l 0807 0078 0729 2622302 047554
6 0837 0083 0754 271223 0381295
75
Co=40 mglM ass (g) F ina l Absorbance C em gI) Qe (m g g )
1 0751 0022 0729 2622302 1377698
2 069 0034 0656 2359712 0820144
3 0698 0056 0642 2309353 0563549
4 07 0063 0637 2291367 0427158
5 0649 0078 0571 2053957 0389209
6 0701 0083 0618 2223022 0296163
C o=30 mgl
Co=20 mq1M ass (g) F ina l Absorbance Ce(mgI) Qe (m gg )
1 0357 0022 0335 1205036 0794964
2 0398 0034 0364 1309353 0345324
3 0394 0056 0338 1215827 0261391
4 0403 0063 034 1223022 0194245
5 0397 0078 0319 1147482 0170504
6 0458 0083 0375 1348921 0108513
Co=10 mgl
M ass (g) F ina l Absorbance Ce(mgI) Qe (m gg )
1 023 0022 0208 7482014 0251799
2 0231 0034 0197 7086331 0145683
3 0302 0056 0246 8848921 0038369
4 0302 0063 0239 8597122 0035072
5 0295 0078 0217 7805755 0043885
6 0336 0083 0253 9100719 0014988
Co=5m gl
M ass (g) F ina l Absorbance Ce(mgI) Qe (m gg )
1 0131 0022 0109 3920863 0107914
2 0139 0034 0105 3776978 0061151
3 0146 0056 009 323741 0 058753
4 0193 0063 013 4676259 0008094
5 0192 0078 0114 4100719 0017986
6 021 0083 0127 4568345 0007194
76
Pinus sppCo=60 mg1
|M ass (g) F ina l Absorbance Ce(mgI) Qe (m gg )
1 0419 0021 0 398 14316547 45683453
2 0176 0032 0 144 51798561 27410072
3 0154 0044 011 39568345 18681055
4 0144 0052 0 092 33093525 14172662
5 016 0064 0 096 34532374 11309353
I 6 018 0084 0 096 34532374 0 942446
C o= 50 m glM ass (g) F ina l Absorbance Ce(m gI) Qe (m gg )
1 0309 0021 0 288 10359712 39640288
2 0163 0032 0131 47122302 22643885
3 0127 0044 0 083 29856115 156714634 012 0052 0 068 24460432 11888489
5 0165 0064 0101 36330935 09273381
6 0193 0084 0 109 39208633 07679856
C o=40 mg1
M ass (g) F ina l Absorbance Ce(mgI) Qe (m gg)
1 0208 0021 0 187 67266187 33273381
2 0118 0032 0 086 30935252 18453237
3 0119 0044 0075 26978417 124340534 0136 0052 0 084 30215827 09244604
5 0145 0064 0081 29136691 07417266
6 0174 0084 009 32374101 06127098
C o= 30 mg1
C o=20 mg1
77
Co=10 mgljM ass (g) F ina l Absorbance Ce(mgI) Qe (m gg)
1 0 045 0034 0011 03956835 09604317
2 0052 0052 0 052 18705036 04064748
3 0061 0082 0061 21942446 02601918
4 0 0777 0106 0 0777 2794964 01801259
5 0107 0132 0 1 0 7 38489209 01230216
6 0142 0155 0 142 51079137 00815348
C o=5 m glM ass (g) F ina l Absorbance Ce(mgI) Qe (m gg)
1 0 039 0034 0 005 01798561 04820144
2 0065 0052 0 0 1 3 04676259 02266187
3 0089 0082 0 007 02517986 01582734
4 0116 0106 001 03597122 01160072
5 0161 0132 0 029 10431655 00791367
________ 6 0202 0155 0 0 4 7 16906475 00551559
Constant mass isotherm data
Cypressus lusitanicaConstant M ass o f 1g
Initial C oncen tra tion (mgl) Ce (m gl) Qe (mgg)
5 1007194 0399281
10 3129496 068705
20 1122302 1877698
30 1568345 0431655
40 2766187 1233813
50 3294964 1705036
60 3989209 2010791
Constant M ass o f 2gInitial C oncen tra tion (mgl) Ce (m gl) Q e (mgg)
5 0 359712 0232014
10 1079137 0446043
20 3920863 1303957
30 442446 0778777
40 9856115 1507194
50 121223 1893885
60 1741007 2129496
Constant m ass o f 3gInitial C oncen tra tion (mgl) Ce (m gl) Qe (mgg)
5 0 143885 0161871
10 0 683453 0310552
20 147482 0617506
30 3 381295 088729
40 6 18705 1127098
50 121223 1893885
60 1215827 1594724
78
Constant mass of 5gInitial Concentration (mg1) Ce (m gl) Qe (m gg )
5 0071942 009856110 0359712 0 19280620 0 971223 0 380576
30 2 266187 0 55467640 2 589928 0748201
50 352518 0 92949660 7 446043 1051079
Constant m ass of 6g
Initial C oncentration (m gl) Ce (m gl) Qe (m gg )
5 0143885 0 080935
10 0 215827 0 1630720 0827338 0 319544
30 0899231 048501240 1151079 064748250 2 014388 0 79976
60 3 129496 0947842
Pinus spp
Constant m ass of 1 gInitial Concentration (m gl) Ce(mgI) Qe (m gg)
5 0179856 0482014
10 0395683 096043220 2302158 176978430 4100719 258992840 6726619 332733850 1035971 396402960 1431655 4568345
Constant m ass o f 2gInitial Concentration (m gl) Ce(m gI) Qe (m gg)
5 0 467626 022661910 1151079 0942446
20 1870504 040647530 1978417 140107940 3093525 1845324
50 471223 2264388
60 5179856 2741007
Constant mass of 3gInitial C oncentration (m gl) Ce(m gI) Qe (m gg)
5 0251799 0 158273
10 1726619 0942446
20 1834532 0605516
30 2194245 0260192
40 2697842 1243405
50 2985612 1567146
60 3956835 1868106
79
Constant mass of 4gInitial C oncentra tion (mgl) Ce(mgI) Qe (mgg)
5 0359712 0116007
10 1690647 0457734
20 1798561 070503630 2446043 118884940 2794964 018012650 3021583 09244660 3309353 1417266
Constant m ass of 5gInitial C oncentra tion (mgl) Ce(mgI) Qe (mgg)
5 1043165 007913710 2194245 035611520 2913669 074172730 2985612 054028840 3453237 113093550 3633094 092733860 3848921 0123022
Constant m ass of 6gInitial C oncentra tion (mgl) Ce(mgI) Qe (mgg)
5 3453237 094244610 3920863 076798620 323741 06127130 3201439 044664340 2302158 029496450 5107914 008153560 1690647 0055156
Vitex keniensis
Constant m ass of 1gInitial C oncentra tion (m gl) Ce(m gI) Qe (mgg)
5 0611511 043884910 1906475 180935320 287 171330 5071942 249280640 9460432 305395750 1284173 371582760 1794964 4205036
80
Constant mass of 2gInitial C oncentra tion (mgl) Ce(m gI) Qe (m gg)
5 1151079 019244610 1834532 090827320 309 08455
30 3309353 1334532
40 4388489 178057650 5683453 221582760 7985612 2600719
Constant m ass of 3gInitial C oncentra tion (mgl) Ce(m gI) Qe (m gg)
5 2 014388 00995210 2482014 058393320 359 054730 3956835 086810640 5791367 147362150 5827338 180575560 6906475 1103118
Constant m ass of 4g
Initial C oncentra tion (mgl) Ce(m gI) Qe (m gg)5 3 489209 00377710 372 040720 3956835 065107930 4352518 039118740 4676259 113309450 5791367 135521660 8129496 0796763
Constant m ass of 5gInitial C oncentra tion (mgl) Ce(m gI) Qe (m gg)
5 1618705 005762610 1978417 036043220 2122302 095755430 3 81295 112374140 388 0322450 4892086 050215860 5359712 0692806
Constant m ass of 6gInitial C oncentra tion (mgl) C e(m gI) Qe (m gg)
5 2158273 004736210 2625899 095623520 3201439 027997630 3309353 077817740 392 026850 8417266 0526379
60 8597122 0356715
81
Ocotea usambarebsis
Constant m ass of 1 g
Initial C oncentra tion (m gl) Ce(mgI) Qe (mgg)5 3625899 237410110 3122302 1877698
20 2622302 137769840 1205036 079496450 7482014 025179960 3920863 0107914
Constant m ass of 2gInitial C oncentra tion (m gl) Ce(mgI) Qe (mgg)
5 3776978 006115110 7086331 0145683
20 1309353 0345324
40 2359712 0820144
50 2917266 104136760 3658273 1170863
Constant m ass of 3gInitial C oncentra tion (m gl) Ce(mgI) Qe (mgg)
5 323741 005875310 8848921 003836920 1215827 026139140 2309353 056354950 3125899 0624760 3485612 0838129
Constant m ass of 4gInitial C oncentra tion (m gl) Ce(mgI) Qe (mgg)
5 4676259 000809410 8597122 003507220 1223022 019424540 2291367 042715850 2755396 056115160 326259 0684353
Constant m ass of 5gInitial C oncentra tion (m gl) Ce(mgI) Qe (mgg)
5 4100719 001798610 7805755 0043885
20 1147482 0170504
40 2053957 038920950 2622302 047554
60 302518 0594964
82
Constant mass of 6gIn itia l C oncen tra tion (m gl) C e(m gI) Q e (m gg)
5 4 568345 000719410 9 100719 001498820 1205036 079496440 22 23022 029616350 271223 038129560 3273381 0454436
Appendix A6 pH versus amount of dye sorbedVariation of dye removal with pH
pH Finalabsorbance
Mass of dye removed (mgg)
Cypress Camphor Pine MeruOak
pH Cypress Camphor Pine Meru Oak
5 0062 0177 007 0066 5 07769784 02841727 06978417 076258996 0063 0199 0084 0074 6 07733813 02338129 07482014 073381297 0064 0213 009 0087 7 07697842 03633094 06978417 068705048 0069 0242 014 0136 8 07517986 01294964 04964029 051079149 0212 0252 0148 0101 9 02374101 00935252 04676259 06366906
10 0277 0269 0238 0213 10 00035971 00323741 01438849 0233812911 045 0478 0246 028 11 -0618705 -0719424 01151079 -000719412 0845 1162 0523 0561 12 -2039568 -3179856 -0881295 -1017986
83
Appendix A7 Mean Particle size Versus dye removal at equilibriumEffect of particle Size on Dye removalMean pa rtic le size(mm) Dye rem oval at equlibrium (m gg)
0 225 0840 3625 0820 475 0805
0 5625 0780 89 075
Appendix A8 Number of revolutions per minute versus Dye removalE ffe c t o f S h a k in g v e lo c ity on Dye rem ova lSpeed
rpmF in a l A b so rb a n ce3 - 425mm 425 - 525m m 525 - 6mm All sizes
0 0187 0172 0 173 015325 0119 0132 0 147 014750 0116 012 0 116 014675 0112 0115 0 118 0121
100 01 011 0 102 0114125 0091 0105 0 097 0072150 0042 0047 0 049 0024175 0046 005 0041 0036200 0061 0057 0 047 0072225 0072 0063 0 05 0072250 0075 006 0 066 007
Speedrp m
M ass o f Dye a d so rb e d p e r g ram o f S a w d u s t (m g g )
3 - 425mm 425 - 525m m 525 - 6mm All sizes0 0314 0383 0371 045
25 0561 0524 0 477 047750 0593 0574 0 593 04775 06 0589 0 575 057
100 0642 061 062 063125 066 0625 0 65 0746150 085 0825 0 825 0912175 08375 082 08375 0875200 0786 08 0 825 0746225 0746 0782 082 0746250 0738 07875 0 78 075
84
Appendix A9 Freundlich constantsValues of K Values of n
M ass (g) C am phor Meru Oak C ypress Pine C am phor Meru O ak C ypress Pine
1 0 0184 08248 04127 05396 0736 1634 274 1246572
2 00105 02511 04291 05194 0742 0806 1-744 102
3 00079 00566 04443 04359 07838 0552 184 1199
4 0003 00117 03083 0302 0435 04186 1378 1128
5 00014 01326 03909 00998 0552 09472 182 07156
6 00004 01504 04558 01028 0466 05803 127 1008
A verage 0006933 02378667 040685 033325 0 619133 0823017 1798667 1052862
Appendix A10 Initial concentration versus dye removal for Pinus spp Vitex kiniensis Octea usambrensis and Cypressus lusitanica
P inus sppC o (mg1) dye rem oval d ifferent m asses
ig 2g 3g 4g 5g eg5 96402878 45323741 31654676 23201439 15827338 11031175
10 96043165 40647482 26019185 1801259 12302158 81534772
20 95197842 48983813 3289968 24774843 19876978 16598721
30 86330935 46702638 31414868 23501199 18009592 1488809
40 9352518 48248651 32547962 24559353 19729856 16480566
50 92517986 48070054 32465388 24508813 19684322 16446926
60 92290168 47997081 32431517 244894 19671928 16438237
V itex ken iens isC o (m gl) dye rem oval d ifferent m asses
ig 2g 3g 4g 5g eg5 8776978 3848921 1990408 7553957 1352518 9472422
10 8093525 4082734 2505995 1411871 1604317 1133094
20 8565 42275 1252998 2035 1612 134
30 8309353 4448441 1823333 2170264 1673861 118904940 7634892 4451439 2757794 1991906 1732014 131594750 7431655 4431655 2947242 2266187 1915108 155635560 7008393 4334532 3009592 2258693 1872902 1593725
O co tea usam barebsisC o (m gl) dye rem oval d ifferent m asses
ig 2g 3g 4g 5g eg5 2158273 1223022 117506 1618705 3597122 0719424
10 2517986 1456835 383693 3507194 4388489 149880120 397482 1726619 1306954 1243165 852518 5425659
30 352518 3015588 24 94005 1582734 1956835 164868140 3444245 205C36 1408873 1067896 9730216 740407750 3755396 2082734 12494 1122302 9510791 7625899
60 3956835 1951439 1396882 1140588 9916067 7573941
85
Cvpressus lusitanicaCo (mg1) dye removal fo r d iffe ren t masses
19 2g 3g 4g 5g 6g10 685 447 3103333 23125 193 1646667
20 6345 42125 2948333 2195 18 1640833
30 626 43465 2953333 224825 1854 1618
40 60 3765 282 22675 1872 1619833
50 6424 3775 2686 2178 18576 16
60 62 354 2653333 215375 1752 1580833
86
Bibliography1 Alam JB Dikshit AK and M Bandyopadhyay (2000) Efficacy of
adsorbents for removal 24-D and Atrazine removal from Water
Environment Global Nest the Inti Journal Vol 2 No 2 pp 139-148
2 APHA (American Public Health Association)(1992) Standard Methods
for examination of water and Wastewater 18th Edition APHA Washington
DC
3 Anliker R Clarke EA and MoserP (1981) Use of the partition
coefficient as an indicator of bioaccumulation tendency of dyestuffs in fish
Chemosphere Vol 10 pp263 - 274
4 Arvola L (1986) Spring phytoplankton of 54 small lakes in Southern
Finland Hydrobilogia Vol 137pp125- 134
5 AtlasG and TT Bannister (1980) Deoedence on mean spectral
extinction coefficient of phytoplankton depth water colour and species
Limnol Oceanography Vol 25 pp 157-159
6 BaldwinS (1987) Biomass stoves Engineering Design Development
and Dissemination Volunteers in Technical assistance Arlington Virginia
7 BaughmannG and Perenich TA (1988) Fate of Dyes in agueous
systems Solubility and partition of hydrophobic dyes and related
compounds EnvironToxic Chemical Vol 7 pp 188-199
8 Bennett LE and M Drikas (1993) The evaluation of colour in natural
waters Water Res Volume 27pp1209-1208
9 Boegerding AJ and RA Hites (1994) Identification and measurement
of food and cosmetic dves in a municipal wastewater treatment plant
Environment Science Technology Vol 28pp1278-1284
10 Canadian Council of Ministers of Environment (2001) Canadian water
quality guidelines for the protection of aquatic life Colour Winnipeg
11 Chiou CT LJ Peters and VH Freed (1979) A physical concept of
soii-water equilibria for nonionic organic compounds Science Vol206 pp
831-832
12 Chiou CT PE Porter and DW Schmeddling (1983) Partition
equilibria of nonionic organic compounds between soil organic matter and
water Environmental Science and Technology
87
13 Clarke EA and Anliker R (1980) Organic Dyes and pigments in The
Handbook of Environmental Chemistry Vol 3 Part A Anthropogenic
Compounds Hutzinger O (Ed) Springer-Verlag Hiedelberg pp 181- 215
14 Del Giorgio PA and RH Peters (1994) Patterns in Planktonic PR
ratios in lakes Influence of lake trophy and dissolved organic carbon
Limnol Oceanography Volume 39 pp 772-787
15 Dzombak DA and R G Luthy (1984) Estimating adsorption of
polvacvclic aromatic hydrocarbons on soils Soil science Vol 137 p 292-
308
16 EfflerSW and MT Auer (1987) Optical heteroqenisity in Green Bay
Water Resource Bulletin Vol 23pp 937-942
17 Emig DK (1973) Removal of Heavy metals from acid bath plating by soil
Phd Thesis Perdue University
18 Fessenden RJ and Fessenden JS (1990) Organic Chemistry 4th
Edition Brooks Cole Publishing Company Pacific Grove California
19 FisetJF Blais JFBen Cheikh R and RDTyagi (2000)Review on
metal removal from effluents by adsorption and wood barks Rev Sci Eau
Vol 13 pp325- 349
20 Environmental technology Letters (1986) Vol 7 No8 pp 415
21 Githere PG (MSc Thesis) Potential of ground Charcoal In removal of
synthetic dye from water MSc Thesis University of Nairobi
22 Griffin RA and WR Roy (1985) Interaction of organic solvents with
saturated soil-water systems Environmental Institute for waste
management Studies Open File Report 3 University of Alabama pp86
23 GuptaGS PrasadG and Singh VN (1990) Removal of Chrome dve
from aqueous solutions by mixed adsorbents Fly ash and coal Wat Res
Vol 24 No 1pp45-50
24 Gurr E (1971) Synthetic Dyes in Biology Medicine and Chemistry
Academic Press London amp New York
25 Haines TA TVKomov VE Matey and CH Jagoe (1995) Perch
Mercury content is related to acidity and colour in 26 Russian Lakes Water
Air Soil Pollution Vol 85 pp823-828
88
26 Henebry MS ad J CairnsJr(1984) Protozoan colonization rates in
trophic status ot some freshwater wetlands lakes Journal of Protozool Vol
31 pp456-467
27 Horvart C Melander W and Molnar I ( 1976) Solvophobic interactions
in Liquid Chromatography with nonpolar stationary phases Journal of
chromatography Vol 125 pp 129 - 156
28 httpwwwpgonlinecom
29 Huang JC and Liao CS (1970) Adsorption of pesticides by clay minerals
Journal of Sanitation Eng Div American Society of Civil Eng Vol 96 pp
1057- 1078
30lrving S Goldstein(1977) Wood Technology Chemical Aspect ACS
Symposium series 43 American Chemical Society Washington
31llmavirta V and P Huttunen (1989) Water chemistry and
phytoplankton communities acidic clear and brown-water lakes in eastern
Finland Water Air Soil Pollution Vol 46pp415-432
32 Jang-Yeun Horng and Shang-Da Huang (1993) Removal of organic dye
(Direct Blue) from synthetic Wastewater by adsorptive bubble techniques
Environmental science Technology Vol 27 pp 1169-1175
33 Jerome JH R P Bukata PH Whitfield and N Rousseau (1994)
Colour in natural Waters 2 Observations of Spectral variations in British
Columbia Rivers Northwest Science Volume 68pp53-64
34 Jerome JH R P Bukata PH Whitfield and N Rousseau (1994)
Colour in natural Waters 1 Factors controlling the dominant wavelength
Northwest Science Volume 68pp43 -52
35 Jones HR (1974) Pollution Control in the Textile Industry
36 Juarez LM KH Holtschmit JJ Salmeron and MK Smith (1987)
The effects of chemical and visual communication space availability and
substratum colour on growth of juvenile fresh water prawn Macrobrachium
rosebergii Journal of marine Biology and ecology Vol 110 pp285- 295
37 Kuo W G (1992) Decolorizing Dye Waste-water with Fenton Reagent
Water resources Vol26 pp 881
38 Lamount IM (1981) Water Research topics Ellis Horwood London Vol
1 PP- 222
89
3 9 Liang IG (1991) The impact of effluent regulations on dyeing industry
Rev Pro Colouration Vol 21pp56-71
4 0 Lillie R Connrsquos Biological stains Williams amp Wilkins Baltimore MD USA
4 1 Masumune S and Smith JM (1976) Adsorption Rate Stud ie s ^
significance of pore diffusion America Institute of Chemical Engineers
Journal Vol 10No 2 pp246
4 2 McCrum WA (1984) The use of second-order derivative spectroscopy
in investigation of sources of coloured pollutants in water Water Res Vol
18pp 1249-1252
43 Mierle G and R Ingram (1991) The role of Humic substances in
mobilization of Mercury from watersheds Water Air Soil Pollution Vol 56
pp349-357
44 Michelson DL (1975) Removal of soluble mercury from water by
complexinq techniques US D1 Office of water Research and Technology
Bulletin No 74 Virginia Polytechnique Institute Blackburg Va
45 Nilsson A and I Hakanson (1992) Relationship between Mercury in
lake water water colour and mercury in fish Hydrobiologia Vol
235236pp675-683
46 PaggaUMand TaegerK(1994) Development of a method for
adsorption of dyestuffs on activated sludge Water Resources Vol
28pp1051-1057
47 PootsVJP Healy JJ and Mckay G (1976) Removal of basic dve
from effluent using wood as an adsorbent Water Pollution Control
Federation Journal pp 926-934
48 Ratte ID and Bruener MM (1974) The physical chemistry of Dve
adsorption Academic Press New York and London
49 Rosen JB (1954) General Numerical Solution for Solid diffusion in Fixed
Beds Ind Eng Chem Vol 46 1590
50 Roy WR Krapac IG Chou SFJ and Griffin RA (1992) Batch-Tvne
Procedures for Estimating Soil adsorption of chemicals Illinois State
Geological Survey Chapaign Illinois 61820
51 Sawyer C N and McCarty PL (1978) Chemistry for Environmental
Engineering M c G ra w -H il l book Company
90
52 Schwarzenbach RP GsechwaldPM and Imboden DM (1993)
Environmental Organic Chemistry John Wiley and Son Inc New York
53 Sewe PO 1986(MSc Thesis) Textile wastewater Treatment and
management in Eldoret Kenya
54 Shafizadeh (1981) Thermal deterioration of wood ACS Synposium Vol
43 pp57 - 81
55 Sheath RG MO Morison JE Korch D Kaczmarczyk and KM
Cole (1986) Distribution of macroalgae in South-central Alaska USA
Hydrobiologia vol135 pp259-270
56 Sinanoglu 0 and Abdulnur S (1965) Effect of water and other solvents
on the structure of biopolvmers Federation Proceedings Vol 29 Part II pp
512-523
57 Sittig Mbdquo (19731 Pollutant Removal Handbook Noyes Patal Corporation
London England
58 Susan Budavari (1990) The Merck Index 12th Edition Merck amp Company
NJ USA
59 Tsoumis Gbdquo (1991) Science and Technology of wood Structure
Properties Utilization Chapman and Hall
60 UNEP (1993) The Textile Industry and The Environment Technical Report
No 16 pp 65-66
61 UNEP (1996) Cleaner Production in textile wet processing A Workbook
for trainers 1st Edition Paris
62 Van Soest PJ and Goering HK (1994) Forage fibre Analysis
Handbook on Animal husbandry Research Division Beltsville Maryland
20705
63 Weber WJ McGinley PM and Katz LE (1991) Sorption Phenomena in
subsurface Systems Concepts Models and effects of contaminant fate and
Transport Water Res Volm 25 No 5 pp 499-528
64 Wetzel RG (1975) Limnology WB Saunders Company Philadelphia
65 Zollinger H (1987) Colour Chemistry - Syntheses Properties and
Application of Organic Dves and Pigments VCH New York 92-102
91
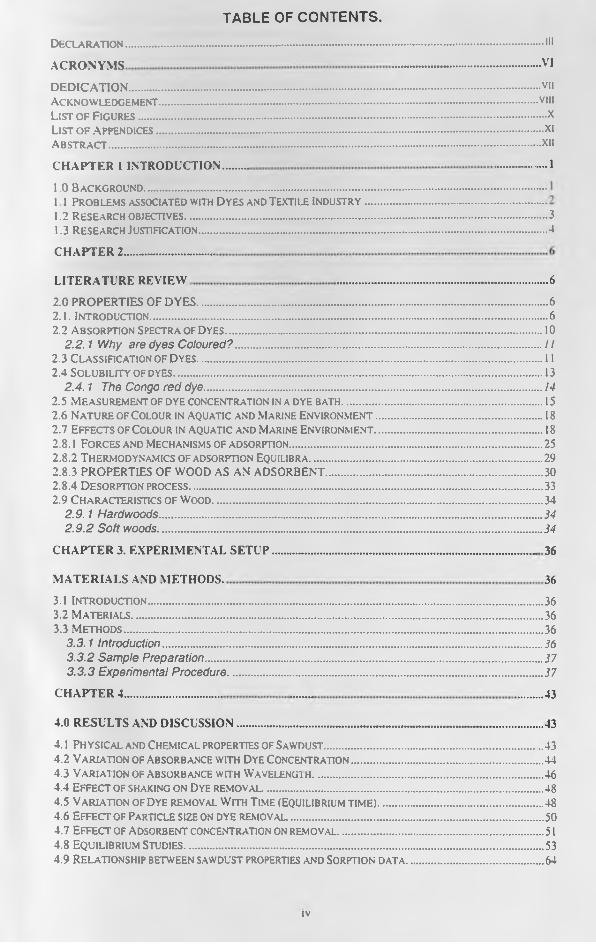