Embed Size (px)
Citation preview

Kamaraddi & Prakash, Cogent Food & Agriculture (2015), 1: 1112675http://dx.doi.org/10.1080/23311932.2015.1112675
FOOD SCIENCE & TECHNOLOGY | RESEARCH ARTICLE
Assessment of suitability of selected rice varieties for production of expanded riceVijayalaxmi Kamaraddi1 and Jamuna Prakash2*
Abstract: Expanded rice, prepared from pre-gelatinized milled rice by sand roast-ing method, is a popular snack food of India. Five high-yielding rice varieties of Hill zone of Karnataka state, viz., IET-13901, KHP-2, KHP-5, KHP-10, and Intan were screened for puffing quality based on their physicochemical, functional, nutritional and organoleptic parameters with Rajamudi as local check. The effect of varietal differences on expansion/puffing quality parameters, in vitro digestibility of starch and protein as well as bioaccessibility of iron, zinc, and calcium were determined. Results indicated a strong positive correlation between amylose content and expan-sion ratio and a negative correlation between protein and amylose content, length expansion ratio and volume expansion ratio. Expansion characteristics showed that the varieties suitable for production of puffed rice were KHP-2, IET-13901 and Intan. Nutritional analysis showed following ranges of nutrient content in expanded rice: protein, 6.22–8.17%; fat, 0.06–0.14%; and as mg/100 g calcium, 20.5–23.5; iron, 2.01–2.72; zinc, 1.22–1.82; thiamine, 0.315–0.470; riboflavin, 0.051–0.069; and niacin, 3.18–4.68. Nearly 80.3–80.8% starch and 67.6–83.2% protein was digestible. Among all varieties, KHP-2 had lowest amount of rapidly digestible starch (61.4%). Mineral bioaccessibility ranged from 42.7 to 52.1%. Sensory analysis indicated that Intan and KHP-2 were superior and suited for production of expanded rice.
*Corresponding author: Jamuna Prakash, Department of Food Science and Nutrition, University of Mysore, Mysore, India E-mail: [email protected]
Reviewing editor:Fatih Yildiz, Middle East Technical University, Turkey
Additional information is available at the end of the article
ABOUT THE AUTHORSThe first author, Vijayalaxmi Kamaraddi, is an assistant professor at College of Agriculture affiliated to University of Agricultural Science, Bangalore, India and an experienced researcher too. This research was part of her PhD research work, wherein she worked extensively on milling and processing of different rice varieties. The study included influence of various milling parameters of paddy on quality characteristics of rice as well as storage stability, and extensive analysis of nutritional and sensory quality. A part of the research is being presented in this paper.
Senior author, Jamuna Prakash, was the research guide, who was instrumental in framing the study design and supervising the research process. Senior author, a Professor of Food Science and Nutrition, has worked mostly in the area of food composition, dealing with effects of processing and storage variables with her research team. She has also done extensive work in product development and sensory evaluation. Many of the processes have been transferred to industries under various consultancy projects.
PUBLIC INTEREST STATEMENTThe research reported in this paper is investigative in nature wherein different rice varieties were tested for their suitability for use in preparation of expanded rice. Expanded rice is a low fat, crisp cereal used commonly in snack items across Asian countries. Being relatively low-cost product, it is very popular among lower income group of people. Hence the research reported in this paper is very useful for the manufacturers of expanded rice. In addition, nutritional quality of expanded rice is also presented in detail, which can be used for computing the nutrient intake through the use of this product. Starch digestibility profile also shows presence of slow digestible starch in one of the variety, which can be useful for diabetics. Expanded rice also seems to have a moderate content of dietary fiber, and it is a fair source of B-complex vitamins, making it a healthier product.
Received: 03 October 2015Accepted: 20 October 2015Published: 18 November 2015
© 2015 The Author(s). This open access article is distributed under a Creative Commons Attribution (CC-BY) 4.0 license.
Page 1 of 14

Page 2 of 14
Kamaraddi & Prakash, Cogent Food & Agriculture (2015), 1: 1112675http://dx.doi.org/10.1080/23311932.2015.1112675
Subjects: Breads; Cereals & Dough; Food Analysis; Sensory Science
Keywords: physical characteristics; expansion characteristics; nutritional composition; starch digestibility; mineral bioaccessibility; sensory quality
1. IntroductionRice (Oryza sativa) is one of the leading food crops of the world. It is the staple food for more than half of the world’s population. World production of rough rice or paddy is about 738 million tons from the cultivated area of 153,600 ha. China is first in rice production followed by India. During the year 2013–2014, India’s contribution to world production of paddy was about 19%, which represented 24% of the total paddy cultivated area with annual production of 120.6 million tons. Rice contributes about 60–70% of total calories and one-third of daily protein requirement, not only as a dietary sta-ple but also as a convenience food in the form of expanded (puffed) rice, as breakfast cereal, snack foods, multigrain flakes, puffed, popped, flaked, and extruded products. Pre-gelatinized and puffed flour has been used as an ingredient for cakes, desserts, sweets, fryums, crackers, formulated baby foods, soups, stews, noodles, and puddings. It is used as a base for preparation of steamed and shallow-fried fermented foods and rice vinegar, etc. Moreover, rice starches have been found to be useful as a fat replacer in ice creams, cheese cakes, mayonnaise, salad dressing, spreads, and cook-ies (FAO, 2012).
Expanded rice, also known as puffed rice, is one of the most popular rice-based snack products. It is a whole grain puffed product from pre-gelatinized milled rice, generally prepared by pre-condi-tioning the grain by hydrothermal treatment followed by drying and milling. The milled grains are again treated with salt water to an optimum moisture content which is then used for puffing by sand roasting method. Puffed rice is commonly used in snacks, cereal drinks, ready-to-eat breakfast cere-als, or in infant food formulations as a major source of carbohydrates. It is a staple food product of India, affordable and relished by poorest of the poor section of population contributing considerably to their energy and protein requirements. It also contributes beneficial nutrients such as dietary fiber, vitamins, minerals, and phytochemicals which have been linked with reduction in the risk of degenerative diseases (Joshi, Mohapatra, & Joshi, 2014; Maisont & Narkrugsa, 2009).
Researchers have reported that the physiochemical characteristics of grain such as amylose con-tent, protein content, moisture content, and degree of gelatinization affect the puffing quality of the grains significantly (Chandrasekhar & Chattopadhyay, 1989; Chinnaswamy & Bhattacharya, 1983a; Maisont & Narkrugsa, 2010). These in turn are dependent on grain variety. Paddy varieties used for puffing in general fetch higher market price than the ones used for staple rice production. Hence the farmers, processers, and breeders are more interested in varieties suitable for puffed rice produc-tion. The present investigation was undertaken to test the suitability of selected rice varieties for puffed rice production and to study their nutritional and organoleptic quality in comparison to a conventionally grown variety.
2. Materials and methods
2.1. MaterialsFive high-yielding paddy varieties of Hill zone selected for the study were procured from Agriculture Research Station, University of Agricultural Sciences, Bangalore, located at Mudigere of Chikmagaluru district of Karnataka State, India, namely IET-13901, KHP-2, KHP-5, KHP-10, and Intan, along with Rajamudi variety which was used as local check for comparison. Four of the varieties were of medi-um duration except Intan which was of long duration. The grains were harvested at full maturity, cleaned, graded, and stored at room temperature (25–30°C) in airtight storage bins for aging up to 6 months. The paddy samples were then exposed to the laboratory air for 1–2 days before analytical work in order to equilibrate the moisture.

Page 3 of 14
Kamaraddi & Prakash, Cogent Food & Agriculture (2015), 1: 1112675http://dx.doi.org/10.1080/23311932.2015.1112675
The chemicals used for the study were of analytical grade. Glass double-distilled water was used for all the analysis and experiments were carried out in quadruplicates. The enzymes used for the study were pepsin (Batch No. 3-0060), pancreatin (Batch No. 0-0864), diastase (Batch No. 0695/195/270511), and papain (Batch No. 0993/493/130811) from Sigma Chemical Co., USA. The dialysis tubing used for bioaccessibility studies was procured from Sigma, USA, which had a molecu-lar mass cut-off of 8,000 kda.
2.2. Methods
2.2.1. Parboiling and puffingParboiling, a hydrothermal pre-milling treatment was used as pre-treatment for the production of puffed rice. Paddy samples were soaked in water bath (80°C) for 45 min followed by steaming at 1 atm for 10 min in autoclave (Miah, Haque, Douglass, & Clarke, 2002). The gelatinized samples were shade-dried till they reached a moisture content of 10%. Dehusking and polishing was carried out with use of a laboratory scale dehusker and abrasive polisher. Parboiled, dried, and milled samples (10% moisture content) were conditioned to 12% moisture level by addition of measured quantity of brine (2% salt solution) and were tempered overnight in an airtight container. Thermal expansion of different varieties of parboiled and milled rice samples were carried out by sand roasting method, maintaining a sand to rice ratio of 15:1 (Chinnaswamy & Bhattacharya, 1983a). Three hundred gram of fine sand was heated in a pan till it reached the temperature of 250°C temperature and the par-boiled and milled rice samples were poured in it and quickly stirred resulting in sudden puffing of grains in about 10 s. The puffed grains were stored in airtight polyethylene packages to maintain freshness and protect against moisture ingress which is very important to maintain the quality of puffed grains.
2.2.2. Physical characteristicsAll the experiments were replicated four times. Length (L), breadth (B), and thickness (T) of brown rice of each variety were measured manually using a Vernier caliper (Mstutoyo, Japan) having a 0.05-mm precision. A minimum of 10 full grains per replication with both tips intact were used for measurements. Based on the L and L/B ratio, the grains were classified as per Bhattacharya, Sowbhagya, and Indhudhara Swamy (1980). The true density of raw brown rice samples of all varie-ties were determined by toluene displacement method (Mohsenin, 1989) and expressed as kg/m3. The bulk density was determined as per Varnamkhasti et al. (2008), using hectoliter weight and ex-pressed in kg/m3. Thousand kernel weight of the raw brown rice samples were determined by weigh-ing 1,000 grains in an electronic balance.
Hardness of the raw brown rice kernels was measured using Texture Analyzer (TA-HDI texture analyzer, Stable Micro system UK) with a 100-kg load cell using single compression. A single com-pression force-versus-time program was used to compress single raw brown rice kernel along the thickness, at a speed of 0.5 mm/min and return to its original position. The original clearance be-tween the probe and the base in the load cell of the instrument was fixed at 10 mm, so that when the probe moved down, it would compress the test sample kept horizontally on the base to a dis-tance of 2 mm. The program was set to move the probe at 10 mm/min in both pre-test and post-test phases. A 5-mm diameter cylinder stainless steel probe was used to compress a single grain. The test was repeated 20 times from the sample lot, for all six varieties. The maximum force indicated by the force time curve was taken as the maximum compressive force/hardness (Mohapatra & Bal, 2012).
2.2.3. Expansion characteristicsThe L and B of the unexpanded and expanded rice were also measured manually by a Vernier caliper in mm. The measurement was made on 10 random drawn grains from the test samples of each vari-ety. For calculation of length and width expansion, the average of all the ten values of grains was taken. Lengthwise expansion and breadthwise expansion were calculated using ratio between
Page 4 of 14
Kamaraddi & Prakash, Cogent Food & Agriculture (2015), 1: 1112675http://dx.doi.org/10.1080/23311932.2015.1112675
unexpanded and expanded grain. The volume expansion was measured by sand replacement method (Chinnaswamy & Bhattacharya, 1983a; Joshi et al., 2014) and also expressed as the ratio between unexpanded and expanded grain.
2.2.4. Chemical compositionThe moisture content was estimated following standard oven-drying and repeated weighing meth-od of AOAC (2000). The amylose content was estimated as per simplified colorimetric procedure of Juliano and Sukurai (1985). In brief, a 100 mg of finely ground sample was treated with 1.0 ml of rectified spirit and 9.0 ml of 1 N NaOH and heated on boiling water bath (15 min) to gelatinize the starch, transferred to a 100-ml volumetric flask and volume was made up. Five milliliter of this solu-tion was drawn in a 100-ml volumetric flask, 1.0 ml of 1 N acetic acid, and 2.0 ml of KI reagent was then added, shaken well, volume made up and allowed to stand in dark for 20 min to develop color. Absorbance of the solution was measured in a spectrophotometer at 620 nm and amylose content expressed on a dry weight basis using purified potato amylose for standard curve. For protein con-tent, nitrogen was estimated by using Kjeldahl equipment (Kel plus, Pelican system, India). The pro-tein content of the sample was estimated from the nitrogen value using the conversion factor of 5.95 (Ranganna, 1986). Fat was estimated by Soxhlet distillation method by repeated extraction of fat by petroleum ether and ash was determined by incineration of sample in a furnace and weighing of residual inorganic material (AOAC, 2000). Insoluble and soluble dietary fiber were measured on the basis of separation of non-starch polysaccharides by enzymatic and gravimetric assay of Asp, Johansson, Hallmer, and Siljestroem (1983) which is equivalent to physiologically unavailable fiber. Total starch was estimated by degradation of starch to glucose with amyloglucosidase followed by determination of glucose (Batey & Ryde, 1982; Raghuramulu, Nair, & Kalyansundaram, 1983). Calcium was analyzed by precipitation as calcium oxalate and subsequent titration with potassium permanganate, iron was determined colorimetrically by α-α-dipyridyl method, zinc content was es-timated through atomic absorption spectrophotometer after preliminary digestion of food sample (AOAC, 2000). Thiamine was estimated on the basis of oxidation of thiamine to thiochrome, which fluoresces in UV light under standard conditions and the fluorescence is proportional to the thi-ochrome present, and hence, to the thiamine originally in solution. For estimation of riboflavin, the native fluorescence of riboflavin in neutral pH was used for the chemical estimation (Raghuramulu et al., 2003). Niacin was analyzed colorimetrically as per AOAC (2005) standard method 961.14, based on the reaction of nicotinic acid with cyanogen bromide and aromatic amines to give a yellow colored compound.
2.2.5. Digestible and bioaccessible nutrientsTo determine in vitro starch digestibility (IVSD), modified method of Kon, Wagner, Booth, and Robbins (1971), Holm, Björck, Asp, Sjöberg, and Lundquist (1985), and Som, Mouliswar, Daniel, Malleshi, and Venkat Rao (1992) was followed. A 100 mg of sample was digested with α-amylase, pepsin, pancrea-tin, and amyloglucosidase sequentially with appropriate pH adjustment and incubation as required. Finally, glucose was estimated in digest and converted to starch by multiplying the value by 0.9. The percent starch digestibility was calculated taking total starch into consideration.
In vitro protein digestibility (IVPD) was estimated according to Akeson and Stahman (1964). A 2.0 g of sample was digested with pepsin and pancreatin enzymes to follow gastric digestion, insolu-ble protein precipitated with trichloroacetic acid and soluble protein estimated through Kjeldahl method. The percent protein digestibility was calculated by taking total protein into consideration.
In vitro bioaccessibility of iron, zinc, and calcium were measured through determining the propor-tion of minerals diffused through a semi-permeable membrane after digesting the samples with pepsin and pancreatin stimulating the physiological digestion procedure (Luten et al., 1996). The content of iron, zinc and calcium diffused through the semi-permeable membrane were estimated by methods as described earlier.

Page 5 of 14
Kamaraddi & Prakash, Cogent Food & Agriculture (2015), 1: 1112675http://dx.doi.org/10.1080/23311932.2015.1112675
2.2.6. Starch profileIn addition to total starch content and digestibility, the in vitro rapidly digestible (RDS), slow digest-ible (SDS), and resistant starch (RS) fractions of expanded rice samples were also determined using the method of Englyst, Kingman, and Cummings (1992). The samples were digested with enzymes following physiological digestion procedure and the starch fractions were estimated as glucose re-leased at different time intervals. The residual fraction was considered as RS.
2.2.7. Sensory qualityAll freshly puffed rice samples were subjected to sensory analysis by a semi-trained panel number-ing 28. A score card was designed specifically to test the quality attributes of sample using a grading scale of 1–10 which represented qualities of poor, fair, satisfactory, good, and excellent. Water was allowed in between samples to wash down the previous samples. The sensory attributes tested were appearance, color, size, shape, texture, crispiness, aroma, taste, and overall acceptability.
2.2.8. Statistical analysisData were computed to obtain mean and standard deviation and analyzed using analysis of vari-ance to determine significant differences between various parameters with a statistical software SPSS 15.0 (SPSS Inc., Chicago, IL), further Duncan’s multiple range test was used as post-test to de-termine significant difference between samples, if any (Duncan, 1995). Pearson’s correlation coeffi-cients for various physical and chemical properties of rice varieties were also computed to understand the association between different properties.
3. Results and discussion
3.1. Physical characteristicsThe paddy samples collected from the Agriculture Research Station having equilibrium moisture content of 12.5 ± 0.5% were subjected to different physical tests. Physical parameters relevant to puffing quality of six selected varieties of paddy are depicted in Table 1. The L, B, and T of the grains varied between 5.66–6.61, 1.75–2.40, and 1.43–1.80 mm, respectively, with statistically significant difference between varieties. Grains of IET-13901 variety were lengthier than other grains, whereas KHP-2 had the largest breadth. Most of the consumers as well as processors prefer large volume of the puffed product, which may be impacted by the initial dimension of the grain. The L/B ratio or slenderness ratio varied between 2.53 and 3.59, which categorized these varieties into medium slen-der type as per Bhattacharya et al. (1980). This classification of the varieties is of significance in the
Table 1. Effect of varietal differences on physical characteristics of expanded rice
Note: Values with different superscript in a row indicate significant differences between each other on application of Duncan’s multiple range test.*Average value of 20 grains.***Highly significant.
Characteristics Rice varieties F ratio
p valueIET-13901 KHP-2 KHP-5 KHP-10 Rajamudi Intan
Length (mm) 6.61a ± 0.008 6.52ab ± 0.017 5.66e ± 0.026 6.12d ± 0.016 6.39bc ± 0.261 6.32c ± 0.019 40.9887 0.000***
Breadth (mm) 1.84d ± 0.013 2.40a ± 0.016 1.75e ± 0.019 2.33b ± 0.025 2.05c ± 0.041 2.34b ± 0.031 459.929 0.000***
Thickness (mm) 1.54c ± 0.038 1.80a ± 0.017 1.43d ± 0.037 1.80a ± 0.012 1.64b ± 0.054 1.54c ± 0.129 24.2057 0.000***
L/B ratio 3.59a ± 0.045 2.73c ± 0.047 3.19b ± 0.047 2.53e ± 0.027 3.15b ± 0.023 2.63d ± 0.022 476.691 0.000***
True density (kg/m3)
1,431.5e ± 1.290
1,615.3b ± 2.362
1,513.3c ± 3.947
1,434.0e ± 5.416
1,438.8d ± 0.957
1,744.0a ± 0.816
7,169.622 0.000***
Bulk density (kg/m3)
762.3e ± 0.957 763e ± 0.816 775.8c ± 3.947 811.3a ± 1.500 768.3d ± 4.193 790.0b ± 5.887 122.01 0.000***
Hardness * (N) 139.06d ± 1.556 151.25b ± 1.398 92.895f ± 2.022 141.61c ± 0.342 98.242e ± 1.973 158.59a ± 1.254 1,322.31 0.000***
1,000 kernel weight (g)
27.51b ± 1.48 30.61a ± 1.49 24.40c±0.98 30.53a ± 0.24 18.09d ± 0.61 18.21d ± 0.24 132.959 0.000***

Page 6 of 14
Kamaraddi & Prakash, Cogent Food & Agriculture (2015), 1: 1112675http://dx.doi.org/10.1080/23311932.2015.1112675
puffing industry as a larger and medium variety would have better yield compared to the small and slender grains. However, because of organoleptic reasons and local availability, sometimes even short and bold grains are used for puffing purposes.
The true density (TD) and bulk density (BD) of the brown rice samples of the varieties varied be-tween 1,431.5–1,744.0 and 762.3–811.3 kg/m3. TD was very important in this investigation as highly dense materials have closely packed starch molecules and thus are harder and dense (Juliano & Sukurai, 1985), which may ultimately affect the puffing quality of the grains. Among the different varieties tested, Intan had the highest TD (1,744 kg/m3), followed by KHP-2 (1,615.30 kg/m3) with significant difference in comparison to other varieties. Thousand kernel weight of various brown rice samples varied from 18.09 to 30.61 g which signifies the head rice yield, in turn the puffing output. Compressive hardness as measured by texture analyzer showed that the hardness of the rice sam-ples varied between 93 and 159 with KHP-5 and Intan having the lowest and highest hardness val-ues, respectively. Rice hardness is the important characteristic as harder grains, would have lesser breakage during milling and higher expansion during puffing process as well.
3.2. Expansion characteristicsThe expansion properties of rice and related chemical parameters i.e. length expansion ratio (LER), breadthwise expansion ratio (BER), and volume expansion ratio of puffed rice (VER), and protein and amylose content of raw and parboiled rice of six varieties are presented in Table 2. The degree of puffing expansion is said to be affected by the conditions of thermal treatments, the rice variety, i.e. mainly its amylose content and the parboiling conditions (Chinnaswamy & Bhattacharya, 1983a, 1983b). The LER, BER, and VER of the puffed rice were found to vary significantly between samples from 1.24 to 1.99, 1.29 to 1.75, and 2.73 to 4.14, respectively, with the highest VER for the variety, KHP-2 (4.14) followed by IET-13901 (3.86), and Intan (3.83).
The protein content of samples varied between 4.46 g and 7.78 g/100 g, the lowest being in the KHP-2 and the highest being in Rajamudi. This property is of importance as higher protein content decreases the puffing output of the cereal (Chandrasekhar & Chattopadhyay, 1991) and rice variety with the low protein content would have better puffing yield. In the present investigation, it was found that the KHP-2 variety which is commonly preferred in the local puffed rice industries, had the minimum protein content among all the varieties tested, with 4.42% followed by Intan (5.40 g), which is also preferred for puffing.
Table 2. Effect of varietal differences on expansion characteristics of rice and related chemical parameters
Note: Values with different superscript in a row indicate significant differences between each other on application of Duncan’s multiple range test.***Highly significant.
Characteristics Rice varieties F ratio
p valueIET-13901 KHP-2 KHP-5 KHP-10 Rajamudi Intan
Expansion characteristics
Lengthwise expansion ratio (LER)
1.75b ± 0.025 1.99a ± 0.012 1.24e ± 0.036 1.51c ± 0.009 1.30d ± 0.009 1.54c ± 0.036 502.284 0.000***
Breadthwise expan-sion ratio (BER)
1.62cb ± 0.012 1.64b ± 0.017 1.34d ± 0.03 1.75a ± 0.023 1.29e ± 0.009 1.59c ± 0.025 284.098 0.000***
Volume expansion ratio (VER)
3.86b ± 029 4.14a ± 0.012 3.15d ± 0.027 3.24c ± 0.017 2.73e ± 0.025 3.83b ± 0.022 2,098.32 0.000***
Chemical parameters
Protein (%) 6.23c ± 0.019 4.46f ± 0.028 6.85b ± 0.031 5.81d ± 0.009 7.78a ± 0.025 5.40e ± 0.025 9,006.271 0.000***
Amylose (raw) % 25.71c ± 0.019 24.5d ± 0.016 22.62e ± 0.026 28.17b ± 0.040 21.62f ± 0.017 28.35a ± 0.233 3,230.947 0.000***
Amylose (parboiled) %
21.49a ± 0.017 13.50f ± 0.022 15.83e ± 0.034 20.83c ± 0.039 18.12d ± 0.024 21.02b ± 0.042 42,931.26 0.000***

Page 7 of 14
Kamaraddi & Prakash, Cogent Food & Agriculture (2015), 1: 1112675http://dx.doi.org/10.1080/23311932.2015.1112675
The amylose content of the raw as well as parboiled rice samples were found to vary between 26.2 to 28.35 and 13.50 to 21.49% on dry weight basis, respectively. Thus, the rice varieties tested were found to be intermediate to high amylose type. It was observed that parboiled milled rice had lower amylose content compared to their raw milled counterparts. Similar results were also reported by Ibukun (2008) and Joshi et al. (2014). Starch molecules are comprised of amylose and amylopectin. The amylose content of rice plays an important role in deciding the puffing characteristics. Amylose is composed of linear chain of glucose molecules which align themselves in the shear fields and thus are difficult to pull apart during the extrusion process (Moraru & Kokini, 2003). Since high-amylose content rice varieties are hard to shear, there is a greater chance that pressure will build up during the thermal treatment. This perhaps resulted in a sudden expansion of the endosperm, making it a highly preferred product from puffing compared to their low amylose content counterparts. It has been observed that highly packed starch molecules have a better ability to expand compared to the loosely packed chalky grains. Singh, Sodhi, Kaur, and Saxena (2003) tested chalky grains for cooking and puffing qualities and found that they had lower elongation ratio after cooking and lower expan-sion ratio after puffing. Joshi et al. (2014) also observed a similar trend.
3.3. Correlation studiesPearson’s correlation coefficients that describe the linear relationship among various physical and physicochemical properties of rice tested at p = 0.05 are presented in Table 3. The size and shape of rice grain represented by L, B, T, and L/B ratio showed that L was correlated positively with B, T, L/B ratio and hardness of the grain, whereas B was correlated positively with T, TD, BD, and hardness of the grain. L/B ratio showed negative correlation with TD, BD, hardness, and amylose content of raw grain. Hardness exhibited positive correlation with L, B, T, TD, BD, and amylose content. The expansion characteristics of grain were positively correlated with L, B, T, TD, hardness, and amylose content of raw grain, and negatively correlated with L/B ratio and protein content. The results are in accordance with the observations of other workers (Joshi et al., 2014; Webb, Pomeranz, Afework, Lai, & Bollich, 1986). Protein content of brown rice was found to have strong negative relationship with LER and VER, which could be explained by lower amylose content. Since starch was responsible for expansion, high protein content would indirectly influence the total amylose content of rice affecting the puffing char-acteristics negatively (Hoke, Jirina, & Houska, 2005; Joshi et al., 2014; Villareal & Juliano, 1989). Similar
Table 3. Pearson’s correlation coefficients for various physical and chemical properties of rice varieties
Notes: PB: Parboiled; LER: Length expansion ratio; BER: Breadth expansion ratio; VER: Volume expansion ratio.
Properties Length Breadth Thick-ness
L/B True density
Bulk density
Hardness Protein Amylose content
LER BER VER
Raw PBLength 1.000
Breadth 0.327 1.000
Thickness 0.398 0.767 1.000
L/B 0.108 −0.903 −0.626 1.000
True density 0.002 0.512 −0.102 −0.531 1.000
Bulk density −0.430 0.425 0.264 −0.640 0.048 1.000
Hardness 0.459 0.722 0.443 −0.523 0.532 0.249 1.000
Protein −0.191 −0.683 −0.475 0.599 −0.594 −0.120 −0.858 1.000
Am-ylose con-tent
Raw 0.079 0.559 0.255 −0.525 0.365 0.676 0.833 −0.604 1.000
PB 0.187 −0.039 −0.171 0.132 −0.157 0.467 0.291 0.190 0.620 1.000
LER 0.627 0.483 0.526 −0.193 0.263 −0.307 0.761 −0.818 0.335 −0.175 1.000
BER 0.248 0.590 0.558 −0.472 0.161 0.434 0.875 −0.791 0.851 0.324 0.689 1.000
VER 0.378 0.374 0.160 −0.185 0.562 −0.228 0.816 −0.879 0.490 −0.076 0.877 0.666 1.000
Page 8 of 14
Kamaraddi & Prakash, Cogent Food & Agriculture (2015), 1: 1112675http://dx.doi.org/10.1080/23311932.2015.1112675
results were reported by Chinnaswamy and Bhattacharya (1983b) and Goodman and Rao (1984) who had reported a positive correlation between amylose content and VER of puffed grains. LER was sig-nificantly positively correlated to volume expansion ratio.
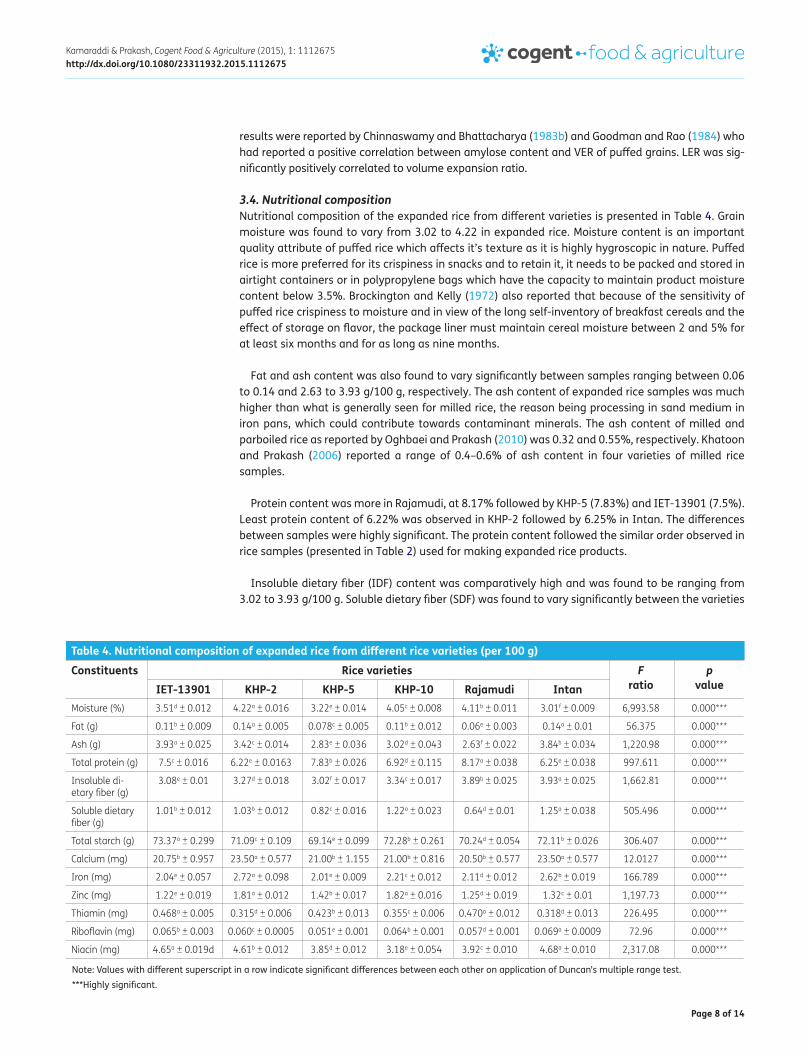
3.4. Nutritional compositionNutritional composition of the expanded rice from different varieties is presented in Table 4. Grain moisture was found to vary from 3.02 to 4.22 in expanded rice. Moisture content is an important quality attribute of puffed rice which affects it’s texture as it is highly hygroscopic in nature. Puffed rice is more preferred for its crispiness in snacks and to retain it, it needs to be packed and stored in airtight containers or in polypropylene bags which have the capacity to maintain product moisture content below 3.5%. Brockington and Kelly (1972) also reported that because of the sensitivity of puffed rice crispiness to moisture and in view of the long self-inventory of breakfast cereals and the effect of storage on flavor, the package liner must maintain cereal moisture between 2 and 5% for at least six months and for as long as nine months.
Fat and ash content was also found to vary significantly between samples ranging between 0.06 to 0.14 and 2.63 to 3.93 g/100 g, respectively. The ash content of expanded rice samples was much higher than what is generally seen for milled rice, the reason being processing in sand medium in iron pans, which could contribute towards contaminant minerals. The ash content of milled and parboiled rice as reported by Oghbaei and Prakash (2010) was 0.32 and 0.55%, respectively. Khatoon and Prakash (2006) reported a range of 0.4–0.6% of ash content in four varieties of milled rice samples.
Protein content was more in Rajamudi, at 8.17% followed by KHP-5 (7.83%) and IET-13901 (7.5%). Least protein content of 6.22% was observed in KHP-2 followed by 6.25% in Intan. The differences between samples were highly significant. The protein content followed the similar order observed in rice samples (presented in Table 2) used for making expanded rice products.
Insoluble dietary fiber (IDF) content was comparatively high and was found to be ranging from 3.02 to 3.93 g/100 g. Soluble dietary fiber (SDF) was found to vary significantly between the varieties
Table 4. Nutritional composition of expanded rice from different rice varieties (per 100 g)
Note: Values with different superscript in a row indicate significant differences between each other on application of Duncan’s multiple range test.***Highly significant.
Constituents Rice varieties F ratio
p valueIET-13901 KHP-2 KHP-5 KHP-10 Rajamudi Intan
Moisture (%) 3.51d ± 0.012 4.22a ± 0.016 3.22e ± 0.014 4.05c ± 0.008 4.11b ± 0.011 3.01f ± 0.009 6,993.58 0.000***
Fat (g) 0.11b ± 0.009 0.14a ± 0.005 0.078c ± 0.005 0.11b ± 0.012 0.06e ± 0.003 0.14a ± 0.01 56.375 0.000***
Ash (g) 3.93a ± 0.025 3.42c ± 0.014 2.83e ± 0.036 3.02d ± 0.043 2.63f ± 0.022 3.84b ± 0.034 1,220.98 0.000***
Total protein (g) 7.5c ± 0.016 6.22e ± 0.0163 7.83b ± 0.026 6.92d ± 0.115 8.17a ± 0.038 6.25e ± 0.038 997.611 0.000***
Insoluble di-etary fiber (g)
3.08e ± 0.01 3.27d ± 0.018 3.02f ± 0.017 3.34c ± 0.017 3.89b ± 0.025 3.93a ± 0.025 1,662.81 0.000***
Soluble dietary fiber (g)
1.01b ± 0.012 1.03b ± 0.012 0.82c ± 0.016 1.22a ± 0.023 0.64d ± 0.01 1.25a ± 0.038 505.496 0.000***
Total starch (g) 73.37a ± 0.299 71.09c ± 0.109 69.14e ± 0.099 72.28b ± 0.261 70.24d ± 0.054 72.11b ± 0.026 306.407 0.000***
Calcium (mg) 20.75b ± 0.957 23.50a ± 0.577 21.00b ± 1.155 21.00b ± 0.816 20.50b ± 0.577 23.50a ± 0.577 12.0127 0.000***
Iron (mg) 2.04e ± 0.057 2.72a ± 0.098 2.01e ± 0.009 2.21c ± 0.012 2.11d ± 0.012 2.62b ± 0.019 166.789 0.000***
Zinc (mg) 1.22e ± 0.019 1.81a ± 0.012 1.42b ± 0.017 1.82a ± 0.016 1.25d ± 0.019 1.32c ± 0.01 1,197.73 0.000***
Thiamin (mg) 0.468a ± 0.005 0.315d ± 0.006 0.423b ± 0.013 0.355c ± 0.006 0.470a ± 0.012 0.318d ± 0.013 226.495 0.000***
Riboflavin (mg) 0.065b ± 0.003 0.060c ± 0.0005 0.051e ± 0.001 0.064b ± 0.001 0.057d ± 0.001 0.069a ± 0.0009 72.96 0.000***
Niacin (mg) 4.65a ± 0.019d 4.61b ± 0.012 3.85d ± 0.012 3.18e ± 0.054 3.92c ± 0.010 4.68a ± 0.010 2,317.08 0.000***

Page 9 of 14
Kamaraddi & Prakash, Cogent Food & Agriculture (2015), 1: 1112675http://dx.doi.org/10.1080/23311932.2015.1112675
ranging from 0.64 g in Rajamudi to 1.25 g/100 g in Intan. The analyzed samples were found to have a higher content of both IDF and SDF in comparison to white milled rice as the rice was subjected to much lesser degree of polishing before processing to expanded rice. This also resulted in a healthier product as the fiber content was higher. Total dietary fiber (TDF) for milled rice varieties as reported by Panlasigui et al. (1991) in IR 36 was 2.0% followed by IR 42 (1.73%) and IR 62 (1.05%). Khatoon and Prakash (2006) also observed a similar trend in the IDF content of BT, Gowrisanna, Jeera, and Basmati rice with values 2.42, 2.40, 2.08, and 2.82%, respectively. Devi and Geervani (2000) showed that the boiling process increased TDF content significantly, whereas there was no increase after puffing. Nyman et al. (1984) reported IDF values of 2.9% in expanded rice.
Mori (1982) reported TDF of brown rice to range from 5.5 to 6.9% and that of highly polished rice from 1.12 to 1.90%. Topping, Morson, Jackson, Illman, and Trimble (1991) also reported a high TDF content of brown rice than white rice. Partitioning of the TDF showed that IDF and SDF in raw rice gave mean values of 76.5 and 23.5% of TDF, respectively. The mean TDF content of rice increased on cooking and the extent of increase varied with the processing treatment. Higher TDF was observed when parboiled grain was further processed, as the parboiling process involves partial cooking and cooling. During the initial thermal treatment in parboiling, gelatinization occurs and on cooling, ret-rogradation sets in, which might be responsible for the increase in TDF and also the hardening of the grain after parboiling.
Siljeström, Eliasson, and Björck (1989) observed that different thermal processing used in the preparation of meals for human consumption resulted in conversion of IDF to SDF. Results of the study by Devi and Geervani (2000) also indicated the increase in SDF after thermal processing, prob-ably due to physical disruptions of starch. SDF increased considerably on puffing as puffing involved higher temperature (>200°C), indicating that SDF was likely to be elevated with increasing tempera-ture of processing.
The total starch content in expanded rice ranged between 69.14 and 73.37 g/100 g, the highest value was found in IET-13901 and least was found in KHP-5 with differences being highly significant. Rice is only a fair source of calcium and calcium content of expanded rice varied significantly be-tween the varieties (20.5–23.5 mg/100 g). The iron and zinc contents were in the range of 2.01–2.72 and 1.22–1.82 mg/100 g, respectively, with significant differences. The process of puffing affected the mineral contents of the rice. As process of puffing involves parboiling, the nutrients in the outer bran imbibe into central core of the grain and get fixed during retrogradation during drying. During the puffing process, parboiled rice was roasted with hot sand in an iron pan which can induce metal contamination of product. Heinemann, Fagundes, Pinto, Penteado, and Lanfer-Marquez (2005) re-ported that parboiled milled rice had 18% higher ash in comparison with milled rice and lower con-tents of manganese and calcium.
Highest iron content was observed in KHP-2 (2.72 mg/100 g) followed by Rajamudi (2.62 mg/100 g). The higher iron content in expanded rice could be contaminant iron being contributed by iron pan used for roasting. Highest value for zinc content was observed in KHP-10 and KHP-2 (1.82 and 1.81 mg/100 g). Among the B vitamins analyzed, puffed rice was found to be a good source of thia-mine, riboflavin, and niacin which varied significantly between varieties.
3.5. Digestible and bioaccessible nutrientsThe puffed rice samples were analyzed for IVSD, IVPD, and bioaccessible iron, zinc, and calcium and the results are compiled in Table 5. The IVSD was almost similar in all varieties (55.53–59.81%), whereas in protein slight differences were seen. Figure 1 presents IVSD and IVPD as percent of total and it can be seen that starch has similar values, whereas in protein there were marked differences with values ranging from 67.64 to 83.23%. Bioaccessible calcium was in the range of 10.12–12.11 mg/100 g and as percent of total it varied between 43.06 and 51.53% (Figure 2). Bioaccessible iron was much higher at 1.015–1.308 mg/100 g. In terms of percent, it ranged from 42.74 to 50.56% of total. For a cereal source, puffed rice exhibited a very high extent of iron bioaccessibility. As

Page 10 of 14
Kamaraddi & Prakash, Cogent Food & Agriculture (2015), 1: 1112675http://dx.doi.org/10.1080/23311932.2015.1112675
indicated earlier, the iron content of sample itself was quite high due to processing and this may have resulted in a very high extent of bioaccessibility as rice does not have many iron absorption inhibiting factors. Earlier studies have indicated that contaminant iron could be bioavailable (Kumari, Gupta, Lakshmi, & Prakash, 2004; Reddy, Ingale, & Nalwade, 1997; WHO, 1992). Bioaccessible zinc ranged from 0.61 to 0.91 mg/100 g with significant difference among samples. In terms of percent availability, zinc exhibited a high level of in vitro absorption ranging from 48.8 to 52.1%. These data indicate that puffed rice could be a significant source of minerals due to high absorption.
3.6. Starch profileStarch hydrolysis in vitro has been shown to be significantly correlated with in vivo starch availability (O’ Dea, Snow, & Nestel, 1981). Thus in vivo, starch from rice processed by puffing and boiling may be expected to be better utilized because soluble fiber is fermented more easily than insoluble fiber
Table 5. In vitro digestible and bioaccessible nutrients in expanded rice (per 100 g)
Note: Values with different superscript in a row indicate significant differences between each other on application of Duncan’s multiple range test.***Highly significant.
Nutrients Rice varieties F ratio
p valueIET-13901 KHP-2 KHP-5 KHP-10 Rajamudi Intan
Digestible starch (g)
59.62b ± 0.019 57.39d ± 0.139 55.53f ± 0.020 59.81a ± 0.194 56.51e ± 0.011 58.03c ± 0.025 1,194.31 0.000***
Digestible protein (g)
5.56c ± 0.012 4.20f ± 0.009 5.92b ± 0.019 4.82d ± 0.016 6.80a ± 0.016 4.77e ± 0.019 13,909.9 0.000***
Bioaccessible calcium (mg)
10.41c ± 0.012 12.11a ± 0.012 10.45b ± 0.044 10.12e ± 0.016 10.19d ± 0.026 10.12e ± 0.016 4,150.45 0.000***
Bioaccessible iron (mg)
1.025d ± 0.019 1.308a ± 0.009 1.018d ± 0.017 1.015d ± 0.010 1.050c ± 0.012 1.19b ± 0.012 315.116 0.000***
Bioaccessible zinc (mg)
0.63e ± 0.012 0.91a ± 0.012 0.74c ± 0.016 0.89b ± 0.012 0.61f ± 0.01 0.66d ± 0.005 530.425 0.000***
Figure 1. In vitro starch and protein digestibility of expanded rice as percent of total.
Figure 2. In vitro bioaccessible calcium, iron and zinc in expanded rice as percent of total.

Page 11 of 14
Kamaraddi & Prakash, Cogent Food & Agriculture (2015), 1: 1112675http://dx.doi.org/10.1080/23311932.2015.1112675
(Nyman & Asp, 1982). The starch digestibility profile of expanded rice varieties presented in Figure 3 showed that there were differences in the RDS, SDS, and RS contents of all samples. KHP-2 had a lesser content of RDS and a higher content of RS, whereas IET-13901, KHP-10, and Rajamudi had a higher content of RDS (64.05–64.95%). KHP-5 had least content of RS. In comparison with milled and polished rice (Chitra, Singh, & Ali, 2010), the RDS values of expanded rice in present study are defi-nitely lesser indicating a nutritionally better digestibility profile of starch. Thermal processing meth-od such as parboiling used in the preparation of rice products, which generate higher RS can be beneficial in suppressing starch digestibility especially for diabetics.
The process of parboiling, cooling/drying and high dry heat application increases RS and DF con-tents, which is likely to reduce the IVSD due to the higher resistance of RS to hydrolysis. According to Berry (1986), when hot gelatinized starch is cooled, a certain portion (in particular the high amylose forms) can retrograde to a less soluble form, that is resistant to acid and amylase action. Mangala, Malleshi, Tharanathan, and Mahadevamma (1999) studied RS formed during parboiling and expan-sion of rice and reported 3.6% of non-starch polysaccharides and 2.78% of crude RS in the processed samples, which was found to be higher than finger millet. They also reported 1.9% of SDF and 4.0% of IDF in the processed samples. According to Devi and Geervani (2000), RS in raw rice varied in the range of 0.15–0.37%. The mean RS content of rice increased from 0.24 to 0.37% on parboiling. This could be due to the initial moist heat treatment during parboiling which resulted in gelatinization. Secondly, retrogradation, which sets on cooling of parboiling paddy, could have resulted in increase in RS fraction.
Figure 3. Starch digestibility profile of expanded rice.
Notes: RDS: Rapidly digestible starch; SDS: Slow digestible starch; RS: Resistant starch.
Table 6. Effect of varietal differences on sensory quality of expanded rice
Note: Values with different superscript in a row indicate significant differences between each other on application of Duncan’s multiple range test.***Highly significant.
Nutrients Rice varieties F ratio
p valueIET-13901 KHP-2 KHP-5 KHP-10 Rajamudi Intan
Appearance 9.07b ± 0.385 9.19b ± 0.395 4.85d ± 0.718 6.67c ± 0.620 5.11d ± 0.506 9.48a ± 0.509 121.995 0.000***
Color 9.06b ± 0.446 9.00b ± 0.000 4.63e ± 0.492 6.48c ± 0.700 4.89d ± 0.320 9.63a ± 0.492 135.061 0.000***
Size 8.96b ± 0.518 9.07b ± 0.267 4.67d ± 0.620 6.41c ± 0.797 4.89d ± 0.506 9.52a ± 0.509 421.125 0.000***
Shape 8.92b ± 0.549 9.07b ± 0.267 4.59d ± 0.636 6.41c ± 0.844 4.85d ± 0.534 9.44a ± 0.506 315.116 0.000***
Texture 8.93b ± 0.549 9.07b ± 0.267 4.67d ± 0.620 6.33c ± 0.832 4.85d ± 0.534 9.52a ± 0.509 315.116 0.000***
Crispiness 8.89b ± 0.577 9.07b ± 0.267 4.63d ± 0.629 6.30c ± 0.869 4.81d ± 0.557 9.48a ± 0.509 376.269 0.000***
Aroma 8.85b ± 0.601 9.07b ± 0.267 4.59d ± 0.636 6.26c ± 0.902 4.78d ± 0.577 9.44a ± 0.506 358.691 0.000***
Taste 8.89b ± 0.577 9.11ab ± 0.320 4.63d ± 0.688 6.37c ± 0.883 4.85d ± 0.602 9.41a ± 0.501 315.116 0.000***
Overall ac-ceptability
8.96b ± 0.518 9.07b ± 0.267 4.74d ± 0.594 6.33c ± 0.784 4.89d ± 0.506 9.59a ± 0.501 340.407 0.000***

Page 12 of 14
Kamaraddi & Prakash, Cogent Food & Agriculture (2015), 1: 1112675http://dx.doi.org/10.1080/23311932.2015.1112675
3.7. Sensory analysisThe mean sensory scores of expanded rice varieties are compiled in Table 6 and as evident there were significant differences in the sensory quality of different varieties. Highest score for all attrib-utes were given to Intan variety (9.9.41–9.63) followed by KHP-2 (9.00–9.19) and IET-13901 (8.85–9.07) with values in similar range. The rest of the varieties were given lesser scores indicating that they were not suitable for production of expanded rice. The scores for KHP-10 were in the range of 6.26–6.67, for Rajamudi, 4.78–5.11, and for KHP-5, 4.59–4.85. As observed by expansion characteris-tics of the grain, sensory quality also indicated that Intan and KHP-2 varieties were most suitable for production of expanded rice.
4. ConclusionDifferent rice varieties were tested for their suitability for production of expanded rice. The physical characteristics of rice varieties varied with highest breadth and thickness for KHP-2 variety, which had good expansion characteristics for preparation of puffed rice. It had second highest TD, indicat-ing densely packed starch granules, and minimum protein content which could be the reason for better puffing volume. All these criteria resulted in better puffing characteristics compared to the other samples tested and was also given higher sensory scores. Intan, a high amylose grain also had similar characteristics and was rated high in sensory acceptability. Hence, KHP-2 and Intan can be recommended for puffing purposes.
FundingThe authors received no direct funding for this research.
Competing interestsThe authors declare no competing interest.
Author detailsVijayalaxmi Kamaraddi1
E-mail: [email protected] Prakash2
E-mail: [email protected] Department of Food Science and Nutrition, College of
Agriculture, VC Farm, Mandya 571405, India.2 Department of Food Science and Nutrition, University of
Mysore, Mysore 570 006, India.
Citation informationCite this article as: Assessment of suitability of selected rice varieties for production of expanded rice, Vijayalaxmi Kamaraddi & Jamuna Prakash, Cogent Food & Agriculture (2015), 1: 1112675.
ReferencesAkeson, W. R., & Stahman, M. A. (1964). A pepsin-pancreatin
digest index of protein quality. Journal of Nutrition, 83, 257–261.
AOAC. (2000). Official methods of analysis (17th ed.). Arlington, TX: Author.
AOAC. (2005). Official methods of analysis (18th ed.). Washington, DC: Author.
Asp, N. G., Johansson, C. G., Hallmer, H., & Siljestroem, M. (1983). Rapid enzymic assay of insoluble and soluble dietary fiber. Journal of Agricultural and Food Chemistry, 31, 476–482. doi:10.1021/jf00117a003
Batey, I., & Ryde, N. (1982). Starch analysis using thermostable alpha-amylases. Starch-Stärke, 34, 125–128.
Berry, C. S. (1986). Resistant starch: Formation and measurement of starch that survives exhaustive digestion with amylolytic enzymes during the determination of dietary fibre. Journal of Cereal Science, 4, 301–314. http://dx.doi.org/10.1016/S0733-5210(86)80034-0
Bhattacharya, K. R., Sowbhagya, C. M., & Indhudhara Swamy, Y. M. (1980). Quality of Indian rice. Journal of Food Science and Technology, 17, 189–193.
Brockington, S. F., & Kelly, V. J. (1972). Rice breakfast cereals and infant foods. In D. F. Hutson (Ed.), Rice chemistry and technology (1st ed., pp. 400–418). St. Paul, MN: American Association of Cereal Chemists.
Chandrasekhar, P. R., & Chattopadhyay, P. K. (1989). Heat transfer during fluidized bed puffing of rice grains. Journal of Food Process Engineering, 11, 147–157. http://dx.doi.org/10.1111/jfpe.1989.11.issue-2
Chandrasekhar, P. R., & Chattopadhyay, P. K. (1991). Rice puffing in relation to its varietal characteristics and processing conditions. Journal of Food Process Engineering, 14, 261–277. http://dx.doi.org/10.1111/jfpe.1991.14.issue-4
Chinnaswamy, R., & Bhattacharya, K. R. (1983a). Studies on expanded rice. Physicochemical basis of varietal-differences. Journal of Food Science, 48, 1600–1603. http://dx.doi.org/10.1111/jfds.1983.48.issue-6
Chinnaswamy, R., & Bhattacharya, K. R. (1983b). Studies on expanded rice. Optimum processing conditions. Journal of Food Science, 48, 1604–1608. http://dx.doi.org/10.1111/jfds.1983.48.issue-6
Chitra, M., Singh, V., & Ali, S. Z. (2010). Effect of processing paddy on digestibility of rice starch by in vitro studies. Journal of Food Science and Technology, 47, 414–419. http://dx.doi.org/10.1007/s13197-010-0068-3
Devi, K., & Geervani, P. (2000). Rice processing-effect on dietary fibre components and in vitro starch digestibility. Journal of Food Science and Technology, 37, 315–318.
Duncan, D. B. (1995). Multiple range and multiple F-tests. Biometrics, 11, 1–42.
Englyst, H. N., Kingman, S. M., & Cummings, J. H. (1992). Classification and measurement of nutritionally important starch fractions. European Journal of Clinical Nutrition, 46, S33–S50.
FAO. (2012). Retrieved June 30, 2012, from www.faostat.orgGoodman, D. E., & Rao, R. M. (1984). Amylose content and
puffed volume of gelatinized rice. Journal of Food Science, 49, 1204–1205. http://dx.doi.org/10.1111/jfds.1984.49.issue-4
Heinemann, R., Fagundes, P., Pinto, E., Penteado, M., & Lanfer-Marquez, U. (2005). Comparative study of nutrient composition of commercial brown, parboiled and milled rice from Brazil. Journal of Food Composition and Analysis, 18, 287–296. http://dx.doi.org/10.1016/j.jfca.2004.07.005

Page 13 of 14
Kamaraddi & Prakash, Cogent Food & Agriculture (2015), 1: 1112675http://dx.doi.org/10.1080/23311932.2015.1112675
Hoke, K., Jirina, H., & Houska, M. (2005). Optimum conditions of rice puffing. Czech Journal Food of Science, 23(1), 1–11.
Holm, J., Björck, I., Asp, N. G., Sjöberg, L. B., & Lundquist, I. (1985). Starch availability in vitro and in vivo after flaking, steam cooking and popping of wheat. Journal of Cereal Science, 3, 193–206. http://dx.doi.org/10.1016/S0733-5210(85)80013-8
Ibukun, E. O. (2008). Effect of prolonged parboiling duration on proximate composition of rice. Scientific Research and Essay, 3, 323–325.
Joshi, N. D., Mohapatra, D., & Joshi, D. C. (2014). Varietal selection of some Indica rice for production of puffed rice. Food Bioprocess Technology, 7, 299–305. http://dx.doi.org/10.1007/s11947-013-1056-1
Juliano, B. O., & Sukurai, J. (1985). Miscellaneous rice products. In B. O. Juliano (Ed.), Rice: Chemistry and technology (II ed., pp. 569–612). St. Paul, MN: American Association of Cereal Chemists.
Khatoon, N., & Prakash, J. (2006). Nutritional quality of microwave and pressure cooked rice (Oryza sativa) varieties. Food Science and Technology International, 12, 297–305. http://dx.doi.org/10.1177/1082013206068036
Kon, S., Wagner, J. R., Booth, A. N., & Robbins, D. J. (1971). Optimizing nutrient availability of legume food products. Journal of Food Science, 36, 635–639.
Kumari, M., Gupta, S., Lakshmi, A. J., & Prakash, J. (2004). Iron bioavailability in green leafy vegetables cooked in different utensils. Food Chemistry, 86, 217–222. http://dx.doi.org/10.1016/j.foodchem.2003.08.017
Luten, J., Crews, H., Flynn, A., Van Dael, P., Kastenmayer, P., Hurrell, R., … Frøhlich, W. (1996). Interlaboratory trial on the determination of the in vitro iron dialysability from food. Journal of the Science of Food and Agriculture, 72, 415–424. http://dx.doi.org/10.1002/(ISSN)1097-0010
Maisont, S., & Narkrugsa, W. (2009). Effects of some physicochemical properties of paddy rice varieties on puffing qualities by microwave. Kasetsart Journal, Natural Sciences, 43, 566–575.
Maisont, S., & Narkrugsa, W. (2010). Effects of salt, moisture content and microwave power on puffing qualities of puffed rice. Kasetsart Journal, Natural Sciences, 44, 251–261.
Mangala, S. L., Malleshi, N. G., Tharanathan, R. N., & Mahadevamma (1999). Resistant starch from differently processed rice and ragi (finger millet). European Food Research and Technology, 209, 32–37. http://dx.doi.org/10.1007/s002170050452
Miah, A., Haque, A., Douglass, M. P., & Clarke, B. (2002). Parboiling of rice. Part II: Effect of hot soaking time on the degree of starch gelatinization. International Journal of Food Science and Technology, 37, 539–545. http://dx.doi.org/10.1046/j.1365-2621.2002.00611.x
Mohapatra, D., & Bal, S. (2012). Physical properties of Indica rice in relation to some novel mechanical properties indicating grain characteristics. Food and Bioprocess Technology, 5, 2111–2119. http://dx.doi.org/10.1007/s11947-011-0539-1
Mohsenin, N. N. (1989). Physical properties of plant and animal materials (2nd ed.). New York, NY: Gordon and Breach Science.
Moraru, C. I., & Kokini, J. L. (2003). Nucleation and expansion during extrusion and microwave heating of cereal foods. Comprehensive Reviews in Food Science and Food Safety, 2, 147–165. http://dx.doi.org/10.1111/crfs.2003.2.issue-4
Mori, B. (1982). Contents of dietary fibre in some Japanese foods and the amount ingested through Japanese meals. Nutrition Reports International, 26, 159–166.
Nyman, M., & Asp, N. G. (1982). Fermentation of dietary fibre components in the rat intestinal tract. British Journal of Nutrition, 47, 361–366.
Nyman, M., Siljestrom, M., Pederson, B., Bachknudsen, K. E., Asp, N. G., Johanson, C. G., & Eggum, B. O. (1984). Dietary fibre content and composition in six cereals at different extraction rates. Cereal Chemistry, 61, 14–19.
O’ Dea, K., Snow, P., & Nestel, P. (1981). Rate of starch hydrolysis in vitro as a predictor of metabolic responses to complex carbohydrates in vivo. American Journal of Clinical Nutrition, 34, 1991–1993.
Oghbaei, M., & Prakash, J. (2010). Effect of cooking on nutritional quality of raw and parboiled rice. Indian Journal of Nutrition and Dietetics, 47, 188–199.
Panlasigui, L. N., Thompson, L. U., Juliano, B. O., Perez, C. M., Yiu, S. H., & Greenberg, G. R. (1991). Rice varieties with similar amylose content differ in starch digestibility and glycemic response in humans. American Journal of Clinical Nutrition, 54, 871–877.
Raghuramulu, N., Nair, M. K., & Kalyansundaram, S. (1983). A manual of laboratory techniques. Hyderabad: National Institute of Nutrition, ICMR, Jamai Osmania.
Ranganna, S. (1986). Handbook of analysis and quality control of fruits and vegetable products. New Delhi: Tata McGraw-Hill.
Reddy, S. N., Ingale, S. D., & Nalwade, V. (1997). In vitro availability of iron from green leafy vegetables cooked in different metallic utensils. The Indian Journal of Nutrition and Dietetics, 34, 173–177.
Siljeström, M., Eliasson, A. C., & Björck, I. (1989). Characterization of resistant starch from autoclaved wheat starch. Starch - Stärke, 41, 147–151. http://dx.doi.org/10.1002/(ISSN)1521-379X
Singh, N., Sodhi, N. S., Kaur, M., & Saxena, S. K. (2003). Physico-chemical, morphological, thermal, cooking and textural properties of chalky and translucent rice kernels. Food Chemistry, 82, 433–439. http://dx.doi.org/10.1016/S0308-8146(03)00007-4
Som, N., Mouliswar, P., Daniel, V., Malleshi, N., & Venkat Rao, S. (1992). Digestibility of protein and starch in malted weaning foods. Journal of Food Science and Technology, 29, 262–263.
Topping, D. L., Morson, Y., Jackson, K. A., Illman, R. J., & Trimble, C. R. P. (1991). Effects of cereals and cereal bran’s and some beans on large bowel volatile fatty acids in the pig. In D. J. Martin & C. W. Wrigley (Eds.), Proceedings of International Conference (pp. 384–387). Brisbane: Cereals International.
Varnamkhasti, M. G., Mobli, H., Jafari, A., Keyhani, A. R., Soltanabadi, M. H., Rafiee, S., & Kheiralipour, K. (2008). Some physical properties of rough rice (Oryza sativa L.) grain. Journal of Cereal Science, 47, 496–501. http://dx.doi.org/10.1016/j.jcs.2007.05.014
Villareal, C. P., & Juliano, B. O. (1989). Varietal differences in quality characteristics of puffed rices. Cereal Chemistry, 64, 337–342.
Webb, B. D., Pomeranz, Y., Afework, S., Lai, F. S., & Bollich, C. N. (1986). Rice grain hardness and its relationship to some milling, cooking, and processing characteristics. Cereal Chemistry, 63, 27–30.
WHO. (1992). The prevalence of anaemia in women: A tabulation of available information (2nd ed.). Geneva: WHO/MCH/MSM/92.2.

Page 14 of 14
Kamaraddi & Prakash, Cogent Food & Agriculture (2015), 1: 1112675http://dx.doi.org/10.1080/23311932.2015.1112675
© 2015 The Author(s). This open access article is distributed under a Creative Commons Attribution (CC-BY) 4.0 license.You are free to: Share — copy and redistribute the material in any medium or format Adapt — remix, transform, and build upon the material for any purpose, even commercially.The licensor cannot revoke these freedoms as long as you follow the license terms.
Under the following terms:Attribution — You must give appropriate credit, provide a link to the license, and indicate if changes were made. You may do so in any reasonable manner, but not in any way that suggests the licensor endorses you or your use. No additional restrictions You may not apply legal terms or technological measures that legally restrict others from doing anything the license permits.
Cogent Food & Agriculture (ISSN: 2331-1932) is published by Cogent OA, part of Taylor & Francis Group. Publishing with Cogent OA ensures:• Immediate, universal access to your article on publication• High visibility and discoverability via the Cogent OA website as well as Taylor & Francis Online• Download and citation statistics for your article• Rapid online publication• Input from, and dialog with, expert editors and editorial boards• Retention of full copyright of your article• Guaranteed legacy preservation of your article• Discounts and waivers for authors in developing regionsSubmit your manuscript to a Cogent OA journal at www.CogentOA.com