Embed Size (px)
Citation preview
Assessment of Target Volume and
Organ at Risk Contouring Variability
within the Context of UK Head and
Neck and Lung Cancer Radiotherapy
Clinical Trials
Candidate Name: John Richard Conibear
Candidate Number: 989904229
Institution Name: UCL
Degree: MD (Res)
Page | 2
I, Dr John Richard Conibear, confirm that the work presented in this thesis is my
own. Where information has been derived from other sources, I confirm that this
has been indicated in the thesis.
Signed: ………………………………………………………………………………………
Date: ………………………………………………………………………………………
Page | 3
Acknowledgements
I would like to express my sincere gratitude to the following individuals for their help,
motivation and support during my time spent in research. Without them this work would
not have been possible:
• Professor Peter Hoskin – my principle supervisor.
• Dr Roberto Alonzi – my secondary supervisor.
• Dr Emiliano Spetzi – for his help and advice in analysing my trial DICOM data.
• Yat Tsang – for helping direct me in the statistical analysis of my data and for his
support and knowledge as the RTTQA outlining and imaging sub-committee lead.
• Elizabeth Miles – for her help and guidance in relation to UK radiotherapy trial
quality assurance.
• Professor Christopher Nutting – for his permission to analyse the head and neck
trial benchmark cases.
• Dr David Landau – for his permission to analyse the IDEAL lung trial benchmark
cases.
• Dr Jason Lester – for his permission to analyse the i-START lung trial benchmark
cases.
Finally, my wife and family. Thank you for your continued understanding, encouragement
and support.
Page | 4
Abstract
Aims:
Radiotherapy quality assurance (RTQA) is now a requirement of radiotherapy trials
since poor target volume and organ at risk (OAR) contouring has been shown to
impact on patient outcomes within the context of clinical trials. The first hypothesis
for this research is that statistically significant inter-observer variation exists
amongst clinical oncologists’ target volume and OAR contours within the context of
the pre-trial quality assurance (QA) benchmark cases for four different UK
radiotherapy trials. The second hypothesis is directed towards confirming that
RTQA feedback during the pre-trial benchmark period does influence contouring for
head and neck cancers.
Materials/Methods:
Four radiotherapy trials (ART-DECO, COSTAR, IDEAL and i-START trials) that require
all prospective investigators to submit pre-accrual benchmark cases were selected.
All benchmark cases until November 2012 were collected in DICOM format. The
investigator contours were grouped into either target contours (TARGET) i.e. CTV1,
parallel OARs (OAR-P) i.e. parotid glands, lungs and heart or serial OARs (OAR-S) i.e.
brainstem, spinal cord and oesophagus. These were then analysed using a tumour
management group (TMG) consensus contour to determine whether statistically
significant differences existed between them. The local conformity index (L-CI) for
each structure was also calculated for analysis.
Results:
Analysis of the pre-trial benchmark cases revealed statistically significant
differences (p=<0.05) between clinical oncologists’ target volume, serial and parallel
OAR contours. Analysis of the resubmitted head and neck pre-trial benchmark cases
also revealed statistically significant differences between first and subsequent
submission contours.
Page | 5
Conclusions:
This research revealed that a statistically significant difference does exist in clinical
oncologists’ target volume and OAR contours within the pre-trial QA benchmark
cases for both lung and head and neck cancers. It was also revealed that RTQA
feedback during the pre-trial benchmark period had a positive and statistically
significant impact on head and neck clinician contouring.
Page | 6
Table of Contents
Acknowledgements .................................................................................................................... 3
Abstract ...................................................................................................................................... 4
Table of Contents ....................................................................................................................... 6
Table of Figures .......................................................................................................................... 7
Chapter 1: Introduction............................................................................................................ 10
Chapter 2: Materials and Methods .......................................................................................... 35
Chapter 3: Results of Inter-Observer Variation Analysis Between Target Volume,
Serial and Parallel OAR Outlines Within Two Head and Neck Clinical Trials ........................... 49
Chapter 4: Results of Inter-Observer Variation Analysis Between Target Volume,
Serial and Parallel OAR Outlines Within Two Lung Cancer Clinical Trials ................................ 59
Chapter 5: Results of The Head and Neck Pre-Trial Benchmark Case Resubmission
Analysis. .................................................................................................................................... 71
Chapter 6: Discussion ............................................................................................................... 80
Head and Neck Pre-Trial Benchmark Cases............................................................ 80
Lung Pre-Trial Benchmark Cases ............................................................................ 83
Impact of RTQA Feedback on Head and Neck Pre-Trial Benchmark Case
Resubmissions ........................................................................................................ 87
Chapter 7: Conclusions............................................................................................................. 89
Chapter 8: Future Work ........................................................................................................... 93
Appendix 1 ............................................................................................................................... 96
References ..............................................................................................................................104
Page | 7
Table of Figures
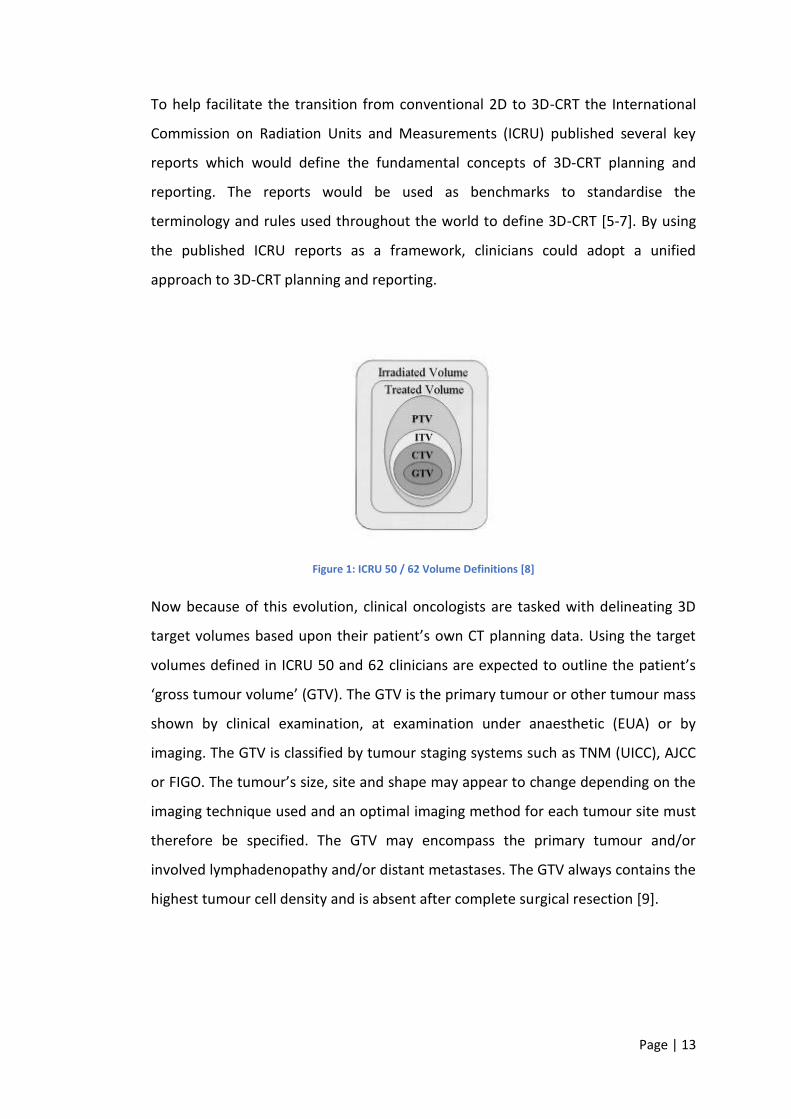
Figure 1: ICRU 50 / 62 Volume Definitions [8] ........................................................... 13
Figure 2: Two Volumes with Different Sizes but The Same Centre of Mass .............. 28
Figure 3: Example CT Slice from ARTDECO Contouring Exercise 1 Displaying TMG
Reference Contours (turquoise = body contour; light purple = CTV1 (high dose
volume); brown = CTV2 (low dose volume); yellow = spinal cord; green = right
parotid gland; pink = left parotid gland; dark purple = brainstem). .......................... 40
Figure 4: Example CT Slice from ARTDECO Contouring Exercise 2 Displaying TMG
Reference Contours (orange = body contour; dark red = GTV; yellow = CTV1 (high
dose volume); light blue = CTV2 (low dose volume); light red = right parotid gland;
purple = left parotid gland; brown = spinal cord; green = brainstem) ...................... 41
Figure 5: Example CT Slice from COSTAR Contouring Exercise Displaying TMG
Reference Contours (orange = CTV1 (high dose volume); yellow = CTV2 (low dose
volume); blue = spinal cord; purple = left parotid gland; red = brainstem) .............. 42
Figure 6: Example CT Slice from IDEAL / i-START Contouring Exercise 1 Displaying
IDEAL Reference Contours (dark yellow = body; green = GTV, dark red = CTV,
turquoise = PTV; dark purple = oesophagus; light yellow = spinal cord; blue = spinal
cord PRV; light red = heart; light purple = right lung; brown = left lung) .................. 43
Figure 7: Example CT Slice from IDEAL / i-START Contouring Exercise 2 Displaying
IDEAL Reference Contours (dark yellow = body; green = GTV, dark red = CTV,
turquoise = PTV; dark purple = oesophagus; light yellow = heart; blue = spinal cord
PRV; light red = spinal cord PRV; light purple = right lung; brown = left lung) .......... 44
Figure 8: A boxplot displaying the distribution of the DICE, JACCARD, RIET and 1-
GMI for OAR-P (parotid glands), OAR-S (spinal cord and brainstem) and TARGET
(high dose CTV1) ........................................................................................................ 52
Figure 9: L-CI Map for ART-DECO Pre-Trial Benchmark Case 2 CTV1 (No Conformity
i.e. contour not present (L-CI = 0.00); Poor conformity; Good conformity; Perfect
conformity (L-CI = 1.00)) ............................................................................................ 55
Page | 8
Figure 10: L-CI Map for COSTAR Pre-Trial Benchmark Case 1 Spinal Cord (No
Conformity i.e. contour not present (L-CI = 0.00); Poor conformity; Good conformity;
Perfect conformity (L-CI = 1.00)) ................................................................................ 56
Figure 11: L-CI Map for ART-DECO Pre-Trial Benchmark Case 2 Brainstem (No
Conformity i.e. contour not present (L-CI = 0.00); Poor conformity; Good conformity;
Perfect conformity (L-CI = 1.00)) ................................................................................ 57
Figure 12: L-CI Map for ART-DECO Pre-Trial Benchmark Case 1 Left Parotid (No
Conformity i.e. contour not present (L-CI = 0.00); Poor conformity; Good conformity;
Perfect conformity (L-CI = 1.00)) ................................................................................ 58
Figure 13: A boxplot displaying the distribution of the DICE, JACCARD, RIET and 1-
GMI for OAR-P (heart and lungs), OAR-S (spinal cord and oesophagus) and TARGET
(CTV) ........................................................................................................................... 61
Figure 14: A boxplot displaying the distribution of the DICE, JACCARD, RIET and 1-
GMI for individual structures analysed (heart, lung, oesophagus, spinal cord and
CTV) ............................................................................................................................ 64
Figure 15: L-CI Map for IDEAL Pre-Trial Benchmark Case 2 CTV1 (No Conformity i.e.
contour not present (L-CI = 0.00); Poor conformity; Good conformity; Perfect
conformity (L-CI = 1.00)) ............................................................................................ 66
Figure 16: L-CI Map for IDEAL Pre-Trial Benchmark Case 2 Spinal Cord (No
Conformity i.e. contour not present (L-CI = 0.00); Poor conformity; Good conformity;
Perfect conformity (L-CI = 1.00)) ................................................................................ 67
Figure 17: L-CI Map for IDEAL Pre-Trial Benchmark Case 1 Oesophagus (No
Conformity i.e. contour not present (L-CI = 0.00); Poor conformity; Good conformity;
Perfect conformity (L-CI = 1.00)) ................................................................................ 68
Figure 18: L-CI Map for IDEAL Pre-Trial Benchmark Case 1 Heart (No Conformity i.e.
contour not present (L-CI = 0.00); Poor conformity; Good conformity; Perfect
conformity (L-CI = 1.00)) ............................................................................................ 69
Figure 19: L-CI Map for i-START Pre-Trial Benchmark Case 1 Left Lung (No
Conformity i.e. contour not present (L-CI = 0.00); Poor conformity; Good conformity;
Perfect conformity (L-CI = 1.00)) ................................................................................ 70
Figure 20: Analysis of 1st and final submission DICE indice for Target, OAR-S and
OAR-P Contours.......................................................................................................... 75
Page | 9
Figure 21: Analysis of 1st and final submission JACCARD indice for Target, OAR-S
and OAR-P Contours................................................................................................... 76
Figure 22: Analysis of 1st and final submission RIET indice for Target, OAR-S and
OAR-P Contours.......................................................................................................... 77
Figure 23: Analysis of 1st and final submission 1-GMI indice for Target, OAR-S and
OAR-P Contours.......................................................................................................... 78
Figure 24: Impact of RTQA Feedback on an Individual Clinician Contouring
Demonstrated Using L-CI Data During The ART-DECO Trial (No Conformity i.e.
contour not present (L-CI = 0.00); Poor conformity; Good conformity; Perfect
conformity (L-CI = 1.00)) ............................................................................................ 79
Figure 25: Example to Show How an Individual PI’s L-CI Data for Several Structures
Changes Over the Course of Three Submissions (ART-DECO Trial) (No Conformity i.e.
contour not present (L-CI = 0.00); Poor conformity; Good conformity; Perfect
conformity (L-CI = 1.00)) .......................................................................................... 103
Page | 10
Chapter 1: Introduction
The terms accuracy and precision are used in the context of measurement.
Accuracy refers to the degree of conformity and correctness of something when
compared to a true or absolute value. Precision on the other hand describes the
variation you see when you measure the same part repeatedly using the same
device.
Observer variation is the failure of an observer to measure or identify a
phenomenon precisely which in turn results in an error. Two types of observer
variation exist, inter and intra; inter-observer variation is the difference that exists
between different individuals assessing the same information and intra-observer
variation is the difference that exists when one individual assesses the same
information but on more than one occasion.
Both types of observer variation exist in all aspects of medicine. Clinical oncology as
a sub-specialty is not immune from observer variation as it relies upon a clinician’s
own interpretation of clinical and radiological data when making treatment
decisions. Sources of error in clinical oncology can include the observer missing an
abnormality i.e. incorrectly identifying the true extent of a patient’s tumour, the
use of erroneous techniques or imprecise tools resulting in incorrect
measurements, or simply the misinterpretation of the data itself i.e. misinterpreting
normal tissues as being abnormal.
One of the principle tasks clinical oncologists perform in the era of 3D conformal
radiotherapy is the delineation of the patient’s tumour, termed the target volume,
and the delineation of normal organs around the tumour, which are termed the
organs at risk (OAR). Clinicians delineate these structures on computers using
radiotherapy treatment planning software. This task is potentially prone to both
inter and intra-observer variability depending upon the clinical circumstances [1].
The first hypothesis of this research is to confirm whether a statistically significant
difference in inter-observer variation also exists between oncologist’s target
Page | 11
volume and OAR contouring within the clinical trial benchmarking period for lung
and head and neck cancers. This hypothesis will be tested by quantifying inter-
observer variation amongst participating UK head and neck and lung cancer clinical
oncologists by analysing their pre-trial benchmark QA target volume and OAR
contours. It also aims to demonstrate that RTQA feedback during the pre-trial
benchmark period helps to reduce inter-observer variation in target volume and
organ at risk contours by analysing resubmission benchmark data.
This research will not assess intra-observer variation as strictly speaking the re-
submissions were not true intra-observer re-assessments but were driven instead
by specific advice and feedback from the respective trials RTQA teams.
Recent Advances in Radiotherapy
Over the last 50 years’ external beam radiotherapy (EBRT) has undergone
refinement through the discovery of X-ray computed tomography (CT) and
advances in linear accelerator design. Up until the early 1990s curative external
beam radiotherapy for cancer patents was typically planned and delivered using a
2-dimensional technique usually termed ‘conventional radiotherapy’. This
technique meant that the patient’s underlying cancer and a significant proportion
of their surrounding normal tissue was encompassed within a typically box shaped
radiation field. Due to the uncertainties of tumour location and organ movement,
shielding of normal tissue was relatively minimal. This of course meant that the
volume of normal tissue treated was great and that patients often developed
significant acute toxicities [2]. Because of these toxicities patients were often
unable to tolerate radiotherapy doses more than 67-70Gy when delivered using
conventional radiotherapy.
The discovery of CT imaging and its integration into radiotherapy planning during
the 1980s led to the creation of 3D conformal radiotherapy (3D-CRT) [3]. This term
describes how the linear accelerator performs complex beam shaping to conform
the X-rays to match the outline of the patient’s tumour on the patient’s treatment-
planning scan. Conforming the beams also helps to minimise the dose of radiation
delivered to the patient’s normal organs.
Page | 12
Initial studies comparing conventional radiotherapy to 3D-CRT found that 3D-CRT
helped reduce toxicity whilst maintaining disease control. One phase III randomised
controlled trial comparing 3D-CRT with conventional radiotherapy using a standard
dose of 64Gy to treat prostate cancer showed a significant reduction in the dose
limiting late side effect of proctitis with no impact on disease control when using
3D-CRT [4].
More recent advances in 3D treatment planning software and computer-controlled
linear accelerators has led to the creation of a high precision form of 3D-CRT
termed ‘intensity modulated radiotherapy’ (IMRT). Using IMRT, physicists can
deliver precise radiation doses to a tumour whilst minimising the dose to
surrounding normal tissues by planning more complex treatments utilising an
increased number of X-ray beams, sometimes as many as 9. IMRT planning permits
an even higher level of dose conformity to be achieved.
The adoption of IMRT and inverse planning techniques has allowed clinicians to
increase the dose delivered to the patient’s cancer whilst maintaining acceptably
low doses of radiation to the patient’s normal intracranial, intrathoracic, abdominal
or pelvic organs. The advent of 3D-CRT, and now more recently IMRT, has helped to
reduce the incidence of both the acute and late toxicity commonly associated with
radical radiotherapy. These new radiotherapy treatment techniques have also
permitted the exploration of dose escalation in the radical treatment of many
different tumour sub-types.
The Role of the Modern Clinical Oncologist
Over the past century, the role of the clinical oncologist has also evolved as a direct
result of the advances made in radiotherapy planning and delivery. The transition
from 2D conventional to 3D-CRT planning saw radical changes about the clinical
oncologist’s role in target volume delineation. Clinicians who bridged this transition
had to adapt and learn entirely new skills and concepts to be able to fully embrace
the 3D-CRT era.
Page | 13
To help facilitate the transition from conventional 2D to 3D-CRT the International
Commission on Radiation Units and Measurements (ICRU) published several key
reports which would define the fundamental concepts of 3D-CRT planning and
reporting. The reports would be used as benchmarks to standardise the
terminology and rules used throughout the world to define 3D-CRT [5-7]. By using
the published ICRU reports as a framework, clinicians could adopt a unified
approach to 3D-CRT planning and reporting.
Figure 1: ICRU 50 / 62 Volume Definitions [8]
Now because of this evolution, clinical oncologists are tasked with delineating 3D
target volumes based upon their patient’s own CT planning data. Using the target
volumes defined in ICRU 50 and 62 clinicians are expected to outline the patient’s
‘gross tumour volume’ (GTV). The GTV is the primary tumour or other tumour mass
shown by clinical examination, at examination under anaesthetic (EUA) or by
imaging. The GTV is classified by tumour staging systems such as TNM (UICC), AJCC
or FIGO. The tumour’s size, site and shape may appear to change depending on the
imaging technique used and an optimal imaging method for each tumour site must
therefore be specified. The GTV may encompass the primary tumour and/or
involved lymphadenopathy and/or distant metastases. The GTV always contains the
highest tumour cell density and is absent after complete surgical resection [9].
Page | 14
Any areas considered at risk of subclinical invasion are termed the ‘clinical target
volume’ (CTV) and will normally encompass the GTV when one is still present (see
Figure 1 above). The definition of the CTV is based on the histological analysis of
post-surgical and post mortem tumour specimens. These specimens were analysed
to determine the extent of tumour cell spread around the gross GTV as described
by Holland et al. [10]. The GTV-CTV margin is also derived from the biological
characteristics of the tumour, patterns of local tumour recurrence and the
experience of the treating oncologist. Manual editing of the CTV margin is therefore
allowed to account for these factors and anatomical barriers to tumour spread. An
appropriate margin is then added to the CTV to create a ‘planning target volume’
(PTV). The PTV margin accounts for intra and inter-fractional changes in tumour
size, location, variations in patient positioning and changes in alignment of the
treatment beams (setup margin).
Any normal organs within or near to the treatment area should receive as low a
dose of radiation as possible [6, 7]. These normal organs are termed the ‘organs at
risk’ (OAR) and change depending upon the site within the patient’s body that is
being irradiated. The ICRU report described OARs as having distinct tissue
architectures; serial OARs, for example, the spinal cord, have a high relative seriality
implying that dose above a tolerance limit, even to a small volume, impairs the
function of the entire OAR; parallel OARs, for example, the lungs, have a low
relative seriality where the main parameter impairing the organ’s function is the
proportion of the OAR receiving a dose above a specified tolerance. In reality
though, many organs have tissue architecture with both high and low seriality
components.
This modern, individualised, three or four-dimensional approach to radiotherapy
planning now depends heavily on the clinician’s own interpretation of radiological
cross-sectional anatomy and requires clinicians to differentiate between ‘normal’
and ‘abnormal’ body tissues. This of course makes the process of target volume
delineation highly observer dependent and at significant risk of inter and intra-
observer variation.
Page | 15
Variation in CTV delineation by the clinician is the greatest geometric uncertainty in
the whole treatment process. Studies conducted comparing the outlines of
radiologists with clinical oncologists have shown significant inter-observer
variability for both the GTV and/or CTV for multiple different tumour sub-sites. The
magnitude of this inter-observer variability has also shown to be greater than any
intra-observer variation [9]. Improvements can be made through training in cross-
sectional anatomy which enables clinicians to distinguish normal structures more
clearly e.g. blood vessels from lymph nodes, and to identify the extent of structures
more accurately on cross sectional imaging i.e. the oesophagus on CT or MRI. Joint
outlining by an oncologist and a radiologist can also help improve consistency and
the use of consensus guidelines such as the head and neck nodal atlas by Gregoire
et al. or the pelvic nodal atlas by Taylor et al. can improve the reproducibility of CTV
delineation significantly [11, 12].
Ensuring Quality and Safety in Modern Radiotherapy Delivery
Modern radiotherapy bears little resemblance to its early form despite relying upon
the same fundamental scientific principles. Twenty first century practitioners of
radiation therapy can now use CT plus the possibility of other diagnostic imaging
technologies to delineate a 3D target which is representative of the patient’s cancer
whilst observing its relation to the normal tissues surrounding it. With the ability
now to also integrate real time imaging into the radiotherapy treatment process it
is now also possible to track the tumour within the patient body to ensure the
target is not ‘missed’ during the radiation treatment if it moves.
Consequently, radiotherapy departments now rely upon advanced computer
technology and highly skilled clinical and non-clinical staff to target and deliver
radiotherapy treatments. These technological advances though have led to
increasingly complex processes which in themselves increase the risk of human and
technological errors. To ensure patients are treated safely and accurately new
systems and checks have had to be designed to minimise these risks; both
technological and human. At every point now in the patient’s treatment pathway
Page | 16
checks are in place to help minimise error to ensure that patients receive the
highest quality of care.
UK hospitals are governed by strict legislation which outlines the safe
implementation and utilisation of radiation; the Ionising Radiation Regulations 1999
(IRR 1999) and the Ionising Regulations (Medical Exposure) Regulations 2000
(IRMER 2000) [13-15]. These regulations define how radiation in the context of
medicine should be safely managed to ensure patients, public and staff are not
exposed to radiation unnecessarily. These regulations form the cornerstone of
radiation protection within UK hospitals. With the ongoing advancement in
radiotherapy treatment technology and delivery techniques clear guidance is
needed to ensure clarity within radiotherapy departments internationally. This is
achieved through regular publications from the International Commission on
Radiation Units and Measurements (ICRU). Their publications on measurements,
prescribing, recording and reporting of photon beam therapy ensures unity of
standards internationally [6, 7, 16, 17].
Nationally bodies such as the Royal College of Radiologists (RCR) also play an
important role in improving modern radiotherapy standards. They have published
guidance on a variety of important topics aimed at improving UK radiotherapy
standards; for instance, their publication ‘On Target: Ensuring Geometric Accuracy
in Radiotherapy’ which explains the significance of systematic and random errors
typically associated with 3D-CRT radiotherapy. This particular publication provides
clear guidance on what can be done to minimise errors and improve the accuracy
and reproducibility of modern radiotherapy delivery [18]. A combination of
international guidance, national government regulations, published guidance from
important bodies and the skilled training of hospital staff that provides the basis for
modern radiotherapy services in the UK.
Target Volume Delineation Accuracy and Inter-Observer Variation
With the advent of 3D-CRT and its evolution to IMRT, modern radiotherapy now
allows us to achieve optimal dose coverage of treatment target volumes.
Consequently, it is of critical importance that target volumes are delineated
Page | 17
accurately to ensure adequate dose coverage whilst minimising dose to normal
surrounding tissues. Even prior to 3D-CRT, inter-observer variation had been found
to exist in 2D conventional planning [19].
Grabarz et al. conducted a study to describe the degree of inter and intra-observer
variability in target and field definition when using 3D volume vs. 2D field-based
planning. The study utilised 9 palliative cases (3 bone metastases, 3 palliative lung
cases and 3 abdominal pelvis soft-tissue masses) which were given to 5 radiation
oncologists participating within the study. The radiation oncologists were asked to
create two sets of treatment fields, one using a 2D field-based approach and the
second using a 3D volume-based approach. Once created, the 2D and 3D volumes
were analysed for inter and intra-observer variations in target definition by
determining the percentage overlap, under-coverage and over-coverage. The study
found that the degree of inter-observer variation for 2D and 3D planning was
similar with a degree of overlap of 76% (range 56% - 85%) and 74% (range 55% -
88%) respectively. Comparison of the 2D and 3D treatment fields defined by the
same clinicians revealed a mean degree of overlap of 78%; over-coverage was 22%
and under-coverage, 41%. Statistically there was significantly more under-coverage
when field-based planning was used for bone metastases (33%) compared with the
other anatomical sites studied. The author, based on their findings, concluded that
2D planning is more likely to result in geographic misses in bone metastases
compared with other areas and that clinically significant inter and intra-observer
variation exists in palliative radiotherapy planning [19].
Due to the increased complexity of 3D conformal target volume delineation it
comes as no surprise that studies examining inter-observer variation during the 3D
outlining process have found significant inter-observer variation in target volume
outlines [19-28].
Wachter et al. examined the benefits of integrating axial and sagittal MRI into
prostate contouring on CT with the aim of improving localisation of the prostatic
apex through an inter-observer analysis. The study found that the apex of the
prostate could be discriminated more easily using the MRI rather than the CT with
Page | 18
best judgement seen using the sagittal MRI sequences. The inter-observer variation
for the definition of the prostate apex was smaller and statistically significant
(p=0.009) for the sagittal MRI compared to the axial MRI and CT. They concluded
that the addition of MRI provides superior anatomical information for the purposes
of target outlining and thereby helps to avoid the unnecessary irradiation of healthy
tissues [20]. A similar study by Cattaneo et al. looked at target delineation in post-
operative radiotherapy of brain gliomas and the impact image registration of pre-
operative MR on treatment planning CT scans had on inter-observer variability.
They also concluded that the use of CT and MR registered imaging reduced inter-
observer variability in target volume delineation for post-operative irradiation of
high grade gliomas and that smaller margins around target volume could be
adopted in defining irradiation technique [23].
A study conducted by Wu et al. looked at inter-observer variation in cervical cancer
tumour delineation for image-based radiotherapy planning among and within
different specialties and found that despite the improvements MRI imaging could
bring to the resolution and definition of anatomical structures there was still
“human” variations which could overshadow the gains made from these
technological advancements [21]. The challenges noted for tumour delineation in
this study included partial voluming by parametrial fat at the periphery of the
uterus; (2) extension of the tumour into parametrial space; (3) similar signal
intensity of structures proximal to the tumour such as ovaries, muscles, bladder
wall, bowel loops, and pubic symphysis; (4) post-radiation changes such as
heterogeneity and necrosis; (5) susceptibility artefacts from bowels and vaginal
tampons; (6) presence of other pathologies such as atypical myoma; (7) factors that
affect pelvic anatomy, including the degree of bladder distension, bowel
interposition, uterine malposition and retroversion [21]. The conclusion of the
author, based on their study findings, was that strategies needed to be developed
for standardization and training in tumour delineation [21].
A systematic review conducted by Loo et al. evaluating inter-observer variation in
parotid gland delineation and its impact on intensity-modulated radiotherapy
solutions also found that significant inter-observer variation exists in parotid gland
Page | 19
delineation in the context of head and neck radiotherapy planning [22]. Their study
found that almost half of the contours (46%) produced by the participating
radiation oncologists and radiologists were sufficiently different enough from the
contour used clinically to have necessitated a different IMRT plan if used. This study
helps to highlight the impact normal organ outlining can have on radiotherapy
planning and the study team concluded that strategies, such as consistent
guidelines, were needed to improve inter-observer consistency in parotid gland
delineation [22].
A study by Lorenzen et al. has specifically looked at the impact of guidelines on the
degree of inter-observer variation in the delineation of the heart and left anterior
descending coronary artery (LADCA) in the context of breast radiotherapy planning
[24]. Their study found that common guidelines for the delineation of the heart and
LADCA helped reduce spatial variation in the heart and length of LAD contoured
which helped to reduce inter-observer variation and consequently the mean and
maximum estimated radiotherapy doses to the heart [24].
Therefore to help improve both target volume and normal organ delineation
accuracy and thereby reduce inter-observer variation a number of successful
strategies have been examined including the use of contrast [29, 30], the use of
fiducial markers [31], the addition of complimentary imaging modalities such as
FDG-PET [32] and MRI [33], the aid of a dedicated diagnostic radiologist during
target volume delineation [30, 34] and the use of protocols which define precisely
how structures should be accurately delineated [35-37]. These studies have
revealed that that implementing such strategies can improve target volume
accuracy and reduce inter-observer variation. Failure though to incorporate such
strategies has also been shown to impact negatively on patient outcomes and none
more so than trial protocol compliance.
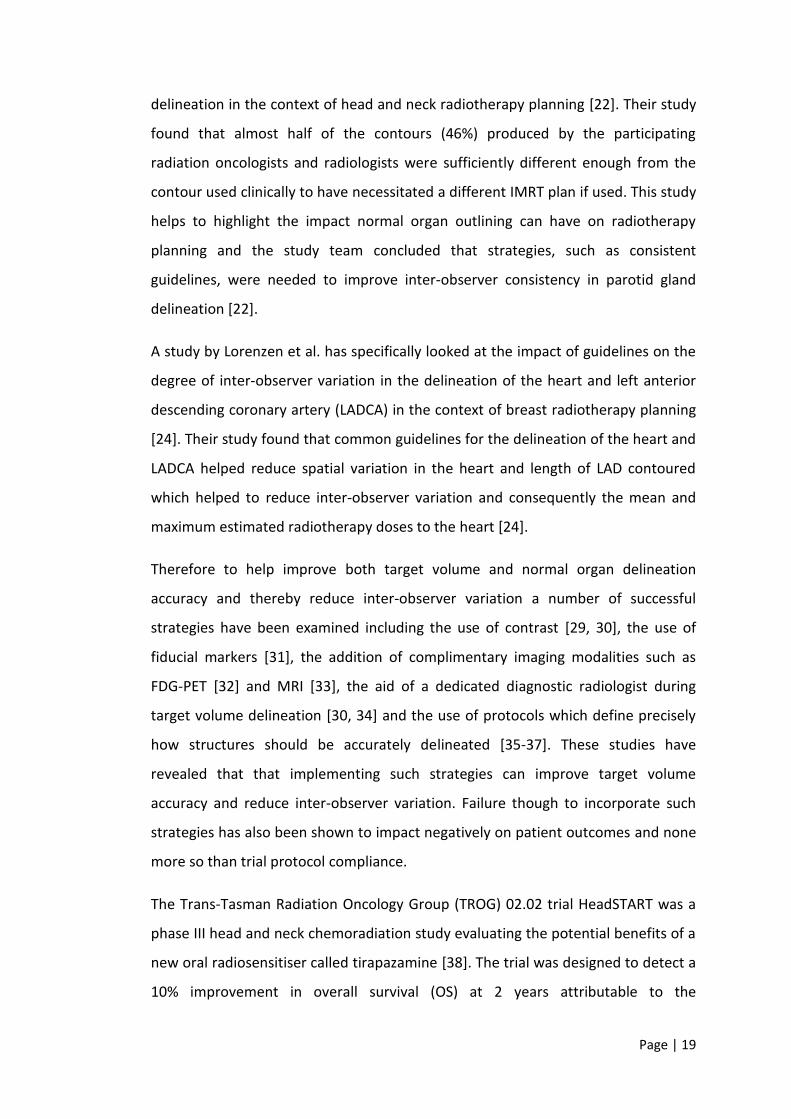
The Trans-Tasman Radiation Oncology Group (TROG) 02.02 trial HeadSTART was a
phase III head and neck chemoradiation study evaluating the potential benefits of a
new oral radiosensitiser called tirapazamine [38]. The trial was designed to detect a
10% improvement in overall survival (OS) at 2 years attributable to the
Page | 20
tirapazamine. Patients with squamous cell carcinoma of the head and neck were
randomised to either tirapazamine, cisplatin and radiotherapy or cisplatin and
radiotherapy alone. The radiotherapy in both arms was to be delivered using
standard treatment fields and IMRT was not permitted.
The trial was designed so that once a patient’s radiotherapy planning had been
completed it was to be submitted to the Quality Assurance Review Centre (QARC)
for interventional review before the end of the first week of the patient’s
radiotherapy treatment. The QARC would then provide feedback to the submitting
centre on whether the plan was compliant with the trial protocol. If not the QARC
would advise on appropriate modifications to the plan to make it compliant and
then for the plan to be re-submitted. This system of radiotherapy quality assurance
(QA) was a semi-prospective one to ensure protocol compliance early in the
patient’s treatment. Once the patient had completed their radiotherapy treatment
all the patient’s radiotherapy data was re-submitted for further retrospective
review by the tumour management group (TMG).
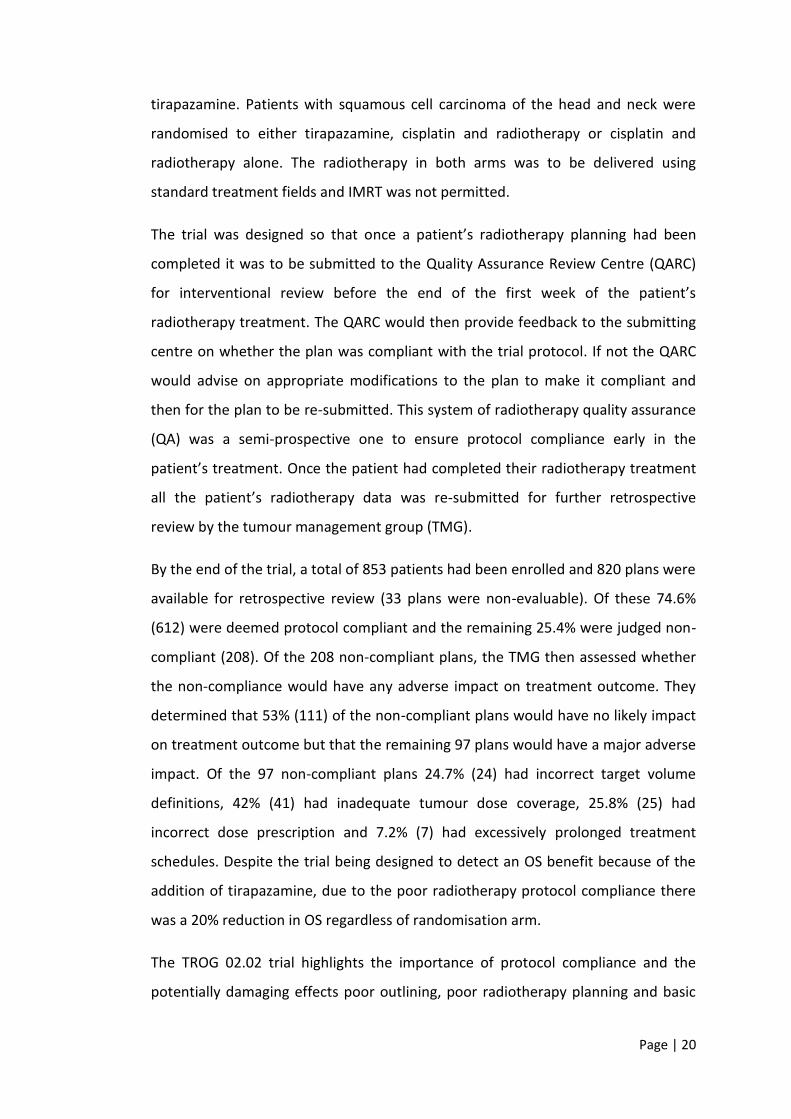
By the end of the trial, a total of 853 patients had been enrolled and 820 plans were
available for retrospective review (33 plans were non-evaluable). Of these 74.6%
(612) were deemed protocol compliant and the remaining 25.4% were judged non-
compliant (208). Of the 208 non-compliant plans, the TMG then assessed whether
the non-compliance would have any adverse impact on treatment outcome. They
determined that 53% (111) of the non-compliant plans would have no likely impact
on treatment outcome but that the remaining 97 plans would have a major adverse
impact. Of the 97 non-compliant plans 24.7% (24) had incorrect target volume
definitions, 42% (41) had inadequate tumour dose coverage, 25.8% (25) had
incorrect dose prescription and 7.2% (7) had excessively prolonged treatment
schedules. Despite the trial being designed to detect an OS benefit because of the
addition of tirapazamine, due to the poor radiotherapy protocol compliance there
was a 20% reduction in OS regardless of randomisation arm.
The TROG 02.02 trial highlights the importance of protocol compliance and the
potentially damaging effects poor outlining, poor radiotherapy planning and basic
Page | 21
errors in dose prescriptions can have on patient survival. Unfortunately, the TROG
02.02 trial is not the only one to highlight these problems. More recently Abrams et
al. showed that in the Radiation Oncology Group (RTOG) 9704 study which looked
at the potential benefits of chemotherapy and chemoradiotherapy in patients who
had had resected pancreatic tumours, that deviation from the radiotherapy trial
protocol resulted in inferior survival in patients [39].
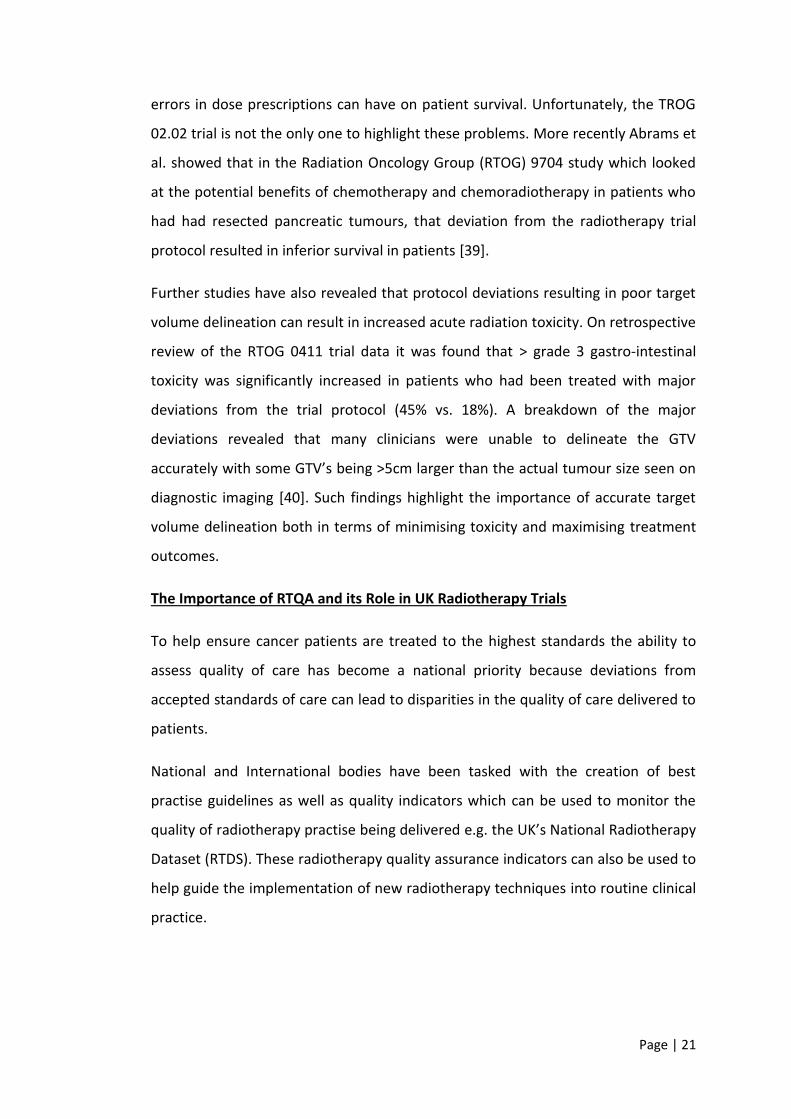
Further studies have also revealed that protocol deviations resulting in poor target
volume delineation can result in increased acute radiation toxicity. On retrospective
review of the RTOG 0411 trial data it was found that > grade 3 gastro-intestinal
toxicity was significantly increased in patients who had been treated with major
deviations from the trial protocol (45% vs. 18%). A breakdown of the major
deviations revealed that many clinicians were unable to delineate the GTV
accurately with some GTV’s being >5cm larger than the actual tumour size seen on
diagnostic imaging [40]. Such findings highlight the importance of accurate target
volume delineation both in terms of minimising toxicity and maximising treatment
outcomes.
The Importance of RTQA and its Role in UK Radiotherapy Trials
To help ensure cancer patients are treated to the highest standards the ability to
assess quality of care has become a national priority because deviations from
accepted standards of care can lead to disparities in the quality of care delivered to
patients.
National and International bodies have been tasked with the creation of best
practise guidelines as well as quality indicators which can be used to monitor the
quality of radiotherapy practise being delivered e.g. the UK’s National Radiotherapy
Dataset (RTDS). These radiotherapy quality assurance indicators can also be used to
help guide the implementation of new radiotherapy techniques into routine clinical
practice.
Page | 22
In terms of radiotherapy clinical trials, deviations from accepted standards of care
can also have direct and important implications on clinical trial outcomes and can
potentially confound the question the study has been designed to address.
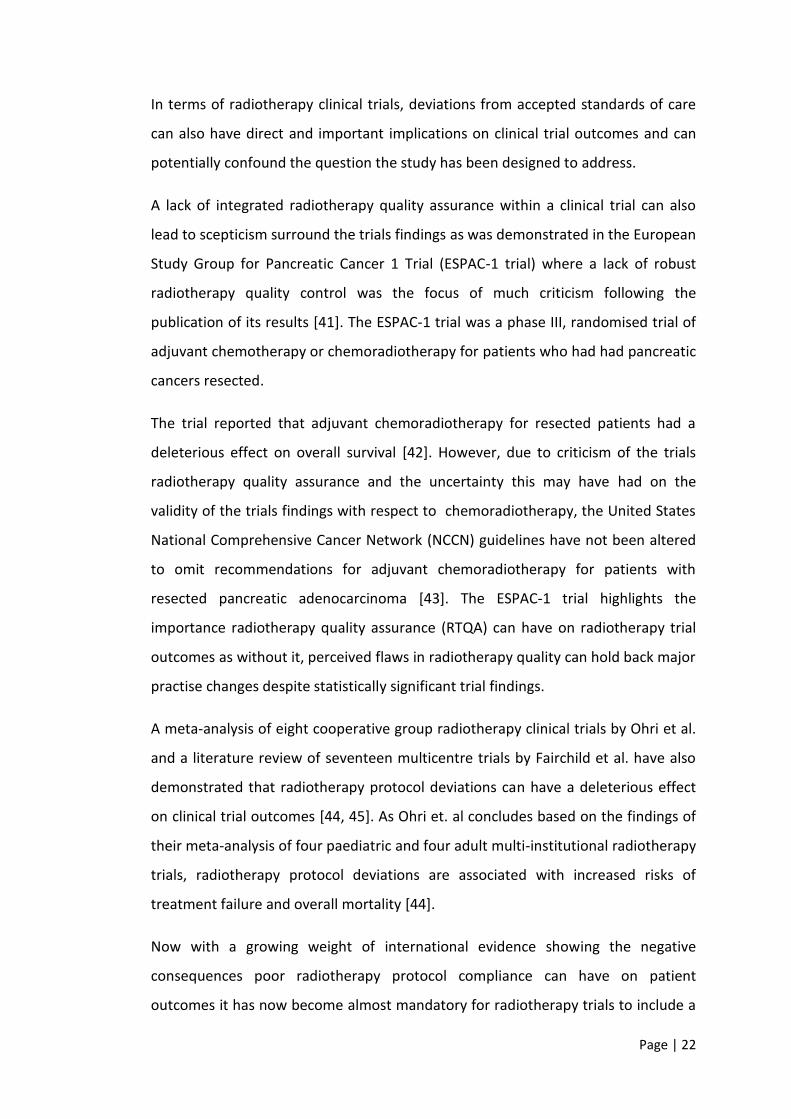
A lack of integrated radiotherapy quality assurance within a clinical trial can also
lead to scepticism surround the trials findings as was demonstrated in the European
Study Group for Pancreatic Cancer 1 Trial (ESPAC-1 trial) where a lack of robust
radiotherapy quality control was the focus of much criticism following the
publication of its results [41]. The ESPAC-1 trial was a phase III, randomised trial of
adjuvant chemotherapy or chemoradiotherapy for patients who had had pancreatic
cancers resected.
The trial reported that adjuvant chemoradiotherapy for resected patients had a
deleterious effect on overall survival [42]. However, due to criticism of the trials
radiotherapy quality assurance and the uncertainty this may have had on the
validity of the trials findings with respect to chemoradiotherapy, the United States
National Comprehensive Cancer Network (NCCN) guidelines have not been altered
to omit recommendations for adjuvant chemoradiotherapy for patients with
resected pancreatic adenocarcinoma [43]. The ESPAC-1 trial highlights the
importance radiotherapy quality assurance (RTQA) can have on radiotherapy trial
outcomes as without it, perceived flaws in radiotherapy quality can hold back major
practise changes despite statistically significant trial findings.
A meta-analysis of eight cooperative group radiotherapy clinical trials by Ohri et al.
and a literature review of seventeen multicentre trials by Fairchild et al. have also
demonstrated that radiotherapy protocol deviations can have a deleterious effect
on clinical trial outcomes [44, 45]. As Ohri et. al concludes based on the findings of
their meta-analysis of four paediatric and four adult multi-institutional radiotherapy
trials, radiotherapy protocol deviations are associated with increased risks of
treatment failure and overall mortality [44].
Now with a growing weight of international evidence showing the negative
consequences poor radiotherapy protocol compliance can have on patient
outcomes it has now become almost mandatory for radiotherapy trials to include a
Page | 23
comprehensive package of quality assurance [44-46]. As already mentioned, the
TROG 02.02 study and others have highlighted the critical impact of protocol
compliance on the treatment of advanced head and neck cancers. The TROG 02.02
study showed that major deficiencies in radiotherapy treatment plans resulted in a
20% decrease in overall survival regardless of randomisation arm [38].
In the United Kingdom (UK) the National Cancer Research Institute (NCRI)
Radiotherapy Trials Quality Assurance (RTTQA) Group has been tasked with
ensuring that all participants in NCRI badged trials adhere to the relevant trial
protocol [47]. The RTTQA group achieves this through a program of activities
tailored towards the clinical trials objectives. Since its inception, the RTTQA group
has developed its program of QA activities to account for new techniques and
advances in planning and delivery systems. When first established the focus of trial
QA was predominantly treatment machine focused but over the past decade this
has developed to include all aspects of radiotherapy delivery from target volume
delineation to IMRT verification. Before a centre can participate in a UK NCRI trial
they are required to complete all steps of the trial specific RTTQA accreditation
process. This accreditation process now typically includes pre-trial benchmark
outlining cases which have been designed to ensure clinicians are following the
guidance set out in the trial protocol.
The addition of pre-trial benchmark cases to the activities performed by the RTTQA
group has meant that new systems have had to be developed to robustly assess
participating trial centres prior to trial patient recruitment. These robust systems
have been designed to ensure participating clinicians meet the minimum standards
of target volume delineation for that trial. To this end, the pre-trial benchmark
cases are focused upon ensuring clinicians can achieve a minimum standard and
consequently all modern NCRI trials have adopted this strategy.
In the UK, all NCRI trial pre-trial benchmark cases are available for download from
the RTTQA’s website. All centres wishing to participate in a trial are expected to
download and complete them before they are permitted to recruit patients into the
trial. Once a centre has submitted their completed cases for review they are
Page | 24
assessed by the trials own QA team which typically comprises of one or more
expert clinicians from the trials TMG plus one or more members of the RTTQA
group who have been assigned to oversee the QA specific activities of the trial. The
duties of the QA team include ensuring that the submitting clinician has followed
the instruction contained within the outlining protocol to construct their target
volumes and normal tissue structures. If after review by the QA team it is felt that
improvements could be made, then constructive feedback is produced by the QA
team and sent back to the trial centre to help them re-evaluate their contours prior
to them re-submitting them. This process is normally repeated until it is felt by the
central QA team that the centre has met the minimum QA requirements of the trial.
Measuring Target Volume and Normal Tissue Inter-Observer Variability
In the past, most UK pre-trial outlining benchmark case assessments were
performed by direct visual inspection of all submitted contours by the central QA
team. More recently a system of pre-trial benchmark quality assurance utilising a
‘gold standard’ contour set has been adopted. This method relies upon the creation
of reference set of contours termed the ‘gold standard’. These ‘gold standard’
reference contours can be created in either one of two ways; either by an expert
individual or through the consensus agreement of a panel of expert clinicians [48-
53]. This latter technique now seems to be the more common method of defining
the reference or ‘gold standard’ contours although the former method continues.
The benefit of having a pre-defined set of reference contours is that all submitted
pre-trial benchmark contours can now be quickly and easily compared against the
reference set either visually or using more advanced computer software which can
measure different conformity indices.
Conformity indices (CIs) are numerical metrics calculated using mathematical
formulae which define concordance based on variations in volume and spatial
relationships [54]. Simply put they are a measurement of the common volume
included in 2 volumes or a comparison of a common or consensus volume of
several volumes with each of the constituent volumes [27].
Page | 25
A systematic review looking at the geometrical analysis of radiotherapy target
volume delineation conducted by Hanna et al. in 2010 found a total of 63 published
studies which used either simple volume metrics or CIs to compare target volumes.
The review found that the majority of published studies (84%) relied upon simple
volume measurements when comparing target structures and only 30% of the
studies utilised CIs when comparing radiotherapy volumes [55].
The problem with simple volume measurements is that unlike CIs they do not give
you any information on the spatial relationship between two volumes i.e. the
common volume included in both radiotherapy volumes. The spatial relationship
between two volumes; where A is, the investigator outline and B is the gold
standard outline, can be analysed in several different ways depending upon the CI
used.
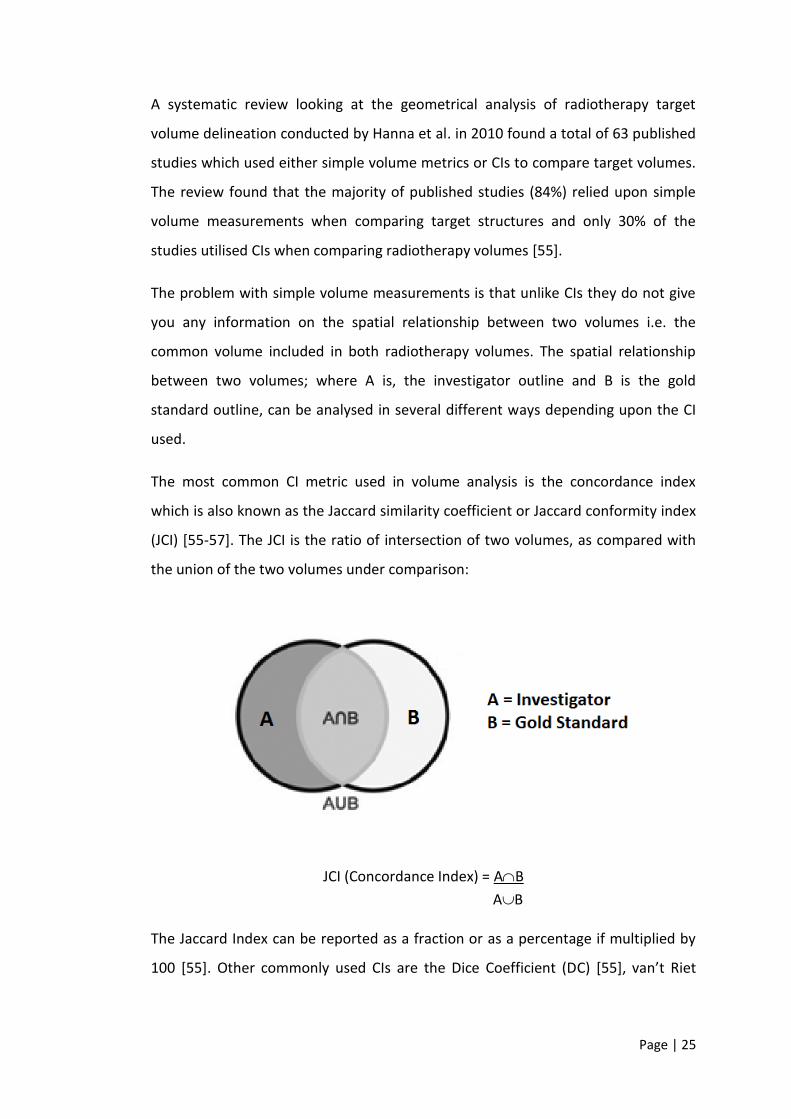
The most common CI metric used in volume analysis is the concordance index
which is also known as the Jaccard similarity coefficient or Jaccard conformity index
(JCI) [55-57]. The JCI is the ratio of intersection of two volumes, as compared with
the union of the two volumes under comparison:
JCI (Concordance Index) = AB
AB
The Jaccard Index can be reported as a fraction or as a percentage if multiplied by
100 [55]. Other commonly used CIs are the Dice Coefficient (DC) [55], van’t Riet
Page | 26
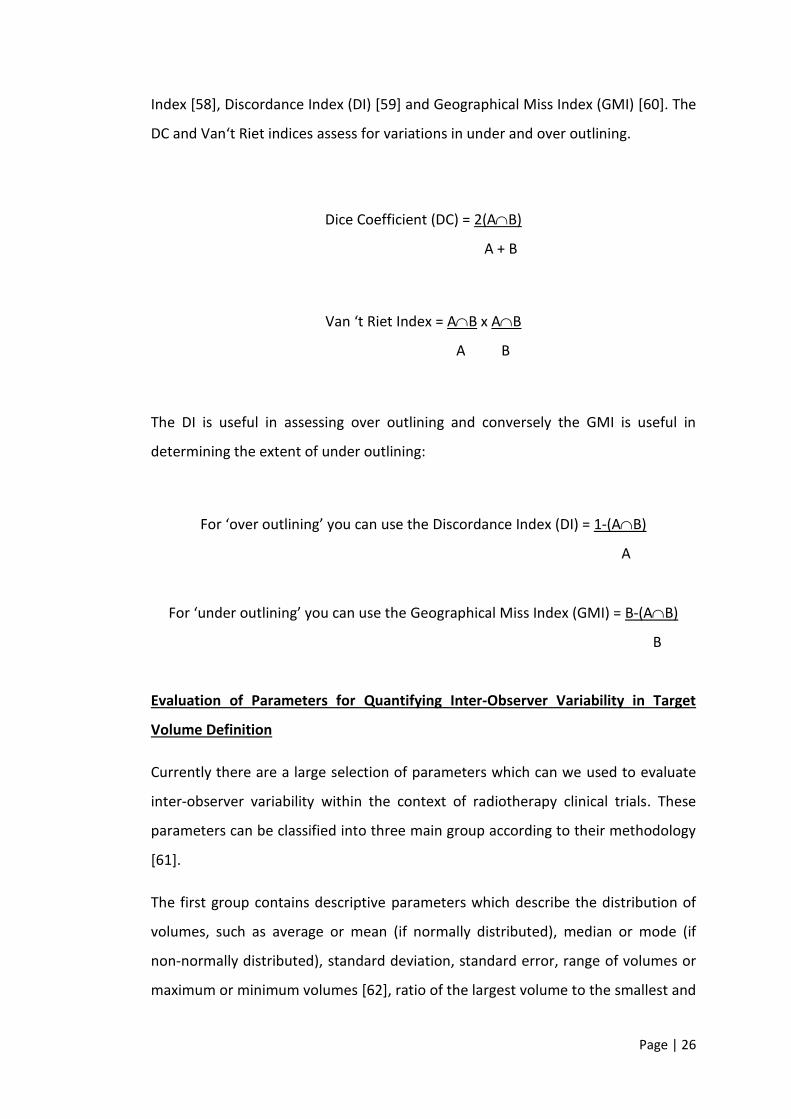
Index [58], Discordance Index (DI) [59] and Geographical Miss Index (GMI) [60]. The
DC and Van‘t Riet indices assess for variations in under and over outlining.
Dice Coefficient (DC) = 2(AB)
A + B
Van ‘t Riet Index = AB x AB
A B
The DI is useful in assessing over outlining and conversely the GMI is useful in
determining the extent of under outlining:
For ‘over outlining’ you can use the Discordance Index (DI) = 1-(AB)
A
For ‘under outlining’ you can use the Geographical Miss Index (GMI) = B-(AB)
B
Evaluation of Parameters for Quantifying Inter-Observer Variability in Target
Volume Definition
Currently there are a large selection of parameters which can we used to evaluate
inter-observer variability within the context of radiotherapy clinical trials. These
parameters can be classified into three main group according to their methodology
[61].
The first group contains descriptive parameters which describe the distribution of
volumes, such as average or mean (if normally distributed), median or mode (if
non-normally distributed), standard deviation, standard error, range of volumes or
maximum or minimum volumes [62], ratio of the largest volume to the smallest and
Page | 27
dispersion of the distribution i.e. coefficient of variation (COW). These simple
volume assessments are easy to measure, and relatively free from interpretation
bias. Simple volume parameters also have the advantage of producing continuous
variables that are amenable to statistical analysis and parametric and non-
parametric calculations [55].
The second group contains parameters which deal with measures that describe the
area of overlap between contoured volumes and includes the Jaccard index,
discordance index (DI), geographical miss index (GMI), Dice coefficient and Van‘t
Riet Index. Due to the large number of available metrics, this second group of
parameters is the one where harmonisation in reporting is lacking [61]. It is also the
group of parameters which reported studies seem use to quantify inter-observer
variability in target delineation most often [62-73]. Parameters within this group
can also be selected to assess specific variances between contoured volumes such
as under (GMI) or over outlining (DI). The advantage of the parameters in this group
is that they provide a single measurement of volumetric and positional change but
are therefore prone to missing subtle areas of variation within a volume and have
been shown to correlate poorly with length.
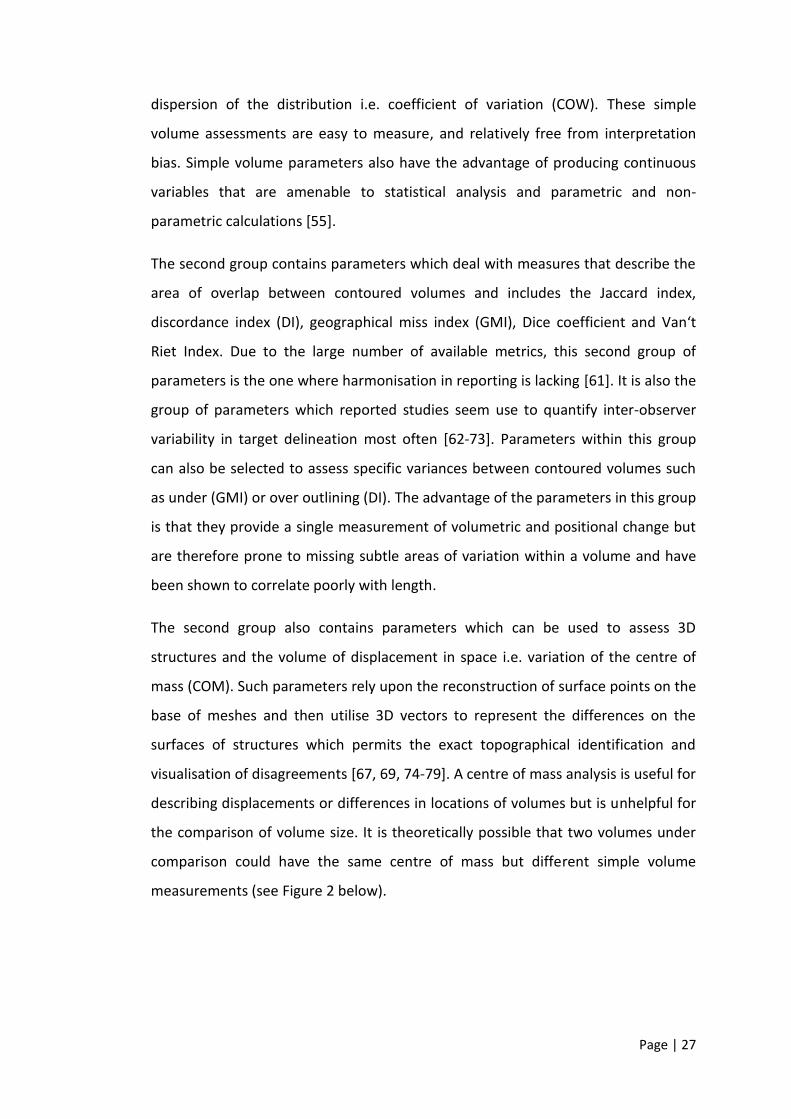
The second group also contains parameters which can be used to assess 3D
structures and the volume of displacement in space i.e. variation of the centre of
mass (COM). Such parameters rely upon the reconstruction of surface points on the
base of meshes and then utilise 3D vectors to represent the differences on the
surfaces of structures which permits the exact topographical identification and
visualisation of disagreements [67, 69, 74-79]. A centre of mass analysis is useful for
describing displacements or differences in locations of volumes but is unhelpful for
the comparison of volume size. It is theoretically possible that two volumes under
comparison could have the same centre of mass but different simple volume
measurements (see Figure 2 below).
Page | 28
Figure 2: Two Volumes with Different Sizes but The Same Centre of Mass
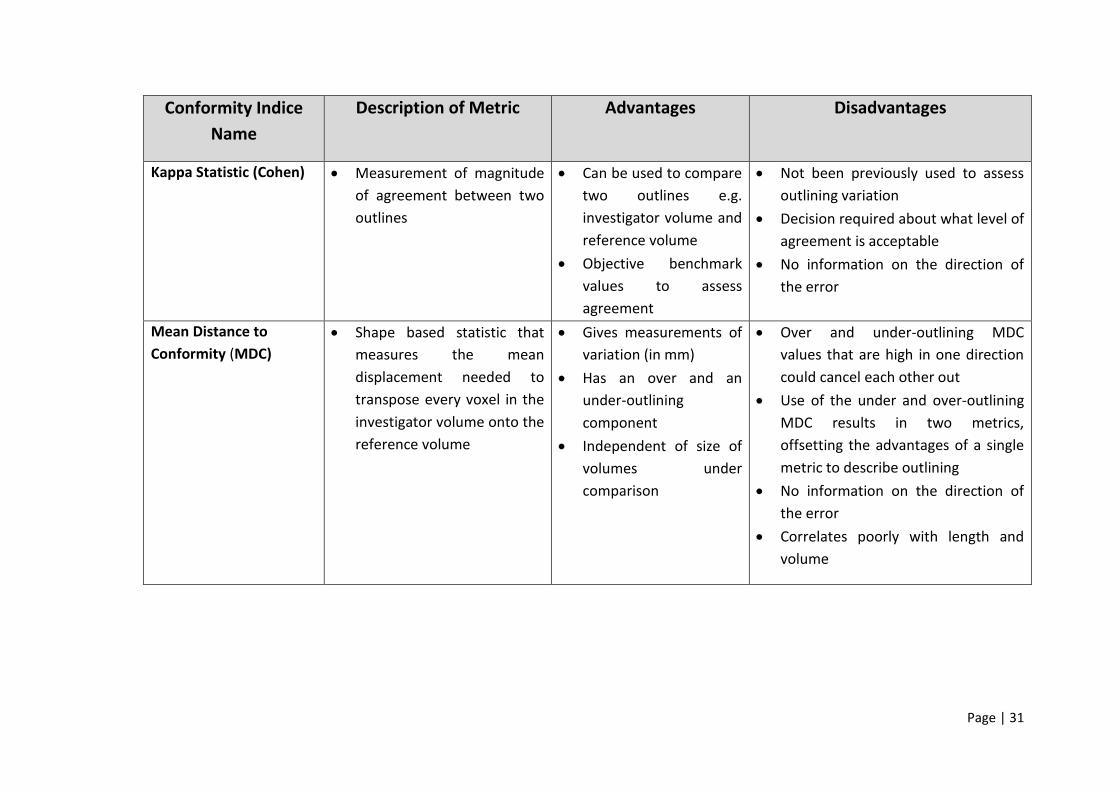
The third group contains parameters which utilise statistical measures of
agreement such as intraclass correlation coefficients (ICC), κ statistics (Fleiss or
Cohen) or other reliability analysis tools [29, 52, 63, 67, 73, 80-82]. The κ statistics
can be utilised to measure the magnitude of agreement between either two
outlines (Cohen Kappa) or multiple outlines (Fleiss’ Kappa). The measure calculates
the degree of agreement in classification over that which would be expected by
chance. Fleiss' kappa can be used only with binary or nominal-scale ratings and
Cohen's kappa coefficient is a statistic which measures inter-rater agreement for
qualitative (categorical) items. For both Fleiss and Cohen Kappa statistics, there is
no information on the direction of the error and both require a decision made on
what level of agreement is acceptable. Table 1 below summarises the commonest
used parameters from each group.
Based on published reviews of different comparison methods used to assess
radiotherapy target volume delineation there does not seem to be a perfect
parameter which fully characterises geometrical volume differences, positional
changes and inter-observer variability [55, 61]. Instead, each comparison method
seems to offer distinct advantages and disadvantages and should be selected based
upon the focus of the research. Hanna et al. recommends combining a simple
volume parameter with a parameter that measures positional displacement, such
as the centre of mass or the concordance index [55] whilst Fotina et al. recommend
adding a further statistical measure of agreement to permit full reporting of the
variability in delineation.
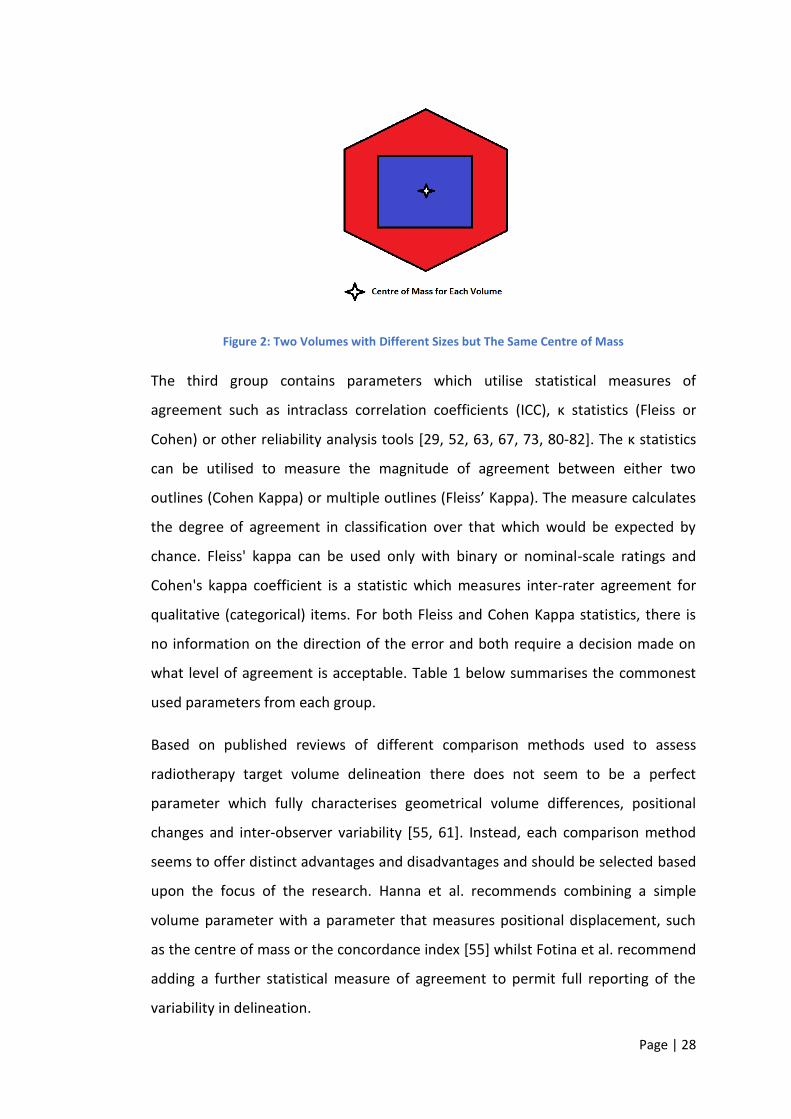
Conformity Indice
Name
Description of Metric Advantages Disadvantages
Jaccard Conformity
Index (JCI)
Van’t Riet
Dice Coefficient
• Ratio of the volume of
overlap of two structures
over union volume of the 2
structures
• Widely used in
literature for multiple
tumour sites and with
different imaging
modalities
• Includes errors of over
and under-outlining
• Benchmark level
defined for poor
concordance (breast
cancer)
• Whole volume metric, may miss
areas of variation within the volume
• Summary metrics incorporating both
over- and under-outlining errors
• Concordance will increase with larger
volumes
• Correlates poorly with length
• Failure to detect small but potentially
clinical significant anatomical errors
such as the bronchus in the SCOPE 1
pre-trial test case
• No information on the direction of
the error
Geographical Miss Index
(GMI)
• Calculates amount of under-
outlining
• Calculates amount of
geographical miss i.e.
under-outlining
• Well correlated with volume
• No benchmark for comparison,
tumour site and case dependent
Table 1: Detailed Information on Conformity Indices Used in Comparing Radiotherapy Target Volumes [54, 55]
Page | 30
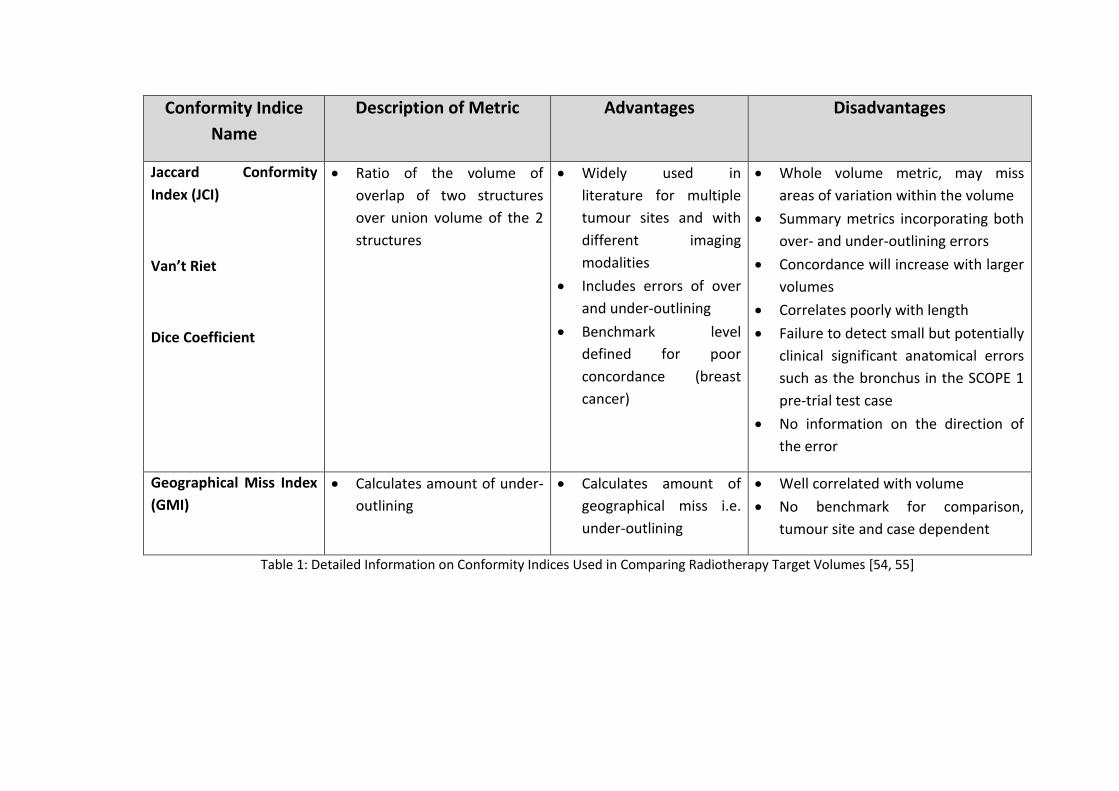
Conformity Indice
Name
Description of Metric Advantages Disadvantages
Discordance Index (DI) • Calculates amount of over-
outlining
• Calculates amount of
over-outlining
• Well correlated with volume
• No benchmark for comparison,
tumour site and case dependent
Kouwenhoven Index • Ratio of the volume of
overlap of two structures
over union volume of the 2
or more structures
• No reference volume
required for calculation
• Value dependent on conformity to
other investigators and not with gold
standard
Kappa Statistic (Fleiss) • Measurement of magnitude
of agreement between
multiple outlines
• No reference volume
required for calculation
• Objective benchmark
values to assess
agreement
• Value dependent on investigators
and not with gold standard
• Only valid for multiple investigator
outlines
• Decision required about what level of
agreement is acceptable
• No information on the direction of
the error
Page | 31
Conformity Indice
Name
Description of Metric Advantages Disadvantages
Kappa Statistic (Cohen) • Measurement of magnitude
of agreement between two
outlines
• Can be used to compare
two outlines e.g.
investigator volume and
reference volume
• Objective benchmark
values to assess
agreement
• Not been previously used to assess
outlining variation
• Decision required about what level of
agreement is acceptable
• No information on the direction of
the error
Mean Distance to
Conformity (MDC)
• Shape based statistic that
measures the mean
displacement needed to
transpose every voxel in the
investigator volume onto the
reference volume
• Gives measurements of
variation (in mm)
• Has an over and an
under-outlining
component
• Independent of size of
volumes under
comparison
• Over and under-outlining MDC
values that are high in one direction
could cancel each other out
• Use of the under and over-outlining
MDC results in two metrics,
offsetting the advantages of a single
metric to describe outlining
• No information on the direction of
the error
• Correlates poorly with length and
volume
Page | 32
Inter-observer Variation in the Context of UK Radiotherapy Trials
Now for over a decade the UK’s RTTQA group has been instrumental in the
administration of quality assurance for national UK radiotherapy trials.
Consequently, it has collated a substantial repository of pre-trial benchmark case
data from multiple different UK centres participating in multiple different UK
radiotherapy trials. Given the growing weight of international evidence highlighting
the importance of target volume outlining on patient outcomes this data holds a
wealth of important information on the degree of observer variability that exists
amongst UK Clinical Oncologists in the context of clinical trials. Work evaluating
inter-observer variability in GTV delineation in the context of upper and lower
gastro-intestinal (GI) tumour sub-sites has already been conducted thorough the
analysis of the SCALOP, ARISTOTLE, NEO-SCOPE and SCOPE 1 pre-trial benchmark
case [83-86].
The National Cancer Research Institute SCOPE 1 trial was a phase II/III randomised
controlled trial of chemoradiation with capecitabine and cisplatin with or without
cetuximab for oesophageal cancer. Prospective trial centres were required to
complete a mid-oesophagus pre-trial benchmark case with the help of a
comprehensive radiotherapy outlining protocol. A total of 50 investigators drawn
gross tumour volumes were received from 34 UK oncology centres and these were
analysed against a pre-defined gold standard GTV to determine several different CIs
(JCI, GMI, and DI). The SCOPE I data revealed a median JCI for investigator GTV’s of
0.69 (interquartile range, 0.62 – 0.70) with 14 of 50 investigators (28%) achieving a
JCI of 0.70 or greater [83]. The SCOPE I JCI values were comparable with those
published in three different studies who had JCI values ranging between 0.69 – 0.72
[87-89].
Through the course of the SCOPE 1 GTV analysis a new metric termed the local
conformity index (L-CI) was established. Unlike traditional CIs which analyses the
structure of interest the L-CI analysed the structure on each individual CT slice and
can highlight individual CT slices where GTV discordance was greatest [27]. Gwynne
et al. found that the highest levels of discordance (<20% of investigators achieving a
Page | 33
L-JCI ≥0.70) was seen on four CT slices and was now able to directly review these
slices for an underlying reason. What they found was a mixture of under outlining
of the oesophageal wall and inappropriate inclusion of the azygous vein,
pericardium, bronchus or peri-bronchial tissues which they concluded was due to
misinterpretation of normal anatomy [27].
Normal Tissue Outlining in the Context of UK Radiotherapy Trials
So far, most published research involving UK radiotherapy trials has focused on the
extent of inter-observer variation concerning the gross tumour volume [64, 90-93].
Comparatively, much less work has been conducted on inter-observer variability
involving normal tissue outlining [22].
Analysis of the SCOPE 1 data revealed that clinicians were misinterpreting normal
tissues seen on CT as viable tumour tissue. This raises the question as to the extent
of inter-observer variation and radiological misinterpretation which is also taking
place when clinicians outline the normal anatomical structures on the CT planning
scan. These normal organs can have an important bearing on the radiotherapy
planning process as Loo et al. demonstrated when they conducted a systemic
review evaluating inter-observer variation in parotid gland delineation and its
impact on intensity-modulated radiotherapy solutions [22]. Loo et al. found that
almost half of the contours (46%) produced by the participating radiation
oncologists and radiologists were sufficiently different from the contour used
clinically to have necessitated a different IMRT plan if used [22]. Therefore, bearing
in mind the constraints of these normal tissues can dictate the optimal
radiotherapy plan selected, poor outlining of normal tissue structures could
potentially have a direct impact on the quality and outcome of a patient’s
treatment.
Assessment of Target Volume and Normal Tissue Structures in The Context of UK
Head and Neck and Lung Cancer Radiotherapy Trials
The first hypothesis for this research is that there is a statistically significant inter-
observer variation amongst clinical oncologist’s target volume and OAR contours
Page | 34
within the context of the pre-trial quality assurance (QA) benchmark cases for four
different UK radiotherapy trials. The second hypothesis is that RTQA feedback
during the pre-trial benchmark period improves head and neck clinician contouring.
This research tests the first hypothesis by establishing whether any statistically
significant inter-observer variation exists amongst UK head and neck and lung
cancer oncologists by analysing their target volume and OAR contours submitted
via the pre-trial benchmark QA cases.
The second hypothesis has been tested by establishing whether RTQA team
feedback significantly impacts on UK head and neck oncologists target volumes and
OAR contours during the pre-trial benchmark QA period.
This work will analyse the pre-trial benchmark cases of the ART-DECO, COSTAR,
IDEAL and i-START trials. It will also analyse the re-submissions contours from the
ART-DECO and COSTAR trials.
Page | 35
Chapter 2: Materials and Methods
Overview of the Head and Neck and Lung Cancer Trials Selected for Analysis
To investigate the degree of inter-observer variability which exists amongst clinical
oncology consultants routinely outlining head and neck and lung cancer target and
organs at risk volumes four national radiotherapy trials were selected which require
clinicians to complete pre-trial outlining benchmark cases. The two head and neck
trials selected were the ARTDECO (Accelerated Radiotherapy sTudy of Dose
EsCalated intensity-mOdulated radiotherapy versus standard dose intensity-
modulated radiotherapy in patients receiving treatment for locally advanced
laryngeal and hypopharyngeal cancers) and the COSTAR (COchlear Sparing inTensity
modulAted Radiotherapy versus conventional radiotherapy in patients with parotid
tumours) trials. The ARTDECO trial is evaluating dose escalated, accelerated (total
dose of radiation is given over a shorter period (fewer days) compared to standard
radiation therapy), IMRT versus standard dose IMRT in patients receiving treatment
for locally advanced laryngeal and hypopharyngeal cancers. The COSTAR trial is
evaluating the potential toxicity benefits of cochlear-sparing IMRT versus
conventional radiotherapy in patients with parotid tumours.
The two lung cancer trials selected were the IDEAL (Isotoxic Dose Escalation and
Acceleration in Lung Cancer ChemoRadiotherapy) and i-START (ISoToxic Accelerated
RadioTherapy in locally advanced non-small cell lung cancer) trials. The IDEAL trial
was evaluating the toxicity, feasibility and potential clinical effectiveness of isotoxic,
dose-escalated radiotherapy with concurrent chemotherapy versus standard
chemoradiotherapy in patients with stage II or stage III non-small cell lung cancer
(NSCLC). The method of dose escalation in IDEAL was through an individual patient-
based model. Each patient would be treated to the dose that, based on the
optimised distribution of radiation on his/her treatment plan, was calculated to be
associated with an acceptable level of grade three toxicity (from oesophagus or
lung). In this way, each patient would be treated to the highest acceptable dose for
his/her own situation and would not be exposed to excess risk with the
introduction of a generic high-dose to the whole population. This method of
Page | 36
individualised dose escalation using predefined normal tissue constraints is termed
isotoxic radiotherapy e.g. one patient receives 66Gy, another 74Gy based upon the
maximum safe achievable dose to the patient which remains within the bounds of
the pre-defined normal tissue constraints for those critical organs surrounding the
target volume. For instance, in thoracic radiotherapy, this includes the mean lung
dose (MLD), the oesophagus and the spinal cord.
The i-START trial was designed to determine the highest doses of radiotherapy that
could be safely delivered in locally advanced NSCLC and would evaluate the
feasibility of delivering isotoxic, accelerated radiotherapy in the treatment of
patients with stage II to stage IIIB NSCLC.
Overview of the Pre-Trial Outlining Quality Assurance (QA) Program
For all four trials, normally one consultant clinical oncologist in each participating
centre is designated the principle investigator (PI) and it is their duty to act as the
local lead for the trial in their centre. All the selected trials required the local PI to
complete pre-accrual contouring benchmark cases. The purpose of the benchmark
cases was multifactorial. Firstly, to ensure that the PI was correctly following the
contouring guidelines contained within each of the trials outlining protocols,
secondly to ensure the correct nomenclature was being used to define the volumes
and finally to ensure that target volume geometric expansion was done correctly
and using reasonable expansion margins.
Trial pre-accrual benchmark cases were available for download from their
respective webpage on the Radiotherapy Trials Quality Assurance (RTTQA) website
(http://www.rttrialsqa.org.uk/). Each case consisted of a compressed DICOM CT
data set. DICOM is an acronym for Digital Imaging and Communications in Medicine
which is a standard for handling, storing, printing, and transmitting information in
medical imaging. Participating clinicians were instructed to extract and import the
DICOM data into their centres radiotherapy treatment planning system (TPS). This
allowed the trial PI to complete the outlining cases using the planning software they
would normally use to plan their patients. In the case of the IDEAL and i-START trials
Page | 37
clinicians were also able to download the diagnostic PET scans relevant to each of
the two cases to assist with target volume delineation.
When completing the contouring cases, PI’s were expected to refer to the
appropriate trial protocol because it contained a clinical history for each contouring
case, diagnostic radiology findings for the cases, definitions of target volumes and
critical structures, guidance on delineating target volumes and some normal
structures, and guidance on structure naming and nomenclature.
ARTDECO and COSTAR Trial: Outlining QA Program
The ARTDECO trial requires PI’s to complete two pre-trial benchmark contouring
exercises; the first a squamous cell carcinoma of the larynx case and the second a
squamous cell carcinoma of the hypopharynx case. For the COSTAR trial PI’s were
required to outline a single case which was the post-operative bed and elective
nodes of a 53-year-old female who had undergone surgery for a right sided high-
grade ex-pleomorphic adenoma of the parotid gland. Both the ARTDECO and
COSTAR trial protocols stipulated which target and normal organ structures needed
to be contoured.
The ART-DECO target volume delineation and planning guidelines contained
anatomical illustrations for each head and neck subsite, nodal atlas, and step-by-
step instructions detailing how the GTV, CTV and PTV contours should be
constructed. Aside from detailing which normal organs should be contoured for
each case (spinal cord, brainstem, contralateral parotid and ipsilateral parotid) no
further information regarding delineation was provided.
The COSTAR target volume delineation and planning guidelines also contained
illustrations detailing the anatomy of the parotid gland, guidance on nodal
outlining, and step-by-step instructions detailing how the parotid bed (CTV) and
PTVs should be constructed. Clinicians were instructed to outline both cochlea,
contralateral parotid gland, spinal cord (below foramen magnum), brainstem
(above foramen magnum) and lens. The COSTAR guidelines included definitions to
aid correct outlining of the brainstem and spinal cord; the brainstem was defined as
Page | 38
beginning at the level of the foramen magnum and outlining of the structure should
extend sufficiently superior to continue beyond the limit of irradiating fields. The
spinal cord was defined as beginning below the level of the foramen magnum and
extending inferiorly to the manubrium. Clinicians were also asked to contour the
spinal cord and not the spinal canal. Prospective COSTAR PI’s were expected to
follow these instructions to help standardise spinal cord and brainstem outlines.
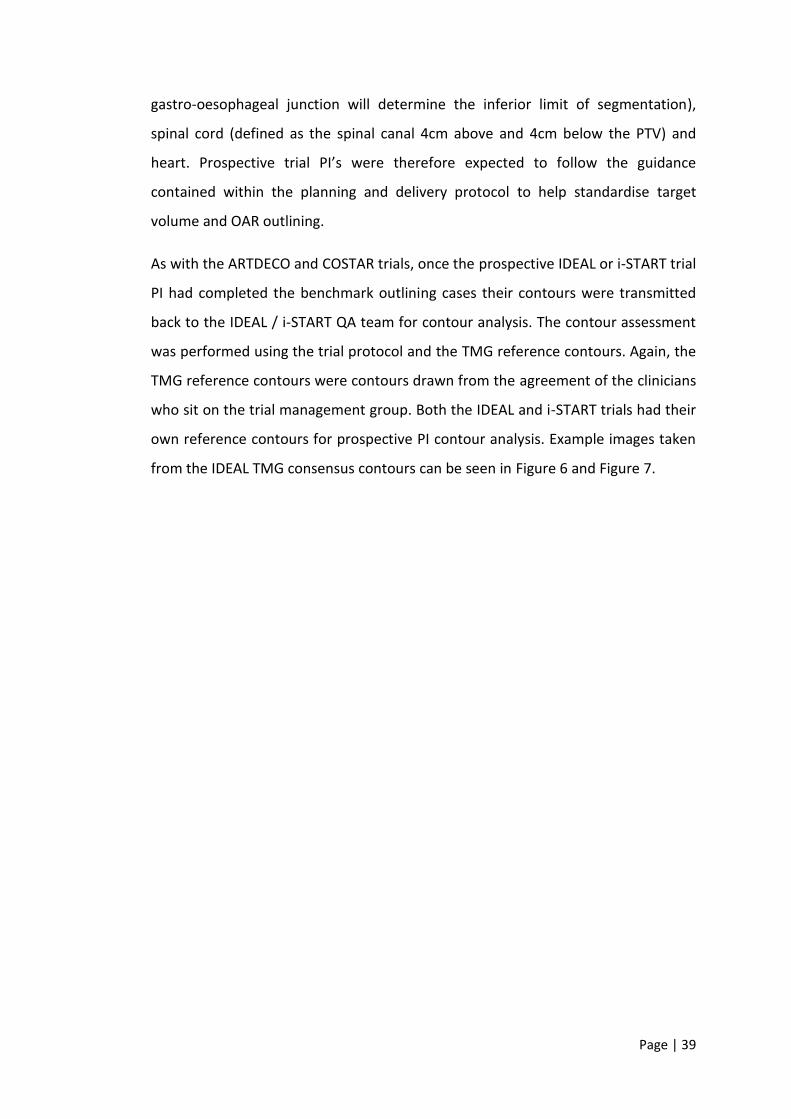
Once the prospective PI had completed the benchmark outlining cases for either
the ARTDECO or COSTAR trials then their contours were transmitted back to the
respective central QA team for that trial. Once received, the trial QA team would
perform an assessment of the submitted contours using the trial protocol and the
tumour management group’s (TMG) reference contours for that benchmark case.
The TMG reference contours were consensus contours drawn from the collective
agreement of the clinicians who sit on the trial management group. Example
images taken from the ARTDECO and COSTAR TMG consensus contours can be seen
in Figure 3, Figure 4 and Figure 5.
IDEAL & i-START Trials: Outlining QA Program
The IDEAL and i-START trials both share the same pre-trial benchmark outlining
exercises. Again, both trials required prospective PI’s to contour two pre-trial
benchmark outlining exercises. Both clinical cases were locally advanced, stage III
lung cancers with tumours located centrally within the chest. To aid clinicians
background case histories, the diagnostic imaging (CT plus PET) with the reports
were provided along with the planning CT scan. The IDEAL / i-START outlining
instructions requested clinicians to create structures to represent the body, GTV,
CTV, PTV, left lung, right lung, the total lung minus the GTV volume, spinal cord,
heart and oesophagus. The IDEAL trial planning and delivery guidelines (which the
pre-trial benchmark cases advised clinicians to reference) contained target and
normal organ delineation instructions. Clinicians were given guidance on how to
define the GTV, CTV, PTV, lungs (these should be segmented in every slice from the
apex to the base as a paired organ), oesophagus (defined as a solid organ 4cm
above and 4cm below the PTV; if a 4cm margin is not possible inferiorly then the
Page | 39
gastro-oesophageal junction will determine the inferior limit of segmentation),
spinal cord (defined as the spinal canal 4cm above and 4cm below the PTV) and
heart. Prospective trial PI’s were therefore expected to follow the guidance
contained within the planning and delivery protocol to help standardise target
volume and OAR outlining.
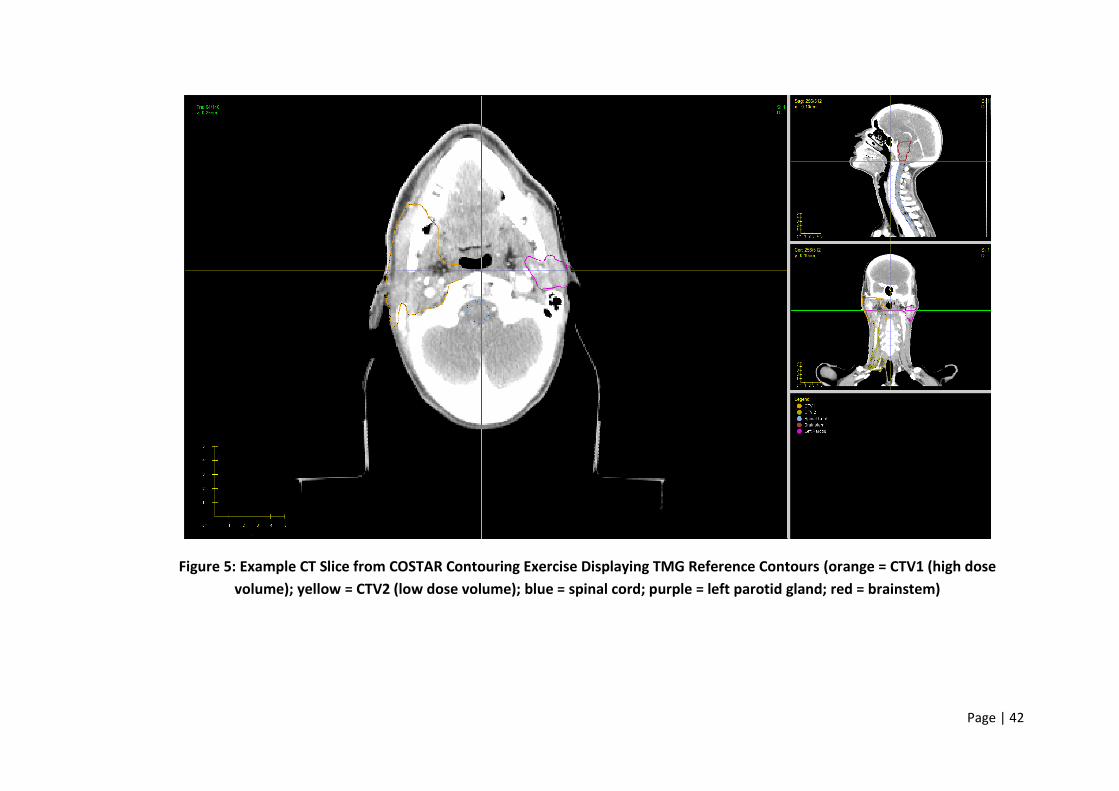
As with the ARTDECO and COSTAR trials, once the prospective IDEAL or i-START trial
PI had completed the benchmark outlining cases their contours were transmitted
back to the IDEAL / i-START QA team for contour analysis. The contour assessment
was performed using the trial protocol and the TMG reference contours. Again, the
TMG reference contours were contours drawn from the agreement of the clinicians
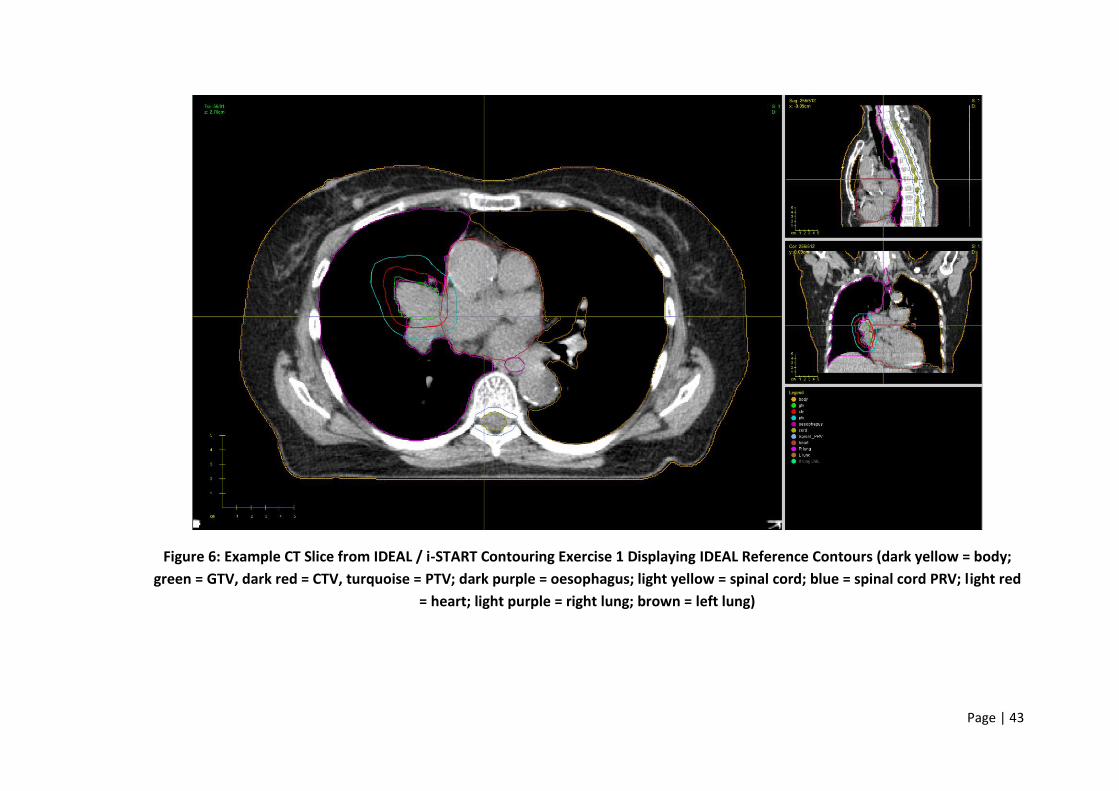
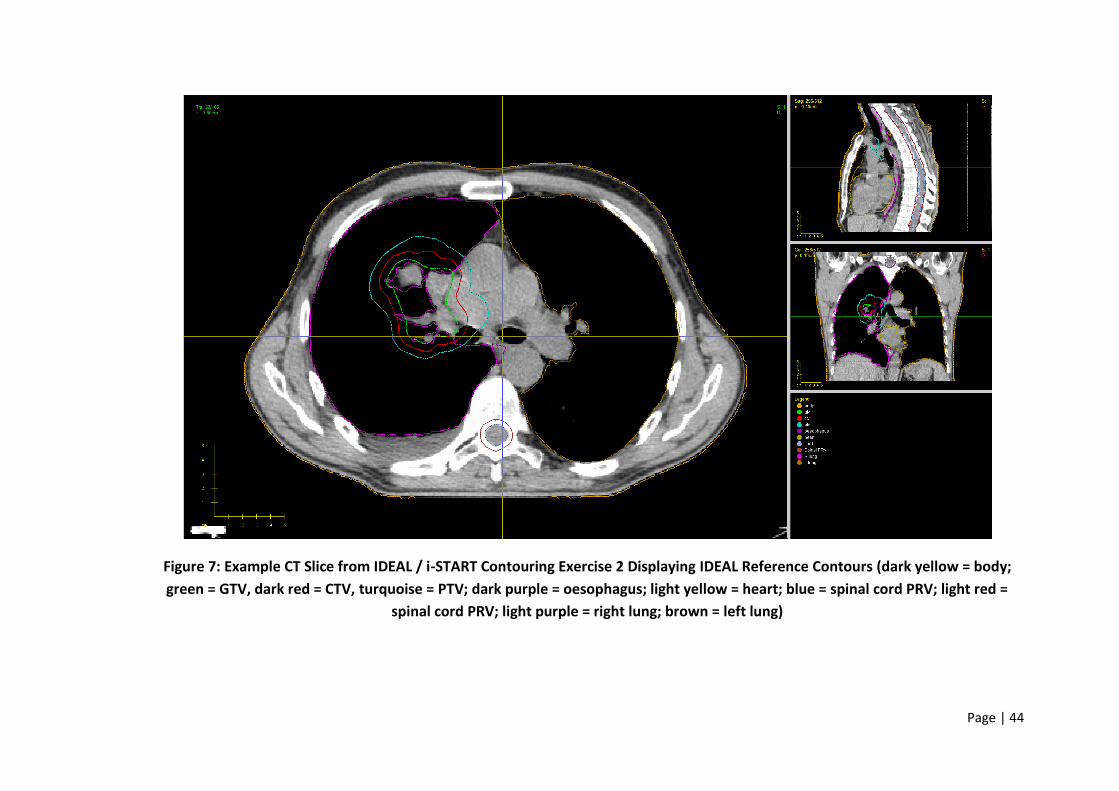
who sit on the trial management group. Both the IDEAL and i-START trials had their
own reference contours for prospective PI contour analysis. Example images taken
from the IDEAL TMG consensus contours can be seen in Figure 6 and Figure 7.
Page | 40
Figure 3: Example CT Slice from ARTDECO Contouring Exercise 1 Displaying TMG Reference Contours (turquoise = body contour;
light purple = CTV1 (high dose volume); brown = CTV2 (low dose volume); yellow = spinal cord; green = right parotid gland; pink =
left parotid gland; dark purple = brainstem).
Page | 41
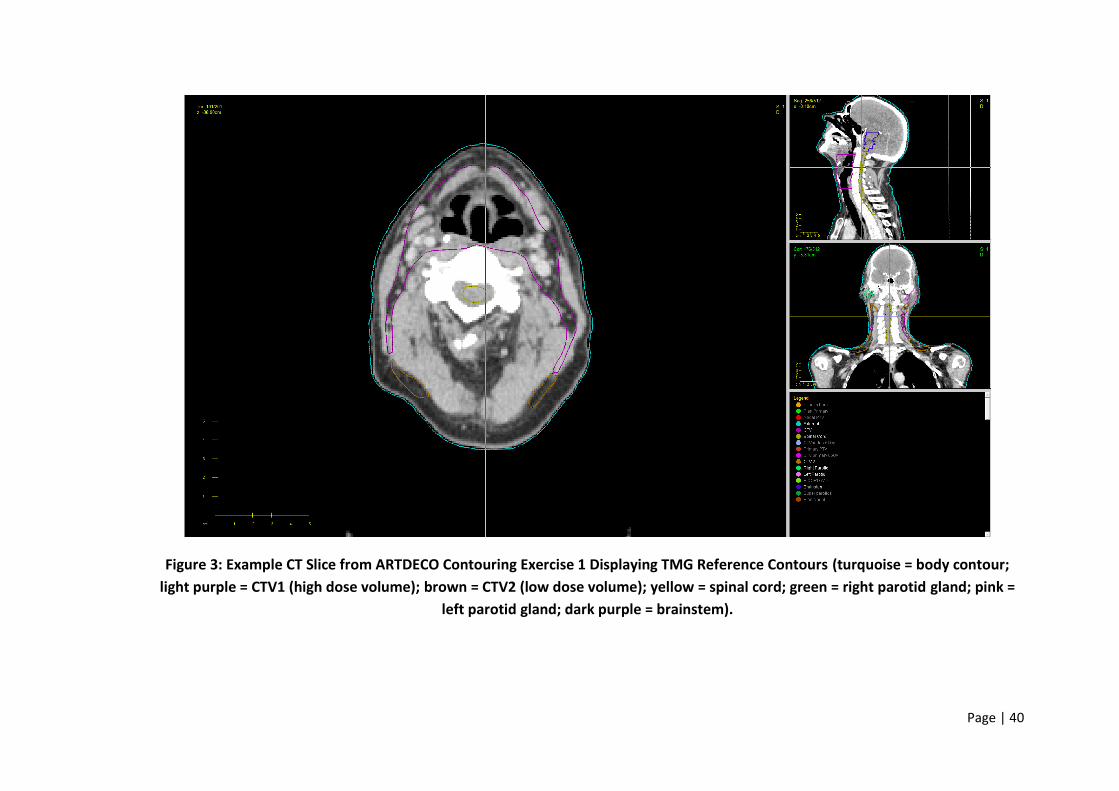
Figure 4: Example CT Slice from ARTDECO Contouring Exercise 2 Displaying TMG Reference Contours (orange = body contour; dark
red = GTV; yellow = CTV1 (high dose volume); light blue = CTV2 (low dose volume); light red = right parotid gland; purple = left
parotid gland; brown = spinal cord; green = brainstem)
Page | 42
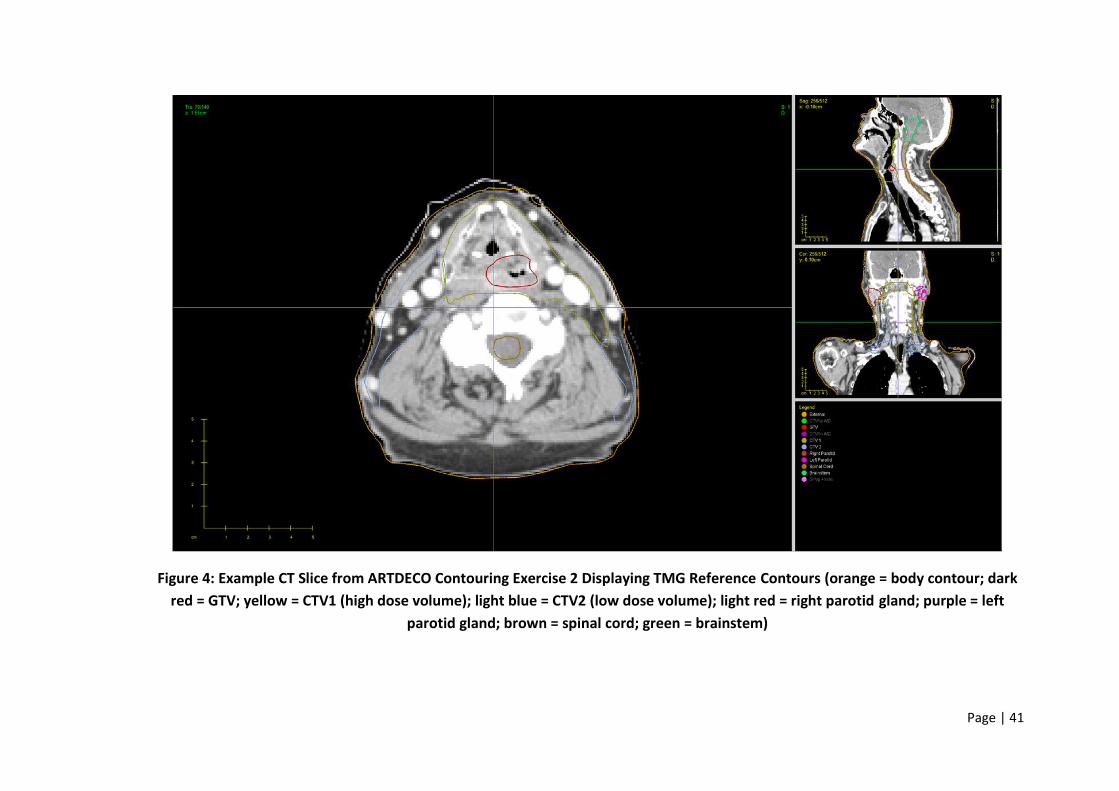
Figure 5: Example CT Slice from COSTAR Contouring Exercise Displaying TMG Reference Contours (orange = CTV1 (high dose
volume); yellow = CTV2 (low dose volume); blue = spinal cord; purple = left parotid gland; red = brainstem)
Page | 43
Figure 6: Example CT Slice from IDEAL / i-START Contouring Exercise 1 Displaying IDEAL Reference Contours (dark yellow = body;
green = GTV, dark red = CTV, turquoise = PTV; dark purple = oesophagus; light yellow = spinal cord; blue = spinal cord PRV; light red
= heart; light purple = right lung; brown = left lung)
Page | 44
Figure 7: Example CT Slice from IDEAL / i-START Contouring Exercise 2 Displaying IDEAL Reference Contours (dark yellow = body;
green = GTV, dark red = CTV, turquoise = PTV; dark purple = oesophagus; light yellow = heart; blue = spinal cord PRV; light red =
spinal cord PRV; light purple = right lung; brown = left lung)
Page | 45
Overview of the Assessment Process Used in the Pre-Trial QA Program
All pre-trial outlining benchmark exercises submitted for assessment were first
reviewed by the respective trials QA team for trial protocol outlining compliance.
The TMG’s reference contours were then used as a visual benchmark to assess
whether the contours submitted adequately delineated the target volumes and
OARs stipulated in the contouring exercise instructions.
In the context of the head and neck trials, if the RTQA team felt that the target
volumes or OAR structures were unsatisfactory due to deviations from the outlining
protocol, then the submitting clinician was requested to resubmit their contours
following guidance set out in the RTQA team’s feedback report. Once resubmitted,
the cases were then re-reviewed for protocol compliance and further resubmissions
requested until judged trial protocol compliant. An analysis of the impact of this on
clinician outlining can be found in Chapter 5.
Data Analysis Step 1: Data Collection and Processing
I collected all benchmark cases, including resubmissions, for ARTDECO and COSTAR
up until June 2012 in DICOM format. For the IDEAL and i-START trials, I collected all
submitted benchmark cases in DICOM format up until November 2012.
Before any of the submitted DICOM data could be analysed all the structure names
contained within the submitted cases had to manually checked and edited by me to
ensure consistent structure naming; approximately 1000 individual structures in
total.
This time-consuming step was necessary because the conformity analysis tool
required all the same structures to be labelled in the same way i.e. ‘CTV1’ and not
‘CTV_1’ or ‘CTV-1’; ‘Brainstem’ and not ‘Brain_Stem’ or ‘BS’. Without me
performing this important step the analysis tools would not have been able to
analyse all the submitted structure contours as it would not have recognised many
of them due to inconsistent structure nomenclature.
Page | 46
Data Analysis Step 2: Analysis of Pre-Trial Benchmark Cases
Once the data had been processed to ensure uniform structure nomenclature it
was then analysed using a conformity analysis tool built by Dr Emiliano Spezi using
MATLAB R2011a and CERR v.4.0 by. All submitted cases were analysed against their
respective trial management group (TMG) consensus contours to assess for inter-
observer and intra-observer variation. The conformity analysis tool calculated the
volume of each structure then the Dice coefficient (DC), Jaccard index (JI),
geographical miss index (GMI) and RIET index for each structure by comparing it
directly to its comparative TMG reference structure. To facilitate easy comparison
of all 4 output indices, 1-GMI was also calculated.
The conformity analysis tool also calculated the Local Conformity Index (L-CI) for
each structure. This metric was created following analysis of the SCOPE 1 pre-trial
benchmark case GTV structures. Unlike traditional conformity indices which
analyses the structure of interest the L-CI analyses the structure on each individual
CT slice and can help highlight where discordance is greatest within each contoured
structure on an individual CT slice basis.
Data Analysis Step 3: Collation of Output Structure Analysis Data
Once the conformity analysis tool had finished calculating the data it was output as
comma-separated values files (.CSV files) which Microsoft Excel 2016 recognises as
a single column of numerical values contained within a spreadsheet with each row
within the Excel spreadsheet representing a different submitting clinician. The
analysis tools created a .CSV file for every indice measured for every structure
analysed. In total 1609 individual .CSV files were created for all the structures
analysed. For the purposes of further analysis, I collated the data from each .CSV
file into Microsoft Excel 2016 spreadsheets.
To permit statistical analysis of inter-observer variation within the output data, the
analysed head and neck trial and lung trial structures were grouped into three
different categories:
Page | 47
1. Targets (which included CTVs)
2. Serial OARs (which included spinal cord, brainstem and oesophagus)
3. Parallel OARs (which included parotid glands, heart and lungs)
Data Analysis Step 4: Statistical Analysis of the Conformity Indice Data
Once all the data had been collated in Excel 2016, it was then analysed using
MATLAB to look for statistically significant differences to determine whether the
proposed hypotheses were valid.
Submission structures from all the trials were sorted into three distinct groups –
target structures (which included the high dose CTV); serial organs at risk (which
included spinal cord, brainstem and oesophagus) and parallel organs at risk (which
included the parotid glands, lungs and heart). The organs contained within each
respective serial or parallel group were determined using the radiobiological
definitions of parallel and serial organs. The term parallel organ is based upon an
analogy with electrical circuits and can be contrasted with serial organs. A parallel
organ, like the parotid gland, has redundancy built in, and a certain fraction of the
organ parenchyma (or functional subunits) can be sacrificed and the organ will still
maintain its function albeit reduced. Classic serial organs are the spinal cord and
oesophagus where loss of function will occur if even a small length of either
structure is sacrificed; typically, serial organs are tubular structures and therefore
cylindrical in shape.
Using these definitions, the target structure group contained the volumes which
clinicians had defined as containing either the primary tumour, or areas at high risk
of containing residual tumour cells. The parallel organs at risk group contained
those critical organs which are defined within the context of radiotherapy planning
as being parallel i.e. parotid glands, lungs and heart (although the heart organ does
contain serial tissues and can therefore be considered a serial-parallel organ). The
serial organs at risk group contained critical organs which are defined within the
context of radiotherapy planning as being serial i.e. spinal cord, brainstem and
oesophagus. Parallel and serial organs also differ geometrically as serial organs are
Page | 48
normally tubular shaped structures whereas parallel organs are often more
complex in their anatomical shape. Therefore, the organ at risk groupings used for
the purposes of analysis could be considered to reflect those with more complex 3D
structures (parallel organs) and those with simpler tubular shapes (serial organs).
For hypothesis one this was tested using a paired difference test with Bonferroni
correction. A paired difference test is a type of location test that is used when
comparing two sets of measurements to assess whether their population means
differ. A paired difference test uses additional information about the sample that is
not present in an ordinary unpaired testing situation, either to increase the
statistical power, or to reduce the effects of confounders. A Bonferroni correction
was utilised to counteract the problem of multiple comparisons. The results of
these analyses are detailed in Chapters 3 and 4.
For hypothesis two, a paired t-test was utilised. A paired t-test is a statistical
technique that is used to compare two population means in the case of two
samples that are correlated. This test seemed most appropriate for detecting
possible statistical differences between the first and final contouring submissions.
Data Analysis Step 5: Designing an Innovative Solution for Collating L-CI Structure
L-Data
In the case of the structure L-CI data, because of its complex nature an innovative
method of consolidating it was needed which would allow an easy and rapid visual
interpretation of its findings. My solution to this problem was to create a bespoke
spreadsheet for each structure analysed from each benchmark case using Microsoft
Excel 2016. How this was done is detailed in Appendix 1 and by using this method,
it was then possible to quickly visualise where the greatest variation existed in
clinician target and OAR contouring and therefore useful in interpreting the
individual Dice, Jaccard, Van’t Riet and GMI indices and the statistical analysis of
their findings.
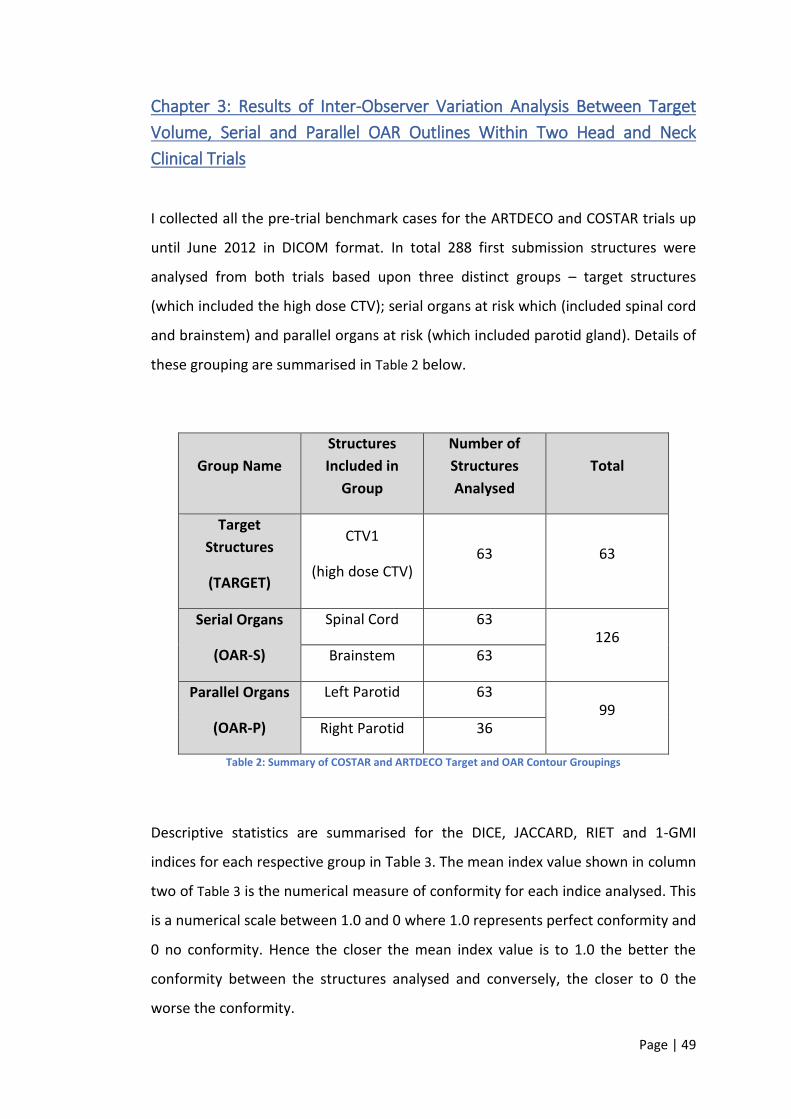
Page | 49
Chapter 3: Results of Inter-Observer Variation Analysis Between Target
Volume, Serial and Parallel OAR Outlines Within Two Head and Neck
Clinical Trials
I collected all the pre-trial benchmark cases for the ARTDECO and COSTAR trials up
until June 2012 in DICOM format. In total 288 first submission structures were
analysed from both trials based upon three distinct groups – target structures
(which included the high dose CTV); serial organs at risk which (included spinal cord
and brainstem) and parallel organs at risk (which included parotid gland). Details of
these grouping are summarised in Table 2 below.
Group Name
Structures
Included in
Group
Number of
Structures
Analysed
Total
Target
Structures
(TARGET)
CTV1
(high dose CTV) 63 63
Serial Organs
(OAR-S)
Spinal Cord 63 126
Brainstem 63
Parallel Organs
(OAR-P)
Left Parotid 63 99
Right Parotid 36
Table 2: Summary of COSTAR and ARTDECO Target and OAR Contour Groupings
Descriptive statistics are summarised for the DICE, JACCARD, RIET and 1-GMI
indices for each respective group in Table 3. The mean index value shown in column
two of Table 3 is the numerical measure of conformity for each indice analysed. This
is a numerical scale between 1.0 and 0 where 1.0 represents perfect conformity and
0 no conformity. Hence the closer the mean index value is to 1.0 the better the
conformity between the structures analysed and conversely, the closer to 0 the
worse the conformity.
Page | 50
The boxplot as shown in Figure 8 demonstrates that overall it seems the target
contours (CTV1 – which contained the high dose CTV) had the highest conformality,
followed by the serial organs at risk (spinal cord and brainstem) and then finally the
parallel organs at risk (parotid glands) for all four conformity indices measured.
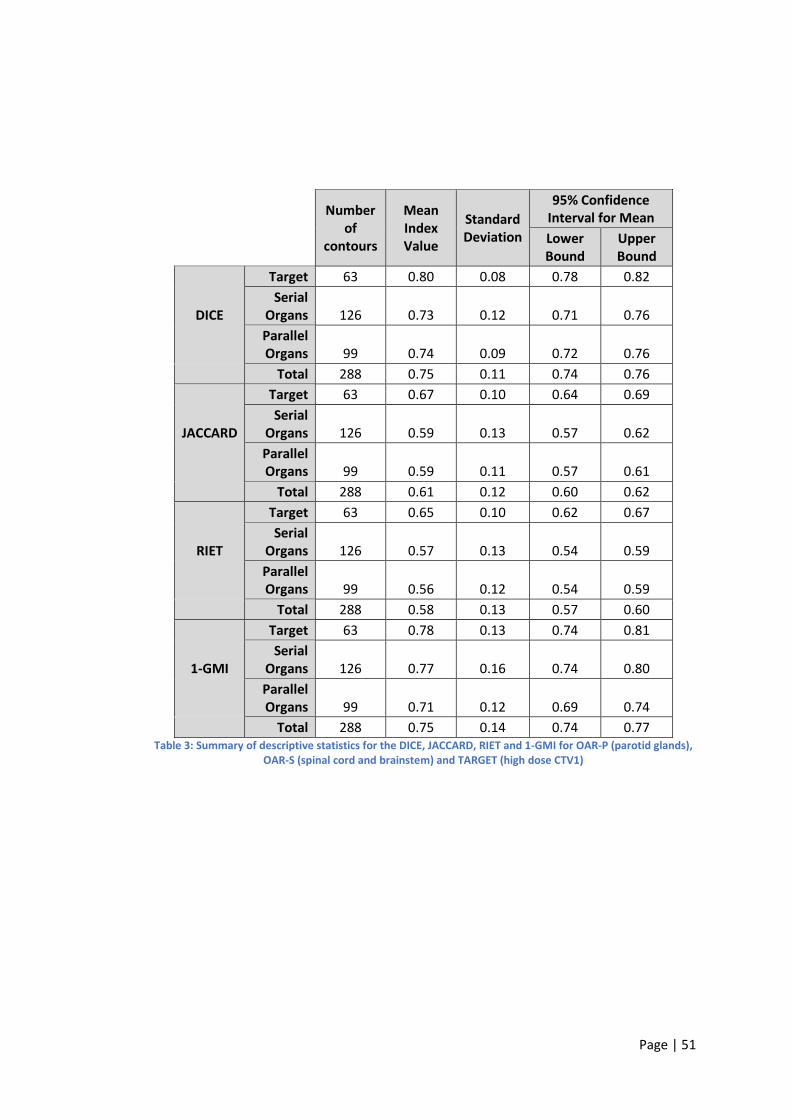
Page | 51
Number of
contours
Mean Index Value
Standard Deviation
95% Confidence Interval for Mean
Lower Bound
Upper Bound
DICE
Target 63 0.80 0.08 0.78 0.82
Serial Organs 126 0.73 0.12 0.71 0.76
Parallel Organs 99 0.74 0.09 0.72 0.76
Total 288 0.75 0.11 0.74 0.76
JACCARD
Target 63 0.67 0.10 0.64 0.69
Serial Organs 126 0.59 0.13 0.57 0.62
Parallel Organs 99 0.59 0.11 0.57 0.61
Total 288 0.61 0.12 0.60 0.62
RIET
Target 63 0.65 0.10 0.62 0.67
Serial Organs 126 0.57 0.13 0.54 0.59
Parallel Organs 99 0.56 0.12 0.54 0.59
Total 288 0.58 0.13 0.57 0.60
1-GMI
Target 63 0.78 0.13 0.74 0.81
Serial Organs 126 0.77 0.16 0.74 0.80
Parallel Organs 99 0.71 0.12 0.69 0.74
Total 288 0.75 0.14 0.74 0.77
Table 3: Summary of descriptive statistics for the DICE, JACCARD, RIET and 1-GMI for OAR-P (parotid glands), OAR-S (spinal cord and brainstem) and TARGET (high dose CTV1)
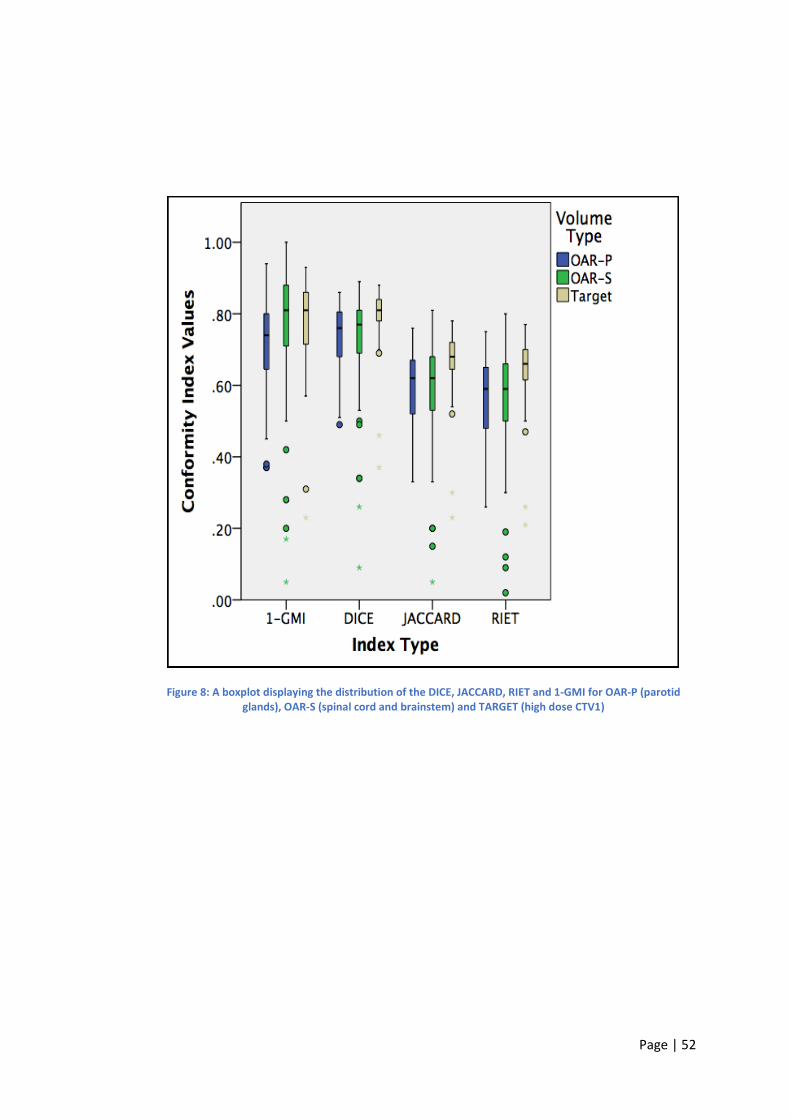
Page | 52
Figure 8: A boxplot displaying the distribution of the DICE, JACCARD, RIET and 1-GMI for OAR-P (parotid glands), OAR-S (spinal cord and brainstem) and TARGET (high dose CTV1)

Page | 53
A pairwise comparison with Bonferroni correction was performed on each of the
groups for each conformity indice (DICE, JACCARD, RIET and 1-GMI). The analysis
revealed the following statistical differences between each group and indice
analysed:
DICE
A significant difference was found between Target and OAR-S (p<0.05)
A significant difference was found between Target and OAR-P (p<0.05)
No significant difference was found between OAR-S and OAR-P (p=1.00)
JACCARD
A significant difference was found between Target and OAR-S (p<0.05)
A significant difference was found between Target and OAR-P (p<0.05)
No significant difference was found between OAR-S and OAR-P (p=1.00)
RIET
A significant difference was found between Target and OAR-S (p<0.05)
A significant difference was found between Target and OAR-P (p<0.05)
No significant difference was found between OAR-S and OAR-P (p=1.00)
1-GMI
No significant difference was found between Target and OAR-S (p=1.00)
A significant difference was found between Target and OAR-P (p<0.05)
A significant difference was found between OAR-S and OAR-P (p<0.05)
To summarise, a statistically significant difference was detected for the DICE,
JACCARD and RIET indices when the target volume contours (TARGET) were
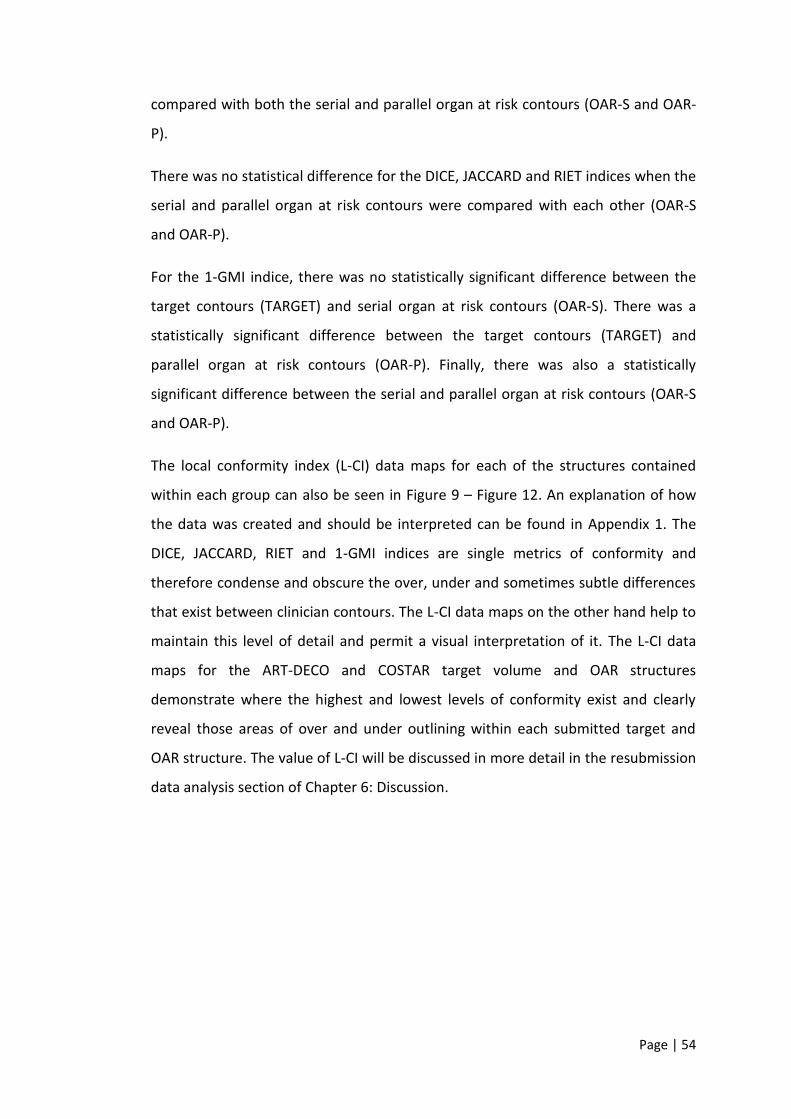
Page | 54
compared with both the serial and parallel organ at risk contours (OAR-S and OAR-
P).
There was no statistical difference for the DICE, JACCARD and RIET indices when the
serial and parallel organ at risk contours were compared with each other (OAR-S
and OAR-P).
For the 1-GMI indice, there was no statistically significant difference between the
target contours (TARGET) and serial organ at risk contours (OAR-S). There was a
statistically significant difference between the target contours (TARGET) and
parallel organ at risk contours (OAR-P). Finally, there was also a statistically
significant difference between the serial and parallel organ at risk contours (OAR-S
and OAR-P).
The local conformity index (L-CI) data maps for each of the structures contained
within each group can also be seen in Figure 9 – Figure 12. An explanation of how
the data was created and should be interpreted can be found in Appendix 1. The
DICE, JACCARD, RIET and 1-GMI indices are single metrics of conformity and
therefore condense and obscure the over, under and sometimes subtle differences
that exist between clinician contours. The L-CI data maps on the other hand help to
maintain this level of detail and permit a visual interpretation of it. The L-CI data
maps for the ART-DECO and COSTAR target volume and OAR structures
demonstrate where the highest and lowest levels of conformity exist and clearly
reveal those areas of over and under outlining within each submitted target and
OAR structure. The value of L-CI will be discussed in more detail in the resubmission
data analysis section of Chapter 6: Discussion.
Page | 55
Figure 9: L-CI Map for ART-DECO Pre-Trial Benchmark Case 2 CTV1 (No Conformity i.e. contour not present (L-CI = 0.00); Poor conformity; Good conformity; Perfect conformity (L-CI = 1.00))
L-CI Map For ART-DECO Pre-Trial Benchmark Case 2 CTV1
27 -9.2
28 -8.95
29 -8.7
30 -8.45 0.00
31 -8.2 0.00 0.00 0.00 0.00 0.00 0.00 0.00 0.00 0.63 0.42 0.70 0.00 0.00 0.48 0.00 0.00 0.00 0.00 1.00
32 -7.95 0.00 0.00 0.25 0.00 0.00 0.00 0.00 0.73 0.67 0.39 0.50 0.00 0.00 0.50 0.60 0.00 0.00 0.00 1.00
33 -7.7 0.68 0.00 0.23 0.00 0.00 0.00 0.00 0.63 0.66 0.46 0.45 0.00 0.00 0.49 0.69 0.00 0.00 0.00 1.00
34 -7.45 0.62 0.55 0.32 0.00 0.00 0.00 0.29 0.72 0.53 0.66 0.75 0.63 0.63 0.46 0.72 0.60 0.65 0.00 1.00
35 -7.2 0.58 0.60 0.41 0.21 0.00 0.00 0.37 0.69 0.55 0.67 0.76 0.66 0.66 0.45 0.66 0.53 0.65 0.00 1.00
36 -6.95 0.53 0.65 0.56 0.64 0.00 0.00 0.26 0.58 0.37 0.74 0.59 0.55 0.55 0.62 0.50 0.58 0.52 0.00 1.00
37 -6.7 0.55 0.66 0.58 0.65 0.61 0.00 0.37 0.54 0.36 0.72 0.70 0.52 0.52 0.60 0.63 0.63 0.51 0.00 1.00
38 -6.45 0.60 0.53 0.53 0.61 0.63 0.00 0.40 0.45 0.34 0.74 0.78 0.55 0.55 0.62 0.80 0.74 0.58 0.00 1.00
39 -6.2 0.75 0.56 0.62 0.71 0.70 0.00 0.44 0.53 0.41 0.72 0.70 0.65 0.65 0.68 0.80 0.73 0.68 0.00 1.00
40 -5.95 0.67 0.54 0.67 0.61 0.63 0.00 0.47 0.55 0.40 0.70 0.63 0.51 0.51 0.67 0.72 0.70 0.71 0.00 1.00
41 -5.7 0.69 0.56 0.62 0.69 0.69 0.00 0.46 0.54 0.42 0.72 0.73 0.58 0.58 0.67 0.76 0.73 0.70 0.00 1.00
42 -5.45 0.64 0.54 0.64 0.62 0.65 0.00 0.46 0.54 0.35 0.71 0.72 0.59 0.59 0.66 0.72 0.70 0.71 0.00 1.00
43 -5.2 0.55 0.52 0.66 0.58 0.59 0.00 0.46 0.48 0.28 0.68 0.68 0.50 0.50 0.66 0.73 0.76 0.65 0.00 1.00
44 -4.95 0.41 0.48 0.52 0.57 0.50 0.00 0.28 0.36 0.29 0.51 0.55 0.48 0.48 0.46 0.71 0.53 0.47 0.00 1.00
45 -4.7 0.43 0.54 0.53 0.65 0.46 0.16 0.26 0.32 0.27 0.44 0.48 0.38 0.38 0.47 0.64 0.46 0.35 0.00 1.00
46 -4.45 0.55 0.55 0.55 0.65 0.59 0.23 0.23 0.26 0.29 0.47 0.48 0.44 0.44 0.38 0.54 0.45 0.37 0.00 1.00
47 -4.2 0.54 0.57 0.55 0.64 0.65 0.33 0.31 0.67 0.23 0.42 0.63 0.44 0.44 0.54 0.51 0.46 0.36 0.21 1.00
48 -3.95 0.49 0.63 0.54 0.68 0.65 0.40 0.38 0.69 0.19 0.39 0.67 0.41 0.41 0.59 0.51 0.55 0.34 0.40 1.00
49 -3.7 0.60 0.54 0.63 0.68 0.66 0.36 0.64 0.76 0.39 0.54 0.68 0.42 0.42 0.73 0.59 0.71 0.43 0.40 1.00
50 -3.45 0.66 0.54 0.64 0.71 0.69 0.38 0.66 0.77 0.40 0.67 0.70 0.75 0.75 0.71 0.59 0.69 0.48 0.45 1.00
51 -3.2 0.65 0.57 0.70 0.73 0.71 0.41 0.69 0.81 0.45 0.73 0.69 0.76 0.77 0.57 0.58 0.72 0.48 0.49 1.00
52 -2.95 0.68 0.56 0.68 0.69 0.56 0.42 0.69 0.74 0.48 0.70 0.68 0.76 0.76 0.51 0.53 0.63 0.49 0.48 1.00
53 -2.7 0.74 0.54 0.68 0.65 0.60 0.46 0.75 0.77 0.50 0.72 0.70 0.79 0.78 0.53 0.58 0.66 0.52 0.47 1.00
54 -2.45 0.71 0.51 0.67 0.64 0.60 0.49 0.78 0.75 0.52 0.72 0.76 0.77 0.75 0.53 0.58 0.62 0.52 0.48 1.00
55 -2.2 0.68 0.49 0.72 0.63 0.58 0.47 0.75 0.56 0.52 0.60 0.55 0.63 0.61 0.54 0.53 0.74 0.54 0.47 1.00
56 -1.95 0.64 0.47 0.69 0.65 0.56 0.52 0.66 0.58 0.56 0.61 0.60 0.65 0.63 0.59 0.55 0.68 0.56 0.51 1.00
57 -1.7 0.86 0.63 0.76 0.74 0.81 0.63 0.87 0.84 0.81 0.78 0.83 0.79 0.79 0.76 0.79 0.79 0.69 0.69 1.00
58 -1.45 0.86 0.68 0.75 0.79 0.82 0.65 0.79 0.86 0.86 0.81 0.84 0.80 0.79 0.78 0.83 0.77 0.71 0.76 1.00
59 -1.2 0.84 0.67 0.77 0.75 0.83 0.66 0.78 0.84 0.84 0.79 0.85 0.78 0.78 0.78 0.85 0.74 0.71 0.76 1.00
60 -0.95 0.85 0.69 0.77 0.77 0.72 0.70 0.83 0.70 0.69 0.79 0.80 0.76 0.76 0.85 0.87 0.84 0.74 0.72 1.00
61 -0.7 0.84 0.75 0.62 0.82 0.73 0.72 0.81 0.73 0.69 0.80 0.82 0.76 0.76 0.82 0.74 0.80 0.77 0.75 1.00
62 -0.45 0.85 0.81 0.75 0.82 0.81 0.63 0.76 0.77 0.72 0.76 0.62 0.77 0.77 0.77 0.84 0.63 0.63 0.73 1.00
63 -0.2 0.82 0.80 0.74 0.81 0.83 0.63 0.78 0.84 0.73 0.74 0.66 0.82 0.82 0.72 0.84 0.60 0.64 0.75 1.00
64 0.05 0.89 0.81 0.77 0.86 0.87 0.74 0.78 0.86 0.79 0.77 0.83 0.84 0.83 0.78 0.84 0.62 0.69 0.81 1.00
65 0.3 0.90 0.77 0.76 0.82 0.88 0.77 0.79 0.86 0.85 0.75 0.81 0.82 0.80 0.78 0.91 0.75 0.84 0.82 1.00
66 0.55 0.90 0.80 0.74 0.82 0.82 0.73 0.74 0.86 0.88 0.77 0.81 0.81 0.80 0.84 0.91 0.78 0.84 0.84 1.00
67 0.8 0.87 0.79 0.74 0.79 0.82 0.78 0.72 0.86 0.83 0.74 0.82 0.75 0.74 0.84 0.92 0.77 0.81 0.85 1.00
68 1.05 0.90 0.82 0.77 0.83 0.83 0.81 0.76 0.86 0.85 0.76 0.84 0.79 0.77 0.83 0.93 0.82 0.83 0.86 1.00
69 1.3 0.87 0.75 0.74 0.81 0.86 0.81 0.77 0.85 0.84 0.75 0.78 0.83 0.82 0.86 0.89 0.81 0.83 0.87 1.00
70 1.55 0.87 0.78 0.76 0.83 0.86 0.81 0.79 0.83 0.84 0.77 0.74 0.79 0.78 0.90 0.88 0.84 0.86 0.84 1.00
71 1.8 0.88 0.75 0.75 0.83 0.89 0.85 0.78 0.81 0.81 0.78 0.75 0.78 0.78 0.89 0.88 0.84 0.85 0.80 1.00
72 2.05 0.87 0.79 0.73 0.81 0.87 0.83 0.75 0.85 0.81 0.77 0.80 0.81 0.84 0.89 0.87 0.87 0.86 0.81 1.00
73 2.3 0.89 0.75 0.73 0.82 0.88 0.82 0.74 0.81 0.80 0.76 0.74 0.80 0.81 0.87 0.91 0.85 0.86 0.79 1.00
74 2.55 0.87 0.83 0.71 0.81 0.86 0.84 0.76 0.81 0.78 0.79 0.78 0.85 0.83 0.84 0.90 0.87 0.86 0.83 1.00
75 2.8 0.84 0.80 0.72 0.82 0.88 0.86 0.73 0.74 0.76 0.82 0.76 0.82 0.82 0.85 0.89 0.84 0.83 0.79 1.00
76 3.05 0.83 0.76 0.72 0.77 0.86 0.83 0.74 0.74 0.81 0.78 0.76 0.80 0.78 0.82 0.89 0.81 0.83 0.78 1.00
77 3.3 0.82 0.75 0.75 0.73 0.86 0.84 0.75 0.73 0.83 0.80 0.74 0.78 0.77 0.84 0.90 0.81 0.83 0.77 1.00
78 3.55 0.83 0.75 0.70 0.69 0.81 0.89 0.82 0.74 0.87 0.72 0.74 0.80 0.80 0.85 0.90 0.84 0.82 0.59 1.00
79 3.8 0.80 0.75 0.64 0.67 0.74 0.84 0.78 0.78 0.88 0.74 0.78 0.75 0.76 0.82 0.89 0.84 0.82 0.58 1.00
80 4.05 0.78 0.76 0.62 0.63 0.67 0.76 0.79 0.74 0.87 0.72 0.76 0.75 0.74 0.84 0.90 0.85 0.84 0.00 1.00
81 4.3 0.70 0.82 0.53 0.66 0.00 0.67 0.00 0.69 0.85 0.66 0.73 0.00 0.00 0.00 0.86 0.78 0.84 0.00 1.00
82 4.55 0.67 0.00 0.31 0.20 0.00 0.54 0.00 0.42 0.00 0.61 0.00 0.00 0.00 0.00 0.87 0.80 0.85 0.00 1.00
83 4.8 0.00 0.00
84 5.05 0.00 0.00
85 5.3 0.00 0.00
86 5.55
87 5.8
88 6.05
10 11 12 13 14 15 16 17 181 2 3 4 5 6 7 8 9CT Slice No. Z
PI No.
Gold Standard
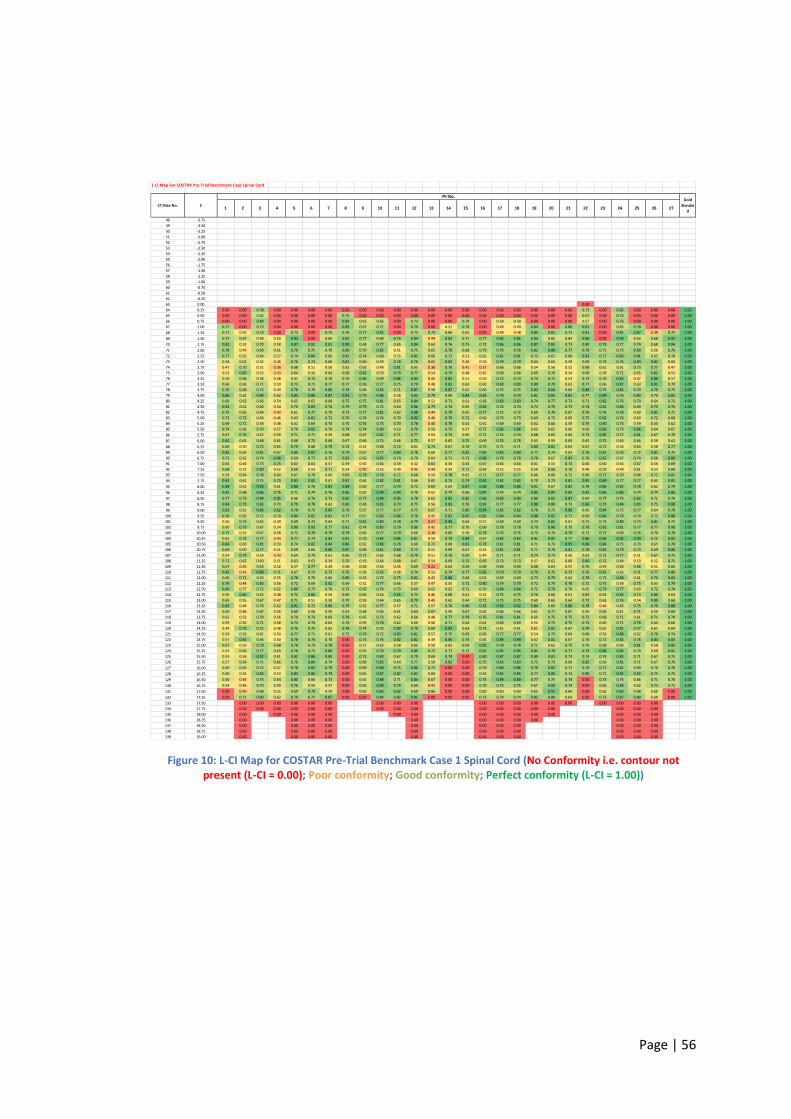
Page | 56
Figure 10: L-CI Map for COSTAR Pre-Trial Benchmark Case 1 Spinal Cord (No Conformity i.e. contour not present (L-CI = 0.00); Poor conformity; Good conformity; Perfect conformity (L-CI = 1.00))
L-CI Map For COSTAR Pre-Trial Benchmark Case Spinal Cord
48 -3.75
49 -3.50
50 -3.25
51 -3.00
52 -2.75
53 -2.50
54 -2.25
55 -2.00
56 -1.75
57 -1.50
58 -1.25
59 -1.00
60 -0.75
61 -0.50
62 -0.25
63 0.00 0.00
64 0.25 0.00 0.00 0.78 0.00 0.00 0.00 0.00 0.00 0.00 0.00 0.00 0.00 0.00 0.00 0.00 0.00 0.00 0.00 0.00 0.00 0.00 0.73 0.00 0.82 0.00 0.00 0.00 1.00
65 0.50 0.00 0.00 0.64 0.00 0.00 0.00 0.00 0.75 0.00 0.00 0.00 0.00 0.00 0.00 0.00 0.00 0.00 0.00 0.00 0.00 0.00 0.67 0.00 0.74 0.00 0.00 0.00 1.00
66 0.75 0.00 0.00 0.80 0.00 0.00 0.00 0.00 0.84 0.63 0.66 0.00 0.73 0.00 0.00 0.74 0.00 0.58 0.58 0.00 0.00 0.00 0.57 0.00 0.76 0.00 0.00 0.00 1.00
67 1.00 0.77 0.00 0.73 0.00 0.00 0.00 0.00 0.85 0.67 0.71 0.00 0.79 0.00 0.51 0.76 0.00 0.49 0.49 0.84 0.00 0.80 0.81 0.00 0.65 0.78 0.00 0.00 1.00
68 1.25 0.71 0.50 0.73 0.00 0.73 0.00 0.75 0.76 0.77 0.82 0.00 0.73 0.73 0.66 0.62 0.00 0.48 0.48 0.84 0.81 0.73 0.81 0.00 0.81 0.87 0.39 0.75 1.00
69 1.50 0.72 0.67 0.58 0.50 0.92 0.00 0.65 0.82 0.77 0.68 0.79 0.84 0.44 0.83 0.71 0.77 0.85 0.85 0.83 0.65 0.64 0.86 0.00 0.90 0.63 0.68 0.92 1.00
70 1.75 0.82 0.53 0.70 0.58 0.87 0.82 0.81 0.90 0.68 0.77 0.65 0.84 0.63 0.76 0.75 0.72 0.86 0.86 0.87 0.83 0.73 0.80 0.79 0.77 0.74 0.68 0.84 1.00
71 2.00 0.78 0.49 0.69 0.61 0.79 0.75 0.70 0.80 0.70 0.82 0.51 0.75 0.65 0.78 0.68 0.70 0.78 0.78 0.82 0.88 0.77 0.79 0.71 0.73 0.80 0.56 0.76 1.00
72 2.25 0.77 0.56 0.64 0.57 0.74 0.84 0.66 0.81 0.74 0.69 0.55 0.81 0.66 0.72 0.53 0.61 0.81 0.81 0.73 0.67 0.68 0.83 0.77 0.83 0.81 0.65 0.70 1.00
73 2.50 0.58 0.63 0.52 0.46 0.76 0.74 0.66 0.81 0.66 0.59 0.78 0.76 0.65 0.82 0.46 0.50 0.79 0.79 0.64 0.63 0.59 0.69 0.73 0.76 0.83 0.82 0.60 1.00
74 2.75 0.47 0.70 0.51 0.36 0.68 0.51 0.56 0.62 0.63 0.48 0.81 0.65 0.36 0.76 0.41 0.37 0.66 0.66 0.54 0.56 0.52 0.68 0.61 0.61 0.73 0.77 0.47 1.00
75 3.00 0.53 0.80 0.55 0.43 0.64 0.56 0.64 0.68 0.82 0.59 0.79 0.77 0.54 0.79 0.48 0.45 0.68 0.68 0.69 0.70 0.54 0.68 0.58 0.71 0.65 0.82 0.55 1.00
76 3.25 0.59 0.68 0.58 0.48 0.61 0.72 0.70 0.70 0.80 0.69 0.86 0.83 0.45 0.85 0.51 0.50 0.74 0.74 0.74 0.75 0.53 0.73 0.70 0.85 0.47 0.89 0.57 1.00
77 3.50 0.66 0.63 0.71 0.50 0.73 0.71 0.77 0.77 0.76 0.77 0.75 0.79 0.48 0.82 0.60 0.60 0.80 0.80 0.80 0.79 0.61 0.77 0.66 0.87 0.63 0.91 0.70 1.00
78 3.75 0.76 0.68 0.72 0.49 0.78 0.70 0.80 0.78 0.68 0.82 0.71 0.87 0.58 0.87 0.62 0.66 0.75 0.75 0.83 0.84 0.66 0.88 0.75 0.85 0.74 0.79 0.75 1.00
79 4.00 0.86 0.62 0.84 0.62 0.85 0.86 0.87 0.92 0.79 0.86 0.56 0.82 0.79 0.69 0.84 0.83 0.79 0.79 0.81 0.83 0.83 0.77 0.89 0.76 0.80 0.70 0.83 1.00
80 4.25 0.68 0.63 0.66 0.54 0.65 0.65 0.68 0.75 0.75 0.81 0.65 0.84 0.51 0.71 0.61 0.68 0.83 0.83 0.74 0.77 0.73 0.71 0.82 0.76 0.70 0.64 0.72 1.00
81 4.50 0.81 0.61 0.66 0.54 0.70 0.83 0.74 0.79 0.79 0.72 0.64 0.86 0.75 0.74 0.65 0.82 0.74 0.74 0.73 0.76 0.73 0.74 0.81 0.80 0.69 0.75 0.76 1.00
82 4.75 0.75 0.65 0.64 0.43 0.61 0.77 0.70 0.73 0.77 0.81 0.67 0.88 0.44 0.79 0.65 0.77 0.72 0.72 0.69 0.76 0.67 0.76 0.76 0.78 0.60 0.81 0.71 1.00
83 5.00 0.72 0.72 0.60 0.46 0.63 0.81 0.72 0.76 0.74 0.74 0.70 0.92 0.48 0.79 0.72 0.66 0.73 0.73 0.69 0.72 0.65 0.75 0.82 0.76 0.60 0.72 0.68 1.00
84 5.25 0.69 0.71 0.58 0.48 0.61 0.69 0.70 0.70 0.76 0.75 0.70 0.78 0.40 0.78 0.62 0.61 0.69 0.69 0.62 0.66 0.59 0.75 0.80 0.73 0.59 0.65 0.62 1.00
85 5.50 0.74 0.66 0.70 0.57 0.70 0.83 0.70 0.74 0.74 0.80 0.63 0.79 0.59 0.75 0.57 0.72 0.86 0.86 0.63 0.65 0.60 0.69 0.86 0.73 0.86 0.64 0.67 1.00
86 5.75 0.67 0.76 0.62 0.59 0.71 0.71 0.59 0.68 0.67 0.82 0.71 0.77 0.53 0.74 0.60 0.71 0.74 0.74 0.68 0.65 0.64 0.73 0.85 0.72 0.81 0.67 0.70 1.00
87 6.00 0.82 0.63 0.68 0.61 0.68 0.72 0.68 0.67 0.66 0.73 0.66 0.75 0.57 0.65 0.75 0.69 0.76 0.76 0.63 0.59 0.65 0.65 0.75 0.63 0.66 0.59 0.62 1.00
88 6.25 0.66 0.50 0.75 0.65 0.79 0.68 0.79 0.74 0.54 0.68 0.72 0.61 0.74 0.67 0.70 0.75 0.71 0.71 0.80 0.81 0.64 0.67 0.71 0.56 0.64 0.58 0.77 1.00
89 6.50 0.83 0.64 0.81 0.67 0.80 0.87 0.76 0.79 0.67 0.77 0.84 0.78 0.60 0.77 0.82 0.80 0.84 0.84 0.77 0.74 0.63 0.78 0.81 0.76 0.72 0.81 0.75 1.00
90 6.75 0.72 0.62 0.74 0.88 0.69 0.77 0.72 0.82 0.66 0.85 0.74 0.70 0.64 0.71 0.73 0.88 0.78 0.78 0.78 0.67 0.83 0.76 0.83 0.67 0.74 0.68 0.89 1.00
91 7.00 0.64 0.46 0.70 0.75 0.63 0.63 0.57 0.59 0.50 0.64 0.59 0.52 0.64 0.56 0.63 0.67 0.64 0.64 0.61 0.55 0.73 0.60 0.60 0.56 0.67 0.56 0.69 1.00
92 7.25 0.68 0.52 0.80 0.52 0.69 0.53 0.71 0.54 0.40 0.55 0.49 0.45 0.44 0.54 0.71 0.64 0.55 0.55 0.59 0.68 0.70 0.46 0.59 0.49 0.61 0.53 0.68 1.00
93 7.50 0.59 0.64 0.78 0.64 0.67 0.70 0.60 0.69 0.79 0.78 0.72 0.68 0.54 0.78 0.62 0.71 0.77 0.77 0.66 0.66 0.72 0.68 0.77 0.70 0.68 0.72 0.81 1.00
94 7.75 0.83 0.61 0.75 0.70 0.83 0.82 0.61 0.81 0.64 0.82 0.81 0.66 0.65 0.75 0.79 0.91 0.82 0.82 0.70 0.73 0.81 0.85 0.89 0.77 0.77 0.65 0.82 1.00
95 8.00 0.88 0.61 0.93 0.61 0.88 0.76 0.83 0.88 0.66 0.77 0.79 0.72 0.69 0.64 0.87 0.88 0.88 0.88 0.81 0.67 0.82 0.78 0.86 0.82 0.78 0.62 0.79 1.00
96 8.25 0.82 0.68 0.86 0.76 0.71 0.74 0.76 0.85 0.62 0.94 0.84 0.70 0.52 0.74 0.68 0.87 0.74 0.74 0.85 0.84 0.83 0.82 0.85 0.86 0.74 0.74 0.86 1.00
97 8.50 0.77 0.73 0.84 0.85 0.66 0.76 0.73 0.85 0.77 0.89 0.85 0.78 0.62 0.85 0.82 0.86 0.83 0.83 0.80 0.81 0.87 0.69 0.77 0.76 0.82 0.71 0.76 1.00
98 8.75 0.84 0.79 0.82 0.70 0.79 0.78 0.62 0.80 0.68 0.85 0.79 0.75 0.56 0.83 0.76 0.83 0.77 0.77 0.88 0.80 0.73 0.86 0.79 0.84 0.80 0.75 0.88 1.00
99 9.00 0.83 0.61 0.86 0.82 0.78 0.75 0.84 0.79 0.67 0.77 0.77 0.75 0.67 0.71 0.80 0.94 0.82 0.82 0.78 0.73 0.88 0.66 0.84 0.73 0.77 0.64 0.78 1.00
100 9.25 0.76 0.65 0.72 0.70 0.84 0.81 0.81 0.77 0.67 0.83 0.86 0.78 0.45 0.83 0.87 0.82 0.84 0.84 0.88 0.87 0.77 0.69 0.86 0.78 0.74 0.73 0.88 1.00
101 9.50 0.50 0.73 0.65 0.49 0.69 0.74 0.64 0.71 0.81 0.80 0.78 0.79 0.27 0.90 0.64 0.57 0.69 0.69 0.73 0.82 0.61 0.71 0.73 0.80 0.73 0.81 0.72 1.00
102 9.75 0.60 0.79 0.67 0.54 0.80 0.83 0.77 0.81 0.74 0.85 0.79 0.80 0.42 0.77 0.70 0.69 0.78 0.78 0.79 0.86 0.70 0.78 0.82 0.81 0.77 0.77 0.80 1.00
103 10.00 0.75 0.53 0.67 0.58 0.72 0.78 0.79 0.79 0.66 0.77 0.79 0.66 0.38 0.69 0.58 0.79 0.76 0.76 0.73 0.74 0.79 0.72 0.77 0.69 0.76 0.70 0.78 1.00
104 10.25 0.62 0.74 0.77 0.44 0.77 0.74 0.83 0.81 0.70 0.84 0.86 0.81 0.50 0.79 0.89 0.67 0.83 0.83 0.81 0.85 0.77 0.86 0.86 0.92 0.90 0.75 0.85 1.00
105 10.50 0.84 0.60 0.81 0.59 0.74 0.82 0.84 0.86 0.62 0.86 0.78 0.69 0.72 0.68 0.83 0.78 0.81 0.81 0.71 0.73 0.95 0.88 0.84 0.75 0.70 0.65 0.78 1.00
106 10.75 0.69 0.60 0.77 0.51 0.69 0.66 0.86 0.87 0.68 0.81 0.80 0.75 0.57 0.69 0.67 0.54 0.81 0.81 0.71 0.76 0.81 0.78 0.82 0.79 0.73 0.69 0.86 1.00
107 11.00 0.54 0.79 0.54 0.43 0.64 0.70 0.61 0.66 0.71 0.62 0.68 0.79 0.51 0.76 0.69 0.49 0.71 0.71 0.74 0.73 0.56 0.62 0.72 0.77 0.51 0.67 0.75 1.00
108 11.25 0.71 0.62 0.60 0.51 0.63 0.63 0.59 0.70 0.59 0.64 0.68 0.67 0.54 0.69 0.75 0.69 0.73 0.73 0.57 0.62 0.60 0.80 0.72 0.64 0.53 0.52 0.75 1.00
109 11.50 0.67 0.45 0.63 0.52 0.57 0.77 0.49 0.58 0.58 0.56 0.45 0.69 0.21 0.64 0.69 0.68 0.69 0.69 0.68 0.63 0.57 0.70 0.59 0.64 0.68 0.51 0.66 1.00
110 11.75 0.82 0.43 0.89 0.71 0.67 0.73 0.73 0.76 0.58 0.76 0.58 0.74 0.53 0.74 0.77 0.85 0.79 0.79 0.79 0.75 0.73 0.76 0.81 0.62 0.71 0.77 0.80 1.00
111 12.00 0.66 0.71 0.63 0.55 0.78 0.70 0.66 0.80 0.63 0.70 0.75 0.81 0.45 0.88 0.68 0.63 0.69 0.69 0.73 0.79 0.62 0.78 0.72 0.84 0.61 0.76 0.83 1.00
112 12.25 0.79 0.44 0.80 0.56 0.72 0.69 0.82 0.69 0.51 0.77 0.66 0.57 0.47 0.55 0.72 0.80 0.79 0.79 0.72 0.75 0.78 0.72 0.75 0.59 0.75 0.63 0.79 1.00
113 12.50 0.80 0.57 0.72 0.62 0.80 0.73 0.70 0.73 0.69 0.74 0.70 0.69 0.63 0.62 0.71 0.70 0.84 0.84 0.72 0.79 0.70 0.65 0.79 0.77 0.60 0.72 0.74 1.00
114 12.75 0.59 0.80 0.62 0.48 0.72 0.80 0.54 0.69 0.66 0.64 0.85 0.73 0.46 0.68 0.61 0.52 0.75 0.75 0.70 0.66 0.61 0.69 0.63 0.83 0.73 0.80 0.63 1.00
115 13.00 0.65 0.55 0.67 0.47 0.71 0.51 0.58 0.70 0.59 0.64 0.65 0.79 0.45 0.62 0.64 0.71 0.75 0.75 0.60 0.65 0.64 0.72 0.63 0.76 0.54 0.80 0.68 1.00
116 13.25 0.83 0.49 0.70 0.62 0.91 0.72 0.80 0.79 0.62 0.77 0.57 0.71 0.57 0.76 0.80 0.82 0.92 0.92 0.84 0.69 0.86 0.78 0.46 0.65 0.75 0.79 0.88 1.00
117 13.50 0.60 0.46 0.67 0.55 0.69 0.58 0.59 0.63 0.64 0.64 0.61 0.64 0.67 0.59 0.67 0.62 0.66 0.66 0.61 0.71 0.67 0.59 0.65 0.61 0.71 0.59 0.69 1.00
118 13.75 0.61 0.53 0.70 0.56 0.70 0.73 0.69 0.78 0.65 0.73 0.62 0.66 0.48 0.77 0.78 0.76 0.81 0.81 0.65 0.75 0.75 0.72 0.68 0.71 0.61 0.71 0.74 1.00
119 14.00 0.55 0.56 0.71 0.58 0.73 0.70 0.62 0.70 0.59 0.78 0.62 0.60 0.50 0.71 0.64 0.62 0.69 0.69 0.52 0.73 0.75 0.74 0.60 0.71 0.78 0.64 0.66 1.00
120 14.25 0.49 0.79 0.72 0.48 0.76 0.75 0.62 0.78 0.74 0.70 0.80 0.79 0.69 0.93 0.63 0.73 0.61 0.61 0.61 0.82 0.67 0.79 0.61 0.81 0.77 0.61 0.64 1.00
121 14.50 0.56 0.59 0.61 0.50 0.77 0.71 0.61 0.72 0.76 0.72 0.83 0.81 0.57 0.75 0.69 0.66 0.77 0.77 0.54 0.73 0.64 0.68 0.58 0.88 0.62 0.76 0.74 1.00
122 14.75 0.57 0.83 0.66 0.50 0.78 0.78 0.70 0.00 0.74 0.76 0.82 0.82 0.49 0.85 0.74 0.64 0.89 0.89 0.62 0.81 0.67 0.70 0.72 0.82 0.76 0.84 0.83 1.00
123 15.00 0.67 0.50 0.79 0.68 0.78 0.73 0.78 0.00 0.57 0.63 0.58 0.65 0.50 0.62 0.69 0.85 0.78 0.78 0.71 0.62 0.75 0.70 0.68 0.64 0.81 0.59 0.85 1.00
124 15.25 0.53 0.64 0.77 0.63 0.78 0.73 0.80 0.00 0.65 0.78 0.79 0.80 0.72 0.71 0.72 0.82 0.85 0.85 0.81 0.78 0.77 0.79 0.88 0.84 0.70 0.60 0.81 1.00
125 15.50 0.55 0.56 0.91 0.61 0.82 0.86 0.80 0.00 0.73 0.80 0.67 0.79 0.69 0.78 0.00 0.80 0.87 0.87 0.80 0.81 0.73 0.74 0.74 0.85 0.71 0.67 0.75 1.00
126 15.75 0.57 0.64 0.71 0.66 0.76 0.84 0.74 0.00 0.68 0.85 0.64 0.77 0.58 0.82 0.00 0.75 0.83 0.83 0.75 0.73 0.69 0.82 0.66 0.81 0.71 0.67 0.76 1.00
127 16.00 0.60 0.65 0.72 0.57 0.78 0.83 0.79 0.00 0.69 0.88 0.75 0.86 0.73 0.00 0.00 0.70 0.86 0.86 0.79 0.82 0.71 0.76 0.77 0.81 0.69 0.70 0.76 1.00
128 16.25 0.60 0.54 0.82 0.53 0.83 0.85 0.79 0.00 0.65 0.87 0.82 0.82 0.60 0.00 0.00 0.63 0.85 0.85 0.77 0.85 0.74 0.80 0.71 0.91 0.82 0.75 0.75 1.00
129 16.50 0.60 0.44 0.73 0.64 0.80 0.66 0.73 0.00 0.62 0.88 0.71 0.84 0.67 0.00 0.00 0.75 0.89 0.89 0.77 0.73 0.74 0.00 0.73 0.74 0.66 0.71 0.70 1.00
130 16.75 0.54 0.46 0.70 0.59 0.76 0.59 0.57 0.00 0.65 0.89 0.79 0.69 0.41 0.00 0.00 0.70 0.75 0.75 0.67 0.82 0.74 0.00 0.66 0.84 0.62 0.73 0.71 1.00
131 17.00 0.00 0.40 0.68 0.55 0.69 0.79 0.59 0.00 0.63 0.85 0.82 0.69 0.66 0.00 0.00 0.60 0.60 0.60 0.65 0.91 0.64 0.00 0.62 0.83 0.68 0.60 0.00 1.00
132 17.25 0.00 0.71 0.80 0.62 0.79 0.77 0.87 0.00 0.00 0.84 0.82 0.91 0.00 0.00 0.00 0.73 0.74 0.74 0.82 0.80 0.64 0.00 0.73 0.87 0.80 0.60 0.00 1.00
133 17.50 0.00 0.00 0.00 0.00 0.00 0.00 0.00 0.00 0.00 0.00 0.00 0.00 0.00 0.00 0.00 0.00 0.00 0.00 0.00
134 17.75 0.00 0.00 0.00 0.00 0.00 0.00 0.00 0.00 0.00 0.00 0.00 0.00 0.00 0.00 0.00 0.00 0.00
135 18.00 0.00 0.00 0.00 0.00 0.00 0.00 0.00 0.00 0.00 0.00 0.00 0.00 0.00 0.00 0.00
136 18.25 0.00 0.00 0.00 0.00 0.00 0.00 0.00 0.00 0.00 0.00 0.00 0.00
137 18.50 0.00 0.00 0.00 0.00 0.00 0.00 0.00 0.00 0.00 0.00 0.00
138 18.75 0.00 0.00 0.00 0.00 0.00 0.00 0.00 0.00 0.00 0.00 0.00
139 19.00 0.00 0.00 0.00 0.00 0.00 0.00 0.00 0.00 0.00 0.00 0.00
25 26 2716 17 18 19 20 21 22 23 24CT Slice No. Z
PI No.
1 2 3 4 5 6 7 8 9 10 11 12 13 14 15
Gold
Standar
d
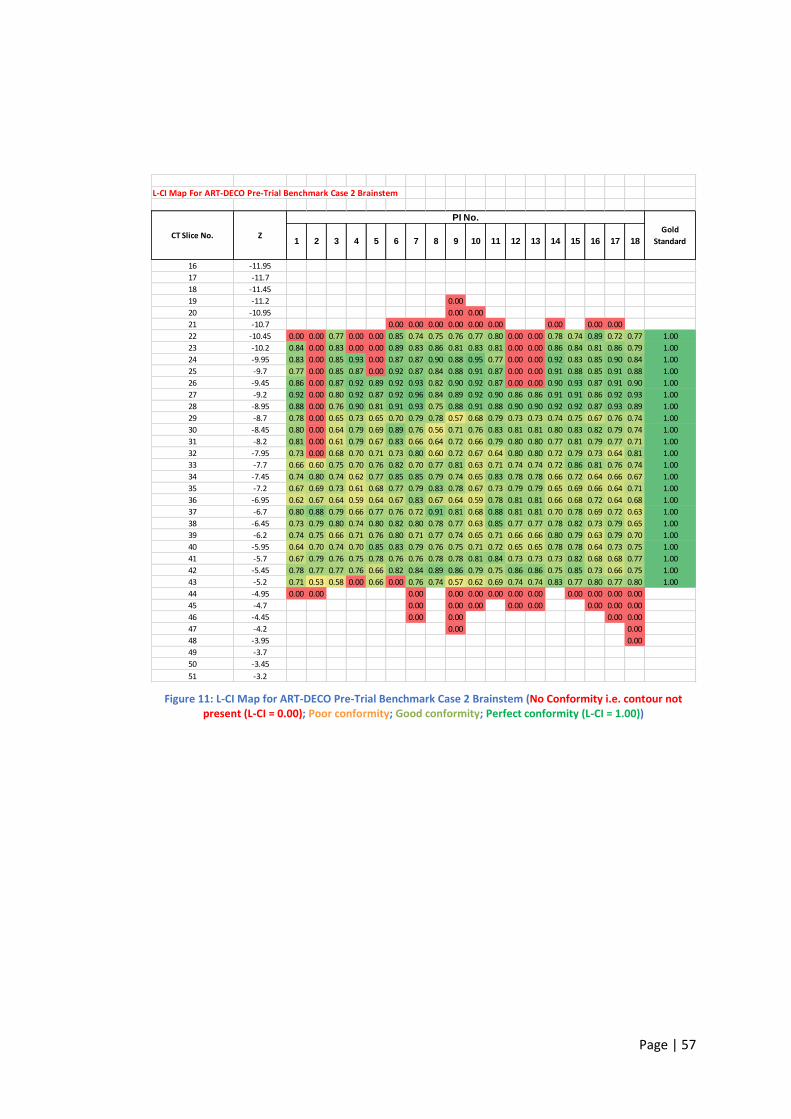
Page | 57
Figure 11: L-CI Map for ART-DECO Pre-Trial Benchmark Case 2 Brainstem (No Conformity i.e. contour not present (L-CI = 0.00); Poor conformity; Good conformity; Perfect conformity (L-CI = 1.00))
L-CI Map For ART-DECO Pre-Trial Benchmark Case 2 Brainstem
16 -11.95
17 -11.7
18 -11.45
19 -11.2 0.00
20 -10.95 0.00 0.00
21 -10.7 0.00 0.00 0.00 0.00 0.00 0.00 0.00 0.00 0.00
22 -10.45 0.00 0.00 0.77 0.00 0.00 0.85 0.74 0.75 0.76 0.77 0.80 0.00 0.00 0.78 0.74 0.89 0.72 0.77 1.00
23 -10.2 0.84 0.00 0.83 0.00 0.00 0.89 0.83 0.86 0.81 0.83 0.81 0.00 0.00 0.86 0.84 0.81 0.86 0.79 1.00
24 -9.95 0.83 0.00 0.85 0.93 0.00 0.87 0.87 0.90 0.88 0.95 0.77 0.00 0.00 0.92 0.83 0.85 0.90 0.84 1.00
25 -9.7 0.77 0.00 0.85 0.87 0.00 0.92 0.87 0.84 0.88 0.91 0.87 0.00 0.00 0.91 0.88 0.85 0.91 0.88 1.00
26 -9.45 0.86 0.00 0.87 0.92 0.89 0.92 0.93 0.82 0.90 0.92 0.87 0.00 0.00 0.90 0.93 0.87 0.91 0.90 1.00
27 -9.2 0.92 0.00 0.80 0.92 0.87 0.92 0.96 0.84 0.89 0.92 0.90 0.86 0.86 0.91 0.91 0.86 0.92 0.93 1.00
28 -8.95 0.88 0.00 0.76 0.90 0.81 0.91 0.93 0.75 0.88 0.91 0.88 0.90 0.90 0.92 0.92 0.87 0.93 0.89 1.00
29 -8.7 0.78 0.00 0.65 0.73 0.65 0.70 0.79 0.78 0.57 0.68 0.79 0.73 0.73 0.74 0.75 0.67 0.76 0.74 1.00
30 -8.45 0.80 0.00 0.64 0.79 0.69 0.89 0.76 0.56 0.71 0.76 0.83 0.81 0.81 0.80 0.83 0.82 0.79 0.74 1.00
31 -8.2 0.81 0.00 0.61 0.79 0.67 0.83 0.66 0.64 0.72 0.66 0.79 0.80 0.80 0.77 0.81 0.79 0.77 0.71 1.00
32 -7.95 0.73 0.00 0.68 0.70 0.71 0.73 0.80 0.60 0.72 0.67 0.64 0.80 0.80 0.72 0.79 0.73 0.64 0.81 1.00
33 -7.7 0.66 0.60 0.75 0.70 0.76 0.82 0.70 0.77 0.81 0.63 0.71 0.74 0.74 0.72 0.86 0.81 0.76 0.74 1.00
34 -7.45 0.74 0.80 0.74 0.62 0.77 0.85 0.85 0.79 0.74 0.65 0.83 0.78 0.78 0.66 0.72 0.64 0.66 0.67 1.00
35 -7.2 0.67 0.69 0.73 0.61 0.68 0.77 0.79 0.83 0.78 0.67 0.73 0.79 0.79 0.65 0.69 0.66 0.64 0.71 1.00
36 -6.95 0.62 0.67 0.64 0.59 0.64 0.67 0.83 0.67 0.64 0.59 0.78 0.81 0.81 0.66 0.68 0.72 0.64 0.68 1.00
37 -6.7 0.80 0.88 0.79 0.66 0.77 0.76 0.72 0.91 0.81 0.68 0.88 0.81 0.81 0.70 0.78 0.69 0.72 0.63 1.00
38 -6.45 0.73 0.79 0.80 0.74 0.80 0.82 0.80 0.78 0.77 0.63 0.85 0.77 0.77 0.78 0.82 0.73 0.79 0.65 1.00
39 -6.2 0.74 0.75 0.66 0.71 0.76 0.80 0.71 0.77 0.74 0.65 0.71 0.66 0.66 0.80 0.79 0.63 0.79 0.70 1.00
40 -5.95 0.64 0.70 0.74 0.70 0.85 0.83 0.79 0.76 0.75 0.71 0.72 0.65 0.65 0.78 0.78 0.64 0.73 0.75 1.00
41 -5.7 0.67 0.79 0.76 0.75 0.78 0.76 0.76 0.78 0.78 0.81 0.84 0.73 0.73 0.73 0.82 0.68 0.68 0.77 1.00
42 -5.45 0.78 0.77 0.77 0.76 0.66 0.82 0.84 0.89 0.86 0.79 0.75 0.86 0.86 0.75 0.85 0.73 0.66 0.75 1.00
43 -5.2 0.71 0.53 0.58 0.00 0.66 0.00 0.76 0.74 0.57 0.62 0.69 0.74 0.74 0.83 0.77 0.80 0.77 0.80 1.00
44 -4.95 0.00 0.00 0.00 0.00 0.00 0.00 0.00 0.00 0.00 0.00 0.00 0.00
45 -4.7 0.00 0.00 0.00 0.00 0.00 0.00 0.00 0.00
46 -4.45 0.00 0.00 0.00 0.00
47 -4.2 0.00 0.00
48 -3.95 0.00
49 -3.7
50 -3.45
51 -3.2
10 11 12 13 14 15 16 17 181 2 3 4 5 6 7 8 9CT Slice No. Z
PI No.
Gold
Standard
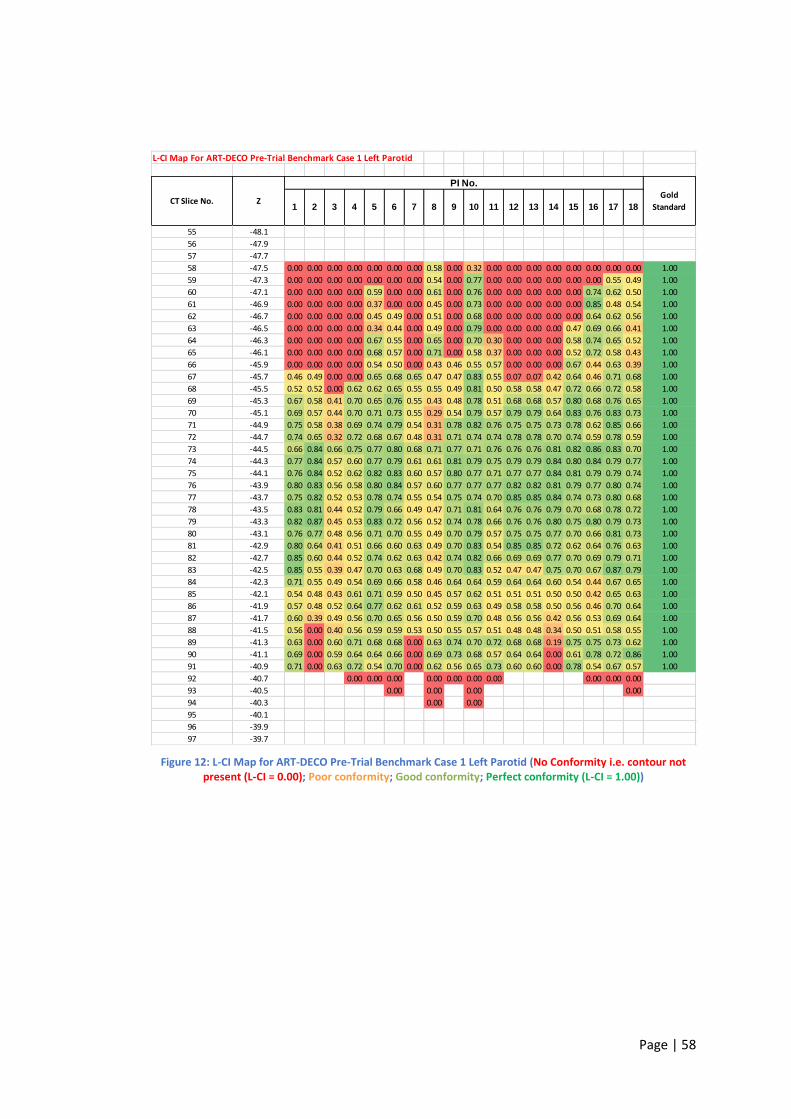
Page | 58
Figure 12: L-CI Map for ART-DECO Pre-Trial Benchmark Case 1 Left Parotid (No Conformity i.e. contour not present (L-CI = 0.00); Poor conformity; Good conformity; Perfect conformity (L-CI = 1.00))
L-CI Map For ART-DECO Pre-Trial Benchmark Case 1 Left Parotid
55 -48.1
56 -47.9
57 -47.7
58 -47.5 0.00 0.00 0.00 0.00 0.00 0.00 0.00 0.58 0.00 0.32 0.00 0.00 0.00 0.00 0.00 0.00 0.00 0.00 1.00
59 -47.3 0.00 0.00 0.00 0.00 0.00 0.00 0.00 0.54 0.00 0.77 0.00 0.00 0.00 0.00 0.00 0.00 0.55 0.49 1.00
60 -47.1 0.00 0.00 0.00 0.00 0.59 0.00 0.00 0.61 0.00 0.76 0.00 0.00 0.00 0.00 0.00 0.74 0.62 0.50 1.00
61 -46.9 0.00 0.00 0.00 0.00 0.37 0.00 0.00 0.45 0.00 0.73 0.00 0.00 0.00 0.00 0.00 0.85 0.48 0.54 1.00
62 -46.7 0.00 0.00 0.00 0.00 0.45 0.49 0.00 0.51 0.00 0.68 0.00 0.00 0.00 0.00 0.00 0.64 0.62 0.56 1.00
63 -46.5 0.00 0.00 0.00 0.00 0.34 0.44 0.00 0.49 0.00 0.79 0.00 0.00 0.00 0.00 0.47 0.69 0.66 0.41 1.00
64 -46.3 0.00 0.00 0.00 0.00 0.67 0.55 0.00 0.65 0.00 0.70 0.30 0.00 0.00 0.00 0.58 0.74 0.65 0.52 1.00
65 -46.1 0.00 0.00 0.00 0.00 0.68 0.57 0.00 0.71 0.00 0.58 0.37 0.00 0.00 0.00 0.52 0.72 0.58 0.43 1.00
66 -45.9 0.00 0.00 0.00 0.00 0.54 0.50 0.00 0.43 0.46 0.55 0.57 0.00 0.00 0.00 0.67 0.44 0.63 0.39 1.00
67 -45.7 0.46 0.49 0.00 0.00 0.65 0.68 0.65 0.47 0.47 0.83 0.55 0.07 0.07 0.42 0.64 0.46 0.71 0.68 1.00
68 -45.5 0.52 0.52 0.00 0.62 0.62 0.65 0.55 0.55 0.49 0.81 0.50 0.58 0.58 0.47 0.72 0.66 0.72 0.58 1.00
69 -45.3 0.67 0.58 0.41 0.70 0.65 0.76 0.55 0.43 0.48 0.78 0.51 0.68 0.68 0.57 0.80 0.68 0.76 0.65 1.00
70 -45.1 0.69 0.57 0.44 0.70 0.71 0.73 0.55 0.29 0.54 0.79 0.57 0.79 0.79 0.64 0.83 0.76 0.83 0.73 1.00
71 -44.9 0.75 0.58 0.38 0.69 0.74 0.79 0.54 0.31 0.78 0.82 0.76 0.75 0.75 0.73 0.78 0.62 0.85 0.66 1.00
72 -44.7 0.74 0.65 0.32 0.72 0.68 0.67 0.48 0.31 0.71 0.74 0.74 0.78 0.78 0.70 0.74 0.59 0.78 0.59 1.00
73 -44.5 0.66 0.84 0.66 0.75 0.77 0.80 0.68 0.71 0.77 0.71 0.76 0.76 0.76 0.81 0.82 0.86 0.83 0.70 1.00
74 -44.3 0.77 0.84 0.57 0.60 0.77 0.79 0.61 0.61 0.81 0.79 0.75 0.79 0.79 0.84 0.80 0.84 0.79 0.77 1.00
75 -44.1 0.76 0.84 0.52 0.62 0.82 0.83 0.60 0.57 0.80 0.77 0.71 0.77 0.77 0.84 0.81 0.79 0.79 0.74 1.00
76 -43.9 0.80 0.83 0.56 0.58 0.80 0.84 0.57 0.60 0.77 0.77 0.77 0.82 0.82 0.81 0.79 0.77 0.80 0.74 1.00
77 -43.7 0.75 0.82 0.52 0.53 0.78 0.74 0.55 0.54 0.75 0.74 0.70 0.85 0.85 0.84 0.74 0.73 0.80 0.68 1.00
78 -43.5 0.83 0.81 0.44 0.52 0.79 0.66 0.49 0.47 0.71 0.81 0.64 0.76 0.76 0.79 0.70 0.68 0.78 0.72 1.00
79 -43.3 0.82 0.87 0.45 0.53 0.83 0.72 0.56 0.52 0.74 0.78 0.66 0.76 0.76 0.80 0.75 0.80 0.79 0.73 1.00
80 -43.1 0.76 0.77 0.48 0.56 0.71 0.70 0.55 0.49 0.70 0.79 0.57 0.75 0.75 0.77 0.70 0.66 0.81 0.73 1.00
81 -42.9 0.80 0.64 0.41 0.51 0.66 0.60 0.63 0.49 0.70 0.83 0.54 0.85 0.85 0.72 0.62 0.64 0.76 0.63 1.00
82 -42.7 0.85 0.60 0.44 0.52 0.74 0.62 0.63 0.42 0.74 0.82 0.66 0.69 0.69 0.77 0.70 0.69 0.79 0.71 1.00
83 -42.5 0.85 0.55 0.39 0.47 0.70 0.63 0.68 0.49 0.70 0.83 0.52 0.47 0.47 0.75 0.70 0.67 0.87 0.79 1.00
84 -42.3 0.71 0.55 0.49 0.54 0.69 0.66 0.58 0.46 0.64 0.64 0.59 0.64 0.64 0.60 0.54 0.44 0.67 0.65 1.00
85 -42.1 0.54 0.48 0.43 0.61 0.71 0.59 0.50 0.45 0.57 0.62 0.51 0.51 0.51 0.50 0.50 0.42 0.65 0.63 1.00
86 -41.9 0.57 0.48 0.52 0.64 0.77 0.62 0.61 0.52 0.59 0.63 0.49 0.58 0.58 0.50 0.56 0.46 0.70 0.64 1.00
87 -41.7 0.60 0.39 0.49 0.56 0.70 0.65 0.56 0.50 0.59 0.70 0.48 0.56 0.56 0.42 0.56 0.53 0.69 0.64 1.00
88 -41.5 0.56 0.00 0.40 0.56 0.59 0.59 0.53 0.50 0.55 0.57 0.51 0.48 0.48 0.34 0.50 0.51 0.58 0.55 1.00
89 -41.3 0.63 0.00 0.60 0.71 0.68 0.68 0.00 0.63 0.74 0.70 0.72 0.68 0.68 0.19 0.75 0.75 0.73 0.62 1.00
90 -41.1 0.69 0.00 0.59 0.64 0.64 0.66 0.00 0.69 0.73 0.68 0.57 0.64 0.64 0.00 0.61 0.78 0.72 0.86 1.00
91 -40.9 0.71 0.00 0.63 0.72 0.54 0.70 0.00 0.62 0.56 0.65 0.73 0.60 0.60 0.00 0.78 0.54 0.67 0.57 1.00
92 -40.7 0.00 0.00 0.00 0.00 0.00 0.00 0.00 0.00 0.00 0.00
93 -40.5 0.00 0.00 0.00 0.00
94 -40.3 0.00 0.00
95 -40.1
96 -39.9
97 -39.7
14 15 16 17 189 10 11 12 134 5 6 7 81 2 3Z
PI No.
Gold
StandardCT Slice No.
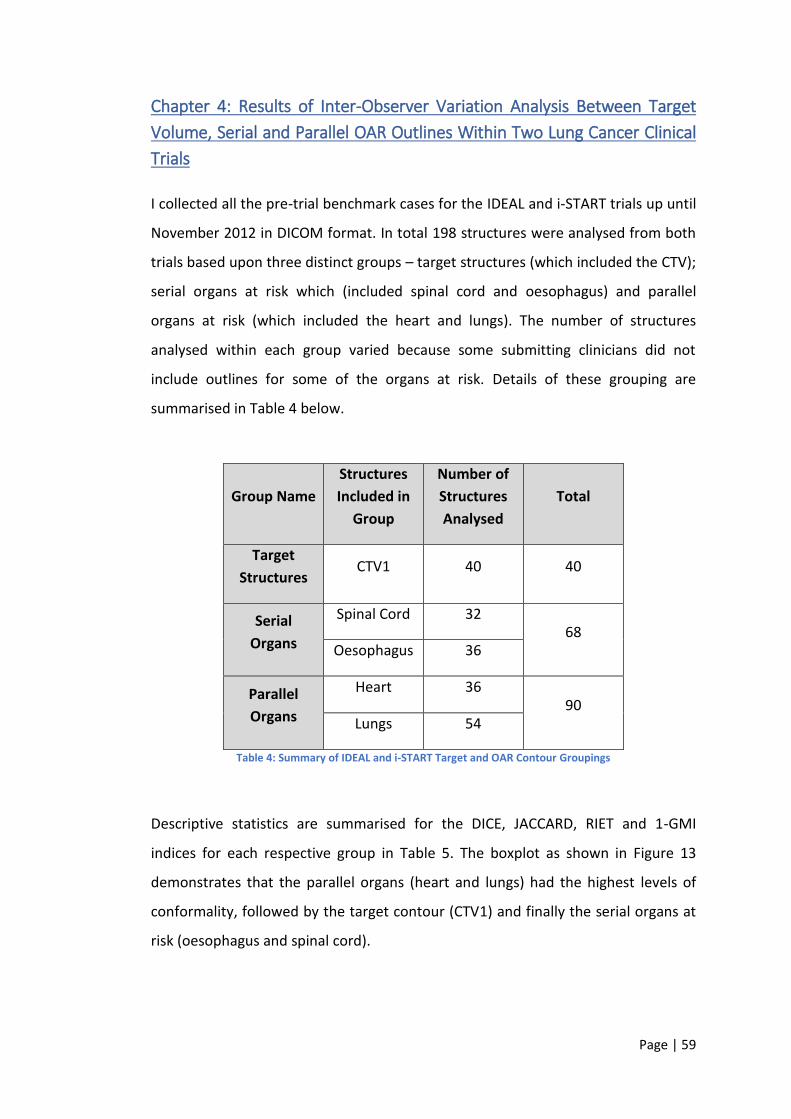
Page | 59
Chapter 4: Results of Inter-Observer Variation Analysis Between Target
Volume, Serial and Parallel OAR Outlines Within Two Lung Cancer Clinical
Trials
I collected all the pre-trial benchmark cases for the IDEAL and i-START trials up until
November 2012 in DICOM format. In total 198 structures were analysed from both
trials based upon three distinct groups – target structures (which included the CTV);
serial organs at risk which (included spinal cord and oesophagus) and parallel
organs at risk (which included the heart and lungs). The number of structures
analysed within each group varied because some submitting clinicians did not
include outlines for some of the organs at risk. Details of these grouping are
summarised in Table 4 below.
Group Name
Structures
Included in
Group
Number of
Structures
Analysed
Total
Target
Structures CTV1 40 40
Serial
Organs
Spinal Cord 32 68
Oesophagus 36
Parallel
Organs
Heart 36 90
Lungs 54
Table 4: Summary of IDEAL and i-START Target and OAR Contour Groupings
Descriptive statistics are summarised for the DICE, JACCARD, RIET and 1-GMI
indices for each respective group in Table 5. The boxplot as shown in Figure 13
demonstrates that the parallel organs (heart and lungs) had the highest levels of
conformality, followed by the target contour (CTV1) and finally the serial organs at
risk (oesophagus and spinal cord).
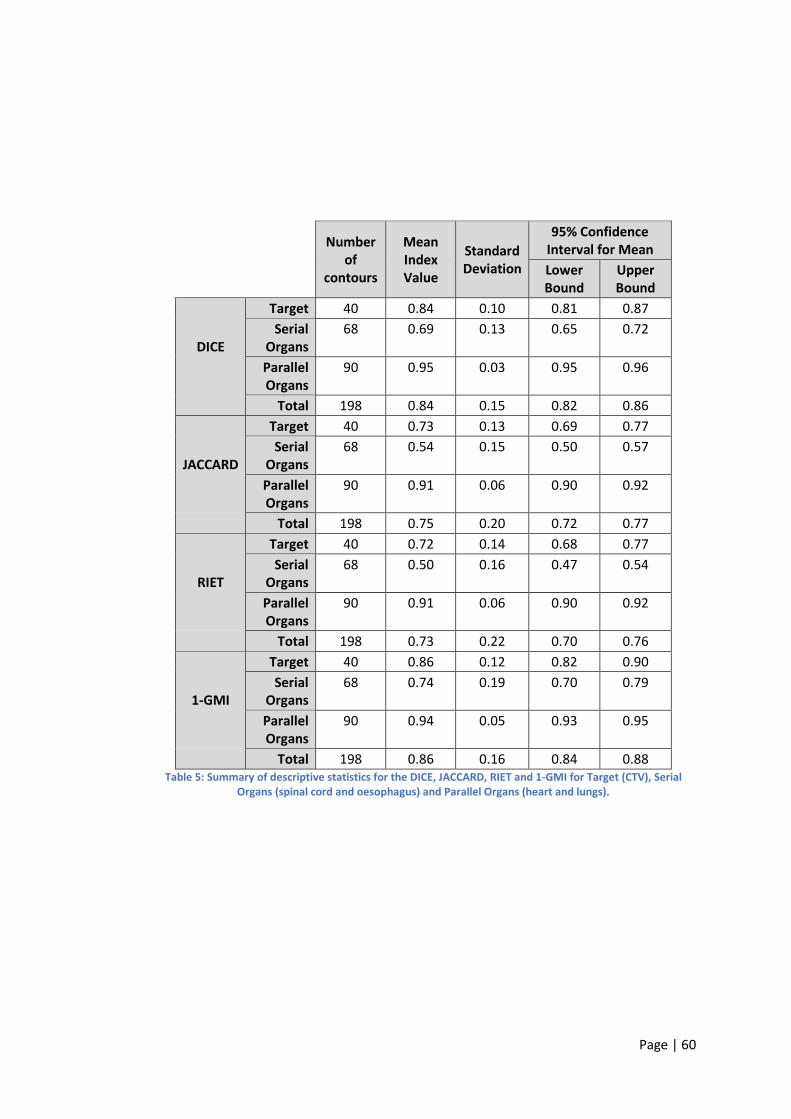
Page | 60
Number of
contours
Mean Index Value
Standard Deviation
95% Confidence Interval for Mean
Lower Bound
Upper Bound
DICE
Target 40 0.84 0.10 0.81 0.87
Serial Organs
68 0.69 0.13 0.65 0.72
Parallel Organs
90 0.95 0.03 0.95 0.96
Total 198 0.84 0.15 0.82 0.86
JACCARD
Target 40 0.73 0.13 0.69 0.77
Serial Organs
68 0.54 0.15 0.50 0.57
Parallel Organs
90 0.91 0.06 0.90 0.92
Total 198 0.75 0.20 0.72 0.77
RIET
Target 40 0.72 0.14 0.68 0.77
Serial Organs
68 0.50 0.16 0.47 0.54
Parallel Organs
90 0.91 0.06 0.90 0.92
Total 198 0.73 0.22 0.70 0.76
1-GMI
Target 40 0.86 0.12 0.82 0.90
Serial Organs
68 0.74 0.19 0.70 0.79
Parallel Organs
90 0.94 0.05 0.93 0.95
Total 198 0.86 0.16 0.84 0.88
Table 5: Summary of descriptive statistics for the DICE, JACCARD, RIET and 1-GMI for Target (CTV), Serial Organs (spinal cord and oesophagus) and Parallel Organs (heart and lungs).
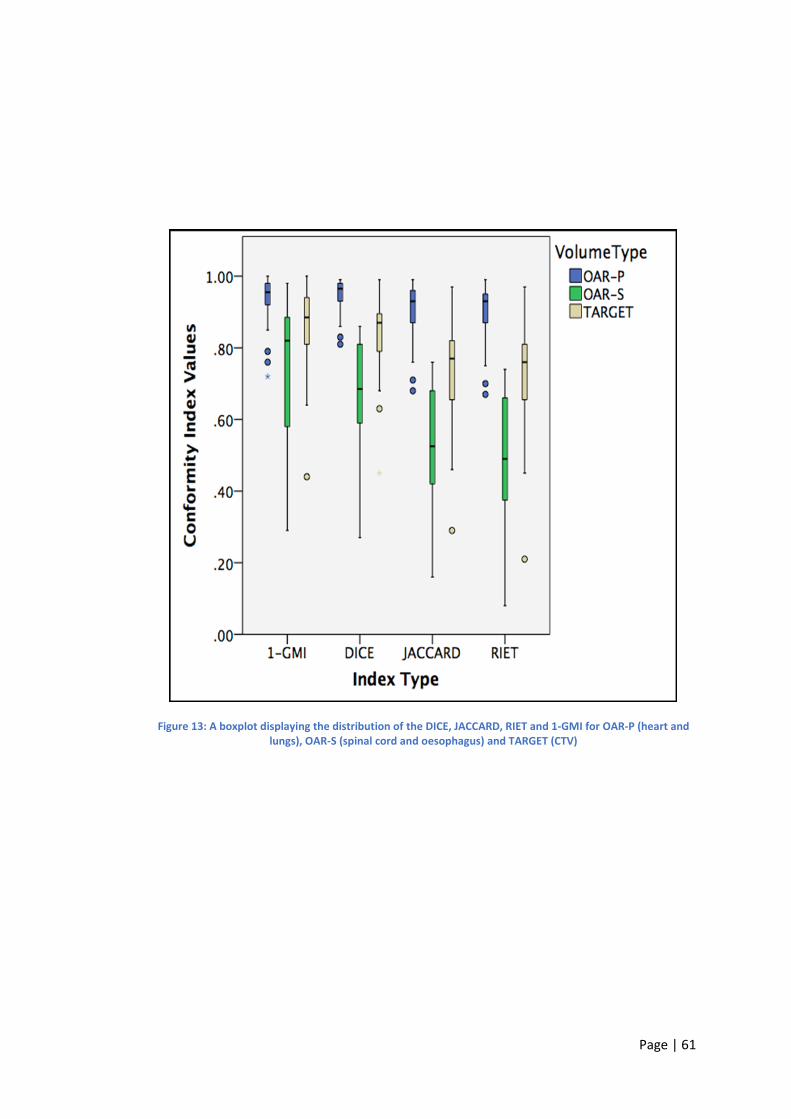
Page | 61
Figure 13: A boxplot displaying the distribution of the DICE, JACCARD, RIET and 1-GMI for OAR-P (heart and lungs), OAR-S (spinal cord and oesophagus) and TARGET (CTV)
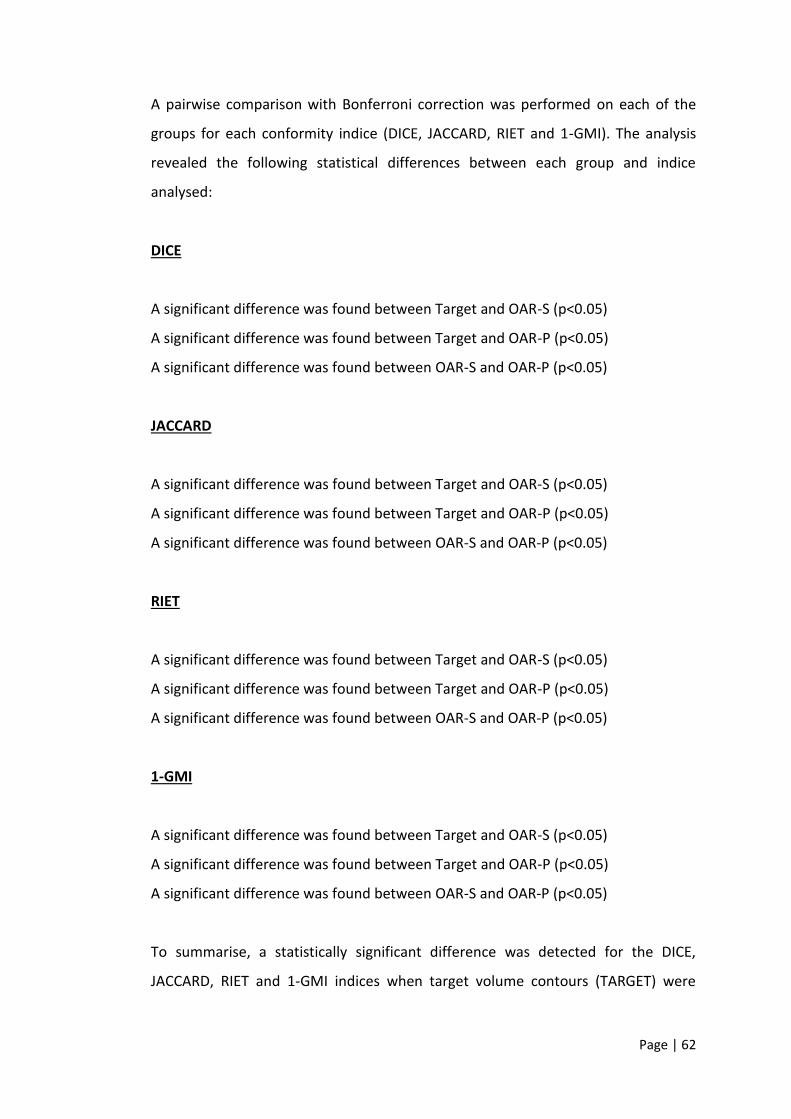
Page | 62
A pairwise comparison with Bonferroni correction was performed on each of the
groups for each conformity indice (DICE, JACCARD, RIET and 1-GMI). The analysis
revealed the following statistical differences between each group and indice
analysed:
DICE
A significant difference was found between Target and OAR-S (p<0.05)
A significant difference was found between Target and OAR-P (p<0.05)
A significant difference was found between OAR-S and OAR-P (p<0.05)
JACCARD
A significant difference was found between Target and OAR-S (p<0.05)
A significant difference was found between Target and OAR-P (p<0.05)
A significant difference was found between OAR-S and OAR-P (p<0.05)
RIET
A significant difference was found between Target and OAR-S (p<0.05)
A significant difference was found between Target and OAR-P (p<0.05)
A significant difference was found between OAR-S and OAR-P (p<0.05)
1-GMI
A significant difference was found between Target and OAR-S (p<0.05)
A significant difference was found between Target and OAR-P (p<0.05)
A significant difference was found between OAR-S and OAR-P (p<0.05)
To summarise, a statistically significant difference was detected for the DICE,
JACCARD, RIET and 1-GMI indices when target volume contours (TARGET) were
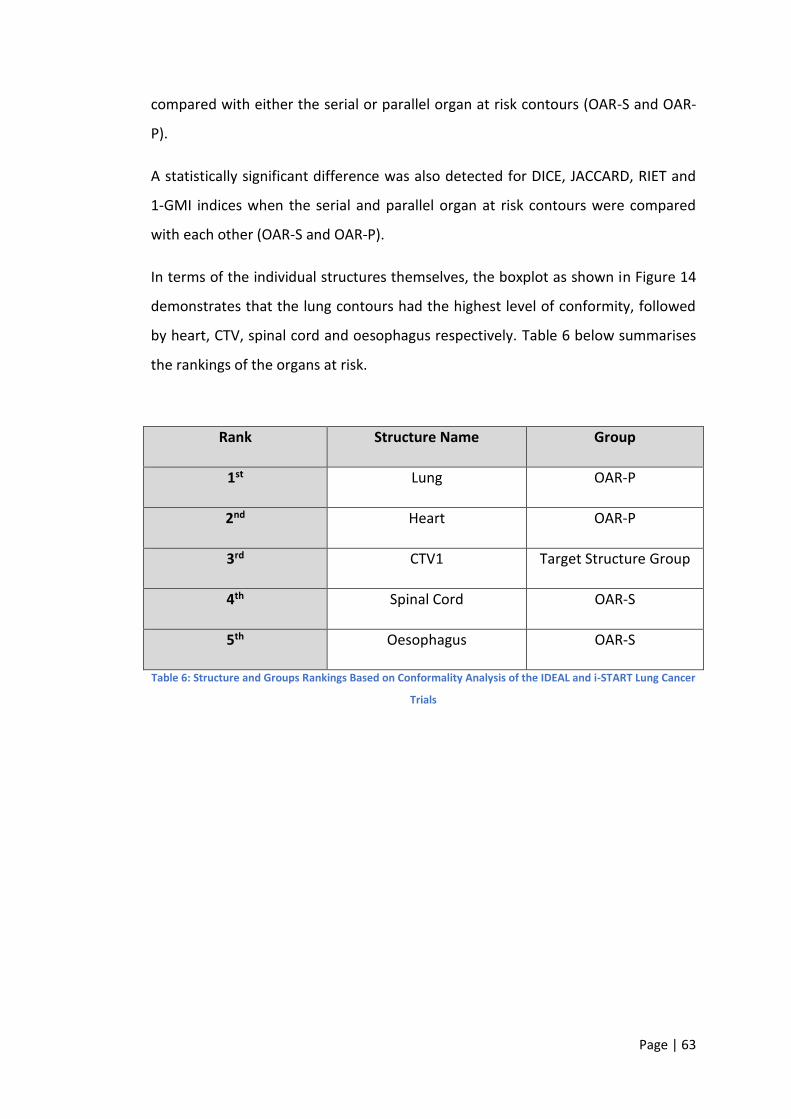
Page | 63
compared with either the serial or parallel organ at risk contours (OAR-S and OAR-
P).
A statistically significant difference was also detected for DICE, JACCARD, RIET and
1-GMI indices when the serial and parallel organ at risk contours were compared
with each other (OAR-S and OAR-P).
In terms of the individual structures themselves, the boxplot as shown in Figure 14
demonstrates that the lung contours had the highest level of conformity, followed
by heart, CTV, spinal cord and oesophagus respectively. Table 6 below summarises
the rankings of the organs at risk.
Rank Structure Name Group
1st Lung OAR-P
2nd Heart OAR-P
3rd CTV1 Target Structure Group
4th Spinal Cord OAR-S
5th Oesophagus OAR-S
Table 6: Structure and Groups Rankings Based on Conformality Analysis of the IDEAL and i-START Lung Cancer
Trials
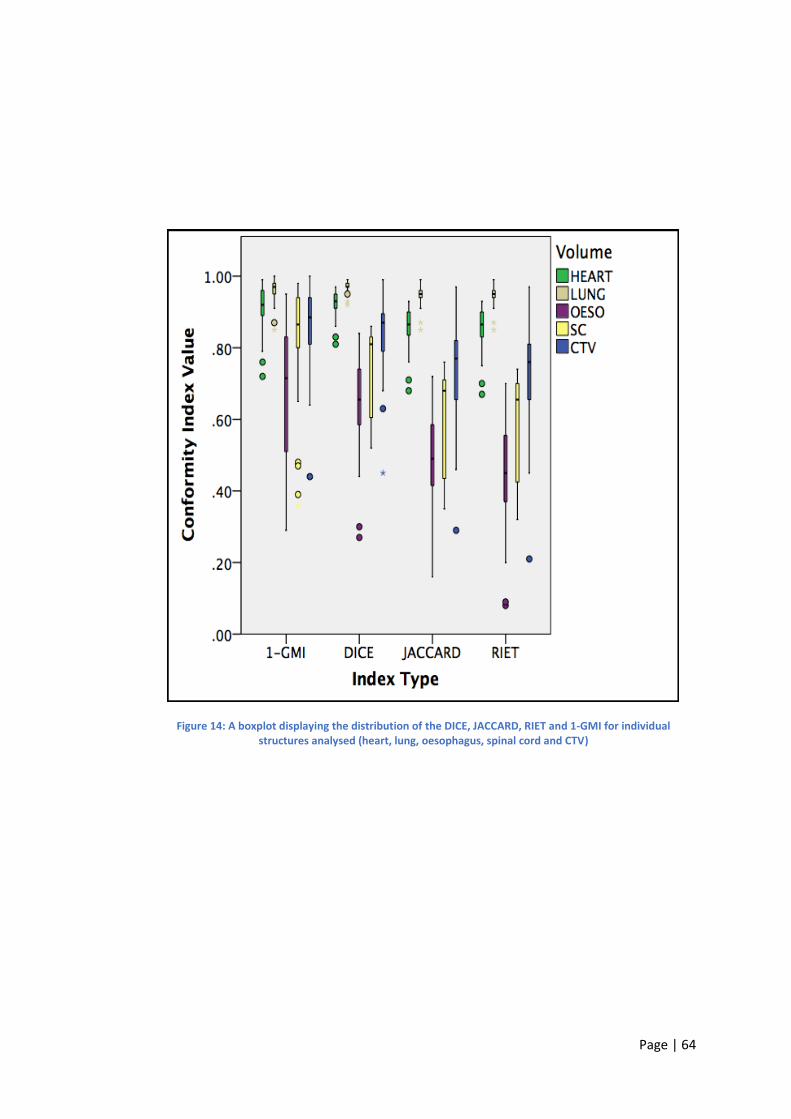
Page | 64
Figure 14: A boxplot displaying the distribution of the DICE, JACCARD, RIET and 1-GMI for individual structures analysed (heart, lung, oesophagus, spinal cord and CTV)
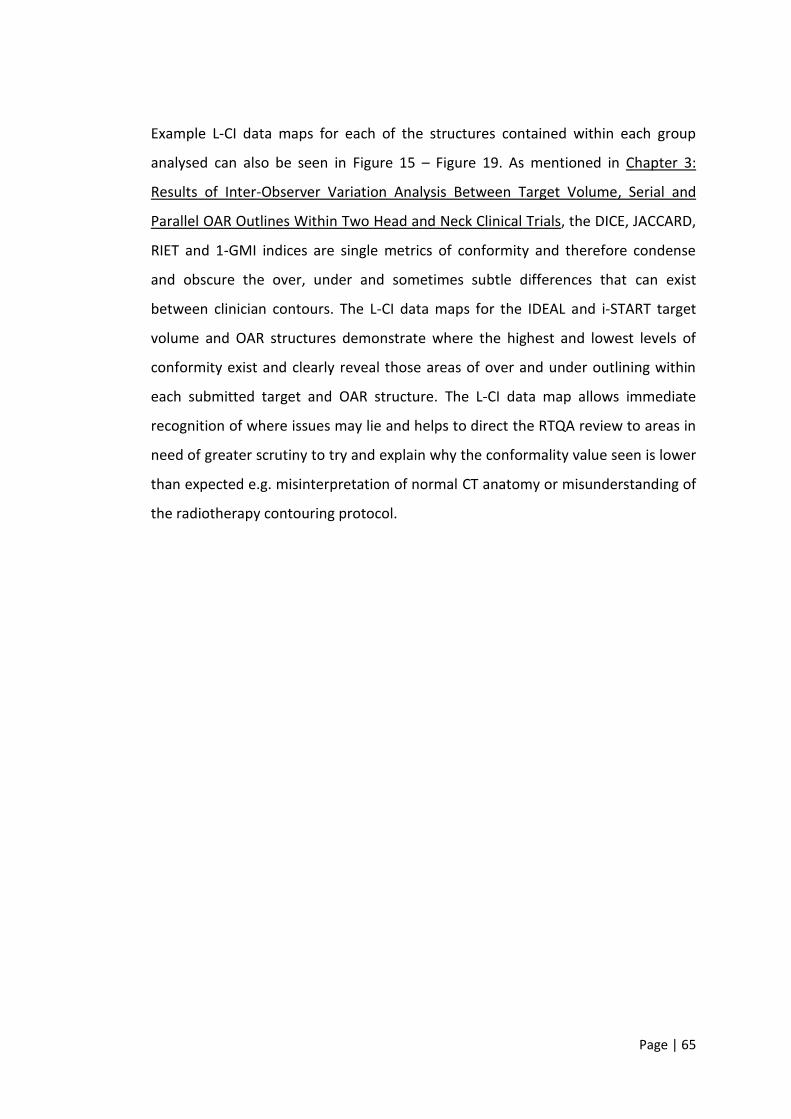
Page | 65
Example L-CI data maps for each of the structures contained within each group
analysed can also be seen in Figure 15 – Figure 19. As mentioned in Chapter 3:
Results of Inter-Observer Variation Analysis Between Target Volume, Serial and
Parallel OAR Outlines Within Two Head and Neck Clinical Trials, the DICE, JACCARD,
RIET and 1-GMI indices are single metrics of conformity and therefore condense
and obscure the over, under and sometimes subtle differences that can exist
between clinician contours. The L-CI data maps for the IDEAL and i-START target
volume and OAR structures demonstrate where the highest and lowest levels of
conformity exist and clearly reveal those areas of over and under outlining within
each submitted target and OAR structure. The L-CI data map allows immediate
recognition of where issues may lie and helps to direct the RTQA review to areas in
need of greater scrutiny to try and explain why the conformality value seen is lower
than expected e.g. misinterpretation of normal CT anatomy or misunderstanding of
the radiotherapy contouring protocol.
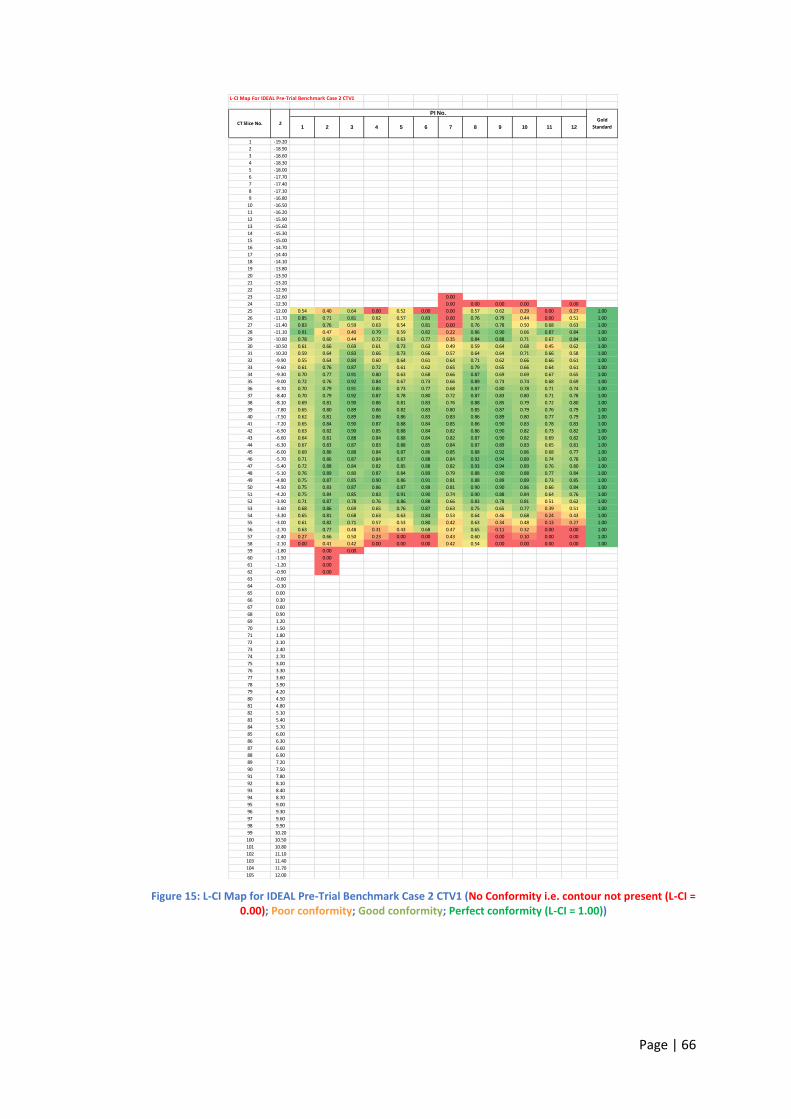
Page | 66
Figure 15: L-CI Map for IDEAL Pre-Trial Benchmark Case 2 CTV1 (No Conformity i.e. contour not present (L-CI = 0.00); Poor conformity; Good conformity; Perfect conformity (L-CI = 1.00))
L-CI Map For IDEAL Pre-Trial Benchmark Case 2 CTV1
1 -19.20
2 -18.90
3 -18.60
4 -18.30
5 -18.00
6 -17.70
7 -17.40
8 -17.10
9 -16.80
10 -16.50
11 -16.20
12 -15.90
13 -15.60
14 -15.30
15 -15.00
16 -14.70
17 -14.40
18 -14.10
19 -13.80
20 -13.50
21 -13.20
22 -12.90
23 -12.60 0.00
24 -12.30 0.00 0.00 0.00 0.00 0.00
25 -12.00 0.54 0.40 0.64 0.00 0.52 0.00 0.00 0.57 0.62 0.29 0.00 0.27 1.00
26 -11.70 0.85 0.71 0.81 0.62 0.57 0.83 0.00 0.76 0.79 0.44 0.00 0.51 1.00
27 -11.40 0.83 0.76 0.59 0.63 0.54 0.81 0.00 0.76 0.78 0.50 0.68 0.63 1.00
28 -11.10 0.91 0.47 0.40 0.79 0.59 0.82 0.22 0.86 0.90 0.66 0.87 0.84 1.00
29 -10.80 0.78 0.60 0.44 0.72 0.63 0.77 0.35 0.84 0.88 0.71 0.67 0.84 1.00
30 -10.50 0.61 0.66 0.69 0.61 0.73 0.63 0.49 0.59 0.64 0.68 0.45 0.62 1.00
31 -10.20 0.59 0.64 0.83 0.66 0.73 0.66 0.57 0.64 0.64 0.71 0.66 0.58 1.00
32 -9.90 0.55 0.64 0.84 0.60 0.64 0.61 0.64 0.71 0.62 0.66 0.66 0.61 1.00
33 -9.60 0.61 0.76 0.87 0.72 0.61 0.62 0.65 0.79 0.65 0.66 0.64 0.61 1.00
34 -9.30 0.70 0.77 0.91 0.80 0.63 0.68 0.66 0.87 0.69 0.69 0.67 0.65 1.00
35 -9.00 0.72 0.76 0.92 0.84 0.67 0.73 0.66 0.89 0.73 0.74 0.68 0.69 1.00
36 -8.70 0.70 0.79 0.91 0.85 0.73 0.77 0.68 0.87 0.80 0.78 0.71 0.74 1.00
37 -8.40 0.70 0.79 0.92 0.87 0.78 0.80 0.72 0.87 0.83 0.80 0.71 0.78 1.00
38 -8.10 0.69 0.81 0.90 0.86 0.81 0.83 0.76 0.88 0.85 0.79 0.72 0.80 1.00
39 -7.80 0.65 0.80 0.89 0.86 0.82 0.83 0.80 0.85 0.87 0.79 0.76 0.79 1.00
40 -7.50 0.62 0.81 0.89 0.86 0.86 0.83 0.83 0.86 0.89 0.80 0.77 0.79 1.00
41 -7.20 0.65 0.84 0.90 0.87 0.88 0.84 0.85 0.86 0.90 0.83 0.78 0.83 1.00
42 -6.90 0.63 0.82 0.90 0.85 0.88 0.84 0.82 0.86 0.90 0.82 0.73 0.82 1.00
43 -6.60 0.64 0.81 0.88 0.84 0.88 0.84 0.82 0.87 0.90 0.82 0.69 0.82 1.00
44 -6.30 0.67 0.83 0.87 0.83 0.88 0.85 0.84 0.87 0.89 0.83 0.65 0.81 1.00
45 -6.00 0.69 0.86 0.88 0.84 0.87 0.86 0.85 0.88 0.92 0.86 0.68 0.77 1.00
46 -5.70 0.71 0.86 0.87 0.84 0.87 0.88 0.84 0.92 0.94 0.89 0.74 0.78 1.00
47 -5.40 0.72 0.88 0.84 0.82 0.85 0.88 0.82 0.93 0.94 0.89 0.76 0.80 1.00
48 -5.10 0.76 0.89 0.80 0.87 0.84 0.89 0.79 0.88 0.90 0.88 0.77 0.84 1.00
49 -4.80 0.75 0.87 0.85 0.90 0.86 0.91 0.81 0.88 0.89 0.89 0.73 0.85 1.00
50 -4.50 0.75 0.83 0.87 0.86 0.87 0.88 0.81 0.90 0.90 0.86 0.66 0.84 1.00
51 -4.20 0.75 0.84 0.85 0.83 0.91 0.90 0.74 0.90 0.88 0.84 0.64 0.76 1.00
52 -3.90 0.71 0.87 0.78 0.76 0.86 0.88 0.66 0.83 0.78 0.81 0.51 0.62 1.00
53 -3.60 0.68 0.86 0.69 0.65 0.76 0.87 0.63 0.75 0.65 0.77 0.39 0.51 1.00
54 -3.30 0.65 0.81 0.68 0.63 0.63 0.84 0.53 0.64 0.46 0.68 0.24 0.43 1.00
55 -3.00 0.61 0.82 0.71 0.57 0.53 0.80 0.42 0.63 0.34 0.48 0.13 0.27 1.00
56 -2.70 0.63 0.77 0.48 0.31 0.43 0.68 0.47 0.65 0.11 0.32 0.00 0.00 1.00
57 -2.40 0.27 0.66 0.50 0.23 0.00 0.00 0.43 0.60 0.00 0.10 0.00 0.00 1.00
58 -2.10 0.00 0.41 0.42 0.00 0.00 0.00 0.42 0.54 0.00 0.00 0.00 0.00 1.00
59 -1.80 0.00 0.00
60 -1.50 0.00
61 -1.20 0.00
62 -0.90 0.00
63 -0.60
64 -0.30
65 0.00
66 0.30
67 0.60
68 0.90
69 1.20
70 1.50
71 1.80
72 2.10
73 2.40
74 2.70
75 3.00
76 3.30
77 3.60
78 3.90
79 4.20
80 4.50
81 4.80
82 5.10
83 5.40
84 5.70
85 6.00
86 6.30
87 6.60
88 6.90
89 7.20
90 7.50
91 7.80
92 8.10
93 8.40
94 8.70
95 9.00
96 9.30
97 9.60
98 9.90
99 10.20
100 10.50
101 10.80
102 11.10
103 11.40
104 11.70
105 12.00
11 126 7 8 9 101 2 3 4 5Z
PI No.
Gold
StandardCT Slice No.
Page | 67
Figure 16: L-CI Map for IDEAL Pre-Trial Benchmark Case 2 Spinal Cord (No Conformity i.e. contour not present (L-CI = 0.00); Poor conformity; Good conformity; Perfect conformity (L-CI = 1.00))
L-CI Map For IDEAL Pre-Trial Benchmark Case 2 Spinal Cord
1 -19.20 0.00 0.00 0.00 0.00 0.00 0.00 0.00
2 -18.90 0.00 0.00 0.00 0.00 0.00 0.00 0.00
3 -18.60 0.00 0.00 0.00 0.00 0.00 0.00 0.00
4 -18.30 0.00 0.00 0.00 0.00 0.00 0.00 0.00
5 -18.00 0.00 0.00 0.00 0.00 0.00 0.00 0.00
6 -17.70 0.00 0.00 0.00 0.00 0.00 0.00 0.00 0.00
7 -17.40 0.79 0.71 0.74 0.00 0.81 0.86 0.29 0.72 0.00 0.00 0.82 1.00
8 -17.10 0.81 0.75 0.77 0.00 0.88 0.81 0.25 0.86 0.81 0.00 0.75 1.00
9 -16.80 0.74 0.76 0.85 0.00 0.78 0.83 0.24 0.78 0.71 0.89 0.80 1.00
10 -16.50 0.72 0.80 0.77 0.00 0.83 0.80 0.22 0.73 0.73 0.82 0.80 1.00
11 -16.20 0.71 0.76 0.78 0.00 0.76 0.85 0.22 0.76 0.76 0.81 0.84 1.00
12 -15.90 0.74 0.81 0.86 0.00 0.78 0.88 0.32 0.78 0.77 0.80 0.91 1.00
13 -15.60 0.85 0.80 0.72 0.00 0.73 0.91 0.30 0.75 0.86 0.87 0.88 1.00
14 -15.30 0.76 0.77 0.67 0.00 0.83 0.83 0.38 0.84 0.85 0.83 0.83 1.00
15 -15.00 0.71 0.87 0.68 0.00 0.84 0.77 0.47 0.71 0.87 0.78 0.77 1.00
16 -14.70 0.75 0.88 0.70 0.00 0.85 0.80 0.33 0.74 0.83 0.84 0.83 1.00
17 -14.40 0.77 0.83 0.80 0.75 0.84 0.84 0.33 0.78 0.84 0.83 0.86 1.00
18 -14.10 0.81 0.82 0.85 0.86 0.64 0.89 0.36 0.80 0.87 0.84 0.89 1.00
19 -13.80 0.85 0.85 0.81 0.93 0.87 0.94 0.44 0.74 0.87 0.91 0.92 1.00
20 -13.50 0.85 0.85 0.87 0.93 0.85 0.94 0.35 0.76 0.79 0.87 0.93 1.00
21 -13.20 0.85 0.74 0.85 0.87 0.91 0.87 0.49 0.84 0.71 0.87 0.92 1.00
22 -12.90 0.85 0.87 0.89 0.66 0.70 0.82 0.48 0.87 0.67 0.80 0.91 1.00
23 -12.60 0.85 0.88 0.88 0.72 0.83 0.83 0.51 0.83 0.72 0.89 0.90 1.00
24 -12.30 0.82 0.86 0.82 0.78 0.82 0.86 0.45 0.83 0.80 0.83 0.89 1.00
25 -12.00 0.80 0.73 0.79 0.88 0.80 0.85 0.37 0.76 0.90 0.87 0.90 1.00
26 -11.70 0.86 0.77 0.87 0.86 0.85 0.86 0.42 0.77 0.86 0.78 0.75 1.00
27 -11.40 0.86 0.72 0.82 0.84 0.84 0.80 0.34 0.72 0.81 0.84 0.76 1.00
28 -11.10 0.83 0.73 0.76 0.84 0.83 0.85 0.38 0.71 0.83 0.81 0.89 1.00
29 -10.80 0.80 0.72 0.75 0.76 0.71 0.84 0.41 0.74 0.80 0.79 0.82 1.00
30 -10.50 0.79 0.83 0.84 0.75 0.83 0.89 0.43 0.80 0.84 0.79 0.82 1.00
31 -10.20 0.77 0.66 0.81 0.76 0.80 0.83 0.47 0.75 0.81 0.84 0.88 1.00
32 -9.90 0.74 0.67 0.86 0.76 0.78 0.88 0.55 0.70 0.83 0.85 0.89 1.00
33 -9.60 0.79 0.70 0.82 0.88 0.85 0.88 0.35 0.75 0.87 0.87 0.75 1.00
34 -9.30 0.83 0.75 0.82 0.88 0.85 0.89 0.39 0.71 0.85 0.87 0.79 1.00
35 -9.00 0.85 0.76 0.76 0.91 0.81 0.91 0.39 0.74 0.79 0.87 0.81 1.00
36 -8.70 0.74 0.77 0.79 0.86 0.85 0.79 0.36 0.75 0.77 0.83 0.75 1.00
37 -8.40 0.74 0.70 0.85 0.78 0.85 0.85 0.40 0.74 0.75 0.86 0.77 1.00
38 -8.10 0.72 0.70 0.71 0.72 0.69 0.84 0.46 0.76 0.70 0.86 0.81 1.00
39 -7.80 0.75 0.75 0.82 0.72 0.79 0.86 0.37 0.80 0.73 0.82 0.86 1.00
40 -7.50 0.74 0.84 0.75 0.73 0.85 0.84 0.38 0.76 0.75 0.71 0.82 1.00
41 -7.20 0.74 0.80 0.82 0.84 0.82 0.80 0.40 0.78 0.75 0.67 0.88 1.00
42 -6.90 0.79 0.78 0.88 0.86 0.91 0.83 0.33 0.75 0.68 0.79 0.89 1.00
43 -6.60 0.82 0.71 0.73 0.85 0.85 0.81 0.29 0.71 0.68 0.81 0.88 1.00
44 -6.30 0.81 0.71 0.74 0.83 0.79 0.87 0.31 0.74 0.78 0.68 0.91 1.00
45 -6.00 0.83 0.78 0.84 0.76 0.80 0.88 0.44 0.78 0.71 0.82 0.84 1.00
46 -5.70 0.84 0.86 0.77 0.68 0.81 0.87 0.46 0.78 0.76 0.83 0.85 1.00
47 -5.40 0.83 0.84 0.81 0.72 0.90 0.88 0.43 0.84 0.82 0.85 0.77 1.00
48 -5.10 0.89 0.86 0.76 0.74 0.88 0.90 0.48 0.84 0.82 0.81 0.78 1.00
49 -4.80 0.90 0.83 0.89 0.76 0.89 0.88 0.33 0.83 0.89 0.83 0.76 1.00
50 -4.50 0.87 0.71 0.83 0.88 0.83 0.89 0.35 0.74 0.88 0.78 0.75 1.00
51 -4.20 0.86 0.65 0.74 0.85 0.83 0.88 0.33 0.64 0.85 0.72 0.77 1.00
52 -3.90 0.91 0.71 0.83 0.93 0.89 0.92 0.27 0.72 0.83 0.86 0.82 1.00
53 -3.60 0.88 0.89 0.76 0.94 0.89 0.87 0.33 0.81 0.82 0.89 0.83 1.00
54 -3.30 0.86 0.89 0.81 0.80 0.88 0.87 0.45 0.82 0.79 0.86 0.81 1.00
55 -3.00 0.84 0.80 0.78 0.77 0.83 0.88 0.49 0.82 0.76 0.85 0.80 1.00
56 -2.70 0.80 0.73 0.78 0.70 0.85 0.85 0.48 0.79 0.77 0.84 0.83 1.00
57 -2.40 0.81 0.70 0.82 0.77 0.88 0.89 0.39 0.79 0.84 0.80 0.81 1.00
58 -2.10 0.84 0.69 0.79 0.83 0.87 0.86 0.37 0.77 0.85 0.84 0.83 1.00
59 -1.80 0.84 0.69 0.74 0.89 0.87 0.86 0.39 0.75 0.88 0.84 0.81 1.00
60 -1.50 0.87 0.70 0.69 0.81 0.89 0.92 0.37 0.71 0.87 0.82 0.83 1.00
61 -1.20 0.84 0.76 0.66 0.86 0.91 0.90 0.31 0.64 0.86 0.81 0.82 1.00
62 -0.90 0.82 0.71 0.69 0.92 0.88 0.87 0.37 0.70 0.86 0.80 0.79 1.00
63 -0.60 0.81 0.75 0.80 0.82 0.87 0.85 0.43 0.82 0.82 0.88 0.81 1.00
64 -0.30 0.78 0.74 0.85 0.75 0.84 0.83 0.42 0.83 0.82 0.88 0.79 1.00
65 0.00 0.78 0.62 0.74 0.75 0.81 0.76 0.40 0.78 0.77 0.79 0.78 1.00
66 0.30 0.83 0.51 0.72 0.67 0.87 0.85 0.30 0.77 0.79 0.80 0.65 1.00
67 0.60 0.87 0.65 0.66 0.73 0.92 0.86 0.27 0.67 0.82 0.81 0.65 1.00
68 0.90 0.89 0.72 0.76 0.85 0.90 0.88 0.37 0.73 0.82 0.86 0.84 1.00
69 1.20 0.86 0.71 0.83 0.85 0.94 0.85 0.37 0.71 0.83 0.89 0.84 1.00
70 1.50 0.83 0.60 0.80 0.83 0.89 0.83 0.38 0.71 0.78 0.89 0.79 1.00
71 1.80 0.76 0.71 0.64 0.89 0.82 0.79 0.40 0.78 0.75 0.84 0.78 1.00
72 2.10 0.72 0.73 0.80 0.87 0.81 0.79 0.38 0.84 0.73 0.92 0.76 1.00
73 2.40 0.69 0.68 0.74 0.76 0.79 0.77 0.45 0.80 0.67 0.85 0.77 1.00
74 2.70 0.65 0.48 0.65 0.69 0.72 0.73 0.37 0.75 0.68 0.83 0.64 1.00
75 3.00 0.68 0.39 0.61 0.79 0.74 0.79 0.30 0.73 0.71 0.73 0.67 1.00
76 3.30 0.69 0.39 0.69 0.76 0.73 0.78 0.26 0.77 0.68 0.72 0.66 1.00
77 3.60 0.80 0.33 0.82 0.83 0.80 0.81 0.30 0.63 0.86 0.72 0.81 1.00
78 3.90 0.81 0.71 0.79 0.81 0.85 0.87 0.31 0.63 0.88 0.84 0.81 1.00
79 4.20 0.83 0.73 0.67 0.78 0.89 0.88 0.25 0.68 0.84 0.83 0.83 1.00
80 4.50 0.86 0.73 0.76 0.92 0.92 0.87 0.34 0.71 0.79 0.86 0.87 1.00
81 4.80 0.85 0.65 0.83 0.90 0.88 0.90 0.35 0.79 0.77 0.84 0.88 1.00
82 5.10 0.85 0.87 0.77 0.80 0.84 0.89 0.40 0.81 0.74 0.00 0.93 1.00
83 5.40 0.81 0.79 0.88 0.75 0.80 0.86 0.42 0.76 0.71 0.00 0.84 1.00
84 5.70 0.75 0.77 0.80 0.78 0.83 0.83 0.25 0.75 0.79 0.00 0.76 1.00
85 6.00 0.83 0.78 0.83 0.69 0.74 0.96 0.36 0.74 0.69 0.00 0.76 1.00
86 6.30 0.86 0.79 0.80 0.74 0.84 0.90 0.34 0.65 0.70 0.00 0.77 1.00
87 6.60 0.83 0.60 0.65 0.85 0.85 0.91 0.39 0.78 0.76 0.00 0.73 1.00
88 6.90 0.86 0.77 0.75 0.87 0.87 0.91 0.38 0.79 0.84 0.00 0.88 1.00
89 7.20 0.82 0.81 0.81 0.96 0.82 0.89 0.37 0.81 0.83 0.00 0.86 1.00
90 7.50 0.81 0.85 0.80 0.91 0.88 0.85 0.33 0.83 0.83 0.00 0.78 1.00
91 7.80 0.76 0.61 0.75 0.83 0.86 0.77 0.44 0.74 0.84 0.00 0.69 1.00
92 8.10 0.71 0.73 0.72 0.94 0.82 0.73 0.32 0.83 0.85 0.00 0.66 1.00
93 8.40 0.76 0.68 0.73 0.83 0.85 0.77 0.32 0.77 0.00 0.00 0.68 1.00
94 8.70 0.78 0.62 0.72 0.77 0.78 0.83 0.33 0.81 0.00 0.00 0.69 1.00
95 9.00 0.79 0.61 0.74 0.00 0.76 0.84 0.44 0.78 0.00 0.00 0.73 1.00
96 9.30 0.80 0.62 0.68 0.00 0.77 0.86 0.39 0.74 0.00 0.00 0.73 1.00
97 9.60 0.85 0.54 0.65 0.00 0.76 0.86 0.38 0.74 0.00 0.00 0.71 1.00
98 9.90 0.86 0.56 0.88 0.00 0.77 0.84 0.36 0.71 0.00 0.00 0.79 1.00
99 10.20 0.00 0.60 0.84 0.00 0.79 0.84 0.00 0.79 0.00 0.00 0.76 1.00
100 10.50 0.00 0.58 0.89 0.00 0.78 0.81 0.00 0.77 0.00 0.00 0.76 1.00
101 10.80 0.00 0.76 0.89 0.00 0.84 0.80 0.00 0.81 0.00 0.00 0.83 1.00
102 11.10 0.00 0.00 0.00 0.00 0.00 0.00
103 11.40 0.00 0.00 0.00 0.00 0.00 0.00
104 11.70 0.00 0.00 0.00 0.00
105 12.00 0.00 0.00 0.00 0.00
9 10 11 124 5 6 7 81 2 3CT Slice No. Z
PI No.
Gold
Standard
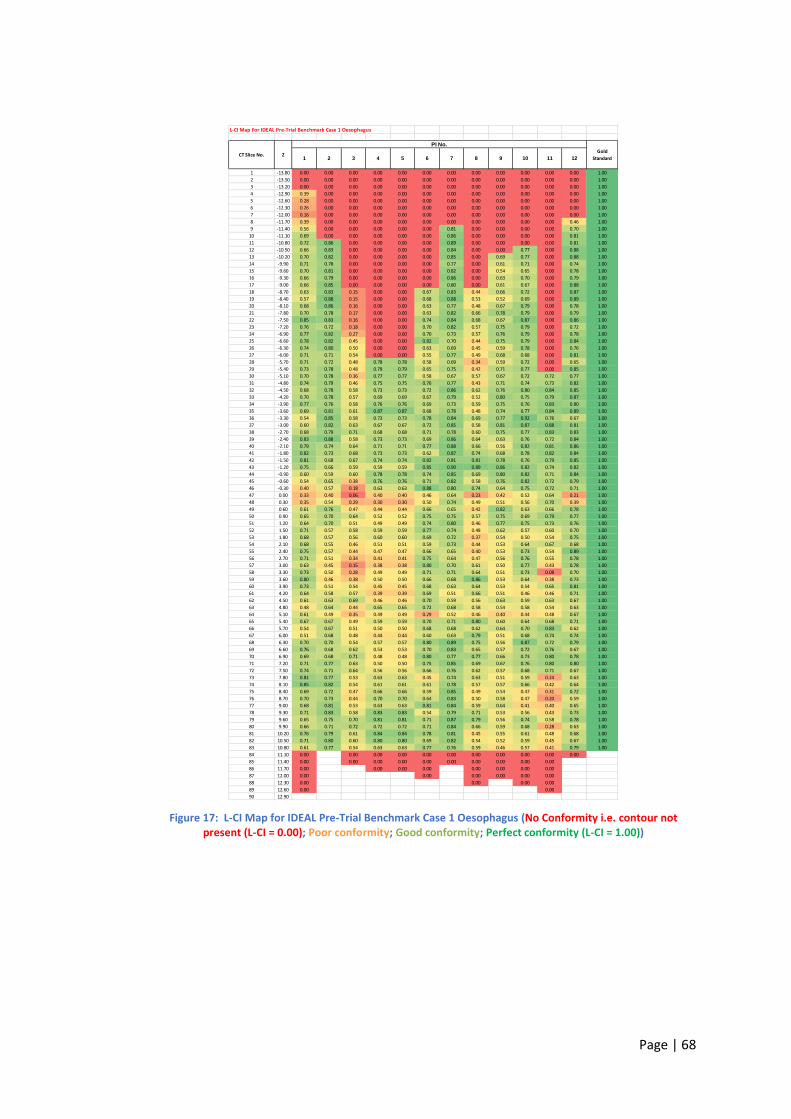
Page | 68
Figure 17: L-CI Map for IDEAL Pre-Trial Benchmark Case 1 Oesophagus (No Conformity i.e. contour not present (L-CI = 0.00); Poor conformity; Good conformity; Perfect conformity (L-CI = 1.00))
L-CI Map For IDEAL Pre-Trial Benchmark Case 1 Oesophagus
1 -13.80 0.00 0.00 0.00 0.00 0.00 0.00 0.00 0.00 0.00 0.00 0.00 0.00 1.00
2 -13.50 0.00 0.00 0.00 0.00 0.00 0.00 0.00 0.00 0.00 0.00 0.00 0.00 1.00
3 -13.20 0.00 0.00 0.00 0.00 0.00 0.00 0.00 0.00 0.00 0.00 0.00 0.00 1.00
4 -12.90 0.39 0.00 0.00 0.00 0.00 0.00 0.00 0.00 0.00 0.00 0.00 0.00 1.00
5 -12.60 0.28 0.00 0.00 0.00 0.00 0.00 0.00 0.00 0.00 0.00 0.00 0.00 1.00
6 -12.30 0.26 0.00 0.00 0.00 0.00 0.00 0.00 0.00 0.00 0.00 0.00 0.00 1.00
7 -12.00 0.16 0.00 0.00 0.00 0.00 0.00 0.00 0.00 0.00 0.00 0.00 0.00 1.00
8 -11.70 0.39 0.00 0.00 0.00 0.00 0.00 0.00 0.00 0.00 0.00 0.00 0.46 1.00
9 -11.40 0.56 0.00 0.00 0.00 0.00 0.00 0.81 0.00 0.00 0.00 0.00 0.70 1.00
10 -11.10 0.69 0.00 0.00 0.00 0.00 0.00 0.86 0.00 0.00 0.00 0.00 0.81 1.00
11 -10.80 0.72 0.86 0.00 0.00 0.00 0.00 0.89 0.00 0.00 0.00 0.00 0.81 1.00
12 -10.50 0.66 0.83 0.00 0.00 0.00 0.00 0.84 0.00 0.00 0.77 0.00 0.88 1.00
13 -10.20 0.70 0.82 0.00 0.00 0.00 0.00 0.85 0.00 0.69 0.77 0.00 0.88 1.00
14 -9.90 0.71 0.78 0.00 0.00 0.00 0.00 0.77 0.00 0.61 0.71 0.00 0.74 1.00
15 -9.60 0.70 0.81 0.00 0.00 0.00 0.00 0.82 0.00 0.54 0.65 0.00 0.78 1.00
16 -9.30 0.66 0.79 0.00 0.00 0.00 0.00 0.86 0.00 0.63 0.70 0.00 0.79 1.00
17 -9.00 0.66 0.85 0.00 0.00 0.00 0.00 0.80 0.00 0.61 0.67 0.00 0.88 1.00
18 -8.70 0.63 0.83 0.15 0.00 0.00 0.67 0.83 0.44 0.66 0.72 0.00 0.87 1.00
19 -8.40 0.57 0.88 0.15 0.00 0.00 0.68 0.88 0.53 0.52 0.69 0.00 0.89 1.00
20 -8.10 0.68 0.86 0.16 0.00 0.00 0.63 0.77 0.48 0.67 0.79 0.00 0.78 1.00
21 -7.80 0.70 0.78 0.17 0.00 0.00 0.63 0.82 0.66 0.78 0.79 0.00 0.79 1.00
22 -7.50 0.85 0.83 0.16 0.00 0.00 0.74 0.84 0.68 0.67 0.87 0.00 0.86 1.00
23 -7.20 0.76 0.72 0.18 0.00 0.00 0.70 0.82 0.57 0.75 0.79 0.00 0.72 1.00
24 -6.90 0.77 0.82 0.27 0.00 0.00 0.70 0.73 0.57 0.76 0.79 0.00 0.78 1.00
25 -6.60 0.78 0.82 0.45 0.00 0.00 0.82 0.70 0.44 0.75 0.79 0.00 0.84 1.00
26 -6.30 0.74 0.80 0.50 0.00 0.00 0.63 0.69 0.45 0.59 0.78 0.00 0.76 1.00
27 -6.00 0.71 0.71 0.54 0.00 0.00 0.55 0.77 0.49 0.68 0.68 0.00 0.81 1.00
28 -5.70 0.71 0.72 0.48 0.78 0.78 0.58 0.69 0.34 0.59 0.72 0.00 0.65 1.00
29 -5.40 0.73 0.78 0.48 0.79 0.79 0.65 0.75 0.42 0.71 0.77 0.00 0.85 1.00
30 -5.10 0.70 0.78 0.36 0.77 0.77 0.58 0.67 0.57 0.67 0.72 0.72 0.77 1.00
31 -4.80 0.74 0.79 0.46 0.75 0.75 0.76 0.77 0.43 0.71 0.74 0.73 0.82 1.00
32 -4.50 0.68 0.78 0.58 0.73 0.73 0.72 0.86 0.62 0.76 0.80 0.84 0.85 1.00
33 -4.20 0.70 0.78 0.57 0.69 0.69 0.67 0.79 0.52 0.80 0.75 0.79 0.87 1.00
34 -3.90 0.77 0.76 0.58 0.76 0.76 0.69 0.73 0.59 0.75 0.76 0.83 0.80 1.00
35 -3.60 0.69 0.81 0.61 0.87 0.87 0.68 0.78 0.48 0.74 0.77 0.84 0.89 1.00
36 -3.30 0.54 0.85 0.58 0.73 0.73 0.78 0.84 0.69 0.77 0.92 0.76 0.67 1.00
37 -3.00 0.60 0.82 0.63 0.67 0.67 0.72 0.85 0.58 0.81 0.87 0.88 0.81 1.00
38 -2.70 0.68 0.79 0.71 0.68 0.68 0.71 0.78 0.60 0.75 0.77 0.83 0.83 1.00
39 -2.40 0.83 0.88 0.58 0.73 0.73 0.69 0.86 0.64 0.63 0.76 0.72 0.84 1.00
40 -2.10 0.79 0.74 0.64 0.71 0.71 0.77 0.88 0.66 0.56 0.82 0.81 0.86 1.00
41 -1.80 0.82 0.73 0.68 0.73 0.73 0.62 0.87 0.74 0.68 0.78 0.82 0.84 1.00
42 -1.50 0.81 0.68 0.67 0.74 0.74 0.82 0.81 0.81 0.78 0.76 0.79 0.85 1.00
43 -1.20 0.75 0.66 0.59 0.59 0.59 0.85 0.90 0.89 0.86 0.82 0.74 0.82 1.00
44 -0.90 0.60 0.59 0.60 0.78 0.78 0.74 0.85 0.69 0.80 0.82 0.71 0.84 1.00
45 -0.60 0.54 0.65 0.38 0.76 0.76 0.71 0.82 0.58 0.76 0.82 0.72 0.79 1.00
46 -0.30 0.40 0.57 0.18 0.63 0.63 0.88 0.80 0.74 0.64 0.75 0.72 0.71 1.00
47 0.00 0.33 0.40 0.06 0.40 0.40 0.46 0.64 0.23 0.42 0.52 0.64 0.21 1.00
48 0.30 0.35 0.54 0.29 0.30 0.30 0.50 0.74 0.49 0.51 0.56 0.70 0.39 1.00
49 0.60 0.61 0.76 0.47 0.44 0.44 0.66 0.65 0.42 0.82 0.63 0.66 0.78 1.00
50 0.90 0.65 0.70 0.64 0.52 0.52 0.75 0.75 0.57 0.75 0.69 0.79 0.77 1.00
51 1.20 0.64 0.70 0.51 0.49 0.49 0.74 0.80 0.46 0.77 0.75 0.73 0.76 1.00
52 1.50 0.71 0.57 0.58 0.59 0.59 0.77 0.74 0.48 0.62 0.57 0.60 0.70 1.00
53 1.80 0.68 0.57 0.56 0.60 0.60 0.69 0.72 0.37 0.54 0.50 0.54 0.75 1.00
54 2.10 0.68 0.55 0.46 0.51 0.51 0.59 0.73 0.44 0.53 0.64 0.67 0.68 1.00
55 2.40 0.75 0.57 0.44 0.47 0.47 0.66 0.65 0.40 0.53 0.73 0.54 0.89 1.00
56 2.70 0.71 0.51 0.34 0.41 0.41 0.75 0.64 0.47 0.56 0.76 0.55 0.78 1.00
57 3.00 0.63 0.45 0.15 0.38 0.38 0.80 0.70 0.61 0.50 0.77 0.43 0.78 1.00
58 3.30 0.73 0.50 0.28 0.49 0.49 0.71 0.71 0.64 0.51 0.73 0.08 0.70 1.00
59 3.60 0.80 0.46 0.38 0.50 0.50 0.66 0.68 0.86 0.53 0.64 0.38 0.73 1.00
60 3.90 0.73 0.51 0.54 0.45 0.45 0.68 0.63 0.64 0.53 0.54 0.65 0.81 1.00
61 4.20 0.64 0.58 0.57 0.39 0.39 0.69 0.51 0.66 0.51 0.46 0.46 0.71 1.00
62 4.50 0.61 0.63 0.69 0.46 0.46 0.70 0.59 0.56 0.63 0.59 0.63 0.67 1.00
63 4.80 0.48 0.64 0.44 0.65 0.65 0.72 0.68 0.58 0.54 0.58 0.54 0.63 1.00
64 5.10 0.61 0.49 0.35 0.49 0.49 0.29 0.52 0.46 0.40 0.44 0.48 0.67 1.00
65 5.40 0.67 0.67 0.49 0.59 0.59 0.70 0.71 0.80 0.60 0.64 0.68 0.71 1.00
66 5.70 0.54 0.67 0.51 0.50 0.50 0.68 0.68 0.62 0.64 0.70 0.83 0.62 1.00
67 6.00 0.51 0.68 0.48 0.44 0.44 0.60 0.63 0.79 0.51 0.68 0.74 0.74 1.00
68 6.30 0.70 0.70 0.54 0.57 0.57 0.80 0.89 0.75 0.56 0.87 0.72 0.79 1.00
69 6.60 0.76 0.68 0.62 0.53 0.53 0.70 0.83 0.65 0.57 0.72 0.76 0.67 1.00
70 6.90 0.69 0.68 0.71 0.48 0.48 0.80 0.77 0.77 0.66 0.73 0.80 0.78 1.00
71 7.20 0.71 0.77 0.63 0.50 0.50 0.75 0.85 0.69 0.67 0.76 0.80 0.80 1.00
72 7.50 0.74 0.71 0.64 0.56 0.56 0.66 0.76 0.62 0.57 0.68 0.71 0.67 1.00
73 7.80 0.81 0.77 0.53 0.63 0.63 0.45 0.74 0.63 0.51 0.59 0.24 0.63 1.00
74 8.10 0.85 0.82 0.54 0.61 0.61 0.61 0.78 0.57 0.57 0.66 0.42 0.64 1.00
75 8.40 0.69 0.72 0.47 0.66 0.66 0.59 0.85 0.49 0.54 0.47 0.31 0.72 1.00
76 8.70 0.70 0.73 0.44 0.70 0.70 0.64 0.83 0.50 0.58 0.47 0.20 0.59 1.00
77 9.00 0.68 0.81 0.53 0.63 0.63 0.81 0.84 0.59 0.64 0.41 0.40 0.65 1.00
78 9.30 0.71 0.83 0.58 0.83 0.83 0.54 0.79 0.71 0.53 0.56 0.43 0.73 1.00
79 9.60 0.65 0.75 0.70 0.81 0.81 0.71 0.87 0.79 0.56 0.74 0.58 0.78 1.00
80 9.90 0.66 0.71 0.72 0.72 0.72 0.71 0.84 0.66 0.59 0.68 0.28 0.63 1.00
81 10.20 0.76 0.79 0.61 0.84 0.84 0.78 0.81 0.45 0.55 0.61 0.48 0.68 1.00
82 10.50 0.71 0.80 0.60 0.80 0.80 0.69 0.82 0.54 0.52 0.59 0.45 0.67 1.00
83 10.80 0.61 0.77 0.54 0.63 0.63 0.77 0.76 0.59 0.46 0.57 0.41 0.79 1.00
84 11.10 0.00 0.00 0.00 0.00 0.00 0.00 0.00 0.00 0.00 0.00 0.00
85 11.40 0.00 0.00 0.00 0.00 0.00 0.00 0.00 0.00 0.00 0.00
86 11.70 0.00 0.00 0.00 0.00 0.00 0.00 0.00 0.00
87 12.00 0.00 0.00 0.00 0.00 0.00 0.00
88 12.30 0.00 0.00 0.00 0.00
89 12.60 0.00 0.00
90 12.90
11 126 7 8 9 10ZCT Slice No.
PI No.
Gold
Standard1 2 3 4 5
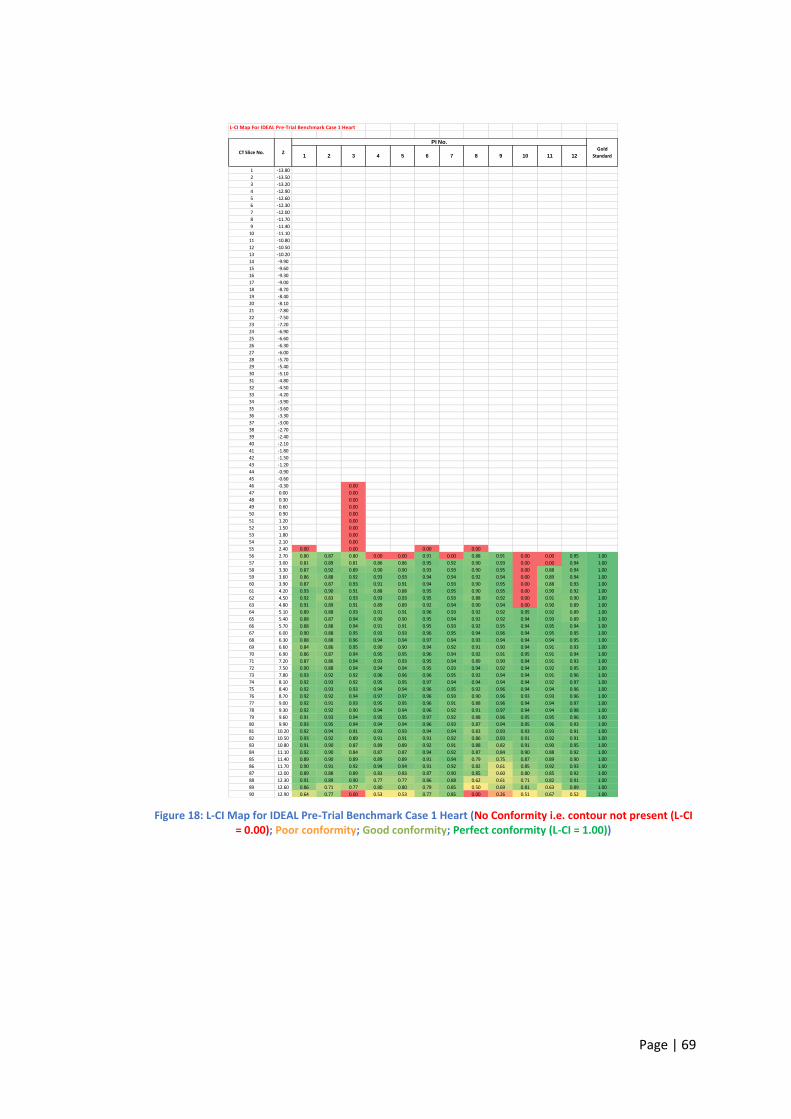
Page | 69
Figure 18: L-CI Map for IDEAL Pre-Trial Benchmark Case 1 Heart (No Conformity i.e. contour not present (L-CI = 0.00); Poor conformity; Good conformity; Perfect conformity (L-CI = 1.00))
L-CI Map For IDEAL Pre-Trial Benchmark Case 1 Heart
1 -13.80
2 -13.50
3 -13.20
4 -12.90
5 -12.60
6 -12.30
7 -12.00
8 -11.70
9 -11.40
10 -11.10
11 -10.80
12 -10.50
13 -10.20
14 -9.90
15 -9.60
16 -9.30
17 -9.00
18 -8.70
19 -8.40
20 -8.10
21 -7.80
22 -7.50
23 -7.20
24 -6.90
25 -6.60
26 -6.30
27 -6.00
28 -5.70
29 -5.40
30 -5.10
31 -4.80
32 -4.50
33 -4.20
34 -3.90
35 -3.60
36 -3.30
37 -3.00
38 -2.70
39 -2.40
40 -2.10
41 -1.80
42 -1.50
43 -1.20
44 -0.90
45 -0.60
46 -0.30 0.00
47 0.00 0.00
48 0.30 0.00
49 0.60 0.00
50 0.90 0.00
51 1.20 0.00
52 1.50 0.00
53 1.80 0.00
54 2.10 0.00
55 2.40 0.00 0.00 0.00 0.00
56 2.70 0.80 0.87 0.80 0.00 0.00 0.91 0.00 0.88 0.91 0.00 0.00 0.95 1.00
57 3.00 0.81 0.89 0.81 0.86 0.86 0.95 0.92 0.90 0.93 0.00 0.00 0.94 1.00
58 3.30 0.87 0.92 0.89 0.90 0.90 0.93 0.93 0.90 0.95 0.00 0.88 0.94 1.00
59 3.60 0.86 0.88 0.92 0.93 0.93 0.94 0.94 0.92 0.94 0.00 0.89 0.94 1.00
60 3.90 0.87 0.87 0.93 0.91 0.91 0.94 0.93 0.90 0.95 0.00 0.88 0.93 1.00
61 4.20 0.93 0.90 0.91 0.88 0.88 0.95 0.95 0.90 0.95 0.00 0.90 0.92 1.00
62 4.50 0.92 0.83 0.93 0.93 0.93 0.95 0.93 0.88 0.92 0.00 0.91 0.90 1.00
63 4.80 0.91 0.89 0.91 0.89 0.89 0.92 0.94 0.90 0.94 0.00 0.90 0.89 1.00
64 5.10 0.89 0.88 0.93 0.91 0.91 0.96 0.93 0.92 0.92 0.95 0.92 0.89 1.00
65 5.40 0.88 0.87 0.94 0.90 0.90 0.95 0.94 0.92 0.92 0.94 0.93 0.89 1.00
66 5.70 0.88 0.88 0.94 0.91 0.91 0.95 0.93 0.92 0.95 0.94 0.95 0.94 1.00
67 6.00 0.90 0.88 0.95 0.93 0.93 0.96 0.95 0.94 0.96 0.94 0.95 0.95 1.00
68 6.30 0.88 0.88 0.96 0.94 0.94 0.97 0.94 0.93 0.94 0.94 0.94 0.95 1.00
69 6.60 0.84 0.86 0.95 0.90 0.90 0.94 0.92 0.91 0.90 0.94 0.91 0.93 1.00
70 6.90 0.86 0.87 0.94 0.95 0.95 0.96 0.94 0.92 0.91 0.95 0.91 0.94 1.00
71 7.20 0.87 0.86 0.94 0.93 0.93 0.95 0.94 0.89 0.90 0.94 0.91 0.93 1.00
72 7.50 0.90 0.88 0.94 0.94 0.94 0.95 0.93 0.94 0.92 0.94 0.92 0.95 1.00
73 7.80 0.93 0.92 0.92 0.96 0.96 0.96 0.95 0.92 0.94 0.94 0.91 0.96 1.00
74 8.10 0.92 0.93 0.92 0.95 0.95 0.97 0.94 0.94 0.94 0.94 0.92 0.97 1.00
75 8.40 0.92 0.93 0.93 0.94 0.94 0.96 0.95 0.92 0.96 0.94 0.94 0.96 1.00
76 8.70 0.92 0.92 0.94 0.97 0.97 0.96 0.93 0.90 0.96 0.93 0.93 0.96 1.00
77 9.00 0.92 0.91 0.93 0.95 0.95 0.96 0.91 0.88 0.96 0.94 0.94 0.97 1.00
78 9.30 0.92 0.92 0.90 0.94 0.94 0.96 0.92 0.91 0.97 0.94 0.94 0.98 1.00
79 9.60 0.91 0.93 0.94 0.95 0.95 0.97 0.92 0.88 0.96 0.95 0.95 0.96 1.00
80 9.90 0.93 0.95 0.94 0.94 0.94 0.96 0.93 0.87 0.94 0.95 0.96 0.93 1.00
81 10.20 0.92 0.94 0.91 0.93 0.93 0.94 0.94 0.83 0.93 0.93 0.93 0.91 1.00
82 10.50 0.93 0.92 0.89 0.91 0.91 0.91 0.92 0.86 0.93 0.91 0.92 0.91 1.00
83 10.80 0.91 0.90 0.87 0.89 0.89 0.92 0.91 0.88 0.82 0.91 0.90 0.95 1.00
84 11.10 0.92 0.90 0.84 0.87 0.87 0.94 0.92 0.87 0.84 0.90 0.88 0.92 1.00
85 11.40 0.89 0.90 0.89 0.89 0.89 0.91 0.94 0.79 0.75 0.87 0.89 0.90 1.00
86 11.70 0.90 0.91 0.92 0.94 0.94 0.91 0.92 0.82 0.61 0.85 0.92 0.93 1.00
87 12.00 0.89 0.88 0.89 0.83 0.83 0.87 0.90 0.85 0.60 0.80 0.85 0.92 1.00
88 12.30 0.91 0.89 0.90 0.77 0.77 0.86 0.88 0.62 0.61 0.71 0.82 0.91 1.00
89 12.60 0.86 0.71 0.77 0.80 0.80 0.79 0.85 0.50 0.69 0.81 0.63 0.89 1.00
90 12.90 0.64 0.77 0.00 0.53 0.53 0.77 0.85 0.00 0.26 0.51 0.67 0.52 1.00
9 10 11 124 5 6 7 81 2 3CT Slice No. Z
PI No.
Gold
Standard
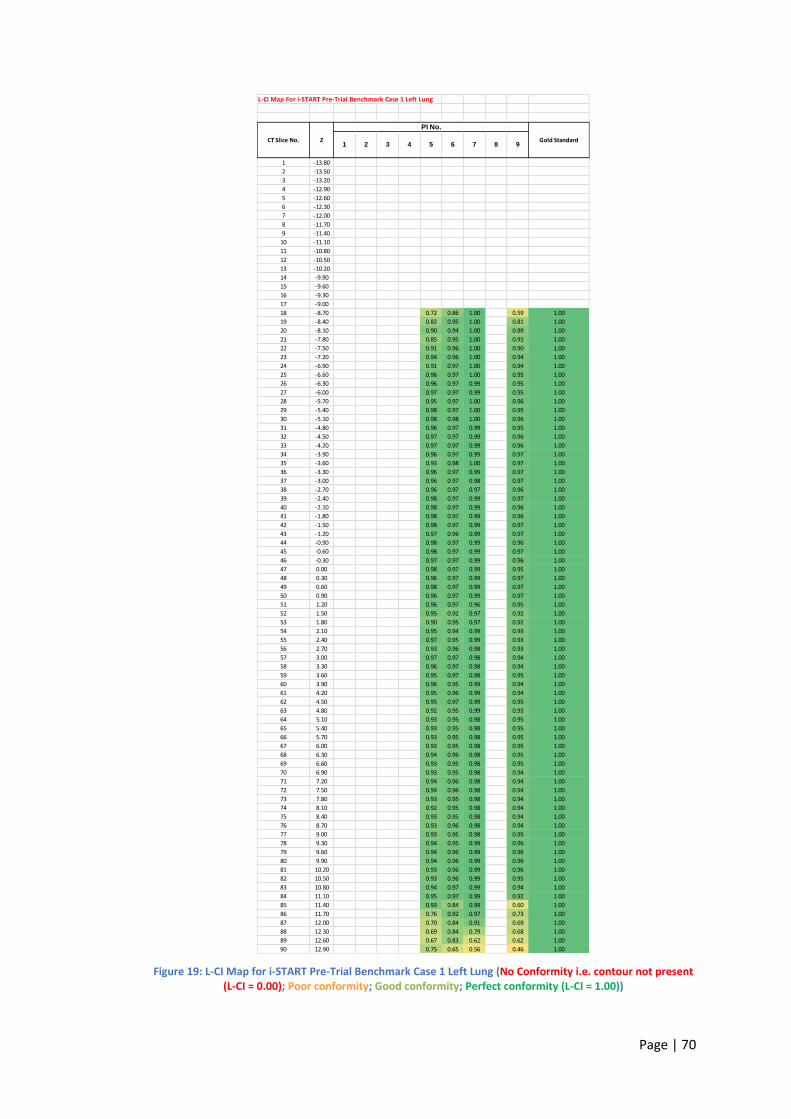
Page | 70
Figure 19: L-CI Map for i-START Pre-Trial Benchmark Case 1 Left Lung (No Conformity i.e. contour not present (L-CI = 0.00); Poor conformity; Good conformity; Perfect conformity (L-CI = 1.00))
L-CI Map For i-START Pre-Trial Benchmark Case 1 Left Lung
1 -13.80
2 -13.50
3 -13.20
4 -12.90
5 -12.60
6 -12.30
7 -12.00
8 -11.70
9 -11.40
10 -11.10
11 -10.80
12 -10.50
13 -10.20
14 -9.90
15 -9.60
16 -9.30
17 -9.00
18 -8.70 0.72 0.86 1.00 0.59 1.00
19 -8.40 0.82 0.95 1.00 0.81 1.00
20 -8.10 0.90 0.94 1.00 0.89 1.00
21 -7.80 0.85 0.95 1.00 0.91 1.00
22 -7.50 0.91 0.96 1.00 0.90 1.00
23 -7.20 0.94 0.96 1.00 0.94 1.00
24 -6.90 0.91 0.97 1.00 0.94 1.00
25 -6.60 0.96 0.97 1.00 0.95 1.00
26 -6.30 0.96 0.97 0.99 0.95 1.00
27 -6.00 0.97 0.97 0.99 0.95 1.00
28 -5.70 0.95 0.97 1.00 0.96 1.00
29 -5.40 0.98 0.97 1.00 0.95 1.00
30 -5.10 0.98 0.98 1.00 0.96 1.00
31 -4.80 0.96 0.97 0.99 0.95 1.00
32 -4.50 0.97 0.97 0.99 0.96 1.00
33 -4.20 0.97 0.97 0.99 0.96 1.00
34 -3.90 0.96 0.97 0.99 0.97 1.00
35 -3.60 0.93 0.98 1.00 0.97 1.00
36 -3.30 0.96 0.97 0.99 0.97 1.00
37 -3.00 0.96 0.97 0.98 0.97 1.00
38 -2.70 0.96 0.97 0.97 0.96 1.00
39 -2.40 0.98 0.97 0.99 0.97 1.00
40 -2.10 0.98 0.97 0.99 0.96 1.00
41 -1.80 0.98 0.97 0.99 0.96 1.00
42 -1.50 0.98 0.97 0.99 0.97 1.00
43 -1.20 0.97 0.96 0.99 0.97 1.00
44 -0.90 0.98 0.97 0.99 0.96 1.00
45 -0.60 0.98 0.97 0.99 0.97 1.00
46 -0.30 0.97 0.97 0.99 0.96 1.00
47 0.00 0.98 0.97 0.99 0.95 1.00
48 0.30 0.96 0.97 0.99 0.97 1.00
49 0.60 0.98 0.97 0.99 0.97 1.00
50 0.90 0.96 0.97 0.99 0.97 1.00
51 1.20 0.96 0.97 0.96 0.95 1.00
52 1.50 0.95 0.92 0.97 0.92 1.00
53 1.80 0.90 0.95 0.97 0.92 1.00
54 2.10 0.95 0.94 0.99 0.93 1.00
55 2.40 0.97 0.95 0.99 0.93 1.00
56 2.70 0.93 0.96 0.98 0.93 1.00
57 3.00 0.97 0.97 0.98 0.94 1.00
58 3.30 0.96 0.97 0.98 0.94 1.00
59 3.60 0.95 0.97 0.98 0.95 1.00
60 3.90 0.96 0.95 0.99 0.94 1.00
61 4.20 0.95 0.96 0.99 0.94 1.00
62 4.50 0.95 0.97 0.99 0.95 1.00
63 4.80 0.92 0.95 0.99 0.93 1.00
64 5.10 0.93 0.95 0.98 0.95 1.00
65 5.40 0.93 0.95 0.98 0.95 1.00
66 5.70 0.93 0.95 0.98 0.95 1.00
67 6.00 0.93 0.95 0.98 0.95 1.00
68 6.30 0.94 0.96 0.98 0.95 1.00
69 6.60 0.93 0.95 0.98 0.95 1.00
70 6.90 0.93 0.95 0.98 0.94 1.00
71 7.20 0.94 0.96 0.98 0.94 1.00
72 7.50 0.94 0.96 0.98 0.94 1.00
73 7.80 0.93 0.95 0.98 0.94 1.00
74 8.10 0.92 0.95 0.98 0.94 1.00
75 8.40 0.93 0.95 0.98 0.94 1.00
76 8.70 0.93 0.96 0.98 0.94 1.00
77 9.00 0.93 0.95 0.98 0.95 1.00
78 9.30 0.94 0.95 0.99 0.96 1.00
79 9.60 0.94 0.96 0.99 0.96 1.00
80 9.90 0.94 0.96 0.99 0.96 1.00
81 10.20 0.93 0.96 0.99 0.96 1.00
82 10.50 0.93 0.96 0.99 0.95 1.00
83 10.80 0.94 0.97 0.99 0.94 1.00
84 11.10 0.95 0.97 0.99 0.92 1.00
85 11.40 0.93 0.84 0.99 0.60 1.00
86 11.70 0.76 0.92 0.97 0.73 1.00
87 12.00 0.70 0.84 0.91 0.69 1.00
88 12.30 0.69 0.84 0.79 0.68 1.00
89 12.60 0.67 0.83 0.62 0.62 1.00
90 12.90 0.75 0.65 0.56 0.46 1.00
91 2CT Slice No. Z
PI No.
Gold Standard3 4 5 6 7 8
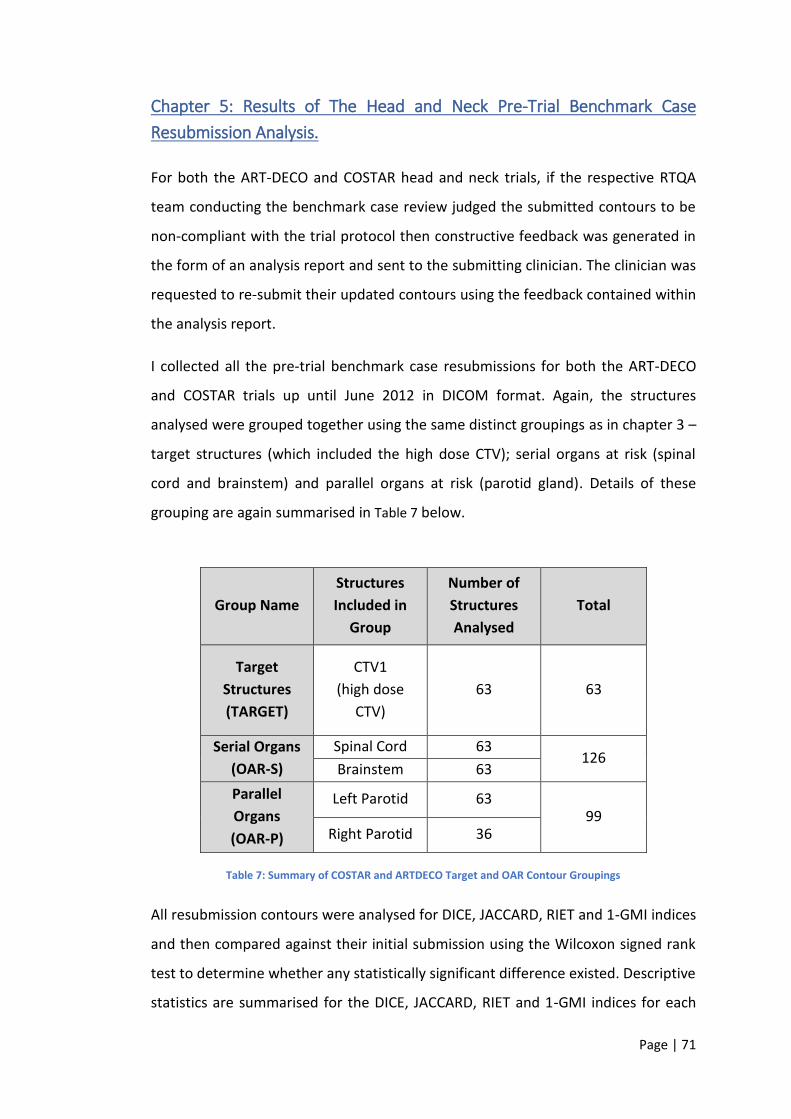
Page | 71
Chapter 5: Results of The Head and Neck Pre-Trial Benchmark Case
Resubmission Analysis.
For both the ART-DECO and COSTAR head and neck trials, if the respective RTQA
team conducting the benchmark case review judged the submitted contours to be
non-compliant with the trial protocol then constructive feedback was generated in
the form of an analysis report and sent to the submitting clinician. The clinician was
requested to re-submit their updated contours using the feedback contained within
the analysis report.
I collected all the pre-trial benchmark case resubmissions for both the ART-DECO
and COSTAR trials up until June 2012 in DICOM format. Again, the structures
analysed were grouped together using the same distinct groupings as in chapter 3 –
target structures (which included the high dose CTV); serial organs at risk (spinal
cord and brainstem) and parallel organs at risk (parotid gland). Details of these
grouping are again summarised in Table 7 below.
Group Name
Structures
Included in
Group
Number of
Structures
Analysed
Total
Target
Structures
(TARGET)
CTV1
(high dose
CTV)
63 63
Serial Organs
(OAR-S)
Spinal Cord 63 126
Brainstem 63
Parallel
Organs
(OAR-P)
Left Parotid 63 99
Right Parotid 36
Table 7: Summary of COSTAR and ARTDECO Target and OAR Contour Groupings
All resubmission contours were analysed for DICE, JACCARD, RIET and 1-GMI indices
and then compared against their initial submission using the Wilcoxon signed rank
test to determine whether any statistically significant difference existed. Descriptive
statistics are summarised for the DICE, JACCARD, RIET and 1-GMI indices for each
Page | 72
respective group for both first and final submissions in Table 8. The table also
includes the mean percentage difference for paired submissions for all the indices
analysed following contour resubmissions. This was determined by first calculating
the percentage difference between an individual clinicians first submission contour
CI value and their final submission contour CI value. The mean was then calculated
for the whole group and this process was repeated for every structure and CI
analysed. The results are displayed in the final column of Table 8 and demonstrate
that there was a positive mean improvement in all four measured conformality
indices. There was variation though between the three groups in the magnitude of
the improvement seen. Overall the serial organs seemed to have the highest mean
percentage difference improvement. It should be noted though that the confidence
intervals for the serial organ Dice, Van’t Riet and 1-GMI indices did include negative
percentage values. This would suggest that for some of the re-submitted contours
analysed following RTQA feedback, the submitting clinician had incorrectly re-
edited their contours prior to resubmitting them.
The boxplots shown in Figure 20 to Figure 23 illustrate the distribution of the four
conformity indices between the first and final submission for the Target, OAR-S and
OAR-P groups. Analysis of the head and neck pre-trial benchmark case resubmission
data revealed a statistically significant improvement in all measured conformity
indices (DICE, JACCARD RIET and GMI) for all three groups (TARGET, OAR-S and
OAR-P) following RTQA feedback.
As explained in Appendix 1, modification of the layout of the L-CI grid (substituting
each PI column with re-submissions by the same PI), made it possible to visually
demonstrate the changes made to a structure over the course of re-submissions.
Hence, Figure 24 clearly demonstrates how the CTV1, left parotid, right parotid,
brainstem and spinal cord volumes for a single clinician were improved following
RTQA feedback over the course of 3 submissions during the ART-DECO pre-trial
benchmark case period.
Page | 73
The L-CI data map helps to identify precisely where adaptations were needed
following the initial submission and subsequently made following the 2 – 3
subsequent re-submissions following RTTQA review and feedback.
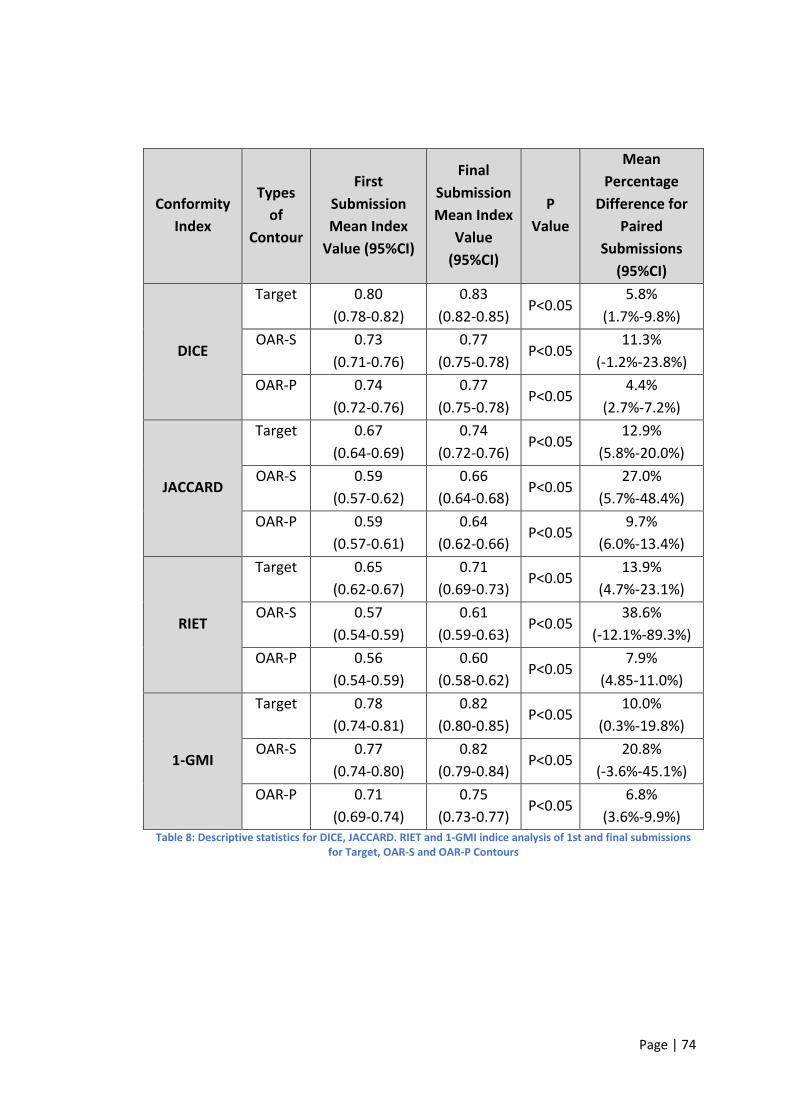
Page | 74
Conformity
Index
Types
of
Contour
First
Submission
Mean Index
Value (95%CI)
Final
Submission
Mean Index
Value
(95%CI)
P
Value
Mean
Percentage
Difference for
Paired
Submissions
(95%CI)
DICE
Target 0.80
(0.78-0.82)
0.83
(0.82-0.85) P<0.05
5.8%
(1.7%-9.8%)
OAR-S 0.73
(0.71-0.76)
0.77
(0.75-0.78) P<0.05
11.3%
(-1.2%-23.8%)
OAR-P 0.74
(0.72-0.76)
0.77
(0.75-0.78) P<0.05
4.4%
(2.7%-7.2%)
JACCARD
Target 0.67
(0.64-0.69)
0.74
(0.72-0.76) P<0.05
12.9%
(5.8%-20.0%)
OAR-S 0.59
(0.57-0.62)
0.66
(0.64-0.68) P<0.05
27.0%
(5.7%-48.4%)
OAR-P 0.59
(0.57-0.61)
0.64
(0.62-0.66) P<0.05
9.7%
(6.0%-13.4%)
RIET
Target 0.65
(0.62-0.67)
0.71
(0.69-0.73) P<0.05
13.9%
(4.7%-23.1%)
OAR-S 0.57
(0.54-0.59)
0.61
(0.59-0.63) P<0.05
38.6%
(-12.1%-89.3%)
OAR-P 0.56
(0.54-0.59)
0.60
(0.58-0.62) P<0.05
7.9%
(4.85-11.0%)
1-GMI
Target 0.78
(0.74-0.81)
0.82
(0.80-0.85) P<0.05
10.0%
(0.3%-19.8%)
OAR-S 0.77
(0.74-0.80)
0.82
(0.79-0.84) P<0.05
20.8%
(-3.6%-45.1%)
OAR-P 0.71
(0.69-0.74)
0.75
(0.73-0.77) P<0.05
6.8%
(3.6%-9.9%) Table 8: Descriptive statistics for DICE, JACCARD. RIET and 1-GMI indice analysis of 1st and final submissions
for Target, OAR-S and OAR-P Contours
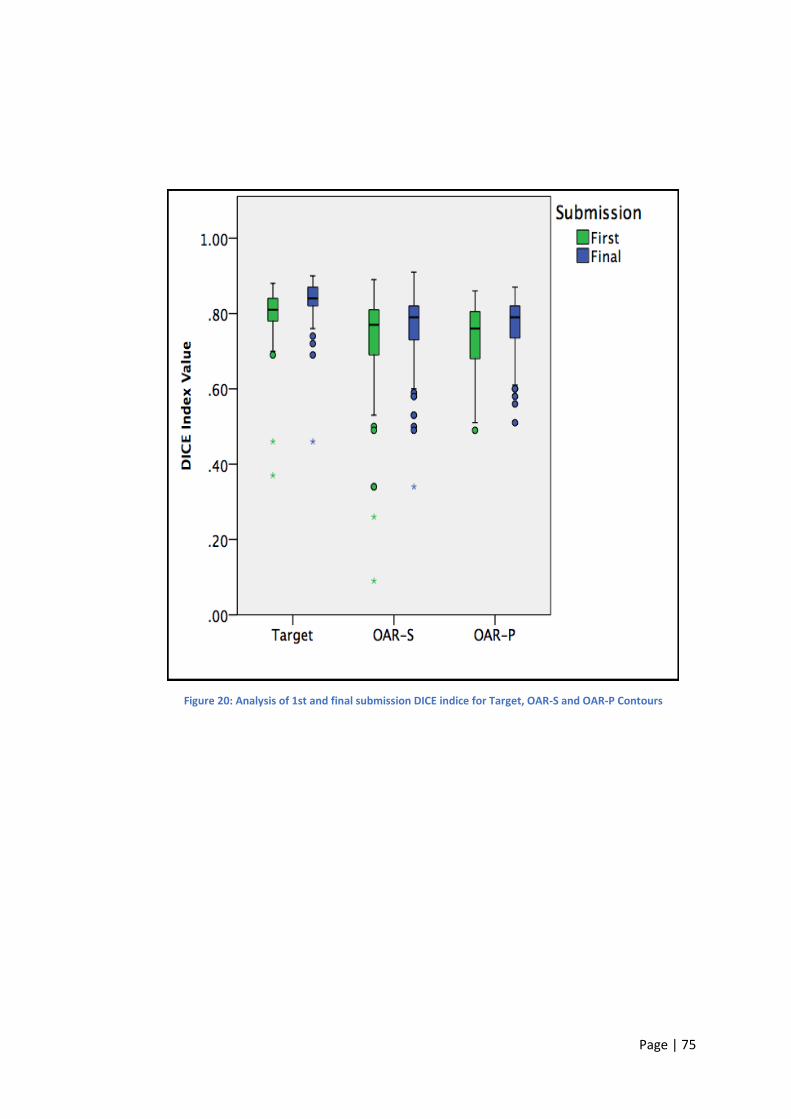
Page | 75
Figure 20: Analysis of 1st and final submission DICE indice for Target, OAR-S and OAR-P Contours
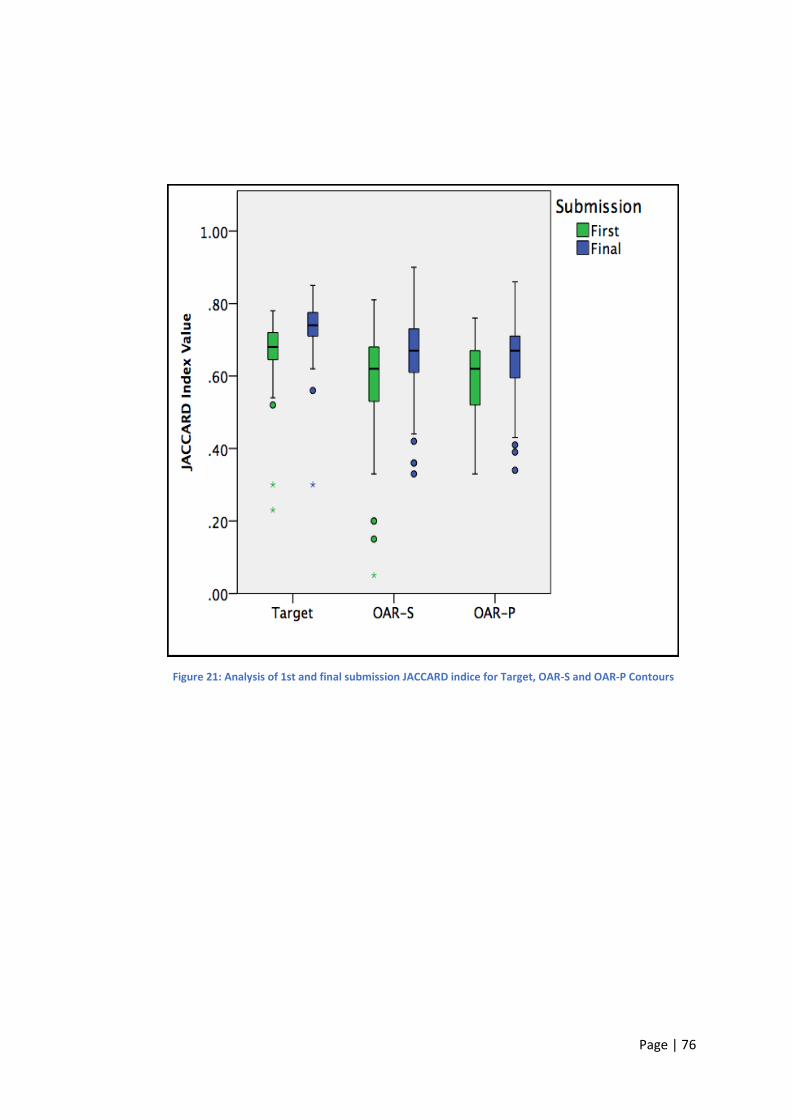
Page | 76
Figure 21: Analysis of 1st and final submission JACCARD indice for Target, OAR-S and OAR-P Contours
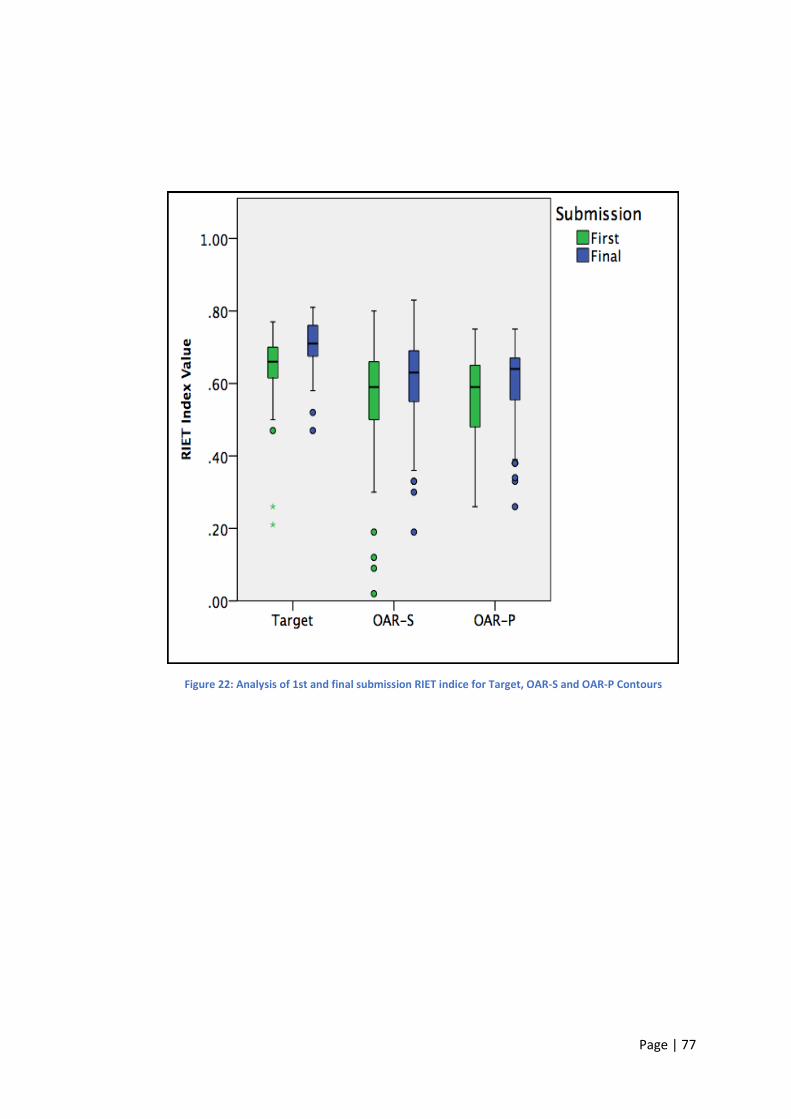
Page | 77
Figure 22: Analysis of 1st and final submission RIET indice for Target, OAR-S and OAR-P Contours
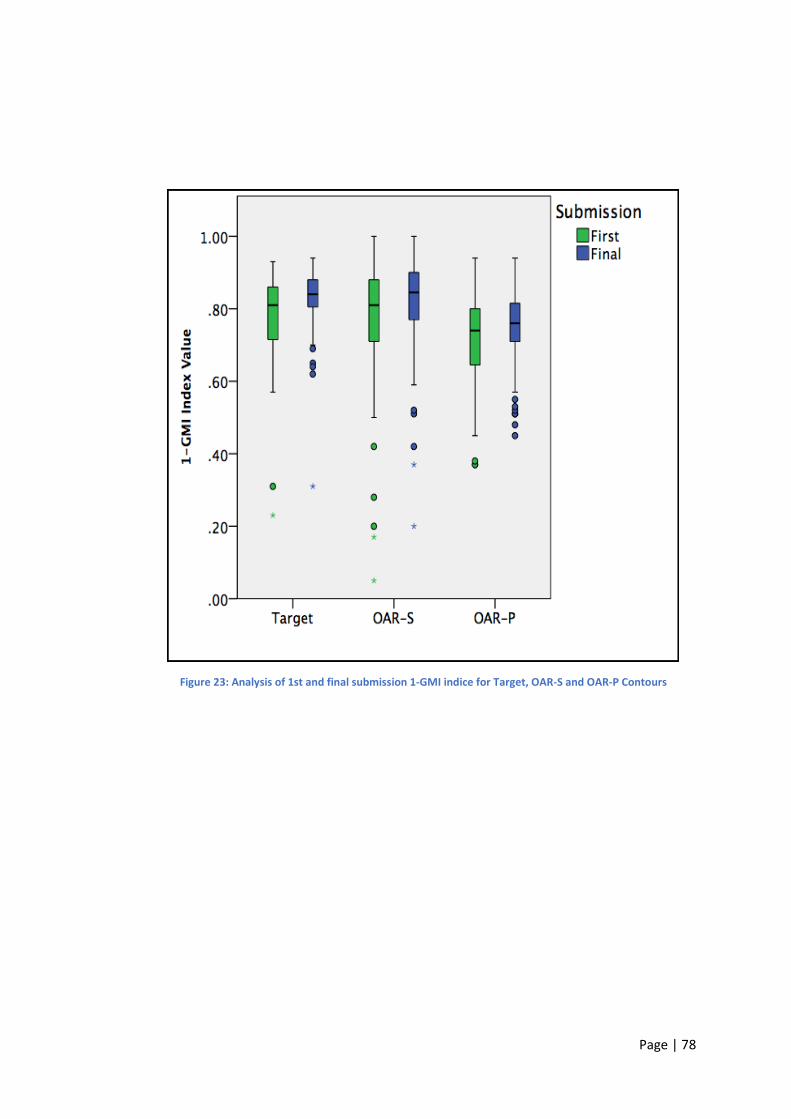
Page | 78
Figure 23: Analysis of 1st and final submission 1-GMI indice for Target, OAR-S and OAR-P Contours
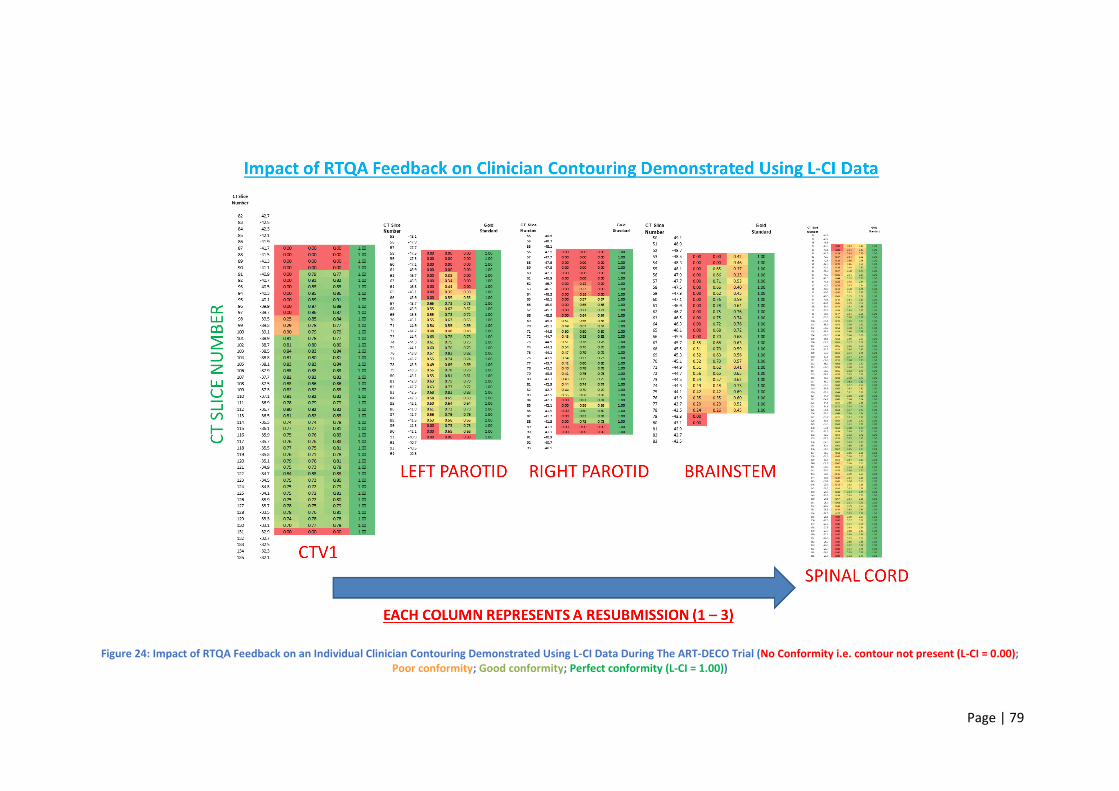
Page | 79
Figure 24: Impact of RTQA Feedback on an Individual Clinician Contouring Demonstrated Using L-CI Data During The ART-DECO Trial (No Conformity i.e. contour not present (L-CI = 0.00); Poor conformity; Good conformity; Perfect conformity (L-CI = 1.00))
Page | 80
Chapter 6: Discussion
Head and Neck Pre-Trial Benchmark Cases
Analysis of the ART-DECO and COSTAR pre-trial benchmark case target volumes,
serial organs (OAR-S) and parallel organs (OAR-P) volumes has revealed that a
statistically significant difference does exist between clinician target and organ at
risk volumes. Therefore, the hypothesis that there is a significant level of inter-
observer variation amongst clinical oncologist’s target volume and OAR contours
within the context of the pre-trial quality assurance (QA) benchmark cases for two
different UK head and neck radiotherapy trials can be accepted.
Table 3 summarises the descriptive statistics for all four indices analysed and
reveals relatively high levels of conformity for both the Dice and 1-GMI conformity
indices (indice range 0.71 – 0.80) for the target structure and parallel and serial
organs at risk volumes. The Jaccard Index and Van’t Riet indices for all three groups
were lower though with values ranging between 0.56 and 0.67.
The Jaccard Conformity Index is the ratio of intersection of two volumes, as
compared with the union of the two volumes under comparison. The Dice co-
efficient and Van’t Riet indice are mathematically similar to the Jaccard Index but
also assess for variations in under and over outlining respectively.
The results reveal that all three groups had high levels of conformity when analysed
using the Dice co-efficient (range 0.73 – 0.80). Slightly lower levels of conformity
were seen when measured using the Jaccard Conformity Index (range 0.59 – 0.67)
and Van’t Riet indice (range 0.56 – 0.65). My analysis suggests low levels of under-
outlining based upon both the Dice co-efficient and 1-GMI results (the 1-GMI
results ranged between 0.71 – 0.78). For all four indices, the highest levels of
conformality were seen in the target group with lower, albeit similar levels of
conformality, in the serial and parallel organ at risk groups.
Page | 81
Comparison of the three groups also revealed that there were statistical differences
between the target group and the serial and parallel organ at risk groups for the
Dice, Jaccard and Van’t Riet indices (p<0.05). These results suggest that clinician
target outlining within the benchmark cases is more consistent than organ at risk
outlining. This could be explained on the basis that the target volume contains the
tumour (or an area at risk of harbouring residual tumour cells post-surgery) and is
therefore deemed by the clinician to be the most important volume to be defined
because sub-optimal definition negatively impacts on the chances of cure. Hence it
is therefore likely to be the volume defined most accurately by the treating
clinician.
This concept might also explain why the target group had such low levels of under
outlining when assessed using the Dice co-efficient (mean value 0.80) and 1-GMI
indices (mean value 0.78). When defining the target volume i.e. the GTV or CTV,
clinicians will always try to avoid missing out macroscopic tumour or areas
considered to be at-risk of harbouring microscopic disease from their volume.
Hence, it would seem more likely that clinicians will tend to over outline rather than
under outline their target volume. Assessment of the Van’t Riet index for the target
group was lower than that of the Dice co-efficient (mean value 0.65) and would
seem to support this.
It should be noted that target volume definition (CTV1) within both the ART-DECO
and COSTAR trial outlining protocols was comprehensively covered. Participating
clinicians were instructed to define their target volumes (CTV1) using normal
anatomical boundaries and their respective landmarks. This is likely to have
reduced inter-observer variation as anatomical landmarks tend to be well defined
and easy to locate in head and neck normal tissue CT and MRI atlases. Both the
trials’ respective radiotherapy planning packs also contained nodal atlases,
guidance on which nodal levels to include in the high dose volume (CTV1) and
comprehensive example cases with example contours defined on example CT data
sets. This level of information is likely to have reduced inter-observer variability and
led to the improved conformality detected through my analysis of the target
contours.
Page | 82
Conversely, the radiotherapy planning packs for both the trials contained much less
information to aid clinician contouring of organs at risk structures. In the case of the
parotid glands (parallel organ at risk group), brainstem and spinal cord (serial organ
at risk group), clinicians were instructed to outline them with little or no
information on their normal anatomical boundaries or an atlas to visually aid their
definition. Consequently, this might help to explain why the organ at risk values
were lower than those seen for the target volume group.
Analysis of the serial and parallel contour groups did not reveal any statistically
significant differences for the DICE, Jaccard or Van’t Riet indices. This would suggest
that both groups were contoured equally well by the submitting clinicians although
as already discussed, not as well as the target group. There was a statistically
significant difference detected in the 1-GMI results for the serial and parallel organ
groups. Review of Table 3 also reveals that the parallel organs had higher levels of
under outlining when compared to the serial organ group. This might be explained
on the basis that the true extent of the parallel organs (parotid glands) are more
difficult to accurately define than the serial organs (spinal cord and brainstem) and
that the radiotherapy planning packs contained relatively less information to aid
their delineation than compared to the target volume group.
The UK SCOPE I trial revealed a Jaccard Conformity Index (JCI) for investigator GTV’s
of 0.69 which they found was comparable with JCI values published in three
different studies (JCI values 0.69 – 0.72) [57, 61-63]. The mean JCI value for the
ART-DECO and COSTAR trial target volume group was 0.67 (CI 0.64 – 0.69) which
would seem consistent with those previously published. Hence, target volume
conformality within the ART-DECO and COSTAR trials would seem to be consistent
with that seen in the UK SCOPE I trial and other published studies [57, 61-63].
Page | 83
Lung Pre-Trial Benchmark Cases
Analysis of the IDEAL and i-START pre-trial benchmark case target volumes, serial
organs (OAR-S) and parallel organs (OAR-P) volumes has revealed that a statistically
significant difference does exist between clinician target and organ at risk volumes.
Therefore, the hypothesis that there is a significant level of inter-observer variation
amongst clinical oncologist’s target volume and OAR contours within the context of
the pre-trial quality assurance (QA) benchmark cases for two different UK lung
radiotherapy trials can be accepted.
Table 5 summarises the descriptive statistics for all four indices analysed and
reveals high levels of conformity for the Dice, Jaccard, Van’t Riet and 1-GMI
conformity indices for the target structure and the parallel organ at risk groups
(indice range 0.72 – 0.95). The serial organ at risk group though had relatively lower
values for all four measured indices with the lowest being the Van’t Riet (mean
value 0.50), then the Jaccard Index (mean value 0.54) followed by the Dice co-
efficient (mean value 0.69) and finally the highest being the 1-GMI indice (mean
value 0.74).
My results would suggest low levels of both under and over outlining in the target
and parallel organ at risk groups based upon the results of the DICE co-efficient,
Van’t Riet and 1-GMI indices. For the target structure group (CTV1), the mean
indice values for DICE, Van’t Riet and 1-GMI were 0.84 (CI 0.81 – 0.87), 0.72 (CI 0.68
– 0.77) and 0.86 (CI 0.82 – 0.90) respectively. For the parallel organs at risk group
(heart and lungs) the mean indice values for DICE, Van’t Riet and 1-GMI were 0.95
(CI 0.95 – 0.96), 0.91 (CI 0.90 – 0.92) and 0.94 (CI 0.93 – 0.95) respectively. For the
serial organs at risk group (spinal cord and oesophagus), my results would suggest
higher levels of under-outlining based on the mean 1-GMI (0.74; CI 0.70 – 0.79) and
Dice (0.69; CI 0.65 – 0.72) results. Based on the Van’t Riet results seen in the serial
organs at risk group (mean 0.50; CI 0.47 – 0.54), over outlining also seemed to be
an issue in this group.
Page | 84
A study of Figure 14 which displays the distribution of conformity indices for each
individual structure analysed reveals some unexpected results. Unlike in the UK
head and neck radiotherapy trial data where CTV1 (Target Structure Group) had the
highest overall mean conformity index values, in the UK lung radiotherapy trial
benchmark case data, CTV1 was ranked 3rd overall in the group with the remaining
structures ordered as shown in Table 6.
This ranking would suggest that in the context of the IDEAL and i-START trials, the
lung volumes had the highest levels of conformity whilst the oesophagus had the
lowest. Compared with the head and neck rankings (Figure 8), this is very different
because CTV1 ranked first overall (Target Structures), the spinal cord and brainstem
(OAR-S) second, and the parotid glands (OAR-P) third.
In the head and neck trial data discussion it was postulated that the target volumes
are the ones most likely to have the highest conformity values because they contain
the tumour target (or an area considered at high risk of containing microscopic
disease) and therefore are the ones clinicians are likely to outline most accurately.
It is therefore interesting to see in the lung trial data analysis that the target volume
comes third, below the parallel organ at risk contours (lung and heart respectively).
In the head and neck trials, target volumes (CTV1) were defined using
comprehensive outlining guidelines which referenced anatomical boundaries and
anatomical landmarks to help guide head and neck clinicians contouring. In the
IDEAL and i-START trials though, the radiotherapy outlining protocols did not
contain such detailed guidance because typically in lung cancer, the CTV is normally
a geometric expansion of the GTV edited off normal structure boundaries.
Therefore, the CTV1 volume in lung cancer contouring can be at greater risk of
inter-observer variation as it is ultimately defined by the underlying GTV volume
which is essentially delineated by the treating lung clinician using all available
diagnostic imaging and the clinician’s own interpretation of the CT planning scan.
The process of defining the GTV volume relies heavily on the delineating clinician’s
own ability to interpret the diagnostic imaging findings and the boundaries of
normal and abnormal anatomy on the patient’s radiotherapy planning scan.
Page | 85
Thus, based on my findings, it would seem there is greater uncertainty and
therefore more likelihood of inter-observer variation during lung cancer target
volume delineation. Consequently, this might explain why in the IDEAL and i-START
structure analysis, the CTV1 structure came 3rd in the rankings of structures based
on the outcome of the conformality analysis (Table 6).
What is also interesting from the structure rankings is that the lung contours, which
are normally auto-contoured using the auto-segmentation function of the
treatment planning system and therefore not normally outlined by the treating
clinician, are first in the rankings. These findings would seem to validate the ability
of the auto-segmentation software to accurately outline lungs based on the high
levels of conformality seen for the submitted lung contours when compared against
the TMGs reference contours.
The other unexpected finding based on Figure 14, is that the heart outline came
second amongst the structure rankings. This again conflicts with the concept that
serial organs are easier to outline than parallel ones based on the idea that serial
organs are tubular in shape, whereas parallel organs typically have more varied
geometrical borders. What also highlights this unexpected finding further is that the
lowest ranked structures (4th and 5th) were the spinal cord and oesophagus
respectively. Both these structures are considered serial organs and anatomically
are normally long tubular structures. These findings would seem to cast doubt on
the idea that serial structures are easier to outline than parallel ones based on their
geometric properties and would suggest that certainly in the case of the
oesophagus, based on its anatomical location and proximity to other central
mediastinal structures, it is difficult to interpret its precise boundaries and
anatomical course.
Analysis of the three groups revealed that there were statistically significant
differences between the target group and the serial and parallel OAR groups for all
four indices analysed (p<0.05). The results of the analysis would seem to validate
the differences seen in the mean indices for Dice, Jaccard Index, Van’t Riet and 1-
GMI for target and organ at risk contours detailed in the discussion above.
Page | 86
The mean JCI value for the IDEAL and i-START trial target volume group was 0.73 (CI
0.69 – 0.77) and seems consistent with the published UK SCOPE I trial target volume
JCI of 0.69. Hence, target volume conformality within the IDEAL and i-START trials
seems to be consistent with that seen in the UK SCOPE I trial.
Page | 87
Impact of RTQA Feedback on Head and Neck Pre-Trial Benchmark Case
Resubmissions
Analysis of the head and neck pre-trial benchmark case resubmission data found
statistically significant differences between the first and the final target, OAR-P and
OAR-S contours submitted for RTQA assessment (p<0.05). In fact, the target, OAR-P
and OAR-S structures analysed from the ART-DECO and COSTAR benchmark cases
showed statistically significant improvements in all 4 conformity indices analysed
(p<0.05). Based on this, the hypothesis that RTQA feedback during the pre-trial
benchmark period does positively influence head and neck clinician contouring can
be accepted.
Analysis of the resubmitted head and neck benchmark cases using L-CI data maps
has also helped to demonstrate how a clinician’s contours evolve over the course of
RTQA feedback and subsequent re-submissions. Figure 24 clearly demonstrates
how one clinician’s contours evolved over the course of a total of 3 submissions.
For instance, on the first submission, Figure 24 reveals that the clinician’s CTV1 and
brainstem contours had low levels of conformity on CT slices 87 – 100 and 53 – 66
respectively. Following RTQA feedback and subsequent resubmission, column 2
now reveals improved conformality for both structures compared with the TMG
reference contours (shown in column 4). Using the L-CI data map shown in Figure
24, it would seem the submitting clinician re-contoured CT slices 91 – 104 and 55 –
74 of their CTV1 and brainstem respectively. They also removed two erroneous
slices of their brainstem contour (CT slices 79 and 80) and inspection of their spinal
cord contour reveals these were added correctly to this structure instead to
improve the junction point between the brainstem and spinal cord structures.
Inspection of the third submission L-CI data map (column 3) suggests no further
amendments were made to their CTV1 contour but they did add new contours on
CT slices 53 – 54 for their brainstem (although the conformality of these contours
was lower compared with others contained within the structure (LCI values 0.42
and 0.46 respectively)).
Page | 88
Overall, Figure 24 demonstrates the value of the L-CI data maps in helping to
highlight areas of high and low contouring conformity over the full extent of a
clinicians delineated target volume or OAR structure. The L-CI data map allows
immediate recognition of where issues may lie and helps to direct attention to
where greater scrutiny is needed to try to explain why conformality is lower than
expected e.g. misinterpretation of normal anatomy or misunderstanding of the
radiotherapy protocol.
The L-CI is also capable of revealing precisely how RTQA feedback, following RTQA
review, can influence clinician contouring on a CT slice by slice basis following
subsequent resubmissions. Through this enhanced level of detail, the L-CI helps to
explain why there was a statistically significant improvement in all 4 conformity
indices analysed for the head and neck structures which underwent RTQA review
and subsequent feedback during the ART-DECO and COSTAR pre-trial benchmark
period. The L-CI is therefore a valuable tool which complements other conformity
indices (i.e. Dice, Jaccard, Van’t Riet and GMI) because unlike those other indices,
which are effectively 1-dimensional due to their single integer assessment of
clinician conformality, the L-CI can display a 2-dimensional map of conformity and
thus can display a more nuanced level of detail.
Page | 89
Chapter 7: Conclusions
Analysis of the pre-trial benchmark cases from UK head and neck and lung cancer
trials has yielded a wealth of data highlighting the degree of inter-observer
variability that exists in contouring in UK radiotherapy trials. The results of the
analysis have revealed that most of the target volumes and OAR contours analysed
from the pre-trial benchmark cases met published standards (JCI values ≥ 0.69) [83,
87-89]. It was also revealed that target volumes are not always the ones to have the
highest levels of contouring conformity. Variation in the levels of target volume and
OAR contouring conformity was found to exist between the head and neck and lung
cancer trials and raised important questions why these differences might exist.
Based on the head and neck pre-trial benchmark cases, it seems that more
information within the radiotherapy outlining protocol relating to target volume
contouring combined with an anatomical approach to target volume boundaries
helps to improve target volume conformality amongst clinicians. Conversely, it
would also seem that a lack of detail defining the anatomical boundaries of organs
at risk also results in lower levels of clinician conformity. Thus, it would seem vitally
important that to ensure adequate conformity amongst clinicians that the
radiotherapy trial outlining protocol contains detailed information on how target
volume and organ at risk volumes should be defined with example cases and/or CT
atlases for clinician use.
Analysis of the lung cancer pre-trial benchmark cases has also revealed unexpected
findings regarding the rankings of the target and organ at risk contours based on
their respective conformity indice values. My results found the target volume to be
in the middle of the rankings with the parallel organ at risk volumes at the top and
the serial organ at risk volumes at the bottom. This seems surprising as I would
have hypothesised that the volume containing the tumour target would have a
higher level of conformity than the organ at risk volumes on the basis that they are
the most critical ones for achieving a potential cure.
Page | 90
However, based on the results this was not the case and instead the highest ranked
structure was the lung contours which are typically automatically outlined by the
treatment planning software rather than a human being. These results though do
seem to validate the ability of radiotherapy treatment planning software to auto-
contour normal lung volumes with a very high degree of conformality (range 0.91 –
0.95 for the four indices analysed). Therefore, I suspect that as radiotherapy
treatment planning software continues to advance that its ability to auto-contour
other normal organs might also develop with hopefully the same high level of
conformality it can currently achieve when delineating the normal lungs.
The analysis of the lung cancer benchmark cases has again also highlighted the
importance of including detailed and systematic instructions on the outlining of
target and normal structures. Given the relatively low conformality indice values for
the spinal cord and oesophagus contours it seems imperative that future
radiotherapy trial outlining protocols include clear definitions and systematic
instructions on how to outline normal organs at risk. The inclusion of an atlas
should also be considered so to demonstrate more clearly how the normal organ
should be defined on a CT slice by slice basis. These measures lead to improved
conformality amongst participating clinicians as demonstrated by the results of the
head and neck pre-trial benchmark case analysis where the radiotherapy outlining
protocol did include some of these measures.
This research has also demonstrated the value of the local conformity index (L-CI) in
helping to pinpoint quickly and easily the precise area(s) within contoured
structures where the highest levels of inter-observer variability exist (Figure 9 –
Figure 12, Figure 15 – Figure 19 and Figure 24 help demonstrate this). As opposed
to the Dice, Jaccard, Van’t Riet and GMI indices, the L-CI allows the reviewer’s
attention to be quickly directed to those underperforming areas within the
delineated structure to help try and explain why conformality is lower than
expected e.g. misinterpretation of normal anatomy or misunderstanding of the
radiotherapy protocol. The Dice, Jaccard, Van’t Riet and GMI indices on the other
hand essentially provide a summary of the structures conformity with the added
benefit of information on under or over outlining depending on the indice used. The
Page | 91
L-CI however offers itself as a broader tool than those more traditional conformity
indices as it can be used during the RTQA review process to provide more detailed
feedback on structure outlining e.g. feedback on a CT slice by slice basis.
However, the process of creating the L-CI is more intensive and time consuming
than compared with analysing the traditional Dice, Jaccard, Van’t Riet and GMI
indices and should therefore only really be considered when such a level of detail is
truly needed e.g. adding a deeper layer of information to help explain why a
measured traditional indice might be lower than one might expect. Thus, the L-CI
complements the traditional indices which are themselves able to provide a more
rapid, one dimensional assessment of contouring conformity.
By combining the pre-trial benchmark cases with the L-CI it also allows the
radiotherapy trial management group to dynamically monitor, and if necessary,
review and update the radiotherapy outlining protocol to overcome potential
shortcomings. For instance, if analysis of the pre-trial benchmark cases using the L-
CI were to reveal unexpectedly low levels of conformality for an organ at risk or
target structure then it could help prompt a review of the radiotherapy outlining
protocol to determine whether more can be done to reduce inter-observer
variability. This could involve improved guidance on how the structure should be
delineated, the inclusion of an example case or a CT atlas demonstrating how the
structure is outlined or perhaps a TMG organised contouring workshop for
participating clinicians.
Analysis of the resubmitted ART-DECO and COSTAR pre-trial benchmark cases has
also revealed that radiotherapy quality assurance feedback during the pre-accrual
benchmark period can improve clinician conformity. This was demonstrated by a
statistically significant improvement in the mean Dice, Jaccard, Riet and 1-GMI
indices for all target and OAR structures analysed following resubmission.
The L-CI data maps were also shown to be invaluable during to RTQA feedback
process in helping to demonstrate visually on a CT slice by slice basis how individual
clinician contours evolve over the course of RTQA feedback and subsequent

Page | 92
resubmissions. This important finding validates the benefits of radiotherapy quality
assurance, particularly during the pre-accrual benchmark period.
Page | 93
Chapter 8: Future Work
This work has analysed the degree of interobserver variation in the context of UK
head and neck and lung cancer trials. Work has also already been published on the
analysis of the UK SCOPE 1 pre-trial benchmark cases which studied inter-observer
variation in the delineation of oesophageal cancer target volumes [64]. As pre-trial
benchmark cases are becoming more integrated into UK radiotherapy trials future
work could include the analysis of said cases in the context of other tumour sites
such as cervical, bladder, lymphoma and the recent stereotactic radiotherapy
studies which cover multiple sites within the body. Analysis of these other tumour
sites could help to determine where the greatest levels of inter-observer variation
exits in the context of target and organ at risk outlining and help evolve existing and
future radiotherapy outlining protocols to help reduce inter-observer variability and
improve target and organ at risk contouring amongst participating clinicians.
Both the IDEAL and i-START lung cancer radiotherapy trials shared the same pre-
trial benchmark cases, but both had different TMG reference contours for their
target and organ at risk contours. In future it would be useful to conduct a
comparative analysis of these two TMG reference contours sets to determine the
degree of inter-observer variation that can exist between two ‘expert groups’. This
analysis could lead to some interesting results and subsequent discussion on the
role of alternative methods for the creation of reference contour sets which can
influence the degree of inter-observer variability detected during contour
conformity analysis.
The Radiation Therapy Oncology Group (RTOG) has utilised the ‘simultaneous truth
and performance level estimation’ (STAPLE) algorithm to create single reference
contour sets for its atlases. This technique utilises the STAPLE algorithm to create a
single contour set from multiple different expert contours [66-69]. Recently this
method was used to create the reference contour set for the UK’s INTERLACE trial
which is evaluating the potential benefits of chemotherapy prior to chemoradiation
for cervical cancer. This method of combining expert opinions to create a reference
contour set has already been shown by the SCOPE1 team to statistically improve
Page | 94
the number of submitting trial clinicians judged as achieving an excellent
conformity level by 53% [70]. This approach should therefore be seriously
considered by future TMG groups when defining their reference contours.
One key element this work has not evaluated is the impact of delineation variability
on plan dosimetry. Despite seeing inter-observer variation within the context of the
pre-trial benchmark cases the question remains as to whether this has any direct
impact on the dose delivered to the target or OAR volumes. Two UK studies have
assessed this; one utilising the IDEAL trial patient data set and the other the Isotoxic
Lung pre-trial benchmark cases. Both studies investigated the impact inter-observer
variation in OAR contouring had on radiotherapy plan dosimetry [71, 72].
The IDEAL trial dosimetry audit utilised sixty-six patient contour sets. Each patient’s
contours were assessed by the trial chief investigator and the trial RTTQA
dosimetrist. Adjustments were made to the contours if there was agreement by the
two assessors. Dose volume histograms (DVHs) were calculated for both the
original and the edited volumes and then used to determine whether there was any
difference in the isotoxic dose prescription. The results showed no changes to the
prescription dose when editing the heart, brachial plexus or spinal cord PRV
volumes. Seven out of sixty-six patients (10.6%) had differences in the final
prescribed dose calculated due to changes in the oesophagus (4/66) and Lungs-GTV
(3/66) outlining. They found that the mean difference in final prescribed dose was
0.6Gy (range: 0.2 – 1.1Gy) for oesophagus and 3.2Gy (2.5 – 4.5Gy) for lungs-GTV
[71].
In the second study five prospective principal investigators for the Isotoxic Lung
IMRT trial were recruited and each provided with an atlas of OAR contours. Each
investigator, using the atlas, was asked to submit outlining cases which were then
assessed for protocol compliance using the TMG consensus OAR contours. A total
of twenty-five individual OAR contours were analysed including the spinal canal,
brachial plexus, oesophagus, heart and mediastinal envelope. Comparing against
the DVHs of the TMG consensus OARs the median difference in dose received by
1cc of the brachial plexus was 16.47% (IQR 50.40%), by 1cc of oesophagus 12.68%
Page | 95
(IQR 1.13%), by 1cc of heart 0.03% (IQR 0.06%) and by 1cc of mediastinal envelope
0.24% (IQR 0.02%). The difference in mean heart dose was 1.99% (IQR 1.01%).
Overall, they found no difference in the final isotoxic prescription dose for any of
the cases analysed [72].
These small studies suggest that inter-observer variation in OAR delineation can
have an impact on both the final prescription dose and the dose received by the
contoured OAR. This could have clinical implications if the difference was significant
but was shown to be small in both these studies. Whether the same can be said for
the head and neck and lung trial benchmark cases analysed here is not known but
could form the basis of a future extension of this work.
Also leading on from this question is the potential impact inter-observer variation in
OAR and target outlining can have both treatment toxicity and clinical outcomes. A
future extension of this work might be to establish whether any correlation exists
between high level of inter-observer variation during the pre-trial benchmark
period and subsequent toxicity rates and clinical outcomes, including rates of local
relapse, following completion and publication of the final trial results.
Finally, one question this research has not answered is whether the improvement
radiotherapy quality assurance can have on clinician conformality during the pre-
accrual benchmark period is maintained during the entire course of the
radiotherapy trial. This would be an interesting question to study in a future
extension of this work and might be answered by mandating that all participating
clinicians must repeat a benchmark case exercise at pre-defined time points over
the course of the trial recruitment period e.g. every 12 months. Analysis of these
subsequent benchmark cases might establish whether inter-observer variation in
target and OAR contouring deteriorates beyond the completion of the initial pre-
trial benchmark period.
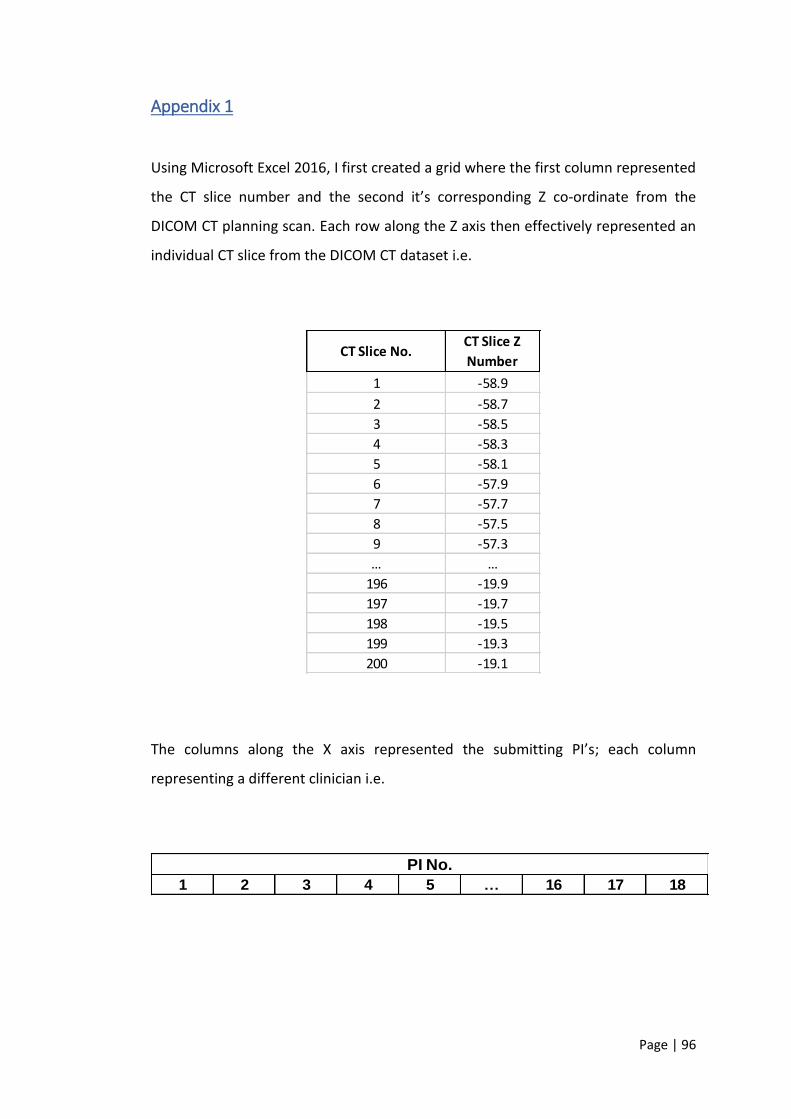
Page | 96
Appendix 1
Using Microsoft Excel 2016, I first created a grid where the first column represented
the CT slice number and the second it’s corresponding Z co-ordinate from the
DICOM CT planning scan. Each row along the Z axis then effectively represented an
individual CT slice from the DICOM CT dataset i.e.
The columns along the X axis represented the submitting PI’s; each column
representing a different clinician i.e.
1 -58.9
2 -58.7
3 -58.5
4 -58.3
5 -58.1
6 -57.9
7 -57.7
8 -57.5
9 -57.3
… …
196 -19.9
197 -19.7
198 -19.5
199 -19.3
200 -19.1
CT Slice No.CT Slice Z
Number
1 2 3 4 5 … 16 17 18
PI No.
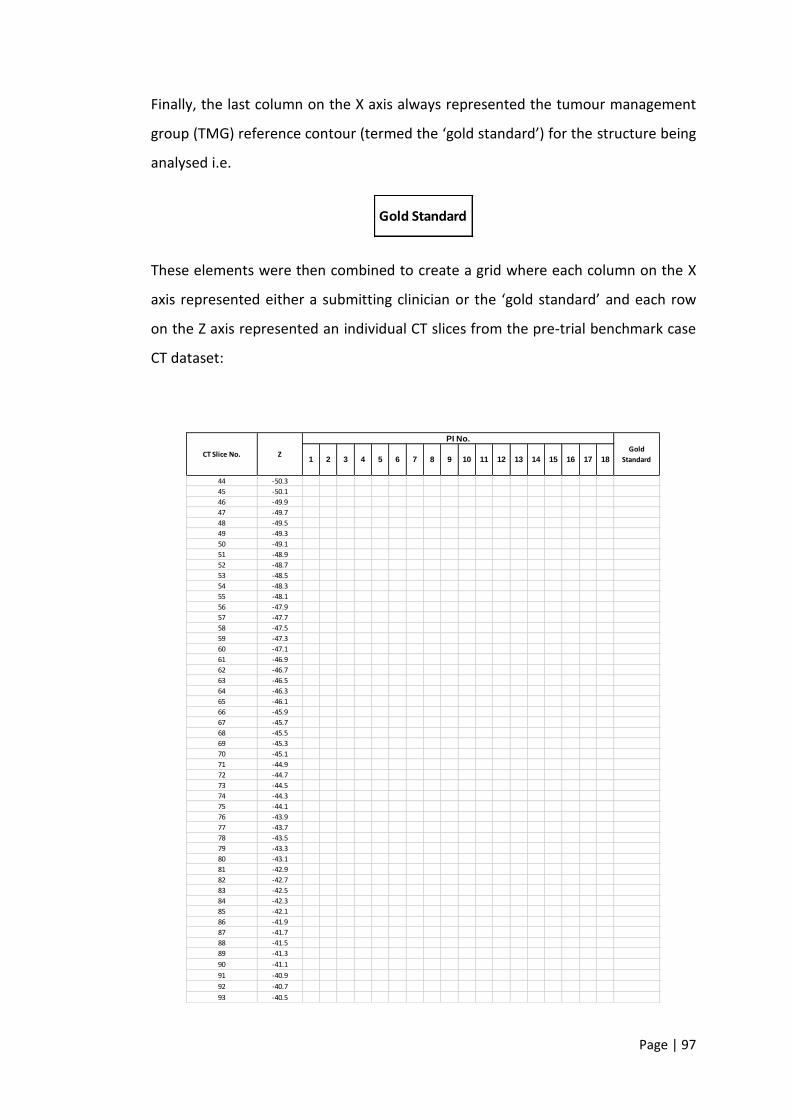
Page | 97
Finally, the last column on the X axis always represented the tumour management
group (TMG) reference contour (termed the ‘gold standard’) for the structure being
analysed i.e.
These elements were then combined to create a grid where each column on the X
axis represented either a submitting clinician or the ‘gold standard’ and each row
on the Z axis represented an individual CT slices from the pre-trial benchmark case
CT dataset:
Gold Standard
44 -50.3
45 -50.1
46 -49.9
47 -49.7
48 -49.5
49 -49.3
50 -49.1
51 -48.9
52 -48.7
53 -48.5
54 -48.3
55 -48.1
56 -47.9
57 -47.7
58 -47.5
59 -47.3
60 -47.1
61 -46.9
62 -46.7
63 -46.5
64 -46.3
65 -46.1
66 -45.9
67 -45.7
68 -45.5
69 -45.3
70 -45.1
71 -44.9
72 -44.7
73 -44.5
74 -44.3
75 -44.1
76 -43.9
77 -43.7
78 -43.5
79 -43.3
80 -43.1
81 -42.9
82 -42.7
83 -42.5
84 -42.3
85 -42.1
86 -41.9
87 -41.7
88 -41.5
89 -41.3
90 -41.1
91 -40.9
92 -40.7
93 -40.5
CT Slice No. Z
PI No.
Gold
Standard1 2 3 4 10 11 12 13 145 6 7 8 9 15 16 17 18
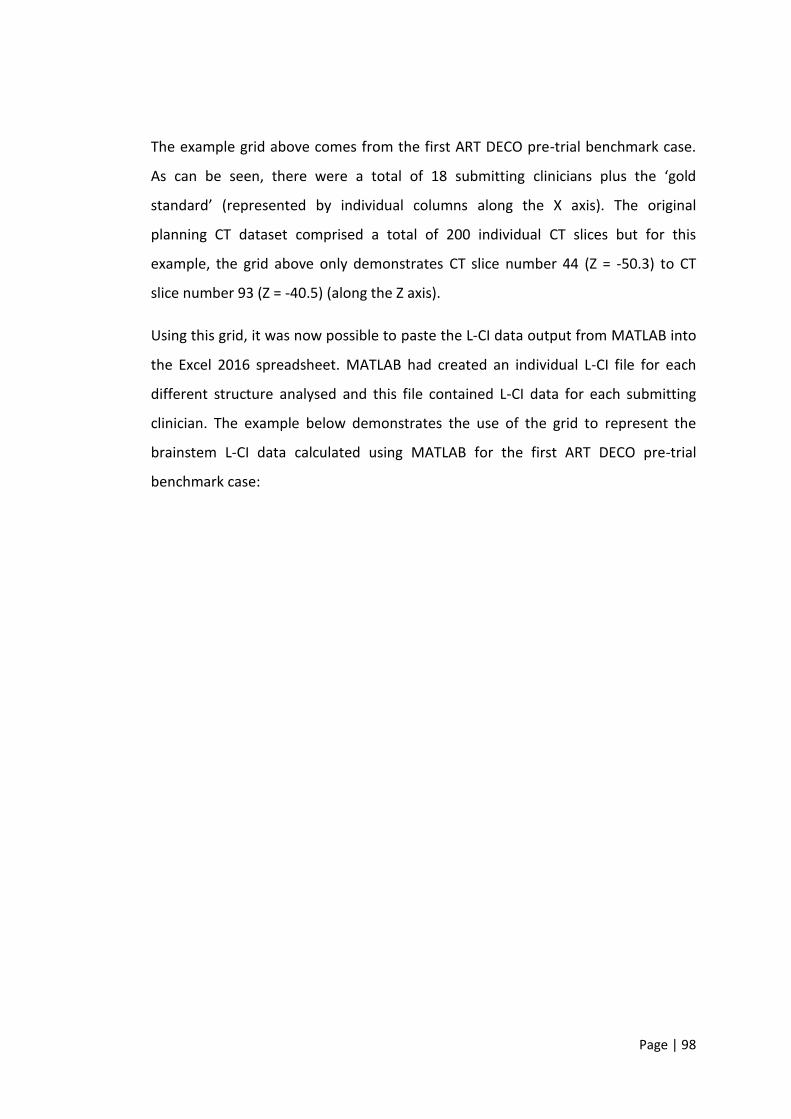
Page | 98
The example grid above comes from the first ART DECO pre-trial benchmark case.
As can be seen, there were a total of 18 submitting clinicians plus the ‘gold
standard’ (represented by individual columns along the X axis). The original
planning CT dataset comprised a total of 200 individual CT slices but for this
example, the grid above only demonstrates CT slice number 44 (Z = -50.3) to CT
slice number 93 (Z = -40.5) (along the Z axis).
Using this grid, it was now possible to paste the L-CI data output from MATLAB into
the Excel 2016 spreadsheet. MATLAB had created an individual L-CI file for each
different structure analysed and this file contained L-CI data for each submitting
clinician. The example below demonstrates the use of the grid to represent the
brainstem L-CI data calculated using MATLAB for the first ART DECO pre-trial
benchmark case:
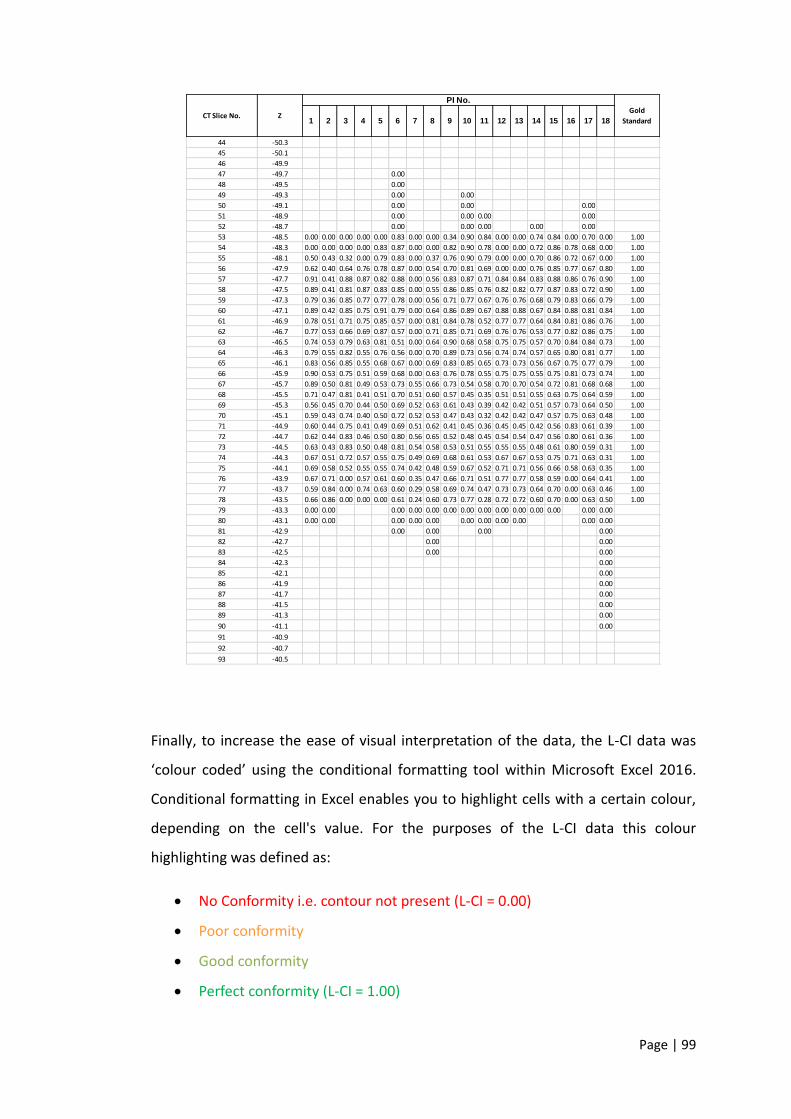
Page | 99
Finally, to increase the ease of visual interpretation of the data, the L-CI data was
‘colour coded’ using the conditional formatting tool within Microsoft Excel 2016.
Conditional formatting in Excel enables you to highlight cells with a certain colour,
depending on the cell's value. For the purposes of the L-CI data this colour
highlighting was defined as:
• No Conformity i.e. contour not present (L-CI = 0.00)
• Poor conformity
• Good conformity
• Perfect conformity (L-CI = 1.00)
44 -50.3
45 -50.1
46 -49.9
47 -49.7 0.00
48 -49.5 0.00
49 -49.3 0.00 0.00
50 -49.1 0.00 0.00 0.00
51 -48.9 0.00 0.00 0.00 0.00
52 -48.7 0.00 0.00 0.00 0.00 0.00
53 -48.5 0.00 0.00 0.00 0.00 0.00 0.83 0.00 0.00 0.34 0.90 0.84 0.00 0.00 0.74 0.84 0.00 0.70 0.00 1.00
54 -48.3 0.00 0.00 0.00 0.00 0.83 0.87 0.00 0.00 0.82 0.90 0.78 0.00 0.00 0.72 0.86 0.78 0.68 0.00 1.00
55 -48.1 0.50 0.43 0.32 0.00 0.79 0.83 0.00 0.37 0.76 0.90 0.79 0.00 0.00 0.70 0.86 0.72 0.67 0.00 1.00
56 -47.9 0.62 0.40 0.64 0.76 0.78 0.87 0.00 0.54 0.70 0.81 0.69 0.00 0.00 0.76 0.85 0.77 0.67 0.80 1.00
57 -47.7 0.91 0.41 0.88 0.87 0.82 0.88 0.00 0.56 0.83 0.87 0.71 0.84 0.84 0.83 0.88 0.86 0.76 0.90 1.00
58 -47.5 0.89 0.41 0.81 0.87 0.83 0.85 0.00 0.55 0.86 0.85 0.76 0.82 0.82 0.77 0.87 0.83 0.72 0.90 1.00
59 -47.3 0.79 0.36 0.85 0.77 0.77 0.78 0.00 0.56 0.71 0.77 0.67 0.76 0.76 0.68 0.79 0.83 0.66 0.79 1.00
60 -47.1 0.89 0.42 0.85 0.75 0.91 0.79 0.00 0.64 0.86 0.89 0.67 0.88 0.88 0.67 0.84 0.88 0.81 0.84 1.00
61 -46.9 0.78 0.51 0.71 0.75 0.85 0.57 0.00 0.81 0.84 0.78 0.52 0.77 0.77 0.64 0.84 0.81 0.86 0.76 1.00
62 -46.7 0.77 0.53 0.66 0.69 0.87 0.57 0.00 0.71 0.85 0.71 0.69 0.76 0.76 0.53 0.77 0.82 0.86 0.75 1.00
63 -46.5 0.74 0.53 0.79 0.63 0.81 0.51 0.00 0.64 0.90 0.68 0.58 0.75 0.75 0.57 0.70 0.84 0.84 0.73 1.00
64 -46.3 0.79 0.55 0.82 0.55 0.76 0.56 0.00 0.70 0.89 0.73 0.56 0.74 0.74 0.57 0.65 0.80 0.81 0.77 1.00
65 -46.1 0.83 0.56 0.85 0.55 0.68 0.67 0.00 0.69 0.83 0.85 0.65 0.73 0.73 0.56 0.67 0.75 0.77 0.79 1.00
66 -45.9 0.90 0.53 0.75 0.51 0.59 0.68 0.00 0.63 0.76 0.78 0.55 0.75 0.75 0.55 0.75 0.81 0.73 0.74 1.00
67 -45.7 0.89 0.50 0.81 0.49 0.53 0.73 0.55 0.66 0.73 0.54 0.58 0.70 0.70 0.54 0.72 0.81 0.68 0.68 1.00
68 -45.5 0.71 0.47 0.81 0.41 0.51 0.70 0.51 0.60 0.57 0.45 0.35 0.51 0.51 0.55 0.63 0.75 0.64 0.59 1.00
69 -45.3 0.56 0.45 0.70 0.44 0.50 0.69 0.52 0.63 0.61 0.43 0.39 0.42 0.42 0.51 0.57 0.73 0.64 0.50 1.00
70 -45.1 0.59 0.43 0.74 0.40 0.50 0.72 0.52 0.53 0.47 0.43 0.32 0.42 0.42 0.47 0.57 0.75 0.63 0.48 1.00
71 -44.9 0.60 0.44 0.75 0.41 0.49 0.69 0.51 0.62 0.41 0.45 0.36 0.45 0.45 0.42 0.56 0.83 0.61 0.39 1.00
72 -44.7 0.62 0.44 0.83 0.46 0.50 0.80 0.56 0.65 0.52 0.48 0.45 0.54 0.54 0.47 0.56 0.80 0.61 0.36 1.00
73 -44.5 0.63 0.43 0.83 0.50 0.48 0.81 0.54 0.58 0.53 0.51 0.55 0.55 0.55 0.48 0.61 0.80 0.59 0.31 1.00
74 -44.3 0.67 0.51 0.72 0.57 0.55 0.75 0.49 0.69 0.68 0.61 0.53 0.67 0.67 0.53 0.75 0.71 0.63 0.31 1.00
75 -44.1 0.69 0.58 0.52 0.55 0.55 0.74 0.42 0.48 0.59 0.67 0.52 0.71 0.71 0.56 0.66 0.58 0.63 0.35 1.00
76 -43.9 0.67 0.71 0.00 0.57 0.61 0.60 0.35 0.47 0.66 0.71 0.51 0.77 0.77 0.58 0.59 0.00 0.64 0.41 1.00
77 -43.7 0.59 0.84 0.00 0.74 0.63 0.60 0.29 0.58 0.69 0.74 0.47 0.73 0.73 0.64 0.70 0.00 0.63 0.46 1.00
78 -43.5 0.66 0.86 0.00 0.00 0.00 0.61 0.24 0.60 0.73 0.77 0.28 0.72 0.72 0.60 0.70 0.00 0.63 0.50 1.00
79 -43.3 0.00 0.00 0.00 0.00 0.00 0.00 0.00 0.00 0.00 0.00 0.00 0.00 0.00 0.00
80 -43.1 0.00 0.00 0.00 0.00 0.00 0.00 0.00 0.00 0.00 0.00 0.00
81 -42.9 0.00 0.00 0.00 0.00
82 -42.7 0.00 0.00
83 -42.5 0.00 0.00
84 -42.3 0.00
85 -42.1 0.00
86 -41.9 0.00
87 -41.7 0.00
88 -41.5 0.00
89 -41.3 0.00
90 -41.1 0.00
91 -40.9
92 -40.7
93 -40.5
CT Slice No. Z
PI No.
Gold
Standard1 2 3 4 10 11 12 13 145 6 7 8 9 15 16 17 18
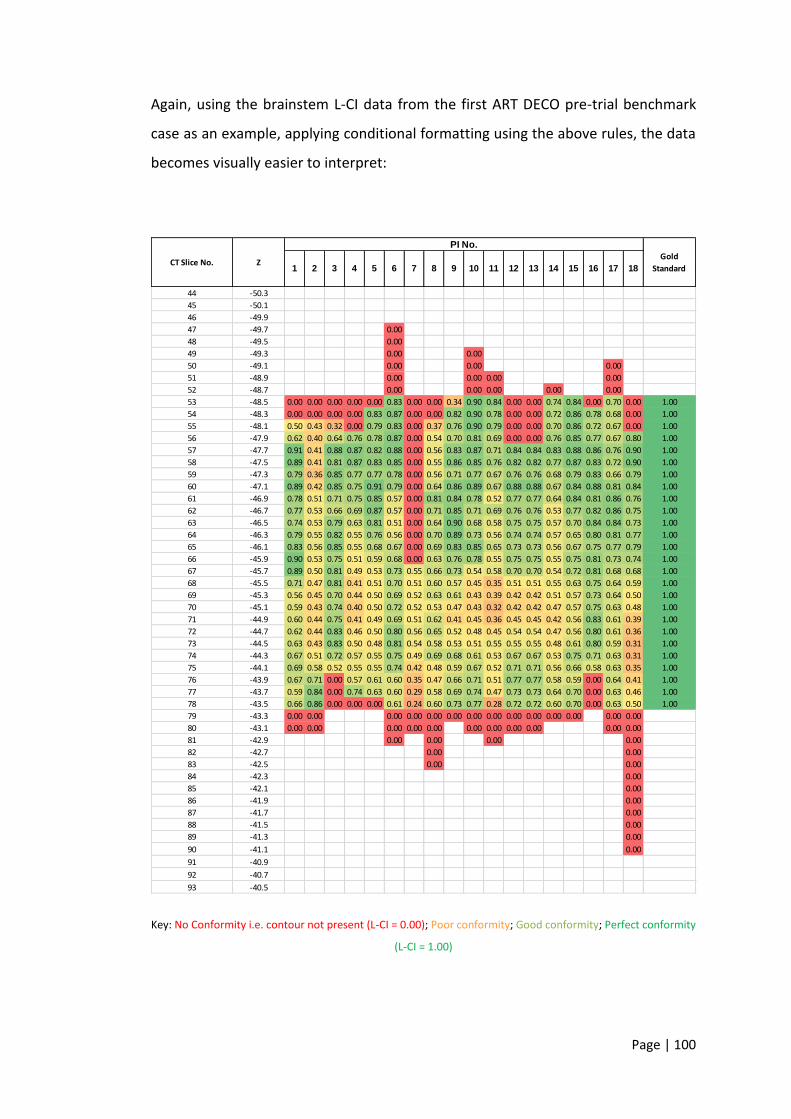
Page | 100
Again, using the brainstem L-CI data from the first ART DECO pre-trial benchmark
case as an example, applying conditional formatting using the above rules, the data
becomes visually easier to interpret:
Key: No Conformity i.e. contour not present (L-CI = 0.00); Poor conformity; Good conformity; Perfect conformity
(L-CI = 1.00)
44 -50.3
45 -50.1
46 -49.9
47 -49.7 0.00
48 -49.5 0.00
49 -49.3 0.00 0.00
50 -49.1 0.00 0.00 0.00
51 -48.9 0.00 0.00 0.00 0.00
52 -48.7 0.00 0.00 0.00 0.00 0.00
53 -48.5 0.00 0.00 0.00 0.00 0.00 0.83 0.00 0.00 0.34 0.90 0.84 0.00 0.00 0.74 0.84 0.00 0.70 0.00 1.00
54 -48.3 0.00 0.00 0.00 0.00 0.83 0.87 0.00 0.00 0.82 0.90 0.78 0.00 0.00 0.72 0.86 0.78 0.68 0.00 1.00
55 -48.1 0.50 0.43 0.32 0.00 0.79 0.83 0.00 0.37 0.76 0.90 0.79 0.00 0.00 0.70 0.86 0.72 0.67 0.00 1.00
56 -47.9 0.62 0.40 0.64 0.76 0.78 0.87 0.00 0.54 0.70 0.81 0.69 0.00 0.00 0.76 0.85 0.77 0.67 0.80 1.00
57 -47.7 0.91 0.41 0.88 0.87 0.82 0.88 0.00 0.56 0.83 0.87 0.71 0.84 0.84 0.83 0.88 0.86 0.76 0.90 1.00
58 -47.5 0.89 0.41 0.81 0.87 0.83 0.85 0.00 0.55 0.86 0.85 0.76 0.82 0.82 0.77 0.87 0.83 0.72 0.90 1.00
59 -47.3 0.79 0.36 0.85 0.77 0.77 0.78 0.00 0.56 0.71 0.77 0.67 0.76 0.76 0.68 0.79 0.83 0.66 0.79 1.00
60 -47.1 0.89 0.42 0.85 0.75 0.91 0.79 0.00 0.64 0.86 0.89 0.67 0.88 0.88 0.67 0.84 0.88 0.81 0.84 1.00
61 -46.9 0.78 0.51 0.71 0.75 0.85 0.57 0.00 0.81 0.84 0.78 0.52 0.77 0.77 0.64 0.84 0.81 0.86 0.76 1.00
62 -46.7 0.77 0.53 0.66 0.69 0.87 0.57 0.00 0.71 0.85 0.71 0.69 0.76 0.76 0.53 0.77 0.82 0.86 0.75 1.00
63 -46.5 0.74 0.53 0.79 0.63 0.81 0.51 0.00 0.64 0.90 0.68 0.58 0.75 0.75 0.57 0.70 0.84 0.84 0.73 1.00
64 -46.3 0.79 0.55 0.82 0.55 0.76 0.56 0.00 0.70 0.89 0.73 0.56 0.74 0.74 0.57 0.65 0.80 0.81 0.77 1.00
65 -46.1 0.83 0.56 0.85 0.55 0.68 0.67 0.00 0.69 0.83 0.85 0.65 0.73 0.73 0.56 0.67 0.75 0.77 0.79 1.00
66 -45.9 0.90 0.53 0.75 0.51 0.59 0.68 0.00 0.63 0.76 0.78 0.55 0.75 0.75 0.55 0.75 0.81 0.73 0.74 1.00
67 -45.7 0.89 0.50 0.81 0.49 0.53 0.73 0.55 0.66 0.73 0.54 0.58 0.70 0.70 0.54 0.72 0.81 0.68 0.68 1.00
68 -45.5 0.71 0.47 0.81 0.41 0.51 0.70 0.51 0.60 0.57 0.45 0.35 0.51 0.51 0.55 0.63 0.75 0.64 0.59 1.00
69 -45.3 0.56 0.45 0.70 0.44 0.50 0.69 0.52 0.63 0.61 0.43 0.39 0.42 0.42 0.51 0.57 0.73 0.64 0.50 1.00
70 -45.1 0.59 0.43 0.74 0.40 0.50 0.72 0.52 0.53 0.47 0.43 0.32 0.42 0.42 0.47 0.57 0.75 0.63 0.48 1.00
71 -44.9 0.60 0.44 0.75 0.41 0.49 0.69 0.51 0.62 0.41 0.45 0.36 0.45 0.45 0.42 0.56 0.83 0.61 0.39 1.00
72 -44.7 0.62 0.44 0.83 0.46 0.50 0.80 0.56 0.65 0.52 0.48 0.45 0.54 0.54 0.47 0.56 0.80 0.61 0.36 1.00
73 -44.5 0.63 0.43 0.83 0.50 0.48 0.81 0.54 0.58 0.53 0.51 0.55 0.55 0.55 0.48 0.61 0.80 0.59 0.31 1.00
74 -44.3 0.67 0.51 0.72 0.57 0.55 0.75 0.49 0.69 0.68 0.61 0.53 0.67 0.67 0.53 0.75 0.71 0.63 0.31 1.00
75 -44.1 0.69 0.58 0.52 0.55 0.55 0.74 0.42 0.48 0.59 0.67 0.52 0.71 0.71 0.56 0.66 0.58 0.63 0.35 1.00
76 -43.9 0.67 0.71 0.00 0.57 0.61 0.60 0.35 0.47 0.66 0.71 0.51 0.77 0.77 0.58 0.59 0.00 0.64 0.41 1.00
77 -43.7 0.59 0.84 0.00 0.74 0.63 0.60 0.29 0.58 0.69 0.74 0.47 0.73 0.73 0.64 0.70 0.00 0.63 0.46 1.00
78 -43.5 0.66 0.86 0.00 0.00 0.00 0.61 0.24 0.60 0.73 0.77 0.28 0.72 0.72 0.60 0.70 0.00 0.63 0.50 1.00
79 -43.3 0.00 0.00 0.00 0.00 0.00 0.00 0.00 0.00 0.00 0.00 0.00 0.00 0.00 0.00
80 -43.1 0.00 0.00 0.00 0.00 0.00 0.00 0.00 0.00 0.00 0.00 0.00
81 -42.9 0.00 0.00 0.00 0.00
82 -42.7 0.00 0.00
83 -42.5 0.00 0.00
84 -42.3 0.00
85 -42.1 0.00
86 -41.9 0.00
87 -41.7 0.00
88 -41.5 0.00
89 -41.3 0.00
90 -41.1 0.00
91 -40.9
92 -40.7
93 -40.5
CT Slice No. Z
PI No.
Gold
Standard1 2 3 4 10 11 12 13 145 6 7 8 9 15 16 17 18
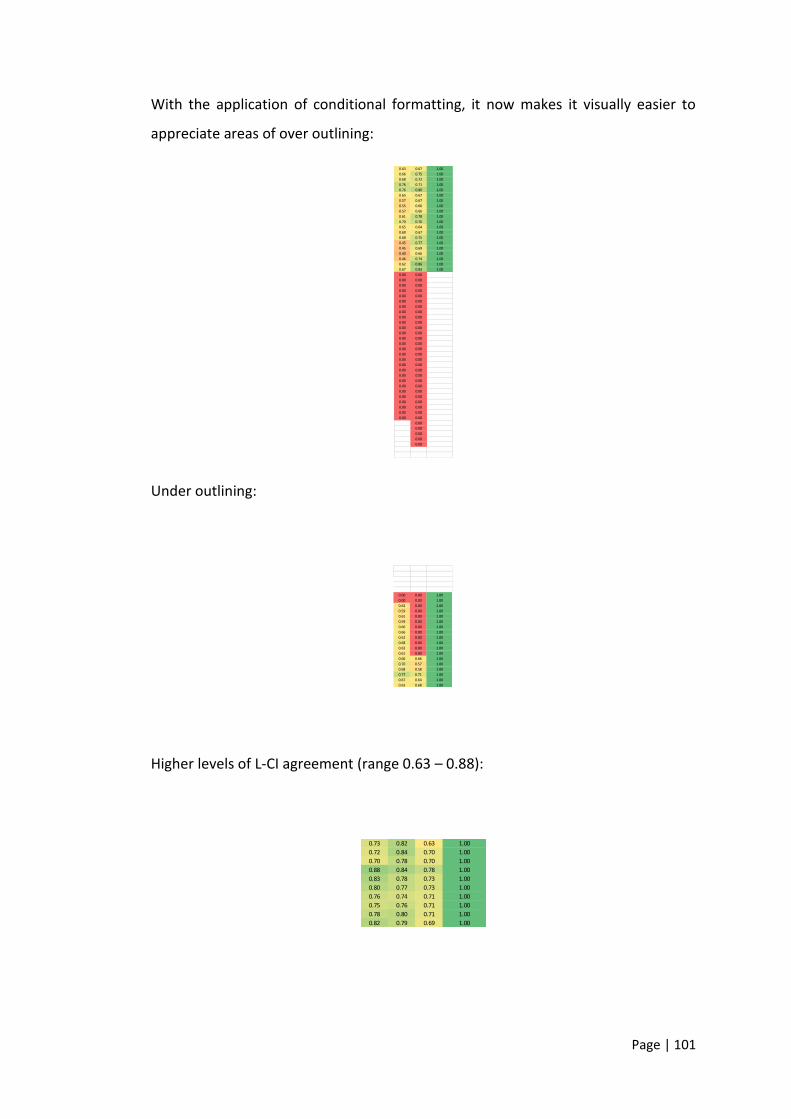
Page | 101
With the application of conditional formatting, it now makes it visually easier to
appreciate areas of over outlining:
Under outlining:
Higher levels of L-CI agreement (range 0.63 – 0.88):
0.63 0.67 1.00
0.66 0.75 1.00
0.68 0.72 1.00
0.76 0.71 1.00
0.76 0.80 1.00
0.65 0.67 1.00
0.57 0.67 1.00
0.55 0.66 1.00
0.57 0.66 1.00
0.61 0.78 1.00
0.70 0.76 1.00
0.65 0.64 1.00
0.60 0.67 1.00
0.68 0.75 1.00
0.45 0.77 1.00
0.45 0.69 1.00
0.40 0.66 1.00
0.46 0.74 1.00
0.62 0.86 1.00
0.67 0.83 1.00
0.00 0.00
0.00 0.00
0.00 0.00
0.00 0.00
0.00 0.00
0.00 0.00
0.00 0.00
0.00 0.00
0.00 0.00
0.00 0.00
0.00 0.00
0.00 0.00
0.00 0.00
0.00 0.00
0.00 0.00
0.00 0.00
0.00 0.00
0.00 0.00
0.00 0.00
0.00 0.00
0.00 0.00
0.00 0.00
0.00 0.00
0.00 0.00
0.00 0.00
0.00 0.00
0.00 0.00
0.00 0.00
0.00
0.00
0.00
0.00
0.00
0.00 0.00 1.00
0.00 0.00 1.00
0.62 0.00 1.00
0.59 0.00 1.00
0.61 0.00 1.00
0.59 0.00 1.00
0.66 0.00 1.00
0.66 0.00 1.00
0.62 0.00 1.00
0.68 0.00 1.00
0.63 0.00 1.00
0.61 0.00 1.00
0.66 0.66 1.00
0.70 0.57 1.00
0.68 0.58 1.00
0.77 0.71 1.00
0.67 0.64 1.00
0.63 0.68 1.00
0.73 0.82 0.63 1.00
0.72 0.84 0.70 1.00
0.70 0.78 0.70 1.00
0.88 0.84 0.78 1.00
0.83 0.78 0.73 1.00
0.80 0.77 0.73 1.00
0.76 0.74 0.71 1.00
0.75 0.76 0.71 1.00
0.78 0.80 0.71 1.00
0.82 0.79 0.69 1.00
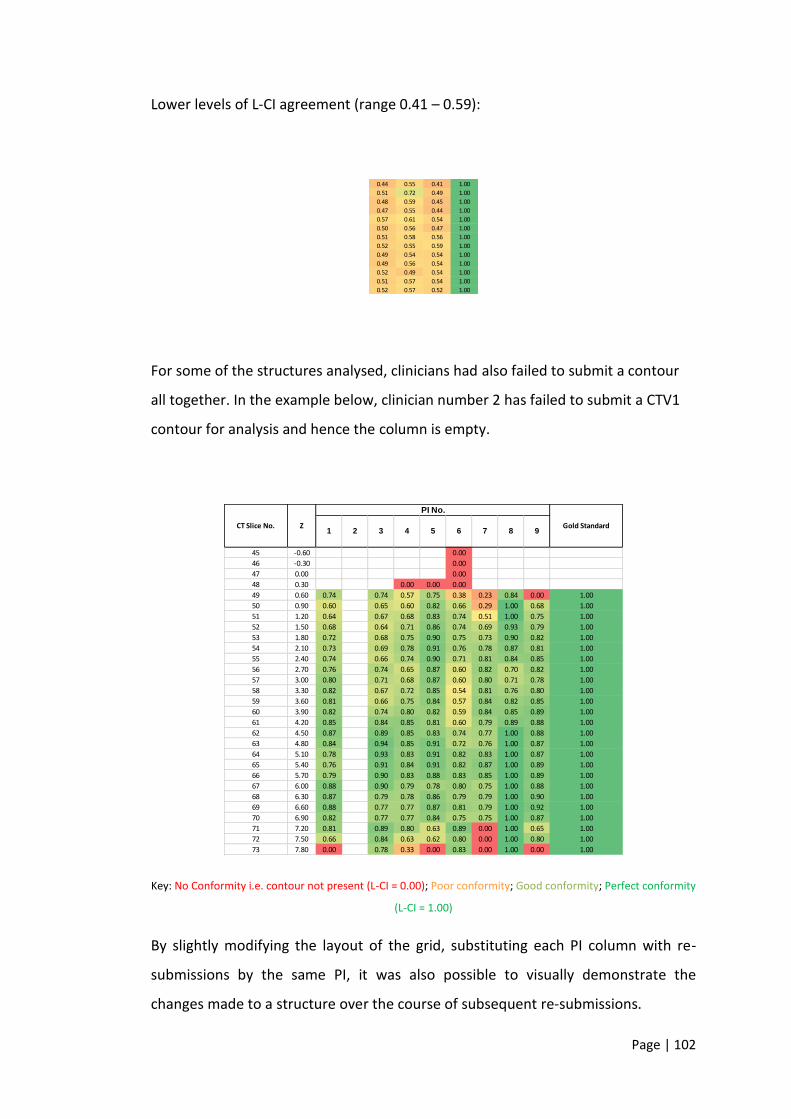
Page | 102
Lower levels of L-CI agreement (range 0.41 – 0.59):
For some of the structures analysed, clinicians had also failed to submit a contour
all together. In the example below, clinician number 2 has failed to submit a CTV1
contour for analysis and hence the column is empty.
Key: No Conformity i.e. contour not present (L-CI = 0.00); Poor conformity; Good conformity; Perfect conformity
(L-CI = 1.00)
By slightly modifying the layout of the grid, substituting each PI column with re-
submissions by the same PI, it was also possible to visually demonstrate the
changes made to a structure over the course of subsequent re-submissions.
0.44 0.55 0.41 1.00
0.51 0.72 0.49 1.00
0.48 0.59 0.45 1.00
0.47 0.55 0.44 1.00
0.57 0.61 0.54 1.00
0.50 0.56 0.47 1.00
0.51 0.58 0.56 1.00
0.52 0.55 0.59 1.00
0.49 0.54 0.54 1.00
0.49 0.56 0.54 1.00
0.52 0.49 0.54 1.00
0.51 0.57 0.54 1.00
0.52 0.57 0.52 1.00
45 -0.60 0.00
46 -0.30 0.00
47 0.00 0.00
48 0.30 0.00 0.00 0.00
49 0.60 0.74 0.74 0.57 0.75 0.38 0.23 0.84 0.00 1.00
50 0.90 0.60 0.65 0.60 0.82 0.66 0.29 1.00 0.68 1.00
51 1.20 0.64 0.67 0.68 0.83 0.74 0.51 1.00 0.75 1.00
52 1.50 0.68 0.64 0.71 0.86 0.74 0.69 0.93 0.79 1.00
53 1.80 0.72 0.68 0.75 0.90 0.75 0.73 0.90 0.82 1.00
54 2.10 0.73 0.69 0.78 0.91 0.76 0.78 0.87 0.81 1.00
55 2.40 0.74 0.66 0.74 0.90 0.71 0.81 0.84 0.85 1.00
56 2.70 0.76 0.74 0.65 0.87 0.60 0.82 0.70 0.82 1.00
57 3.00 0.80 0.71 0.68 0.87 0.60 0.80 0.71 0.78 1.00
58 3.30 0.82 0.67 0.72 0.85 0.54 0.81 0.76 0.80 1.00
59 3.60 0.81 0.66 0.75 0.84 0.57 0.84 0.82 0.85 1.00
60 3.90 0.82 0.74 0.80 0.82 0.59 0.84 0.85 0.89 1.00
61 4.20 0.85 0.84 0.85 0.81 0.60 0.79 0.89 0.88 1.00
62 4.50 0.87 0.89 0.85 0.83 0.74 0.77 1.00 0.88 1.00
63 4.80 0.84 0.94 0.85 0.91 0.72 0.76 1.00 0.87 1.00
64 5.10 0.78 0.93 0.83 0.91 0.82 0.83 1.00 0.87 1.00
65 5.40 0.76 0.91 0.84 0.91 0.82 0.87 1.00 0.89 1.00
66 5.70 0.79 0.90 0.83 0.88 0.83 0.85 1.00 0.89 1.00
67 6.00 0.88 0.90 0.79 0.78 0.80 0.75 1.00 0.88 1.00
68 6.30 0.87 0.79 0.78 0.86 0.79 0.79 1.00 0.90 1.00
69 6.60 0.88 0.77 0.77 0.87 0.81 0.79 1.00 0.92 1.00
70 6.90 0.82 0.77 0.77 0.84 0.75 0.75 1.00 0.87 1.00
71 7.20 0.81 0.89 0.80 0.63 0.89 0.00 1.00 0.65 1.00
72 7.50 0.66 0.84 0.63 0.62 0.80 0.00 1.00 0.80 1.00
73 7.80 0.00 0.78 0.33 0.00 0.83 0.00 1.00 0.00 1.00
5 6 7 8 9CT Slice No. Z
PI No.
Gold Standard1 2 3 4
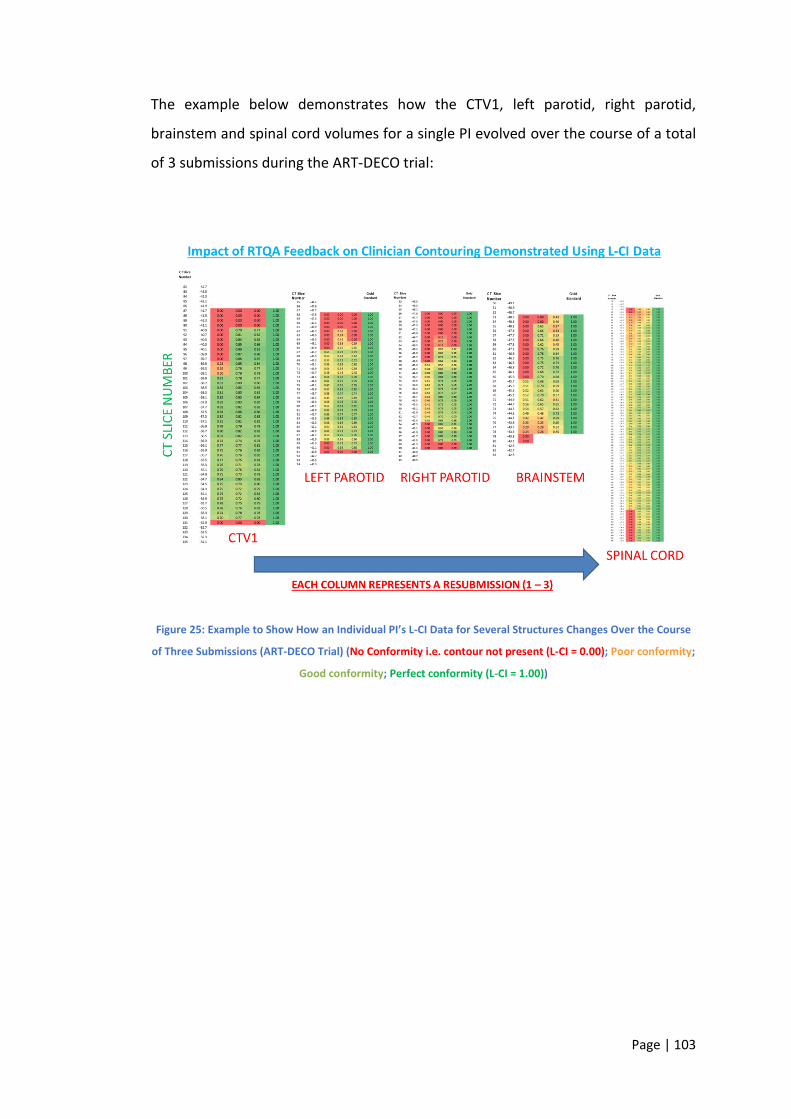
Page | 103
The example below demonstrates how the CTV1, left parotid, right parotid,
brainstem and spinal cord volumes for a single PI evolved over the course of a total
of 3 submissions during the ART-DECO trial:
Figure 25: Example to Show How an Individual PI’s L-CI Data for Several Structures Changes Over the Course
of Three Submissions (ART-DECO Trial) (No Conformity i.e. contour not present (L-CI = 0.00); Poor conformity;
Good conformity; Perfect conformity (L-CI = 1.00))
Page | 104
References
1. Begnozzi, L., et al., Quality assurance of 3D-CRT: indications and difficulties
in their applications. Crit Rev Oncol Hematol, 2009. 70(1): p. 24-38.
2. Morris, D.E., et al., Evidence-based review of three-dimensional conformal
radiotherapy for localized prostate cancer: an ASTRO outcomes initiative.
International journal of radiation oncology, biology, physics, 2005. 62(1): p.
3-19.
3. Fuks, Z., et al., Three-dimensional conformal treatment: a new frontier in
radiation therapy. Important Adv Oncol, 1991: p. 151-72.
4. Dearnaley, D.P., et al., Comparison of radiation side-effects of conformal and
conventional radiotherapy in prostate cancer: a randomised trial. Lancet,
1999. 353(9149): p. 267-72.
5. Measurements, I.C.o.R.U.a., Prescribing, recording and reporting electron
beam theraphy. 2004, Oxford: Oxford University Press. 100 p.
6. Measurements, I.C.o.R.U.a., Prescribing, recording and reporting photon
beam therapy : issued: 1 September 1993. 1993, Bethesda, Md.:
International Commission on Radiation Units and Measurements. viii,72p.
7. Measurements, I.C.o.R.U.a., Prescribing, recording and reporting photon
beam therapy : (supplement to CRU report 50). 1999, Bethesda, Md.:
International Commission on Radiation Units and Measurements. ix, 52 p.
8. Purdy, J.A., Current ICRU definitions of volumes: limitations and future
directions. Semin Radiat Oncol, 2004. 14(1): p. 27-40.
9. Barrett, A., Practical radiotherapy planning. 4th ed. 2009, London: Hodder
Arnold. viii, 468 p.
10. Holland, R., et al., Histologic multifocality of Tis, T1-2 breast carcinomas.
Implications for clinical trials of breast-conserving surgery. Cancer, 1985.
56(5): p. 979-90.
11. Gregoire, V., et al., Selection and delineation of lymph node target volumes
in head and neck conformal radiotherapy. Proposal for standardizing
terminology and procedure based on the surgical experience. Radiotherapy
Page | 105
and oncology : journal of the European Society for Therapeutic Radiology
and Oncology, 2000. 56(2): p. 135-50.
12. Taylor, A., A.G. Rockall, and M.E. Powell, An atlas of the pelvic lymph node
regions to aid radiotherapy target volume definition. Clinical oncology, 2007.
19(7): p. 542-50.
13. Great Britain, H. and C. Safety, Work with ionising radiation : Ionising
Radiations Regulations 1999 approved code of practice and guidance. 2000,
London: HSE Books.
14. Great Britain, H. and C. Safety, The protection of persons against ionising
radiation arising from any work activity. 1994: HSE Books.
15. Great Britain, H. and E. Safety, Requirements for the approval of dosimetry
services under the Ionising Radiations Regulations 1999. 1999, [Sudbury?]:
Health & Safety Executive.
16. Measurements, I.C.o.R.U.a., Prescribing, recording and reporting proton-
beam therapy. 2007, Oxford: Oxford University Press. 210 p.
17. Prescribing, recording, and reporting photon-beam intensity-modulated
radiation therapy (IMRT). 2010, Oxford: Oxford University Press.
18. On target : ensuring geometric accuracy in radiotherapy. 2008, London:
Royal College of Radiologists.
19. Grabarz, D., et al., Quantifying interobserver variation in target definition in
palliative radiotherapy. Int J Radiat Oncol Biol Phys, 2011. 80(5): p. 1498-
504.
20. Wachter, S., et al., Interobserver comparison of CT and MRI-based prostate
apex definition. Clinical relevance for conformal radiotherapy treatment
planning. Strahlenther Onkol, 2002. 178(5): p. 263-8.
21. Wu, D.H., et al., Interobserver variation in cervical cancer tumor delineation
for image-based radiotherapy planning among and within different
specialties. J Appl Clin Med Phys, 2005. 6(4): p. 106-10.
22. Loo, S.W., et al., Interobserver variation in parotid gland delineation: a study
of its impact on intensity-modulated radiotherapy solutions with a
systematic review of the literature. Br J Radiol, 2012. 85(1016): p. 1070-7.
Page | 106
23. Cattaneo, G.M., et al., Target delineation in post-operative radiotherapy of
brain gliomas: interobserver variability and impact of image registration of
MR(pre-operative) images on treatment planning CT scans. Radiother Oncol,
2005. 75(2): p. 217-23.
24. Lorenzen, E.L., et al., Inter-observer variation in delineation of the heart and
left anterior descending coronary artery in radiotherapy for breast cancer: a
multi-centre study from Denmark and the UK. Radiother Oncol, 2013.
108(2): p. 254-8.
25. Yamazaki, H., et al., Quantitative assessment of inter-observer variability in
target volume delineation on stereotactic radiotherapy treatment for
pituitary adenoma and meningioma near optic tract. Radiat Oncol, 2011. 6:
p. 10.
26. Krengli, M., et al., Target volume delineation for preoperative radiotherapy
of rectal cancer: inter-observer variability and potential impact of FDG-
PET/CT imaging. Technol Cancer Res Treat, 2010. 9(4): p. 393-8.
27. Gwynne, S., et al., Toward semi-automated assessment of target volume
delineation in radiotherapy trials: the SCOPE 1 pretrial test case. Int J Radiat
Oncol Biol Phys, 2012. 84(4): p. 1037-42.
28. Jeanneret-Sozzi, W., et al., The reasons for discrepancies in target volume
delineation : a SASRO study on head-and-neck and prostate cancers.
Strahlenther Onkol, 2006. 182(8): p. 450-7.
29. Breen, S.L., et al., Intraobserver and interobserver variability in GTV
delineation on FDG-PET-CT images of head and neck cancers. Int J Radiat
Oncol Biol Phys, 2007. 68(3): p. 763-70.
30. McJury, M., et al., Optimizing localization accuracy in head and neck, and
brain radiotherapy. Br J Radiol, 2006. 79(944): p. 672-80.
31. Moseley, D.J., et al., Comparison of localization performance with implanted
fiducial markers and cone-beam computed tomography for on-line image-
guided radiotherapy of the prostate. Int J Radiat Oncol Biol Phys, 2007.
67(3): p. 942-53.
Page | 107
32. Greco, C., et al., Current status of PET/CT for tumour volume definition in
radiotherapy treatment planning for non-small cell lung cancer (NSCLC).
Lung Cancer, 2007. 57(2): p. 125-34.
33. Smith, W.L., et al., Prostate volume contouring: a 3D analysis of
segmentation using 3DTRUS, CT, and MR. Int J Radiat Oncol Biol Phys, 2007.
67(4): p. 1238-47.
34. Horan, G., et al., "Two are better than one": a pilot study of how radiologist
and oncologists can collaborate in target volume definition. Cancer Imaging,
2006. 6: p. 16-9.
35. Steenbakkers, R.J., et al., Observer variation in target volume delineation of
lung cancer related to radiation oncologist-computer interaction: a 'Big
Brother' evaluation. Radiother Oncol, 2005. 77(2): p. 182-90.
36. Tai, P., et al., Variability of target volume delineation in cervical esophageal
cancer. Int J Radiat Oncol Biol Phys, 1998. 42(2): p. 277-88.
37. Seddon, B., et al., Target volume definition in conformal radiotherapy for
prostate cancer: quality assurance in the MRC RT-01 trial. Radiother Oncol,
2000. 56(1): p. 73-83.
38. Peters, L.J., et al., Critical impact of radiotherapy protocol compliance and
quality in the treatment of advanced head and neck cancer: results from
TROG 02.02. Journal of clinical oncology : official journal of the American
Society of Clinical Oncology, 2010. 28(18): p. 2996-3001.
39. Abrams, R.A., et al., Failure to adhere to protocol specified radiation therapy
guidelines was associated with decreased survival in RTOG 9704--a phase III
trial of adjuvant chemotherapy and chemoradiotherapy for patients with
resected adenocarcinoma of the pancreas. International journal of radiation
oncology, biology, physics, 2012. 82(2): p. 809-16.
40. Crane, C.H., et al., Phase II study of bevacizumab with concurrent
capecitabine and radiation followed by maintenance gemcitabine and
bevacizumab for locally advanced pancreatic cancer: Radiation Therapy
Oncology Group RTOG 0411. J Clin Oncol, 2009. 27(25): p. 4096-102.
41. Koshy, M.C., et al., A challenge to the therapeutic nihilism of ESPAC-1. Int J
Radiat Oncol Biol Phys, 2005. 61(4): p. 965-6.
Page | 108
42. Neoptolemos, J.P., et al., A randomized trial of chemoradiotherapy and
chemotherapy after resection of pancreatic cancer. N Engl J Med, 2004.
350(12): p. 1200-10.
43. National Comprehensive Cancer, N., Pancreatic Adenocarcinoma. 2017,
NCCN.
44. Ohri, N., et al., Radiotherapy protocol deviations and clinical outcomes: a
meta-analysis of cooperative group clinical trials. J Natl Cancer Inst, 2013.
105(6): p. 387-93.
45. Fairchild, A., et al., Does Quality of Radiotherapy Predict Outcomes of
Multicentre Cooperative Group Trials? A Literature Review. International
journal of radiation oncology, biology, physics, 2013. 87(2): p. 246-260.
46. Goodman, K.A., Quality Assurance for Radiotherapy: A Priority for Clinical
Trials. JNCI: Journal of the National Cancer Institute, 2013. 105(6): p. 376-
377.
47. Miles, E. and K. Venables, Radiotherapy quality assurance: facilitation of
radiotherapy research and implementation of technology. Clin Oncol (R Coll
Radiol), 2012. 24(10): p. 710-2.
48. Fuller, C.D., et al., Prospective randomized double-blind pilot study of site-
specific consensus atlas implementation for rectal cancer target volume
delineation in the cooperative group setting. Int J Radiat Oncol Biol Phys,
2011. 79(2): p. 481-9.
49. van Sornsen de Koste, J.R., et al., Use of CD-ROM-based tool for analyzing
contouring variations in involved-field radiotherapy for Stage III NSCLC. Int J
Radiat Oncol Biol Phys, 2005. 63(2): p. 334-9.
50. Clark, C.H., et al., Pre-trial quality assurance processes for an intensity-
modulated radiation therapy (IMRT) trial: PARSPORT, a UK multicentre
Phase III trial comparing conventional radiotherapy and parotid-sparing
IMRT for locally advanced head and neck cancer. Br J Radiol, 2009. 82(979):
p. 585-94.
51. Szumacher, E., et al., Effectiveness of educational intervention on the
congruence of prostate and rectal contouring as compared with a gold
Page | 109
standard in three-dimensional radiotherapy for prostate. Int J Radiat Oncol
Biol Phys, 2010. 76(2): p. 379-85.
52. Senan, S., et al., Evaluation of a target contouring protocol for 3D conformal
radiotherapy in non-small cell lung cancer. Radiother Oncol, 1999. 53(3): p.
247-55.
53. Valicenti, R.K., et al., Variation of clinical target volume definition in three-
dimensional conformal radiation therapy for prostate cancer. Int J Radiat
Oncol Biol Phys, 1999. 44(4): p. 931-5.
54. Gwynne, S., et al., Improving radiotherapy quality assurance in clinical trials:
assessment of target volume delineation of the pre-accrual benchmark case.
Br J Radiol, 2013. 86(1024): p. 20120398.
55. Hanna, G.G., A.R. Hounsell, and J.M. O’Sullivan, Geometrical Analysis of
Radiotherapy Target Volume Delineation: a Systematic Review of Reported
Comparison Methods. Clinical Oncology, 2010. 22(7): p. 515-525.
56. Dice, L.R., Measures of the Amount of Ecologic Association Between Species.
Ecology, 1945. 26(3): p. 297-302.
57. Kouwenhoven, E., M. Giezen, and H. Struikmans, Measuring the similarity of
target volume delineations independent of the number of observers. Phys
Med Biol, 2009. 54(9): p. 2863-73.
58. Riet, A.v.t., et al., A conformation number to quantify the degree of
conformality in brachytherapy and external beam irradiation: Application to
the prostate. International Journal of Radiation Oncology*Biology*Physics,
1997. 37(3): p. 731-736.
59. Kepka, L., et al., Delineation variation of lymph node stations for treatment
planning in lung cancer radiotherapy. Radiother Oncol, 2007. 85(3): p. 450-
5.
60. Muijs, C.T., et al., Consequences of additional use of PET information for
target volume delineation and radiotherapy dose distribution for esophageal
cancer. Radiother Oncol, 2009. 93(3): p. 447-53.
61. Fotina, I., et al., Critical discussion of evaluation parameters for inter-
observer variability in target definition for radiation therapy.
Strahlentherapie und Onkologie, 2012. 188(2): p. 160-167.
Page | 110
62. Logue, J.P., et al., Clinical variability of target volume description in
conformal radiotherapy planning. Int J Radiat Oncol Biol Phys, 1998. 41(4):
p. 929-31.
63. Altorjai, G., et al., Cone-beam CT-based delineation of stereotactic lung
targets: the influence of image modality and target size on interobserver
variability. Int J Radiat Oncol Biol Phys, 2012. 82(2): p. e265-72.
64. Gwynne, S., et al., Inter-observer Variation in Outlining of Pre-trial Test Case
in the SCOPE1 Trial: A United Kingdom Definitive Chemoradiotherapy Trial
for Esophageal Cancer. International Journal of Radiation
Oncology*Biology*Physics, 2011. 81(2, Supplement): p. S67-S68.
65. Li, X.A., et al., Variability of target and normal structure delineation for
breast cancer radiotherapy: an RTOG Multi-Institutional and Multiobserver
Study. Int J Radiat Oncol Biol Phys, 2009. 73(3): p. 944-51.
66. Louie, A.V., et al., Inter-observer and intra-observer reliability for lung cancer
target volume delineation in the 4D-CT era. Radiother Oncol, 2010. 95(2): p.
166-71.
67. Lutgendorf-Caucig, C., et al., Feasibility of CBCT-based target and normal
structure delineation in prostate cancer radiotherapy: multi-observer and
image multi-modality study. Radiother Oncol, 2011. 98(2): p. 154-61.
68. Petersen, R.P., et al., Target volume delineation for partial breast
radiotherapy planning: clinical characteristics associated with low
interobserver concordance. Int J Radiat Oncol Biol Phys, 2007. 69(1): p. 41-8.
69. Song, W.Y., et al., Prostate contouring uncertainty in megavoltage computed
tomography images acquired with a helical tomotherapy unit during image-
guided radiation therapy. Int J Radiat Oncol Biol Phys, 2006. 65(2): p. 595-
607.
70. Steenbakkers, R.J., et al., Reduction of observer variation using matched CT-
PET for lung cancer delineation: a three-dimensional analysis. Int J Radiat
Oncol Biol Phys, 2006. 64(2): p. 435-48.
71. van Baardwijk, A., et al., PET-CT-based auto-contouring in non-small-cell
lung cancer correlates with pathology and reduces interobserver variability
Page | 111
in the delineation of the primary tumor and involved nodal volumes. Int J
Radiat Oncol Biol Phys, 2007. 68(3): p. 771-8.
72. Weiss, E., et al., Clinical evaluation of soft tissue organ boundary
visualization on cone-beam computed tomographic imaging. Int J Radiat
Oncol Biol Phys, 2010. 78(3): p. 929-36.
73. Tong, S., et al., Intra- and inter-observer variability and reliability of prostate
volume measurement via two-dimensional and three-dimensional
ultrasound imaging. Ultrasound Med Biol, 1998. 24(5): p. 673-81.
74. Berthelet, E., et al., Computed tomography determination of prostate
volume and maximum dimensions: a study of interobserver variability.
Radiother Oncol, 2002. 63(1): p. 37-40.
75. Giezen, M., et al., Magnetic resonance imaging- versus computed
tomography-based target volume delineation of the glandular breast tissue
(clinical target volume breast) in breast-conserving therapy: an exploratory
study. Int J Radiat Oncol Biol Phys, 2011. 81(3): p. 804-11.
76. van Mourik, A.M., et al., Multiinstitutional study on target volume
delineation variation in breast radiotherapy in the presence of guidelines.
Radiother Oncol, 2010. 94(3): p. 286-91.
77. Villeirs, G.M., et al., Interobserver delineation variation using CT versus
combined CT + MRI in intensity-modulated radiotherapy for prostate cancer.
Strahlenther Onkol, 2005. 181(7): p. 424-30.
78. Weltens, C., et al., Interobserver variations in gross tumor volume
delineation of brain tumors on computed tomography and impact of
magnetic resonance imaging. Radiother Oncol, 2001. 60(1): p. 49-59.
79. White, E.A., et al., Inter-observer variability of prostate delineation on cone
beam computerised tomography images. Clin Oncol (R Coll Radiol), 2009.
21(1): p. 32-8.
80. Allozi, R., et al., Tools for consensus analysis of experts' contours for
radiotherapy structure definitions. Radiother Oncol, 2010. 97(3): p. 572-8.
81. Lawton, C.A., et al., Variation in the definition of clinical target volumes for
pelvic nodal conformal radiation therapy for prostate cancer. Int J Radiat
Oncol Biol Phys, 2009. 74(2): p. 377-82.
Page | 112
82. Tyng, C.J., et al., Conformal radiotherapy for lung cancer: interobservers'
variability in the definition of gross tumor volume between radiologists and
radiotherapists. Radiat Oncol, 2009. 4: p. 28.
83. Gwynne, S., et al., Inter-observer Variation in Outlining of Pre-trial Test Case
in the SCOPE1 Trial: A United Kingdom Definitive Chemoradiotherapy Trial
for Esophageal Cancer. International Journal of Radiation Oncology • Biology
• Physics, 2012. 81(2): p. S67-S68.
84. Gwynne, S., et al., PO-0664 MEAN DISTANCE TO CONFORMITY AS A TOOL
FOR ASSESSING OUTLINING IN THE UK SCOPE 1 OESOPHAGEAL
CHEMORADIOTHERAPY TRIAL. Radiotherapy and Oncology, 2012. 103: p.
S259.
85. Fokas, E., et al., Comparison of investigator-delineated gross tumor volumes
and quality assurance in pancreatic cancer: Analysis of the pretrial
benchmark case for the SCALOP trial. Radiotherapy and Oncology, 2015.
86. Cole, N., et al., PO-0965 QUALITY ASSURANCE OF TARGET VOLUME
DEFINITION IN THE ARISTOTLE PHASE III RECTAL CANCER TRIAL – INITIAL
ASSESSMENT. Radiotherapy and Oncology, 2012. 103: p. S380.
87. Vesprini, D., et al., Improving Observer Variability in Target Delineation for
Gastro-oesophageal Cancer—the Role of 18Ffluoro-2-deoxy-d-glucose
Positron Emission Tomography/Computed Tomography. Clinical Oncology,
2008. 20(8): p. 631-638.
88. Yu, W., et al., GTV spatial conformity between different delineation methods
by 18FDG PET/CT and pathology in esophageal cancer. Radiotherapy and
Oncology, 2009. 93(3): p. 441-446.
89. Schreurs, L.M.A., et al., Original article: Impact of 18-fluorodeoxyglucose
positron emission tomography on computed tomography defined target
volumes in radiation treatment planning of esophageal cancer: reduction in
geographic misses with equal inter-observer variability. Diseases of the
Esophagus, 2010. 23(6): p. 493-501.
90. Gwynne, S., et al., PO-0664 MEAN DISTANCE TO CONFORMITY AS A TOOL
FOR ASSESSING OUTLINING IN THE UK SCOPE 1 OESOPHAGEAL
Page | 113
CHEMORADIOTHERAPY TRIAL. Radiotherapy and Oncology, 2012. 103,
Supplement 1(0): p. S259.
91. Gwynne, S., et al., Prospective Review of Outlining in the UK NeoSCOPE
Esophageal Trial. International Journal of Radiation
Oncology*Biology*Physics, 2014. 90(1, Supplement): p. S733.
92. Rackley, T.P., et al., Esophageal Delineation - Lessons Learned From Pre-
Accrual Benchmark Cases in the UK NeoSCOPE Esophageal Trial.
International Journal of Radiation Oncology*Biology*Physics, 2014. 90(1,
Supplement): p. S10.
93. Cole, N., et al., PO-0965 QUALITY ASSURANCE OF TARGET VOLUME
DEFINITION IN THE ARISTOTLE PHASE III RECTAL CANCER TRIAL – INITIAL
ASSESSMENT. Radiotherapy and Oncology, 2012. 103, Supplement 1(0): p.
S380.