Embed Size (px)
Citation preview
Decarbonization PolicyPanel 4: Alexandra Klass: Legal Pathways to Deep Decarbonization
Andy Bowen: A Developer's perspective
Emily Hammond: Local vs Federal Action
Frank Wolak: An Effective (& Durable) Market design for Renewables
Moderator: Dave Tuttle, UT Energy Institute1:00 p.m.-3:30 p.m. Classroom 105
*Coffee Break from 2:00 p.m. - 2:15 p.m. outside of classroom 105
2
3
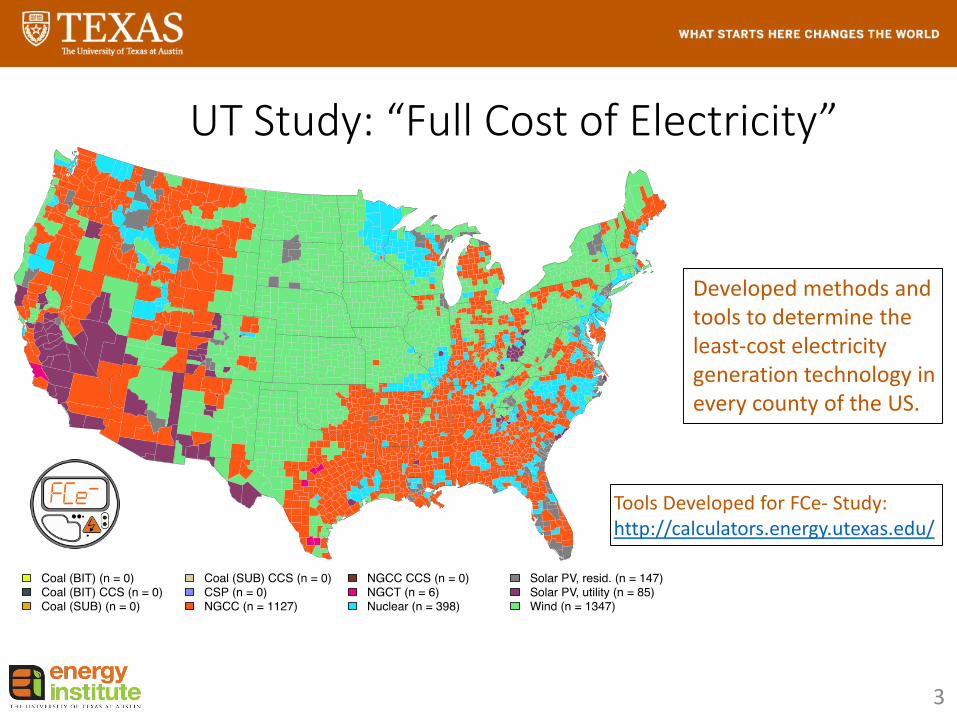
UT Study: “Full Cost of Electricity”
Tools Developed for FCe- Study:http://calculators.energy.utexas.edu/
Developed methods and tools to determine the least-cost electricity generation technology in every county of the US.
Legal Pathways to Deep Decarbonization in the United
States: Transmission, Distribution, and Storage Challenges
Alexandra B. KlassUniversity of Minnesota Law School
Deep Decarbonzation Pathways Project
• Global Project on Deep Decarbonization, http://deepdecarbonization.org/about/
• U.S. reports prepared by Energy and Environmental Economics, Inc. (E3) et al.: – Pathways to Deep Decarbonization in the United
States: US 2050 Volume 1, Technical Report – Policy Implications of Deep Decarbonization in the
United States: US 2050 Volume 2, Policy Report
“Legal Pathways to Deep Decarbonizationin the United States”
• Forthcoming edited book by Michael Gerrard & John Dernbach
• Attempts to identify a wide range of legal pathways for reducing U.S. greenhouse gas (GHG) emissions by at least 80% from 1990 levels by 2050
• Evaluates legal barriers and potential solutions to implementing deep decarbonzation in U.S., building off Deep Decarbonization Pathways Project
• Over 30 chapters written by lawyers and legal academics• Chapters include carbon pricing; behavior; finance;
technological innovation; buildings; vehicles; aviation; utility-scale and distributed energy generation; transmission, distribution, and storage; bioenergy; EVs; CCS; forestry; agriculture; etc.
Chapter 20: Transmission, Distribution and Storage; Grid Integration
• Contains sections on:– Introduction to the electric transmission grid– Transmission needs for deep decarbonization– Technologies available and under development for
deep decarbonization– Laws applicable to transmission expansion for deep
decarbonization– Effect of existing laws governing electric transmission
on deep decarbonization– Potential new public law approaches– Potential new non-public law approaches
Transmission Needs for Deep Decarbonization
• DPP report states that meeting the 2050 target will require:– doubling electricity generation– Converting virtually all passenger vehicles to EVs– deploying significantly increased percentages of
renewable energy into the grid• Scenarios:
– High renewables (2,500 GW or 30 times current)– High nuclear (400 GW or 4 times current)– High CCS (700 GW fossil with CCS)– Mixed case
Technologies Available and Under Development for Deep Decarbonization
• Grid modernization (enhanced sensors, grid-level EMS, AC/DC power flow controllers, smart meters, improved data management and software, energy usage data availability)
• Improved wind forecasting• Expanding HVDC lines• Energy storage (grid scale and distributed)• Taller wind turbines and other improvements
Laws Applicable to Transmission Expansion for Deep Decarbonization
• State primacy in interstate electric transmission line siting (except on federal lands, for federal projects, or to connect hydropower)
• RTO regional planning (and CREZ in TX)• Limited federal backstop authority and limited
opportunities for federal partnerships (i.e., Plains & Eastern Clean Line under Section 1222 of EPAct2005)
• Developing laws on demand response, energy storage, time of use pricing, energy usage data)
Effect of Existing Laws Governing Electric Transmission on Deep Decarbonization
• Difficult for single-state jurisdictions to fully consider all benefits and costs of interstate lines, particularly in “pass through” states
• State siting and eminent domain barriers to merchant lines
• State “right of first refusal” laws can limit markets for new lines
• FERC Order 1000 and RTO planning process (and CREZ) can help
Potential New Public Law Approaches (Congress)
• Amend Federal Power Act to transfer siting authority for interstate lines to FERC
• Expand/clarify FERC “backstop siting” authority under Section 1221 or expand federal involvement under Section 1222 of EPAct 2005
• Impose federal standards on state siting processes (like Telecommunications Siting Act of 1996)
• Streamline environmental review and permitting at federal and/or state level
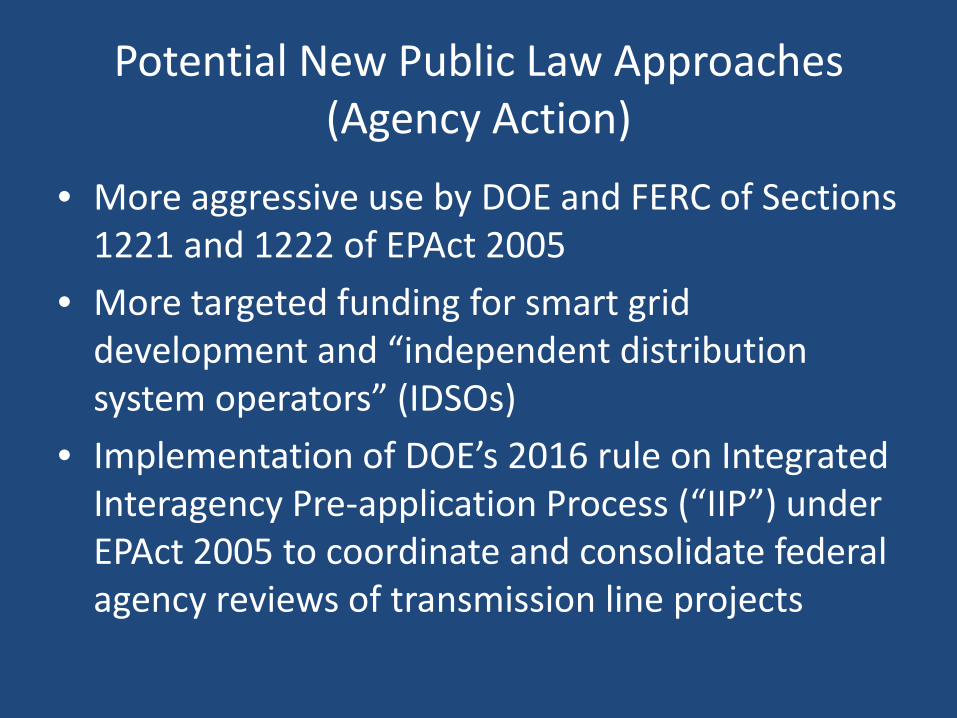
Potential New Public Law Approaches (Agency Action)
• More aggressive use by DOE and FERC of Sections 1221 and 1222 of EPAct 2005
• More targeted funding for smart grid development and “independent distribution system operators” (IDSOs)
• Implementation of DOE’s 2016 rule on Integrated Interagency Pre-application Process (“IIP”) under EPAct 2005 to coordinate and consolidate federal agency reviews of transmission line projects
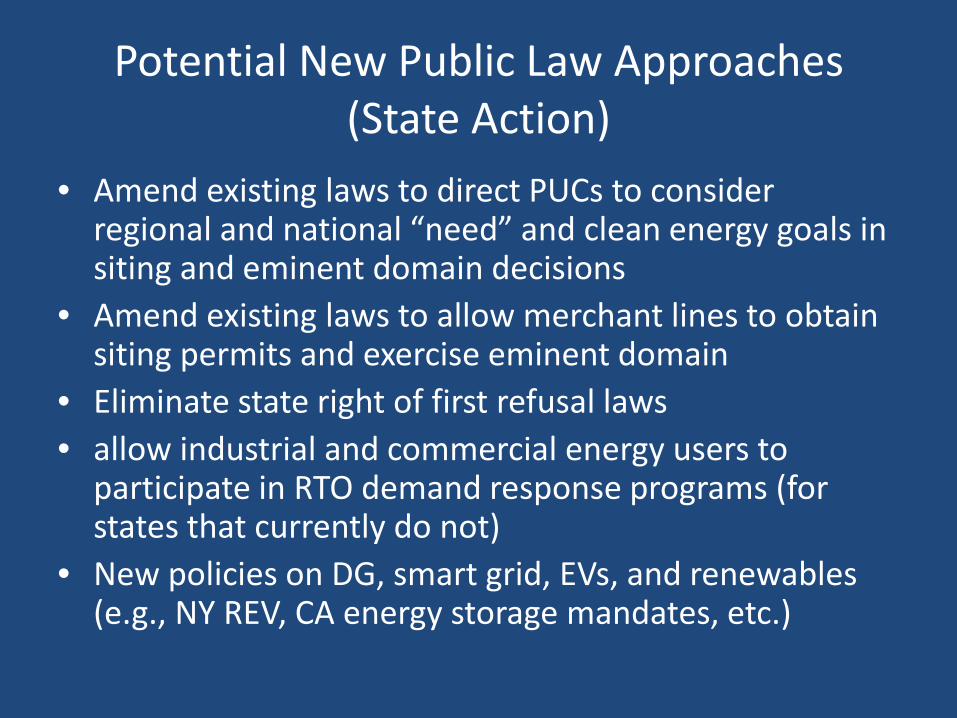
Potential New Public Law Approaches (State Action)
• Amend existing laws to direct PUCs to consider regional and national “need” and clean energy goals in siting and eminent domain decisions
• Amend existing laws to allow merchant lines to obtain siting permits and exercise eminent domain
• Eliminate state right of first refusal laws• allow industrial and commercial energy users to
participate in RTO demand response programs (for states that currently do not)
• New policies on DG, smart grid, EVs, and renewables (e.g., NY REV, CA energy storage mandates, etc.)
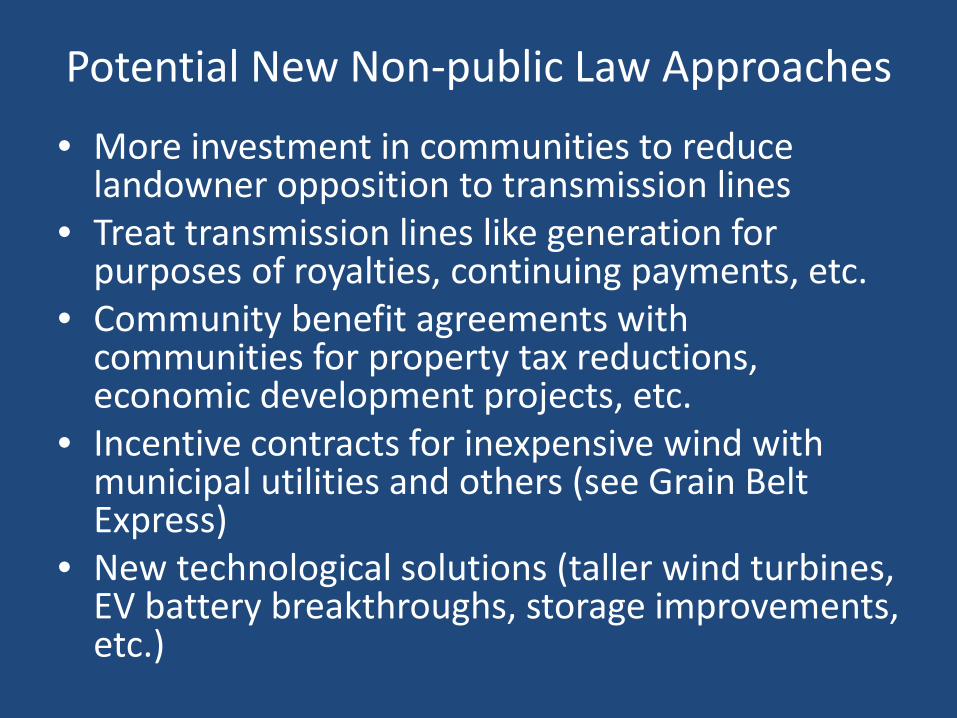
Potential New Non-public Law Approaches
• More investment in communities to reduce landowner opposition to transmission lines
• Treat transmission lines like generation for purposes of royalties, continuing payments, etc.
• Community benefit agreements with communities for property tax reductions, economic development projects, etc.
• Incentive contracts for inexpensive wind with municipal utilities and others (see Grain Belt Express)
• New technological solutions (taller wind turbines, EV battery breakthroughs, storage improvements, etc.)
Emily HammondProfessor of [email protected]
• Scope of Study: Energy Projects at POTWs
• Three Examples
• Project Drivers and Looking Ahead: What Policies Were Most Critical?
Overview
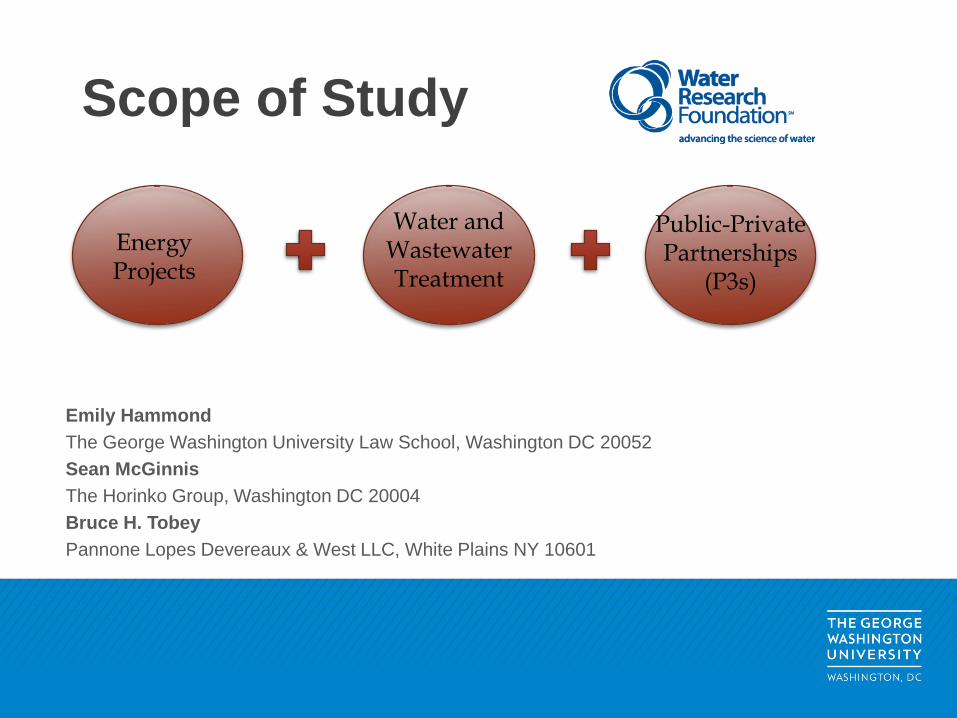
Emily HammondThe George Washington University Law School, Washington DC 20052Sean McGinnisThe Horinko Group, Washington DC 20004Bruce H. TobeyPannone Lopes Devereaux & West LLC, White Plains NY 10601
Scope of Study
Energy Projects
Water and Wastewater Treatment
Public-Private Partnerships
(P3s)
• Demand-Side Measures (efficiency, DR, frequency regulation
• Combined Heat & Power (CHP)• Other Biogas Applications (treat & send to market)• Cool Renewables (solar, wind, in-pipe hydro)
Types of Energy Projects
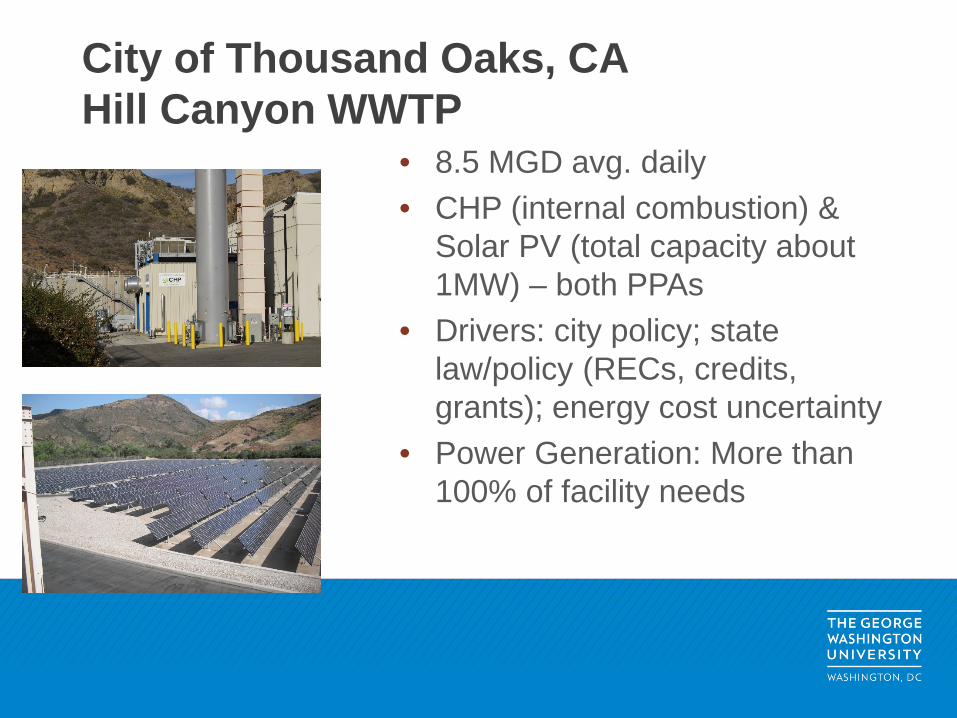
• 8.5 MGD avg. daily• CHP (internal combustion) &
Solar PV (total capacity about 1MW) – both PPAs
• Drivers: city policy; state law/policy (RECs, credits, grants); energy cost uncertainty
• Power Generation: More than 100% of facility needs
City of Thousand Oaks, CAHill Canyon WWTP
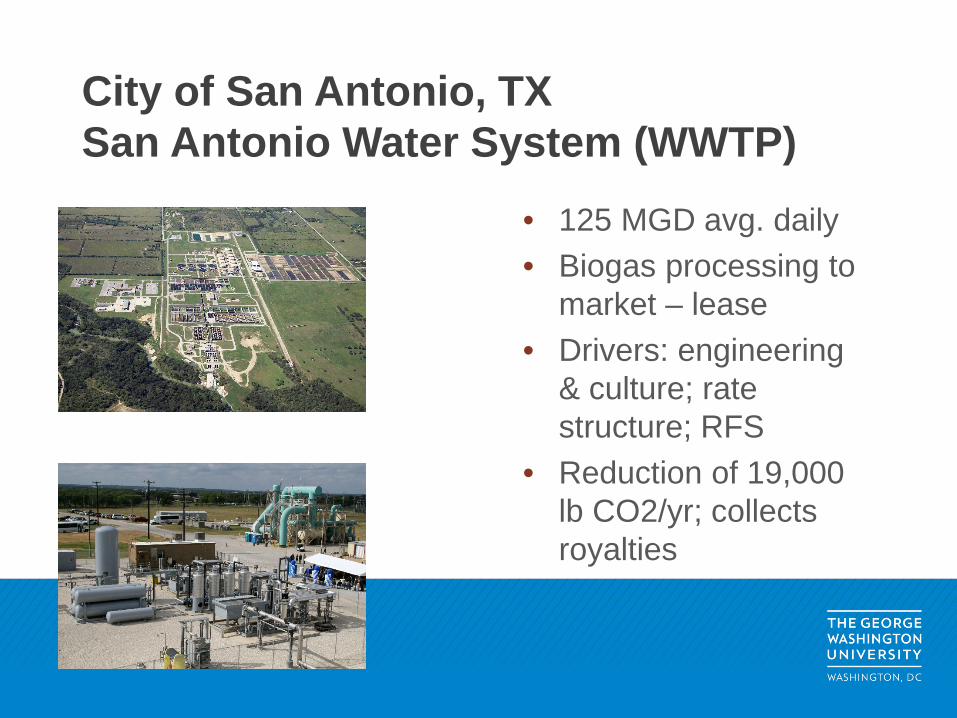
• 125 MGD avg. daily• Biogas processing to
market – lease• Drivers: engineering
& culture; rate structure; RFS
• Reduction of 19,000 lb CO2/yr; collects royalties
City of San Antonio, TXSan Antonio Water System (WWTP)
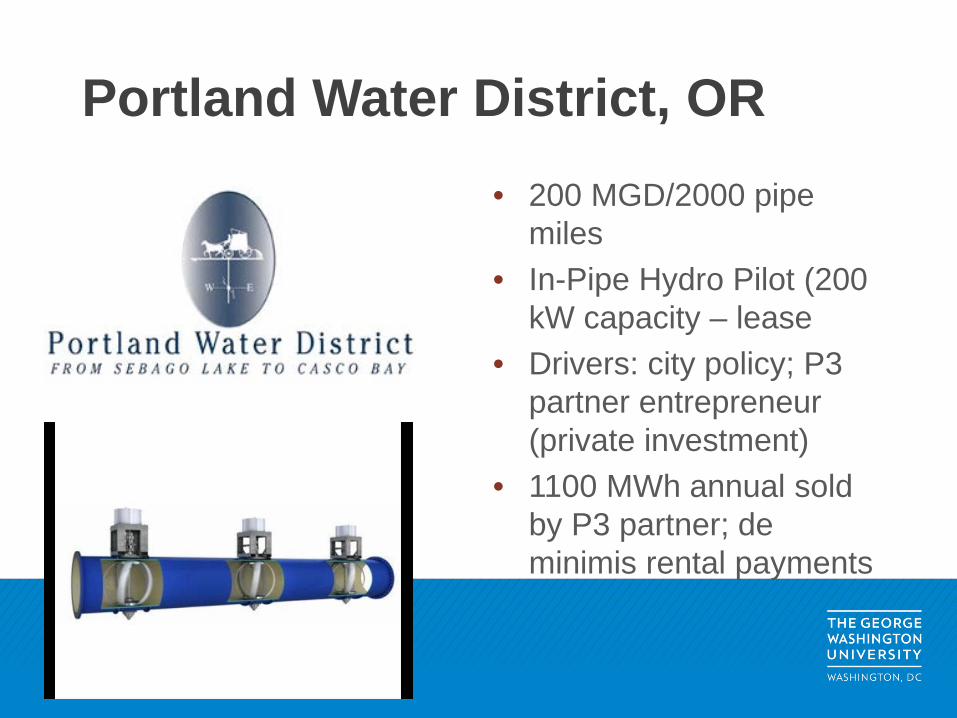
Portland Water District, OR• 200 MGD/2000 pipe
miles• In-Pipe Hydro Pilot (200
kW capacity – lease• Drivers: city policy; P3
partner entrepreneur (private investment)
• 1100 MWh annual sold by P3 partner; de minimis rental payments
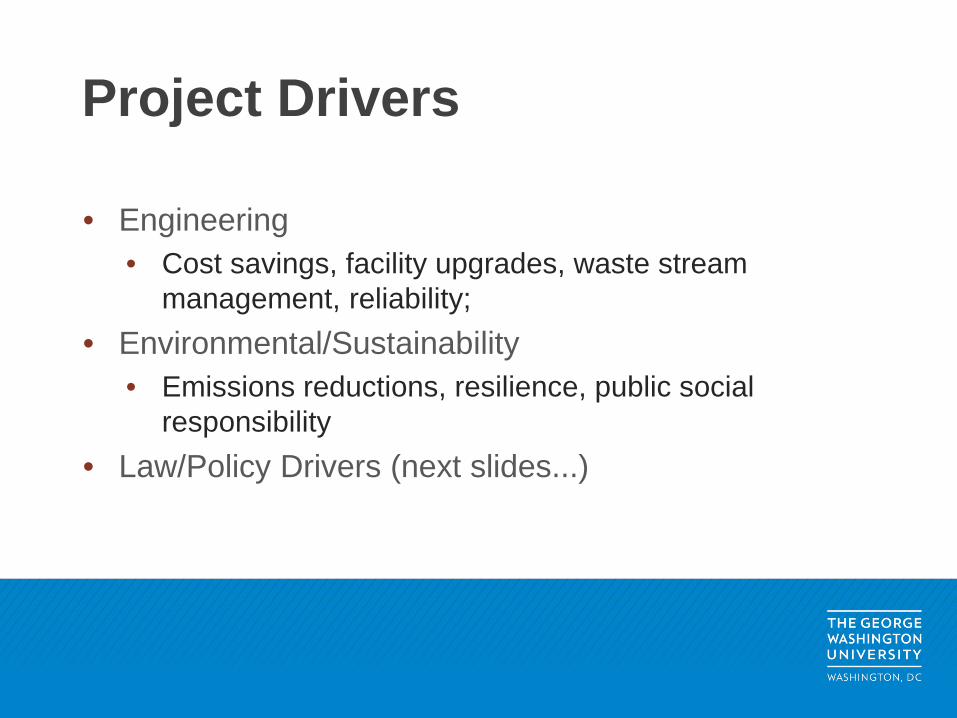
• Engineering • Cost savings, facility upgrades, waste stream
management, reliability; • Environmental/Sustainability
• Emissions reductions, resilience, public social responsibility
• Law/Policy Drivers (next slides...)
Project Drivers
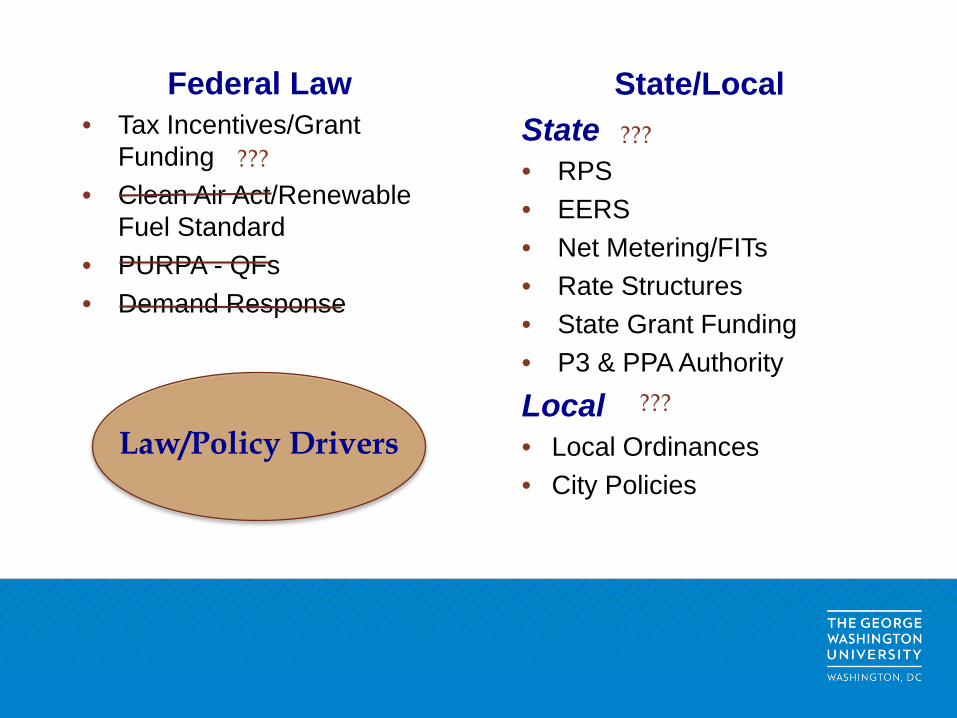
Federal Law• Tax Incentives/Grant
Funding• Clean Air Act/Renewable
Fuel Standard• PURPA - QFs• Demand Response
State/LocalState• RPS• EERS• Net Metering/FITs• Rate Structures• State Grant Funding• P3 & PPA Authority
Local• Local Ordinances• City Policies
Law/Policy Drivers
???
???
???

DECARBONIZATION POLICY –DEVELOPER’S PERSPECTIVEAndy Bowman
April 21, 2017Austin Electricity Conference
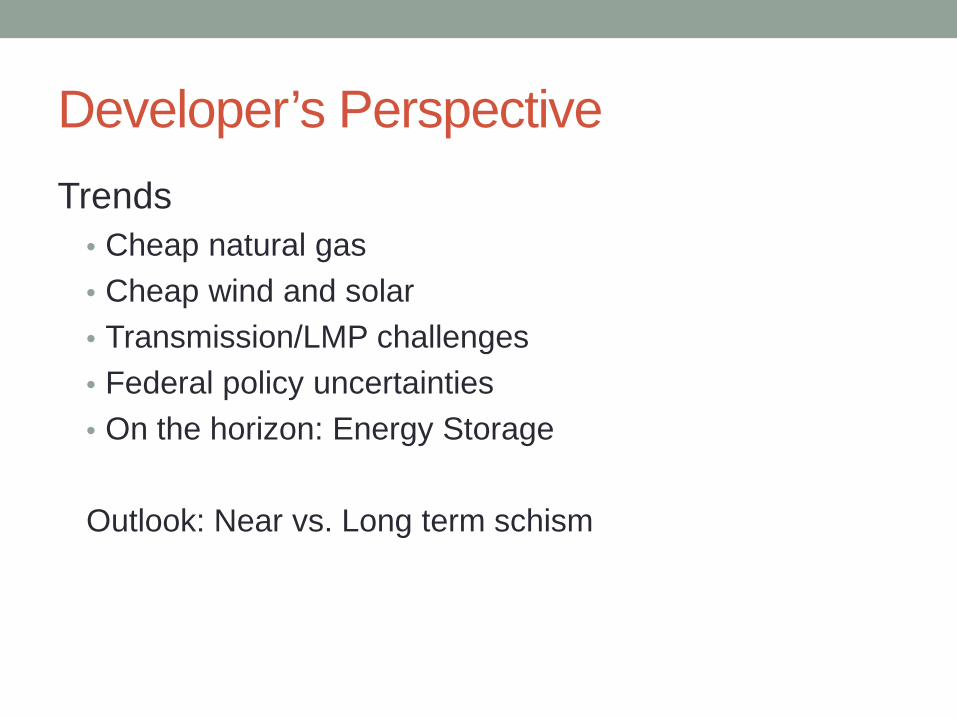
Developer’s PerspectiveTrends
• Cheap natural gas• Cheap wind and solar• Transmission/LMP challenges• Federal policy uncertainties• On the horizon: Energy Storage
Outlook: Near vs. Long term schism
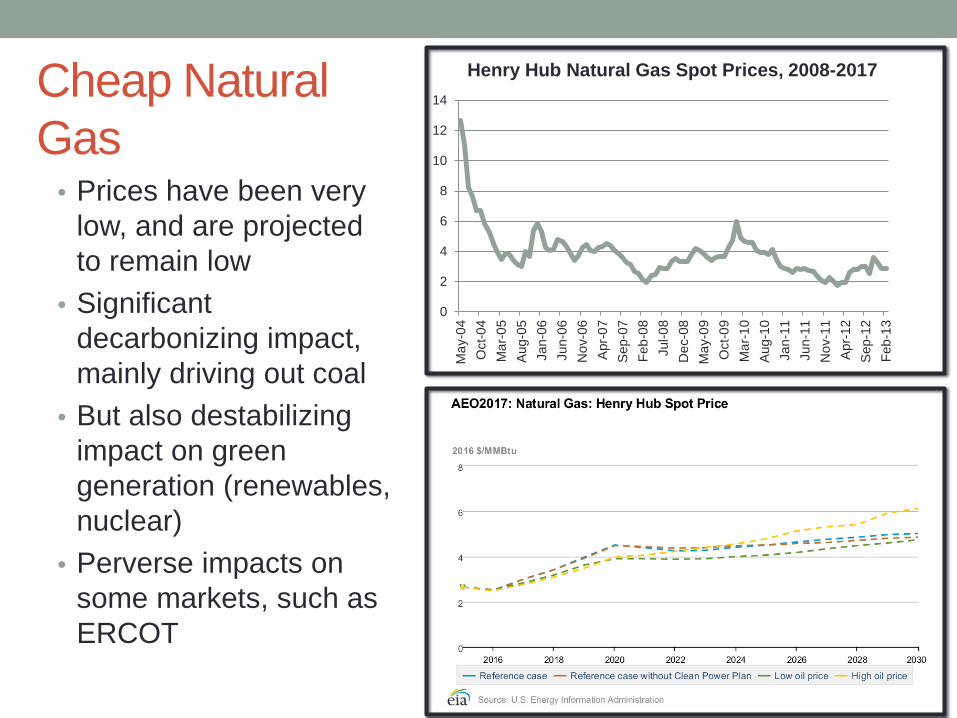
Cheap Natural Gas
• Prices have been very low, and are projected to remain low
• Significant decarbonizing impact, mainly driving out coal
• But also destabilizing impact on green generation (renewables, nuclear)
• Perverse impacts on some markets, such as ERCOT
0
2
4
6
8
10
12
14
May
-04
Oct
-04
Mar
-05
Aug
-05
Jan-
06Ju
n-06
Nov
-06
Apr
-07
Sep
-07
Feb-
08Ju
l-08
Dec
-08
May
-09
Oct
-09
Mar
-10
Aug
-10
Jan-
11Ju
n-11
Nov
-11
Apr
-12
Sep
-12
Feb-
13
Henry Hub Natural Gas Spot Prices, 2008-2017
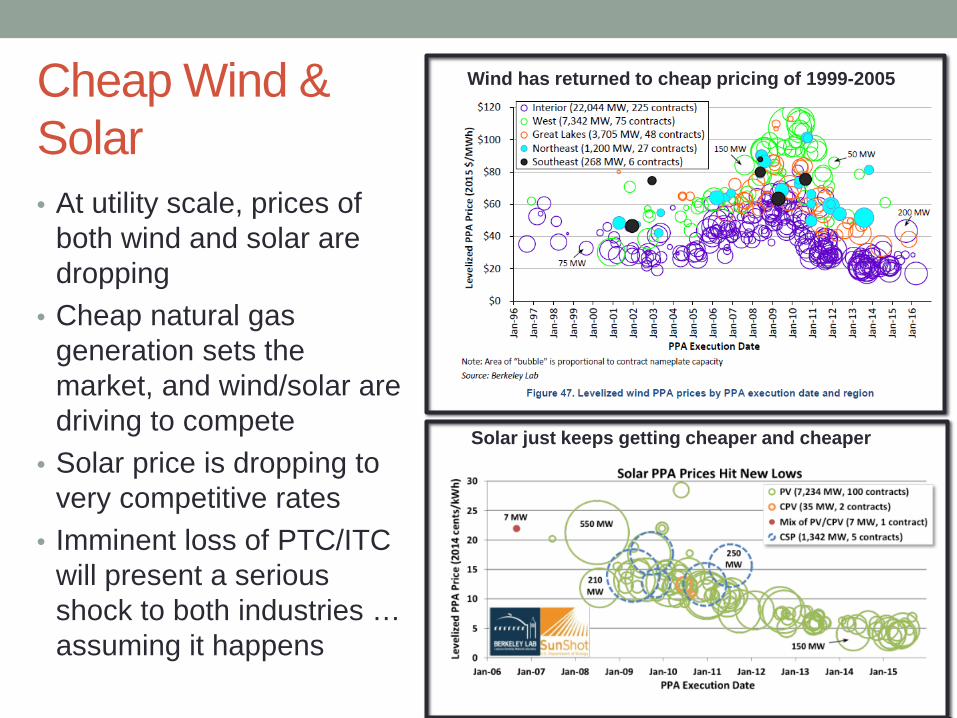
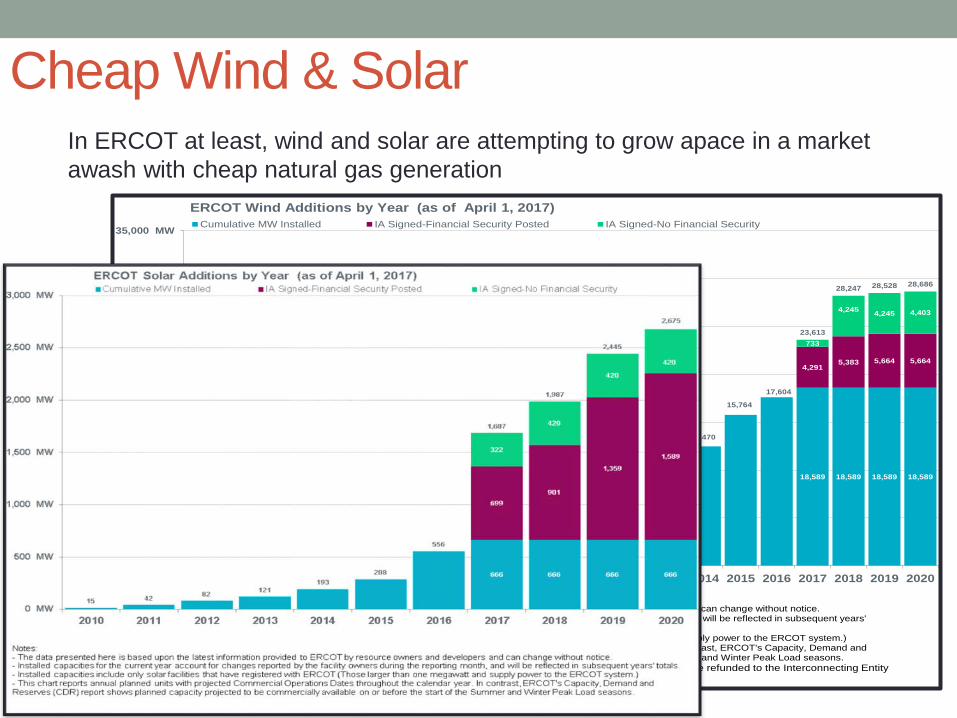
Cheap Wind & Solar• At utility scale, prices of
both wind and solar are dropping
• Cheap natural gas generation sets the market, and wind/solar are driving to compete
• Solar price is dropping to very competitive rates
• Imminent loss of PTC/ITC will present a serious shock to both industries …assuming it happens
Wind has returned to cheap pricing of 1999-2005
Solar just keeps getting cheaper and cheaper
18,589 18,589 18,589 18,589
4,2915,383 5,664 5,664
733
4,245 4,245 4,403
116816 977 1,173 1,385 1,854
2,875
4,785
8,0058,916 9,400 9,604
10,40711,065
12,470
15,764
17,604
23,613
28,247 28,528 28,686
0 MW
5,000 MW
10,000 MW
15,000 MW
20,000 MW
25,000 MW
30,000 MW
35,000 MW
2000 2001 2002 2003 2004 2005 2006 2007 2008 2009 2010 2011 2012 2013 2014 2015 2016 2017 2018 2019 2020
Cumulative MW Installed IA Signed-Financial Security Posted IA Signed-No Financial Security
Notes:- The data presented here is based upon the latest information provided to ERCOT by resource owners and developers and can change without notice.- Installed capacities for the current year account for changes reported by the facility owners during the reporting month, and will be reflected in subsequent years' totals.- Installed capacities include only wind facilities that have registered with ERCOT (Those larger than one megawatt and supply power to the ERCOT system.)- This chart reports annual planned units with projected Commercial Operations Dates throughout the calendar year. In contrast, ERCOT's Capacity, Demand and Reserves (CDR) report shows planned capacity projected to be commercially available on or before the start of the Summer and Winter Peak Load seasons.- Financial security posted for funding interconnection facilities does not include CREZ security deposits, which are refunded to the Interconnecting Entity
ERCOT Wind Additions by Year (as of April 1, 2017)
Cheap Wind & SolarIn ERCOT at least, wind and solar are attempting to grow apace in a market awash with cheap natural gas generation
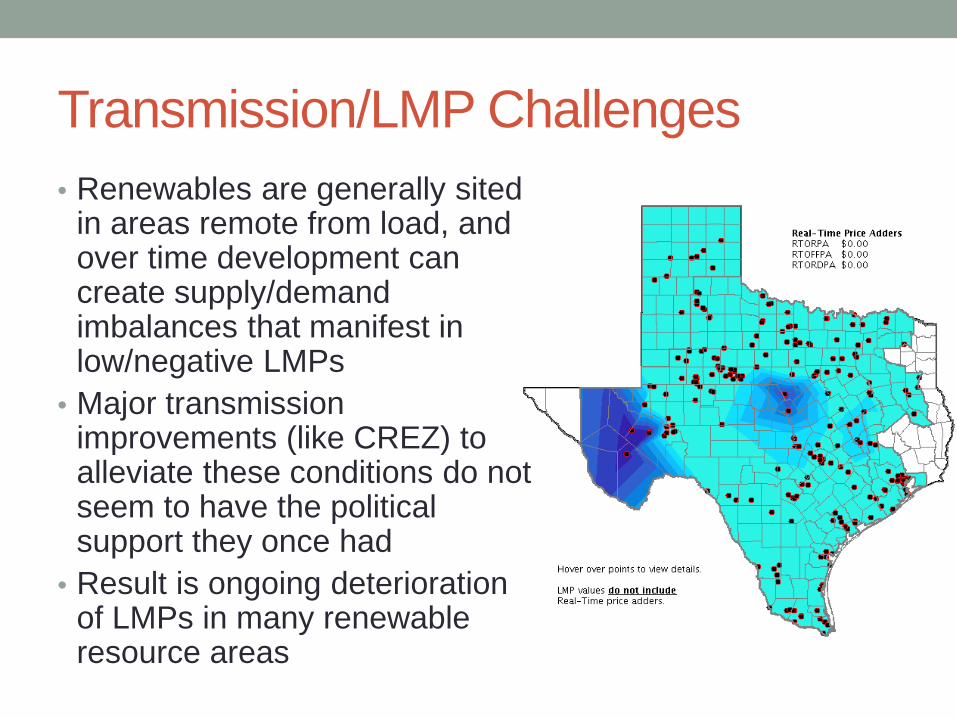
Transmission/LMP Challenges• Renewables are generally sited
in areas remote from load, and over time development can create supply/demand imbalances that manifest in low/negative LMPs
• Major transmission improvements (like CREZ) to alleviate these conditions do not seem to have the political support they once had
• Result is ongoing deterioration of LMPs in many renewable resource areas
Federal Policy Uncertainties• Substantial uncertainties affecting renewable energy
projects since 2016 election• Compounds the challenge of navigating PTC/ITC step-
down• Sources of uncertainty:
• Tax reform - in particular, reduction of corporate tax rate• Trade matters – in particular, solar and steel• Clean Power Plan, and power plant emissions generally• Treasury/IRS guidance• Political climate
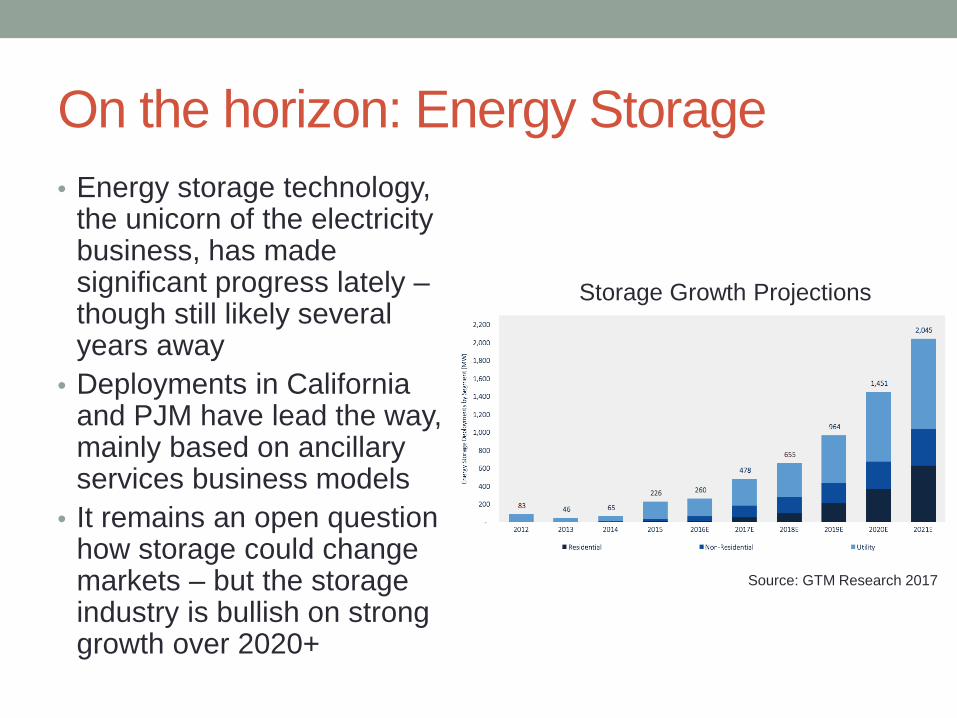
On the horizon: Energy Storage• Energy storage technology,
the unicorn of the electricity business, has made significant progress lately –though still likely several years away
• Deployments in California and PJM have lead the way, mainly based on ancillary services business models
• It remains an open question how storage could change markets – but the storage industry is bullish on strong growth over 2020+
Storage Growth Projections
Source: GTM Research 2017
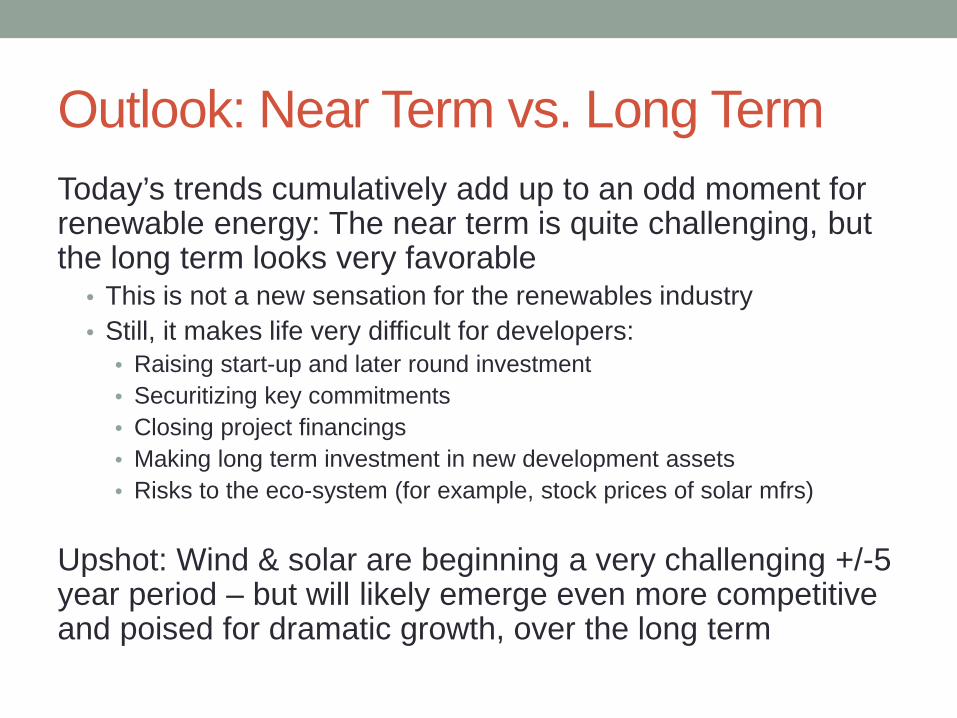
Outlook: Near Term vs. Long TermToday’s trends cumulatively add up to an odd moment for renewable energy: The near term is quite challenging, but the long term looks very favorable
• This is not a new sensation for the renewables industry• Still, it makes life very difficult for developers:
• Raising start-up and later round investment• Securitizing key commitments• Closing project financings• Making long term investment in new development assets• Risks to the eco-system (for example, stock prices of solar mfrs)
Upshot: Wind & solar are beginning a very challenging +/-5 year period – but will likely emerge even more competitive and poised for dramatic growth, over the long term
Long-Term Market Design with Significant
Intermittent Renewables
1
Frank A. WolakDirector, Program on Energy and Sustainable
DevelopmentProfessor, Department of Economics
Stanford UniversityCo-Director of Bits and Watts Initiative on 21st
Century Grid
Example of the Challenge: Renewable Energy Production
in California
2
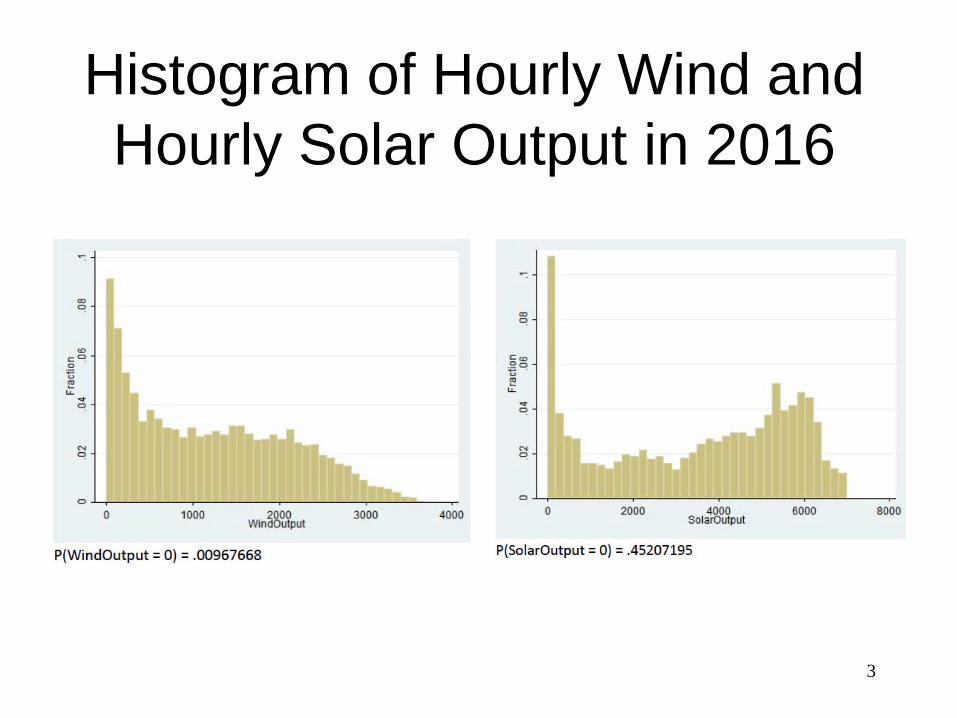
Histogram of Hourly Wind and Hourly Solar Output in 2016
3
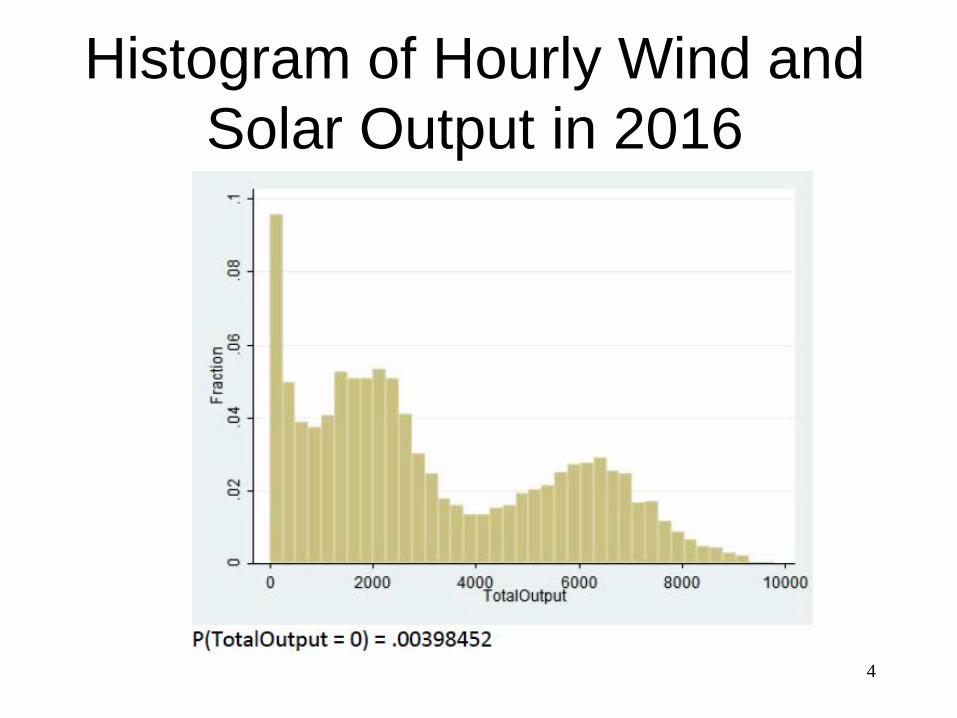
Histogram of Hourly Wind and Solar Output in 2016
4
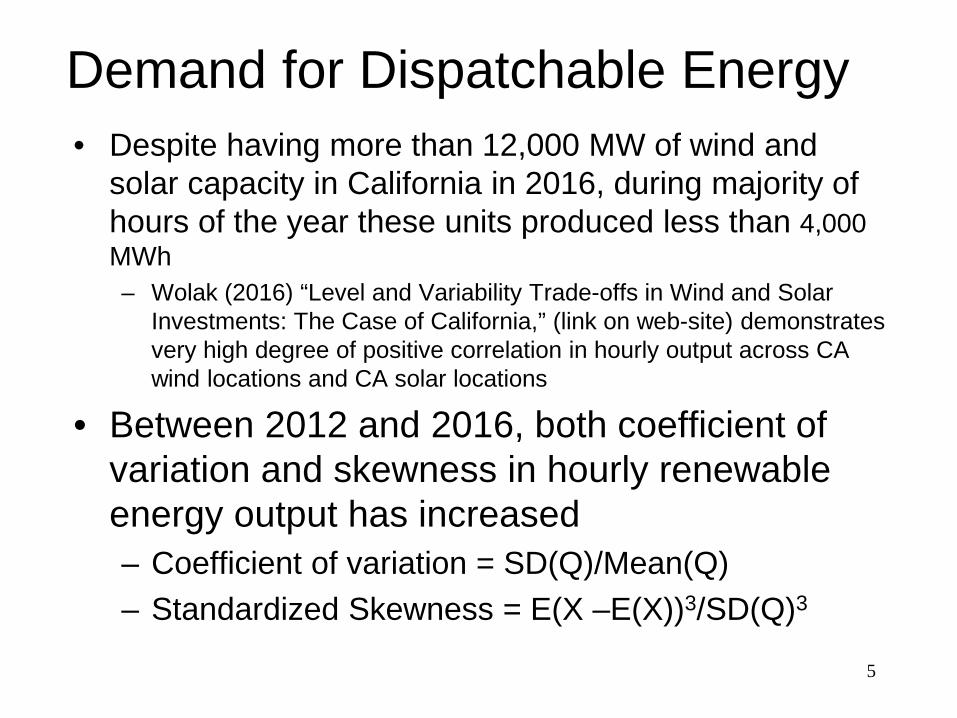
Demand for Dispatchable Energy• Despite having more than 12,000 MW of wind and
solar capacity in California in 2016, during majority of hours of the year these units produced less than 4,000 MWh– Wolak (2016) “Level and Variability Trade-offs in Wind and Solar
Investments: The Case of California,” (link on web-site) demonstrates very high degree of positive correlation in hourly output across CA wind locations and CA solar locations
• Between 2012 and 2016, both coefficient of variation and skewness in hourly renewable energy output has increased– Coefficient of variation = SD(Q)/Mean(Q)– Standardized Skewness = E(X –E(X))3/SD(Q)3
5
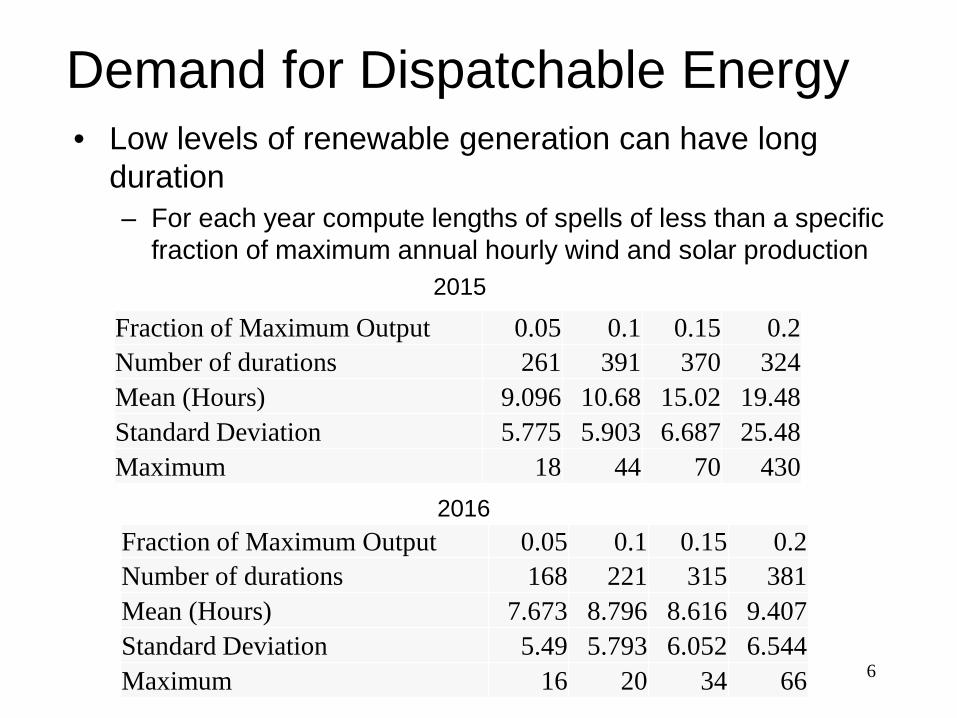
Demand for Dispatchable Energy• Low levels of renewable generation can have long
duration– For each year compute lengths of spells of less than a specific
fraction of maximum annual hourly wind and solar production
6
2015
2016Fraction of Maximum Output 0.05 0.1 0.15 0.2Number of durations 168 221 315 381Mean (Hours) 7.673 8.796 8.616 9.407Standard Deviation 5.49 5.793 6.052 6.544Maximum 16 20 34 66
Fraction of Maximum Output 0.05 0.1 0.15 0.2Number of durations 261 391 370 324Mean (Hours) 9.096 10.68 15.02 19.48Standard Deviation 5.775 5.903 6.687 25.48Maximum 18 44 70 430

Why Focus on Long-Term Wholesale Market Design?
7
Short-Term Market Design in USStandardization of short-term wholesale market design in the US• Multi-settlement, locational marginal pricing
(LMP) market– Day-ahead forward market and real-time imbalance market– Price all relevant operating constraints on transmission network
and generation units in day-ahead and real-time markets• Market design is ideally suited to integrate a
significant amount of intermittent renewables– Can price increasing number of operating constraints that result
from integrating renewables– Market can set prices that reward fast-response generation
units– Market can reward distributed generation and storage for its
locational benefits
8
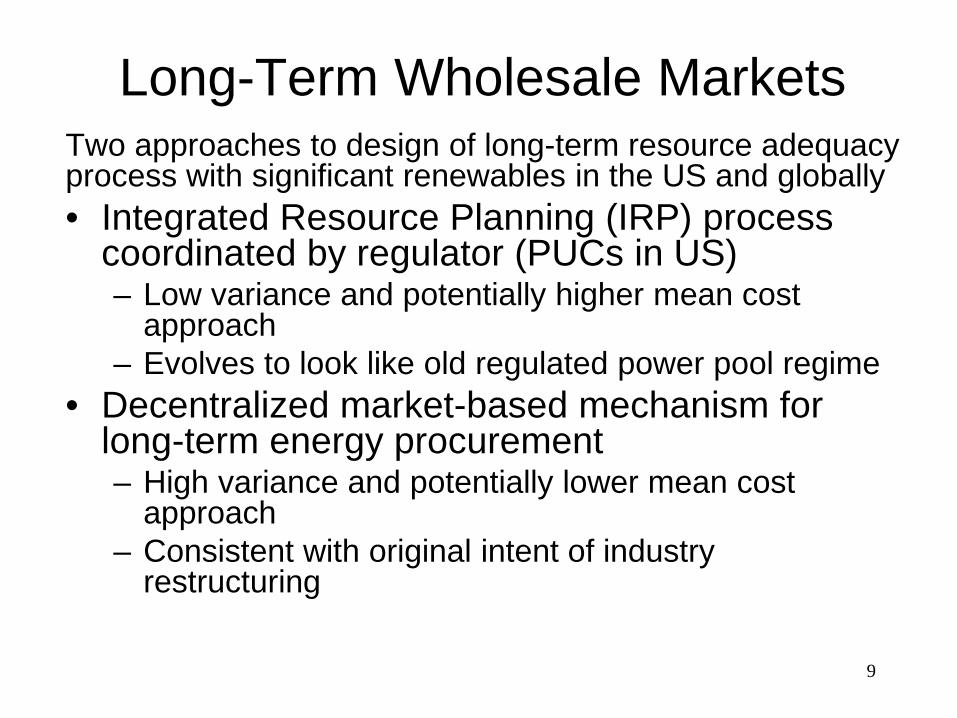
Long-Term Wholesale MarketsTwo approaches to design of long-term resource adequacy process with significant renewables in the US and globally • Integrated Resource Planning (IRP) process
coordinated by regulator (PUCs in US)– Low variance and potentially higher mean cost
approach– Evolves to look like old regulated power pool regime
• Decentralized market-based mechanism for long-term energy procurement– High variance and potentially lower mean cost
approach– Consistent with original intent of industry
restructuring
9
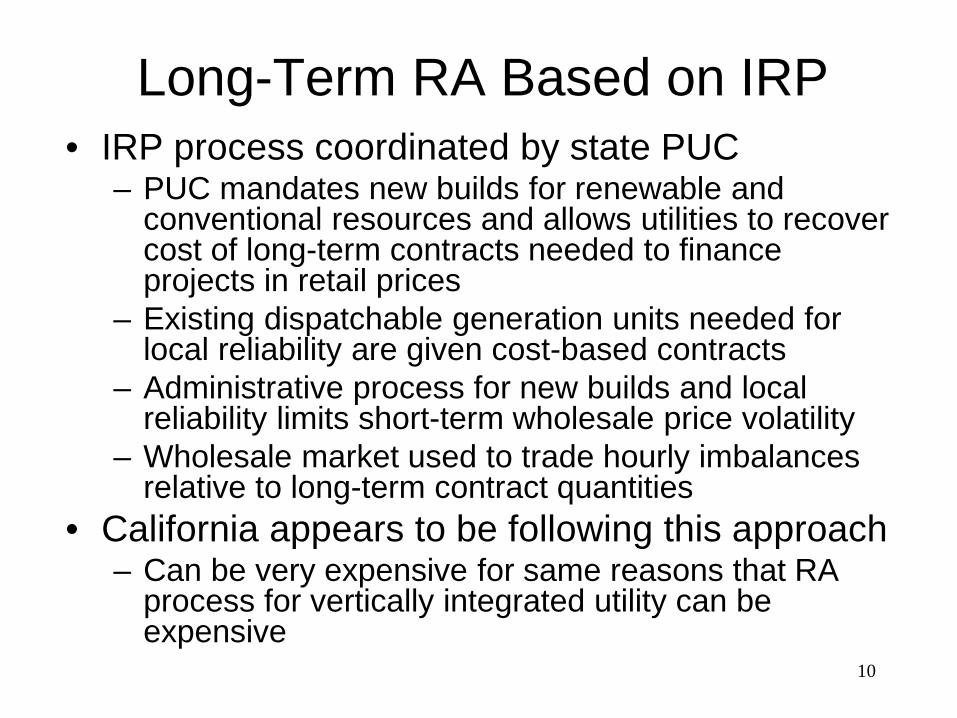
Long-Term RA Based on IRP• IRP process coordinated by state PUC
– PUC mandates new builds for renewable and conventional resources and allows utilities to recover cost of long-term contracts needed to finance projects in retail prices
– Existing dispatchable generation units needed for local reliability are given cost-based contracts
– Administrative process for new builds and local reliability limits short-term wholesale price volatility
– Wholesale market used to trade hourly imbalances relative to long-term contract quantities
• California appears to be following this approach– Can be very expensive for same reasons that RA
process for vertically integrated utility can be expensive
10
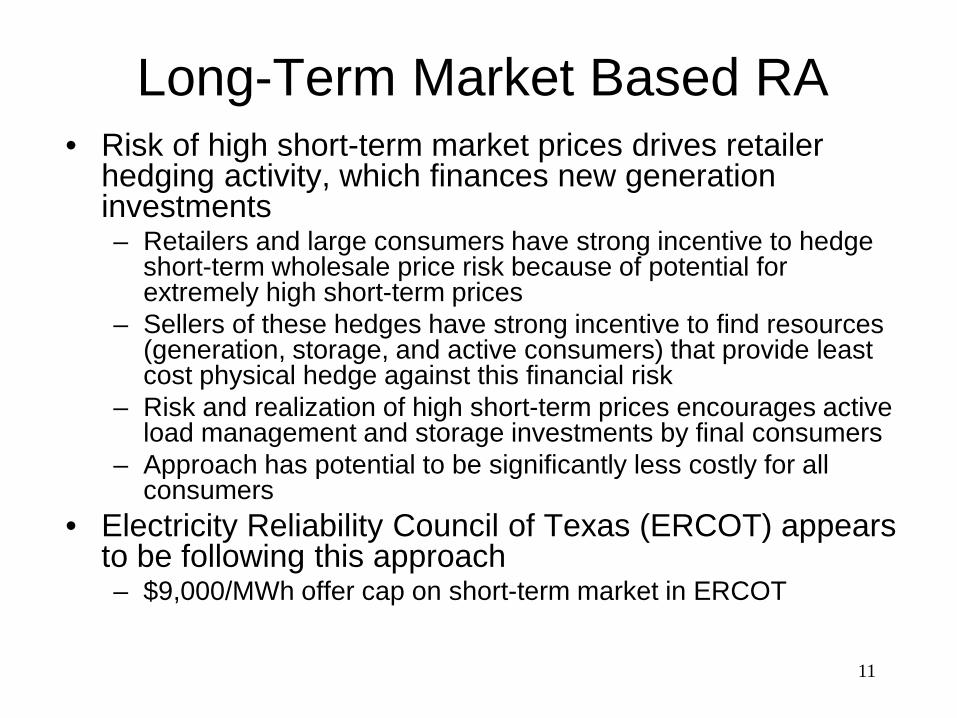
Long-Term Market Based RA• Risk of high short-term market prices drives retailer
hedging activity, which finances new generation investments– Retailers and large consumers have strong incentive to hedge
short-term wholesale price risk because of potential for extremely high short-term prices
– Sellers of these hedges have strong incentive to find resources (generation, storage, and active consumers) that provide least cost physical hedge against this financial risk
– Risk and realization of high short-term prices encourages active load management and storage investments by final consumers
– Approach has potential to be significantly less costly for all consumers
• Electricity Reliability Council of Texas (ERCOT) appears to be following this approach– $9,000/MWh offer cap on short-term market in ERCOT
11
Capacity-Based versus Energy-Based Long-Term Resource
Adequacy
12
Capacity-Based Resource Adequacy• Capacity-based resource adequacy mechanisms likely
to get extremely expensive for consumers in high renewables penetration regions
• Capacity shortfalls very unlikely in regions with significant intermittent renewable generation– ~30 percent wind capacity factor – ~20 percent solar capacity factor
• Extremely difficult, if not impossible, to define “firm” renewable generation capacity– Recent example of South Australia instructive
• “Firm capacity” construct designed for systems based on conventional dispatchable thermal generation capacity– Why should consumers pay for “firm” capacity that is not firm?
13
Capacity-Based Resource Adequacy• Energy shortfalls relative to energy demand much more
likely resource adequacy challenge with high share of intermittent renewables– Resource adequacy process should focus on addressing energy
adequacy challenge• Significant contemporaneous correlation between hourly
output of wind and solar locations in California– Wolak (2016) “Level versus Variability Trade-offs in Wind and
Solar Energy Investments: The Case of California” The Energy Journal
– Makes dealing with energy shortfalls even more challenging• Portfolio of transmission grid and distribution grid level
generation and storage resources and active participation of final consumers likely to be least cost solution to managing energy supply/demand balance
14
Capacity-Based Long-Term RA• Without significant hourly retail price variability, all
management of intermittency must occur on the wholesale supply side of market– Significant amounts thermal generation capacity will be required
to supply energy when renewable resources are not available– Storage investments will take place primarily because of
regulatory mandates• Capacity-based RA process “designs in” less price
volatility, which yields a purely wholesale supply-side approach to resource adequacy that can be very expensive for consumers– Pay total fixed cost of generation capacity that is rarely used– Pay for total cost of renewable generation capacity that is used
when it is available– Pay for storage investments that regulatory process allows
• Determining least-cost mix of resources to serve consumers is extremely challenging task
15
Restructuring and RA Process• Major source of potential benefits from industry re-
structuring is that market mechanisms are extremely good at solving very complex optimization problems– Find least cost mix of resources to meet demand
• If you don’t how much or what mix of resources is needed to serve demand, run a market to find this out– Reserve margins developed in large part because of historical
inability to use dynamic prices to allocate available supply of energy
• For market to find least cost solution, both sides of market must see same price– Both load and supply resources must face same real-time price– Neither side of market needs to receive or pay this price, but
must buy or sell forward contract to avoid this price i
• True price volatility helps manage intermittent renewables at least cost to consumers
16
Concluding Comments
• Long-term wholesale market designs following two trajectories– IRP approach led by state PUCs—CA, NY, IL, MA– Long-term energy market-based approach—TX, NZ, AU, SG
• Capacity-based RA process not well-suited to address reliability challenge faced by regions with significant intermittent renewables– Likely to be become increasingly expensive for consumers
because an increasingly important source of supply finds it difficult to participate
– Optimal reserve margin, amount and mix of capacity largely unknown, particularly for regions with significant renewables
– Run long-term market to find optimal mix of grid-scale and distributed generation and storage and active demand-side participation
17
Concluding Comments
• Market mechanisms have and can find least cost mix of resources to meet demand– Doing so requires facing all market participants,
including final consumers spatially differentiated real-time prices that reflect all relevant operating constraints
– Provides business case for entry of entities that will help consumers and producers manage risk of high and low short-term prices at least cost
– Market allocate costs and risk management to entities able manage costs and risk at least costs
– Differences in costs better market mechanisms and IRP process-based markets can be substantial
• California versus Texas residential electricity prices
18