Embed Size (px)
Citation preview
45J. Kang (ed.), Assessment of the Nuclear Programs of Iran and North Korea, DOI 10.1007/978-94-007-6019-6_3, © Springer Science+Business Media Dordrecht 2013
1 Introduction
On 26 June 2008, the Democratic People’s Republic of Korea (DPRK) submitted to China a declaration of its plutonium-production activities. According to Glenn Kessler of the Washington Post , it declared that it possessed 37 kg of plutonium. 1 According to Global Security Newswire , however, the DPRK declared that it had extracted 30.8 kg of plutonium from spent nuclear fuel using its reprocessing facility and had used 2 kg of that amount in its October 2006 nuclear test. 2 In addition to the controversy over the amount of separated plutonium, the DPRK has unseparated plutonium in the 8,000 spent fuel rods in the cooling pond at Yongbyon before April 2009.
GIRM can be used to estimate the total plutonium production in a graphite-moderated reactor without detailed information on the reactor’s operating history. The basic idea of GIRM is that the transmutation of trace impurities in the graphite is directly related to the cumulative plutonium production in the nuclear fuel (Gesh 2004 ) .
Using the Graphite Isotope Ratio Method to Verify the DPRK’s Plutonium-Production Declaration
Jungmin Kang
J. Kang (*) Lee Byong Whi Nuclear Energy Policy Center , Korea Advanced Institute of Science and Technology , 291 Daehak-ro , Yuseong-gu 291, Daejeon, 305-701 , Korea, Republic of (South Korea) e-mail: [email protected]
This was previously published at Science & Global Security: Jungmin Kang, “Using Graphite Isotope Ratio Method to Verify DPRK’s Declaration of Plutonium Production,” Science & Global Security , 19:121–129, 2011.
1 Glenn Kessler, “Message to U.S. Preceded Nuclear Declaration by North Korea,” The Washington Post , 2 July 2008, A7. The DPRK’s declaration did not include information on its nuclear-weapon and uranium enrichment activities. 2 Nuclear Threat Initiative (NTI), “North Korea Declares 31 kg of Plutonium,” Global Security Newswire , 24 October 2008; According to Selig S. Harrison who visited Pyongyang in early January 2009, the DPRK said that it has weaponized almost 31 kg of plutonium. Choe Sang-Hun, “North Korea Says It Has ‘Weaponized’ Plutonium,” New York Times , 18 January 2009, A8.

46 J. Kang
This study explains how the total amount of plutonium produced in the 5-megawatt electric (MWe) graphite reactor at Yongbyon (hereafter the 5 MWe reactor) could be estimated using the GIRM technique.
2 Graphite Isotope Ratio Method
GIRM was originally proposed by Steve Fetter. In his 1993 Science & Global Security paper, Fetter pointed out that:
A small fraction of the neutrons produced by fi ssion will be absorbed in the moderator and permanent structural components of the reactor core, usually producing radioactive nuclei. If these radioactive nuclei have long half-lives (much longer than the lifetime of the reactor), very little radioactive decay will occur, and the concentration of these nuclei will be proportional to the total number of neutrons passing through the material (the neutron “ fl uence”). Thus, long-lived radionuclides produced by neutron absorption in naturally occurring nuclei in the permanent components of the reactor core provide an estimate of the neutron fl uence at that point. When coupled with reasonable assumptions about the design and operation of the reactor, measurements of neutron-induced radionu-clides at several points in the core can be used to estimate neutron fl uences and plutonium production (Fetter 1993 ) .
The Paci fi c Northwest National Laboratory (PNNL) developed the GIRM concept into a practical plutonium production veri fi cation tool for graphite-moderated reactors in the early 1990s (Wood et al. 2002 ; Reid et al. 1999 ) . When tested on the Hanford plutonium-production reactors, it was found that GIRM does indeed provide an accu-rate estimate of lifetime plutonium production of a graphite moderated reactor.
The fi rst step in GIRM is to identify suitable indicator elements that exist in graphite in suf fi cient concentrations to be accurately measured. According to a PNNL report, the B 10 /B 11 ratio is an excellent indicator element for low- fl uence reactors, while Ti 48 /Ti 49 has been successfully used for high- fl uence reactors. 3 This study focuses on the B 10 /B 11 ratio. Boron-10 and boron-11 are both stable isotopes, constituting 19.9 and 80.1% of natural boron respectively.
The second step of GIRM is sampling a reactor’s irradiated graphite and measuring the post-irradiation radio of the targeted isotopes. 4 To maximize the accuracy of the total plutonium production estimate, the number of samples and their locations must be optimized. Until graphite samples are available from the 5 MWe reactor, calculated B 10 /B 11 ratios of graphite samples must be used to demonstrate the method.
The third step of the GIRM is to estimate from the isotope ratios cumulative plutonium production values in the fuel at locations near where the graphite samples
3 C. J. Gesh, op. cit . 4 Graphite samples of about 1-cm in diameter and 2-cm in length can be extracted from any loca-tion in the core by commercially available automated graphite reactor sampling machines. For the measurement of key isotopic ratios in the samples, mass-spectrometry measurement techniques are used. Secondary ionization mass spectrometry is used to analyze boron isotopic ratios, while thermal ionization mass spectrometry is used to analyze titanium, uranium and plutonium ratios. C. J. Gesh, op. cit .

47Using the Graphite Isotope Ratio Method to Verify…
were taken. This study uses MCNPX® Monte Carlo radiation transport depletion computer code to make this correlation. 5
The fi nal step is to estimate cumulative plutonium production for the entire core using a regression technique, based on the estimated cumulative plutonium production values near the sample locations. The regression technique produces a three dimensional map that closely fi ts the local cumulative plutonium production values. This study uses Wolfram Mathematica 7® as the regression tool. 6
3 The 5 MWe Reactor
3.1 Core Characteristics
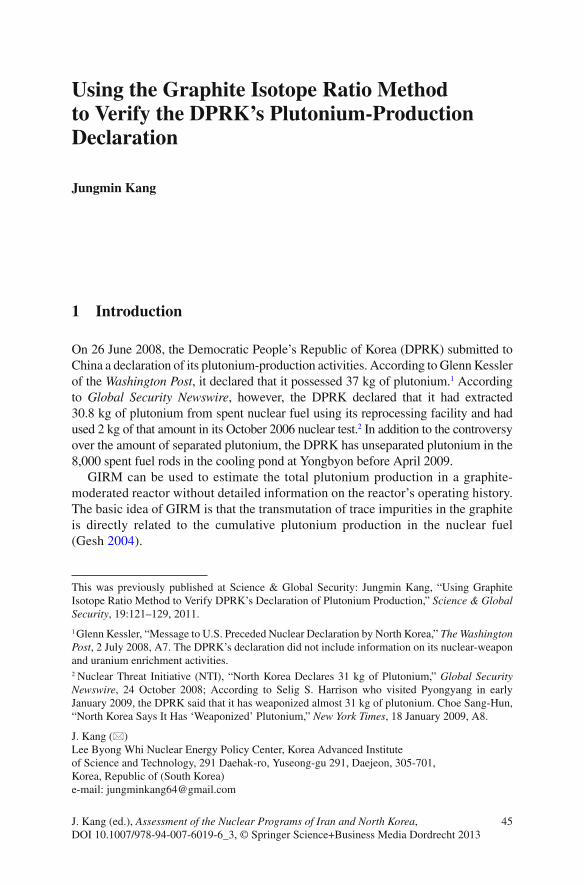
The 5 MWe reactor is a graphite-moderated reactor fueled by natural-uranium metal clad in Magnox magnesium alloy. 7 The fuel rods are placed in channels in the graphite moderator, and are cooled by CO
2 gas fl owing through the channels. Table 1 shows
the characteristics of the 5 MWe reactor. A horizontal cross-section of the reactor is shown in Fig. 1 . 8
Table 1 Estimated physical characteristics of the 5 MWe reactor
Thermal power 25 MWth Effective core radius 643 cm Electric power 5 MWe Effective core height 592 cm Speci fi c power 0.50 MWth/tHM Upper re fl ector 77.50 cm Uranium loaded 50 t Bottom re fl ector 66.50 cm Graphite-moderator 300 t Fuel composition U(0.5% Al) Graphite-re fl ector 300 t Diameter of fuel meat 2.90 cm Number of channels 812–877 Length of fuel meat 52 cm Number of fuel channels 801 Length of fuel rod 60 cm Number of control rod channels 44 Uranium per fuel rod 6.24 kg Number of fuel rods
per channel 10 Clad composition Mg(1% Al)
Distance between channels 20 cm Clad thickness 0.05 cm Radius of channel 6.50 cm
David Albright and Kevin O’Neill, eds., op. cit., 161. B. D. Murphy, “ORIGEN-ARP Cross-Section Libraries for Magnox, Advanced Gas-Cooled, and VVER Reactor Designs,” Oak Ridge National Laboratory, ORNL/TM-2003/263 ( 2004 ), 4. Personal communication with KAERI, (November 2008)
5 MCNPX® (MCNP eXtended) is a Monte Carlo radiation transport computer code that transports nearly all particles at nearly all energies and performs depletion calculations of nuclear fuels. John S. Hendricks et al., “MCNPX® 2.6.0 Extensions,” Los Alamos National Laboratory, LA-UR-08-2216 (April 2008). 6 Wolfram Mathematica 7® < http://www.wolfram.com/products/mathematica/index.html >. 7 The 50 MWe British Calder Hall reactor is believed to have been the model of the 5 MWe reactor (David and O’Neill 2000 ) . 8 Personal communication with the Korean Atomic Energy Research Institute (KAERI), November 2008.
48 J. Kang
3.2 Operating History
The 5 MWe reactor operated from 1985 until April 1994 and from February 2003 to July 2007. 9
The reactor was shut down in 1994, in accordance with the U.S.-DPRK Agreed Framework until, the Framework’s breakdown in December 2002. The DPRK resumed operation of the reactor in February 2003 and then shut it down again in mid-July 2007 to disable it in accordance with the 13 February 2007 Agreement of the Six-Party Talks. The reactor was stopped between April and June 2005 for discharge of fuel for reprocessing. 10 On 14 April 2009, after U.N. Security Council condemned the DPRK’s April 5 test of a long-range ballistic missile, the DPRK announced that it would restore the 5 MWe reactor to operation. 11 However, as of Spring 2011, it had not done so.
9 David Albright and Kevin O’Neill, eds., op. cit ., 119. 10 For additional information on the Yongbyon Nuclear Scienti fi c Research Center see for example, http://en.wikipedia.org/wiki/Yongbyon_Nuclear_Scienti fi c_Research_Center . 11 The DPRK announced that it would restore the nuclear fuel fabrication facility and the reprocessing facility. “Timeline of North Korea’s Nuclear, Missile Programs,” Fox News , 25 April 2009 http://www.foxnews.com/story/0,2933,517880,00.html .
Fig. 1 Cross-section of the 5 MWe reactor (Source: KAERI)

49Using the Graphite Isotope Ratio Method to Verify…
The average burnup of the irradiated fuel in the 5 MWe reactor in 1994 is estimated to have been about 600–700 MWd/tHM. 12 If the fuel had not been dis-charged and reprocessed, even after an additional 4 years of full power operation of the reactor between February 2003 and July 2007, its average burnup would still have been only about 1,100 MWd/tHM, assuming a capacity factor of 70%. 13 That burnup is assumed in following calculations.
4 Simulating Boron Isotopic Ratios
Since the core is symmetric, it would be necessary to take samples in one angular sector. We assume that graphite samples would be taken at 200 locations of a 1/4 core as shown in Fig. 2 . Simulated B 10 /B 11 ratios of graphite samples just outside the aluminum channel liners are given in Table 2 . 14
12 David Albright and Kevin O’Neill, eds., op. cit ., 118. 13 The accumulated core average burnups of the 5-MWe reactor between February 2003 and April 2005 and between June 2005 and mid-July 2007 are about 220 MWd/tHM and 210 MWd/tHM, respectively, assuming 20 MW thermal power and a capacity factor of 70%. 14 Based on the 1/4 core model of the 5 MWe reactor containing spent fuel with average burnup of 1,100 MWd/tHM, the simulated B 10 /B 11 ratios of graphite samples were calculated by an expert at KAERI using a three dimensional Monte Carlo burnup code, developed by Seoul National University and KAERI. The calculations assume all control rods are out from their channels. Personal communication from KAERI, June 2009.
Fig. 2 1/4 core layout of the 5 MWe reactor and sampling locations (Source: KAERI)

50 J. Kang
5 Local Cumulative Plutonium Production Estimates
Based on the physical characteristics shown in Table 1 , the cross-section of a three dimensional cell-model of the fuel, channel liner and graphite surrounding a fuel channel is given in Fig. 3 . Neutron re fl ecting boundary conditions are assumed. This is equivalent to approximating the core as in fi nite.
Using the geometry of the pin-cell model and the material speci fi cations in Table 1 , the calculated B 10 /B 11 ratio as a function of cumulative plutonium production per cm 3 of fuel are given in Fig. 4 .
Table 2 Simulated B 10 /B 11 ratios of graphite samples at A1 location of Fig. 2
Layer from bottom of graphite moderator B 10 /B 11 (×1,000)
Layer 1 (0–60 cm) 50.7 Layer 2 (60–120 cm) 19.2 Layer 3 (120–180 cm) 8.32 Layer 4 (180–240 cm) 4.50 Layer 5 (240–300 cm) 3.28 Layer 6 (300–360 cm) 3.29 Layer 7 (360–420 cm) 4.43 Layer 8 (420–480 cm) 8.07 Layer 9 (480–540 cm) 18.7 Layer 10 (540–600 cm) 48.6
Fig. 3 Three-dimensional pin-cell model of a fuel rod of the 5-MWe reactor (with re fl ecting boundary conditions)

51Using the Graphite Isotope Ratio Method to Verify…
Using the MCNPX® code results given in Fig. 4 , the simulated B 10 /B 11 ratios of graphite samples, that are assumed to be taken for analysis at 200 locations in the 1/4 core of the 5 MWe reactor, are correlated to the local cumulative plutonium production of fuel rods located adjacent to the sample locations. 15
6 Estimate of the Total Cumulative Plutonium Production
The local cumulative plutonium production values are used to fi x the parameters of a fi tting function that depends upon the vertical and radial position in the core to estimate total cumulative plutonium production throughout the core of the 5 MWe reactor. The regression technique is calculated with Mathematica 7®. 16
The resulting estimate based on the pin-model-derived correlation in Fig. 4 is 42.84 kg, which differs by 1.1% from an estimate of 42.39 kg obtained by the
15 To calculate the expected cumulative plutonium production (g/cm 3 ) for any given B 10 /B 11 value, I give the following equation to fi t the curve in Fig. 4 using Wolfram Mathematica®: Pu (mg/cm 3 ) = −13.2 − 23.3x − 1.87x 2 , where x = log(B 10 /B 11 ). 16 Wolfram Mathematica 7®. Functional form of the fi tting function in this study is F(x, y, z) = 0.0307848 − 1.74155 × 10 −7 x 2 − 1.75037 × 10 −7 y 2 – 5.13598 × 10 −7 z – 1.83897 × 10 −7 z 2 .
Cumulative Pu (grams/cm3)
0.00 0.01 0.02 0.03 0.04 0.05
B10
/B11
Rat
io
0.0001
0.001
0.01
0.1
Fig. 4 B 10 /B 11 ratio as a function of cumulative plutonium production (g/cm 3 ) on the three dimen-sional pin-cell model of a fuel rod of the 5-MWe reactor

52 J. Kang
same independent 1/4-core model depletion burnup calculation that produced the simulated boron isotopic ratios for an average fuel burnup of 1,100 MWd/tHM. 17
7 Conclusions
Using GIRM, the cumulative plutonium production of the 5 MWe graphite reactor of the DPRK can be accurately estimated without operational history, once a number of strategically located graphite samples are available.
Acknowledgments Jungmin Kang would like to thank Alexander Glaser and Zia Mian at Princeton University for their very useful comments.
References
Albright D, O’Neill K (eds) (2000) Solving the North Korean nuclear puzzle. The Institute for Science and International Security, Washington, DC, p 146
Fetter S (1993) Nuclear archaeology: verifying declarations of fi ssile-material production. Sci Global Secur 3:237–259
Gesh CJ (2004) A graphite isotope ratio method primer – a method for estimating plutonium production in graphite moderated reactors. PNNL-14568, Paci fi c Northwest National Laboratory, Richland, Feb 2004
Murphy BD (2004) ORIGEN-ARP cross-section libraries for magnox, Advanced Gas-Cooled, and VVER Reactor Designs. Oak Ridge National Laboratory, ORNL/TM-2003/263
Reid BD et al. (1999) Graphite isotope ratio method development report: irradiation test demon-stration of uranium as a low fl uence indicator. PNNL-13056, Paci fi c Northwest National Laboratory, Richland, Sept 1999
Wood TW, Milazzo MD, Reichmuth BA, Bedell J (2002) Establishing con fi dent accounting for Russian weapons plutonium. Nonproliferation Rev 2002:126–137
17 Personal communication with KAERI, June 2009.