Embed Size (px)
Citation preview
Motiee, H., A. Motiei, A. Hejranfar and M.R. Delavar. 2006. "Assessment of Unaccounted-for Water in Municipal Water Networks Using GIS and Modeling." Journal of Water Management Modeling R225-24. doi: 10.14796/JWMM.R225-24.© CHI 2006 www.chijournal.org ISSN: 2292-6062 (Formerly in Intelligent Modeling of Urban Water Systems. ISBN: 0-9736716-2-9)
547
24 Assessment of Unaccounted-for Water
in Municipal Water Networks Using GIS and Modeling
Homayoun Motiee, Ali Motiei, Ahmad Hejranfar and M.Reza Delavar
This chapter presents a study to calculate “Unaccounted-for Water” (UFW) due to high pressure in water networks. Unaccounted-for Water (UFW) including the physical and non-physical loss of water in the network is one of the parameters that managers should consider when considering the crisis of water supply in cities and the need to improve network efficiency.
Increasing the number of consumers at the same time as increasing limitations of water resources requires network optimization management. Steps to increase network efficiency with GIS and modeling include several tasks. First, all of network data including spatial and attributed information was stored in a GIS system. Then using a specific extension tool (such as Hydrogen), this data was imported into the EPANET program. After hydraulic calculations to identify high-pressure zones in the network, a layer in the GIS was created to represent these zones.
To verify the general results of the model, we used information that was collected during real incidents in the network.
548 Unaccounted-for Water using GIS and modeling
24.1 Introduction
One of the biggest problems of distribution network management is the variation and lack of accurate and updated data. Unaccounted-for-Water (UFW), including physical (leakage) and non-physical loss of water in the network, is one of the subjects that managers should consider in order to increase network efficiency.
It is important to distinguish between total water loss (UFW) and leakage. Leakage is one of the components of total water lost in a network, and comprises physical losses from pipes, joints and fittings, and also from overflowing surface reservoirs. Other components of total water loss are non-physical losses, e.g. meter under-registration, illegal connections, and illegal or unknown uses [WHO, 2001].
Based on water use and network statistics collected for some developing countries the percentage of Unaccounted-for Water was found to be several times higher typical, compared to world standards, due to old network elements. Zoning of the water network is an effective method to inspect and control UFW. Also, modeling the pressure distribution in the network and identifying the location and amounts of lost water are important subjects in the study of UFW.
The result of recent studies in different locations of the world shows a high rate of UFW in distribution networks. The percentage of UFW in comparison to the total amount of input water is about 9% in Germany and up to 43% in Malaysia. In most countries, percentage of UFW is about 20% - 30%, and the ratio of non-physical loss to physical loss is about 40%-60% (Rizzo, 1999). In Iran, based on a few case studies, UFW percentage is about 35%. The scarcity of water resources in addition to expensive water treatment costs increases the importance of UFW (Tabesh et al., 2001)
Analysis of UFW can be done in different ways and for several objectives, including loss control, primary estimates of loss, long-term development plans, and identifying effective parameters in UFW.
Increases in the number of consumers at the same time as increasing scarcity in water resources, requires network optimization management. This requires using recent technology to optimize distribution water networks (Feinberg et al., 1997). Geographic Information (GIS) Systems are a powerful tool for managers needing to make important decisions in their networks because of the large volume of data that must be considered (Arnoff, 1999).

Unaccounted-for Water using GIS and modeling 549
Water and Wastewater management organizations in Tehran city (2000), have started to use GIS system to optimize their data for their distribution networks during last few years. A pilot site in Ghazvin City has been chosen to carry out this research. The characteristics of the pilot site are:
Number of Pipes: 138 Number of Nodes: 130 Number of Reservoirs: 2 Number of Valves: 20 Number of Tanks and Pumps: 0 Number of consumers: 1787
Results of this study will be used to estimate the magnitude of UFW and to optimize the water network in the whole of greater Ghazvin city where is near Tehran.
This pilot site was studied during 28 days with installation of discharge and pressure measurement instruments at the input and output points. It was possible to determine UFW by considering the difference between values of input amounts of water and values of consumer’s usages.
Since it is so expensive to use real measurements in a big municipal water network, it is more practical and economical to utilize modeling, such as provided by specialized program like EPANET. In this research we used a method presented by Germanopoulos (1985) to calculate UFW using EPANET in conjunction with a GIS system. We first used real data in the pilot area and then compared the results of UFW obtained by simulation with those obtained by measurements.
24.2 Background of the Method
Loss of water may occur in any location on the network including pipes and nodes. To simplify modeling of locations and amounts of loss in each pipe, nodes were removed and replaced by an equivalent length of pipe (Germanopoulos, 1985). In the EPANET program, each node on the network is assigned a known value of loss (Rosman, 2000). In fact, in EPANET, in order to simulate the suspected pipe with a leakage, an orifice will be defined for its node. This is the important key of this method.
Germanopoulos (1985) has presented a relationship between pressure and loss in a distribution water network. Assuming a uniform distribution of loss across the pipelines, this relationship is defined as follow:
550 Unaccounted-for Water using GIS and modeling
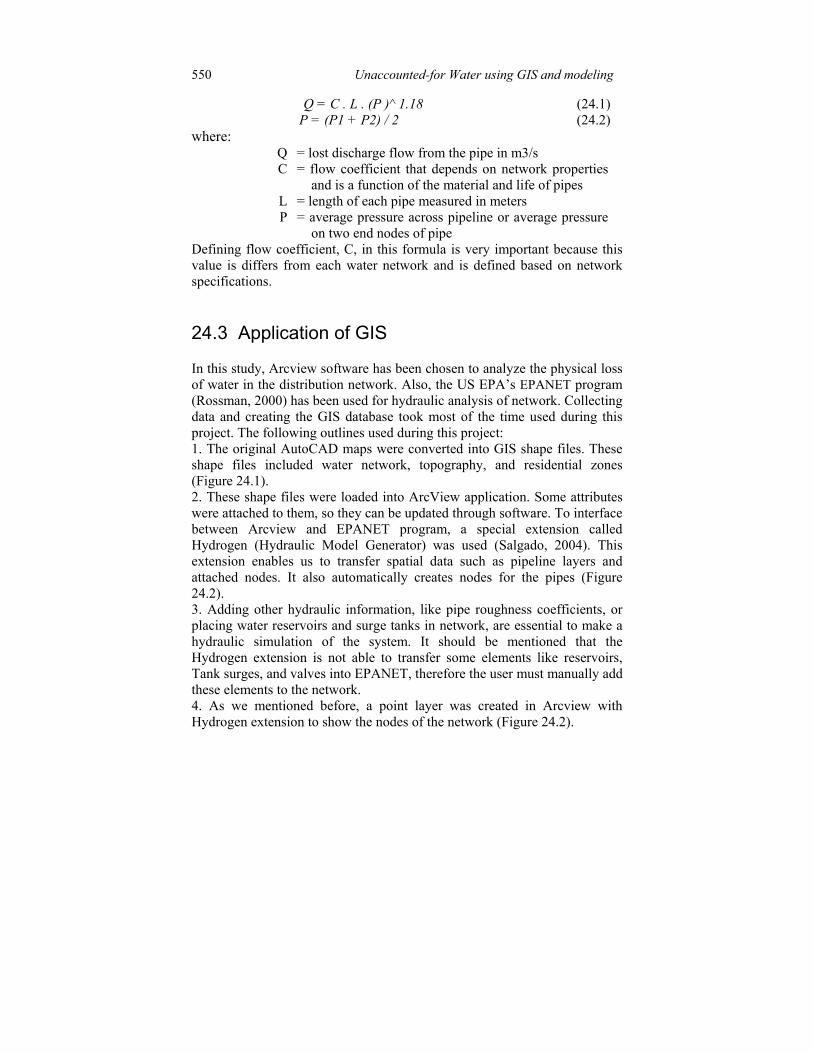
Q = C . L . (P )^ 1.18 (24.1) P = (P1 + P2) / 2 (24.2)
where: Q = lost discharge flow from the pipe in m3/s C = flow coefficient that depends on network properties
and is a function of the material and life of pipes L = length of each pipe measured in meters P = average pressure across pipeline or average pressure
on two end nodes of pipe Defining flow coefficient, C, in this formula is very important because this value is differs from each water network and is defined based on network specifications.
24.3 Application of GIS
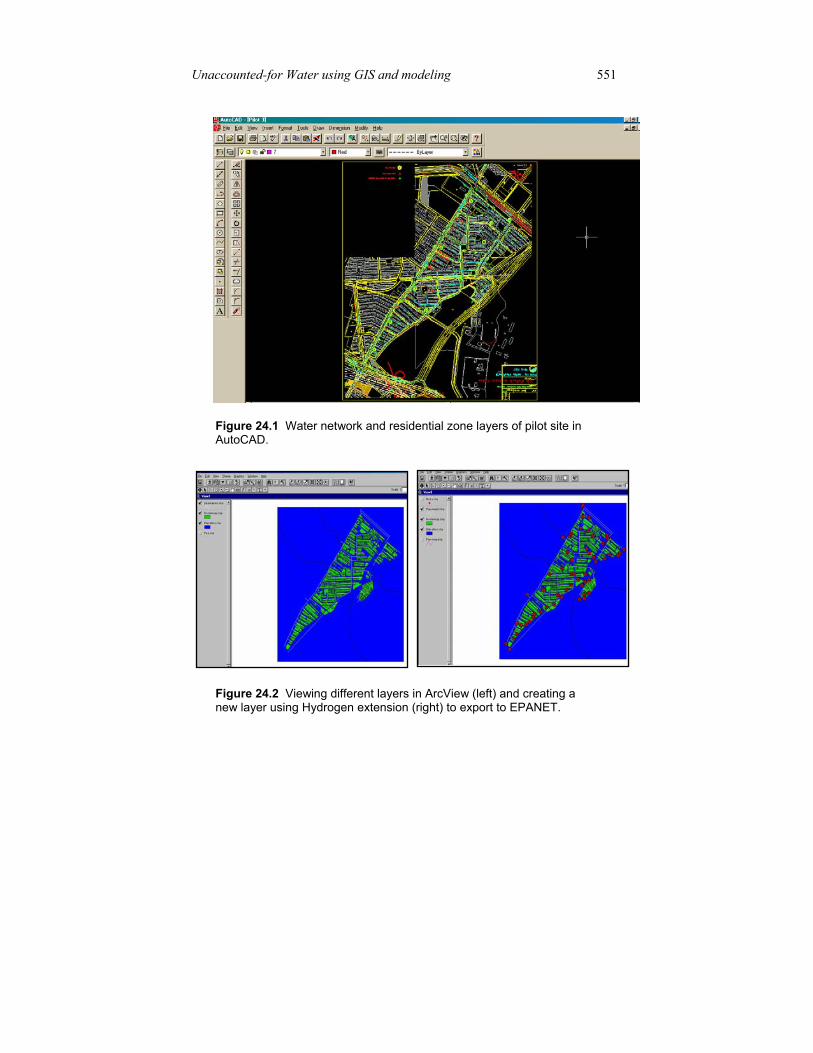
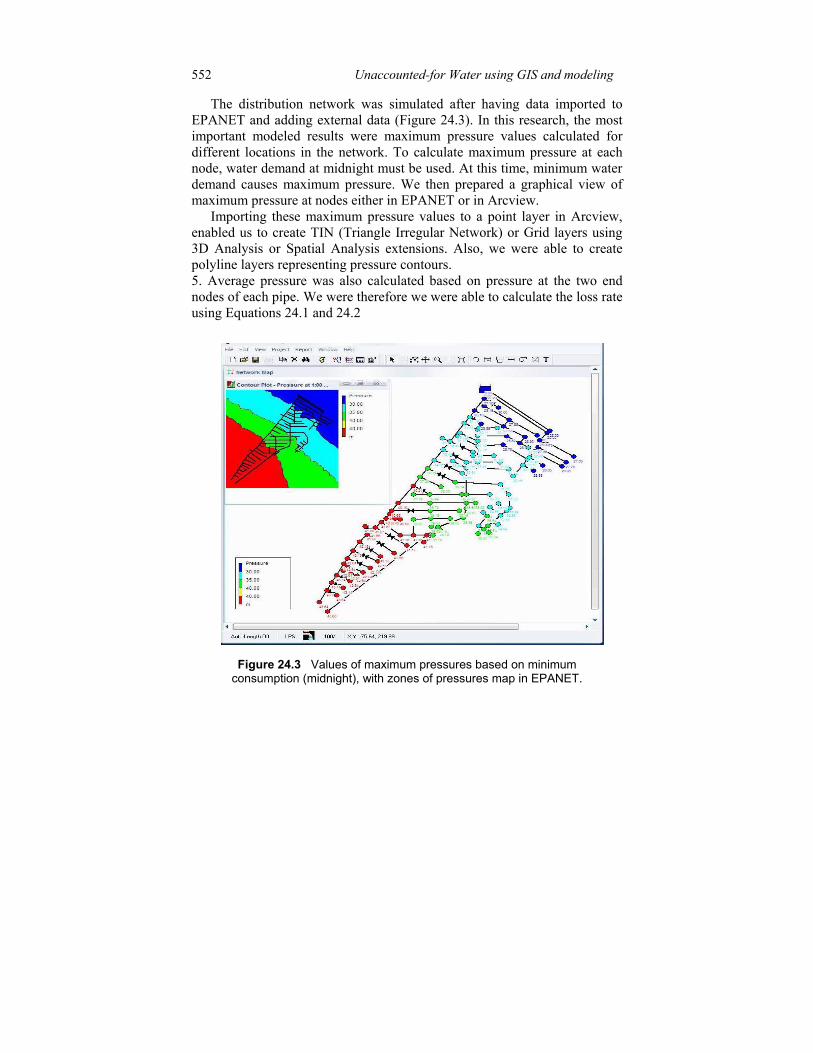
In this study, Arcview software has been chosen to analyze the physical loss of water in the distribution network. Also, the US EPA’s EPANET program (Rossman, 2000) has been used for hydraulic analysis of network. Collecting data and creating the GIS database took most of the time used during this project. The following outlines used during this project: 1. The original AutoCAD maps were converted into GIS shape files. Theseshape files included water network, topography, and residential zones (Figure 24.1). 2. These shape files were loaded into ArcView application. Some attributeswere attached to them, so they can be updated through software. To interface between Arcview and EPANET program, a special extension called Hydrogen (Hydraulic Model Generator) was used (Salgado, 2004). This extension enables us to transfer spatial data such as pipeline layers and attached nodes. It also automatically creates nodes for the pipes (Figure 24.2). 3. Adding other hydraulic information, like pipe roughness coefficients, orplacing water reservoirs and surge tanks in network, are essential to make a hydraulic simulation of the system. It should be mentioned that the Hydrogen extension is not able to transfer some elements like reservoirs, Tank surges, and valves into EPANET, therefore the user must manually add these elements to the network. 4. As we mentioned before, a point layer was created in Arcview withHydrogen extension to show the nodes of the network (Figure 24.2).
Unaccounted-for Water using GIS and modeling 551
Figure 24.1 Water network and residential zone layers of pilot site in AutoCAD.
Figure 24.2 Viewing different layers in ArcView (left) and creating a new layer using Hydrogen extension (right) to export to EPANET.
552 Unaccounted-for Water using GIS and modeling
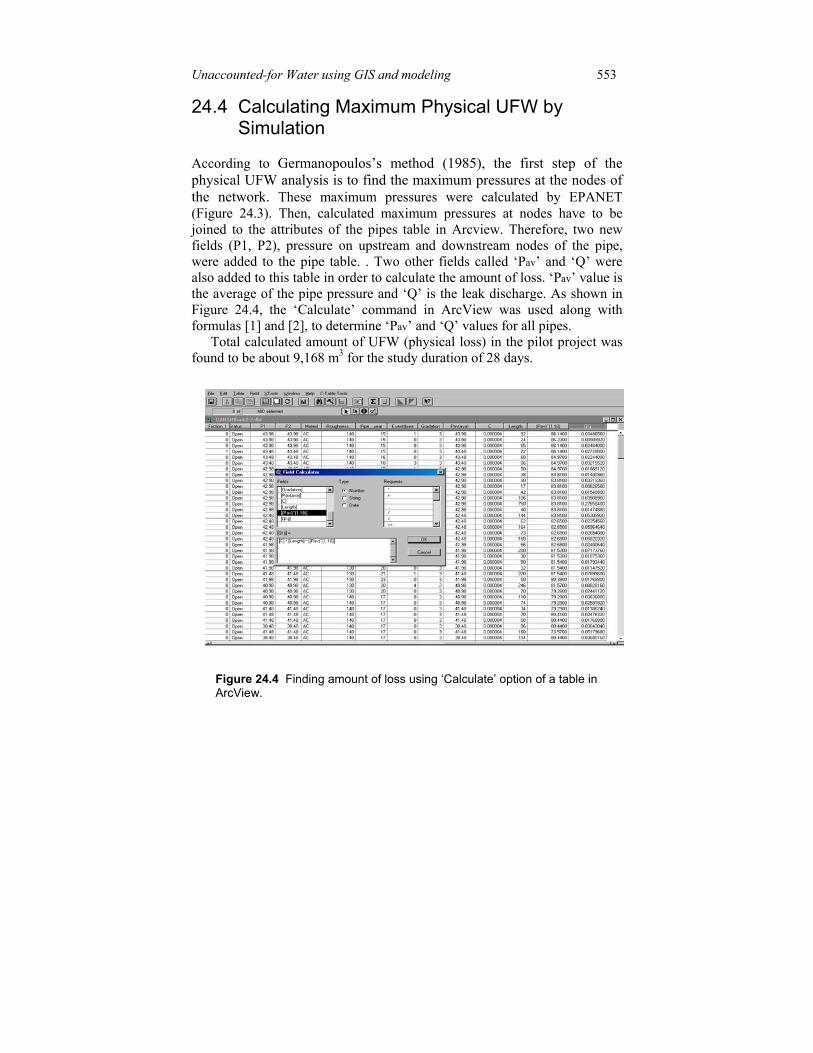
The distribution network was simulated after having data imported to EPANET and adding external data (Figure 24.3). In this research, the most important modeled results were maximum pressure values calculated for different locations in the network. To calculate maximum pressure at each node, water demand at midnight must be used. At this time, minimum water demand causes maximum pressure. We then prepared a graphical view of maximum pressure at nodes either in EPANET or in Arcview.
Importing these maximum pressure values to a point layer in Arcview, enabled us to create TIN (Triangle Irregular Network) or Grid layers using 3D Analysis or Spatial Analysis extensions. Also, we were able to create polyline layers representing pressure contours. 5. Average pressure was also calculated based on pressure at the two endnodes of each pipe. We were therefore we were able to calculate the loss rate using Equations 24.1 and 24.2
Figure 24.3 Values of maximum pressures based on minimum consumption (midnight), with zones of pressures map in EPANET.
Unaccounted-for Water using GIS and modeling 553
24.4 Calculating Maximum Physical UFW by Simulation
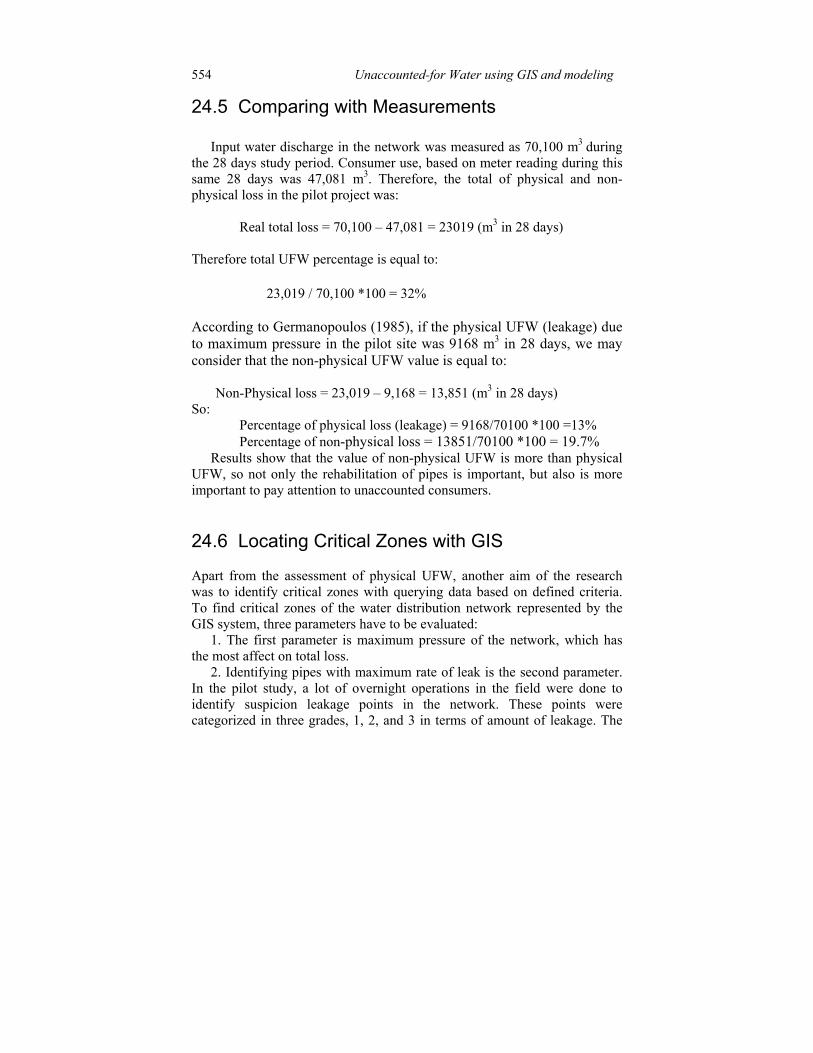
According to Germanopoulos’s method (1985), the first step of the physical UFW analysis is to find the maximum pressures at the nodes of the network. These maximum pressures were calculated by EPANET (Figure 24.3). Then, calculated maximum pressures at nodes have to be joined to the attributes of the pipes table in Arcview. Therefore, two new fields (P1, P2), pressure on upstream and downstream nodes of the pipe, were added to the pipe table. . Two other fields called ‘Pav’ and ‘Q’ were also added to this table in order to calculate the amount of loss. ‘Pav’ value is the average of the pipe pressure and ‘Q’ is the leak discharge. As shown in Figure 24.4, the ‘Calculate’ command in ArcView was used along with formulas [1] and [2], to determine ‘Pav’ and ‘Q’ values for all pipes.
Total calculated amount of UFW (physical loss) in the pilot project was found to be about 9,168 m3 for the study duration of 28 days.
Figure 24.4 Finding amount of loss using ‘Calculate’ option of a table in ArcView.
554 Unaccounted-for Water using GIS and modeling
24.5 Comparing with Measurements
Input water discharge in the network was measured as 70,100 m3 during the 28 days study period. Consumer use, based on meter reading during this same 28 days was 47,081 m3. Therefore, the total of physical and non-physical loss in the pilot project was:
Real total loss = 70,100 – 47,081 = 23019 (m3 in 28 days)
Therefore total UFW percentage is equal to:
23,019 / 70,100 *100 = 32%
According to Germanopoulos (1985), if the physical UFW (leakage) due to maximum pressure in the pilot site was 9168 m3 in 28 days, we may consider that the non-physical UFW value is equal to:
Non-Physical loss = 23,019 – 9,168 = 13,851 (m3 in 28 days) So:
Percentage of physical loss (leakage) = 9168/70100 *100 =13% Percentage of non-physical loss = 13851/70100 *100 = 19.7%
Results show that the value of non-physical UFW is more than physical UFW, so not only the rehabilitation of pipes is important, but also is more important to pay attention to unaccounted consumers.
24.6 Locating Critical Zones with GIS
Apart from the assessment of physical UFW, another aim of the research was to identify critical zones with querying data based on defined criteria. To find critical zones of the water distribution network represented by the GIS system, three parameters have to be evaluated:
1. The first parameter is maximum pressure of the network, which hasthe most affect on total loss.
2. Identifying pipes with maximum rate of leak is the second parameter.In the pilot study, a lot of overnight operations in the field were done to identify suspicion leakage points in the network. These points were categorized in three grades, 1, 2, and 3 in terms of amount of leakage. The
Unaccounted-for Water using GIS and modeling 555
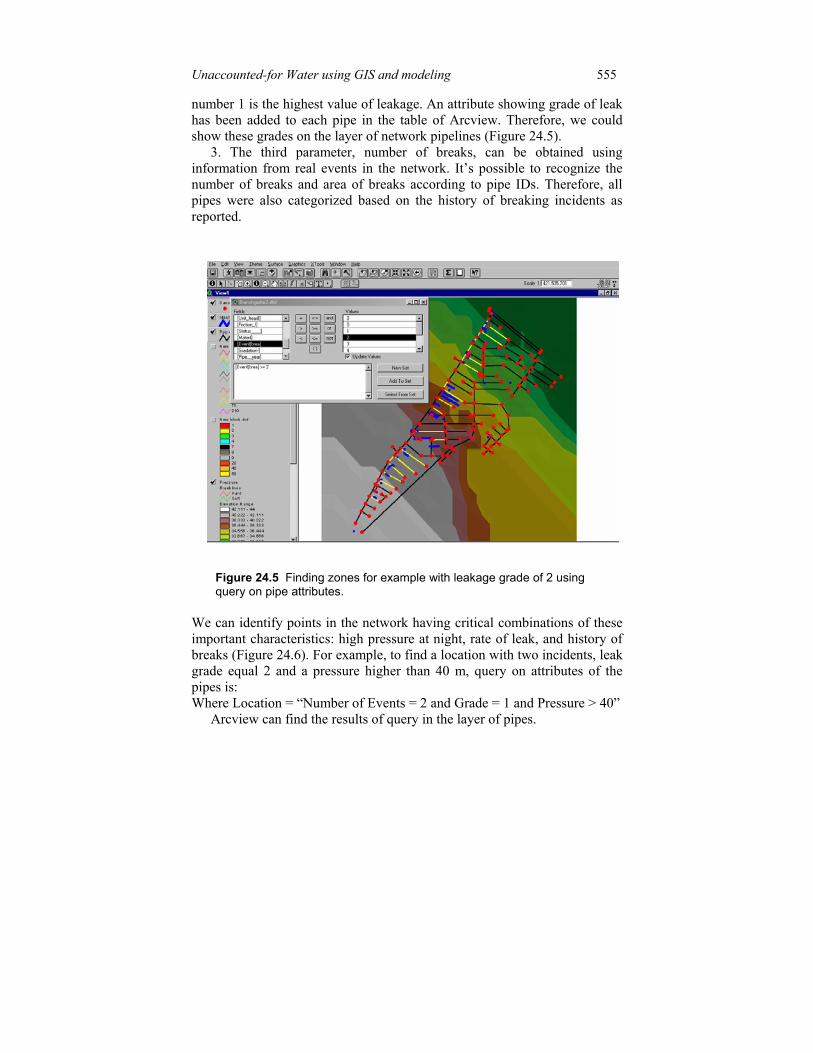
number 1 is the highest value of leakage. An attribute showing grade of leak has been added to each pipe in the table of Arcview. Therefore, we could show these grades on the layer of network pipelines (Figure 24.5).
3. The third parameter, number of breaks, can be obtained usinginformation from real events in the network. It’s possible to recognize the number of breaks and area of breaks according to pipe IDs. Therefore, all pipes were also categorized based on the history of breaking incidents as reported.
Figure 24.5 Finding zones for example with leakage grade of 2 using query on pipe attributes.
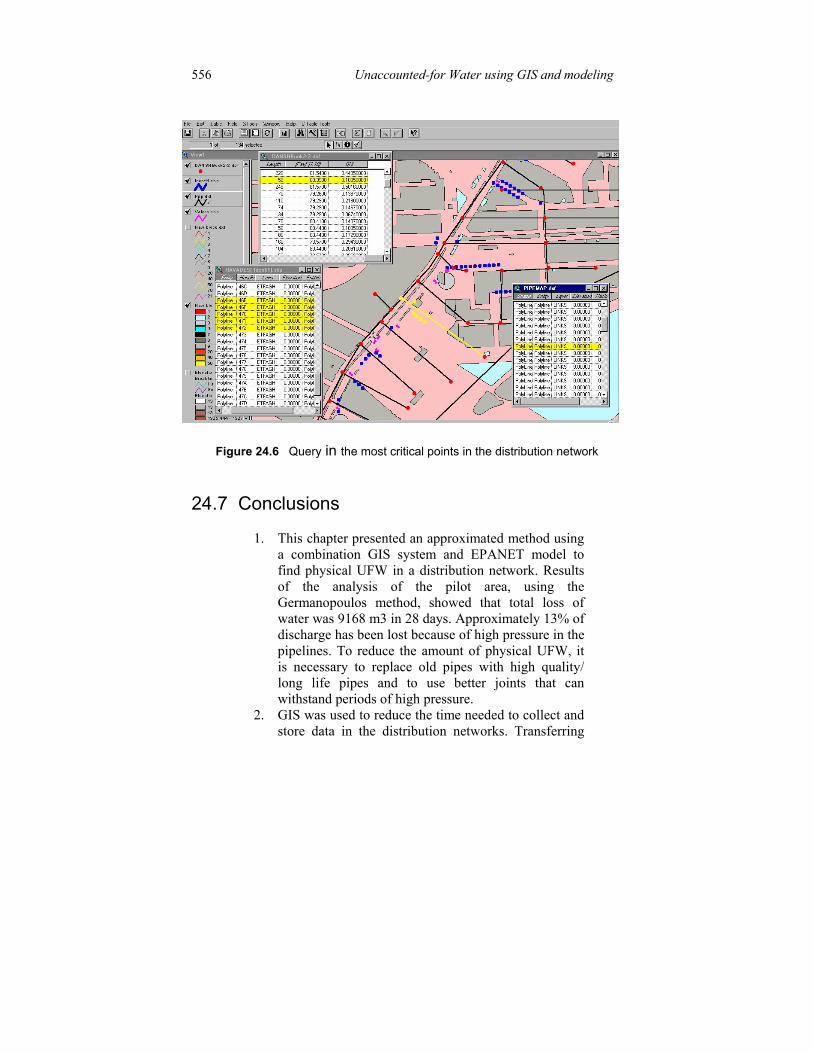
We can identify points in the network having critical combinations of these important characteristics: high pressure at night, rate of leak, and history of breaks (Figure 24.6). For example, to find a location with two incidents, leak grade equal 2 and a pressure higher than 40 m, query on attributes of the pipes is: Where Location = “Number of Events = 2 and Grade = 1 and Pressure > 40”
Arcview can find the results of query in the layer of pipes.
556 Unaccounted-for Water using GIS and modeling
Figure 24.6 Query in the most critical points in the distribution network
24.7 Conclusions
1. This chapter presented an approximated method usinga combination GIS system and EPANET model tofind physical UFW in a distribution network. Resultsof the analysis of the pilot area, using theGermanopoulos method, showed that total loss ofwater was 9168 m3 in 28 days. Approximately 13% ofdischarge has been lost because of high pressure in thepipelines. To reduce the amount of physical UFW, itis necessary to replace old pipes with high quality/long life pipes and to use better joints that canwithstand periods of high pressure.
2. GIS was used to reduce the time needed to collect andstore data in the distribution networks. Transferring
Unaccounted-for Water using GIS and modeling 557
data between the GIS system and hydraulic models helps optimize the engineering analysis. Result of the hydraulic analysis (e.g. pressure zones) can be displayed in the GIS, and in combination with other layers such as the topographic layer of the city, helps us to understand the critical zones of the water distribution network.
3. Municipal water networks include huge amounts ofspatial and tabular data that will be changed, deletedor added. Therefore GIS system is a helpful tool toefficiently store and update the data fast andeffectively. In addition to understand the current andfuture hydraulic situation of the water network, it ispossible to use mathematical models. These modelsare capable of simulating events in the network andtherefore can be used them to calculate the networkpressures and the resultant physical UFW.
References Feinberg,D. , Uric,S.W. (1997), "Integrating GIS with Water and Wastewater Hydraulic
Models", ESRI user Conference, http://www.Esri.com. Germanopoulos G. (1985) A technical note on the inclusion of pressure dependent
demand and leakage terms in water supply network models, Civil Engineering Systems, 171-179.
Jacobs, P. , I.C.Goulter and J.Davidson,(1993), Water- Distribution GIS from Fragmented and Incomplete Information .J.of Computing in Civil EngineeringASCE.vol.7, No.3
Motiee, H. , Hejranfar, A.(2002). Assessment of UFW with GIS and EPANET model, thesis of MSc. Power and Water university of Technology .
Tabesh,M. , Bostanian,M. , Delavar, M. (2001): Applying GIS and hydraulic models in reducing water lost in networks. Tehran University.
Rossman, L. A. September ( 2000). EPANET Users Manual USA Runoff’s, 1989, GIS: A Management Perspective. Rizzo A.(1999), Leakage Control and Unaccounted for Water Analysis , Proceedings of
the International Symposium on Efficient Water Use in Urban Areas Vela, A.,Perez R.,and Espert V. (1991) “Incorporation of leakages in the mathematical
model of a water distribution network” Proceeding 2nd International Conference on Computer Method in Water Resources,
Water and Wastewater Organization of Iran – (2000) Report , Study of the Unaccounted water in Ghazvin city
WHO– (2001) , Leakage Management and Control , A Best Practice Training Manual.
558 Unaccounted-for Water using GIS and modeling