Embed Size (px)
Citation preview

Chalmers University of Technology
Smögen, August, 2008 J.W. Ringsberg and B.L. Josefson
p. 1 (15)
Assessment of Uncertainties in Life Prediction of
Fatigue Crack Initiation in Rails –
Influence of Residual Stresses From Manufacturing
Jonas W Ringsberg1 and B Lennart Josefson2
Chalmers University of Technology1Department of Shipping and Marine Technology2Department of Applied Mechanics
Göteborg, SWEDEN
Chalmers University of Technology
Smögen, August, 2008 J.W. Ringsberg and B.L. Josefson
p. 2 (15)
Outline of presentation
• Introduction and motivation for study
• Finite element models and analyses
• Fatigue analysis
• Statistical analysis
• Conclusions
Chalmers University of Technology
Smögen, August, 2008 J.W. Ringsberg and B.L. Josefson
p. 3 (15)
Introduction and motivation for study
• Modern rails are subject to a complex loading situation with high local stresses at the railhead during a wheel passage superposed with a global bending stress in the rail cross section.
– Hence, a material point near the rail’s surface is subject to cyclic, fatigue loading with rotating principal stresses.
• The manufacturing of rails may give rise to additional concern for fatigue cracks starting from defects in the weld zone.
– Failures at rail welds and growth of cracks starting in the weld zone have been studied in Mutton and Alvarez [2] and Beretta et al. [3].
• A completed weld, a flash butt weld or a thermite weld, typically exhibits high tensile residual stresses in the web region.
– These stresses may increase the risk for fatigue failure as they are relatively unaffected by the subsequent resulting high local stresses at the railhead during wheel passages; see Skyttebol et al. [5].
INTRODUCTION FE ANALYSIS FATIGUE ANALYSIS STATISTICAL ANALYSIS CONCLUSIONS
Chalmers University of Technology
Smögen, August, 2008 J.W. Ringsberg and B.L. Josefson
p. 4 (15)
Introduction and motivation for study
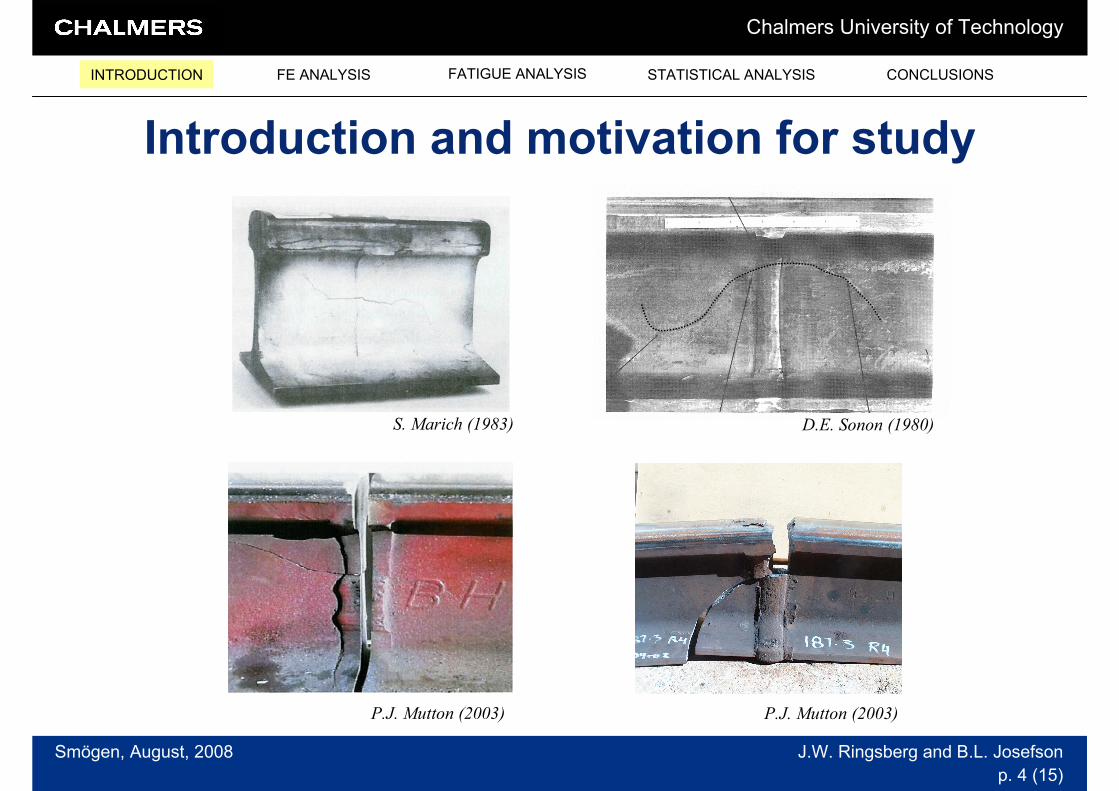
P.J. Mutton (2003)
D.E. Sonon (1980)
P.J. Mutton (2003)
S. Marich (1983)
INTRODUCTION FE ANALYSIS FATIGUE ANALYSIS STATISTICAL ANALYSIS CONCLUSIONS
Chalmers University of Technology
Smögen, August, 2008 J.W. Ringsberg and B.L. Josefson
p. 5 (15)
Introduction and motivation for study
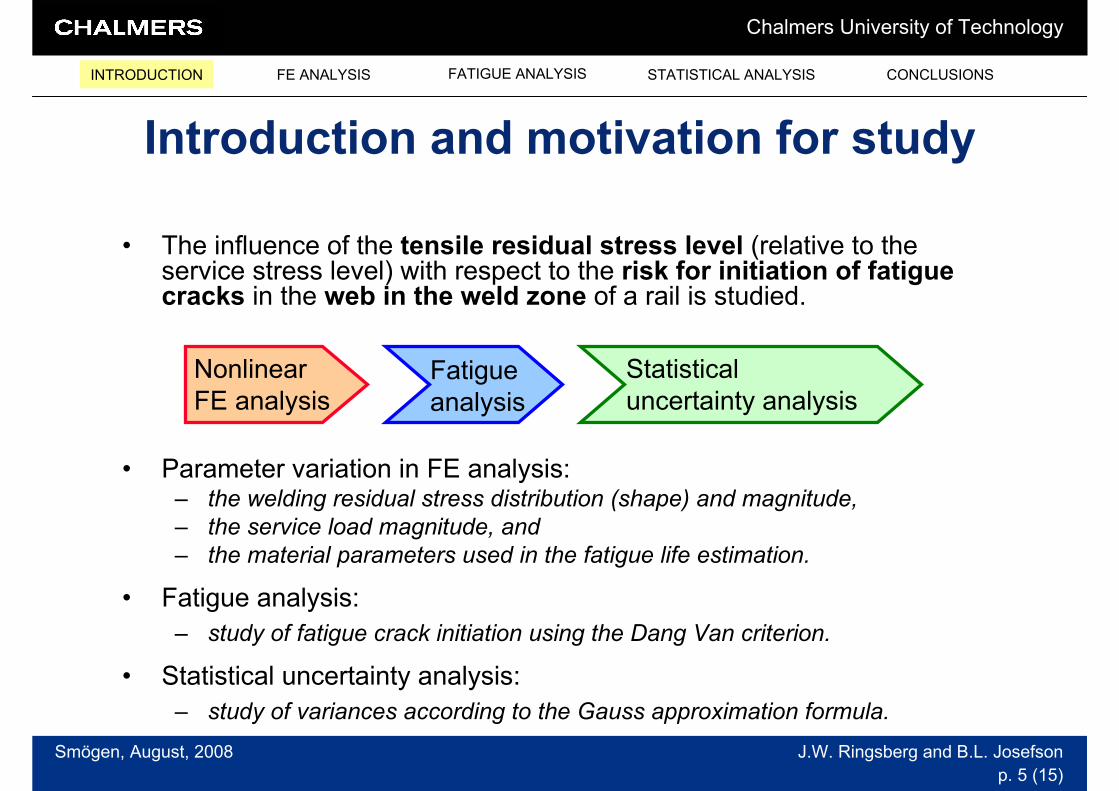
• The influence of the tensile residual stress level (relative to the service stress level) with respect to the risk for initiation of fatigue cracks in the web in the weld zone of a rail is studied.
• Parameter variation in FE analysis:– the welding residual stress distribution (shape) and magnitude,
– the service load magnitude, and
– the material parameters used in the fatigue life estimation.
• Fatigue analysis:
– study of fatigue crack initiation using the Dang Van criterion.
• Statistical uncertainty analysis:
– study of variances according to the Gauss approximation formula.
Nonlinear
FE analysisFatigue
analysis
Statistical
uncertainty analysis
INTRODUCTION FE ANALYSIS FATIGUE ANALYSIS STATISTICAL ANALYSIS CONCLUSIONS
Chalmers University of Technology
Smögen, August, 2008 J.W. Ringsberg and B.L. Josefson
p. 6 (15)
Finite element models and analyses
• Ringsberg et al. [9]: FE tool developed for the analysis of RCF of rails.
– Track model: track dynamics.
– Rail model: local/detailed RCF analysis.
• The rail model is a 3D FE model made of 8-node brick elements.
– Elasto-plastic material behaviour of the steel grade 900A was modelled by a linear
kinematic hardening model.
– A Hertzian contact load distribution simulates a traveling wheel (normal and
tangential loads).
– An initial welding residual stress field representing a flash butt weld was introduced
at the weld position.
INTRODUCTION FE ANALYSIS FATIGUE ANALYSIS STATISTICAL ANALYSIS CONCLUSIONS
Chalmers University of Technology
Smögen, August, 2008 J.W. Ringsberg and B.L. Josefson
p. 7 (15)
Finite element models and analyses
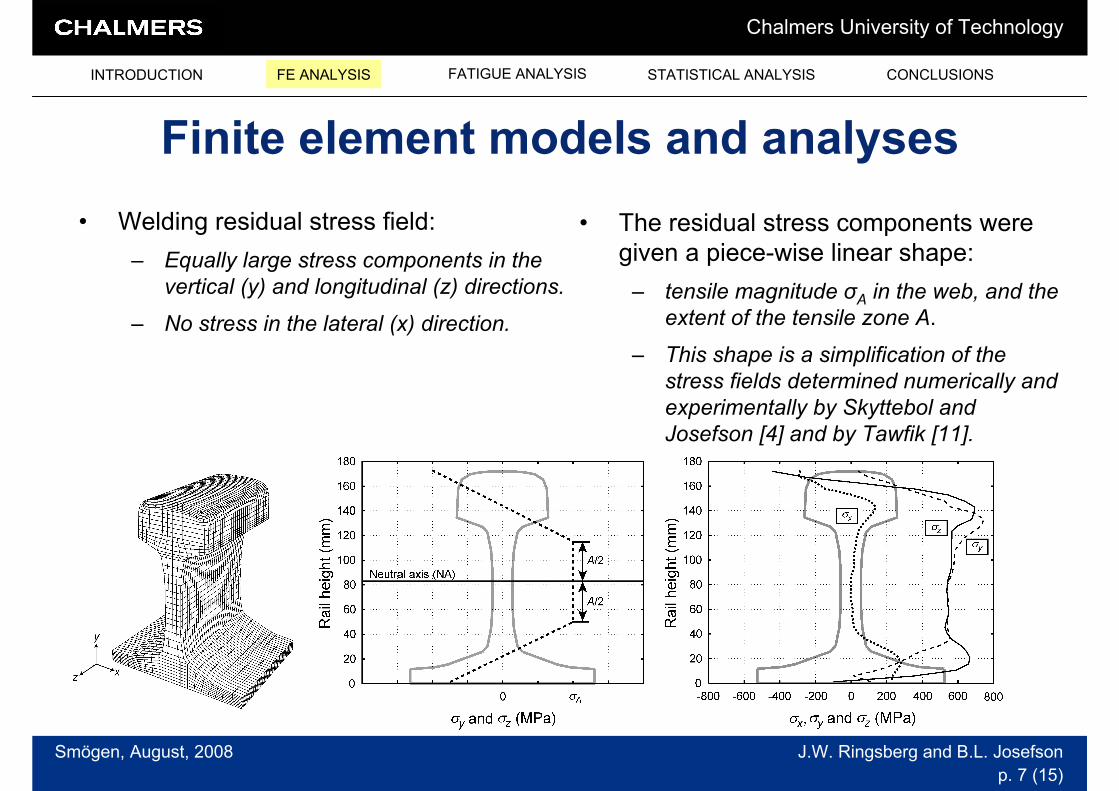
• Welding residual stress field:
– Equally large stress components in the
vertical (y) and longitudinal (z) directions.
– No stress in the lateral (x) direction.
• The residual stress components were
given a piece-wise linear shape:
– tensile magnitude σA in the web, and the
extent of the tensile zone A.
– This shape is a simplification of the
stress fields determined numerically and
experimentally by Skyttebol and
Josefson [4] and by Tawfik [11].
INTRODUCTION FE ANALYSIS FATIGUE ANALYSIS STATISTICAL ANALYSIS CONCLUSIONS
Chalmers University of Technology
Smögen, August, 2008 J.W. Ringsberg and B.L. Josefson
p. 8 (15)
Finite element models and analyses
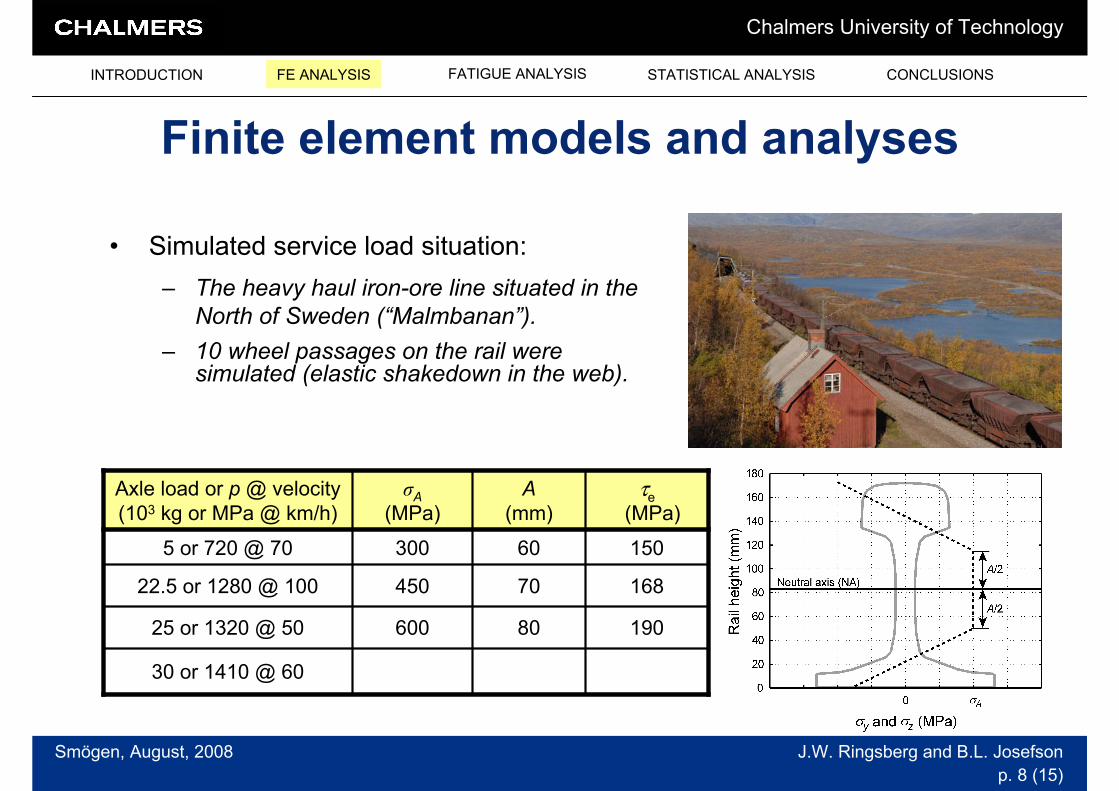
30 or 1410 @ 60
1908060025 or 1320 @ 50
1687045022.5 or 1280 @ 100
150603005 or 720 @ 70
τe(MPa)
A
(mm)
σA(MPa)
Axle load or p @ velocity
(103 kg or MPa @ km/h)
INTRODUCTION FE ANALYSIS FATIGUE ANALYSIS STATISTICAL ANALYSIS CONCLUSIONS
• Simulated service load situation:
– The heavy haul iron-ore line situated in the
North of Sweden (“Malmbanan”).
– 10 wheel passages on the rail were simulated (elastic shakedown in the web).
Chalmers University of Technology
Smögen, August, 2008 J.W. Ringsberg and B.L. Josefson
p. 9 (15)
Fatigue analysis
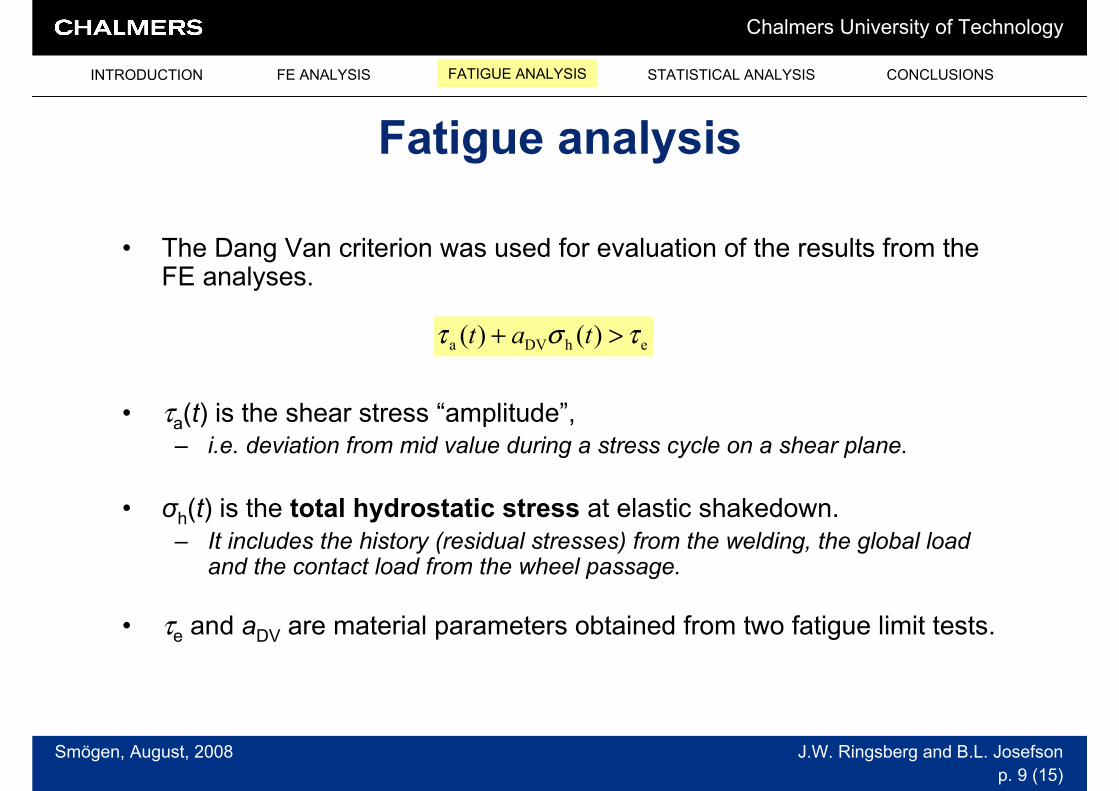
• The Dang Van criterion was used for evaluation of the results from the FE analyses.
• τa(t) is the shear stress “amplitude”,– i.e. deviation from mid value during a stress cycle on a shear plane.
• σh(t) is the total hydrostatic stress at elastic shakedown.
– It includes the history (residual stresses) from the welding, the global load and the contact load from the wheel passage.
• τe and aDV are material parameters obtained from two fatigue limit tests.
ehDVa )()( τστ >+ tat
INTRODUCTION FE ANALYSIS FATIGUE ANALYSIS STATISTICAL ANALYSIS CONCLUSIONS
Chalmers University of Technology
Sheffield Hallam University, Sheffield, UK
ICMFF8-2007
B.L. Josefson and J.W. Ringsberg
p. 10
Fatigue analysis
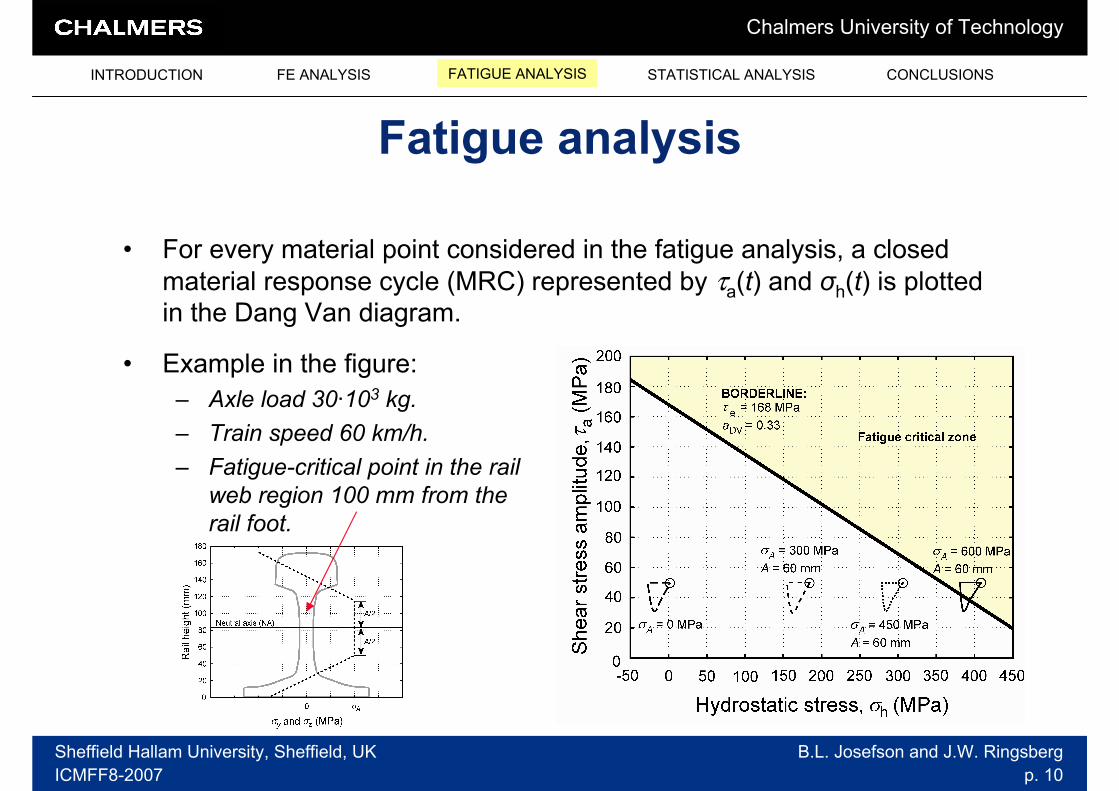
• For every material point considered in the fatigue analysis, a closed
material response cycle (MRC) represented by τa(t) and σh(t) is plotted in the Dang Van diagram.
• Example in the figure:
– Axle load 30·103 kg.
– Train speed 60 km/h.
– Fatigue-critical point in the rail
web region 100 mm from the
rail foot.
INTRODUCTION FE ANALYSIS FATIGUE ANALYSIS STATISTICAL ANALYSIS CONCLUSIONS
Chalmers University of Technology
Sheffield Hallam University, Sheffield, UK
ICMFF8-2007
B.L. Josefson and J.W. Ringsberg
p. 11
Fatigue analysis
INTRODUCTION FE ANALYSIS FATIGUE ANALYSIS STATISTICAL ANALYSIS CONCLUSIONS
Chalmers University of Technology
Smögen, August, 2008 J.W. Ringsberg and B.L. Josefson
p. 12 (15)
Statistical analysis
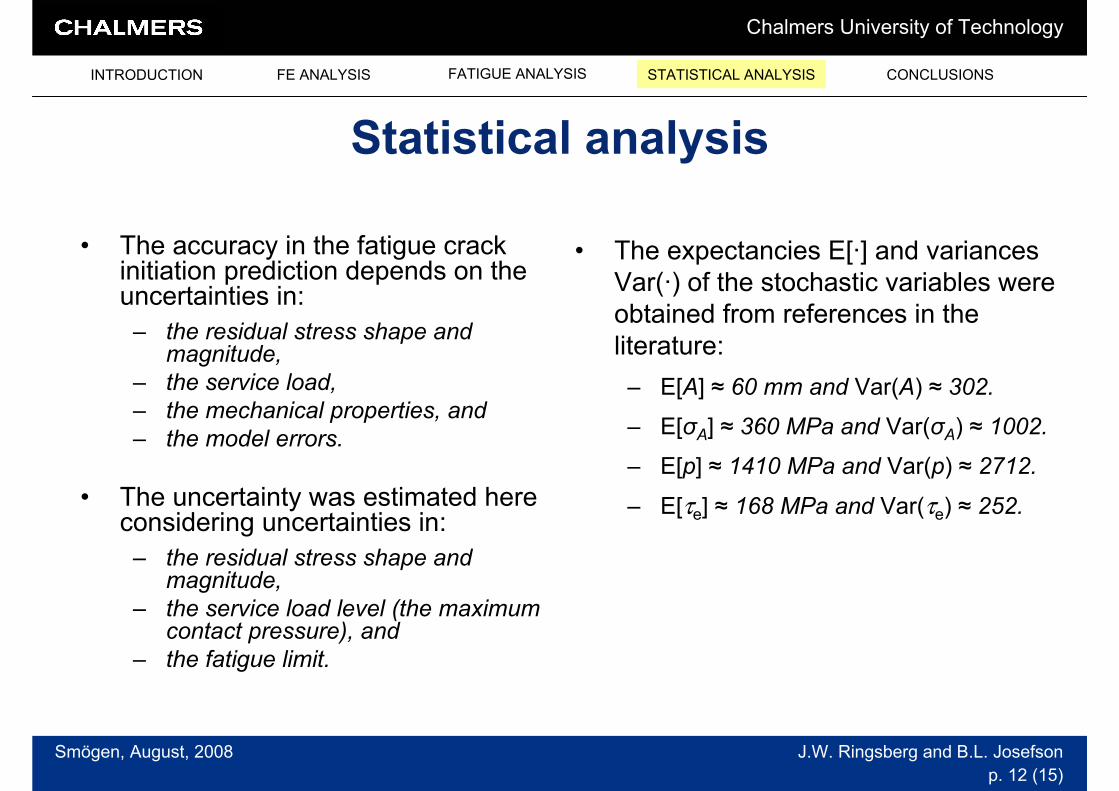
• The accuracy in the fatigue crack initiation prediction depends on the uncertainties in:
– the residual stress shape and magnitude,
– the service load,
– the mechanical properties, and
– the model errors.
• The uncertainty was estimated here considering uncertainties in:
– the residual stress shape and magnitude,
– the service load level (the maximum contact pressure), and
– the fatigue limit.
• The expectancies E[·] and variances
Var(·) of the stochastic variables were
obtained from references in the
literature:
– E[A] ≈ 60 mm and Var(A) ≈ 302.
– E[σA] ≈ 360 MPa and Var(σA) ≈ 1002.
– E[p] ≈ 1410 MPa and Var(p) ≈ 2712.
– E[τe] ≈ 168 MPa and Var(τe) ≈ 252.
INTRODUCTION FE ANALYSIS FATIGUE ANALYSIS STATISTICAL ANALYSIS CONCLUSIONS
Chalmers University of Technology
Smögen, August, 2008 J.W. Ringsberg and B.L. Josefson
p. 13 (15)
Statistical analysis
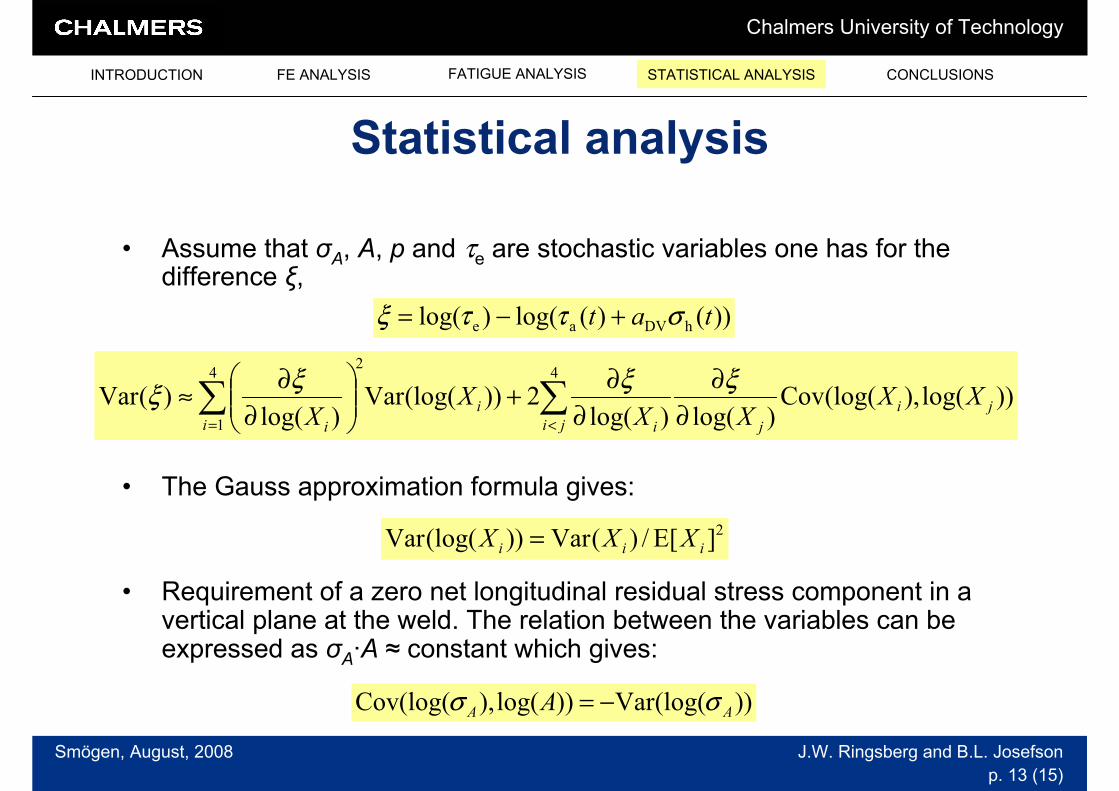
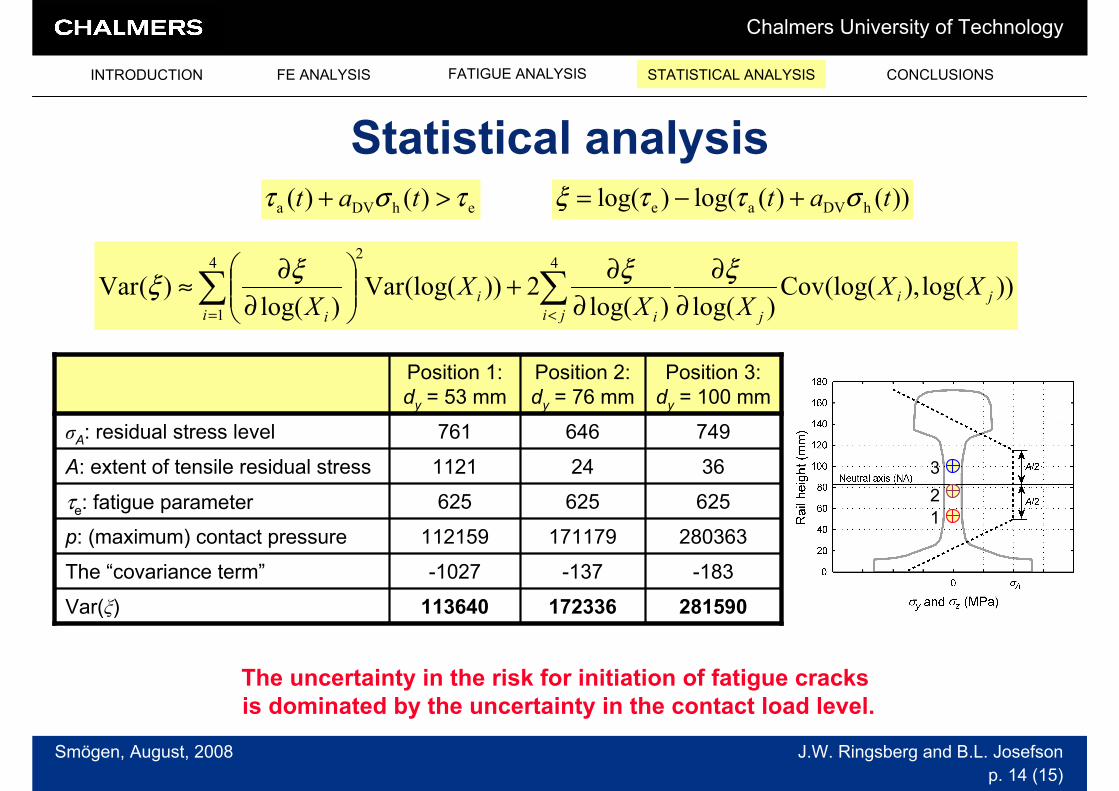
• Assume that σA, A, p and τe are stochastic variables one has for the difference ξ,
• The Gauss approximation formula gives:
• Requirement of a zero net longitudinal residual stress component in a vertical plane at the weld. The relation between the variables can be expressed as σA·A ≈ constant which gives:
))()(log()log( hDVae tat σττξ +−=
))log(),(log(Cov)log()log(
2))(log(Var)log(
)(Var4
24
1
ji
jji i
i
i i
XXXX
XX ∂
∂
∂
∂+
∂
∂≈ ∑∑
<=
ξξξξ
2]E[/)(Var))(log(Var iii XXX =
))(log(Var))log(),(log(Cov AA A σσ −=
INTRODUCTION FE ANALYSIS FATIGUE ANALYSIS STATISTICAL ANALYSIS CONCLUSIONS
Chalmers University of Technology
Smögen, August, 2008 J.W. Ringsberg and B.L. Josefson
p. 14 (15)
Statistical analysis
281590172336113640Var(ξ)
-183-137-1027The “covariance term”
280363171179112159p: (maximum) contact pressure
625625625τe: fatigue parameter
36241121A: extent of tensile residual stress
749646761σA: residual stress level
Position 3:
dy = 100 mm
Position 2:
dy = 76 mm
Position 1:
dy = 53 mm
ehDVa )()( τστ >+ tat
))log(),(log(Cov)log()log(
2))(log(Var)log(
)(Var4
24
1
ji
jji i
i
i i
XXXX
XX ∂
∂
∂
∂+
∂
∂≈ ∑∑
<=
ξξξξ
The uncertainty in the risk for initiation of fatigue cracks
is dominated by the uncertainty in the contact load level.
INTRODUCTION FE ANALYSIS FATIGUE ANALYSIS STATISTICAL ANALYSIS CONCLUSIONS
1
2
3
))()(log()log( hDVae tat σττξ +−=
Chalmers University of Technology
Smögen, August, 2008 J.W. Ringsberg and B.L. Josefson
p. 15 (15)
Conclusions
• The representation of the welding residual stress field was simplified compared with similar investigations.
– It was deemed satisfactory for a quantitative investigation.
• The fatigue analysis showed that:
– the presence of welding residual stresses increases the risk for fatigue crack initiation, and
– the higher the magnitude of the stresses (σA) the larger is this risk for fatigue failure.
• The statistical analysis showed that:
– the contact load, p, had the greatest influence on Var(ξ),
– the welding residual stress magnitude, σA, was the second most influencing parameter,
– the fatigue parameter, τe, was the third most influencing parameter,
– followed by the welding residual stress distribution, A.
INTRODUCTION FE ANALYSIS FATIGUE ANALYSIS STATISTICAL ANALYSIS CONCLUSIONS