Embed Size (px)
Citation preview
Executive Health and Safety
Assessment uncertainties relating to electromagnetic fields (EMF) measurement and computation
Prepared by EMFields Limited for the Health and Safety Executive 2008
RR649 Research Report
Executive Health and Safety
Assessment uncertainties relating to electromagnetic fields (EMF) measurement and computation
Philip Chadwick EMFields Ltd 1 Essex Place Lambourn Berkshire RG17 8QF
Guidelines for limiting occupational exposure to electromagnetic fields (EMF) have been produced by international organisations, and have been recommended for use in the UK by the Health Protection Agency (HPA). There is also an EU Directive (the EMF Directive) which sets restrictions on occupational exposure to electromagnetic fields and which is expected to be implemented in UK legislation by April 2012.
Technical standardisation bodies have produced assessment methods that can be used with these guidelines and with the EMF Directive. Neither the exposure restrictions nor the technical assessment standards specify how measurement and computation uncertainty should be considered as part of an over-all EMF assessment in the workplace.
This report describes possible uncertainty management regimes, and discusses the likely implications of these regimes for UK industry. Although it does not describe in detail how to make an assessment of uncertainty, its appendices contain examples of uncertainty assessment from three CENELEC EMF assessment standards.
This report and the work it describes were funded by the Health and Safety Executive (HSE). Its contents, including any opinions and/or conclusions expressed, are those of the author alone and do not necessarily reflect HSE policy.
HSE Books
© Crown copyright 2008
First published 2008
All rights reserved. No part of this publication may be reproduced, stored in a retrieval system, or transmitted in any form or by any means (electronic, mechanical, photocopying, recording or otherwise) without the prior written permission of the copyright owner.
Applications for reproduction should be made in writing to: Licensing Division, Her Majesty’s Stationery Office, St Clements House, 2-16 Colegate, Norwich NR3 1BQ or by e-mail to [email protected]
ii
EXECUTIVE SUMMARY
Guidelines for limiting occupational exposure to electromagnetic fields (EMF) have been produced by international organisations, and have been recommended for use in the UK by the Health Protection Agency (HPA). There is also an EU Directive (the EMF Directive) which sets restrictions on occupational exposure to electromagnetic fields and which is expected to be implemented in UK legislation by April 2012.
Technical standardisation bodies have produced assessment methods that can be used with these guidelines and with the EMF Directive. Neither the exposure restrictions nor the technical assessment standards specify how measurement and computation uncertainty should be considered as part of an over-all EMF assessment in the workplace.
This report describes possible uncertainty management regimes, and discusses the likely implications of these regimes for UK industry. It concludes that:
Uncertainty cannot be ignored, because it gives confidence to an EMF assessment. CENELEC EMF assessment standards, and accepted best practice, require that an assessment of uncertainty is made.
It is likely that advice will be needed on which uncertainty management regime is appropriate for the UK, whether this is for any implementation of the EMF Directive or for use in conjunction with existing HPA-RPD (Health Protection Agency – Radiation Protection Division) guidance.
There are two basic approaches to managing uncertainty associated with EMF assessments: the direct comparison (or shared risk) approach and the additive approach.
It is possible to modify these approaches, or to develop a hybrid which may avoid the most serious disadvantages of each.
The direct comparison approach is likely to be more compatible with simplified measurement and analysis techniques, and may lower the financial and organisational impact of any EMF assessment. Without constraints it could also allow measurements of essentially uncontrolled quality to be used, with a concomitant loss of confidence in the validity of the assessment. If it is used in conjunction with a requirement for an assessment of uncertainty then the quality of the assessment technique would be established. If, in addition, a maximum allowed assessment uncertainty is specified then the direct comparison approach can be used in a high-confidence assessment.
The additive approach requires an employer to establish a formal uncertainty budget, which complicates the overall assessment procedure, but means that there can always be confidence in the validity of the EMF exposure assessment. It is often suggested that this approach ensures that exposures cannot exceed the relevant guideline or limit, but because of the statistical nature of uncertainty this is not actually so. If the uncertainty is high, as it is likely to be in workplace measurements, the additive approach would cause allowed exposure levels to be lowered dramatically, and the concomitant impact on industry of meeting EMF exposure guidelines or regulations could be significantly greater.
iii
It is possible to develop variants on the direct comparison approach which also incorporate aspects of the additive approach. This should improve the over-all quality of the EMF assessment, because the uncertainty has to be determined, and also means that, as long as the allowed uncertainty is not excessively large, there can be reasonable confidence that the exposure guideline or restriction will not be exceeded by a large amount. It also means that, as long as the uncertainty is below the specified maximum, the effective exposure limit or guideline is not reduced and it allows an employer to use an assessment method with a high uncertainty - perhaps one that is simple or low-cost -if the exposure level is sufficiently low. There is no technical reason to favour any particular hybrid approach over any other, and the details of such approaches can be decided within the context of the appropriate regulatory regime
The direct comparison approach, and variants on it, are likely to allow greater coherence with existing emission and exposure information than the additive approach.
The direct comparison approach is likely to be the most acceptable to some employers, although some employers may not favour it because the over-all acceptability of the EMF assessment may appear to be undermined. A variant in which the uncertainty has to be assessed even if it is not considered further might mitigate this problem and make it more favoured by employers and workers.
The additive approach may be the most acceptable to some workers. In situations where exposure levels are low and/or techniques of exposure assessments with small uncertainties can be used, the approach may be attractive to some employers, but where uncertainties are high it is likely to be very unpopular with employers. It may also be perceived as decreasing the permitted exposure levels and this may be unacceptable to both employers and regulators.
A hybrid approach is the most likely to be acceptable in principle to employers and workers, because the more obvious difficulties of the direct comparison and additive approaches can be avoided. However, such an approach is likely to be more complex than either of the other approaches, and would require maximum uncertainties to be specified for all exposure situations.
iv
CONTENTS
1. BACKGROUND 1
2. UNCERTAINTY IN RELATION TO EMF EXPOSURE ASSESSMENT 2
3. OPTIONS FOR MANAGING UNCERTAINTY 3
4. IMPLICATIONS FOR INDUSTRY OF THE USE OF DIFFERENT 4 UNCERTAINTY REGIMES
4.1 MAGNITUDE OF UNCERTAINTY 4
4.2 COHERENCE WITH EXISTING EMISSION AND EXPOSURE 4 INFORMATION
4.3 DIRECT COMPARISON UNCERTAINTY REGIME 5
4.4 ADDITIVE UNCERTAINTY REGIME 5
4.5 HYBRID UNCERTAINTY REGIMES 6
4.6 EFFECT OF UNCERTAINTY REGIME ON REFERENCE LEVEL 7
5. ACCEPTABILITY TO SOCIAL PARTNERS (EMPLOYERS, WORKERS 8 AND REGULATORS) OF EACH REGIME
5.1 DIRECT COMPARISON UNCERTAINTY REGIME 7
5.2 ADDITIVE UNCERTAINTY REGIME 7
5.3 HYBRID UNCERTAINTY REGIMES 9
6 SUMMARY 10
7 REFERENCES 12
APPENDIX A: EXAMPLES OF UNCERTAINTY ASSESSMENT REGIMES IN 13 CENELEC EMF STANDARDS
APPENDIX B: ANNEX C OF EN50413 16
APPENDIX C: UNCERTAINTY APPROACH OF EN50361 23
v

vi
1. BACKGROUND
Guidelines for limiting occupational exposure to electromagnetic fields (EMF) have been produced by the International Commission on Non-Ionizing Radiation Protection (ICNIRP)(1). Current guidance from the Health Protection Agency - Radiation Protection Division (HPA-RPD; former NRPB)(2) is that these guidelines should be used in the UK; Directive 2004/40/EC (the EMF Directive)(3) which is intended to restrict the EMF exposure of workers in the European Union, is based on the ICNIRP guidelines. The ICNIRP guidelines, the HPA-RPD advice and the EMF Directive do not address how to manage the issue of assessment uncertainty.
The European Committee for Electrotechnical Standardisation (CENELEC) and the International Electrotechnical Commission (IEC) - have produced standards for the assessment of EMF emissions from devices and (in the case of CENELEC) for the assessment of the EMF exposure of people(4). CENELEC and IEC measurement and computation standards include requirements for detailed uncertainty budgets (see Section 2), and CENELEC device emission standards specify maximum allowed uncertainties for assessment of the emission. There are two general approaches to uncertainty: the additive approach and the direct comparison approach (see Section 3), and CENELEC standards for emissions from devices usually specify the direct comparison approach. It was hoped that some guidance as to which approach is the most appropriate for assessments of human exposure to electromagnetic fields might be developed during the writing of CENELEC EN50499(4), the general assessment standard intended to be used with the EMF Directive, but the question has instead been left to national authorities to resolve.
It is likely that advice will be needed on which uncertainty management regime is appropriate for the UK, whether this is for any implementation of the EMF Directive or for use in conjunction with existing HPA-RPD guidance. This report describes possible uncertainty management regimes, and discusses the likely implications of these regimes for UK industry.
This report does not describe how to make an assessment of uncertainty: that is a subject that has a comprehensive literature of its own. The appendices contain examples of uncertainty assessment from three CENELEC standards, provided for information.
1
2. UNCERTAINTY IN RELATION TO EMF EXPOSURE ASSESSMENT
Uncertainty in scientific or technical the context has a very specific meaning. To help understand what is meant by uncertainty in a technical context such as EMF assessment, it is useful to imagine that there is a “true” value for something that we are trying to measure – the electromagnetic field strength at a distance of 1 m from a piece of equipment in a factory, for example. When we make a measurement of the field strength, the result should be close to this “true” value, but may not be exactly the same. If we make the measurement many times, we will get a range of results which are close to the “true” value. This spread in measured results might reflect differences in the exact measurement position, statistical variation in the response of the measurement instrument and also, perhaps, differences in the way that different people read the instrument display. In CENELEC EMF device standards, strict rules are given on how to determine and combine these disparate contributions to give one overall uncertainty for the assessment. This analysis of overall uncertainty is called the uncertainty budget and the overall uncertainty value that it produces is a measure of how close any one measured result should be to the “true” value.
It is important to realise that the basis of this uncertainty figure is statistical: if for example the overall measurement uncertainty is 30%, then there is a 95% probability that the measured value will be within 30% of the “true” value, but still a 5% probability that it is not.
Uncertainty cannot be ignored, because it gives confidence to the assessment. If an exposure assessment has an uncertainty of 100%, then all we could say is that we are reasonably sure that the actual exposure level is somewhere between zero and twice the reported value. If the measured exposure is small, that might be acceptable but if the measured exposure level is close to the exposure limit, the uncertainty can become as important as the result of the measurement in determining whether the exposure meets the limit.
2
3. OPTIONS FOR MANAGING UNCERTAINTY
In the EMF emission standards for devices that CENELEC has produced, the criterion for compliance with the specified emission limits is that the result of the assessment must be below the relevant limit and that the uncertainty is below the maximum allowed uncertainty. For example, the CENELEC standard for the assessment of emissions from mobile telephones(5)
allows a measurement uncertainty of 30%. This means that as long as the measured emission level is below the limit and the uncertainty is below 30% then the device complies with the requirements of the standard. This is usual practice for emission standards, but it is implicit in this approach that the true result of the measurement may, in fact, be above the limit. This can be visualised quite easily if we consider an assessment which indicates that the emission is 90% of the limit with an associated uncertainty of 30%. Conversely, the true result of the assessment may be below the limit when the result indicates that it is in fact above. This uncertainty management regime is called the direct comparison approach to uncertainty or sometimes the shared risk approach, although this is a slightly misleading name because the “risk” that it refers to is that of a false declaration of compliance rather than any risk to health or safety.
For standards that are used to assess the EMF exposure of people, an alternative approach can be taken: the uncertainty is added to the result of the assessment and then the total quantity is compared to the limit. The argument for this is that it should ensure that, in 95% of cases, the exposure will be below the limit. This is called the additive approach to uncertainty.
The direct comparison approach has the advantages of consistency with existing practice and simplicity of approach. The additive approach is more likely to ensure that an exposure is actually below the relevant limit, although it does not guarantee this because of the statistical nature of uncertainty (see Section 2). The additive approach is favoured in some countries, such as Austria and Denmark, where the direct comparison approach is not considered sufficiently protective.
Some device emission standards specify a hybrid approach to uncertainty in which the direct comparison approach is used, but if uncertainty is larger than the specified maximum it must then be added onto the results of the assessment.
3
4. IMPLICATIONS FOR INDUSTRY OF THE USE OF DIFFERENT UNCERTAINTY REGIMES
4.1. MAGNITUDE OF UNCERTAINTY The determination of overall uncertainty according to CENELEC and IEC standards is complex and often can be as difficult as the actual assessment. The appendices to this report discuss this further, with examples of how uncertainty is required to be assessed from three CENELEC EMF standards.
Whilst a detailed determination of uncertainty can be appropriate for laboratory measurements, it is unlikely to be feasible in many industrial environments and a more simple estimation of uncertainty usually will be appropriate. The standards discussed in the appendices take quite different approaches to uncertainty: EN50361 (a laboratory assessment standard for mobile phones) requires a detailed uncertainty budget (see Appendix B) whereas EN40413 (which is a general measurement standard more suitable for industrial situations) requires just that uncertainty is determined.
This requirement for a simplified approach, and the difficulties of exposure assessment in industrial environments, mean that uncertainties are likely to be significantly higher than for laboratory-based assessments specified in device emission standards. For example, the maximum allowed uncertainty specified by CENELEC for measuring emissions from mobile telephones is 30%, and some laboratories can achieve 25% or better. In industrial environments measurement uncertainty could easily exceed 50%, and in hostile environments may be much higher.
4.2. COHERENCE WITH EXISTING EMISSION AND EXPOSURE INFORMATION
In many situations an employer may wish to rely on existing information on emissions from devices as part of a workplace EMF exposure assessment. For example, if all the radio systems used by a security company have been tested according to the relevant CENELEC standard (as they should have been to be sold in the European Union) then the employer can be confident that exposures from those radio systems will not exceed the ICNIRP general public exposure guidelines. This is because the CENELEC standards require that emissions from devices should not give rise to exposures in excess of the 1999 EU Recommendation on general public exposure to EMF(6). The Recommendation is based on the ICNIRP guidelines for general public exposure to EMF, which are generally 3-5 times below the corresponding occupational exposure guidelines.
Those standards use the direct comparison approach to uncertainty, so it might be necessary to justify their inclusion in an over-all workplace EMF exposure assessment which used an additive approach to uncertainty. Normally that should not be a significant difficulty as long as the maximum uncertainty in the assessment standard is low and the frequency of the EMF emitted by the particular device is such that there is a large difference between occupational and general public exposure guidelines.
4
4.3. DIRECT COMPARISON UNCERTAINTY REGIME The direct comparison approach is the simpler to apply. In its simplest form the measured or computed exposure level is still compared directly with the exposure guidelines even if uncertainty is high (as it is likely to be in many industrial situations – see Section 4.1).
As an example, a measurement of magnetic flux density of 400 µT might be made close to a 50 Hz induction heater. Neglecting any effect of harmonics on the exposure, and assuming that the assessment at this stage is a straightforward comparison with the relevant ICNIRP reference level of 500 µT (the same as the action value of the EMF Directive) then the exposure would be deemed to be below the reference level no matter how large the uncertainty. If the uncertainty in this case were small – perhaps 15%, although that is unlikely – then we might be confident that this was a reasonable conclusion. If the uncertainty were 300% though, there might be less confidence that this were so.
This approach has the advantage that an employer does not have to be particularly concerned about the impact on the assessment of the absolute level of uncertainty, which may simplify measurement and analysis and could lower the financial and organisational impact of any EMF assessment. If uncertainty were neglected completely it would, however, also allow measurements of essentially uncontrolled quality to be used, with a concomitant loss of confidence in the validity of the assessment. This is why CENELEC standards that specify the direct comparison approach set a maximum allowed uncertainty. Even if CENELEC standards are not used, best practice would require the assessor to make a reasonable estimate of uncertainty – although this could be less formal than the uncertainty budget required in, for example, EN50360 (see Appendix A).
4.4. ADDITIVE UNCERTAINTY REGIME Under the additive uncertainty regime, the uncertainty is added to the results of the assessment before the exposure level is compared to the relevant limit.
In the example discussed in Section 4.3, an uncertainty of 15% added to the measured magnetic flux density of 400 µT would give a value of 475 µT to compare with the 500 µT reference level (or action value). In this case the exposure would still be below the reference level, but with a more realistic uncertainty of perhaps 50 % it would not be. If the uncertainty were 300% then the measured magnetic flux density would have to be below 125 µT if the exposure were to be below the reference level.
It is clear that if the uncertainty is high, as it is likely to be in workplace measurements, the additive approach would cause allowed exposure levels to be lowered dramatically and the concomitant impact on industry of meeting EMF exposure guidelines or regulations could be significantly greater.
With this approach, an employer does have to make an assessment of uncertainty, which complicates the overall assessment procedure, but means that there can be confidence in the validity of the EMF exposure assessment. It is often suggested that this approach ensures that exposures cannot exceed the relevant guideline or limit, but because of the statistical nature of uncertainty (see Section 2) this is not actually so.
5
4.5. HYBRID UNCERTAINTY REGIMES Many CENELEC device EMF emission standards use a variation on the direct comparison approach which also incorporates aspects of the additive approach. In this approach a maximum allowed uncertainty is specified and, as long as the assessment uncertainty is below this, the results of the assessment are compared directly with the relevant limit. However, if uncertainty is larger than the specified maximum it must then be added onto the results of the assessment as in the additive approach.
Using the example of the 50 Hz induction heater again, and assuming a specified maximum uncertainty of perhaps 50%, the exposure will be deemed to be below the reference level as long as the measured magnetic flux density is below 500 µT and the measurement uncertainty is below 50%. So a measured magnetic flux density of 499 µT with an uncertainty of 49% would be deemed compliant. If the uncertainty were 51%, however, it would be added to the result of the measurement, making the 499 µT equivalent to 753 µT. With this level of uncertainty, the measured magnetic flux density would have to be below 331 µT for the exposure to be deemed below the reference level.
It is clear that there is a sudden change from the direct comparison to the additive approach when the uncertainty exceeds the specified maximum, with a corresponding change in maximum allowed exposure level. The approach could be further adjusted to avoid this sudden change by, for example, adding on the difference between the actual uncertainty and the specified maximum uncertainty if the specified maximum uncertainty is exceeded. Using this approach, a measured magnetic flux density of 499 µT with an uncertainty of 49% would be deemed compliant. If the uncertainty were 51%, only an extra 1% (the difference between the actual uncertainty of 51% and the maximum permitted uncertainty of 51%) would be added to the result of the measurement, making the 499 µT equivalent to 504 µT. With this level of uncertainty, using this variant of the hybrid approach, the measured magnetic flux density would have to be below 495 µT for the exposure to be deemed below the reference level. If the measurement uncertainty were 60%, then the measured magnetic flux density would have to be below 454 µT for the exposure to be deemed below the reference level.
There is no technical reason to favour any particular hybrid approach over any other, and the details of such approaches can be decided within the context of the appropriate regulatory regime.
These hybrid approaches have the advantage of ensuring the over-all quality of the EMF assessment, because the uncertainty has to be determined, and also that, as long as the allowed uncertainty is not excessively large, there can be reasonable confidence that the exposure guideline or restriction will be not be exceeded by a large amount. Their use means that, as long as the uncertainty is below the specified maximum, the effective exposure limit or guideline is not reduced. It also allows an employer to use an assessment method with a high uncertainty, perhaps one that is simple or low-cost, if the exposure level is sufficiently low that even with a high uncertainty the sum will be below the relevant exposure restriction or limit.
6
4.6. EFFECT OF UNCERTAINTY REGIME ON REFERENCE LEVEL
Eff
ecti
ve r
efe
rence l
evel
(µT) 600
500
400
Direct comparison
Additive
Hybrid 1
300
200 Hybrid 2
100
0
0 20 40 60 80 100 120 140 160 180 200
Measurement uncertainty (%)
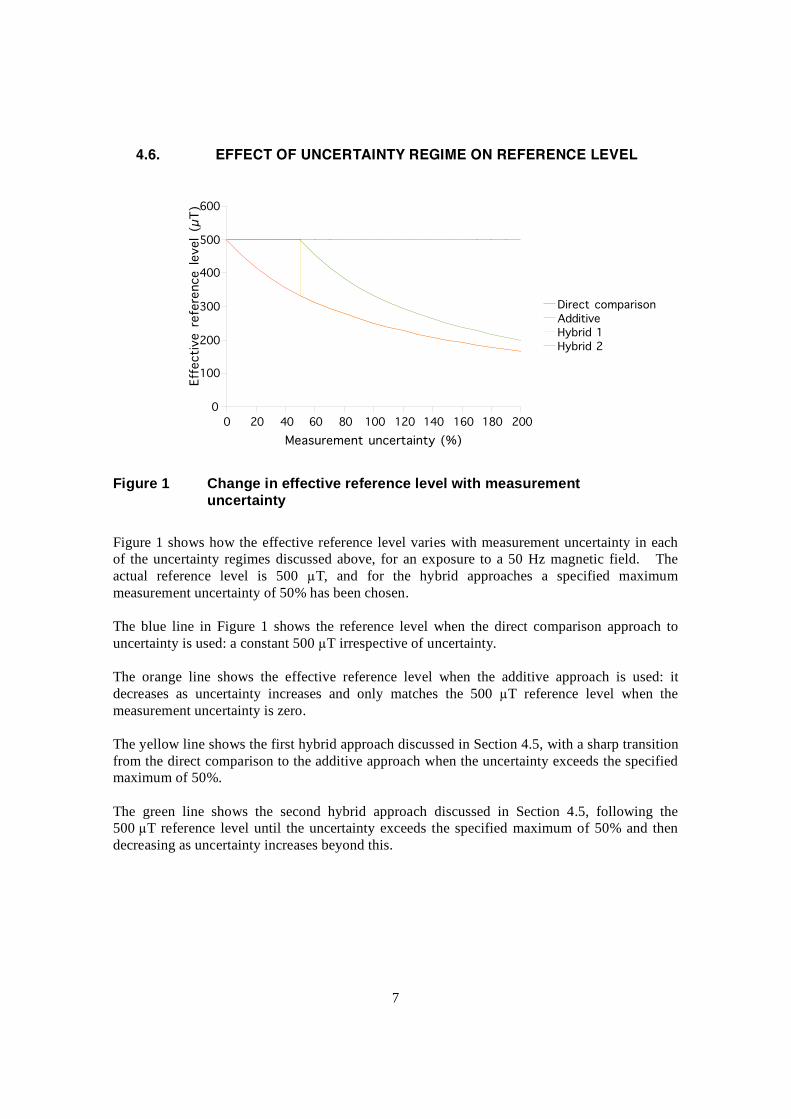
Figure 1 Change in effective reference level with measurement uncertainty
Figure 1 shows how the effective reference level varies with measurement uncertainty in each of the uncertainty regimes discussed above, for an exposure to a 50 Hz magnetic field. The actual reference level is 500 µT, and for the hybrid approaches a specified maximum measurement uncertainty of 50% has been chosen.
The blue line in Figure 1 shows the reference level when the direct comparison approach to uncertainty is used: a constant 500 µT irrespective of uncertainty.
The orange line shows the effective reference level when the additive approach is used: it decreases as uncertainty increases and only matches the 500 µT reference level when the measurement uncertainty is zero.
The yellow line shows the first hybrid approach discussed in Section 4.5, with a sharp transition from the direct comparison to the additive approach when the uncertainty exceeds the specified maximum of 50%.
The green line shows the second hybrid approach discussed in Section 4.5, following the 500 µT reference level until the uncertainty exceeds the specified maximum of 50% and then decreasing as uncertainty increases beyond this.
7
5. ACCEPTABILITY TO SOCIAL PARTNERS (EMPLOYERS, WORKERS AND REGULATORS) OF EACH REGIME
5.1. DIRECT COMPARISON UNCERTAINTY REGIME This approach is likely to be acceptable to many employers because it does not necessarily require a very formal assessment of uncertainty (see Appendix A on the requirements of the CENELEC standards EN590499 and 509413 in this respect) and allows simple techniques for exposure assessment to be used. Where assessment uncertainty is high (as in many industrial situations) it is likely to be easier to show compliance with exposure restriction using the direct comparison approach than it would be with the additive approach.
It may be less acceptable to workers because it may appear less protective than the additive approach – even with a very great uncertainty the exposure is complaint with the limits. This may be less of a problem where there is a constraint on the maximum allowed uncertainty - such as the 30% permitted in the CENELEC standard EN50361 – but in many industrial situations the maximum allowed uncertainty could be high.
Some regulators - particularly those in Germany and Denmark – have in the past opposed the direct comparison approach because they do not consider it sufficiently protective. Regulators in other countries have favoured it because it is a practical approach which can be applied easily and which will not present an undue burden to employers (see discussion of the additive approach in situations where uncertainty is high).
Many employers will be cautious of assessments which are not accepted by workers, and particularly cautious of assessments that are not accepted by regulators.
A modification to make this approach more acceptable would be to require an assessment of uncertainty even if no constraints are put on it – this is essentially what is done in EN50413 (see Appendix A) . That modification would help to ensure that the quality of a particular assessment technique was established, leaving an employer or regulator to judge the acceptable level of uncertainty (if a standard that specifies allowed uncertainty is not used).
5.2. ADDITIVE UNCERTAINTY REGIME The additive approach may be the most acceptable to some workers because it appears to offer more of a guarantee that exposure guidelines or restrictions will not be exceeded. In situations where exposure levels are low and/or techniques of exposure assessments with small uncertainties can be used, the approach may be attractive to some employers precisely because it does appear more conservative. Where the uncertainty is high, the additive approach may be less attractive to both employers and regulators because it means that the effective exposure guideline or restriction is lowered and the potential impact of any regulation will be greater. In industrial situations, where uncertainty may be very large, it may render regulation unenforceable, which it could be argued is actually less protective of workers than enforceable regulation.
It should be noted that because of the statistical nature of uncertainty, the additive approach does not necessarily guarantee compliance with the exposure restriction.
The additive approach has the disadvantage that it does not provide coherence with existing emission and exposure information (see Section 4.2).
8
5.3. HYBRID UNCERTAINTY REGIME A hybrid approach, as described in Section 4.5, may be particularly appealing to regulators because it avoids the obvious problems of an unmodified direct comparison approach - the lack of constraints on quality of assessment – and also the problems of the additive approach – the tendency for the exposure guidelines or restrictions to be effectively lowered by an amount equivalent to the uncertainty. It does rely on maximum allowed uncertainties being specified for each assessment technique, and this is unlikely to be achieved. However, this may be the easiest approach to apply for those technologies where standards bodies such as CENELEC have produced assessment standards which include maximum permitted uncertainties. This approach would not avoid the criticism that the direct comparison approach explicitly allows exposures to exceed the relevant guideline or restriction and on this basis may be less acceptable to some workers.
This approach also has the advantage of coherence with existing emission and exposure information (see Section 4.2).
9
6. SUMMARY
Uncertainty cannot be ignored, because it gives confidence to an EMF assessment. CENELEC EMF assessment standards, and accepted best practice, require that an assessment of uncertainty is made.
It is likely that advice will be needed on which uncertainty management regime is appropriate for the UK, whether this is for any implementation of the EMF Directive or for use in conjunction with existing HPA-RPD guidance.
There are two basic approaches to managing uncertainty associated with EMF assessments: the direct comparison (or shared risk) approach and the additive approach.
It is possible to modify these approaches, or to develop a hybrid which may avoid the most serious disadvantages of each.
The direct comparison approach is likely to be more compatible with simplified measurement and analysis techniques, and may lower the financial and organisational impact of any EMF assessment. Without constraints it could also allow measurements of essentially uncontrolled quality to be used, with a concomitant loss of confidence in the validity of the assessment. If it is used in conjunction with a requirement for an assessment of uncertainty then the quality of the assessment technique would be established. If, in addition, a maximum allowed assessment uncertainty is specified then the direct comparison approach can be used in a high-confidence assessment.
The additive approach requires an employer to establish a formal uncertainty budget, which complicates the overall assessment procedure, but means that there can always be confidence in the validity of the EMF exposure assessment. It is often suggested that this approach ensures that exposures cannot exceed the relevant guideline or limit, but because of the statistical nature of uncertainty this is not actually so. If the uncertainty is high, as it is likely to be in workplace measurements, the additive approach would cause allowed exposure levels to be lowered dramatically, and the concomitant impact on industry of meeting EMF exposure guidelines or regulations could be significantly greater.
It is possible to develop variants on the direct comparison approach which also incorporate aspects of the additive approach. This should improve the over-all quality of the EMF assessment, because the uncertainty has to be determined, and also means that, as long as the allowed uncertainty is not excessively large, there can be reasonable confidence that the exposure guideline or restriction will be not be exceeded by a large amount. It also means that, as long as the uncertainty is below the specified maximum, the effective exposure limit or guideline is not reduced and it allows an employer to use an assessment method with a high uncertainty - perhaps one that is simple or low-cost -if the exposure level is sufficiently low. There is no technical reason to favour any particular hybrid approach over any other, and the details of such approaches can be decided within the context of the appropriate regulatory regime
The direct comparison approach, and variants on it, are likely to allow greater coherence with existing emission and exposure information than the additive approach.
10
The direct comparison approach is likely to be the most acceptable to some employers, although some employers may not favour it because the over-all acceptability of the EMF assessment may appear to be undermined. A variant in which the uncertainty has to be assessed even if it is not considered further might mitigate this problem and make it more favoured by employers and workers.
The additive approach may be the most acceptable to some workers. In situations where exposure levels are low and/or techniques of exposure assessments with small uncertainties can be used, the approach may be attractive to some employers, but where uncertainties are high it is likely to be very unpopular with employers. It may also be perceived as decreasing the permitted exposure levels and this may be unacceptable to both employers and regulators.
A hybrid approach is the most likely to be acceptable in principle to employers and workers, because the more obvious difficulties of the direct comparison and additive approaches can be avoided. However, such an approach is likely to be more complex than either of the other approaches, and would require maximum uncertainties to be specified for all exposure situations.
11
7. REFERENCES
1. ICNIRP, 1998. Guidelines on limiting exposure to time-varying electric, magnetic and electromagnetic fields. Health Physics, 74(4) 494.
2. NRPB, 2004. Advice on limiting exposure to electromagnetic fields (0 - 300 GHz). (Documents of the NRPB, 15, no. 2). Chilton, Oxon, UK: National Radiological Protection Board.
3. Minimum health and safety requirements regarding the exposure of workers. Directive 2004/40/EC of the European Parliament and of the Council on the workers to the risks arising from physical agents (electromagnetic fields) (18th individual Directive within the meaning of Article 16(1) of Directive 89/391/EEC).
4. CENELEC EN50499: Assessment of the exposure of workers to electromagnetic fields.
5. CENELEC EN50360: Product standard to demonstrate the compliance of mobile phones with the basic restrictions related to human exposure to electromagnetic fields (300 MHz - 3 GHz)
6. COUNCIL RECOMMENDATION 1999/519/EC of 12 July 1999 on the limitation of exposure of the general public to electromagnetic fields (0 Hz to 300 GHz)
12
APPENDIX A: EXAMPLES OF UNCERTAINTY ASSESSMENTREGIMES IN CENELEC EMF STANDARDS
It is not the intention of this report to describe how to make an assessment of uncertainty: that is a subject that has a comprehensive literature of its own. This appendix, and those that follow it, contain examples of uncertainty assessment from three standards that have been produced by CENELEC Technical Committee 106X (which is responsible for standards related to EMF in the human environment):
• EN50499, the Worker’s EMF standard intended to be used with the EMF Directive;
• EN50413, the default measurement standard intended to be used with EN50499 if there is not a more suitable product or workplace EMF assessment standard;
• EN50361, a laboratory standard for the EMF assessment of mobile phones and radios.
EN50499
CENELEC EN50499:2008. Procedure for the assessment of the exposure of workers to electromagnetic fields
This standard has possibly the least stringent uncertainty regime of any CENELEC EMF standard. It simply says (Section 4.4):
As a part of the assessment process, measurements and/or calculations shall be associated with an uncertainty evaluation. Assessment uncertainty shall be reported… and it shall be taken into account when performing compliance evaluation according to national regulation in relation to the implementation of the directive.
This standard does not contain detailed measurement or calculation procedures, but instead allows the use of procedures, and uncertainty regimes, from other assessment standards. The default assessment standard – to be used if there is no specific technology or industry-sector appropriate standard – is EN50413.
13
EN50413
CENELEC EN50413:2008. Basic standard on measurement and calculation procedures for human exposure to electric, magnetic and electromagnetic fields (0 Hz – 300 GHz)
This standard does specify that uncertainty must be determined, for both measurement and calculation. The normative (mandatory) part of it says (sections 5.5 and 6.3):
Uncertainty General remarks
The uncertainty of the measurement shall be specified (see Annex C).
Evaluating uncertainties
The uncertainties in the assessment method shall be evaluated. Annex C provides information on how this can be done.
Examples of typical uncertainties
The following measurement uncertainties are typical examples. There may be other uncertainties, which are not listed, and some of the listed uncertainties may not be present or may not be significant in the overall assessment.
Measurement uncertainties: • size and shape of the measurement probe; • the actual position of the probe in relation to the planned measurement point; • calibration or stated accuracy of the measurement instrument; • interaction between the equipment under evaluation and the measurement system; • repeatability; • effect of the environment during the measurement.
Uncertainty of calculations When performing calculations, the uncertainty of the result has to be specified. Some major sources of calculation uncertainty are given below: • numerical uncertainties; • modelling uncertainty of the source of exposure; • uncertainty of the phantom model (shape, dimension); • uncertainty of tissue and material properties.
Annex C of EN50413 is informative – that means that it is not mandatory to use it. This Annex contains a general account of the principles of uncertainty but does not specify how it should be assessed. It gives examples of how to produce an overall uncertainty budget for an assessment and explains the terminology of uncertainty. Annex C of EN509413 is reproduced in Appendix B of this report.
14
EN50361
CENELEC EN50361:2001. Basic standard for the measurement of SAR related to human exposure to EMF from mobile phones (300 MHz – 3 GHz)
EN50361 has been superseded by EN62209-1, which is derived from an IEC standard, but is still an extant standard, and the two standards treat uncertainty very similarly.
EN50361 is of interest because it was the first EMF standard that specified in detail how an uncertainty assessment should be made. It is mandatory to prepare an uncertainty budget (see Appendix B for more details) and to derive an overall uncertainty value.
The specific sources of uncertainty that must be quantified are:
• Measurement Equipment o Calibration o Isotropy o Linearity o Detection limits o Boundary effect o Measurement device o Response time o Noise o Integration time
• Mechanical constraints o Scanning system o Phantom shell o Matching between probe and phantom o Positioning of the phone
• Physical Parameters o Liquid conductivity (deviation from target) o Liquid conductivity (measurement error) o Liquid permittivity (deviation from target) o Liquid permittivity (measurement error) o Drifts in output power of the phone, probe, temperature and humidity o Perturbation by the environment
• Post-Processing o SAR interpolation and extrapolation o Maximum SAR evaluation
The uncertainty contributions from each of these sources must be combined in a very specific and formalised way to give an expanded uncertainty with a confidence of 95%. EN50361 requires that the overall expanded uncertainty of the SAR assessment is below 30%. This is an example of the direct comparison approach to uncertainty.
Section 7 of EN50361, which addresses uncertainty, is reproduced in Appendix C of this report.
15

APPENDIX B: ANNEX C OF EN50413
16
Annex C of EN50413 (informative)
Uncertainty assessment for the measurement of EMF
C.1 Steps in establishing an uncertainty budget
C.1.1 Selection of uncertainty contributions
An uncertainty budget is a list of the probable sources of error combined with an estimation for their uncertainty and a distribution of their probability. If there is any doubt about whether a contribution is significant or not, it should be included in the uncertainty budget in order to demonstrate that it has been considered. Most uncertainty contributions will not be the same for the complete range of measurements. Therefore it is necessary to re-evaluate the budget used for every type of measurement equipment and measuring task. However, for the ease of use, it might be appropriate to use only a single budget covering the complete range of equipment and tasks as long as all major factors are accounted for and the overestimation of the uncertainty does not create the necessity for additional measures. This approach should not be used if limit values are exceeded.
C.1.2 Classes of uncertainty contributions
There are two major groups of uncertainty contributions: • random effects result in errors that vary in an unpredictable way while the measurement is
being made or is repeated under the same conditions. The uncertainty associated with these contributions can be evaluated by statistical techniques from repeated measurements;
• contributions to uncertainty arising from systematic effects are those that remain constant while the measurement is being made but can change if the measurement conditions, method or equipment is altered.
Normally, all corrections that can be applied to the measured result should be applied. However, in some cases it may be impractical or unnecessary to correct for all known errors. For example, the calibration certificate for a receiver may give actual measured input results at specific readings, with an associated uncertainty. It is possible to correct subsequent readings by using this calibration to achieve the lowest possible uncertainty. However, it is more practical to use indicated values with no corrections applied, in which case the manufacturer's specified uncertainty should be used, provided it has been confirmed by an accredited calibration.
The individual uncertainty contributions should be in terms of the variation in the quantity being measured, rather than the influence quantity, and all in the same units. Most EMF measurements are derived from readings using logarithmic scales e.g. dBµV, corrections for the gain or loss of system components are in dB, specification limits are generally given in dB and instrument specification limits are normally in dB. In these cases it is recommended that the uncertainty calculations are made in terms of dBs. In some cases, for example, where the addition of signals is the dominant contribution it may be more correct to calculate the uncertainty in terms of absolute values, e.g. V/m.
It is relatively straightforward to assign a value to the uncertainty contribution when there is already evidence on which to base the value, such as a calibration certificate or manufacturer's specification. In other cases there may be little or no data available and estimation has to be made based on experience or on other relevant published material.
Most contributions to uncertainty can be adequately represented by a symmetrical distribution about the nominal or measured result, for instance the uncertainty attributed to a receiver.
17
However, some contributions are not symmetrical and these are most simply dealt with by calculating separate positive and negative values for the total uncertainty. The decision on whether this is appropriate will depend on the difference between the two values and the need for rigor in the uncertainty estimation. An example of an asymmetric uncertainty is the addition of two signals at the same frequency where the resultant is dependent on their relative phase, as occurs with multiple reflections in a screened room and mismatch uncertainty.
C.1.3 Probability distribution and standard uncertainty of each contribution
The probability distribution of an uncertainty describes the variation in probability of the true value lying at any particular difference from the measured or assigned result. The form of the probability distribution will not necessarily be a regular geometric shape and an assumption has to be made, based on prior knowledge or theory that it approximates to one of the common forms. It is then possible to calculate the standard uncertainty, u(xi), for the assigned form from simple equations. The four main distributions of interest to EMF measurement are normal, rectangular, triangular and U-shaped.
C.1.3.1 Normal
This distribution can be assigned to uncertainties derived from multiple contributions. For example, when an accredited calibration laboratory provides a total uncertainty for an instrument this will have been calculated at a minimum level of confidence of 95 % and can be assumed to be normal. The standard uncertainty for a value of uncertainty with assumed normal distribution is given by dividing the value of uncertainty uN by the coverage factor k, appropriate to the stated level of confidence:
x u i ) = uN( k
For a reported level of confidence of 95 %, the coverage factor k = 1,96 or approximately 2.
Typical examples for normal distributions are calibration uncertainties or the reproducibility of measurements.
C.1.3.2 Rectangular
This distribution means that there is equal probability of the true value lying anywhere between the prescribed limits. A rectangular distribution should be assigned where a manufacturer's specification limits are used as the uncertainty, unless there is a statement of confidence associated with the specification, in which case a normal distribution can be assumed.
For rectangular distributions the standard uncertainty results to
u (x )= i 3 a i
where
ai is the semi-range limit value of the individual uncertainty contribution.
Typical examples for rectangular distributions are instrument reading, linearity and isotropy uncertainties.U-shaped
C.1.3.3 U-shaped
This distribution is applicable to mismatch uncertainty. The value of the limit for the mismatch uncertainty M associated with the power transfer at a junction is obtained from
18
%
M = 20 log10(1± !G " ! L ) dB or
)2M = 100 !(1± "G # " L $ 1 % ]
where !G and !L are the reflection coefficients for the source and load. In log presentation (dB) the mismatch uncertainty is asymmetric regarding the measurement result. If in the relevant expression of the above formulas the minus symbol is used (instead of the plus symbol) this always gives the larger absolute value. However, the difference between the two values is often insignificant and therefore it is acceptable to use the larger of the two limits i.e.
20 log10(1± !G " ! L )
in order to obtain a value for uncertainty which is symmetric around the measurement result.
For U-Shaped Distributions the standard uncertainty results to
2Mu( xi = )
C.1.3.4 Triangular
This distribution means that there is greater probability of the true value lying centrally between two prescribed limits. A triangular distribution should be assigned • where the contribution has a distribution with defined limits and • where the majority of the values within the limits lie around the central point.
For triangular distributions the standard uncertainty results to
6 ia(x u i ) =
where ai is the semi-range limit value of the individual uncertainty contribution.
C.1.4 Combined standard uncertainty
C.1.4.1 Sensitivity coefficients
In some cases the input quantity to the process may not be in the same units as the output quantity. For example, the uncertainty in the measurement distance on an open site should be converted to the uncertainty in the received signal strength. In this case the input quantity is length, but the output quantity is electric. It is therefore necessary to introduce a sensitivity coefficient so that the output quantity (y), can be related to the input quantity (xi). This sensitivity coefficient is referred to as ci. The sensitivity coefficient is effectively a conversion factor from one unit to another. The relationship between the input quantity and the output quantity may not be linear. The partial derivative !f /! xi can be used to obtain the sensitivity coefficient and this is one of the reasons that mathematical modelling is used to describe measurement systems. In practice the derivation of the partial derivatives can be difficult and the effort involved is not always justified by the results obtained. A linear approximation such as the quotient Δ f/Δxi, where Δf is the change in f resulting from a change Δxi in xi, is often sufficient.
C.1.4.2 Correlated input quantities
The combined standard uncertainty of the output estimate will only apply when there is no correlation between any of the input estimates, that is, the input quantities are independent of each other. It may be the case that some input quantities are affected by the same influence
19
20
quantity, e.g. temperature, or by the errors in a particular instrument that is used for separate measurements in the same process. In such cases the input quantities are not independent of each other and the equation for obtaining the standard uncertainty of the output estimate shall be modified. However, as mentioned previously, if correlation between any contributions is known or suspected then the most straightforward approach is to sum the standard uncertainty of these contributions arithmetically. ENV 13005 [C1] should be referred to if a more detailed approach is required.
C.1.4.3 Combined standard uncertainty
The combined uncertainty uc(y) is obtained by taking the square root of the sum of squares of the individual standard uncertainties. If any of the standard uncertainties are not already in terms of the measured quantity then they should be converted using the appropriate sensitivity coefficient, ci, then:
)()( iii xucyu !=
Any contributions with known or suspected adverse correlation should be added together, then for m contributions:
)(yu = (y)u 2m
1=c i
i!
C.1.5 Expanded uncertainty
The expanded uncertainty, U, defines an interval about the measured result that will encompass the true value with a specified level of confidence, p %. The expanded uncertainty is obtained by multiplying the combined standard uncertainty by coverage factor, k, thus:
U = k u (y)c The recommended level of confidence is 95 %, which can be obtained with k = 1,96.
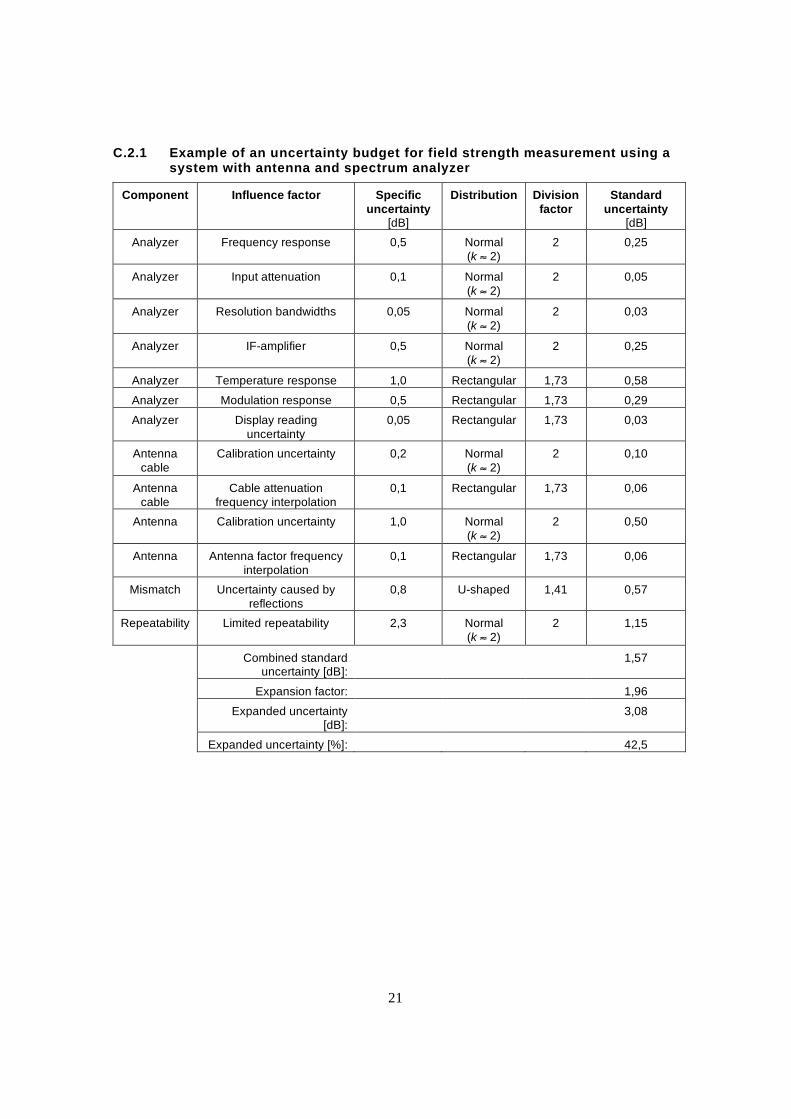
C.2 Examples for uncertainty budgets
The following simple examples give a practical guideline to set-up an uncertainty budget for EMF measurements in the high frequency range using different equipment. These are real examples from actual measurement situations and will not be representative for other situations. The first example shows an uncertainty calculation with logarithmic values, the second example is done in linear scale.
21
C.2.1 Example of an uncertainty budget for field strength measurement using a system with antenna and spectrum analyzer
Component Influence factor Specific uncertainty
[dB]
Distribution Division factor
Standard uncertainty
[dB] Analyzer Frequency response 0,5 Normal
(k ≈ 2) 2 0,25
Analyzer Input attenuation 0,1 Normal (k ≈ 2)
2 0,05
Analyzer Resolution bandwidths 0,05 Normal (k ≈ 2)
2 0,03
Analyzer IF-amplifier 0,5 Normal (k ≈ 2)
2 0,25
Analyzer Temperature response 1,0 Rectangular 1,73 0,58
Analyzer Modulation response 0,5 Rectangular 1,73 0,29
Analyzer Display reading uncertainty
0,05 Rectangular 1,73 0,03
Antenna cable
Calibration uncertainty 0,2 Normal (k ≈ 2)
2 0,10
Antenna cable
Cable attenuation frequency interpolation
0,1 Rectangular 1,73 0,06
Antenna Calibration uncertainty 1,0 Normal (k ≈ 2)
2 0,50
Antenna Antenna factor frequency interpolation
0,1 Rectangular 1,73 0,06
Mismatch Uncertainty caused by reflections
0,8 U-shaped 1,41 0,57
Repeatability Limited repeatability 2,3 Normal (k ≈ 2)
2 1,15
Combined standard uncertainty [dB]:
1,57
Expansion factor: 1,96
Expanded uncertainty [dB]:
3,08
Expanded uncertainty [%]: 42,5
22
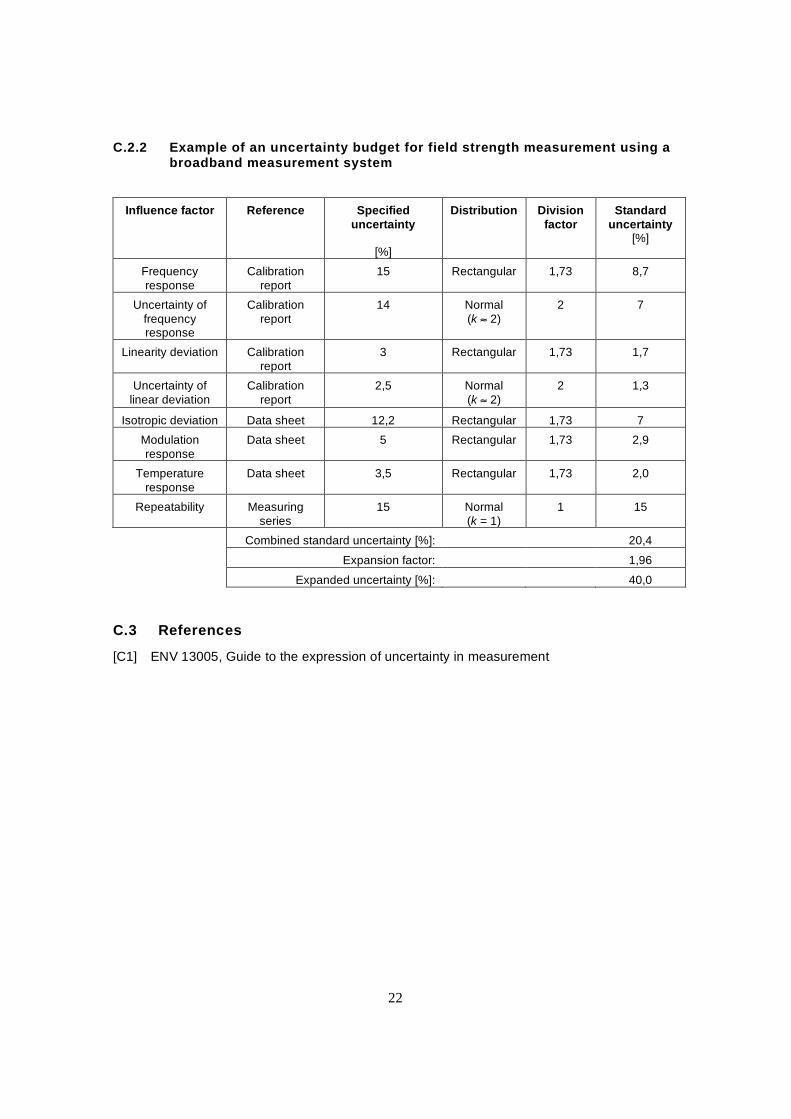
C.2.2 Example of an uncertainty budget for field strength measurement using a broadband measurement system
Influence factor Reference Specified
uncertainty
[%]
Distribution Division factor
Standard uncertainty
[%]
Frequency response
Calibration report
15 Rectangular 1,73 8,7
Uncertainty of frequency response
Calibration report
14 Normal (k ≈ 2)
2 7
Linearity deviation Calibration report
3 Rectangular 1,73 1,7
Uncertainty of linear deviation
Calibration report
2,5 Normal (k ≈ 2)
2 1,3
Isotropic deviation Data sheet 12,2 Rectangular 1,73 7 Modulation response
Data sheet 5 Rectangular 1,73 2,9
Temperature response
Data sheet 3,5 Rectangular 1,73 2,0
Repeatability Measuring series
15 Normal (k = 1)
1 15
Combined standard uncertainty [%]: 20,4
Expansion factor: 1,96
Expanded uncertainty [%]: 40,0
C.3 References
[C1] ENV 13005, Guide to the expression of uncertainty in measurement

23
APPENDIX C: UNCERTAINTY APPROACH OF EN50361
24
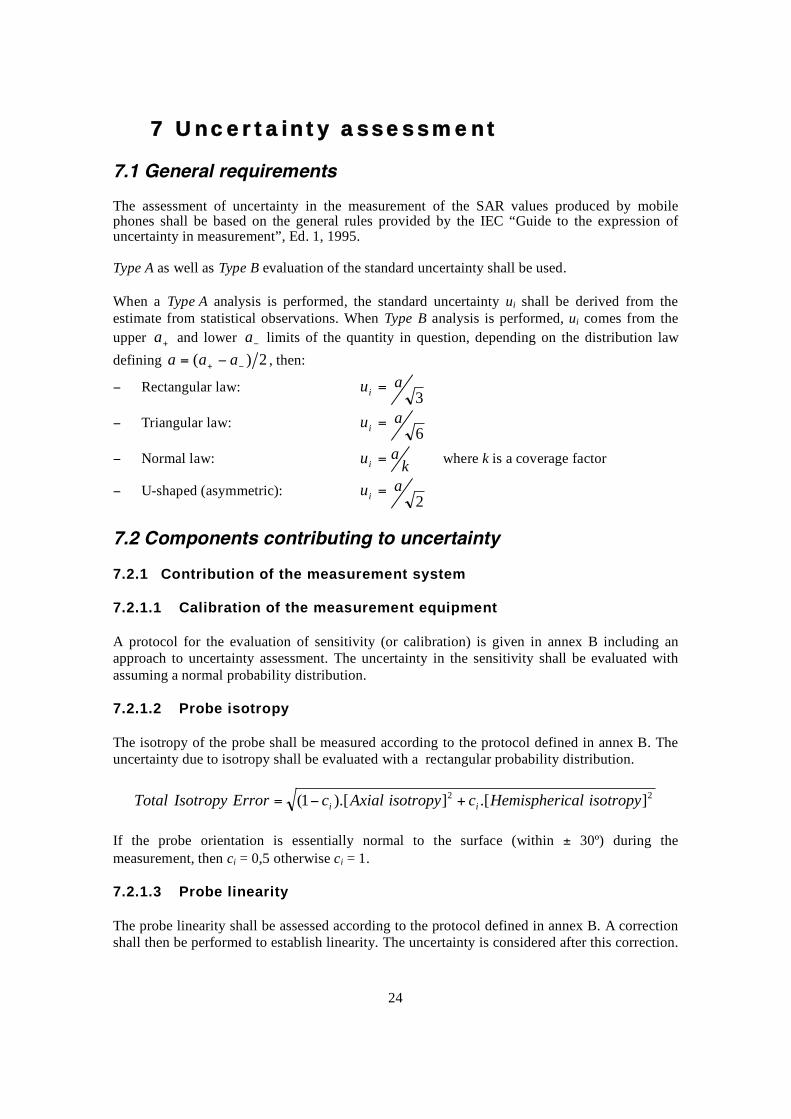
7 Uncertainty assessment 7.1 General requirements The assessment of uncertainty in the measurement of the SAR values produced by mobile phones shall be based on the general rules provided by the IEC “Guide to the expression of uncertainty in measurement”, Ed. 1, 1995. Type A as well as Type B evaluation of the standard uncertainty shall be used. When a Type A analysis is performed, the standard uncertainty ui shall be derived from the estimate from statistical observations. When Type B analysis is performed, ui comes from the upper +a and lower !a limits of the quantity in question, depending on the distribution law defining 2)( !+ != aaa , then:
− Rectangular law: 3
aui =
− Triangular law: 6
aui =
− Normal law: kaui = where k is a coverage factor
− U-shaped (asymmetric): 2
aui =
7.2 Components contributing to uncertainty 7.2.1 Contribution of the measurement system 7.2.1.1 Calibration of the measurement equipment A protocol for the evaluation of sensitivity (or calibration) is given in annex B including an approach to uncertainty assessment. The uncertainty in the sensitivity shall be evaluated with assuming a normal probability distribution. 7.2.1.2 Probe isotropy The isotropy of the probe shall be measured according to the protocol defined in annex B. The uncertainty due to isotropy shall be evaluated with a rectangular probability distribution.
22 ].[]).[1( isotropycalHemisphericisotropyAxialcErrorIsotropyTotal ii +!= If the probe orientation is essentially normal to the surface (within ± 30º) during the measurement, then ci = 0,5 otherwise ci = 1. 7.2.1.3 Probe linearity The probe linearity shall be assessed according to the protocol defined in annex B. A correction shall then be performed to establish linearity. The uncertainty is considered after this correction.
25
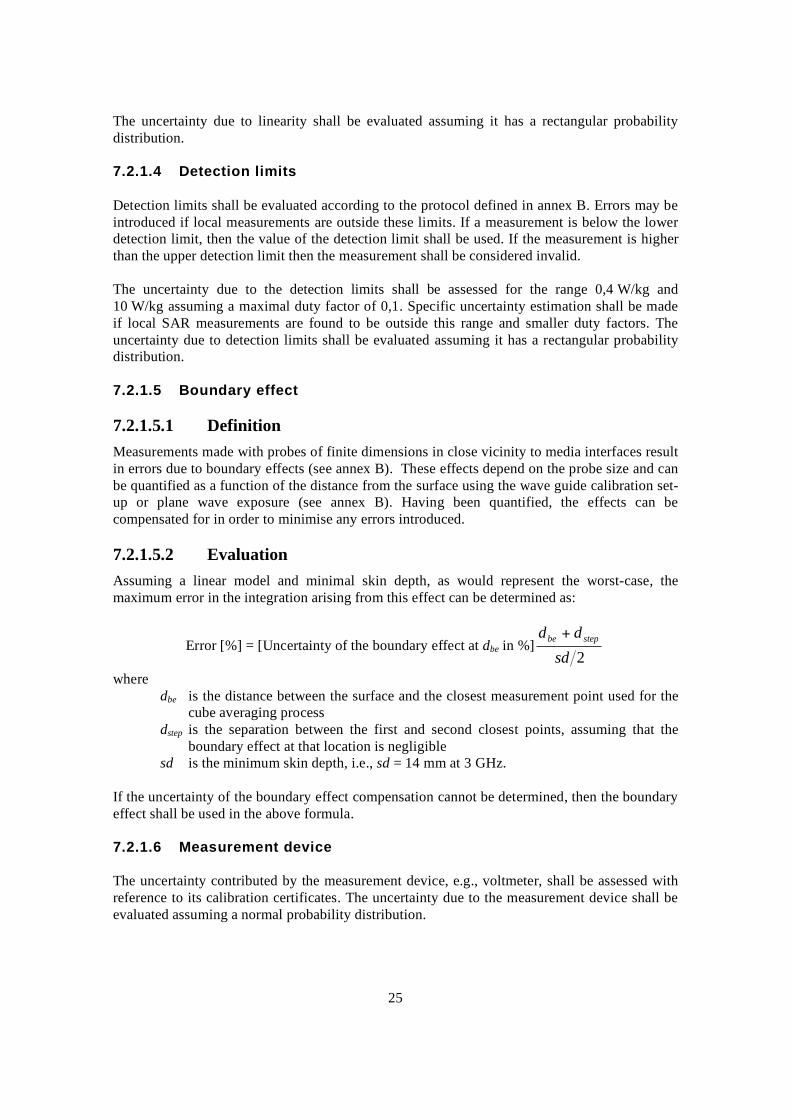
The uncertainty due to linearity shall be evaluated assuming it has a rectangular probability distribution. 7.2.1.4 Detection limits Detection limits shall be evaluated according to the protocol defined in annex B. Errors may be introduced if local measurements are outside these limits. If a measurement is below the lower detection limit, then the value of the detection limit shall be used. If the measurement is higher than the upper detection limit then the measurement shall be considered invalid. The uncertainty due to the detection limits shall be assessed for the range 0,4 W/kg and 10 W/kg assuming a maximal duty factor of 0,1. Specific uncertainty estimation shall be made if local SAR measurements are found to be outside this range and smaller duty factors. The uncertainty due to detection limits shall be evaluated assuming it has a rectangular probability distribution. 7.2.1.5 Boundary effect 7.2.1.5.1 Definition Measurements made with probes of finite dimensions in close vicinity to media interfaces result in errors due to boundary effects (see annex B). These effects depend on the probe size and can be quantified as a function of the distance from the surface using the wave guide calibration set-up or plane wave exposure (see annex B). Having been quantified, the effects can be compensated for in order to minimise any errors introduced. 7.2.1.5.2 Evaluation Assuming a linear model and minimal skin depth, as would represent the worst-case, the maximum error in the integration arising from this effect can be determined as:
Error [%] = [Uncertainty of the boundary effect at dbe in %]2sddd stepbe +
where dbe is the distance between the surface and the closest measurement point used for the
cube averaging process dstep is the separation between the first and second closest points, assuming that the
boundary effect at that location is negligible sd is the minimum skin depth, i.e., sd = 14 mm at 3 GHz.
If the uncertainty of the boundary effect compensation cannot be determined, then the boundary effect shall be used in the above formula. 7.2.1.6 Measurement device The uncertainty contributed by the measurement device, e.g., voltmeter, shall be assessed with reference to its calibration certificates. The uncertainty due to the measurement device shall be evaluated assuming a normal probability distribution.
26
7.2.1.7 Response time Response time shall be evaluated according to the protocol defined in annex B. The uncertainty arising from the response time shall be neglected if the probe is stationary for a time period greater than twice the response time before the measured SAR is logged. 7.2.1.8 Noise 7.2.1.8.1 Definition This is the signal detected by the measurement system even if the phone is not transmitting. The sources of these signals include RF noise, ELF noise (lighting systems, the scanning system, grounding of the laboratory power supply, etc.), electrostatic effects (movement of the probe, people walking, etc.) and other effects (light detecting effects, temperature, etc.) 7.2.1.8.2 Evaluation
The noise level shall be determined by three different coarse scans with the RF source switched off. None of the evaluated points shall exceed 0,02 W/kg. This test shall be repeated periodically (preferably every second month). Within this constraint, the uncertainty due to noise shall be neglected. 7.2.1.9 Integration time The integration time may introduce additional error if the mobile phone is not emitting a continuous wave (CW) signal. This uncertainty depends on the signal characteristics and must be evaluated prior to any SAR measurements. If a non-CW signal is used, then the uncertainty introduced must be taken into account in the global uncertainty assessment. The uncertainty due to integration time shall be evaluated assuming it has a rectangular probability distribution. Example of evaluation for a GSM signal :
For an integration time of intt , if 2 pulses are missed, this induces the following uncertainty:
int
3106,4.2txu
!
=
27
7.2.2 Contribution of mechanical constraints Scanning system The mechanical constraints of the scanning system introduce uncertainty to the SAR measurements through the accuracy and repeatability of positioning. These parameters shall be assessed with reference to the scanning system’s specifications. The uncertainty contribution dss to the averaged SAR value (rectangular distribution) is then calculated based on the minimum skin depth sd, i.e., sd = 14 mm at 3 GHz and first-order approximation:
Error SAR [%] = 2
100sddss
Phantom shell The shape and the thickness of the phantom shell shall be specified. The uncertainty contribution dph to the averaged SAR value (rectangular distribution) is then calculated based on the minimum skin depth sd, i.e., sd = 14 mm at 3 GHz and first-order approximation:
Error SAR [%] = 2
100sdd ph
Matching between probe and phantom references Before each scan the alignment between position of the probe and the phantom shall be verified using the three reference points R1, R2 and R3 described in 5.2.3. The uncertainty is calculated by the maximum mis-alignment at all three points dmis and the uncertainty contribution to the averaged SAR value (rectangular distribution) is then calculated based on the minimum skin depth sd, i.e., sd = 14 mm at 3 GHz and first-order approximation:
Error SAR [%] = 2
100sddmis
Positioning of the phone 7.2.2.4.1 Definition This is the uncertainty in the spatial peak SAR that occurs as a result of uncertainty in the positioning of the phone with respect to the phantom. It only depends on the positioner and can be determined from the positioner specification. 7.2.2.4.2 Evaluation Three devices that provide significantly different SAR distributions shall be used for this test. The tests shall be conducted on the left head side for both positions. Three people shall perform 4 evaluations of spatial peak SAR each at both positions whereby the device shall be de-mounted and newly positioned before each tests. A statistical analysis shall be provided for each
28
device at each position (i.e., at least 12 tests at each position for each device). The mobile phone positioning uncertainty is the largest standard deviation determined by this evaluation. The uncertainty due to the phone positioning shall be evaluated assuming it has a normal probability distribution. 7.2.3 Contribution of physical parameters Liquid density The electromagnetic parameters of the tissue equivalent liquids have been evaluated assuming they have a density of 1 000 kg/m3. This density shall be used for SAR evaluation and the uncertainty introduced by the assumption shall be considered negligible. Liquid conductivity The uncertainty due to the liquid conductivity arises from two different sources. The first source of error is the deviation of the liquid conductivity from its target value (max. ± 5 %) and the second source of error arises from the measurement procedures used to assess conductivity. The uncertainty shall be assessed using a rectangular probability For 10 g averaging, the maximum weighting coefficient for SAR is 0,5. Liquid permittivity The uncertainty due to the liquid permittivity arises from two different sources. The first source of error is the deviation of the liquid conductivity from its target value (max. ± 5 %) and the second source of error arises from the measurement procedures used to assess permittivity. The uncertainty shall be assessed using a rectangular probability. For 10 g averaging, the maximum weighting coefficient for SAR is 0,5. Drifts in output power of the phone, probe, temperature and humidity The drifts due to the electronics of the phone and the measurement equipment, as well as temperature and humidity, are controlled by the first and last step of the measurement process defined in 6.3 and the resulting error is less than ± 5 %. The uncertainty shall be evaluated assuming a rectangular probability distribution. Perturbation of the environment The perturbation of the environment results from various contributing factors: • reflection of waves in the laboratory, • influence of the EM properties of the phantom shell and the mobile phone holder, • background level of EM fields. The error is usually of ± 3 % and the uncertainty shall be evaluated assuming a rectangular probability distribution. 7.2.4 Contribution of post-processing This is the uncertainty caused by the implemented extrapolation, integration and averaging procedure assuming the local SAR are accurately measured at their correct positions.
29
Extrapolation and interpolation algorithms The uncertainty due to the extrapolation and interpolation algorithms shall be evaluated assuming a rectangular probability distribution. The relative uncertainty is evaluated using the following formula (see annex C):
ref
referpextraperpolextra SAR
SARSARU
!=
int/int/ .100%
Four sets of 3D reference data, publicly available on CD-ROM, shall be used. These data sets represent the SAR, estimated by numerical methods, induced by two numerical models of mobile phone next to the phantom and two analytical functions (see annex C). Using these data sets, the « unknown data » have to be calculated using the « known data » with the interpolation and extrapolation process. In this way, the estimated SAR averaged over 10 g in a given cube shall be compared to the target value given by the reference data. Maximum SAR evaluation The uncertainty due to these shall be evaluated assuming a rectangular probability distribution. The relative uncertainty shall be evaluated using the following formula (see annex C):
ref
refestimatedfinding SAR
SARSARU
max
maxmaxmax .100%
!=
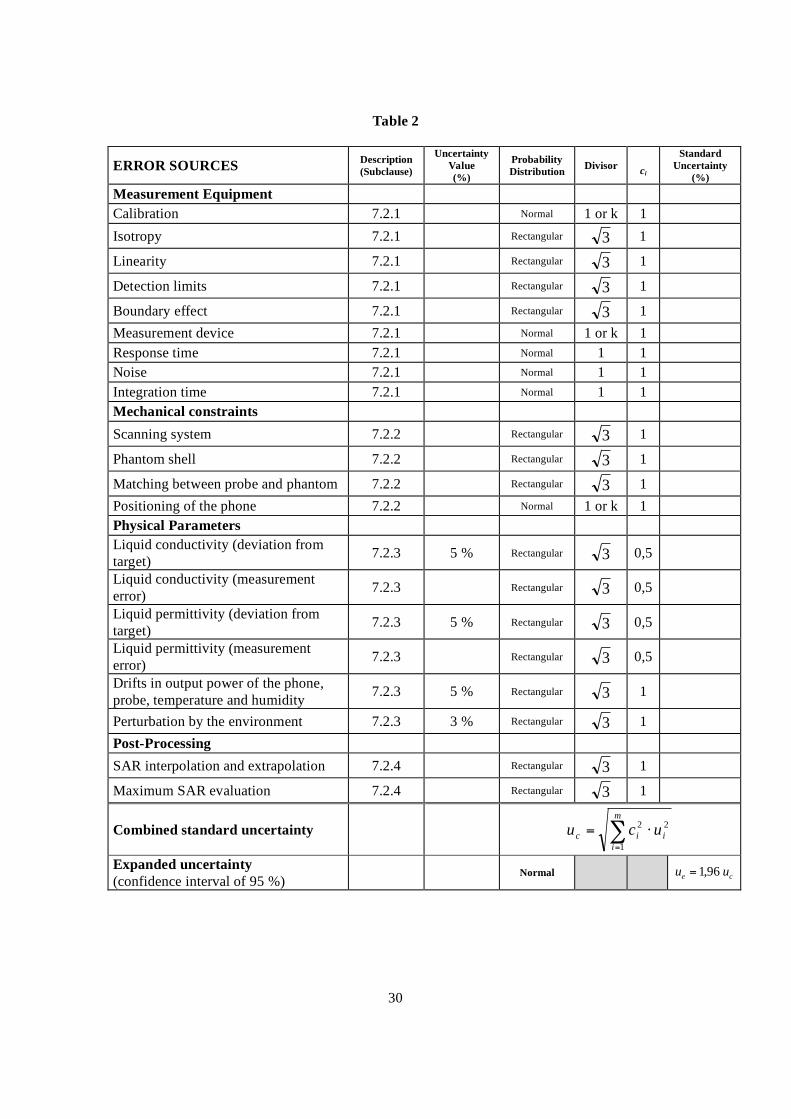
Four sets of 3D reference data, publicly available on CD-ROM, shall be used. These data sets represent the SAR induced by two numerical models of mobile phone next to the phantom and two analytical functions (see annex C). The reference data sets include target values for their maximum mass averaged SAR and these shall be compared with the maximum mass averaged SAR yielded by the averaging and maximum finding schemes under evaluation. 7.3 Uncertainty assessment Combined and expanded uncertainties The contributions of each component of uncertainty shall be registered with their name, probability distribution, sensitivity coefficient and uncertainty value. The results shall be recorded in a table of the following form. The combined uncertainty shall then be evaluated according to the following formula:
!=
"=m
iiic ucu
1
22
where ci is the weighting coefficient. The expanded uncertainty shall be evaluated using a confidence interval of 95 %.
30
Table 2
ERROR SOURCES Description (Subclause)
Uncertainty Value (%)
Probability Distribution Divisor ci
Standard Uncertainty
(%)
Measurement Equipment Calibration 7.2.1 Normal 1 or k 1 Isotropy 7.2.1 Rectangular 3 1
Linearity 7.2.1 Rectangular 3 1
Detection limits 7.2.1 Rectangular 3 1
Boundary effect 7.2.1 Rectangular 3 1 Measurement device 7.2.1 Normal 1 or k 1 Response time 7.2.1 Normal 1 1 Noise 7.2.1 Normal 1 1 Integration time 7.2.1 Normal 1 1 Mechanical constraints Scanning system 7.2.2 Rectangular 3 1
Phantom shell 7.2.2 Rectangular 3 1
Matching between probe and phantom 7.2.2 Rectangular 3 1 Positioning of the phone 7.2.2 Normal 1 or k 1 Physical Parameters Liquid conductivity (deviation from target) 7.2.3 5 % Rectangular 3 0,5
Liquid conductivity (measurement error) 7.2.3 Rectangular 3 0,5
Liquid permittivity (deviation from target) 7.2.3 5 % Rectangular 3 0,5
Liquid permittivity (measurement error) 7.2.3 Rectangular 3 0,5
Drifts in output power of the phone, probe, temperature and humidity 7.2.3 5 % Rectangular 3 1
Perturbation by the environment 7.2.3 3 % Rectangular 3 1 Post-Processing SAR interpolation and extrapolation 7.2.4 Rectangular 3 1
Maximum SAR evaluation 7.2.4 Rectangular 3 1
Combined standard uncertainty !=
"=m
iiic ucu
1
22
Expanded uncertainty (confidence interval of 95 %) Normal ce uu 96,1=
31
Maximum expanded uncertainty The expanded uncertainty with a confidence interval of 95 % shall not exceed 30 % for SAR values averaged over 10 g in the range from 0,4 to 10 W/kg.

32

33

Published by the Health and Safety Executive 07/08
Assessment uncertainties relating to electromagnetic fields (EMF) measurement and computation
Health and Safety Executive
RR649
www.hse.gov.uk
Guidelines for limiting occupational exposure to electromagnetic fields (EMF) have been produced by international organisations, and have been recommended for use in the UK by the Health Protection Agency (HPA). There is also an EU Directive (the EMF Directive) which sets restrictions on occupational exposure to electromagnetic fields and which is expected to be implemented in UK legislation by April 2012.
Technical standardisation bodies have produced assessment methods that can be used with these guidelines and with the EMF Directive. Neither the exposure restrictions nor the technical assessment standards specify how measurement and computation uncertainty should be considered as part of an over-all EMF assessment in the workplace.
This report describes possible uncertainty management regimes, and discusses the likely implications of these regimes for UK industry. Although it does not describe in detail how to make an assessment of uncertainty, its appendices contain examples of uncertainty assessment from three CENELEC EMF assessment standards.
This report and the work it describes were funded bythe Health and Safety Executive (HSE). Its contents, including any opinions and/or conclusions expressed, are those of the author alone and do not necessarily reflect HSE policy.