Embed Size (px)
Citation preview

International J. of Healthcare and Biomedical Research, Volume: 05, Issue: 03, April 2017, 62-69
62
www.ijhbr.com ISSN: 2319-7072
Original article:
Assessment of upper limb coordination using bruininks-oseretsky test of motor
proficiency, 2nd edition (bot-2), in 5-15 years school going children
*Apoorva D. Dighe, Dr.Sanjivani Dhote, Dr.Tushar Palekar, Antara Pande, Pooja Yengde,
Gurjit Singh
DR.D.Y.PATIL COLLEGE OF PHYSIOTHERAPY,PIMPRI PUNE-411018
Corresponding author*
ABSTRACT:
Background: The purpose of the study was to assess the upper limb coordination in school going children of 5-15 years
using Bruininks- Oseretsky test of motor proficiency. Motor skill is a learned series of movements that combine to produce a
smooth, efficient action. Coordination is achieved when subsequent parts of the same movement, or the movements of
several limbs or body parts are combined in manner that is well timed, smooth, and efficient with respect to the intended
goal.
Material and methods: A Cross sectional analytical study was conducted using BOT-2 Short Form. A multistage stratified
sampling of children (n=516) aged 5-15 years was done that included 268 females and 248 males.
Results: 516 children were assessed (268 females, mean age 10.69 years±3.04 & 248 males, mean age 10.66 years
±3.02).8.87 females showed well below average score whereas 1.87 males showed below average score.
Conclusion: The study concluded that performance of females was poor as compared to males. Children of 12, 13, 14 & 15
years showed better results than 5-11 years children.
Keywords: Upper limb coordination (ULC), Bruininks-Oseretsky test (BOT), Developmental Coordination Disorder
(DCD), Motor Coordination.
INTRODUCTION:
Motor development refers to the gradual process by
which a child gains use and coordination of the
large muscles of the legs, trunk and arms and the
smaller muscles of the hands.1The neuromuscular
development starts in embryonic stage which
continues after birth. According to studies done in
different parts of the world, development of motor
skill is associated with physical activity like
throwing or catching a ball, in both children and
adolescent.1Physical activity has been an additional
determinant of motor performance along with other
factors.
When subsequent parts of same movement, or the
movements of several limbs or body parts are
combined in a manner that is well timed, smooth,
and efficient with respect to the intended goal,
coordination is achieved.2 This involves the
integration of proprioceptive information detailing
the position and movement of musculoskeletal
system with the neural processes in the brain and
spinal cord that controls, plan and relay motor
coordination. Age plays a key role in upper limb
coordination. It allows a person to be involved in
the participation of sport with a reasonable amount
of success as it will aid fluid body movement for
skill performance.2
The participation in sport is
helpful in developing a social network and
achieving a sense of belonging in a community or
social setting as well as in maintaining self
regulation for daily tasks. Thus, children will be
able to maintain appropriate and controlled body
movement during task performance which reduces
the energy required and thus minimises fatigue.

International J. of Healthcare and Biomedical Research, Volume: 05, Issue: 03, April 2017, 62-69
56
www.ijhbr.com ISSN: 2319-7072
Upper limb coordination deficit is observed in
children with Development coordination
disorder(DCD), Learning Disabilities, Sensory
Integrative Dysfunction and other motor
impairments.3
In clinical practice, upper limb coordination
deficits in children are identified by observations of
poor coordination of two body sides, avoidance of
crossing of midline, failure to develop a preferred
hand and possibly right-left confusion.4
For
assessing this upper limb coordination many scales
are available such as,
Movement Assessment Battery for children
(Movement ABC-2)5 Peabody Development Motor
Scales (PDMS 2)5Maastrichtse Motoriek Test
(MMT)5
Bruininks-oseretsky Test of motor proficiency,
Second Edition (BOT-2)
It is an individually administered test that uses
engaging, goal- directed activities to measure a
wide array of motor skills in individuals of age 4-
21.The BOT-2 uses a subset and composite
structure that highlights motor performance in the
broad functional areas of stability, mobility,
strength, coordination and object manipulation. The
Bruininks-oseretsky Test of motor proficiency-
BOTMP,(Bruininks,1978) consists of 46 items
grouped under eight different subtests of motor
proficiency for children between 4 and 15 years of
age.4
The upper limb coordination subset of BOTMP is
the seventh subset under gross motor composite.
The scoring system varies with each item, ranging
from a 0- point (pass/ fail) to a 5-point scale. The
number of performance trials for each item is
specified. A raw score is recorded in the unit
measured (e.g. number of catches, dribbles) and
then converted to a numerical point score.6 This
motor –area composite measures control and
coordination of the arms and hands, especially for
object manipulation.6
The Upper Limb Coordination subtest consists of
activities designed to measure visual tracking with
coordinated arm and hand movement.
AIMS AND OBJECTIVES:
This study conducted with the aim:
To assess upper limb coordination using
Bruininks-oseretsky Test of motor proficiency,
Second Edition (BOT-2), in 5 to 15 years school
going children.
The objectives of the study were, to find out Upper
limb coordination point score and descriptive
category using Bruininks-Oseretsky Test of Motor
Proficiency, 2nd
edition, to find out upper limb
coordination point score and descriptive category
among males and females using Bruininks-
Oseretsky Test of Motor Proficiency, 2nd
edition
and find out upper limb coordination point score
and descriptive category, according to age groups
using Bruininks-Oseretsky Test of Motor
Proficiency, 2nd
edition.
MATERIAL AND METHODS:
Research committee of Dr. D.Y. Patil College of
Physiotherapy approved this study. The tools used
in this study were BOT-2 kit includes examiners
manual, individual record form, student booklet,
tennis ball and target. A table and chair of
appropriate to child’s height and clipboard were
additionally used.
Five hundred sixteen samples were assessed, in
which 268 were females (mean age 10.69
years±3.04) and 248 were males (mean age 10.66
years±3.02). Information provided by the class
teacher and school records were used to include the
5-15 years old children in five groups. (The age
group 1-5.0-7.11,age group 2-8.0-9.11,age group 3-
10.0-11.11,age group 4 -12.0-13.11 and age group
5-14.0-15.11), according to the following criteria:
no neurological trauma like spinal fracture ,6
63

International J. of Healthcare and Biomedical Research, Volume: 05, Issue: 03, April 2017, 62-69
57
www.ijhbr.com ISSN: 2319-7072
months back, no visual and musculoskeletal
problems, no neurological deficit or other
diagnosed medical condition. The sample
characteristic of the 516 is described in the table 1.
TABLE 1
DESCRIPTION OF THE STUDY SAMPLE
AGE GRP FEMALE MALE
1(5,6,7) 59 52
2(8,9) 46 49
3(10,11) 61 47
4 (12,13) 51 49
5(14,15) 51 51
PROCEDURE
Subjects were selected on the basis of multistage
sampling method. In the first stage, 3 English
schools and 3 Marathi schools was selected
randomly out of the total schools in Pimpri
Chinchwad Area. In the second stage, from each
standard, 1 division was selected. In third stage,
from every division, boys and girls of same age
were selected by stratified random sampling
method.
A written informed consent was obtained from the
parents one day prior to the assessment. A pre
assessment was taken to record their socio
demographic data and other parameters. Proper
precautions was taken so that there was no harm to
the child. Every child was asked to do 7 tasks-
Dropping and catching the ball with both hands-
The examinee was asked to drop the ball and after
it bounces once, catches with both hands .A catch
was counted incorrect if the examinee traps the ball
against his or her body or catches with one hand.
The number of correct catches out of 5 trials was
recorded. second was Catching the ball with both
hands from 10 feet distance – The examinee was
standing just behind the line (i.e 10 feet from the
examiner) and catch the ball with both hands which
was carefully tossed underhanded and with a slight
arc between the examinee’s shoulders and waist. A
catch was incorrect if, the examinee catches the
ball against his or her body or if the ball was
thrown above the shoulders, below the knees or
outside the examinee’s reach. The number of
correct catches out of 5 trials was recorded.
Thirdly, Dropping and catching the ball with one
hand- The examinee was asked to drop the ball and
after it bounces once, catch with preferred hand .A
catch was counted incorrect if the examinee
trapped the ball against his or her body or catches
with the non-preferred hand. After that Catching
the ball from 10 feet distance with one hand- The
examinee was asked to stand just behind the line
(i.e 10 feet from the examiner) and catches the ball
with preferred hand which is carefully tossed
underhanded and with a slight arc between the
examinee’s shoulders and waist. A catch was
counted incorrect if the examinee catches the ball
against his or her body or if the ball was thrown
above the shoulders, below the knees or outside the
examinee’s reach. The number of correct catches
out of 5 trials was recorded. Then dribbling the ball
with one hand- The examinee was asked to drop
the ball and then dribble the ball with preferred
hand. Second trial was conducted if the examinee
does not earn the maximum score of 10 dribbles on
64
International J. of Healthcare and Biomedical Research, Volume: 05, Issue: 03, April 2017, 62-69
56
www.ijhbr.com ISSN: 2319-7072
the first trial. Correct number of dribbles was
recorded up to 10. A Dribble was counted
incorrect, if the examinee dribbles with non
preferred hand, catches the ball or allows the ball to
bounce more than once between dribbles. The sixth
task was Dribbling the ball with alternating hand-
The examinee was asked to drop the ball and then
was asked to dribble the ball with alternating
hands. Second trial was conducted if the examinee
does not earn the maximum score of 10 dribbles on
the first trial. Correct number of dribbles was
recorded up to 10. A Dribble was counted
incorrect, if the examinee does not alternate hands
with each dribbles, catches the ball or allows the
ball to bounce more than once between dribbles,
and last task was Throwing a ball at a target- The
examinee was asked to stand just behind the line
(i.e.7 feet from the target) and is asked to throw the
ball with preferred hand, over handed or with
modified side arm motion. Number of correct
throws was recorded out of 5. A Throw was
counted incorrect if examinee misses the target,
throwed underhand or stepped over the line while
throwing.
Subjects were assessed for these tasks and these
raw score were then converted to a numerical point
score.
OBSERVATION & RESULTS:
All the subjects completed the upper limb
coordination assessment and the results of the
findings were converted on the percentage scale to
get a better estimation of the upper limb
coordination score in 5-15 years school going
children.
The followings are the graphical representation of
the findings of the study:-firstly, Mean and
Standard deviaton of upper limb coordination point
score, and DESCRIPTIVE ANALYSIS, which will
consider Age, Gender & Descriptive category
according to BOT-2.
For interpretation of results, the values of mean &
standard deviation was calculated by epi info 7.The
mean score and standard deviation of the age group
1-5 according to male and female was interpreted.
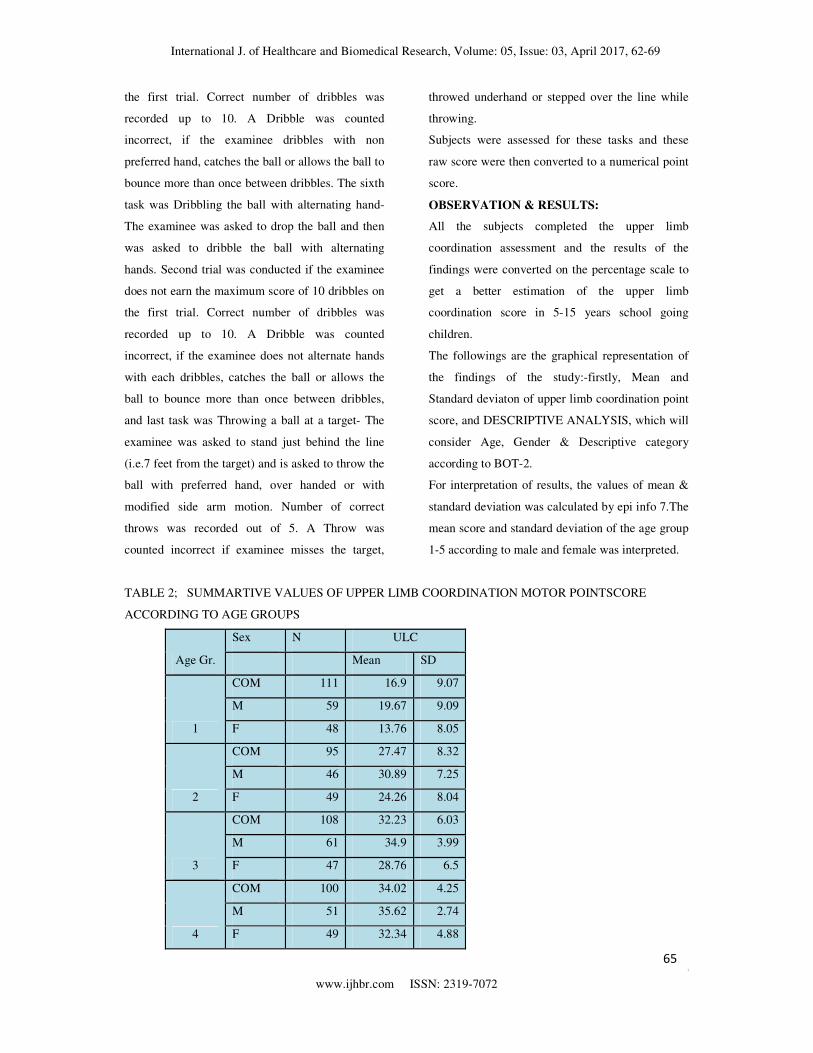
TABLE 2; SUMMARTIVE VALUES OF UPPER LIMB COORDINATION MOTOR POINTSCORE
ACCORDING TO AGE GROUPS
Age Gr.
Sex N ULC
Mean SD
1
COM 111 16.9 9.07
M 59 19.67 9.09
F 48 13.76 8.05
2
COM 95 27.47 8.32
M 46 30.89 7.25
F 49 24.26 8.04
3
COM 108 32.23 6.03
M 61 34.9 3.99
F 47 28.76 6.5
4
COM 100 34.02 4.25
M 51 35.62 2.74
F 49 32.34 4.88
65

International J. of Healthcare and
www.ijhbr.com ISSN: 2319
5
COM 101
M
F
GRAPH 1; UPPER LIMB COORDINATION TOTAL MOTOR POINT SCORE ACCORDING TO AGE
GROUP
According to the graph, as the age group increases, the upper limb coordination total motor point score also
increases.
Graph 2 - DESCRIPTIVE CATEGORY ACCORDING TO GENDER
16.9
27.47
0
5
10
15
20
25
30
35
40
1 2
ME
AN
OF U
LC
TO
TA
L P
OIN
T S
CO
RE
AGE GROUP
ULC TOTAL POINT SCORE
ACCORDING TO AGE GROUP
0
20
40
60
WAA AA
Female 0 8.06
Male 0 56.34
GE
ND
ER
DESCRIPTIVE CATEGORY ACCORDING
TO GENDER
International J. of Healthcare and Biomedical Research, Volume: 05, Issue: 03, April 2017,
www.ijhbr.com ISSN: 2319-7072
101 35.39 3.82
51 36.41 3.46
51 34.37 3.91
GRAPH 1; UPPER LIMB COORDINATION TOTAL MOTOR POINT SCORE ACCORDING TO AGE
According to the graph, as the age group increases, the upper limb coordination total motor point score also
CATEGORY ACCORDING TO GENDER
32.2334.02 35.39
3 4 5
AGE GROUP
ULC TOTAL POINT SCORE
ACCORDING TO AGE GROUP
Mean
A BA WBA
8.06 37.9 45.16 8.87
56.34 20.9 20.9 1.87
DESCRIPTIVE CATEGORY ACCORDING
TO GENDER
03, April 2017, 62-69
56
GRAPH 1; UPPER LIMB COORDINATION TOTAL MOTOR POINT SCORE ACCORDING TO AGE
According to the graph, as the age group increases, the upper limb coordination total motor point score also
66

International J. of Healthcare and
www.ijhbr.com ISSN: 2319
The performance of the students was interpreted by
the descriptive category and was compared among
male & female. According to this, 45.16 % females
showed Below average performance where as only
20.9% males showed Below average performance,
GRAPH 3: DESCRIPTIVE CATEGORY ACCORDING TO AGE GROUP
According to above graph, the scores of students were mostly higher in average category, except Age Group 3,
where below average were more and Age Group 5 showed similar number in both average and below average
category.
DISCUSSION:
The primary aim of the study was to find affection
of upper limb coordination in the school going
children of age 5-15 years using BOT 2 Scale.
upper limb coordination subtest of BOT 2,which is
the seventh subtest under gross motor composite.
Sample’s score is consistent with individuals who
generally can catch a tennis ball that is tossed from
10 feet away about 50% of the time, dribble a
tennis ball two to five times, and hit a target with a
tennis ball from 10 feet away about 25% of the
0
10
20
30
40
50
60
WAA
AGE GROUP 1(5,6,7) 0
AGE GROUP 2(8,9) 0
AGE GROUP 3(10,11) 0
AGE GROUP 4(12,13) 0
AGE GROUP 5(14,15) 0
AG
E G
RO
UP
DESCRIPTIVE CATEGORY ACCORDING TO AGE
International J. of Healthcare and Biomedical Research, Volume: 05, Issue: 03, April 2017,
www.ijhbr.com ISSN: 2319-7072
The performance of the students was interpreted by
the descriptive category and was compared among
male & female. According to this, 45.16 % females
where as only
average performance,
where as 8.87% females showe
average performance, where as only 1.87% males
were under the category of Well Below average.
GRAPH 3: DESCRIPTIVE CATEGORY ACCORDING TO AGE GROUP
According to above graph, the scores of students were mostly higher in average category, except Age Group 3,
where below average were more and Age Group 5 showed similar number in both average and below average
he study was to find affection
of upper limb coordination in the school going
15 years using BOT 2 Scale. The
upper limb coordination subtest of BOT 2,which is
the seventh subtest under gross motor composite.
with individuals who
generally can catch a tennis ball that is tossed from
10 feet away about 50% of the time, dribble a
tennis ball two to five times, and hit a target with a
tennis ball from 10 feet away about 25% of the
time. The scoring system varies w
ranging from a 0-point (pass/fail) to a 5
The total number of samples were
10.67 years ± 3.02 )in which 268 females(mean age
10.69 years±3.04 ) & and 248 were males(mean
age 10.66 years±3.02 ).
Descriptive category according to gender, showed a
vast difference between males and femal
According to the study done, 45.16 % females
showed Below average performance where as only
20.9% males showed Below average performance,
where as 8.87% females showed Well Below
WAA A AA BA WBA
57.66 8.11 26.13 8.11
49.47 13.68 27.37 9.47
38.89 17.59 39.81 3.7
55 10 33 2
36.27 24.51 36.27 2.94
DESCRIPTIVE CATEGORY ACCORDING TO AGE
GROUP
03, April 2017, 62-69
55
where as 8.87% females showed Well Below
, where as only 1.87% males
Well Below average.
According to above graph, the scores of students were mostly higher in average category, except Age Group 3,
where below average were more and Age Group 5 showed similar number in both average and below average
time. The scoring system varies with each item,
(pass/fail) to a 5-point scale.
The total number of samples were 516, (mean age
females(mean age
were males(mean
y according to gender, showed a
vast difference between males and females.
, 45.16 % females
erformance where as only
males showed Below average performance,
where as 8.87% females showed Well Below
WBA
8.11
9.47
3.7
2
2.94
DESCRIPTIVE CATEGORY ACCORDING TO AGE
67

International J. of Healthcare and Biomedical Research, Volume: 05, Issue: 03, April 2017, 62-69
56
www.ijhbr.com ISSN: 2319-7072
average performance , where as only 1.87% males
were under the category of Well Below average.
These performance differences in males and
females can be due to the dietary intake of boys is
more than that of girls (satabdi ghosh et al 2013)1.
Nutritional status appear to be significant predictor
for both fine and gross motor development.1 It also
alters the learning process by influencing brain
development and physical growth and accordingly
modify the movement proficiency of the children
by adjusting the strength, power, coordination and
perception.1
Total motor point score according to age group, in
which the study reveals that as the age increases the
mean values of point score also increases.
Barnekow- Bergkvist et al. (1998) found that
performance in physical tests; height, weight and
physical activity at the age of 13 contributed best to
explain adult physical performance and physical
activity. Therefore, it may be concluded that so far
all the subtests of coordination was concerned age
factor was responsible for higher mean value. Age
group 4 &5 having higher age, they had
significantly performed better in comparison to age
group 1, 2 & 3 boys and girls.
Coordination was also related to limb length,
general musculature and neuromuscular
coordination, which are definitely influenced by the
advancement of age. The remaining motor
performance is related to lean body mass, general
musculature, aerobic capacity and certain
psychological state of mind (willingness to accept
pain) and development of all of which are
influenced by advancement of age. Therefore, it is
obvious that age group 1, 2 &3 will have less motor
quality than that of age group 4&5 because of
structural and functional differences of higher age
groups.
Descriptive category according to age groups, in
which the study revealed that BA and WBA were
more in the age group 1 & 2 as compared to age
group 3, 4 & 5.3 It is observed that children of age
8, 9, & 10 are less in the activities played with a
tennis ball than the children of age 11, 12,
&13.Environmental factors including the schedules
of school’s physical education activities may
explain some of the remaining variability of scores.
From the foregoing discussion of the leading
researchers it has also been evident that the growth
and development of body parts and functional
capacity of the organs and systems improve rapidly
during pre-pubertal stage and each year during this
stage results significant improvement in stature.
Chatterjee et al. (1992) has also reported that
gradual increase in motor fitness measurements
with the advancement of age on school going
children of 5-15 years age. Therefore, it is expected
that during pre- adolescent stage with advancement
of age (12-15 years) that motor activity involving
neuromuscular coordination will also increase, that
is the reason age group 1&2 had WBA
performances more than Age group 3,4 &5.
LIMITATIONS;
In our study, we were not able to take the
socioeconomic status that can be probably a reason
for the performance score difference amongst
different age group students.
FURTHER SCOPE:
To establish normative data & to consider different
medium schools and body mass index of the
children.
CONCLUSION
The study concluded that, there is very slight score
difference in males and females, although males
showed better performance than females in
coordination skills like catching and throwing of
objects. Children of age 12,13,14,15 years showed
better results than children of age 5, 6, 7, 8, 9, & 10
years i.e. as the age advanced performances of the
students increased.
68

International J. of Healthcare and Biomedical Research, Volume: 05, Issue: 03, April 2017, 62-69
55
www.ijhbr.com ISSN: 2319-7072
REFERENCES
1) Satabdi Ghosh, Sutanu Dutta Chowdhury, Ananga Mohan Chandra & Tusharkanti Ghosh (2013) A study on the
influence of occupation on development of motor activities in children, International Journal of Adolescence and
Youth,18:1,23-31.
2) Salter, Jennifer E; Laurie R. Wishart; Timothy D.Lee; Dominic Simon (2004). “ Perceptual and motor contributions to
bimanual coordination.” Neurosciences letters. 363(2); 102-107
3) T.Balakrishnan, Chavan Sasidhar Rao. Interrater Reliability Of Bilateral Coordination of Bruininks Oseretsky Test of
Motor Proficiency (BOTMP) & Performance of Indian Children Compared With USA Norms (2007). The Indian Journal of
Occupational Therapy: Vol.XXXVIII:No.3.
4) Ozgurmulazimoglu-Balli. Motor Proficiency and Body Mass Index of preschool Children: In relation to Socioeconomic
Status (2016). Journal of Education and Training Studies Vol. 4. No .4.
5) “Fine motor outcomes in preschool children who receives occupational therapy services”.Retrieved 26 October 2014.
6) Robert H. Bruininks, PhD, & Brett D. Bruininks, PhD. Bruininks Oseretsky Test of Motor Proficiency, Second Edition
Complete Form Report(2013).
7) Barbara R Lucas, Jane Latimer, Robyn Doney, et al.The Bruininks Oseretsky Test of Motor Proficiency- Short Form is
Reliable in children living in Australian Aboriginal communities (2013).Lucas et.al BMC Pediatrics,13:13
8) Komal K B did a study on “To study the Prevalence of Developmental coordination Disorder in 5-15 years of normal
children in Dharwad”(2012).Rajiv Gandhi University of Health Sciences, Karnataka.
9) Dr. Pradip Kumar Paul. Comparative Study on Balance and Coordination of 12 and 13 years boys, volume 3 issue 4 (July
2014).
ACKNOWLEDGEMENT
Having surmounted all the difficulties and after reaching the shore by completing the work of this study, I am realizing the
limitations of language and words while acknowledging thanks to all those who helped me in this voyage.
I thank my mother Mrs.Dipti Dighe, my father Mr. Dilip Dighe & my brother Akshay Dighe for their moral support,
prayers and encouragement that have been a pillar of strength throughout this work. Words are few and language seems
feeble when the heart is full of gratitude, these few words cannot express my deep sense of gratitude to my esteemed
Guide Dr. Mrs. Sanjivani Dhote, who has been a constant source of inspiration to me since the very beginning of this
work. Her unsurpassable teaching experience & scientific approach has increased my interest and knowledge in the
subject. It is only because of her constructive supervision and overall encouraging sympathetic attitude that my work has
acquired the present shape.
It is with deep sense of gratitude and sincerity that I thank Dr.TusharPalekar, principal of Dr. D. Y. Patil College of
Physiotherapy, Pimpri, Pune and Dr.Mrs.Manisha Rathi for helping me to successfully complete this study. From him I
have tried to imbibe values, vast knowledge, experience and a high sense of professionalism.
I would like to thank my college “Dr.D.Y.Patil College of Physiotherapy, Pimpri, Pune, for giving an opportunity to select
this project.
I am highly indebted to My Friends especially Antara Pande, Pooja Yengde and Nilambari. C for constantly
supporting me and for bearing the brunt of this herculaneum task.
Finally, I express my sincere thanks to all the schools and there management whose willingness to be a part of this study
helped this work see the light of day.
Lastly I would like to thank God for sending all these wonderful opportunities and giving me a chance to prove myself.
69