Embed Size (px)
Citation preview
Draft
Validity of field assessments to predict peak muscle power
in preschoolers
Journal: Applied Physiology, Nutrition, and Metabolism
Manuscript ID apnm-2016-0426.R2
Manuscript Type: Article
Date Submitted by the Author: 16-Mar-2017
Complete List of Authors: King-Dowling, Sara; McMaster University Proudfoot, Nicole; McMaster University, Pediatrics Cairney, John; McMaster University, Family Medicine/Kinesiology Timmons, Brian; McMaster University,
Keyword: children, standing long jump, standing broad jump, musculoskeletal fitness, shuttle run
https://mc06.manuscriptcentral.com/apnm-pubs
Applied Physiology, Nutrition, and Metabolism
Draft
1
Validity of field assessments to predict peak muscle power in preschoolers
Sara King-Dowling, PhD Candidate1,2,3
Nicole A. Proudfoot, MSc, PhD Candidate1,2
John Cairney, PhD1,3
Brian W. Timmons, PhD1,2,3
1Department of Kinesiology, McMaster University, Hamilton, Canada
2Child Health and Exercise Medicine Program, Department of Pediatrics, McMaster University,
Hamilton, Canada
3Infant and Child Health Lab, Department of Family Medicine, McMaster University, Hamilton,
Canada
*Corresponding author: Brian W. Timmons, PhD, Child Health & Exercise Medicine Program
Department of Pediatrics, McMaster University; Address: 1280 Main Street West, HSC 3N27G
Hamilton, ON, Canada, L8S 4K1; Tel: 905-521-2100 ext 77615; Fax: 905-521-1703; Email:
Page 1 of 22
https://mc06.manuscriptcentral.com/apnm-pubs
Applied Physiology, Nutrition, and Metabolism
Draft
2
ABSTRACT
Background: Field-based fitness assessments are time- and cost-efficient. However, no studies
to date have reported the predictive value of field-based musculoskeletal fitness assessments in
preschoolers. The purpose of this study was to determine the validity of two field assessments to
predict peak muscle power in preschool-aged children.
Methods: Four-hundred nineteen 3- to 5-year olds participated (208 girls, 211 boys; mean age:
4.5±0.9 years). Peak power (PP) was evaluated using a modified 10-second Wingate protocol as
the criterion standard. Standing long jump was measured in inches to the back of the heel using a
2-footed takeoff and landing. Shuttle run time was measured using a shuttle run protocol, that
required children to sprint 50 feet (15.2m), pick up a small block and sprint back, with time
measured to the closest millisecond. Regression modeling was used to calculate the predictive
power of each field-based measurement, adjusting for weight (kg), age and sex.
Results: Both standing long jump distance and shuttle run time were significantly correlated
with PP (r=0.636, p<.001 and r=-0.684, p<.001 respectively). Linear regression analysis
determined that a child’s PP can be predicted from the child’s weight, age and sex and either
standing long jump or shuttle run time (adjusted R2 = 0.79, p<.001 and 0.81, p<.001,
respectively).
Conclusion: The standing long jump and the BOT-2 shuttle run are both significant predictors of
peak muscle power in preschool children. Either measure can be used as a cost and time efficient
estimate of musculoskeletal fitness in preschoolers.
Key Words: Children; standing long jump; standing broad jump; musculoskeletal fitness; shuttle
run, short-term muscle power
Page 2 of 22
https://mc06.manuscriptcentral.com/apnm-pubs
Applied Physiology, Nutrition, and Metabolism
Draft
3
INTRODUCTION
Musculoskeletal fitness (MF) is now recognized as an important marker of health across the life
span (Pate et al. 2012). Emerging evidence shows positive associations between MF and bone
heath and self-esteem as well as negative associations between MF and central adiposity,
cardiovascular disease and metabolic risk factors among children and adolescents (Ortega et al.
2008, Smith et al. 2014). Long-term follow-up studies have also found that, compared to
cardiorespiratory fitness, measures of MF in adolescence are more strongly predictive of bone
mineral density later in life (Kemper et al. 2000, Barnekow-Bergkvist et al. 2006).
Despite the growing body of work on MF in childhood, a recent review by Plowman and
colleagues (2014) concluded that many important questions still remain regarding how we test
MF in children and youth. As population level studies rely heavily on field-based assessment of
fitness, the first step to understanding the impact of MF on health in childhood is to determine
how well MF field-tests agree with criterion laboratory measures of the same construct. The use
of valid and reliable MF field tests will make it possible to measure meaningful changes and
deficits over time and relate this back to important health outcomes in large samples of children.
One important aspect of MF is muscle power (Pate et al. 2012). Short-term muscle power, or
peak power is defined as the highest mechanical power that can be delivered during short
duration exercise (≤30 s), with ‘true’ peak power requiring measures of instantaneous force and
velocity (Van Praagh and Doré 2002). The Wingate anaerobic test is a 30 second cycle
ergometer sprint test used to measure peak power, mean power and percent fatigue (Bar-Or
1987). It is one of the most common methods for assessing short-term muscle power; however,
Page 3 of 22
https://mc06.manuscriptcentral.com/apnm-pubs
Applied Physiology, Nutrition, and Metabolism
Draft
4
the specialized equipment is costly and not feasible in large population –based studies, especially
in school/preschool settings.
Although there is growing evidence supporting MF field tests in school-aged children (Safrit
1990, Freedson et al. 2000, Castro-Piñero et al. 2010a, Artero et al. 2011), much less is known
about the validity of MF testing in the kindergarten/preschool population. As young children
tend to accumulate their daily physical activity in short, intense intermittent bouts (Baquet et al.
2007), short-term muscle power may be extremely relevant to their habitual activity patterns. In a
recent systematic review by Ortega and colleagues (Ortega et al. 2015), the authors identified the
need for validation studies as no studies to date have examined the criterion-related validity of
field-based MF assessments in preschoolers. The standing long jump (standing broad jump) and
Bruininks Oseretsky Test of Motor Proficiency 2nd
Edition (BOT-2, (Bruininks and Bruininks
2005)) shuttle run were examined as they are field-based tests that are easy to administer and
comprehend, time efficient, and involve minimal equipment, making them ideal for field-based
fitness testing in a young population. The purpose of this study was to determine if the standing
long jump (LJ) and the BOT-2 shuttle run are able to accurately predict peak muscle power, as
measured using a modified 10s Wingate protocol as the criterion standard (Nguyen et al. 2011),
in a community-based sample of preschool children 3-5 years old.
METHODS
Participants
Four hundred and nineteen preschool children were recruited from various community
organizations in south-central Ontario from 2010-2012 as part of the Health Outcomes and
Page 4 of 22
https://mc06.manuscriptcentral.com/apnm-pubs
Applied Physiology, Nutrition, and Metabolism
Draft
5
Physical activity in Preschoolers (HOPP) Study, which is a longitudinal observational study
examining the interrelationships between physical activity and numerous health outcomes from
preschool to early childhood. Details of the study design are provided in a previous publication
(Timmons et al. 2012). The current study is a cross-sectional secondary analysis of the baseline
cohort of children who range in age from 3.0 (36 months) – 5.9 years (71 months) (50.4% male).
Children with known physical impairments or diagnosed medical condition (e.g. diabetes,
cerebral palsy) were not eligible to participate. Informed, written consent was given by
parents/guardians of all participants. Ethical approval was obtained from the McMaster
University Faculty of Health Science/Hamilton Health Sciences Research Ethics Board.
Measures
Anthropometrics
Standing height was measured without shoes to the nearest 0.1cm using a calibrated stadiometer.
Weight was measured on a digital scale to the nearest 0.1kg in light clothing and without shoes.
For descriptive purposes, Body Mass Index (BMI) was calculated as weight/height2 (kg/m
2).
BMI percentiles, based on sex and age, were calculated based on Centers for Disease Control
and Prevention (CDC) growth charts (Kuczmarski et al. 2002).
Field Assessments
Standing Long jump (LJ)
The standing long jump (LJ) (or standing broad jump) was chosen as is used in numerous fitness
test batteries across the world and was a recommended MF field test in the Institute of
Medicine’s report on youth fitness measurement (Pate et al. 2012). It is considered to be a
Page 5 of 22
https://mc06.manuscriptcentral.com/apnm-pubs
Applied Physiology, Nutrition, and Metabolism
Draft
6
measure of explosive strength/muscle power and has found to be reliable in preschoolers (Oja
and Jürimäe 1997, Bénéfice et al. 1999, Artero et al. 2011, Fernandez-Santos et al. 2015) and to
be strongly associated with other lower body muscular strength field tests (e.g. vertical jump,
counter movement jump, squat jump) in children and youth (Castro-Piñero et al. 2010b,
Fernandez-Santos et al. 2015). In addition, the relative simplicity of the long jump compared to
other jump protocols such as the counter movement jump and vertical jump, made this test ideal
for the preschool population.
Children were required to stand with both feet behind a marked line. Participants were instructed
to jump as far as they could off both feet. The jump was first demonstrated using appropriate arm
swing and 2 footed takeoff and landing. If the child did not understand the instructions the task
was re-demonstrated and any errors were corrected. Distance was measured, to the nearest half
inch, from the marked line to the back of the closest heel. Each child performed 3 jumps and the
best result was recorded. Jumps were not recorded if the children fell or if they used a one-footed
take-off or landing (Ruiz et al. 2011).
BOT-2 shuttle-run
Speed and agility, although mainly thought to assess ‘motor fitness’, also involves many
components of MF as it requires explosive lower body strength and power along with balance
and coordination (Ortega et al. 2008, Artero et al. 2011).
Running speed and agility was assessed using the Bruininks-Oseretsky Test of Motor Proficiency
2nd
Edition (BOT-2, (Bruininks and Bruininks 2005)) shuttle run protocol. This test required
Page 6 of 22
https://mc06.manuscriptcentral.com/apnm-pubs
Applied Physiology, Nutrition, and Metabolism
Draft
7
children to sprint 50 feet (15.2 m), pick up a small shuttle block and sprint back, which was
explained verbally before beginning the test. Children started on a ready-set-go signal from the
investigator and were encouraged to run as fast as they could throughout the test. Shuttle run
time (SRT) was measured in seconds to the nearest tenth of a second. A second trial was
conducted only if the participants stumbled, fell, failed to pick up the shuttle block or dropped
the shuttle block before crossing the start/finish line during the first trial. If a second trial was
necessary, the task was explained again and then demonstrated by the investigator. The full
running speed and agility subsection (5 items) of the BOT-2 has been found to have high test-
retest and inter-rater reliability in young children age 4-7 (Bruininks and Bruininks 2005).
Similar shuttle-run tests also have good reliability in preschool children (e.g. 4x10m 4x4m;
Ortega et al. 2015), however this test was chosen in order to limit complexity as only 1 change in
direction is required.
Peak muscle power
Modified Wingate Test
As young children accumulate the majority of their moderate to vigorous physical activity in
bouts less than 10 seconds (Baquet et al. 2007), we developed a modified 10s Wingate anaerobic
cycling test to determine short-term muscle power (Nguyen et al. 2011). The test was performed
on a pediatric cycle ergometer (Fleisch-Metabo, Geneva, Switzerland, or Pediatric Corival,
LODE, the Netherlands). The Wingate test is considered a gold standard in short-term muscle
power assessment, and this modified 10s protocol has been shown to be feasible and highly
reliable (ICC 0.93) for preschoolers 3-5 years old (Nguyen et al. 2011). Seat height and pedal
crank length were adjusted for each child and their feet were taped into the pedals. In order to
Page 7 of 22
https://mc06.manuscriptcentral.com/apnm-pubs
Applied Physiology, Nutrition, and Metabolism
Draft
8
establish peak cadence (rpm), the child performed an initial “sprint” by pedaling as fast as they
could for ~20 s against only the internal resistance of the ergometer. After a short rest, the child
began the modified Wingate test. The child was instructed to pedal as fast as they could with a
“ready… set… go” signal from the investigator. When 80 % of the peak cadence was reached,
the braking force (0.55 N·m·kg-1
body mass) was applied. During the 10-second test, the child
was encouraged to keep pedalling as fast as he/she could. Peak power (PP) in Watts was taken as
the highest instantaneous power output achieved during the test. If children were unable or
refused to pedal over 25rpm they were excluded from the current analysis.
Due to change of equipment from the Fleisch-Metabo to the LODE cycle ergometer after the
first 65 participants, a calibration study on 28 participants who completed tests on both
ergometers one week apart was conducted (Caldwell et al. 2016). No significant differences in
peak or mean power were observed, and therefore results from both ergometers were included in
the final analyses.
Statistical Analyses
Sex differences in anthropometrics and fitness measures were examined using independent t-
tests. Pearson correlations were conducted to examine the relationship between PP and both LJ
and SRT. In order to determine the predictive power of each field test, multiple variable linear
regression analysis was conducted. Weight (kg), age and sex were first added into the model
using the entry method (Model 1). SRT (Model 2) or LJ (Model 3) or both (Model 4) were then
entered simultaneously into the model to determine the unique predictive power of each field test
over and above weight (kg), age and sex. Age was measured in years and collapsed into three
Page 8 of 22
https://mc06.manuscriptcentral.com/apnm-pubs
Applied Physiology, Nutrition, and Metabolism
Draft
9
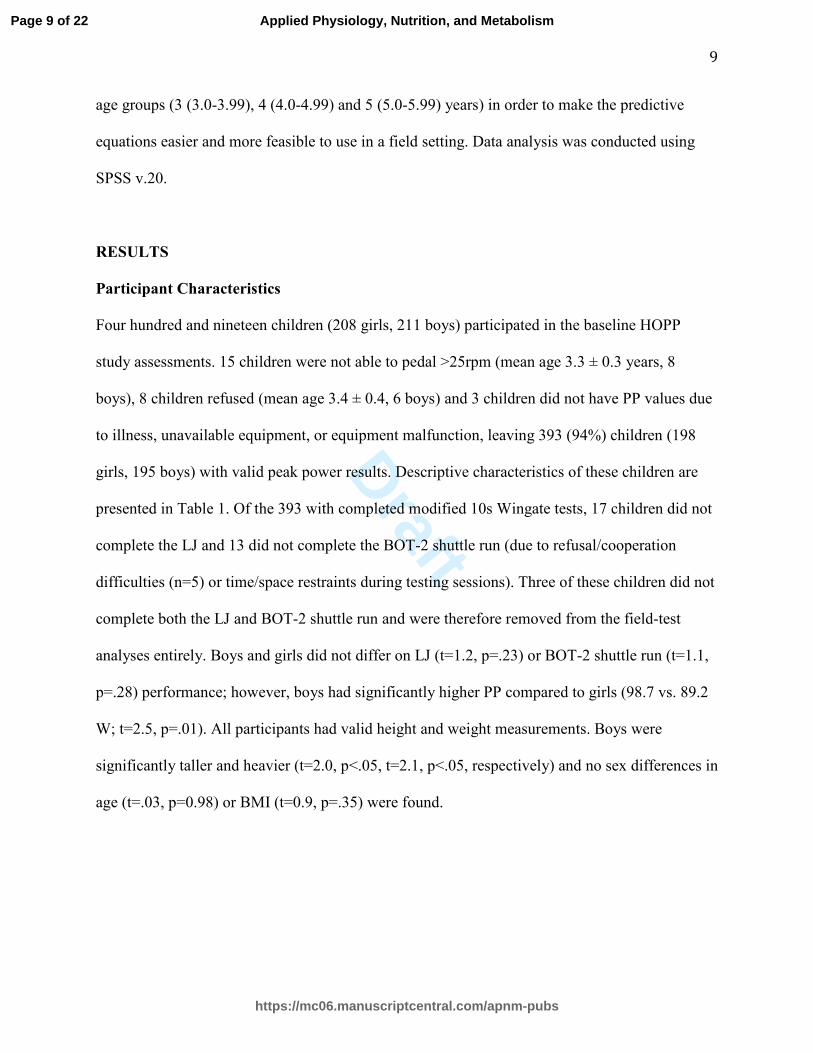
age groups (3 (3.0-3.99), 4 (4.0-4.99) and 5 (5.0-5.99) years) in order to make the predictive
equations easier and more feasible to use in a field setting. Data analysis was conducted using
SPSS v.20.
RESULTS
Participant Characteristics
Four hundred and nineteen children (208 girls, 211 boys) participated in the baseline HOPP
study assessments. 15 children were not able to pedal >25rpm (mean age 3.3 ± 0.3 years, 8
boys), 8 children refused (mean age 3.4 ± 0.4, 6 boys) and 3 children did not have PP values due
to illness, unavailable equipment, or equipment malfunction, leaving 393 (94%) children (198
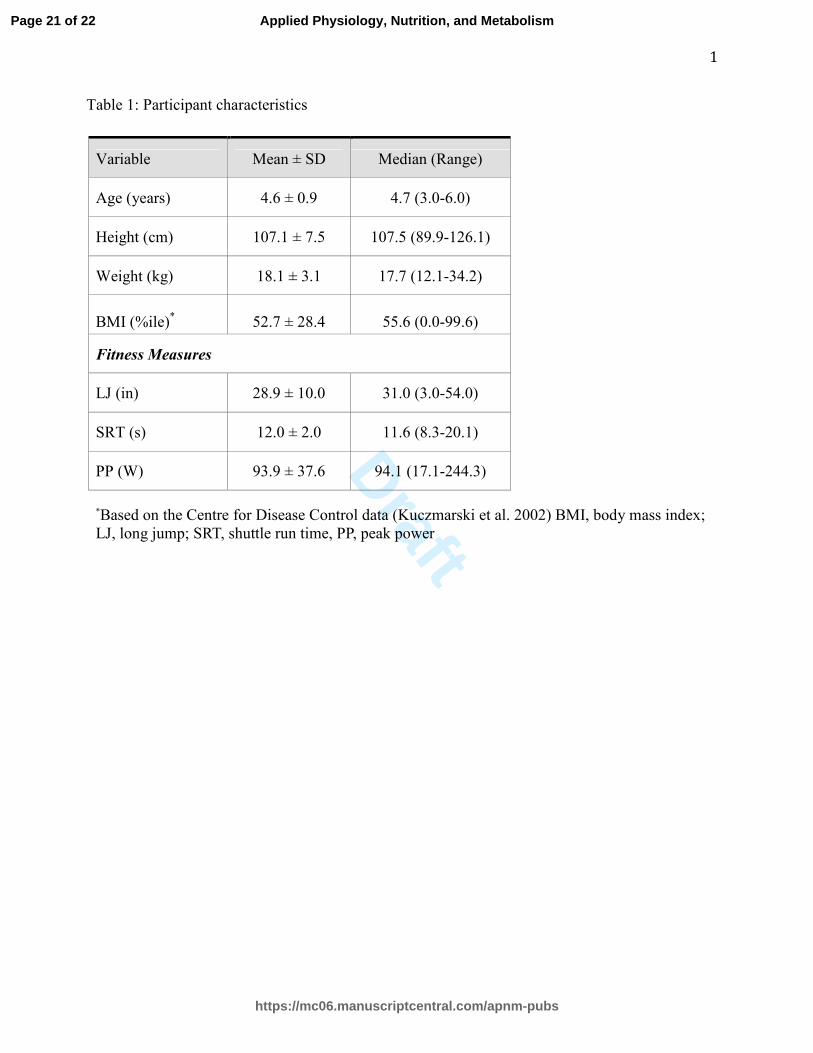
girls, 195 boys) with valid peak power results. Descriptive characteristics of these children are
presented in Table 1. Of the 393 with completed modified 10s Wingate tests, 17 children did not
complete the LJ and 13 did not complete the BOT-2 shuttle run (due to refusal/cooperation
difficulties (n=5) or time/space restraints during testing sessions). Three of these children did not
complete both the LJ and BOT-2 shuttle run and were therefore removed from the field-test
analyses entirely. Boys and girls did not differ on LJ (t=1.2, p=.23) or BOT-2 shuttle run (t=1.1,
p=.28) performance; however, boys had significantly higher PP compared to girls (98.7 vs. 89.2
W; t=2.5, p=.01). All participants had valid height and weight measurements. Boys were
significantly taller and heavier (t=2.0, p<.05, t=2.1, p<.05, respectively) and no sex differences in
age (t=.03, p=0.98) or BMI (t=0.9, p=.35) were found.
Page 9 of 22
https://mc06.manuscriptcentral.com/apnm-pubs
Applied Physiology, Nutrition, and Metabolism
Draft
10
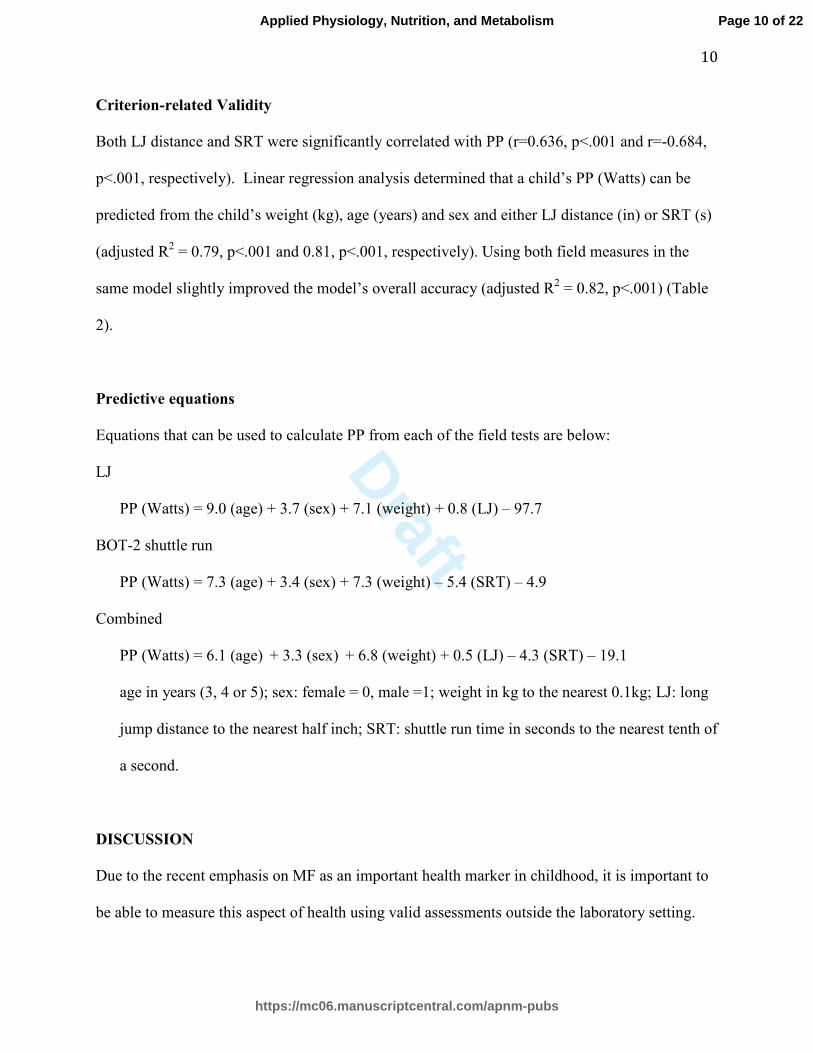
Criterion-related Validity
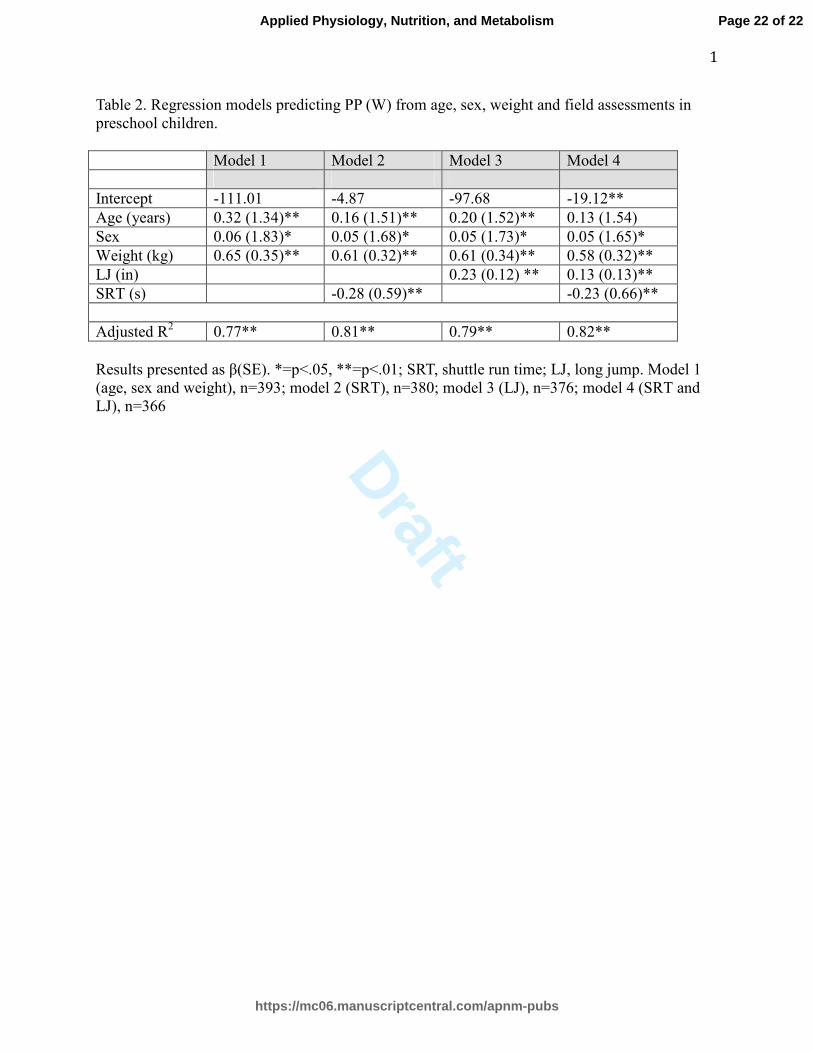
Both LJ distance and SRT were significantly correlated with PP (r=0.636, p<.001 and r=-0.684,
p<.001, respectively). Linear regression analysis determined that a child’s PP (Watts) can be
predicted from the child’s weight (kg), age (years) and sex and either LJ distance (in) or SRT (s)
(adjusted R2 = 0.79, p<.001 and 0.81, p<.001, respectively). Using both field measures in the
same model slightly improved the model’s overall accuracy (adjusted R2 = 0.82, p<.001) (Table
2).
Predictive equations
Equations that can be used to calculate PP from each of the field tests are below:
LJ
PP (Watts) = 9.0 (age) + 3.7 (sex) + 7.1 (weight) + 0.8 (LJ) – 97.7
BOT-2 shuttle run
PP (Watts) = 7.3 (age) + 3.4 (sex) + 7.3 (weight) – 5.4 (SRT) – 4.9
Combined
PP (Watts) = 6.1 (age) + 3.3 (sex)
+ 6.8 (weight) + 0.5 (LJ) – 4.3 (SRT) – 19.1
age in years (3, 4 or 5); sex: female = 0, male =1; weight in kg to the nearest 0.1kg; LJ: long
jump distance to the nearest half inch; SRT: shuttle run time in seconds to the nearest tenth of
a second.
DISCUSSION
Due to the recent emphasis on MF as an important health marker in childhood, it is important to
be able to measure this aspect of health using valid assessments outside the laboratory setting.
Page 10 of 22
https://mc06.manuscriptcentral.com/apnm-pubs
Applied Physiology, Nutrition, and Metabolism
Draft
11
Although the Wingate anaerobic test is commonly referred to as a gold standard for the
measurement of short-term muscle power, it requires expensive equipment, trained personnel
and is not suitable for testing large groups of children. The purpose of this study was to
determine the construct validity of the LJ and 50ft shuttle run by measuring their ability to
accurately predict peak power as measured using a criterion standard modified Wingate protocol
in preschool children. The results show that when used in combination with age, weight and sex,
both the LJ and BOT-2 shuttle run are able to predict approximately 80% of the variance in PP in
children aged 3-5 years. Although SRT shows slightly better predictive accuracy, either the LJ or
SRT can be conducted as cost- and time-efficient estimates of peak muscle power in
preschoolers.
Jump tests and sprint times are common MF field measures used in many national fitness
protocols (Pate et al. 2012) (e.g. CAHPER (Canadian Association for Health Physical Education
and Recreation. 1966), EUROFIT (Adam 1988), ALPHA (Ruiz et al. 2011)), with protocols
recently developed for the preschool population (PREFIT (Ortega et al. 2015)). Our results are
similar to field-test validation studies comparing vertical jump heights and sprint times against
Wingate power outputs in older children, which found moderate to high correlations (Tharp et al.
1985, Hoffman et al. 2000, Bongers et al. 2015). In the current study, the r=0.68 correlation
between LJ and PP is considerably higher than validation studies comparing LJ to 1RM leg
extension or leg press reporting correlations from r=0.2-0.4 in children age 6-12 (Milliken et al.
2008, Fernandez-Santos et al. 2015). This suggests that the LJ may be better able to predict
lower body muscle power than tests of lower body muscle strength in young children. Although
the field-tests in this study independently explained 40-45% of the variance in PP, adding
Page 11 of 22
https://mc06.manuscriptcentral.com/apnm-pubs
Applied Physiology, Nutrition, and Metabolism
Draft
12
participant’s weight into the model significantly increased the predictive value of the tests; this is
a common finding in the literature due to the high correlations between body mass and muscle
power and strength measures, which is suggested to be due to increases in fat-free mass (Tharp et
al. 1985, Fernandez-Santos et al. 2015). This is further supported by a recent study by Fry and
colleagues (2015) who discovered that age related differences in leg strength and power in
children from age 3 to 7 were minimal once body mass was adjusted for, this highlights the
importance of considering body mass when interpreting muscular performance in young
children.
The average peak power output of 94 W in the current sample is consistent with findings from
Fry and colleagues (2015) who measured the highest mean power achieved during a maximal
velocity leg press in a similar same age group (age 3-7). Previous research has also shown that
laboratory-assessed peak and mean power using the aforementioned modified 10s Wingate
protocol exhibits strong tracking, or stability of relative rankings over time, in preschool children
(Gabel et al. 2011, Caldwell et al. 2016). Utilizing valid and reliable field-based tests in this age
group will allow short-term muscle power to be tracked in large cohorts and ultimately help to
determine its relevance to health-related outcomes later in life.
Due to the young age of the participants, a few children under the age of 4 (n=15) had not yet
achieved the level of coordination required to pedal the ergometer above 25 rpm and were
therefore excluded from the analysis. However, as many field-measures of MF involve one’s
ability to move in a coordinated way (e.g., long jump, vertical jump, sprinting), it would be
expected that their ability to perform on the field-test would be hindered as well. This is
Page 12 of 22
https://mc06.manuscriptcentral.com/apnm-pubs
Applied Physiology, Nutrition, and Metabolism
Draft
13
supported by our data as these children who had difficulty pedaling had significantly shorter LJ
distance (t=2.2, p<.05) and longer SRT (t=3.2, p<.01) than the 3 year old children who were able
to pedal >25rpm. Although we cannot tease out the effects of motor coordination in the
relationship between LJ and SRT to PP, both impaired motor coordination and low MF have
been shown to be risk factors for negative health outcomes such as excess weight gain as
children age (Ortega et al. 2008, Lopes et al. 2012). Although, within typically developing
children, body weight is relevant to the prediction of absolute PP, overweight children who are at
risk for poor MF would actually perform worse on the LJ and/or shuttle run. This would lead to
an overall prediction of relative peak power (W/kg) much lower than a normal weight child of
the same age who performs better on the LJ and shuttle run. By using field-tests of MF that
incorporate dynamic coordination, teachers may be able not only to identify children with poor
MF, but also identify children who may have concurrent motor coordination difficulties. These
tests are valuable because both the LJ and BOT-2 shuttle run involve movement patterns that are
typical of preschool-aged children and can be used to provide a reasonable estimate of peak
muscle power in young children.
Limitations
To our knowledge, this is the first study to validate field-measures of MF to a laboratory
criterion standard of short-term muscle power in preschool-aged children. Although the children
were always given verbal encouragement and the tests were quick to complete and easy to
comprehend, we recognize that due to the young age of the sample, participant motivation and
attention may have impacted the children’s performance. There may be small, random errors
related to manual timing of the BOT-2 shuttle run and visual measurement of the LJ distance,
Page 13 of 22
https://mc06.manuscriptcentral.com/apnm-pubs
Applied Physiology, Nutrition, and Metabolism
Draft
14
however overall these should not impact the results as studies investigating the reliability of
similar protocols have found no evidence of systematic bias or heteroscedasticity (Artero et al.
2011).
Future directions
The results from this study confirm that field-based assessments can be used to estimate peak
muscle power in preschoolers. We recognize that there is limited evidence linking short-term
muscle power in the early years to long-term health outcomes. Therefore, future research
investigating the relationships between peak muscle power, as a surrogate of MF, and health
outcomes, such as weight status or cardiovascular risk, in large samples of children is necessary
before the predictive utility of these tests can be determined. As young children’s activity
patterns are characterized by short intermittent bursts of activity, their ability to create short-term
power outputs may have important implications for their accumulation of physical activity
throughout the day. Longitudinal studies examining these relationships starting at the preschool
age are needed in order to ascertain the causal ordering and impact of low MF on physical
activity and health from early childhood to adolescence. Future work examining the predictive
validity of these field tests and the age cut-offs for poor peak muscle power are required before
targeted interventions can be implemented.
Page 14 of 22
https://mc06.manuscriptcentral.com/apnm-pubs
Applied Physiology, Nutrition, and Metabolism
Draft
15
Acknowledgements
The Health Outcomes and Physical Activity in Preschoolers study was funded by the Canadian
Institutes of Health Research (award # 102560). BWT was supported by a CIHR New
Investigator Salary Award and an Early Researcher Award from the Ontario Ministry of
Economic Development and Innovation.
Conflict of Interest Disclaimer
The authors report no conflicts of interest associated with this manuscript.
Page 15 of 22
https://mc06.manuscriptcentral.com/apnm-pubs
Applied Physiology, Nutrition, and Metabolism
Draft
16
References
Adam, C. 1988. Eurofit: Handbook for the eurofit tests of physical fitness. Italian National
Olympic Committee, Central Direction for Sport’s Technical Activities
Documentation and Information Division.
Artero, E., Espana-Romero, V., Castro-Pinero, J., Ortega, F., Suni, J., Castillo-Garzon, M., and
Ruiz, J. 2011. Reliability of field-based fitness tests in youth. Int. J. Sports Med. 32(3):
159.
Baquet, G., Stratton, G., Van Praagh, E., and Berthoin, S. 2007. Improving physical activity
assessment in prepubertal children with high-frequency accelerometry monitoring:
A methodological issue. Prev. Med. 44(2): 143–147.
doi:10.1016/j.ypmed.2006.10.004.
Barnekow-Bergkvist, M., Hedberg, G., Pettersson, U., and Lorentzon, R. 2006. Relationships
between physical activity and physical capacity in adolescent females and bone
mass in adulthood. Scand. J. Med. Sci. Sports 16(6): 447–455. doi:10.1111/j.1600-
0838.2005.00500.x.
Bar-Or, O. 1987. The Wingate anaerobic test an update on methodology, reliability and
validity. Sports Med. 4(6): 381–394.
Bénéfice, E., Fouéré, T., and Malina, R. 1999. Early nutritional history and motor
performance of Senegalese children, 4-6 years of age. Ann. Hum. Biol. 26(5): 443–
455.
Bongers, B.C., Werkman, M.S., Blokland, D., Eijsermans, M.J., Van der Torre, P., Bartels, B.,
Verschuren, O., and Takken, T. 2015. Validity of the Pediatric Running-Based
Page 16 of 22
https://mc06.manuscriptcentral.com/apnm-pubs
Applied Physiology, Nutrition, and Metabolism
Draft
17
Anaerobic Sprint Test to Determine Anaerobic Performance in Healthy Children.
Pediatr. Exerc. Sci. 27(2): 268–276. doi:10.1123/pes.2014-0078.
Bruininks, R.H., and Bruininks, B.D. 2005. Bruininks-Oseretsky Test of Motor Proficiency,
Second Edition (BOT-2). Pearson Assessment, Minneapolis, MN.
Caldwell, H.A.T., Proudfoot, N.A., King-Dowling, S., Di Cristofaro, N.A., Cairney, J., and
Timmons, B.W. 2016. Tracking of physical activity and fitness during the early years.
Appl. Physiol. Nutr. Metab. doi:10.1139/apnm-2015-0338.
Canadian Association for Health Physical Education and Recreation. 1966. The CAHPER
fitness-performance test manual for boys and girls 7 to 17 years of age. CAHPER,
Ottawa.
Castro-Piñero, J., Artero, E.G., España-Romero, V., Ortega, F.B., Sjöström, M., Suni, J., and
Ruiz, J.R. 2010a. Criterion-related validity of field-based fitness tests in youth: a
systematic review. Br. J. Sports Med. 44(13): 934–943.
doi:10.1136/bjsm.2009.058321.
Castro-Piñero, J., Ortega, F.B., Artero, E.G., Girela-Rejón, M.J., Mora, J., Sjöström, M., and Ruiz,
J.R. 2010b. Assessing Muscular Strength in Youth: Usefulness of Standing Long Jump
as a General Index of Muscular Fitness: J. Strength Cond. Res. 24(7): 1810–1817.
doi:10.1519/JSC.0b013e3181ddb03d.
Fernandez-Santos, J.R., Ruiz, J.R., Cohen, D.D., Gonzalez-Montesinos, J.L., and Castro-Piñero,
J. 2015. Reliability and Validity of Tests to Assess Lower-Body Muscular Power in
Children: J. Strength Cond. Res. 29(8): 2277–2285.
doi:10.1519/JSC.0000000000000864.
Page 17 of 22
https://mc06.manuscriptcentral.com/apnm-pubs
Applied Physiology, Nutrition, and Metabolism
Draft
18
Freedson, P.S., Cureton, K.J., and Heath, G.W. 2000. Status of Field-Based Fitness Testing in
Children and Youth. Prev. Med. 31(2): S77–S85. doi:10.1006/pmed.2000.0650.
Fry, A.C., Irwin, C.C., Nicoll, J.X., and Ferebee, D.E. 2015. Muscular Strength and Power in 3-
to 7-Year-Old Children. Pediatr. Exerc. Sci. 27(3): 345–354. doi:10.1123/pes.2014-
0152.
Hoffman, J.R., Epstein, S., Einbinder, M., and Weinstein, Y. 2000. A Comparison Between the
Wingate Anaerobic Power Test to Both Vertical Jump and Line Drill Tests in
Basketball Players. J. Strength Cond. Res. 14(3): 261–264.
Kemper, H.C.G., Twisk, J.W.R., van Mechelen, W., Post, G.B., Roos, J.C., and Lips, P. 2000. A
fifteen-year longitudinal study in young adults on the relation of physical activity
and fitness with the development of the bone mass: the Amsterdam Growth and
Health Longitudinal Study. Bone 27(6): 847–853. doi:10.1016/S8756-
3282(00)00397-5.
Kuczmarski, R.J., Ogden, C.L., Guo, S.S., Grummer-Strawn, L.M., Flegal, K.M., Mei, Z., Wei, R.,
Curtin, L.R., Roche, A.F., and Johnson, C.L. 2002. 2000 CDC Growth Charts for the
United States: methods and development. Vital Health Stat. 11. (246): 1–190.
Lopes, Ví.P., Maia, J.A.R., Rodrigues, L.P., and Malina, R. 2012. Motor coordination, physical
activity and fitness as predictors of longitudinal change in adiposity during
childhood. Eur. J. Sport Sci. 12(4): 384–391. doi:10.1080/17461391.2011.566368.
Milliken, L.A., Faigenbaum, A.D., Loud, R.L., and Westcott, W.L. 2008. Correlates of Upper
and Lower Body Muscular Strength in Children: J. Strength Cond. Res. 22(4): 1339–
1346. doi:10.1519/JSC.0b013e31817393b1.
Page 18 of 22
https://mc06.manuscriptcentral.com/apnm-pubs
Applied Physiology, Nutrition, and Metabolism
Draft
19
Nguyen, T., Obeid, J., and Timmons, B.W. 2011. Reliability of fitness measures in 3- to 5-
year-old children. Pediatr. Exerc. Sci. 23(2): 250–260.
Oja, L., and Jürimäe, T. 1997. Assessment of motor ability of 4‐and 5‐year‐old children.
Am. J. Hum. Biol. 9(5): 659–664.
Ortega, F.B., Cadenas-Sánchez, C., Sánchez-Delgado, G., Mora-González, J., Martínez-Téllez,
B., Artero, E.G., Castro-Piñero, J., Labayen, I., Chillón, P., and Löf, M. 2015. Systematic
review and proposal of a field-based physical fitness-test battery in preschool
children: the PREFIT battery. Sports Med. 45(4): 533–555.
Ortega, F.B., Ruiz, J.R., Castillo, M.J., and Sjöström, M. 2008. Physical fitness in childhood and
adolescence: a powerful marker of health. Int. J. Obes. 32(1): 1–11.
doi:10.1038/sj.ijo.0803774.
Pate, R., Oria, M., and Pillsbury, L. 2012. Fitness measures and health outcomes in youth.
National Academies Press.
Plowman, S.A. 2014. Top 10 Research Questions Related to Musculoskeletal Physical
Fitness Testing in Children and Adolescents. Res. Q. Exerc. Sport 85(2): 174–187.
doi:10.1080/02701367.2014.899857.
Ruiz, J.R., Castro-Piñero, J., España-Romero, V., Artero, E.G., Ortega, F.B., Cuenca, M.M.,
Jimenez-Pavón, D., Chillón, P., Girela-Rejón, M.J., Mora, J., Gutiérrez, Á., Suni, J.,
Sjöström, M., and Castillo, M.J. 2011. Field-based fitness assessment in young people:
the ALPHA health-related fitness test battery for children and adolescents. Br. J.
Sports Med. 45(6): 518–524. doi:10.1136/bjsm.2010.075341.
Safrit, M.J. 1990. The validity and reliability of fitness tests for children: a review. Pediatr.
Exerc. Sci. 2(1): 9–28.
Page 19 of 22
https://mc06.manuscriptcentral.com/apnm-pubs
Applied Physiology, Nutrition, and Metabolism
Draft
20
Smith, J.J., Eather, N., Morgan, P.J., Plotnikoff, R.C., Faigenbaum, A.D., and Lubans, D.R. 2014.
The Health Benefits of Muscular Fitness for Children and Adolescents: A Systematic
Review and Meta-Analysis. Sports Med. 44(9): 1209–1223. doi:10.1007/s40279-
014-0196-4.
Tharp, G.D., Newhouse, R.K., Uffelman, L., Thorland, W.G., and Johnson, G.O. 1985.
Comparison of Sprint and Run Times with Performance on the Wingate Anaerobic
Test. Res. Q. Exerc. Sport 56(1): 73–76. doi:10.1080/02701367.1985.10608434.
Timmons, B.W., Proudfoot, N.A., MacDonald, M.J., Bray, S.R., and Cairney, J. 2012. The health
outcomes and physical activity in preschoolers (HOPP) study: rationale and design.
BMC Public Health 12: 284. doi:10.1186/1471-2458-12-284.
Van Praagh, E., and Doré, E. 2002. Short-term muscle power during growth and maturation.
Sports Med. 32(11): 701–728.
Page 20 of 22
https://mc06.manuscriptcentral.com/apnm-pubs
Applied Physiology, Nutrition, and Metabolism
Draft
1
Table 1: Participant characteristics
Variable Mean ± SD Median (Range)
Age (years) 4.6 ± 0.9 4.7 (3.0-6.0)
Height (cm) 107.1 ± 7.5 107.5 (89.9-126.1)
Weight (kg) 18.1 ± 3.1 17.7 (12.1-34.2)
BMI (%ile)* 52.7 ± 28.4 55.6 (0.0-99.6)
Fitness Measures
LJ (in) 28.9 ± 10.0 31.0 (3.0-54.0)
SRT (s) 12.0 ± 2.0 11.6 (8.3-20.1)
PP (W) 93.9 ± 37.6 94.1 (17.1-244.3)
*Based on the Centre for Disease Control data (Kuczmarski et al. 2002) BMI, body mass index;
LJ, long jump; SRT, shuttle run time, PP, peak power
Page 21 of 22
https://mc06.manuscriptcentral.com/apnm-pubs
Applied Physiology, Nutrition, and Metabolism
Draft
1
Table 2. Regression models predicting PP (W) from age, sex, weight and field assessments in
preschool children.
Model 1 Model 2 Model 3 Model 4
Intercept -111.01 -4.87 -97.68 -19.12**
Age (years) 0.32 (1.34)** 0.16 (1.51)** 0.20 (1.52)** 0.13 (1.54)
Sex 0.06 (1.83)* 0.05 (1.68)* 0.05 (1.73)* 0.05 (1.65)*
Weight (kg) 0.65 (0.35)** 0.61 (0.32)** 0.61 (0.34)** 0.58 (0.32)**
LJ (in) 0.23 (0.12) ** 0.13 (0.13)**
SRT (s) -0.28 (0.59)** -0.23 (0.66)**
Adjusted R2 0.77** 0.81** 0.79** 0.82**
Results presented as β(SE). *=p<.05, **=p<.01; SRT, shuttle run time; LJ, long jump. Model 1
(age, sex and weight), n=393; model 2 (SRT), n=380; model 3 (LJ), n=376; model 4 (SRT and
LJ), n=366
Page 22 of 22
https://mc06.manuscriptcentral.com/apnm-pubs
Applied Physiology, Nutrition, and Metabolism