Embed Size (px)
Citation preview
Assimila'on of MOPITT observa'ons using DART and CAM-‐CHEM: Constraints on CO concentra'ons and emissions
Benjamin Gaubert1
Jérôme Barré1, Helen Worden1, Louisa Emmons1, Chris'ne Wiedinmyer1, Simone Tilmes1, Arthur Mizzi1, David Edwards1 and Jeffrey Anderson2
1NCAR, Atmospheric Chemistry Division 2NCAR, Ins'tute for Mathema'cs Applied for Geo-‐Sciences

q Global CO analysis using CAM-‐CHEM with DART-‐EAKF
Ø To produce 6-‐hourly analysis (both meteorology and CO)
Ø CO spaHo-‐temporal variability, emissions and trends analysis
q InvesHgate the state augmentaHon approach Ø To evaluate interacHon with meteorology (see poster of J. Barré) Ø To esHmate CO emissions Ø Co-‐emiPed species, i.e VOCs emissions, BB aerosols
AssimilaHon of CO profiles in CAM-‐CHEM
www.image.ucar.edu/DAReS/DART
Anderson et al. 2009, Raeder et al. 2012 Arellano et al. 2006, 2010, Barré et al. 2014 in prep
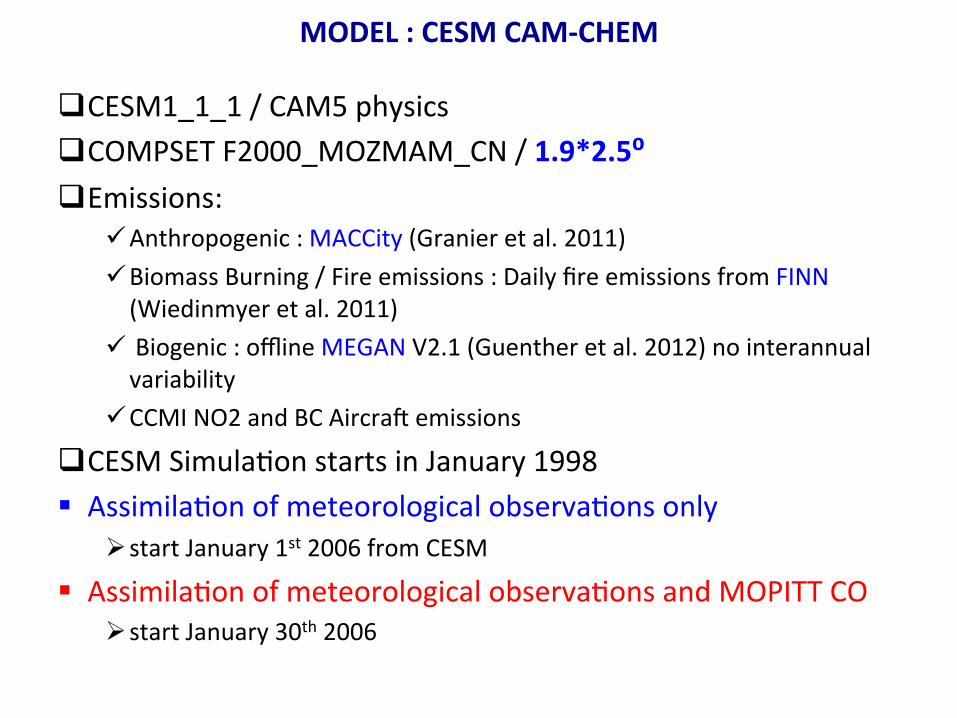
MODEL : CESM CAM-‐CHEM
q CESM1_1_1 / CAM5 physics q COMPSET F2000_MOZMAM_CN / 1.9*2.5⁰ q Emissions:
ü Anthropogenic : MACCity (Granier et al. 2011) ü Biomass Burning / Fire emissions : Daily fire emissions from FINN (Wiedinmyer et al. 2011)
ü Biogenic : offline MEGAN V2.1 (Guenther et al. 2012) no interannual variability
ü CCMI NO2 and BC Aircrab emissions q CESM Simula'on starts in January 1998 § Assimila'on of meteorological observa'ons only
Ø start January 1st 2006 from CESM
§ Assimila'on of meteorological observa'ons and MOPITT CO Ø start January 30th 2006
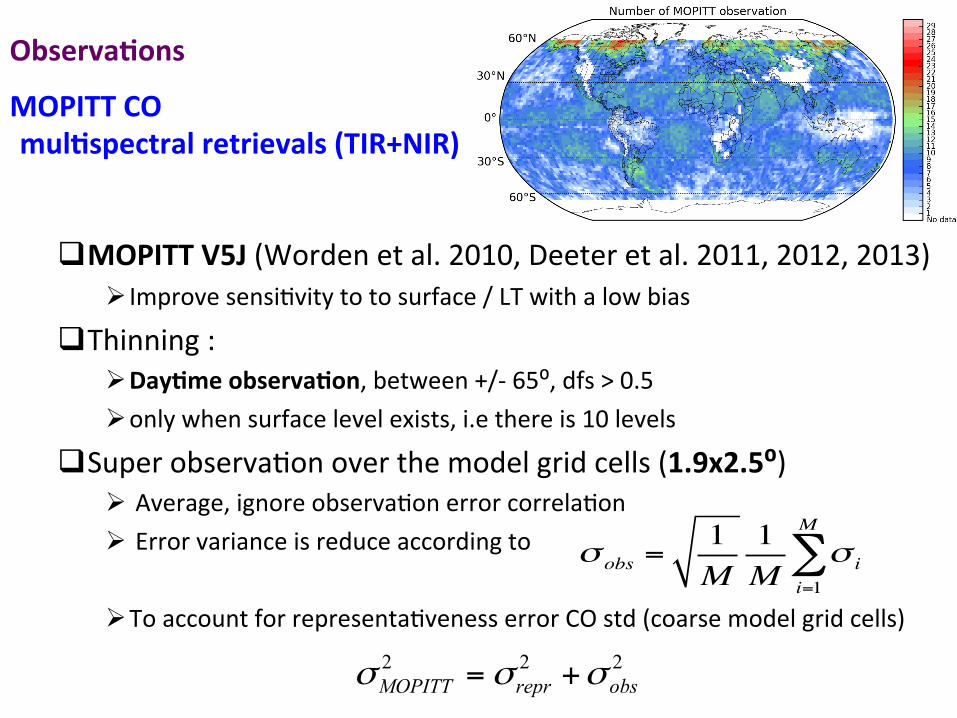
ObservaHons
MOPITT CO mulHspectral retrievals (TIR+NIR)
q MOPITT V5J (Worden et al. 2010, Deeter et al. 2011, 2012, 2013)
Ø Improve sensi'vity to to surface / LT with a low bias
q Thinning : Ø DayHme observaHon, between +/-‐ 65⁰, dfs > 0.5 Ø only when surface level exists, i.e there is 10 levels
q Super observa'on over the model grid cells (1.9x2.5⁰) Ø Average, ignore observa'on error correla'on Ø Error variance is reduce according to
Ø To account for representa'veness error CO std (coarse model grid cells)
σ obs =1M
1M
σ ii=1
M
∑
222obsreprMOPITT σσσ +=
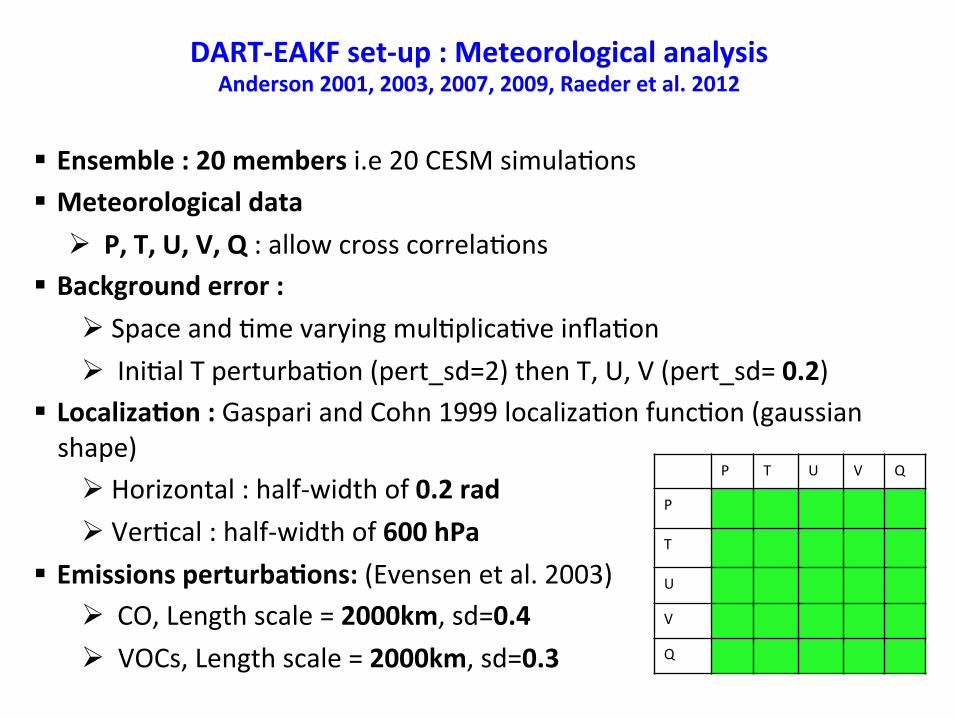
§ Ensemble : 20 members i.e 20 CESM simula'ons § Meteorological data
Ø P, T, U, V, Q : allow cross correla'ons § Background error :
Ø Space and 'me varying mul'plica've infla'on Ø Ini'al T perturba'on (pert_sd=2) then T, U, V (pert_sd= 0.2)
§ LocalizaHon : Gaspari and Cohn 1999 localiza'on func'on (gaussian shape) Ø Horizontal : half-‐width of 0.2 rad Ø Ver'cal : half-‐width of 600 hPa
§ Emissions perturbaHons: (Evensen et al. 2003) Ø CO, Length scale = 2000km, sd=0.4 Ø VOCs, Length scale = 2000km, sd=0.3
DART-‐EAKF set-‐up : Meteorological analysis Anderson 2001, 2003, 2007, 2009, Raeder et al. 2012
P T U V Q
P
T
U
V
Q
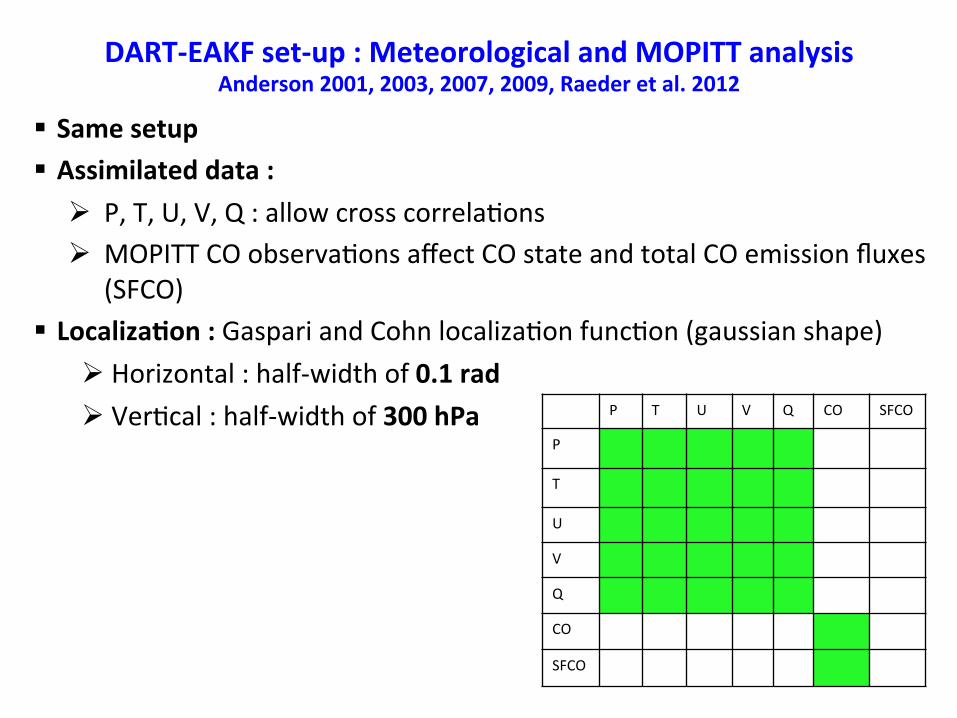
§ Same setup § Assimilated data :
Ø P, T, U, V, Q : allow cross correla'ons Ø MOPITT CO observa'ons affect CO state and total CO emission fluxes
(SFCO) § LocalizaHon : Gaspari and Cohn localiza'on func'on (gaussian shape)
Ø Horizontal : half-‐width of 0.1 rad Ø Ver'cal : half-‐width of 300 hPa
DART-‐EAKF set-‐up : Meteorological and MOPITT analysis Anderson 2001, 2003, 2007, 2009, Raeder et al. 2012
P T U V Q CO SFCO
P
T
U
V
Q
CO
SFCO
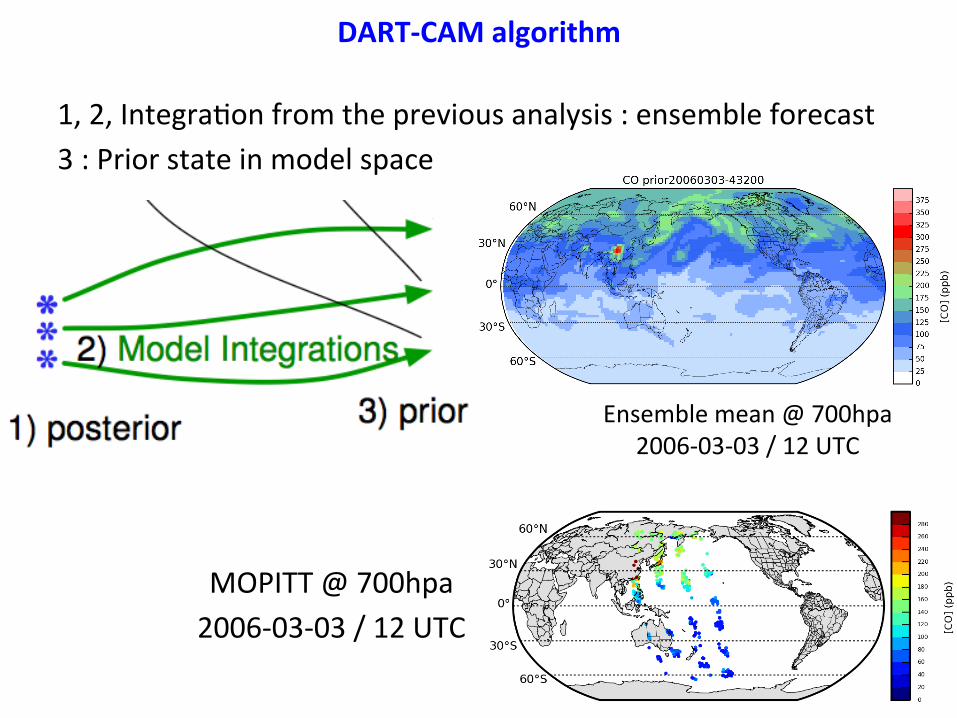
DART-‐CAM algorithm
MOPITT @ 700hpa 2006-‐03-‐03 / 12 UTC
1, 2, Integra'on from the previous analysis : ensemble forecast 3 : Prior state in model space
Ensemble mean @ 700hpa 2006-‐03-‐03 / 12 UTC
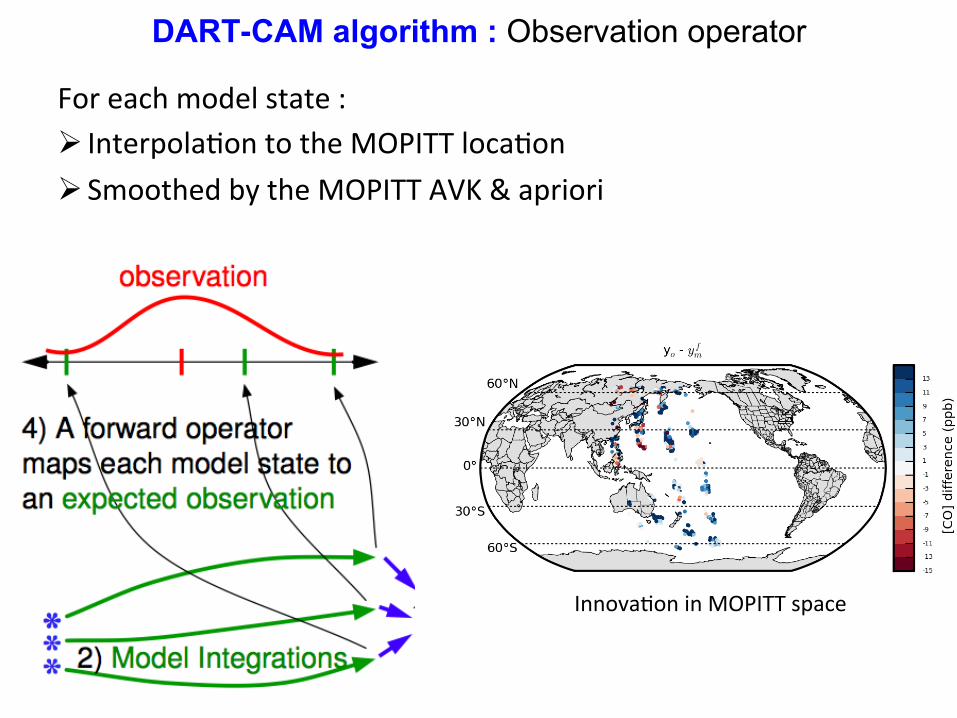
DART-CAM algorithm : Observation operator
For each model state : Ø Interpola'on to the MOPITT loca'on Ø Smoothed by the MOPITT AVK & apriori
Innova'on in MOPITT space
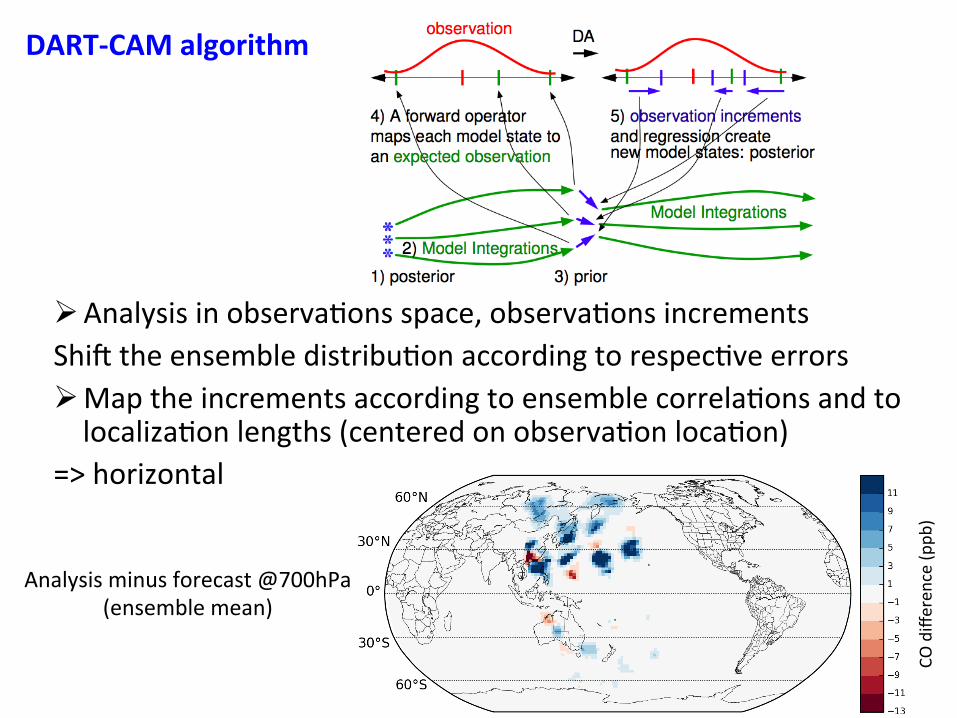
DART-‐CAM algorithm
Ø Analysis in observa'ons space, observa'ons increments Shib the ensemble distribu'on according to respec've errors Ø Map the increments according to ensemble correla'ons and to localiza'on lengths (centered on observa'on loca'on)
=> horizontal
CO differen
ce (p
pb)
Analysis minus forecast @700hPa (ensemble mean)

MOPITT CO analysis verHcal localizaHon : weighted mean of sensiHvity
ObservaHon locaHon are the center of the localizaHon funcHon
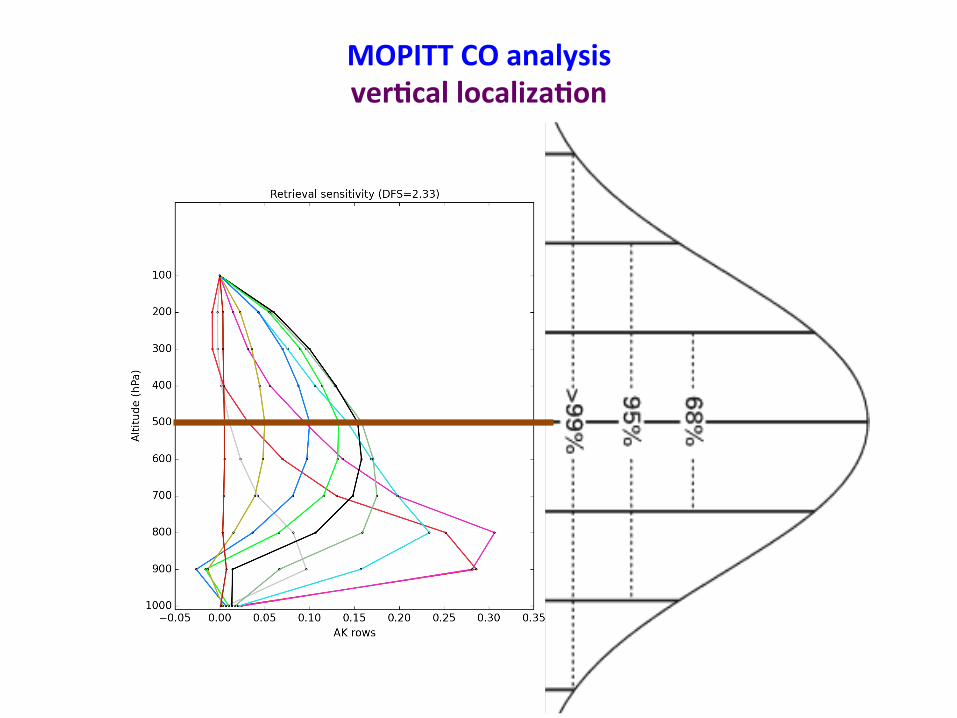
MOPITT CO analysis verHcal localizaHon

Results against MOPITT (diagnosHcs in observaHon space) Mean of RCRV staHsHcs = bias weighted by prescribed errors
Met analysis Met & MOPITT prior
Met & MOPITT posterior

EvaluaHon of analyses vs MOPITT March 2006, @300hPa
Ø Huge reduc'on of the bias on average Ø Residual bias in the tropics but actually come from MOPITT (Deeter et al. 2012)

EvaluaHon of analyses vs MOPITT March 2006, @800hPa
Ø Bias reduc'on of con'nental ouqlow Ø Spurious correla'ons in tropical atlan'c / pacific Ø Residual underes'ma'on in the northern
pacific, equatorial atlan'c
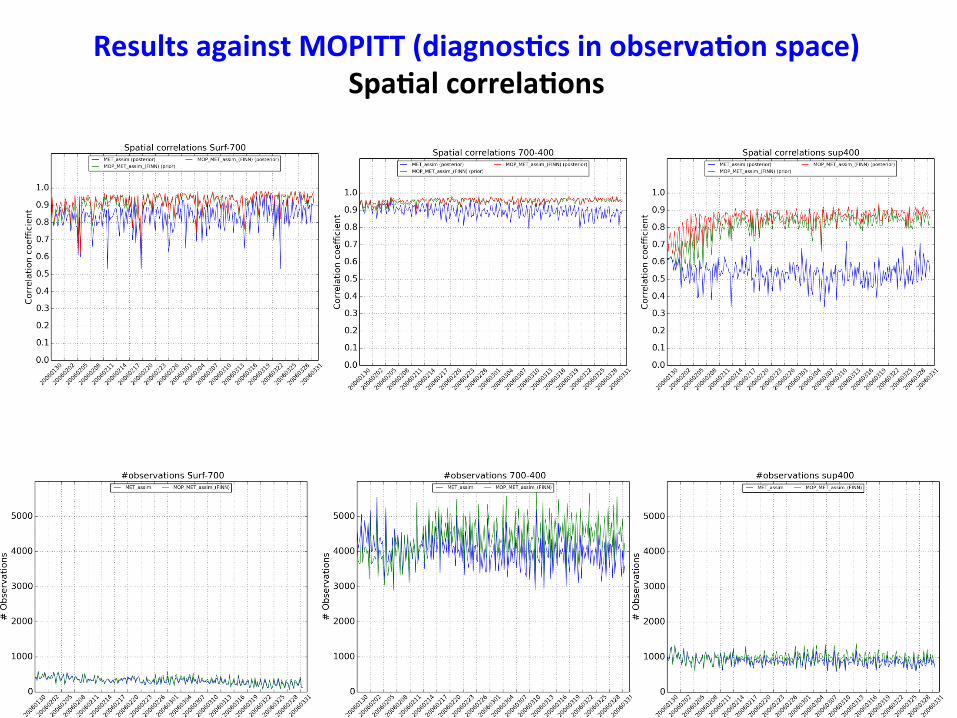
Results against MOPITT (diagnosHcs in observaHon space) SpaHal correlaHons

Comparison with NASA/Intex B DC8 flight (March 2006)
All the flights are considered (average in in 50hPa bin, outside Mexico city)
Average CO Bias and RMSE Number of observa'ons
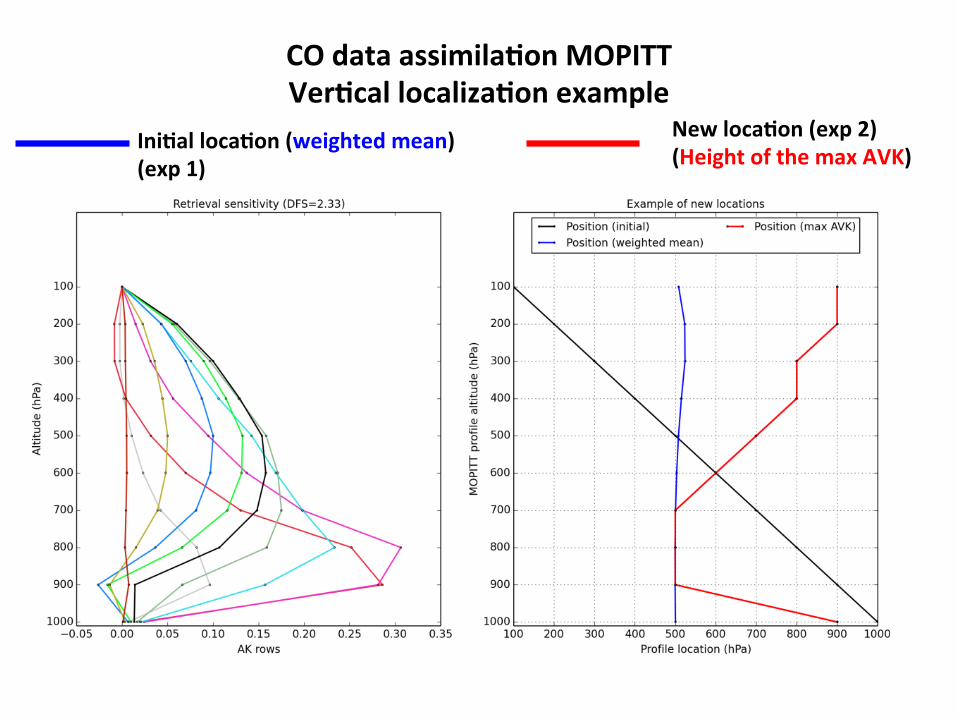
CO data assimilaHon MOPITT VerHcal localizaHon example
IniHal locaHon (weighted mean) (exp 1)
New locaHon (exp 2) (Height of the max AVK)
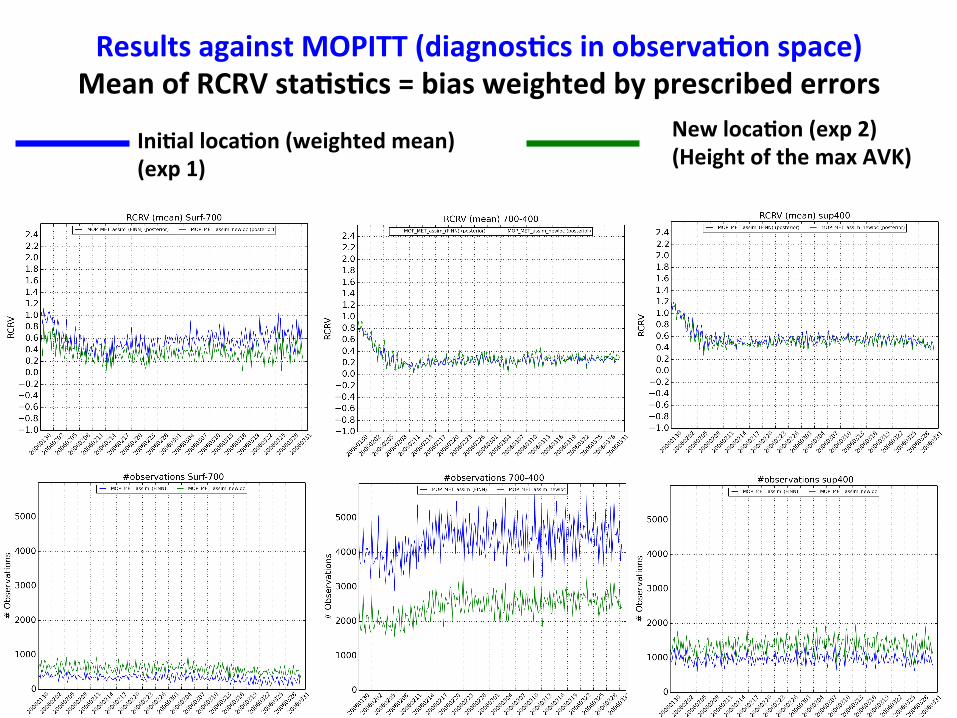
Results against MOPITT (diagnosHcs in observaHon space) Mean of RCRV staHsHcs = bias weighted by prescribed errors
IniHal locaHon (weighted mean) (exp 1)
New locaHon (exp 2) (Height of the max AVK)

Emissions correcHons
IniHal locaHon (weighted mean) (exp 1)
New locaHon (exp 2) (Height of the max AVK)
RelaHve emissions difference (a posteriori – a priori) / March 2006 in total emissions fluxes

Comparison with NASA/Intex B DC8 flight (March 2006)
All the flights are considered (average in in 50hPa bin, outside Mexico city)
Average CO Bias and RMSE Number of observa'ons

Conclusions Ø MOPITT CO state is correctly assimilated within CAM-‐CHEM
Ø Es'ma'on of CO emissions fluxes shows reasonable correla'on and spa'o-‐temporal paserns, need to introduce beser temporal correla'on or a smoothers
Ø The ensemble spread reflects errors from meteorology and emissions, then
Ø Further work needs to be done from VOCs sources of CO, both from their concentra'ons and emissions
Ø Check changes in oxida've capacity