Embed Size (px)
Citation preview

Advisory Committee on Assisted Reproductive Technology
Assisted Reproductive Technology
in New Zealand 2014
Published November 2017
ii Assisted Reproductive Technology in New Zealand 2014
This report has been prepared for the Advisory Committee on Assisted Reproductive Technology by the Perinatal and Reproductive Epidemiology Research Unit (PRERU) of the University of New South Wales. PRERU has provided the data and analysis.
Citation: ACART. 2017. Assisted Reproductive Technology in New Zealand 2014. Wellington: Advisory Committee on Assisted Reproductive Technology.
Published in November 2017 by the Advisory Committee on Assisted Reproductive Technology, PO Box 5013, Wellington 6145, New Zealand
ISBN: 978-1-98-853922-5 (online) HP 6724
This document is available on the ACART website: www.acart.health.govt.
Assisted Reproductive Technology in New Zealand 2014 iii
Foreword
On behalf of the Advisory Committee on Assisted Reproductive Technology (ACART), I am
pleased to present this report, Assisted Reproductive Technology in New Zealand 2014, the sixth
New Zealand-specific report based on the Australian and New Zealand Assisted
Reproduction Database (ANZARD).
The report provides a quantitative report of the numbers, types and outcomes of assisted
reproductive technology in New Zealand. It gives a fuller picture of the uses and outcomes
of assisted reproductive procedures in New Zealand.
One of ACART’s functions is to monitor the application and health outcomes of assisted
reproductive treatments. New Zealand has good data about some uses of assisted
reproduction. The Ethics Committee on Assisted Reproductive Technology provides an
Annual Report that includes data about procedures that require ethical approval. District
health boards hold information about publicly funded procedures. However, New Zealand
lacks one collated source of comprehensive data looking at the full spectrum of procedures
carried out, regardless of how they are funded or categorised in New Zealand’s regulatory
framework.
The well-established ANZARD report in most cases aggregates data from Australia and
New Zealand. This means that the report, while valuable and comprehensive, lacks New
Zealand-specific detail. There are significant variations in the regulatory frameworks and
funding arrangements for assisted reproductive technology in each country, and in patterns
of usage. For these reasons, ACART decided in 2010 to commission New Zealand-specific
reports from the ANZARD data.
We hope that the report will be useful to consumers, fertility services providers and others
with an interest in how New Zealanders are using assisted reproductive technology. With
successive annual reports, we will begin to build a picture of use and trends over time.
The Ministry of Health has supported ACART in obtaining this report. I would also like to
thank the National Perinatal Epidemiology and Statistics Unit at the University of New
South Wales for collaborating with ACART to develop the report.
Gillian Ferguson
Chair, Advisory Committee on Assisted Reproductive Technology
November 2017
iv Assisted Reproductive Technology in New Zealand 2014
Acknowledgments
The Australian and New Zealand Assisted Reproduction Database (ANZARD), funded by the Fertility Society of Australia (FSA), is a collaborative effort between the National Perinatal Epidemiology and Statistics Unit (NPESU) and fertility centres in Australia and New Zealand. The NPESU is a unit within the Centre for Big Data Research in Health and the School of Women's and Children's Health of UNSW Sydney (University of New South Wales).
We would like to thank all staff in the fertility centres for their efforts in compiling the data and providing additional information when requested. A complete list of all contributing fertility clinics can be found in Appendix A.
Abbreviations
ANZARD Australian and New Zealand Assisted Reproduction Database
ART assisted reproductive technology
DET double embryo transfer
DI donor sperm insemination
FSA Fertility Society of Australia
FSH follicle stimulating hormone
ICSI intracytoplasmic sperm injection
IVF in vitro fertilisation
NPESU National Perinatal Epidemiology and Statistics Unit
OPU oocyte pick-up
PGD preimplantation genetic diagnosis
SET single embryo transfer
UNSW University of New South Wales
Symbols
–

Assisted Reproductive Technology in New Zealand 2014 v
Contents
Foreword ........................................................................................................................................ iii
Summary ........................................................................................................................................ ix
Use of ART treatment cycles ...................................................................................................................... ix
Treatment outcomes and number of babies ............................................................................................. ix
Women’s age and parity ............................................................................................................................ ix
Autologous fresh cycles .............................................................................................................................. ix
Autologous thaw cycles .............................................................................................................................. ix
Deliveries by gestation and women’s age ................................................................................................... x
Cumulative live birth rates .......................................................................................................................... x
1 Introduction ............................................................................................................................. 1
Treatments covered in this report .............................................................................................................. 1
Data used in this report ............................................................................................................................... 2
Structure of this report ............................................................................................................................... 2
2 Overview of ART treatment in 2014 ...................................................................................... 4
3 Autologous and donation/recipient cycles in 2014 ............................................................. 5
Overview of autologous and recipient cycles ............................................................................................. 5
Autologous fresh cycles ............................................................................................................................... 9
Autologous thaw cycles ............................................................................................................................. 11
Donation and recipient cycles ................................................................................................................... 12
4 Pregnancy and birth outcomes following autologous and recipient cycles in 2014 .... 15
Early pregnancy loss .................................................................................................................................. 15
Deliveries by delivery outcomes and treatment type ............................................................................... 16
Deliveries by maternal age ........................................................................................................................ 16
Gestational age of babies .......................................................................................................................... 17
Birth outcomes .......................................................................................................................................... 18
5 Preimplantation genetic diagnosis in 2014 ........................................................................ 19
6 Donor insemination cycles in 2014 ..................................................................................... 20
Clinical pregnancies following DI cycles .................................................................................................... 20
Perinatal outcomes of babies .................................................................................................................... 20
7 Trends in ART treatment and outcomes 2010-2014 .......................................................... 21
8 Cumulative success rates for women undertaking autologous treatment 2012 to 2014
22
Appendix A: Contributing fertility clinics .................................................................................. 27

vi Assisted Reproductive Technology in New Zealand 2014
Appendix B: Data used in this report ......................................................................................... 28
Glossary ........................................................................................................................................ 30
References .................................................................................................................................... 33
Assisted Reproductive Technology in New Zealand 2014 vii
List of tables Table 1: Number of initiated ART treatment cycles by treatment type, New Zealand, 2014 ...................4
Table 2: Number of autologous and recipient cycles by women’s age group and treatment type, New
Zealand, 2014 .........................................................................................................................6
Table 3: Number of autologous and recipient cycles by partners’ age group and treatment type, New
Zealand, 2014 .........................................................................................................................6
Table 4: Number of autologous and recipient cycles by parity and treatment type, New Zealand, 2014 6
Table 5: Number of autologous and recipient cycles with fertilisation attempted by treatment type and
procedure, New Zealand, 2014 ..............................................................................................7
Table 6: Number of embryo transfer cycles by number of embryos transferred per cycle and women’s
age group, New Zealand, 2014 ..............................................................................................8
Table 7: Number of embryo transfer cycles by treatment type and stage of embryo development, New
Zealand, 2014 .........................................................................................................................8
Table 8: Number of embryo transfer cycles by freezing method and stage of embryo development,
New Zealand, 2014 ................................................................................................................9
Table 9: Outcomes of autologous fresh cycles by women’s age group, New Zealand, 2014 .................9
Table 10: Outcomes of autologous fresh embryo transfer cycles by women’s age and number of
embryos transferred, New Zealand, 2014 ........................................................................... 10
Table 11: Outcomes of autologous fresh embryo transfer cycles by women’s age and stage of embryo
development, New Zealand, 2014 ....................................................................................... 10
Table 12: Outcomes of autologous thaw cycles by women’s age group, New Zealand, 2014 ............. 11
Table 13: Outcomes of autologous thaw embryo transfer cycles by women’s age and number of
embryos transferred, New Zealand, 2014 ........................................................................... 11
Table 14: Outcomes of autologous thaw embryo transfer cycles by women’s age and stage of embryo
development, New Zealand, 2014 ....................................................................................... 12
Table 16: Outcomes of oocyte/embryo recipient cycles by treatment type, New Zealand, 2014 ......... 13
Table 17: Outcomes of oocyte/embryo recipient cycles by recipient’s age group, New Zealand, 2014 13
Table 19: Early pregnancy losses by pregnancy outcome and number of embryos transferred, New
Zealand, 2014 ...................................................................................................................... 15
Table 20: Deliveries by delivery outcome and treatment type, New Zealand, 2014 ............................. 16
Table 21: Deliveries by gestation and maternal age group, New Zealand, 2014 ................................. 16
Table 22: Babies by gestational age and plurality, New Zealand, 2014 ............................................... 17
Table 24: Number of cycles with PGD by type of embryo, New Zealand, 2014 ................................... 19
Table 25: Outcomes of DI cycles by women’s age group, New Zealand, 2014 .................................... 20
Table 26: Number of fresh and thaw cycles by stage/outcome of treatment, New Zealand, 2014 ....... 21
Table 27: Number of cycles by women’s age group for all women who started their first autologous
freshcycle (excluding freeze-all cycles(a)) between 1st January 2012 and 31st December
2012, New Zealand, 2012 to 2014 ...................................................................................... 23
Table 28: Cycle-specific and cumulative live delivery rates for all women who started their first
autologous fresh cycle (excluding freeze-all cycles) between 1st January 2012 and 31st
December 2012, New Zealand, 2012 to 2014 ..................................................................... 24
viii Assisted Reproductive Technology in New Zealand 2014
Table 29: Cycle-specific and cumulative live delivery rates for women aged less than 30 years who
started their first autologous fresh cycle (excluding freeze-all cycles) between 1st January
2012 and 31st December 2012, New Zealand, 2012 to 2014 ............................................. 24
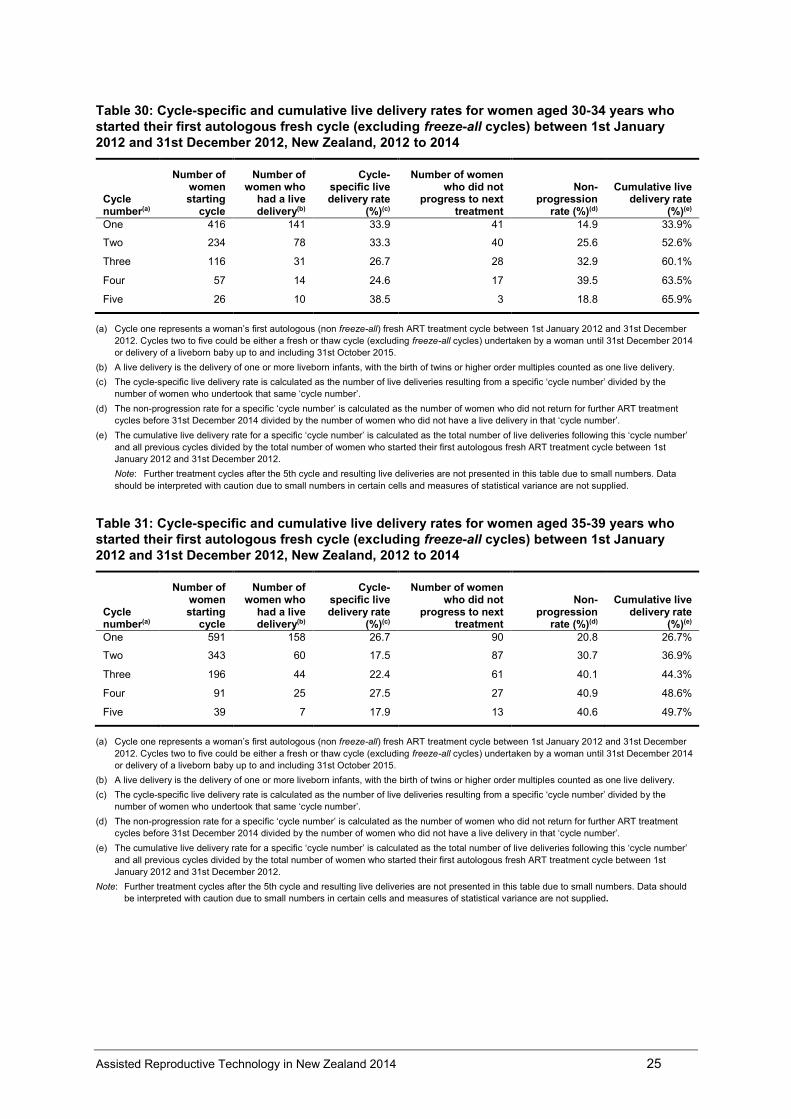
Table 30: Cycle-specific and cumulative live delivery rates for women aged 30-34 years who started
their first autologous fresh cycle (excluding freeze-all cycles) between 1st January 2012
and 31st December 2012, New Zealand, 2012 to 2014 ...................................................... 25
Table 31: Cycle-specific and cumulative live delivery rates for women aged 35-39 years who started
their first autologous fresh cycle (excluding freeze-all cycles) between 1st January 2012
and 31st December 2012, New Zealand, 2012 to 2014 ...................................................... 25
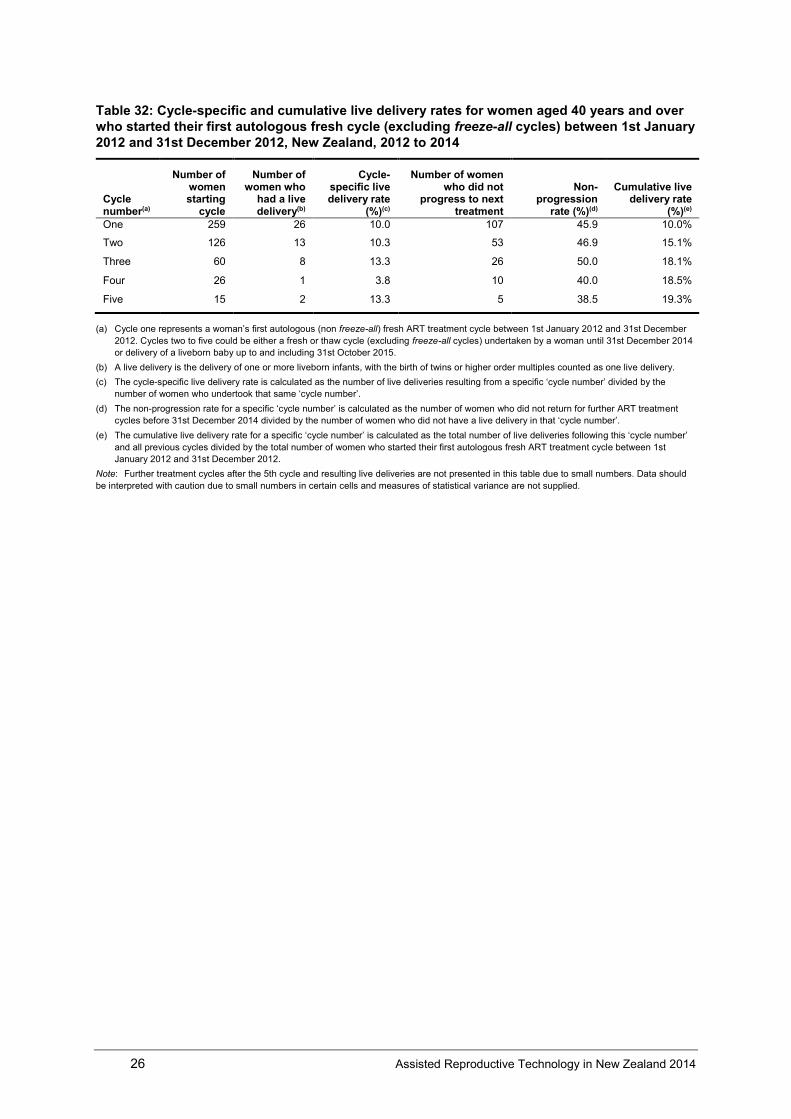
Table 32: Cycle-specific and cumulative live delivery rates for women aged 40 years and over who
started their first autologous fresh cycle (excluding freeze-all cycles) between 1st January
2012 and 31st December 2012, New Zealand, 2012 to 2014 ............................................. 26

Assisted Reproductive Technology in New Zealand 2014 ix
Summary
Use of ART treatment cycles There were 5,891 assisted reproductive technology (ART) treatment cycles reported from New Zealand in 2014. This represented 6.5 cycles per 1,000 women of reproductive age (15-44 years) in New Zealand. Women used their own oocytes/embryos in 93.1% of treatments (autologous), and 39.7% of autologous cycles used frozen/thawed embryos.
Treatment outcomes and number of babies Of all initiated ART treatment cycles performed in 2014, 28.1% (1,655) resulted in a clinical pregnancy and 22.1% (1,302) in a live delivery. There were 1,343 liveborn babies, 80.4% (1,080) were singletons at term (gestational age of 37-41 weeks) with normal birthweight (≥2,500 grams).
Women’s age and parity The average age of women undertaking autologous and oocyte/embryo recipient cycles was 35.6 years. For women undergoing oocyte/embryo recipient cycles, the mean age was 39.7 years, four years older than for autologous cycles (35.4 years).Of all autologous and oocyte/embryo recipient cycles, one in five (20.9%) was undertaken by women aged 40 years or older. Of autologous cycles (fresh and thaw), 70.2% were undertaken by nulliparous women compared with 79.0% for oocyte/embryo recipient cycles.
Autologous fresh cycles The overall live delivery rate per autologous fresh embryo transfer cycle was 28.1%. The highest live delivery rate per autologous fresh embryo transfer cycle was in women aged less than 30 years (41.5%) and declined with advancing women’s age. Overall, 83.4% of autologous fresh embryo transfer cycles were single embryo transfer (SET) cycles, 16.5% were double embryo transfer (DET) cycles and 0.1% had three or more embryos transferred. The rates of clinical pregnancy and live delivery were higher in blastocyst transfer cycles than in cleavage stage embryo transfer cycles regardless of a woman’s age.
Autologous thaw cycles The overall live delivery rate per autologous thaw embryo transfer cycle was 26.5%. The highest live delivery rate per embryo transfer cycle was in women aged 30-34 years (34.3%) and declined with advancing women’s age. Of the 2,065 frozen/thawed embryo transfer cycles 96.5% were SET cycles and 3.5% were DET cycles. Overall, the rates of clinical pregnancy and live delivery were higher in blastocyst transfer cycles than in cleavage stage embryo transfer cycles regardless of a woman’s age.
x Assisted Reproductive Technology in New Zealand 2014
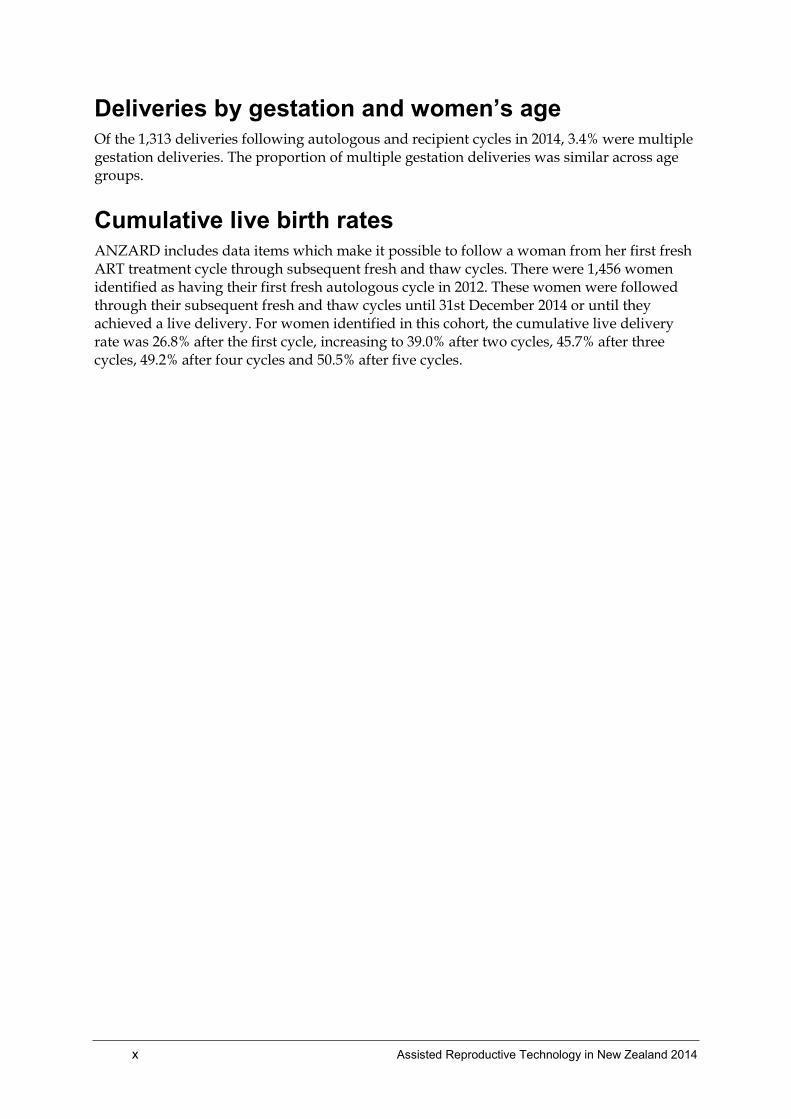
Deliveries by gestation and women’s age Of the 1,313 deliveries following autologous and recipient cycles in 2014, 3.4% were multiple gestation deliveries. The proportion of multiple gestation deliveries was similar across age groups.
Cumulative live birth rates ANZARD includes data items which make it possible to follow a woman from her first fresh ART treatment cycle through subsequent fresh and thaw cycles. There were 1,456 women identified as having their first fresh autologous cycle in 2012. These women were followed through their subsequent fresh and thaw cycles until 31st December 2014 or until they achieved a live delivery. For women identified in this cohort, the cumulative live delivery rate was 26.8% after the first cycle, increasing to 39.0% after two cycles, 45.7% after three cycles, 49.2% after four cycles and 50.5% after five cycles.
Assisted Reproductive Technology in New Zealand 2014 1
1 Introduction
It is estimated that around 15% of couples at any given time experience infertility, representing the source of much personal suffering to millions around the world (World Health Organisation, 2010). The common medical definition of ‘infertility’ is the failure to achieve a clinical pregnancy after 12 or more months of regular unprotected sexual intercourse (Zegers-Hochschild et al. 2009). Infertility is increasingly being overcome through advancements in fertility treatment, in particular assisted reproductive technologies (ARTs). ARTs have evolved over the last three decades into a suite of mainstream medical interventions that have resulted in the birth of more than 6 million children worldwide (ESHRE, 2015).
The purpose of this annual report is to inform clinicians, researchers, government and the community about ART treatment and the resulting pregnancy and birth outcomes; to provide ongoing monitoring of ART treatment practices, success rates and perinatal outcomes; and to provide information for national and international comparisons.
The Fertility Society of Australia (FSA), in collaboration with the University of New South Wales (UNSW), is committed to providing informative annual statistics on ART treatments and is pleased to present the annual report on the use of ART in New Zealand in 2014.
Treatments covered in this report ART is a group of procedures that involve the in vitro (outside of body) handling of human oocytes (eggs) and sperm or embryos for the purposes of establishing a pregnancy (Zegers-Hochschild et al. 2009). A typical fresh in vitro fertilisation (IVF) cycle involves the following five steps:
1. controlled ovarian hyperstimulation during which an ovarian stimulation regimen, typically using follicle stimulating hormone (FSH), is administered to a woman over a number of days to induce the maturation of multiple oocytes
2. oocyte pick-up (OPU) where mature oocytes are aspirated from ovarian follicles
3. fertilisation of the collected oocytes by incubating them with sperm (from the woman’s partner or donor) over a few hours in the laboratory
4. embryo maturation during which a fertilised oocyte is cultured for 2–3 days to form a cleavage stage embryo (6–8 cells) or 5–6 days to create a blastocyst (60–100 cells)
5. transfer of one or more fresh embryos into the uterus in order to achieve pregnancy.
Treatment may be discontinued at any stage during a treatment cycle due to a number of reasons including inadequate response of ovaries to medication, excessive ovarian stimulation, failure to obtain oocytes, failure of oocyte fertilisation, inadequate embryo growth or patient choice.
Over the last three decades, ART has evolved to encompass complex ovarian hyperstimulation protocols and numerous variations to the typical fresh IVF treatment cycle described above. Some of these variations include:
• intracytoplasmic sperm injection (ICSI), when a single sperm is injected directly into the oocyte
• assisted hatching, when the outer layer of the embryo, the zona pellucida, is either thinned or perforated in the laboratory to aid ‘hatching’ of the embryo
• gamete intrafallopian transfer (GIFT), when mature oocytes and sperm are placed directly into a woman’s fallopian tubes so that fertilisation may take place in vivo (inside

2 Assisted Reproductive Technology in New Zealand 2014
the body). While once popular, this procedure now accounts for only a very small percentage of ART cycles
• preimplantation genetic diagnosis (PGD), when one or more cells are removed from the embryo and analysed for chromosomal disorders or genetic diseases
• oocyte donation, when a woman donates her oocytes to others
• oocyte/embryo recipient, when a woman receives oocytes or embryos from another woman
• cryopreservation and storage of embryos that are not transferred in the initial fresh treatment cycle. Once thawed or warmed, the embryos can be transferred in subsequent treatment cycles. Cryopreservation techniques include both the traditional slow freezing method and a newer technique called ‘vitrification’. Vitrification can be used to cryopreserve gametes and embryos, and uses an ultra-rapid temperature change with exposure to higher concentrations of cryoprotectants
• cryopreservation and storage of oocytes and embryos for fertility preservation
• surrogacy arrangements, where a woman, known as the ‘gestational carrier’, agrees to carry a child for another person or couple, known as the ‘intended parent(s)’, with the intention that the child will be raised by the intended parent(s).
Along with ART, a number of other fertility treatments are undertaken in New Zealand. Artificial insemination is one such treatment by which sperm are placed into the female genital tract (for example, intracervical or intrauterine), and can be used with controlled ovarian hyperstimulation or in natural cycles. Artificial insemination can be undertaken using a partner’s sperm, or donated sperm, also known as ‘donor sperm insemination’ (DI).
Data used in this report This report provides information on ART and DI treatments and the resulting pregnancy and birth outcomes. The data presented in this report were supplied by all four fertility centres and compiled into ANZARD.
As a joint initiative of the NPESU and FSA, the Australian and New Zealand Assisted Reproduction Database (ANZARD) was upgraded in 2009 to accommodate new ART treatment types and to transform ANZARD from a cycle-based data collection to a woman-based data collection (ANZARD 2.0). A more detailed description of ANZARD2.0 can be found in Appendix B.
Structure of this report This report has eight chapters, including this introductory chapter (Chapter 1).
Chapter 2—‘Overview of ART treatment in 2014’, provides an outline of the numbers and outcomes of all ART treatments undertaken in New Zealand.
Chapter 3—‘Autologous and donation/recipient cycles in 2014’, presents data on women undergoing treatment, cycle types, and the outcomes of treatment.
Chapter 4—‘Pregnancy and birth outcomes following embryo transfer cycles in 2014’, presents data on the outcomes of clinical pregnancies and deliveries following autologous and recipient cycles including a description of perinatal outcomes.
Chapter 5—‘Preimplantation genetic diagnosis’, includes information on the numbers of embryos that had cells removed and analysed for chromosomal disorders or genetic diseases before transfer.

Assisted Reproductive Technology in New Zealand 2014 3
Chapter 6—‘Donor sperm insemination cycles in 2014’, presents data on DI cycles and their outcomes, including a description of pregnancy and perinatal outcomes.
Chapter 7—‘Trends in ART treatment and outcomes 2010-2014, presents trends in ART treatment over the last five years of data collection in New Zealand.
Chapter 8—‘ Cumulative success rates for women undertaking autologous treatment 2012-2014’, presents information on all women who started their first autologous fresh ART treatment cycle between 1st January 2012 and 31st December 2012.
Appendices—Appendix A lists the contributing fertility clinics. Appendix B provides an overview of the ANZARD2.0 data collection that was used to prepare this report.
4 Assisted Reproductive Technology in New Zealand 2014
2 Overview of ART treatment in 2014
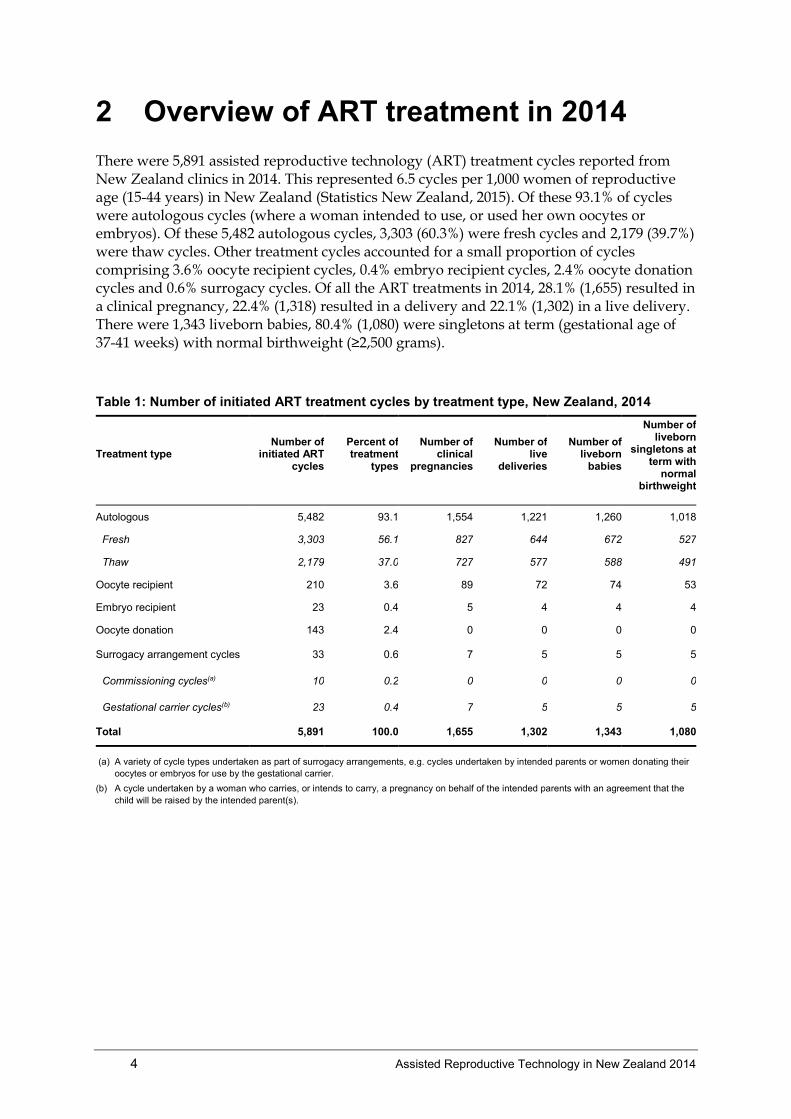
There were 5,891 assisted reproductive technology (ART) treatment cycles reported from New Zealand clinics in 2014. This represented 6.5 cycles per 1,000 women of reproductive age (15-44 years) in New Zealand (Statistics New Zealand, 2015). Of these 93.1% of cycles were autologous cycles (where a woman intended to use, or used her own oocytes or embryos). Of these 5,482 autologous cycles, 3,303 (60.3%) were fresh cycles and 2,179 (39.7%) were thaw cycles. Other treatment cycles accounted for a small proportion of cycles comprising 3.6% oocyte recipient cycles, 0.4% embryo recipient cycles, 2.4% oocyte donation cycles and 0.6% surrogacy cycles. Of all the ART treatments in 2014, 28.1% (1,655) resulted in a clinical pregnancy, 22.4% (1,318) resulted in a delivery and 22.1% (1,302) in a live delivery. There were 1,343 liveborn babies, 80.4% (1,080) were singletons at term (gestational age of 37-41 weeks) with normal birthweight (≥2,500 grams).
Table 1: Number of initiated ART treatment cycles by treatment type, New Zealand, 2014
Treatment type Number of
initiated ART cycles
Percent of treatment
types
Number of clinical
pregnancies
Number of live
deliveries
Number of liveborn
babies
Number of liveborn
singletons at term with
normal birthweight
Autologous 5,482 93.1 1,554 1,221 1,260 1,018
Fresh 3,303 56.1 827 644 672 527
Thaw 2,179 37.0 727 577 588 491
Oocyte recipient 210 3.6 89 72 74 53
Embryo recipient 23 0.4 5 4 4 4
Oocyte donation 143 2.4 0 0 0 0
Surrogacy arrangement cycles 33 0.6 7 5 5 5
Commissioning cycles(a) 10 0.2 0 0 0 0
Gestational carrier cycles(b) 23 0.4 7 5 5 5
Total 5,891 100.0 1,655 1,302 1,343 1,080
(a) A variety of cycle types undertaken as part of surrogacy arrangements, e.g. cycles undertaken by intended parents or women donating their
oocytes or embryos for use by the gestational carrier.
(b) A cycle undertaken by a woman who carries, or intends to carry, a pregnancy on behalf of the intended parents with an agreement that the
child will be raised by the intended parent(s).

Assisted Reproductive Technology in New Zealand 2014 5
3 Autologous and donation/recipient cycles in 2014
This chapter presents data on initiated autologous cycles, oocyte donation cycles and oocyte/embryo recipient cycles.
An ‘autologous cycle’ is defined as an ART treatment cycle in which a woman intends to use, or uses her own oocytes.
A ‘donation cycle’ is defined as an ART treatment cycle in which a woman intends to donate, or donates her oocytes to others. A donation cycle may result in the donation of either oocytes or embryos to a recipient woman. The use of donor sperm does not influence the donor status of the cycle.
A ‘recipient cycle’ is defined as an ART treatment cycle in which a woman receives oocytes or embryos from another woman.
Autologous and donor/recipient cycles can involve the use of, or intended use of, either fresh or frozen/thawed embryos.
Overview of autologous and recipient cycles
Age of women and their partners
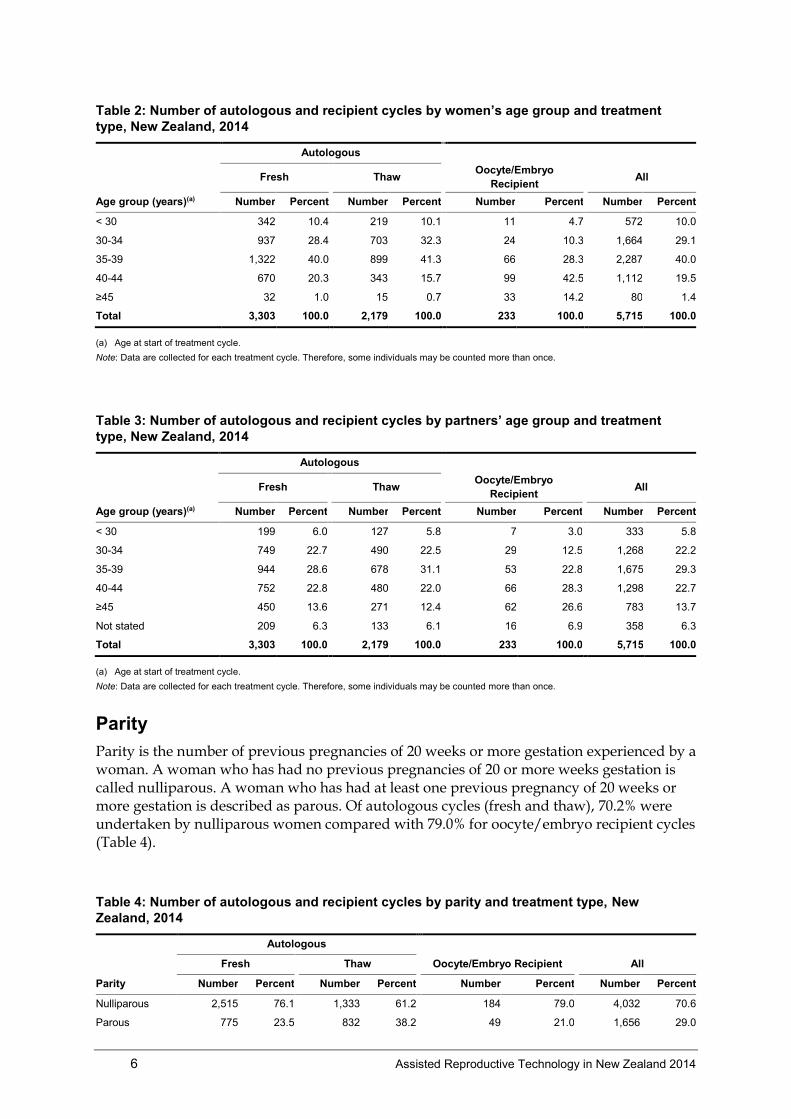
The average age of women undertaking autologous and oocyte/embryo recipient cycles was 35.6 years. For women undergoing oocyte/embryo recipient cycles, the mean age was 39.7 years, four years older than for autologous cycles (35.4 years). Of all autologous and oocyte/embryo recipient cycles, one in five (20.9%) was undertaken by women aged 40 years or older (Table 2). The average age of partners was 38.3 years, with over one-third (36.4%) aged 40 years or older (Table 3).
6 Assisted Reproductive Technology in New Zealand 2014
Table 2: Number of autologous and recipient cycles by women’s age group and treatment
type, New Zealand, 2014
Autologous
Fresh Thaw Oocyte/Embryo
Recipient All
Age group (years)(a) Number Percent Number Percent Number Percent Number Percent
< 30 342 10.4 219 10.1 11 4.7 572 10.0
30-34 937 28.4 703 32.3 24 10.3 1,664 29.1
35-39 1,322 40.0 899 41.3 66 28.3 2,287 40.0
40-44 670 20.3 343 15.7 99 42.5 1,112 19.5
≥45 32 1.0 15 0.7 33 14.2 80 1.4
Total 3,303 100.0 2,179 100.0 233 100.0 5,715 100.0
(a) Age at start of treatment cycle.
Note: Data are collected for each treatment cycle. Therefore, some individuals may be counted more than once.
Table 3: Number of autologous and recipient cycles by partners’ age group and treatment
type, New Zealand, 2014
Autologous
Fresh Thaw Oocyte/Embryo
Recipient All
Age group (years)(a) Number Percent Number Percent Number Percent Number Percent
< 30 199 6.0 127 5.8 7 3.0 333 5.8
30-34 749 22.7 490 22.5 29 12.5 1,268 22.2
35-39 944 28.6 678 31.1 53 22.8 1,675 29.3
40-44 752 22.8 480 22.0 66 28.3 1,298 22.7
≥45 450 13.6 271 12.4 62 26.6 783 13.7
Not stated 209 6.3 133 6.1 16 6.9 358 6.3
Total 3,303 100.0 2,179 100.0 233 100.0 5,715 100.0
(a) Age at start of treatment cycle.
Note: Data are collected for each treatment cycle. Therefore, some individuals may be counted more than once.
Parity
Parity is the number of previous pregnancies of 20 weeks or more gestation experienced by a woman. A woman who has had no previous pregnancies of 20 or more weeks gestation is called nulliparous. A woman who has had at least one previous pregnancy of 20 weeks or more gestation is described as parous. Of autologous cycles (fresh and thaw), 70.2% were undertaken by nulliparous women compared with 79.0% for oocyte/embryo recipient cycles (Table 4).
Table 4: Number of autologous and recipient cycles by parity and treatment type, New
Zealand, 2014
Autologous
Fresh Thaw Oocyte/Embryo Recipient All
Parity Number Percent Number Percent Number Percent Number Percent
Nulliparous 2,515 76.1 1,333 61.2 184 79.0 4,032 70.6
Parous 775 23.5 832 38.2 49 21.0 1,656 29.0
Assisted Reproductive Technology in New Zealand 2014 7
Table 4: Number of autologous and recipient cycles by parity and treatment type, New
Zealand, 2014
Autologous
Fresh Thaw Oocyte/Embryo Recipient All
Parity Number Percent Number Percent Number Percent Number Percent
Not stated 13 0.4 14 0.6 0 0.0 27 0.5
Total 3,303 100.0 2,179 100.0 233 100.0 5,715 100.0
Note: Data are collected for each treatment cycle. Therefore, some individuals may be counted more than once.
Intracytoplasmic sperm injection procedures
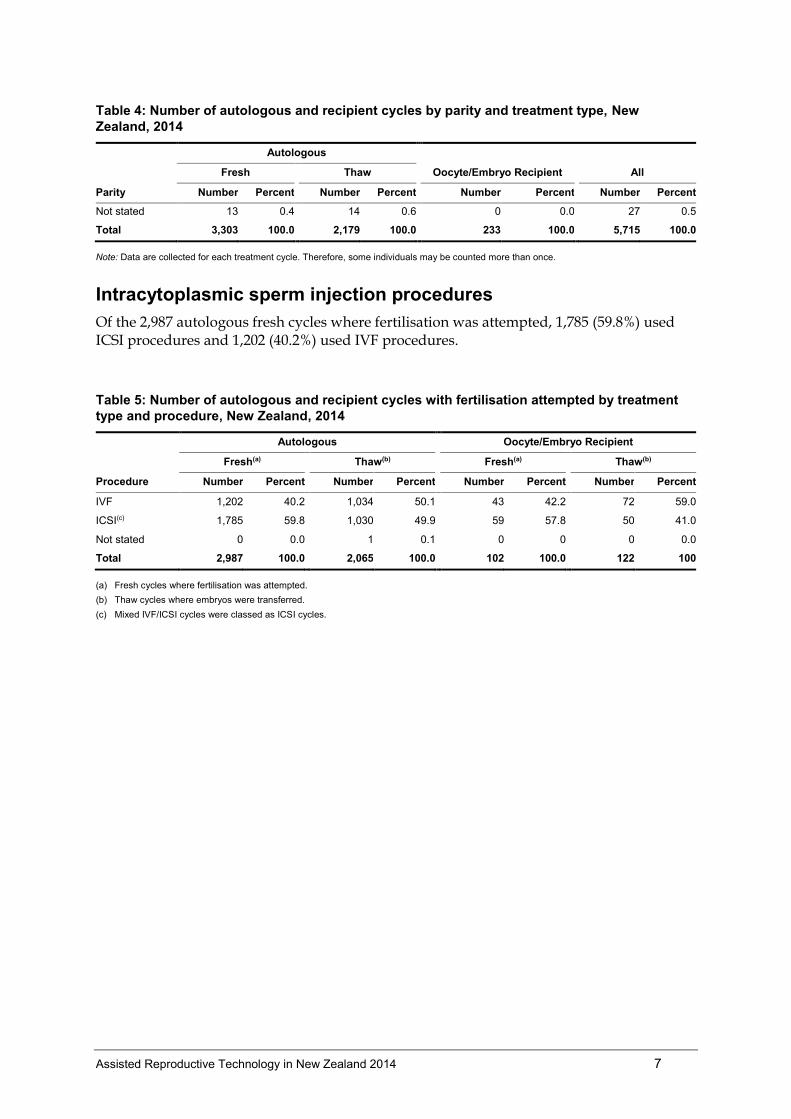
Of the 2,987 autologous fresh cycles where fertilisation was attempted, 1,785 (59.8%) used ICSI procedures and 1,202 (40.2%) used IVF procedures.
Table 5: Number of autologous and recipient cycles with fertilisation attempted by treatment
type and procedure, New Zealand, 2014
Autologous Oocyte/Embryo Recipient
Fresh(a) Thaw(b) Fresh(a) Thaw(b)
Procedure Number Percent Number Percent Number Percent Number Percent
IVF 1,202 40.2 1,034 50.1 43 42.2 72 59.0
ICSI(c) 1,785 59.8 1,030 49.9 59 57.8 50 41.0
Not stated 0 0.0 1 0.1 0 0 0 0.0
Total 2,987 100.0 2,065 100.0 102 100.0 122 100
(a) Fresh cycles where fertilisation was attempted.
(b) Thaw cycles where embryos were transferred.
(c) Mixed IVF/ICSI cycles were classed as ICSI cycles.
8 Assisted Reproductive Technology in New Zealand 2014
Number of embryos transferred
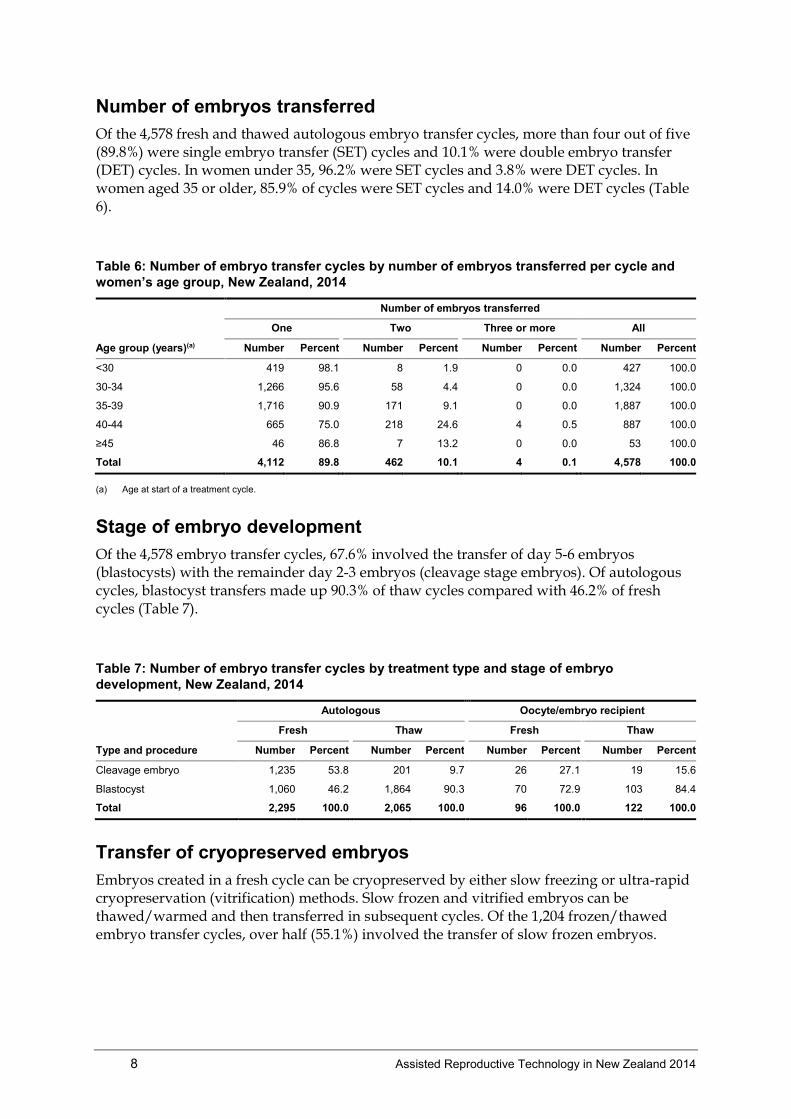
Of the 4,578 fresh and thawed autologous embryo transfer cycles, more than four out of five (89.8%) were single embryo transfer (SET) cycles and 10.1% were double embryo transfer (DET) cycles. In women under 35, 96.2% were SET cycles and 3.8% were DET cycles. In women aged 35 or older, 85.9% of cycles were SET cycles and 14.0% were DET cycles (Table 6).
Table 6: Number of embryo transfer cycles by number of embryos transferred per cycle and
women’s age group, New Zealand, 2014
Number of embryos transferred
One Two Three or more All
Age group (years)(a) Number Percent Number Percent Number Percent Number Percent
<30 419 98.1 8 1.9 0 0.0 427 100.0
30-34 1,266 95.6 58 4.4 0 0.0 1,324 100.0
35-39 1,716 90.9 171 9.1 0 0.0 1,887 100.0
40-44 665 75.0 218 24.6 4 0.5 887 100.0
≥45 46 86.8 7 13.2 0 0.0 53 100.0
Total 4,112 89.8 462 10.1 4 0.1 4,578 100.0
(a) Age at start of a treatment cycle.
Stage of embryo development
Of the 4,578 embryo transfer cycles, 67.6% involved the transfer of day 5-6 embryos (blastocysts) with the remainder day 2-3 embryos (cleavage stage embryos). Of autologous cycles, blastocyst transfers made up 90.3% of thaw cycles compared with 46.2% of fresh cycles (Table 7).
Table 7: Number of embryo transfer cycles by treatment type and stage of embryo
development, New Zealand, 2014
Autologous Oocyte/embryo recipient
Fresh Thaw Fresh Thaw
Type and procedure Number Percent Number Percent Number Percent Number Percent
Cleavage embryo 1,235 53.8 201 9.7 26 27.1 19 15.6
Blastocyst 1,060 46.2 1,864 90.3 70 72.9 103 84.4
Total 2,295 100.0 2,065 100.0 96 100.0 122 100.0
Transfer of cryopreserved embryos
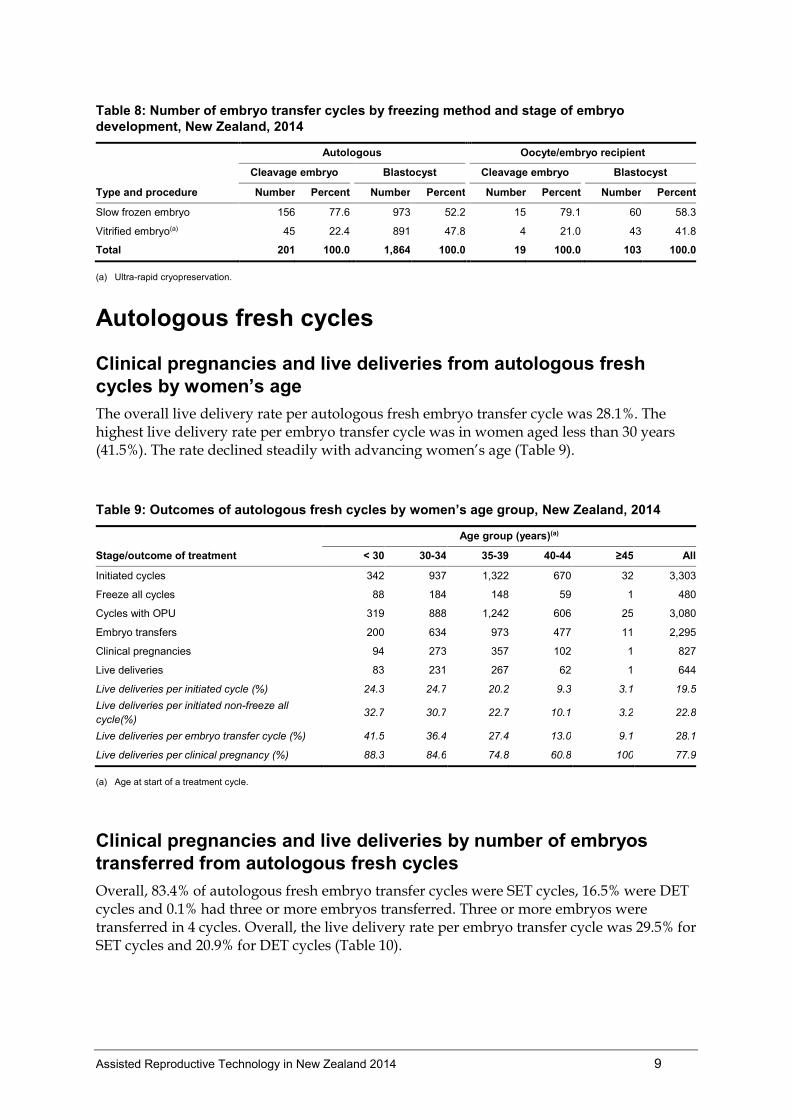
Embryos created in a fresh cycle can be cryopreserved by either slow freezing or ultra-rapid cryopreservation (vitrification) methods. Slow frozen and vitrified embryos can be thawed/warmed and then transferred in subsequent cycles. Of the 1,204 frozen/thawed embryo transfer cycles, over half (55.1%) involved the transfer of slow frozen embryos.
Assisted Reproductive Technology in New Zealand 2014 9
Table 8: Number of embryo transfer cycles by freezing method and stage of embryo
development, New Zealand, 2014
Autologous Oocyte/embryo recipient
Cleavage embryo Blastocyst Cleavage embryo Blastocyst
Type and procedure Number Percent Number Percent Number Percent Number Percent
Slow frozen embryo 156 77.6 973 52.2 15 79.1 60 58.3
Vitrified embryo(a) 45 22.4 891 47.8 4 21.0 43 41.8
Total 201 100.0 1,864 100.0 19 100.0 103 100.0
(a) Ultra-rapid cryopreservation.
Autologous fresh cycles
Clinical pregnancies and live deliveries from autologous fresh
cycles by women’s age
The overall live delivery rate per autologous fresh embryo transfer cycle was 28.1%. The highest live delivery rate per embryo transfer cycle was in women aged less than 30 years (41.5%). The rate declined steadily with advancing women’s age (Table 9).
Table 9: Outcomes of autologous fresh cycles by women’s age group, New Zealand, 2014
Age group (years)(a)
Stage/outcome of treatment < 30 30-34 35-39 40-44 ≥45 All
Initiated cycles 342 937 1,322 670 32 3,303
Freeze all cycles 88 184 148 59 1 480
Cycles with OPU 319 888 1,242 606 25 3,080
Embryo transfers 200 634 973 477 11 2,295
Clinical pregnancies 94 273 357 102 1 827
Live deliveries 83 231 267 62 1 644
Live deliveries per initiated cycle (%) 24.3 24.7 20.2 9.3 3.1 19.5
Live deliveries per initiated non-freeze all
cycle(%) 32.7 30.7 22.7 10.1 3.2 22.8
Live deliveries per embryo transfer cycle (%) 41.5 36.4 27.4 13.0 9.1 28.1
Live deliveries per clinical pregnancy (%) 88.3 84.6 74.8 60.8 100 77.9
(a) Age at start of a treatment cycle.
Clinical pregnancies and live deliveries by number of embryos
transferred from autologous fresh cycles
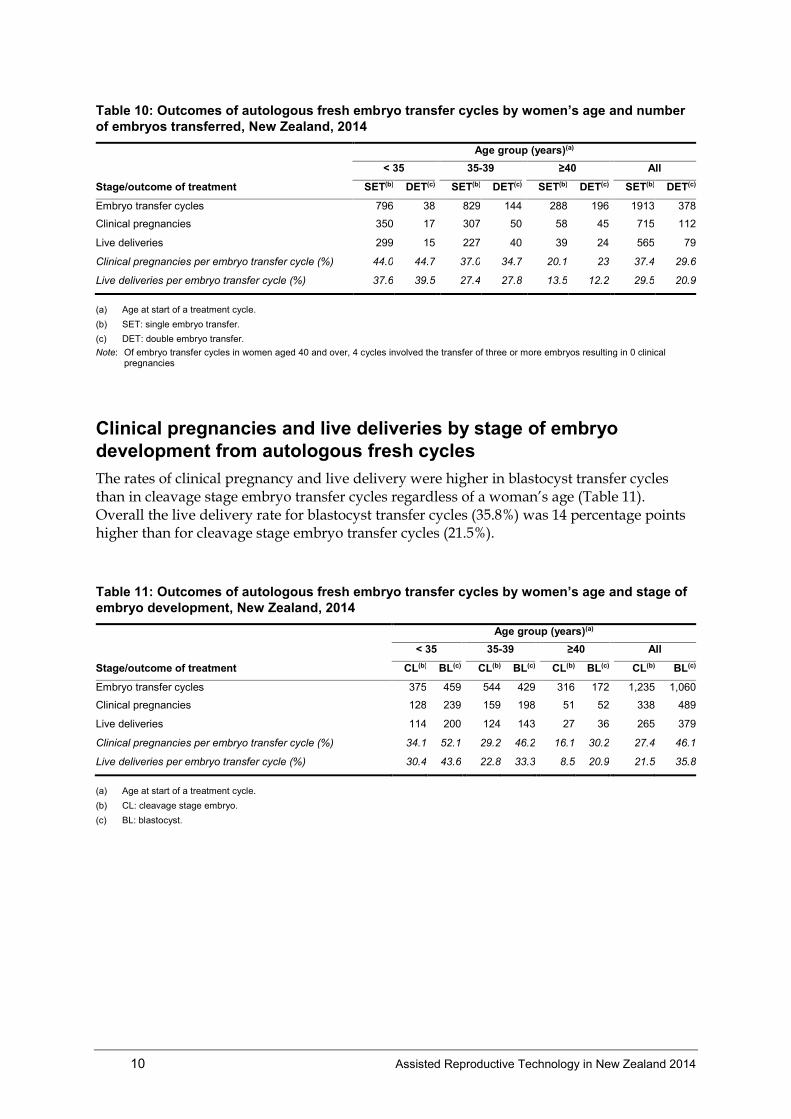
Overall, 83.4% of autologous fresh embryo transfer cycles were SET cycles, 16.5% were DET cycles and 0.1% had three or more embryos transferred. Three or more embryos were transferred in 4 cycles. Overall, the live delivery rate per embryo transfer cycle was 29.5% for SET cycles and 20.9% for DET cycles (Table 10).
10 Assisted Reproductive Technology in New Zealand 2014
Table 10: Outcomes of autologous fresh embryo transfer cycles by women’s age and number
of embryos transferred, New Zealand, 2014
Age group (years)(a)
< 35 35-39 ≥40 All
Stage/outcome of treatment SET(b) DET(c) SET(b) DET(c) SET(b) DET(c) SET(b) DET(c)
Embryo transfer cycles 796 38 829 144 288 196 1913 378
Clinical pregnancies 350 17 307 50 58 45 715 112
Live deliveries 299 15 227 40 39 24 565 79
Clinical pregnancies per embryo transfer cycle (%) 44.0 44.7 37.0 34.7 20.1 23 37.4 29.6
Live deliveries per embryo transfer cycle (%) 37.6 39.5 27.4 27.8 13.5 12.2 29.5 20.9
(a) Age at start of a treatment cycle.
(b) SET: single embryo transfer.
(c) DET: double embryo transfer.
Note: Of embryo transfer cycles in women aged 40 and over, 4 cycles involved the transfer of three or more embryos resulting in 0 clinical pregnancies
Clinical pregnancies and live deliveries by stage of embryo
development from autologous fresh cycles
The rates of clinical pregnancy and live delivery were higher in blastocyst transfer cycles than in cleavage stage embryo transfer cycles regardless of a woman’s age (Table 11). Overall the live delivery rate for blastocyst transfer cycles (35.8%) was 14 percentage points higher than for cleavage stage embryo transfer cycles (21.5%).
Table 11: Outcomes of autologous fresh embryo transfer cycles by women’s age and stage of
embryo development, New Zealand, 2014
Age group (years)(a)
< 35 35-39 ≥40 All
Stage/outcome of treatment CL(b) BL(c) CL(b) BL(c) CL(b) BL(c) CL(b) BL(c)
Embryo transfer cycles 375 459 544 429 316 172 1,235 1,060
Clinical pregnancies 128 239 159 198 51 52 338 489
Live deliveries 114 200 124 143 27 36 265 379
Clinical pregnancies per embryo transfer cycle (%) 34.1 52.1 29.2 46.2 16.1 30.2 27.4 46.1
Live deliveries per embryo transfer cycle (%) 30.4 43.6 22.8 33.3 8.5 20.9 21.5 35.8
(a) Age at start of a treatment cycle.
(b) CL: cleavage stage embryo.
(c) BL: blastocyst.
Assisted Reproductive Technology in New Zealand 2014 11
Autologous thaw cycles
Clinical pregnancies and live deliveries from autologous thaw
cycles by women’s age
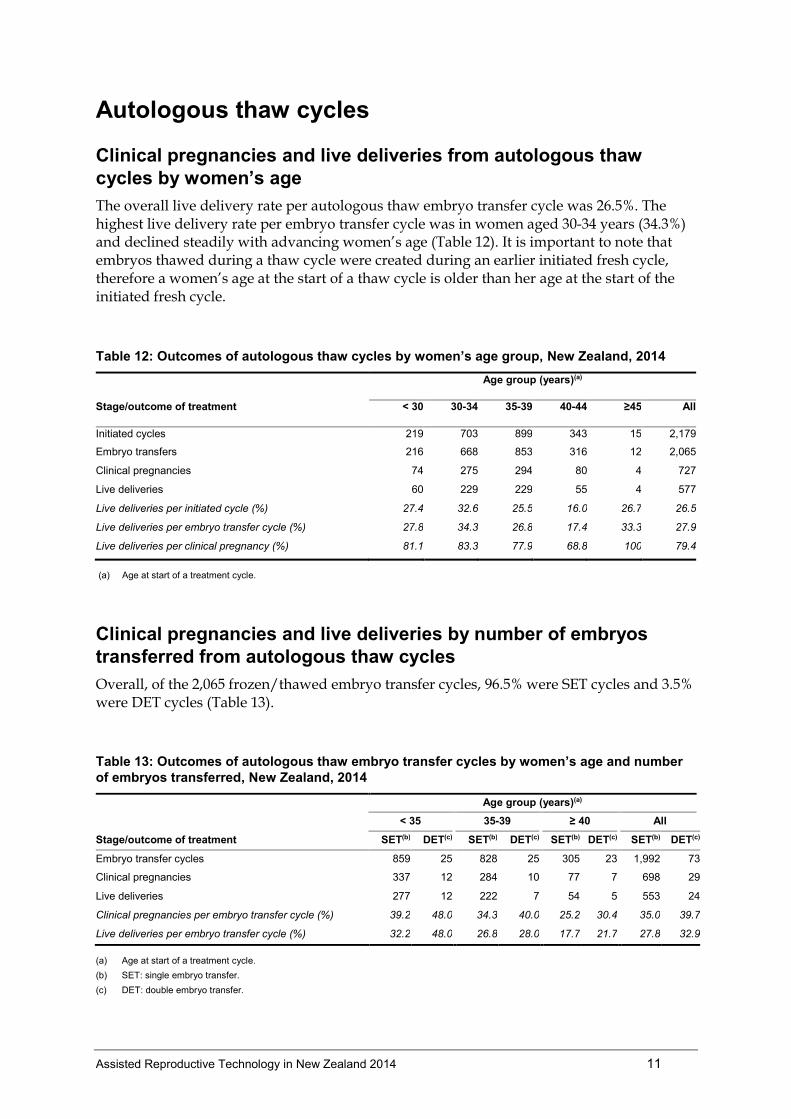
The overall live delivery rate per autologous thaw embryo transfer cycle was 26.5%. The highest live delivery rate per embryo transfer cycle was in women aged 30-34 years (34.3%) and declined steadily with advancing women’s age (Table 12). It is important to note that embryos thawed during a thaw cycle were created during an earlier initiated fresh cycle, therefore a women’s age at the start of a thaw cycle is older than her age at the start of the initiated fresh cycle.
Table 12: Outcomes of autologous thaw cycles by women’s age group, New Zealand, 2014
Age group (years)(a)
Stage/outcome of treatment < 30 30-34 35-39 40-44 ≥45 All
Initiated cycles 219 703 899 343 15 2,179
Embryo transfers 216 668 853 316 12 2,065
Clinical pregnancies 74 275 294 80 4 727
Live deliveries 60 229 229 55 4 577
Live deliveries per initiated cycle (%) 27.4 32.6 25.5 16.0 26.7 26.5
Live deliveries per embryo transfer cycle (%) 27.8 34.3 26.8 17.4 33.3 27.9
Live deliveries per clinical pregnancy (%) 81.1 83.3 77.9 68.8 100 79.4
(a) Age at start of a treatment cycle.
Clinical pregnancies and live deliveries by number of embryos
transferred from autologous thaw cycles
Overall, of the 2,065 frozen/thawed embryo transfer cycles, 96.5% were SET cycles and 3.5% were DET cycles (Table 13).
Table 13: Outcomes of autologous thaw embryo transfer cycles by women’s age and number
of embryos transferred, New Zealand, 2014
Age group (years)(a)
< 35 35-39 ≥ 40 All
Stage/outcome of treatment SET(b) DET(c) SET(b) DET(c) SET(b) DET(c) SET(b) DET(c)
Embryo transfer cycles 859 25 828 25 305 23 1,992 73
Clinical pregnancies 337 12 284 10 77 7 698 29
Live deliveries 277 12 222 7 54 5 553 24
Clinical pregnancies per embryo transfer cycle (%) 39.2 48.0 34.3 40.0 25.2 30.4 35.0 39.7
Live deliveries per embryo transfer cycle (%) 32.2 48.0 26.8 28.0 17.7 21.7 27.8 32.9
(a) Age at start of a treatment cycle.
(b) SET: single embryo transfer.
(c) DET: double embryo transfer.
12 Assisted Reproductive Technology in New Zealand 2014
Clinical pregnancies and live deliveries by stage of embryo
development from autologous thaw cycles
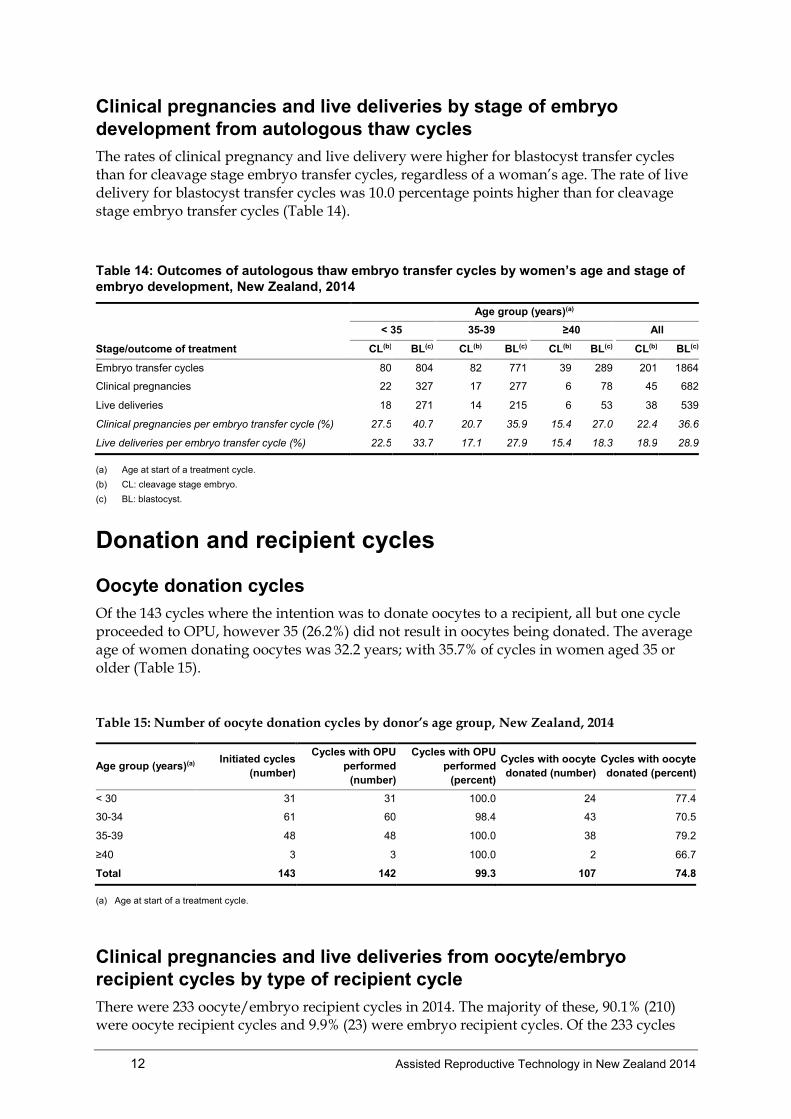
The rates of clinical pregnancy and live delivery were higher for blastocyst transfer cycles than for cleavage stage embryo transfer cycles, regardless of a woman’s age. The rate of live delivery for blastocyst transfer cycles was 10.0 percentage points higher than for cleavage stage embryo transfer cycles (Table 14).
Table 14: Outcomes of autologous thaw embryo transfer cycles by women’s age and stage of
embryo development, New Zealand, 2014
Age group (years)(a)
< 35 35-39 ≥40 All
Stage/outcome of treatment CL(b) BL(c) CL(b) BL(c) CL(b) BL(c) CL(b) BL(c)
Embryo transfer cycles 80 804 82 771 39 289 201 1864
Clinical pregnancies 22 327 17 277 6 78 45 682
Live deliveries 18 271 14 215 6 53 38 539
Clinical pregnancies per embryo transfer cycle (%) 27.5 40.7 20.7 35.9 15.4 27.0 22.4 36.6
Live deliveries per embryo transfer cycle (%) 22.5 33.7 17.1 27.9 15.4 18.3 18.9 28.9
(a) Age at start of a treatment cycle.
(b) CL: cleavage stage embryo.
(c) BL: blastocyst.
Donation and recipient cycles
Oocyte donation cycles
Of the 143 cycles where the intention was to donate oocytes to a recipient, all but one cycle proceeded to OPU, however 35 (26.2%) did not result in oocytes being donated. The average age of women donating oocytes was 32.2 years; with 35.7% of cycles in women aged 35 or older (Table 15).
Table 15: Number of oocyte donation cycles by donor’s age group, New Zealand, 2014
Age group (years)(a) Initiated cycles
(number)
Cycles with OPU
performed
(number)
Cycles with OPU
performed
(percent)
Cycles with oocyte
donated (number)
Cycles with oocyte
donated (percent)
< 30 31 31 100.0 24 77.4
30-34 61 60 98.4 43 70.5
35-39 48 48 100.0 38 79.2
≥40 3 3 100.0 2 66.7
Total 143 142 99.3 107 74.8
(a) Age at start of a treatment cycle.
Clinical pregnancies and live deliveries from oocyte/embryo
recipient cycles by type of recipient cycle
There were 233 oocyte/embryo recipient cycles in 2014. The majority of these, 90.1% (210) were oocyte recipient cycles and 9.9% (23) were embryo recipient cycles. Of the 233 cycles
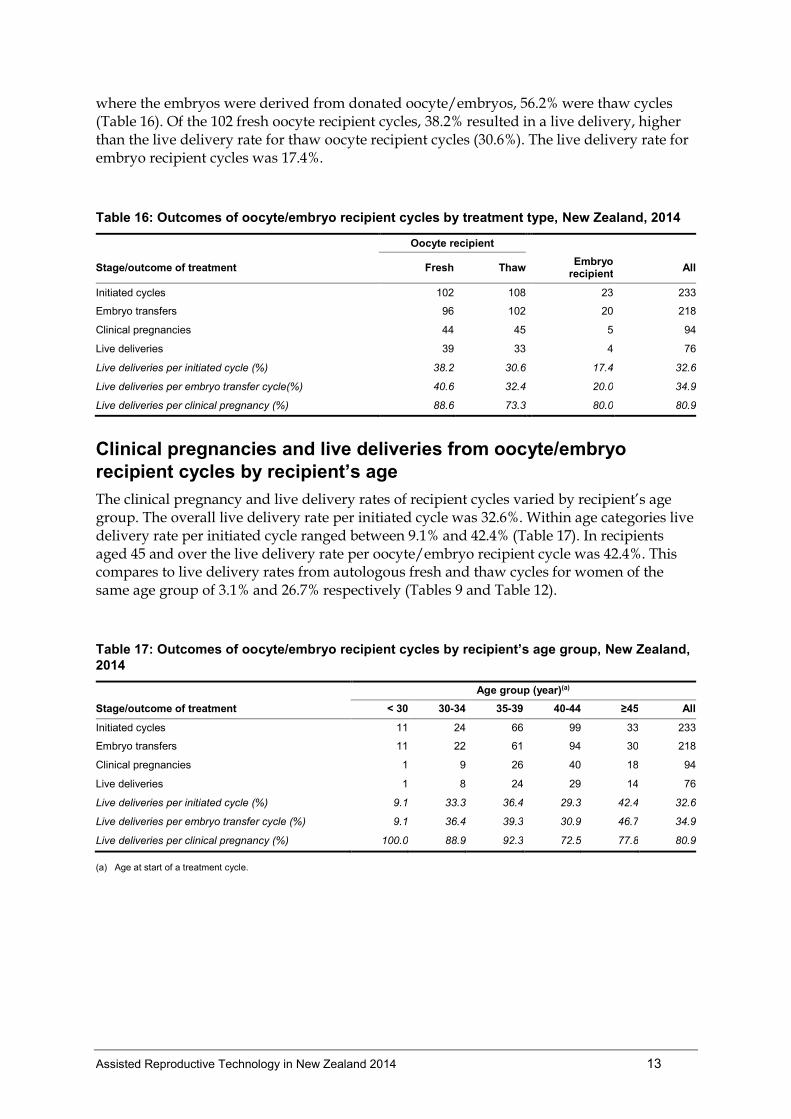
Assisted Reproductive Technology in New Zealand 2014 13
where the embryos were derived from donated oocyte/embryos, 56.2% were thaw cycles (Table 16). Of the 102 fresh oocyte recipient cycles, 38.2% resulted in a live delivery, higher than the live delivery rate for thaw oocyte recipient cycles (30.6%). The live delivery rate for embryo recipient cycles was 17.4%.
Table 16: Outcomes of oocyte/embryo recipient cycles by treatment type, New Zealand, 2014
Oocyte recipient
Stage/outcome of treatment Fresh Thaw Embryo
recipient All
Initiated cycles 102 108 23 233
Embryo transfers 96 102 20 218
Clinical pregnancies 44 45 5 94
Live deliveries 39 33 4 76
Live deliveries per initiated cycle (%) 38.2 30.6 17.4 32.6
Live deliveries per embryo transfer cycle(%) 40.6 32.4 20.0 34.9
Live deliveries per clinical pregnancy (%) 88.6 73.3 80.0 80.9
Clinical pregnancies and live deliveries from oocyte/embryo
recipient cycles by recipient’s age
The clinical pregnancy and live delivery rates of recipient cycles varied by recipient’s age group. The overall live delivery rate per initiated cycle was 32.6%. Within age categories live delivery rate per initiated cycle ranged between 9.1% and 42.4% (Table 17). In recipients aged 45 and over the live delivery rate per oocyte/embryo recipient cycle was 42.4%. This compares to live delivery rates from autologous fresh and thaw cycles for women of the same age group of 3.1% and 26.7% respectively (Tables 9 and Table 12).
Table 17: Outcomes of oocyte/embryo recipient cycles by recipient’s age group, New Zealand,
2014
Age group (year)(a)
Stage/outcome of treatment < 30 30-34 35-39 40-44 ≥45 All
Initiated cycles 11 24 66 99 33 233
Embryo transfers 11 22 61 94 30 218
Clinical pregnancies 1 9 26 40 18 94
Live deliveries 1 8 24 29 14 76
Live deliveries per initiated cycle (%) 9.1 33.3 36.4 29.3 42.4 32.6
Live deliveries per embryo transfer cycle (%) 9.1 36.4 39.3 30.9 46.7 34.9
Live deliveries per clinical pregnancy (%) 100.0 88.9 92.3 72.5 77.8 80.9
(a) Age at start of a treatment cycle.
14 Assisted Reproductive Technology in New Zealand 2014
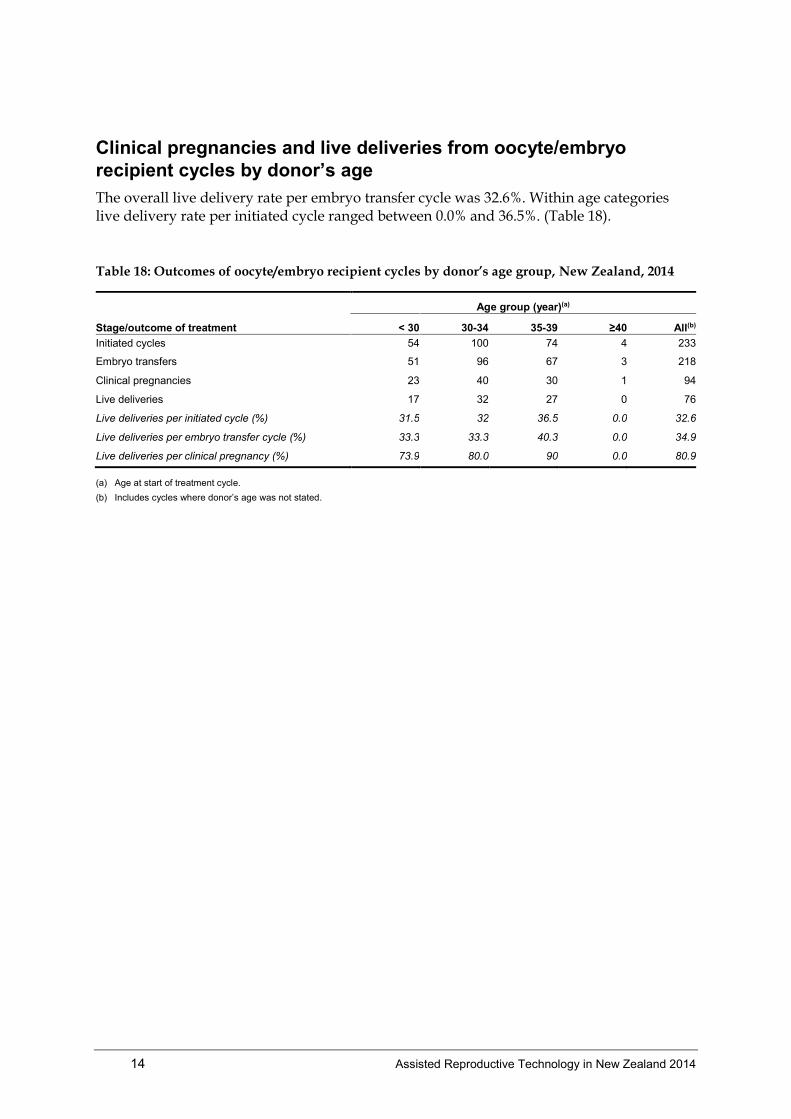
Clinical pregnancies and live deliveries from oocyte/embryo
recipient cycles by donor’s age
The overall live delivery rate per embryo transfer cycle was 32.6%. Within age categories live delivery rate per initiated cycle ranged between 0.0% and 36.5%. (Table 18).
Table 18: Outcomes of oocyte/embryo recipient cycles by donor’s age group, New Zealand, 2014
Age group (year)(a)
Stage/outcome of treatment < 30 30-34 35-39 ≥40 All(b)
Initiated cycles 54 100 74 4 233
Embryo transfers 51 96 67 3 218
Clinical pregnancies 23 40 30 1 94
Live deliveries 17 32 27 0 76
Live deliveries per initiated cycle (%) 31.5 32 36.5 0.0 32.6
Live deliveries per embryo transfer cycle (%) 33.3 33.3 40.3 0.0 34.9
Live deliveries per clinical pregnancy (%) 73.9 80.0 90 0.0 80.9
(a) Age at start of treatment cycle.
(b) Includes cycles where donor’s age was not stated.
Assisted Reproductive Technology in New Zealand 2014 15
4 Pregnancy and birth outcomes
following autologous and recipient
cycles in 2014
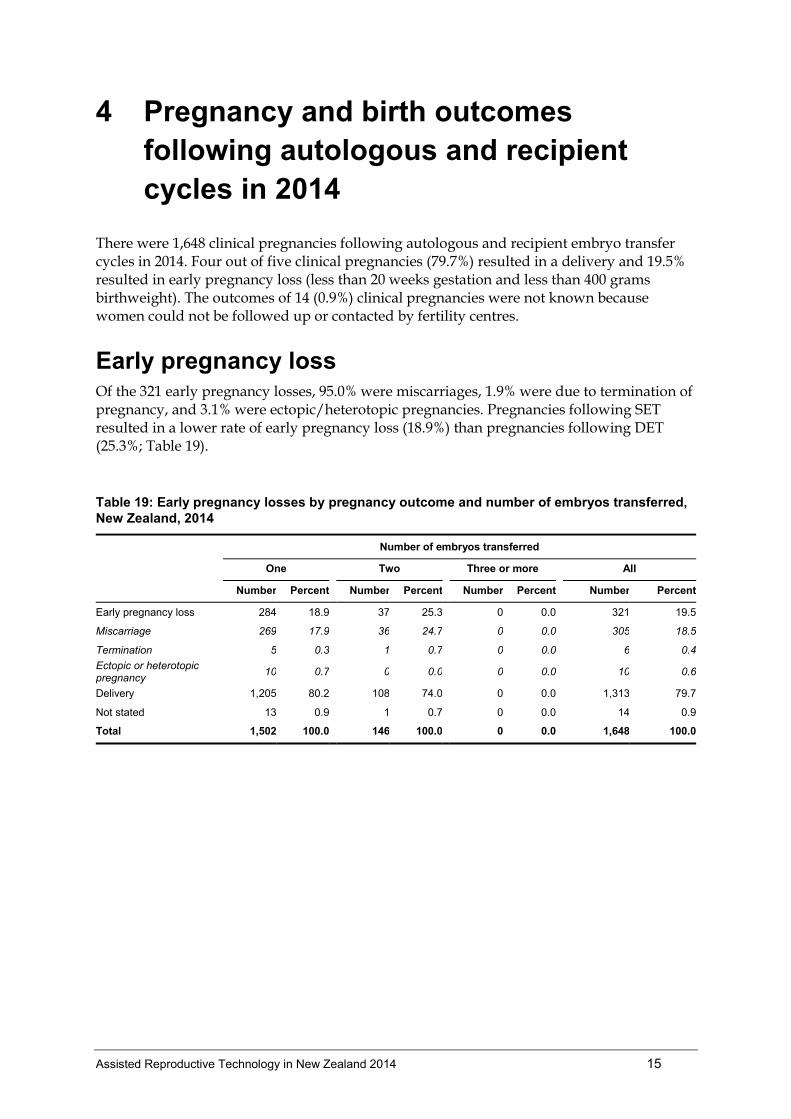
There were 1,648 clinical pregnancies following autologous and recipient embryo transfer cycles in 2014. Four out of five clinical pregnancies (79.7%) resulted in a delivery and 19.5% resulted in early pregnancy loss (less than 20 weeks gestation and less than 400 grams birthweight). The outcomes of 14 (0.9%) clinical pregnancies were not known because women could not be followed up or contacted by fertility centres.
Early pregnancy loss Of the 321 early pregnancy losses, 95.0% were miscarriages, 1.9% were due to termination of pregnancy, and 3.1% were ectopic/heterotopic pregnancies. Pregnancies following SET resulted in a lower rate of early pregnancy loss (18.9%) than pregnancies following DET (25.3%; Table 19).
Table 19: Early pregnancy losses by pregnancy outcome and number of embryos transferred,
New Zealand, 2014
Number of embryos transferred
One Two Three or more All
Number Percent Number Percent Number Percent Number Percent
Early pregnancy loss 284 18.9 37 25.3 0 0.0 321 19.5
Miscarriage 269 17.9 36 24.7 0 0.0 305 18.5
Termination 5 0.3 1 0.7 0 0.0 6 0.4
Ectopic or heterotopic pregnancy
10 0.7 0 0.0 0 0.0 10 0.6
Delivery 1,205 80.2 108 74.0 0 0.0 1,313 79.7
Not stated 13 0.9 1 0.7 0 0.0 14 0.9
Total 1,502 100.0 146 100.0 0 0.0 1,648 100.0
16 Assisted Reproductive Technology in New Zealand 2014
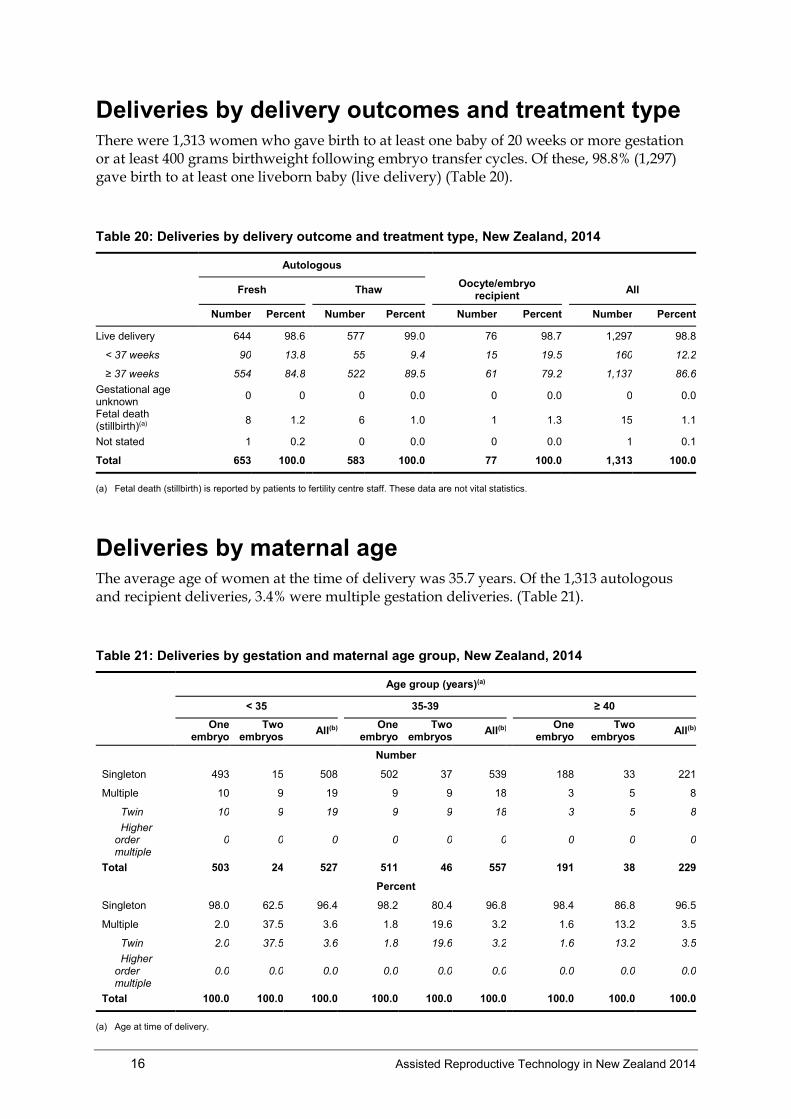
Deliveries by delivery outcomes and treatment type There were 1,313 women who gave birth to at least one baby of 20 weeks or more gestation or at least 400 grams birthweight following embryo transfer cycles. Of these, 98.8% (1,297) gave birth to at least one liveborn baby (live delivery) (Table 20).
Table 20: Deliveries by delivery outcome and treatment type, New Zealand, 2014
Autologous
Fresh Thaw Oocyte/embryo
recipient All
Number Percent Number Percent Number Percent Number Percent
Live delivery 644 98.6 577 99.0 76 98.7 1,297 98.8
< 37 weeks 90 13.8 55 9.4 15 19.5 160 12.2
≥ 37 weeks 554 84.8 522 89.5 61 79.2 1,137 86.6
Gestational age unknown
0 0 0 0.0 0 0.0 0 0.0
Fetal death (stillbirth)(a)
8 1.2 6 1.0 1 1.3 15 1.1
Not stated 1 0.2 0 0.0 0 0.0 1 0.1
Total 653 100.0 583 100.0 77 100.0 1,313 100.0
(a) Fetal death (stillbirth) is reported by patients to fertility centre staff. These data are not vital statistics.
Deliveries by maternal age The average age of women at the time of delivery was 35.7 years. Of the 1,313 autologous and recipient deliveries, 3.4% were multiple gestation deliveries. (Table 21).
Table 21: Deliveries by gestation and maternal age group, New Zealand, 2014
Age group (years)(a)
< 35 35-39 ≥ 40
One
embryo Two
embryos All(b)
One embryo
Two embryos
All(b) One
embryo Two
embryos All(b)
Number
Singleton 493 15 508 502 37 539 188 33 221
Multiple 10 9 19 9 9 18 3 5 8
Twin 10 9 19 9 9 18 3 5 8
Higher order multiple
0 0 0 0 0 0 0 0 0
Total 503 24 527 511 46 557 191 38 229
Percent
Singleton 98.0 62.5 96.4 98.2 80.4 96.8 98.4 86.8 96.5
Multiple 2.0 37.5 3.6 1.8 19.6 3.2 1.6 13.2 3.5
Twin 2.0 37.5 3.6 1.8 19.6 3.2 1.6 13.2 3.5
Higher order multiple
0.0 0.0 0.0 0.0 0.0 0.0 0.0 0.0 0.0
Total 100.0 100.0 100.0 100.0 100.0 100.0 100.0 100.0 100.0
(a) Age at time of delivery.

Assisted Reproductive Technology in New Zealand 2014 17
Gestational age of babies The average gestational age of babies born following autologous and recipient embryo transfer cycles was 38.3 weeks (Table 22). One in six babies (15.5%) were preterm (less than 37 weeks gestation); the average gestational age of ART singletons was 38.4 weeks, while the average gestational age for ART twins was 35.3 weeks.
Table 22: Babies by gestational age and plurality, New Zealand, 2014
Gestational age (weeks)
Singletons Twins Higher order multiples Total
Mean 38.6 34.8 - 38.3
Number Percent Number Percent Number Percent Number Percent
≤ 27 24 1.9 6 6.7 0 0.0 30 2.2
28-31 19 1.5 8 8.9 0 0.0 27 2.0
32-36 95 7.5 58 64.4 0 0.0 153 11.3
≥ 37 1,130 89.1 18 20.0 0 0.0 1,148 84.5
Total 1,268 100.0 90 100.0 0 0.0 1,358 100.0
18 Assisted Reproductive Technology in New Zealand 2014
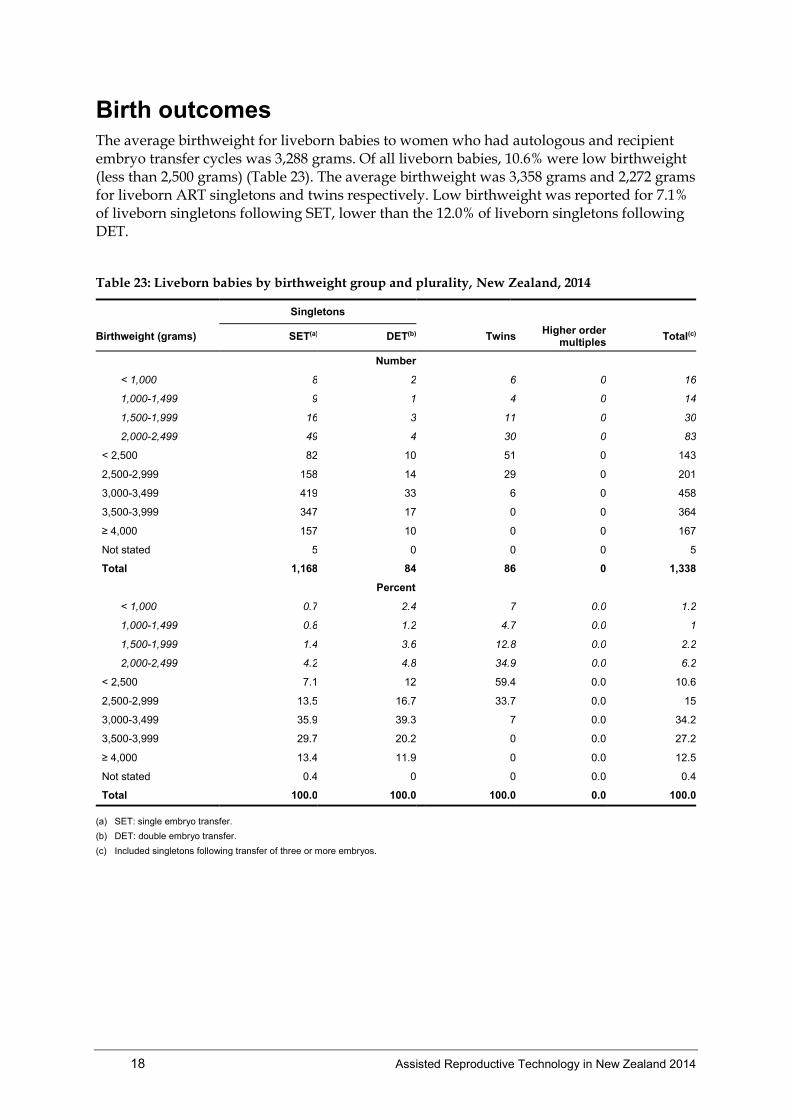
Birth outcomes The average birthweight for liveborn babies to women who had autologous and recipient embryo transfer cycles was 3,288 grams. Of all liveborn babies, 10.6% were low birthweight (less than 2,500 grams) (Table 23). The average birthweight was 3,358 grams and 2,272 grams for liveborn ART singletons and twins respectively. Low birthweight was reported for 7.1% of liveborn singletons following SET, lower than the 12.0% of liveborn singletons following DET.
Table 23: Liveborn babies by birthweight group and plurality, New Zealand, 2014
Singletons
Birthweight (grams) SET(a) DET(b) Twins Higher order
multiples Total(c)
Number
< 1,000 8 2 6 0 16
1,000-1,499 9 1 4 0 14
1,500-1,999 16 3 11 0 30
2,000-2,499 49 4 30 0 83
< 2,500 82 10 51 0 143
2,500-2,999 158 14 29 0 201
3,000-3,499 419 33 6 0 458
3,500-3,999 347 17 0 0 364
≥ 4,000 157 10 0 0 167
Not stated 5 0 0 0 5
Total 1,168 84 86 0 1,338
Percent
< 1,000 0.7 2.4 7 0.0 1.2
1,000-1,499 0.8 1.2 4.7 0.0 1
1,500-1,999 1.4 3.6 12.8 0.0 2.2
2,000-2,499 4.2 4.8 34.9 0.0 6.2
< 2,500 7.1 12 59.4 0.0 10.6
2,500-2,999 13.5 16.7 33.7 0.0 15
3,000-3,499 35.9 39.3 7 0.0 34.2
3,500-3,999 29.7 20.2 0 0.0 27.2
≥ 4,000 13.4 11.9 0 0.0 12.5
Not stated 0.4 0 0 0.0 0.4
Total 100.0 100.0 100.0 0.0 100.0
(a) SET: single embryo transfer.
(b) DET: double embryo transfer.
(c) Included singletons following transfer of three or more embryos.
Assisted Reproductive Technology in New Zealand 2014 19
5 Preimplantation genetic diagnosis in 2014
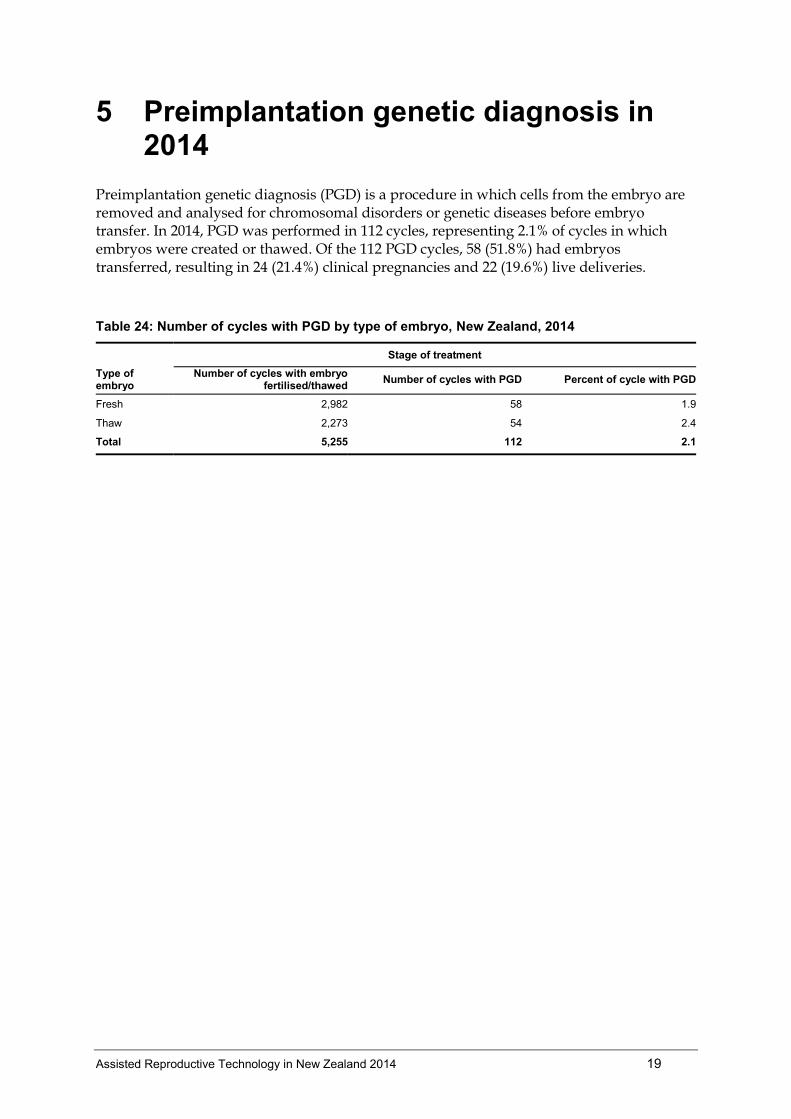
Preimplantation genetic diagnosis (PGD) is a procedure in which cells from the embryo are removed and analysed for chromosomal disorders or genetic diseases before embryo transfer. In 2014, PGD was performed in 112 cycles, representing 2.1% of cycles in which embryos were created or thawed. Of the 112 PGD cycles, 58 (51.8%) had embryos transferred, resulting in 24 (21.4%) clinical pregnancies and 22 (19.6%) live deliveries.
Table 24: Number of cycles with PGD by type of embryo, New Zealand, 2014
Stage of treatment
Type of embryo
Number of cycles with embryo fertilised/thawed
Number of cycles with PGD Percent of cycle with PGD
Fresh 2,982 58 1.9
Thaw 2,273 54 2.4
Total 5,255 112 2.1
20 Assisted Reproductive Technology in New Zealand 2014
6 Donor insemination cycles in 2014
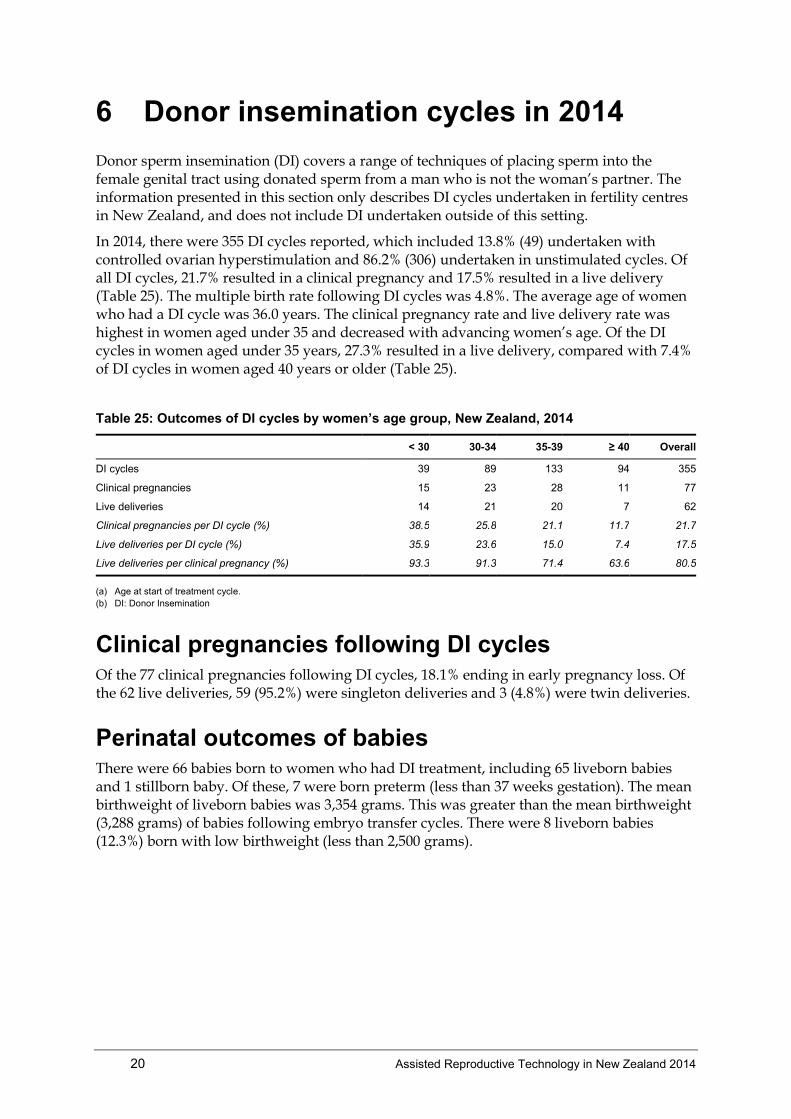
Donor sperm insemination (DI) covers a range of techniques of placing sperm into the female genital tract using donated sperm from a man who is not the woman’s partner. The information presented in this section only describes DI cycles undertaken in fertility centres in New Zealand, and does not include DI undertaken outside of this setting.
In 2014, there were 355 DI cycles reported, which included 13.8% (49) undertaken with controlled ovarian hyperstimulation and 86.2% (306) undertaken in unstimulated cycles. Of all DI cycles, 21.7% resulted in a clinical pregnancy and 17.5% resulted in a live delivery (Table 25). The multiple birth rate following DI cycles was 4.8%. The average age of women who had a DI cycle was 36.0 years. The clinical pregnancy rate and live delivery rate was highest in women aged under 35 and decreased with advancing women’s age. Of the DI cycles in women aged under 35 years, 27.3% resulted in a live delivery, compared with 7.4% of DI cycles in women aged 40 years or older (Table 25).
Table 25: Outcomes of DI cycles by women’s age group, New Zealand, 2014
< 30 30-34 35-39 ≥ 40 Overall
DI cycles 39 89 133 94 355
Clinical pregnancies 15 23 28 11 77
Live deliveries 14 21 20 7 62
Clinical pregnancies per DI cycle (%) 38.5 25.8 21.1 11.7 21.7
Live deliveries per DI cycle (%) 35.9 23.6 15.0 7.4 17.5
Live deliveries per clinical pregnancy (%) 93.3 91.3 71.4 63.6 80.5
(a) Age at start of treatment cycle.
(b) DI: Donor Insemination
Clinical pregnancies following DI cycles Of the 77 clinical pregnancies following DI cycles, 18.1% ending in early pregnancy loss. Of the 62 live deliveries, 59 (95.2%) were singleton deliveries and 3 (4.8%) were twin deliveries.
Perinatal outcomes of babies There were 66 babies born to women who had DI treatment, including 65 liveborn babies and 1 stillborn baby. Of these, 7 were born preterm (less than 37 weeks gestation). The mean birthweight of liveborn babies was 3,354 grams. This was greater than the mean birthweight (3,288 grams) of babies following embryo transfer cycles. There were 8 liveborn babies (12.3%) born with low birthweight (less than 2,500 grams).
Assisted Reproductive Technology in New Zealand 2014 21
7 Trends in ART treatment and outcomes 2010-2014
This section includes autologous cycles, donation/recipient cycles, surrogacy cycles and GIFT cycles undertaken in New Zealand from 2010 to 2014. It does not include DI cycles.
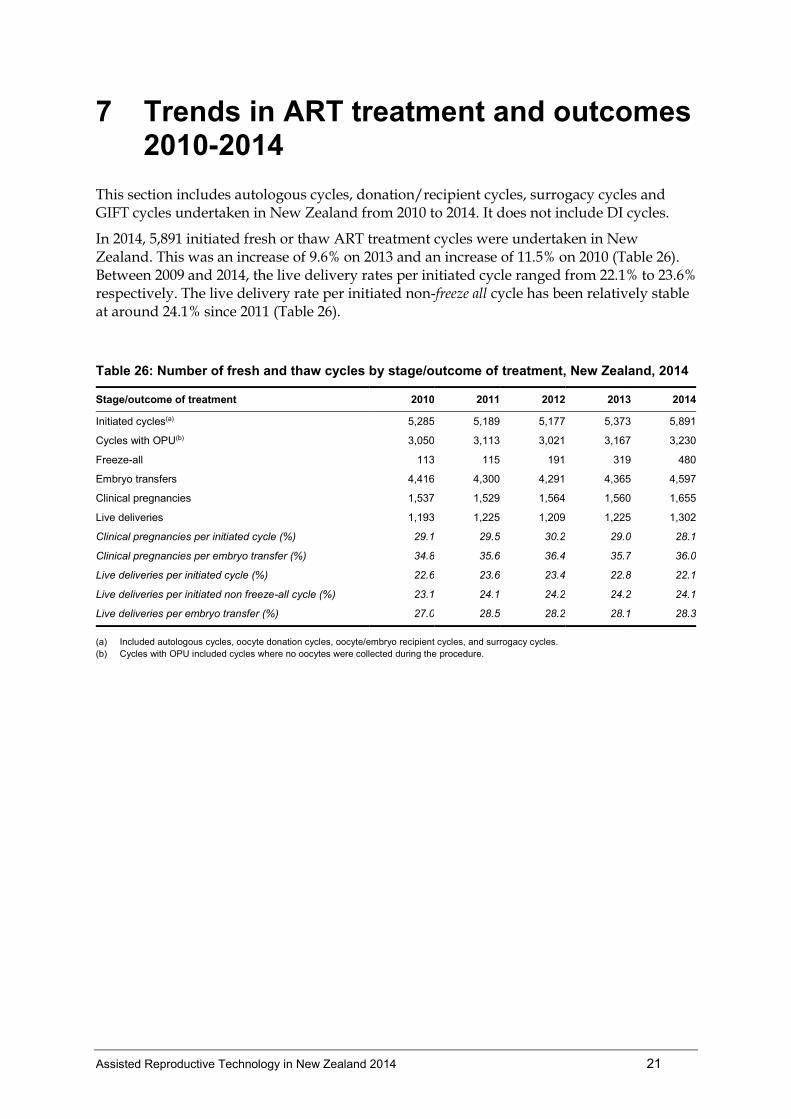
In 2014, 5,891 initiated fresh or thaw ART treatment cycles were undertaken in New Zealand. This was an increase of 9.6% on 2013 and an increase of 11.5% on 2010 (Table 26). Between 2009 and 2014, the live delivery rates per initiated cycle ranged from 22.1% to 23.6% respectively. The live delivery rate per initiated non-freeze all cycle has been relatively stable at around 24.1% since 2011 (Table 26).
Table 26: Number of fresh and thaw cycles by stage/outcome of treatment, New Zealand, 2014
Stage/outcome of treatment 2010 2011 2012 2013 2014
Initiated cycles(a) 5,285 5,189 5,177 5,373 5,891
Cycles with OPU(b) 3,050 3,113 3,021 3,167 3,230
Freeze-all 113 115 191 319 480
Embryo transfers 4,416 4,300 4,291 4,365 4,597
Clinical pregnancies 1,537 1,529 1,564 1,560 1,655
Live deliveries 1,193 1,225 1,209 1,225 1,302
Clinical pregnancies per initiated cycle (%) 29.1 29.5 30.2 29.0 28.1
Clinical pregnancies per embryo transfer (%) 34.8 35.6 36.4 35.7 36.0
Live deliveries per initiated cycle (%) 22.6 23.6 23.4 22.8 22.1
Live deliveries per initiated non freeze-all cycle (%) 23.1 24.1 24.2 24.2 24.1
Live deliveries per embryo transfer (%) 27.0 28.5 28.2 28.1 28.3
(a) Included autologous cycles, oocyte donation cycles, oocyte/embryo recipient cycles, and surrogacy cycles.
(b) Cycles with OPU included cycles where no oocytes were collected during the procedure.
22 Assisted Reproductive Technology in New Zealand 2014
8 Cumulative success rates for women undertaking autologous treatment 2012 to 2014
This section presents information on all women who started their first autologous fresh ART treatment cycle between 1st January 2012 and 31st December 2012. Women were followed from the start of their first autologous fresh cycle through subsequent fresh and thaw cycles, excluding freeze-all cycles, until 31st December 2014 or until they achieved a live delivery (a delivery of at least one liveborn baby) up to and including 31st October 2015. This longitudinal perspective provides a measure of the outcomes of successive ART treatment cycles undertaken by the same woman up to her first birth following ART treatment. These women might have had additional treatment cycles after 2014 and their treatment information and resulting outcomes will be captured in subsequent annual reports. Therefore, in this dynamic cohort of women undergoing their first autologous fresh ART treatment between 1st January 2012 and 31st December 2012, the cumulative success rates may increase over time as more women return for treatment at a later date.
ART treatment cycles presented in Tables 27 to 32 include all initiated autologous fresh and thaw cycles, excluding freeze-all cycles. Cycles which were cancelled at any stage and did not proceed to oocyte collection or embryo transfer are included. Donor sperm insemination cycles, oocyte/embryo recipient cycles, oocyte/embryo donation cycles, surrogacy arrangement cycles and gamete intrafallopian transfer (GIFT) cycles are not included. A pregnancy that ends before 20 weeks gestation or a stillbirth (fetal death) are not counted as a live delivery.
Table 27 presents the number of cycles by women’s age group. Tables 28 to 32 present cycle-specific live delivery rates, non-progression rates and cumulative live delivery rates for all age groups and women aged < 30, 30-34, 35-39 and ≥ 40 years. Only the first five cycles are presented due to the small number of women undertaking six or more treatment cycles between 1st January 2012 and 31st December 2014.
Definition
Cycle-specific live delivery rate for a specific cycle number is calculated as the number of live deliveries resulting from a specific cycle number divided by the number of women who undertook that cycle number. For example, the cycle specific rate of 23.7% for cycle number 3 measures the proportion of women who undertook a third cycle and achieved a live delivery in that cycle (Table 28).
Non-progression rate for a specific cycle is calculated as the number of women who did not return for further ART treatment cycles before 31st December 2014 divided by the number of women who did not have a live delivery in that cycle. For example, the non-progression rate of 39.6% for cycle number 3 measures the proportion of women who did not achieve a live delivery in cycle number 3, and did not progress to a fourth cycle (Table 28). Reasons why a woman/couple did not progress for further treatment, such as poor prognosis, natural pregnancy, migration, financial, psychological and other unrelated reasons are not collected by ANZARD.
Assisted Reproductive Technology in New Zealand 2014 23
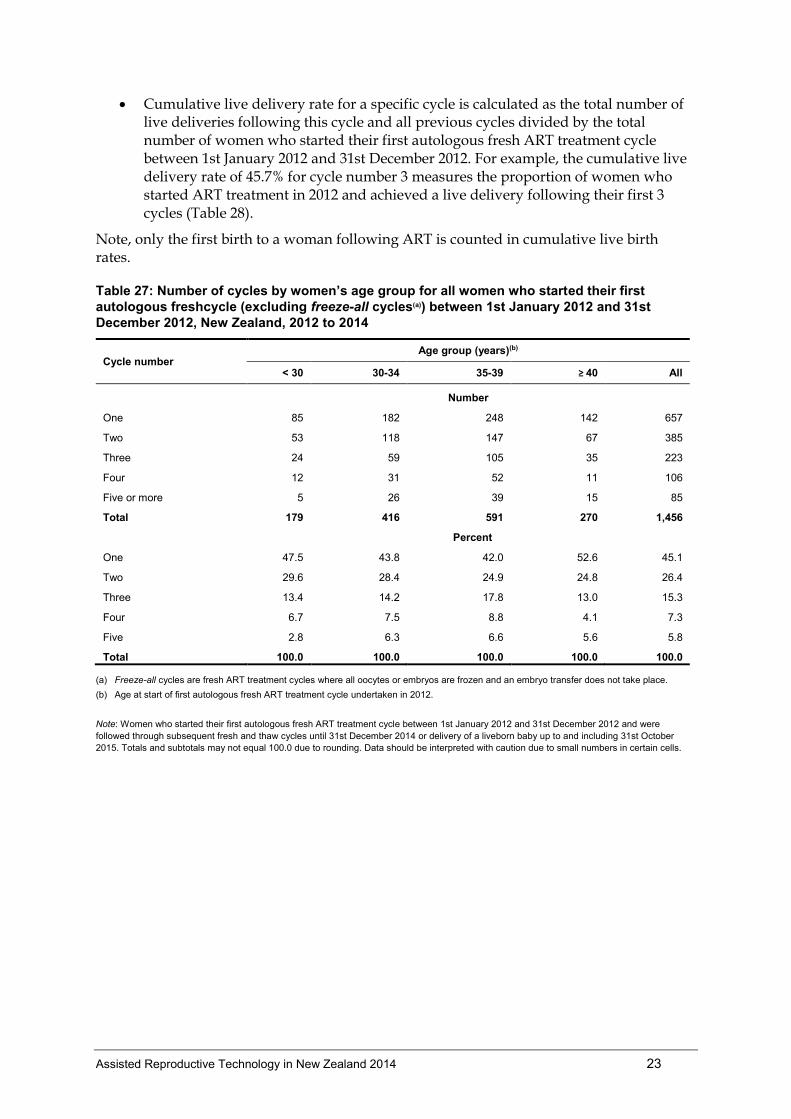
Cumulative live delivery rate for a specific cycle is calculated as the total number of live deliveries following this cycle and all previous cycles divided by the total number of women who started their first autologous fresh ART treatment cycle between 1st January 2012 and 31st December 2012. For example, the cumulative live delivery rate of 45.7% for cycle number 3 measures the proportion of women who started ART treatment in 2012 and achieved a live delivery following their first 3 cycles (Table 28).
Note, only the first birth to a woman following ART is counted in cumulative live birth rates.
Table 27: Number of cycles by women’s age group for all women who started their first
autologous freshcycle (excluding freeze-all cycles(a)) between 1st January 2012 and 31st
December 2012, New Zealand, 2012 to 2014
Cycle number Age group (years)(b)
< 30 30-34 35-39 ≥ 40 All
Number
One 85 182 248 142 657
Two 53 118 147 67 385
Three 24 59 105 35 223
Four 12 31 52 11 106
Five or more 5 26 39 15 85
Total 179 416 591 270 1,456
Percent
One 47.5 43.8 42.0 52.6 45.1
Two 29.6 28.4 24.9 24.8 26.4
Three 13.4 14.2 17.8 13.0 15.3
Four 6.7 7.5 8.8 4.1 7.3
Five 2.8 6.3 6.6 5.6 5.8
Total 100.0 100.0 100.0 100.0 100.0
(a) Freeze-all cycles are fresh ART treatment cycles where all oocytes or embryos are frozen and an embryo transfer does not take place.
(b) Age at start of first autologous fresh ART treatment cycle undertaken in 2012.
Note: Women who started their first autologous fresh ART treatment cycle between 1st January 2012 and 31st December 2012 and were
followed through subsequent fresh and thaw cycles until 31st December 2014 or delivery of a liveborn baby up to and including 31st October
2015. Totals and subtotals may not equal 100.0 due to rounding. Data should be interpreted with caution due to small numbers in certain cells.
24 Assisted Reproductive Technology in New Zealand 2014
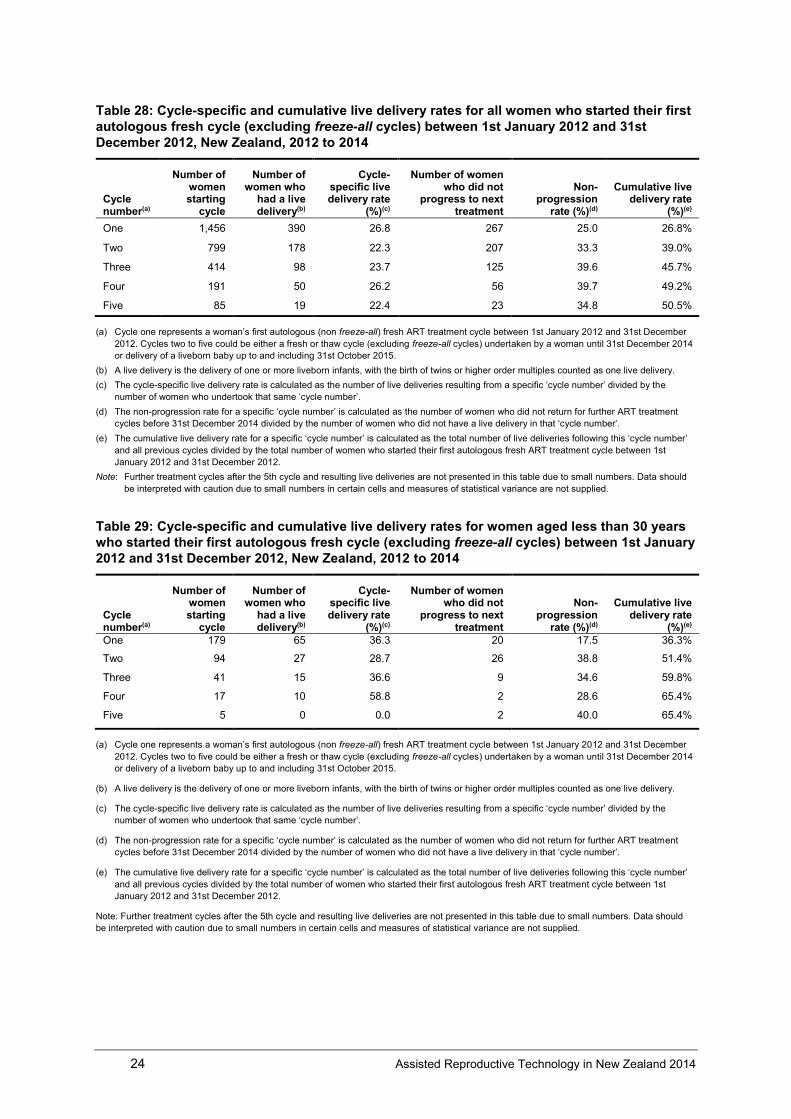
Table 28: Cycle-specific and cumulative live delivery rates for all women who started their first
autologous fresh cycle (excluding freeze-all cycles) between 1st January 2012 and 31st
December 2012, New Zealand, 2012 to 2014
Cycle number(a)
Number of women starting
cycle
Number of women who
had a live delivery(b)
Cycle-specific live delivery rate
(%)(c)
Number of women who did not
progress to next treatment
Non-progression
rate (%)(d)
Cumulative live delivery rate
(%)(e)
One 1,456 390 26.8 267 25.0 26.8%
Two 799 178 22.3 207 33.3 39.0%
Three 414 98 23.7 125 39.6 45.7%
Four 191 50 26.2 56 39.7 49.2%
Five 85 19 22.4 23 34.8 50.5%
(a) Cycle one represents a woman’s first autologous (non freeze-all) fresh ART treatment cycle between 1st January 2012 and 31st December
2012. Cycles two to five could be either a fresh or thaw cycle (excluding freeze-all cycles) undertaken by a woman until 31st December 2014
or delivery of a liveborn baby up to and including 31st October 2015.
(b) A live delivery is the delivery of one or more liveborn infants, with the birth of twins or higher order multiples counted as one live delivery.
(c) The cycle-specific live delivery rate is calculated as the number of live deliveries resulting from a specific ‘cycle number’ divided by the
number of women who undertook that same ‘cycle number’.
(d) The non-progression rate for a specific ‘cycle number’ is calculated as the number of women who did not return for further ART treatment
cycles before 31st December 2014 divided by the number of women who did not have a live delivery in that ‘cycle number’.
(e) The cumulative live delivery rate for a specific ‘cycle number’ is calculated as the total number of live deliveries following this ‘cycle number’
and all previous cycles divided by the total number of women who started their first autologous fresh ART treatment cycle between 1st
January 2012 and 31st December 2012.
Note: Further treatment cycles after the 5th cycle and resulting live deliveries are not presented in this table due to small numbers. Data should
be interpreted with caution due to small numbers in certain cells and measures of statistical variance are not supplied.
Table 29: Cycle-specific and cumulative live delivery rates for women aged less than 30 years
who started their first autologous fresh cycle (excluding freeze-all cycles) between 1st January
2012 and 31st December 2012, New Zealand, 2012 to 2014
Cycle number(a)
Number of women starting
cycle
Number of women who
had a live delivery(b)
Cycle-specific live delivery rate
(%)(c)
Number of women who did not
progress to next treatment
Non-progression
rate (%)(d)
Cumulative live delivery rate
(%)(e)
One 179 65 36.3 20 17.5 36.3%
Two 94 27 28.7 26 38.8 51.4%
Three 41 15 36.6 9 34.6 59.8%
Four 17 10 58.8 2 28.6 65.4%
Five 5 0 0.0 2 40.0 65.4%
(a) Cycle one represents a woman’s first autologous (non freeze-all) fresh ART treatment cycle between 1st January 2012 and 31st December
2012. Cycles two to five could be either a fresh or thaw cycle (excluding freeze-all cycles) undertaken by a woman until 31st December 2014
or delivery of a liveborn baby up to and including 31st October 2015.
(b) A live delivery is the delivery of one or more liveborn infants, with the birth of twins or higher order multiples counted as one live delivery.
(c) The cycle-specific live delivery rate is calculated as the number of live deliveries resulting from a specific ‘cycle number’ divided by the
number of women who undertook that same ‘cycle number’.
(d) The non-progression rate for a specific ‘cycle number’ is calculated as the number of women who did not return for further ART treatment
cycles before 31st December 2014 divided by the number of women who did not have a live delivery in that ‘cycle number’.
(e) The cumulative live delivery rate for a specific ‘cycle number’ is calculated as the total number of live deliveries following this ‘cycle number’
and all previous cycles divided by the total number of women who started their first autologous fresh ART treatment cycle between 1st
January 2012 and 31st December 2012.
Note: Further treatment cycles after the 5th cycle and resulting live deliveries are not presented in this table due to small numbers. Data should
be interpreted with caution due to small numbers in certain cells and measures of statistical variance are not supplied.
Assisted Reproductive Technology in New Zealand 2014 25
Table 30: Cycle-specific and cumulative live delivery rates for women aged 30-34 years who
started their first autologous fresh cycle (excluding freeze-all cycles) between 1st January
2012 and 31st December 2012, New Zealand, 2012 to 2014
Cycle number(a)
Number of women starting
cycle
Number of women who
had a live delivery(b)
Cycle-specific live delivery rate
(%)(c)
Number of women who did not
progress to next treatment
Non-progression
rate (%)(d)
Cumulative live delivery rate
(%)(e)
One 416 141 33.9 41 14.9 33.9%
Two 234 78 33.3 40 25.6 52.6%
Three 116 31 26.7 28 32.9 60.1%
Four 57 14 24.6 17 39.5 63.5%
Five 26 10 38.5 3 18.8 65.9%
(a) Cycle one represents a woman’s first autologous (non freeze-all) fresh ART treatment cycle between 1st January 2012 and 31st December
2012. Cycles two to five could be either a fresh or thaw cycle (excluding freeze-all cycles) undertaken by a woman until 31st December 2014
or delivery of a liveborn baby up to and including 31st October 2015.
(b) A live delivery is the delivery of one or more liveborn infants, with the birth of twins or higher order multiples counted as one live delivery.
(c) The cycle-specific live delivery rate is calculated as the number of live deliveries resulting from a specific ‘cycle number’ divided by the
number of women who undertook that same ‘cycle number’.
(d) The non-progression rate for a specific ‘cycle number’ is calculated as the number of women who did not return for further ART treatment
cycles before 31st December 2014 divided by the number of women who did not have a live delivery in that ‘cycle number’.
(e) The cumulative live delivery rate for a specific ‘cycle number’ is calculated as the total number of live deliveries following this ‘cycle number’
and all previous cycles divided by the total number of women who started their first autologous fresh ART treatment cycle between 1st
January 2012 and 31st December 2012.
Note: Further treatment cycles after the 5th cycle and resulting live deliveries are not presented in this table due to small numbers. Data
should be interpreted with caution due to small numbers in certain cells and measures of statistical variance are not supplied.
Table 31: Cycle-specific and cumulative live delivery rates for women aged 35-39 years who
started their first autologous fresh cycle (excluding freeze-all cycles) between 1st January
2012 and 31st December 2012, New Zealand, 2012 to 2014
Cycle number(a)
Number of women starting
cycle
Number of women who
had a live delivery(b)
Cycle-specific live delivery rate
(%)(c)
Number of women who did not
progress to next treatment
Non-progression
rate (%)(d)
Cumulative live delivery rate
(%)(e)
One 591 158 26.7 90 20.8 26.7%
Two 343 60 17.5 87 30.7 36.9%
Three 196 44 22.4 61 40.1 44.3%
Four 91 25 27.5 27 40.9 48.6%
Five 39 7 17.9 13 40.6 49.7%
(a) Cycle one represents a woman’s first autologous (non freeze-all) fresh ART treatment cycle between 1st January 2012 and 31st December
2012. Cycles two to five could be either a fresh or thaw cycle (excluding freeze-all cycles) undertaken by a woman until 31st December 2014
or delivery of a liveborn baby up to and including 31st October 2015.
(b) A live delivery is the delivery of one or more liveborn infants, with the birth of twins or higher order multiples counted as one live delivery.
(c) The cycle-specific live delivery rate is calculated as the number of live deliveries resulting from a specific ‘cycle number’ divided by the
number of women who undertook that same ‘cycle number’.
(d) The non-progression rate for a specific ‘cycle number’ is calculated as the number of women who did not return for further ART treatment
cycles before 31st December 2014 divided by the number of women who did not have a live delivery in that ‘cycle number’.
(e) The cumulative live delivery rate for a specific ‘cycle number’ is calculated as the total number of live deliveries following this ‘cycle number’
and all previous cycles divided by the total number of women who started their first autologous fresh ART treatment cycle between 1st
January 2012 and 31st December 2012.
Note: Further treatment cycles after the 5th cycle and resulting live deliveries are not presented in this table due to small numbers. Data should
be interpreted with caution due to small numbers in certain cells and measures of statistical variance are not supplied.
26 Assisted Reproductive Technology in New Zealand 2014
Table 32: Cycle-specific and cumulative live delivery rates for women aged 40 years and over
who started their first autologous fresh cycle (excluding freeze-all cycles) between 1st January
2012 and 31st December 2012, New Zealand, 2012 to 2014
Cycle number(a)
Number of women starting
cycle
Number of women who
had a live delivery(b)
Cycle-specific live delivery rate
(%)(c)
Number of women who did not
progress to next treatment
Non-progression
rate (%)(d)
Cumulative live delivery rate
(%)(e)
One 259 26 10.0 107 45.9 10.0%
Two 126 13 10.3 53 46.9 15.1%
Three 60 8 13.3 26 50.0 18.1%
Four 26 1 3.8 10 40.0 18.5%
Five 15 2 13.3 5 38.5 19.3%
(a) Cycle one represents a woman’s first autologous (non freeze-all) fresh ART treatment cycle between 1st January 2012 and 31st December
2012. Cycles two to five could be either a fresh or thaw cycle (excluding freeze-all cycles) undertaken by a woman until 31st December 2014
or delivery of a liveborn baby up to and including 31st October 2015.
(b) A live delivery is the delivery of one or more liveborn infants, with the birth of twins or higher order multiples counted as one live delivery.
(c) The cycle-specific live delivery rate is calculated as the number of live deliveries resulting from a specific ‘cycle number’ divided by the
number of women who undertook that same ‘cycle number’.
(d) The non-progression rate for a specific ‘cycle number’ is calculated as the number of women who did not return for further ART treatment
cycles before 31st December 2014 divided by the number of women who did not have a live delivery in that ‘cycle number’.
(e) The cumulative live delivery rate for a specific ‘cycle number’ is calculated as the total number of live deliveries following this ‘cycle number’
and all previous cycles divided by the total number of women who started their first autologous fresh ART treatment cycle between 1st
January 2012 and 31st December 2012.
Note: Further treatment cycles after the 5th cycle and resulting live deliveries are not presented in this table due to small numbers. Data should
be interpreted with caution due to small numbers in certain cells and measures of statistical variance are not supplied.
Assisted Reproductive Technology in New Zealand 2014 27
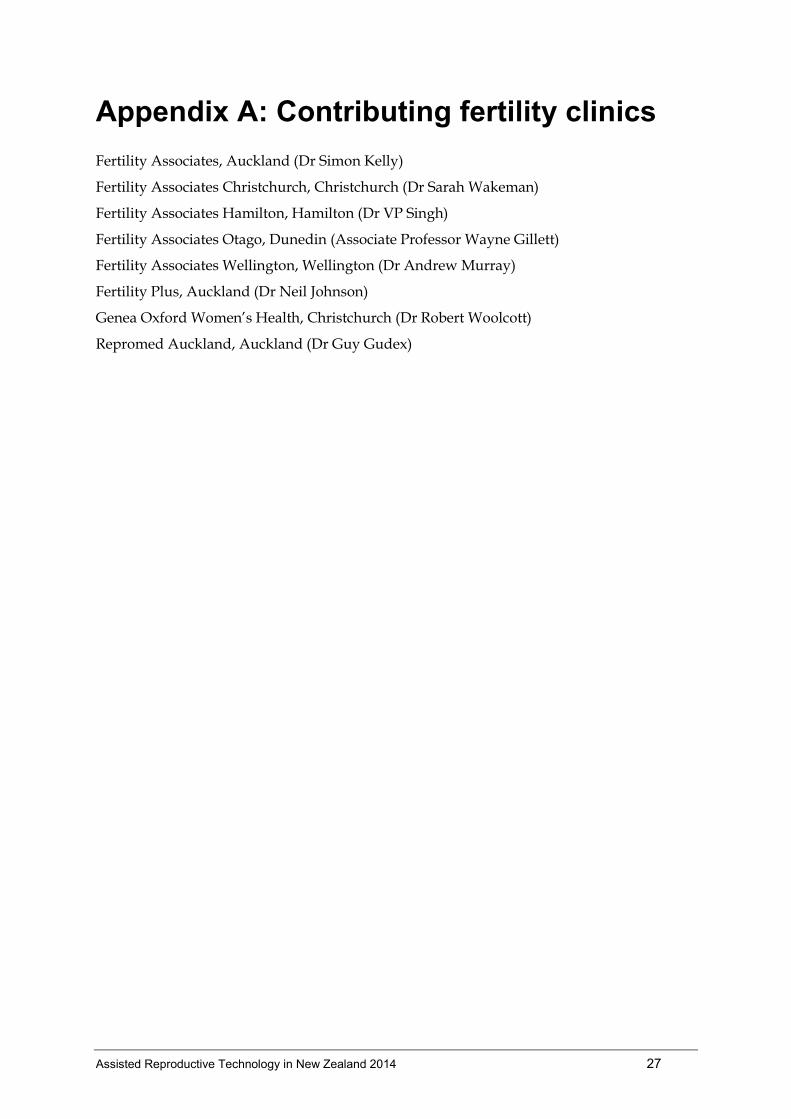
Appendix A: Contributing fertility clinics
Fertility Associates, Auckland (Dr Simon Kelly)
Fertility Associates Christchurch, Christchurch (Dr Sarah Wakeman)
Fertility Associates Hamilton, Hamilton (Dr VP Singh)
Fertility Associates Otago, Dunedin (Associate Professor Wayne Gillett)
Fertility Associates Wellington, Wellington (Dr Andrew Murray)
Fertility Plus, Auckland (Dr Neil Johnson)
Genea Oxford Women’s Health, Christchurch (Dr Robert Woolcott)
Repromed Auckland, Auckland (Dr Guy Gudex)
28 Assisted Reproductive Technology in New Zealand 2014
Appendix B: Data used in this report
The data presented in this report are supplied by 8 fertility clinics in New Zealand and are compiled into ANZARD2.0. ANZARD2.0 includes autologous treatment cycles, treatment involving donated oocytes or embryos and treatment involving surrogacy arrangements. ANZARD 2.0 collects data on the use of ART techniques such as ICSI, oocyte/embryo freezing methods, PGD and cleavage stage /blastocyst transfers. In addition to ART procedures, ANZARD2.0 also collects data from fertility centres about artificial insemination cycles using donated sperm (DI). The outcomes of pregnancies, deliveries and babies born following ART and DI treatments are also maintained in ANZARD2.0. This includes the method of birth, birth status, birthweight, gestational age, plurality, perinatal mortality and selected information on maternal morbidity.
This report presents information on ART and DI treatment cycles that took place in fertility clinics in New Zealand in 2014, and the resulting pregnancies and births. The babies included in this report were conceived through treatment cycles undertaken in 2014, and were born in either 2014 or 2015.
Data validation Most fertility centres have computerised data information management systems and are able to provide the National Perinatal Epidemiology and Statistics Unit (NPESU) with high quality data. All data processed by NPESU undergo a validation process, with data queries being followed up with fertility centre staff. In 2014, information relating to pregnancy and birth outcomes was provided for all New Zealand based cycles.
The Reproductive Technology Accreditation Committee of the Fertility Society of Australia also plays a role in ensuring the quality of ANZARD2.0 data by validating selected records against clinic files in their annual inspections.
Data presentation Data presented in Chapters 2 to 6 are for treatment cycles and not patients. It is possible for an individual woman to undergo more than one treatment cycle in a year or experience more than one pregnancy. This means that information reported about patient characteristics, such as age, parity and cause of infertility, is based on calculations in which individuals may be counted more than once.
The rates of clinical pregnancy and live delivery in Chapters 2 to 6 were measured per initiated cycle. Where the number of initiated cycles was not available, the rates were measured per embryo transfer cycle.
Where applicable, percentages in tables have been calculated including the ‘Not stated’ category. Throughout the report, for totals, percentages may not add up to 100.0 and, for subtotals, they may not add up to the sum of the percentages for the categories. This is due to rounding error.
Data limitations Follow-up of pregnancy and birth outcomes is limited because the ongoing care of pregnant patients is often carried out by non-ART practitioners. The method of follow-up varies by fertility centre and includes follow-up with the patient or clinician or the use of routine data
Assisted Reproductive Technology in New Zealand 2014 29
sourced from a health department. In a small proportion of cases this information is not available. For pregnancies in which there is successful follow-up, data are limited by the self-reported nature of the information. Fertility centre staff invest significant effort in validating such information by obtaining medical records from clinicians or hospitals. Data about previous ART treatment and history of pregnancies are, in some cases, reported by patients.
30 Assisted Reproductive Technology in New Zealand 2014
Glossary
This report categorises ART treatments according to whether a woman used her own oocytes or embryos, or oocytes/embryos were donated by another woman/couple, and whether the embryos were transferred soon after fertilisation or following cryopreservation.
Artificial insemination: a range of techniques of placing sperm into the female genital tract, and can be used with controlled ovarian hyperstimulation or in unstimulated cycles. These techniques are referred to as donor insemination (DI) in this report.
ART (assisted reproductive technology): treatments or procedures that involve the in vitro handling of human oocytes (eggs) and sperm or embryos for the purposes of establishing a pregnancy. ART does not include artificial insemination.
Assisted hatching: when the outer layer of the embryo, the zona pellucida, is either thinned or perforated in the laboratory to aid ‘hatching’ of the embryo, the aim being to potentially improve the chance of implantation in the uterus.
Autologous cycle: an ART treatment cycle in which a woman intends to use, or uses her own oocytes or embryos. GIFT cycles are classified separately from autologous cycles.
Blastocyst: an embryo comprising about 100 cells usually developed by 5 or 6 days after fertilisation.
Caesarean section: an operative delivery by surgical incision through the abdominal wall and uterus.
Cleavage stage embryo: an embryo comprising about 8 cells usually developed by 2 or 3 days after fertilisation.
Clinical pregnancy: a pregnancy in which at least one of the following criteria is met:
• known to be ongoing at 20 weeks
• evidence by ultrasound of an intrauterine sac (with or without a fetal heart)
• examination of products of conception reveal chorionic villi, or
• an ectopic pregnancy has been diagnosed by laparoscope or by ultrasound.
Controlled ovarian hyperstimulation: medical treatment to induce the development of multiple ovarian follicles in order to obtain multiple oocytes at oocyte pick-up (OPU).
Cryopreservation: freezing embryos for potential future ART treatment.
Delivery: a birth event in which one or more babies of 20 weeks or more gestation or of 400 grams or more birthweight are born.
DI (donor insemination) cycle: an artificial insemination cycle in which sperm not from the woman’s partner (donor sperm) is used.
Discontinued cycle: an ART cycle that does not proceed to oocyte pick-up (OPU) or embryo transfer.
Donation cycle: an ART treatment cycle where a woman intends to donate, or donates her oocytes to others. A donation cycle may result in the donation of either oocytes or embryos to a recipient woman. The use of donor sperm does not alter the donor status of the cycle.
Ectopic pregnancy: a pregnancy in which implantation takes place outside the uterine cavity.
Embryo: an egg that has been fertilised by a sperm and has undergone one or more divisions.
Assisted Reproductive Technology in New Zealand 2014 31
Embryo transfer: a procedure whereby embryo(s) are placed in the uterus or fallopian tube. The embryo(s) can be fresh or thawed following cryopreservation, and may include the transfer of cleavage stage embryos or blastocysts.
Freeze-all cycle: a fresh cycle where all oocytes or embryos are preserved for potential future use.
Fetal death (stillbirth): the birth of an infant after 20 or more weeks gestation or 400 grams or more birthweight that shows no signs of life.
Fresh cycle: an ART treatment cycle that intends to use, or uses embryo(s) that have not been cryopreserved (frozen).
Gestational age: the completed weeks of gestation of the fetus. This is calculated as follows:
• Cycles with embryos transferred: (pregnancy end date – embryo transfer date + 16 days) for transfer of cleavage stage embryos and (pregnancy end date – embryo transfer date + 19 days) for transfer of blastocysts.
• GIFT cycles: (pregnancy end date – OPU date) + 14 days.
• DI cycles: (pregnancy end date – date of insemination) + 14 days.
GIFT (gamete intrafallopian transfer): an ART treatment where mature oocytes and sperm are placed directly into a woman’s fallopian tubes so that in vivo fertilisation may take place. GIFT cycles are classified separately from autologous cycles.
Heterotopic pregnancy: a double gestation pregnancy in which implantation takes place both inside and outside the uterine cavity.
ICSI (intracytoplasmic sperm injection): a procedure whereby a single sperm is injected directly into the oocyte to aid fertilisation. If an embryo transfer cycle involves the transfer of at least one embryo created using ICSI, it is counted as an ICSI cycle.
IVF (In vitro fertilisation): an ART procedure that involves extracorporeal fertilisation.
Live birth: according to the World Health Organization (WHO) definition, a live birth is defined as the complete expulsion or extraction from its mother of a product of conception irrespective of the duration of the pregnancy, after such separation, breathes or shows any other evidence of life, such as beating of the heart, pulsation of the umbilical cord, or definite movement of the voluntary muscles, whether or not the umbilical cord has been cut or the placenta is attached; each product of such a birth is considered liveborn. In this report, live births are included if they meet the WHO definition and if they are of 20 weeks or more gestation or 400 grams or more birthweight.
Live delivery: a live delivery is the delivery of one or more liveborn infants, with the birth of twins, triplets or more counted as one live delivery.
Low birthweight: a birthweight of less than 2,500 grams.
Oocyte (egg): a female reproductive cell.
OPU (oocyte pick-up): the procedure to collect oocytes from ovaries, usually by ultrasound guided transvaginal aspiration and rarely by laparoscopic surgery.
Parity: a classification of a woman in terms of the number of previous pregnancies experienced that reached 20 weeks or more gestation.
Parous: refers to a woman who has had at least one previous pregnancy of 20 weeks or more gestation.
PGD (preimplantation genetic diagnosis): a procedure where embryonic cells are removed and screened for chromosomal disorders or genetic diseases before embryo transfer.
32 Assisted Reproductive Technology in New Zealand 2014
Nulliparous: refers to a woman who has never had a pregnancy of 20 weeks or more gestation.
Perinatal death: a fetal death (stillbirth) or neonatal death of at least 20 weeks gestation or at least 400 grams birthweight.
Preterm: a gestation of less than 37 weeks.
Recipient cycle: an ART treatment cycle in which a woman receives oocytes or embryos from another woman.
Secondary sex ratio: the number of male liveborn babies per 100 female liveborn babies.
Surrogacy arrangement: an arrangement where a woman, known as the gestational carrier agrees to carry a child for another person or couple, known as the intended parent(s), with the intention that the child will be raised by the intended parent(s). The oocytes and/or sperm used to create the embryo(s) in the surrogacy cycle can be either from the intended parents or from a donor(s).
Thaw cycle: an ART treatment cycle in which cryopreserved embryos are thawed with the intention of performing embryo transfer.
Thawed embryo: an embryo thawed after cryopreservation. It is used in thaw cycles.
Vitrification: an ultra-rapid cryopreservation method that prevents ice formation within the suspension which is converted to a glass-like solid.
Note: The International Committee Monitoring Assisted Reproductive Technologies (ICMART) has published an ART glossary for the terms used in ART data collections (Zegers-Hochschild et al. 2009). However, the terminology used in this report may differ from that in the ICMART glossary.
Assisted Reproductive Technology in New Zealand 2014 33
References
Focus on Reproduction. September 2015. European Society of Human Reproduction and Embryology (ESHRE). Grimbergen. Belgium. www.eshre.eu
Statistics New Zealand 2014.Population estimates:Estimated Resident Population by Age and Sex (1991+) (Annual-Dec). Viewed 22 May 2017, www.stats.govt.nz/browse_for_stats/population/estimates_and_projections.aspx
World Health Organisation 2010. Mother or nothing: the agony of infertility. Bulletin of the World Health Organisation. Volume 88, Number 12, December 2010, 877-953
Zegers-Hochschild F, Adamson GD, de Mouzon J, Ishihara O, Mansour R, Nygren K, Sullivan E, van der Poel S on behalf of ICMART and WHO 2009. The International Committee Monitoring Assisted Reproductive Technologies (ICMART) and the World Health Organization (WHO) revised glossary on ART terminology. Human Reproduction 24(11):2683–87.