Embed Size (px)
Citation preview

Advisory Committee on Assisted Reproductive Technology
Assisted Reproductive Technology in New Zealand 2012
April 2016
This report has been prepared for the Advisory Committee on Assisted Reproductive Technology by the Perinatal and Reproductive Epidemiology Research Unit (PRERU) of the University of New South Wales. PRERU has provided the data and analysis.
Citation: ACART. 2016. Assisted Reproductive Technology in New Zealand 2012. Wellington: Advisory Committee on Assisted Reproductive Technology.
Published in April 2016 by the Advisory Committee on Assisted Reproductive Technology, PO Box 5013, Wellington 6145, New Zealand
ISBN: 978-0-947491-83-3 (online) HP 6379
This document is available on the ACART website: www.acart.health.govt.nz
Assisted Reproductive Technology in New Zealand 2012 iii
Foreword
On behalf of the Advisory Committee on Assisted Reproductive Technology (ACART) I am pleased to present this report, Assisted Reproductive Technology in New Zealand 2012, the fourth New Zealand-specific report based on the Australian and New Zealand Assisted Reproduction Database (ANZARD). The report provides a quantitative report of the numbers, types and outcomes of assisted reproductive technology in New Zealand. It gives a fuller picture of the uses and outcomes of assisted reproductive procedures in New Zealand. One of ACART’s functions is to monitor the application and health outcomes of assisted reproductive treatments. New Zealand has good data about some uses of assisted reproduction. The Ethics Committee on Assisted Reproductive Technology provides an Annual Report that includes data about procedures that require ethical approval. District Health Boards hold information about publicly funded procedures. However, New Zealand lacks one collated source of comprehensive data looking at the full spectrum of procedures carried out, regardless of how they are funded or categorised in New Zealand’s regulatory framework. The well-established ANZARD report in most cases aggregates data from Australia and New Zealand. This means that the report, while valuable and comprehensive, lacks New Zealand-specific detail. There are significant variations in the regulatory frameworks and funding arrangements for assisted reproductive technology in each country, and in patterns of usage. For these reasons, ACART decided in 2010 to commission New Zealand-specific reports from the ANZARD data. We hope that the report will be useful to consumers, fertility services providers and others with an interest in how New Zealanders are using assisted reproductive technology. With successive annual reports, we will begin to build a picture of use and trends over time. The Ministry of Health has supported ACART in obtaining this report. I would also like to thank Alan Macaldowie of the Australian Institute of Health and Welfare for collaborating with ACART to develop the report.
Alison Douglass Chair, Advisory Committee on Assisted Reproductive Technology February 2016
iv Assisted Reproductive Technology in New Zealand 2012
Acknowledgements
The Australian and New Zealand Assisted Reproduction Database (ANZARD), funded by the Fertility Society of Australia (FSA), is a collaborative effort between the National Perinatal Epidemiology and Statistics Unit (NPESU) and fertility centres in Australia and New Zealand. The NPESU is a formally affiliated unit of the University of New South Wales (UNSW) under the School of Women’s and Children’s Health. We would like to thank all staff in the fertility centres for their efforts in compiling the data and providing additional information when requested. A complete list of all contributing fertility clinics can be found in Appendix A.
Abbreviations
ANZARD Australian and New Zealand Assisted Reproduction Database
ART assisted reproductive technology
DET double embryo transfer
DI donor sperm insemination
FSA Fertility Society of Australia
FSH follicle stimulating hormone
ICSI intracytoplasmic sperm injection
ICMART International Committee Monitoring Assisted Reproductive Technologies
IVF in vitro fertilisation
NPESU National Perinatal Epidemiology and Statistics Unit
OPU oocyte pick-up
PGD preimplantation genetic diagnosis
SET single embryo transfer
UNSW University of New South Wales
Symbols
– not applicable
Assisted Reproductive Technology in New Zealand 2012 v
Contents
Foreword ......................................................................................................................... iii
Acknowledgements....................................................................................................... iv
Abbreviations ................................................................................................................. iv
Symbols ........................................................................................................................... iv
Summary .......................................................................................................................... ix
Use of ART treatment cycles ....................................................................................................... ix
Treatment outcomes and number of babies .............................................................................. ix
Women’s age and parity .............................................................................................................. ix
Autologous fresh cycles ............................................................................................................... ix
Autologous thaw cycles ............................................................................................................... ix
Deliveries by gestation and women’s age .................................................................................. x
Cumulative success rates .............................................................................................................. x
1 Introduction............................................................................................................ 1
Treatments covered in this report................................................................................................ 1
Data used in this report ................................................................................................................. 2
Structure of this report .................................................................................................................. 3
2 Overview of ART treatment in 2012 .................................................................. 4
3 Autologous and donation/recipient cycles in 2012 ......................................... 5
Overview of autologous and recipient cycles ............................................................................ 5
4 Pregnancy and birth outcomes following autologous and recipient cycles in 2012 .................................................................................................................... 19
Early pregnancy loss.................................................................................................................... 19
Deliveries by delivery outcomes and treatment type ............................................................. 20
Deliveries by maternal age ......................................................................................................... 21
Gestational age of babies............................................................................................................. 22
Birth outcomes.............................................................................................................................. 23
5 Preimplantation genetic diagnosis in 2012 ..................................................... 24
6 Donor insemination cycles in 2012 .................................................................. 25
Clinical pregnancies following DI cycles .................................................................................. 25
Perinatal outcomes of babies ...................................................................................................... 25
7 Cumulative success rates for women undertaking autologous treatment 2009–2012 ............................................................................................................... 26
Definition ...................................................................................................................................... 26
vi Assisted Reproductive Technology in New Zealand 2012
Appendices
Appendix A: Contributing fertility clinics................................................................................ 31
Appendix B: Data used in this report ........................................................................................ 32
Glossary ........................................................................................................................... 34
References ....................................................................................................................... 37
List of tables
Table 1: Number of initiated ART treatment cycles by treatment type, New Zealand, 2012 . 4
Table 2: Number of autologous and recipient cycles by women’s age group and treatment type, New Zealand, 2012 ................................................................................................... 6
Table 3: Number of autologous and recipient cycles by women’s partners’ age group and treatment type, New Zealand, 2012 ................................................................................. 6
Table 4: Number of autologous and recipient cycles by parity and treatment type, New Zealand, 2012 ....................................................................................................................... 6
Table 5: Number of autologous and recipient cycles with fertilisation attempted by treatment type and procedure, New Zealand, 2012 ...................................................... 7
Table 6: Number of autologous and recipient embryo transfer cycles by number of embryos transferred per cycle and women’s age group, New Zealand, 2012............................ 7
Table 7: Number of autologous and recipient embryo transfer cycles by treatment type and stage of embryo development, New Zealand, 2012 ....................................................... 7
Table 8: Number of autologous and recipient embryo transfer cycles by freezing method and stage of embryo development, New Zealand, 2012 ............................................... 8
Table 9: Outcomes of autologous fresh cycles by women’s age group, New Zealand, 2012 .. 9
Table 10: Outcomes of autologous fresh embryo transfer cycles by women’s age and number of embryos transferred, New Zealand, 2012 ................................................................. 10
Table 11: Outcomes of autologous fresh embryo transfer cycles by women’s age and stage of embryo development, and New Zealand, 2012 ............................................................ 11
Table 12: Outcomes of autologous thaw cycles by women’s age group, New Zealand, 2012 12
Table 13: Outcomes of autologous thaw embryo transfer cycles by women’s age and number of embryos transferred, Australia and New Zealand, 2012 ........................................ 13
Table 14: Outcomes of autologous thaw embryo transfer cycles by women’s age and stage of embryo development, New Zealand, 2012 ................................................................... 14
Table 15: Number of oocyte donation cycles by donor’s age group, New Zealand, 2012 ...... 15
Table 16: Outcomes of oocyte/embryo recipient cycles by treatment type, New Zealand, 2012 ..................................................................................................................................... 16
Table 17: Outcomes of oocyte/embryo recipient cycles by recipient’s age group, New Zealand, 2012 ..................................................................................................................... 17
Table 18: Outcomes of oocyte/embryo recipient cycles by donor’s age group, New Zealand, 2012 ..................................................................................................................................... 18
Table 19: Early pregnancy losses by pregnancy outcome and treatment type, New Zealand, 2012 ..................................................................................................................................... 19
Table 20: Deliveries by delivery outcome and treatment type, New Zealand, 2012 ................ 20

Assisted Reproductive Technology in New Zealand 2012 vii
Table 21: Deliveries by gestation and maternal age group, New Zealand, 2012 ...................... 21
Table 22: Babies by gestational age and plurality, New Zealand, 2012 ..................................... 22
Table 23: Liveborn babies by birthweight group and plurality, New Zealand, 2012 .............. 23
Table 24: Number of cycles with PGD by type of embryo, New Zealand, 2012....................... 24
Table 25: Outcomes of DI cycles by women’s age group, New Zealand, 2012 ......................... 25
Table 26: Number of cycles by women’s age group for all women who started their first autologous fresh cycle between 1 January 2009 and 31 December 2009, New Zealand(a) ........................................................................................................................... 27
Table 27: Cycle-specific and cumulative live delivery rates for all women who started their first autologous fresh cycle between 1 January 2009 and 31 December 2009, New Zealand .............................................................................................................................. 28
Table 28: Cycle-specific and cumulative live delivery rates for women aged less than 30 years who started their first autologous fresh cycle between 1 January 2009 and 31 December 2009, New Zealand ................................................................................... 28
Table 29: Cycle-specific and cumulative live delivery rates for women aged 30–34 years who started their first autologous fresh cycle between 1 January 2009 and 31 December 2009, New Zealand ........................................................................................................... 29
Table 30: Cycle-specific and cumulative live delivery rates for women aged 35–39 years who started their first autologous fresh cycle between 1 January 2009 and 31 December 2009, New Zealand ........................................................................................................... 29
Table 31: Cycle-specific and cumulative live delivery rates for women aged 40 years and over who started their first autologous fresh cycle between 1 January 2009 and 31 December 2009, New Zealand ................................................................................... 30

Assisted Reproductive Technology in New Zealand 2012 ix
Summary
Use of ART treatment cycles
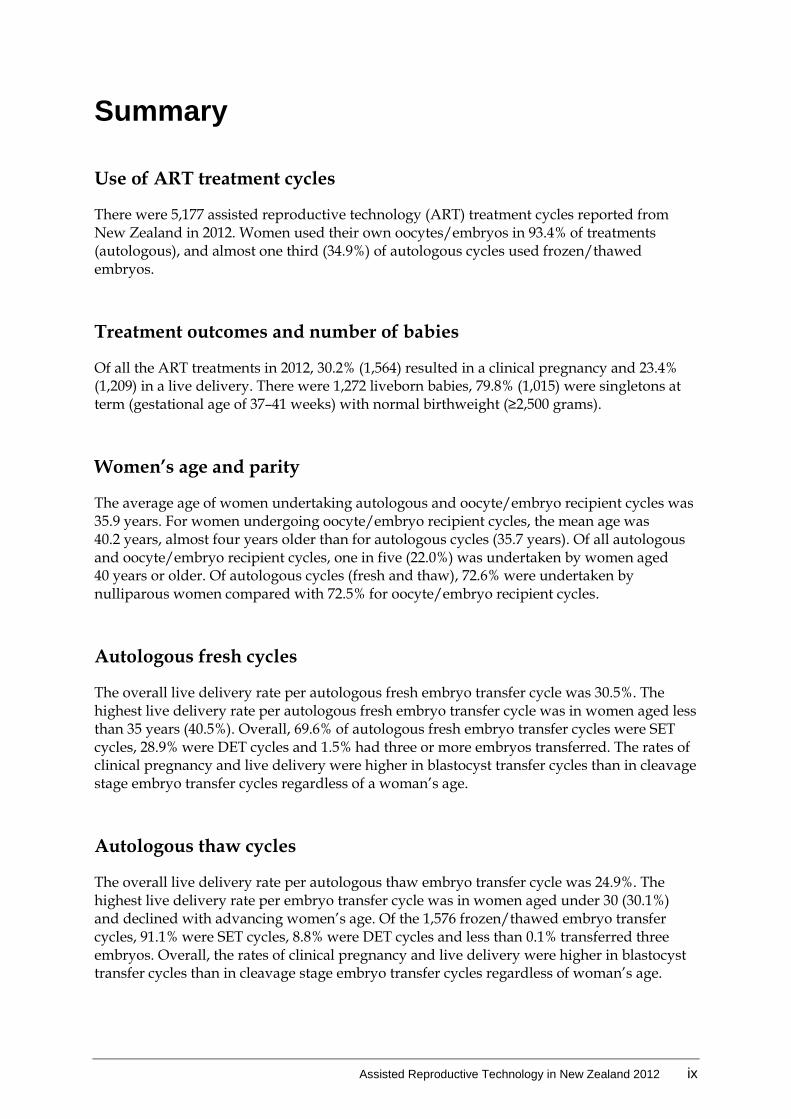
There were 5,177 assisted reproductive technology (ART) treatment cycles reported from New Zealand in 2012. Women used their own oocytes/embryos in 93.4% of treatments (autologous), and almost one third (34.9%) of autologous cycles used frozen/thawed embryos.
Treatment outcomes and number of babies
Of all the ART treatments in 2012, 30.2% (1,564) resulted in a clinical pregnancy and 23.4% (1,209) in a live delivery. There were 1,272 liveborn babies, 79.8% (1,015) were singletons at term (gestational age of 37–41 weeks) with normal birthweight (≥2,500 grams).
Women’s age and parity
The average age of women undertaking autologous and oocyte/embryo recipient cycles was 35.9 years. For women undergoing oocyte/embryo recipient cycles, the mean age was 40.2 years, almost four years older than for autologous cycles (35.7 years). Of all autologous and oocyte/embryo recipient cycles, one in five (22.0%) was undertaken by women aged 40 years or older. Of autologous cycles (fresh and thaw), 72.6% were undertaken by nulliparous women compared with 72.5% for oocyte/embryo recipient cycles.
Autologous fresh cycles
The overall live delivery rate per autologous fresh embryo transfer cycle was 30.5%. The highest live delivery rate per autologous fresh embryo transfer cycle was in women aged less than 35 years (40.5%). Overall, 69.6% of autologous fresh embryo transfer cycles were SET cycles, 28.9% were DET cycles and 1.5% had three or more embryos transferred. The rates of clinical pregnancy and live delivery were higher in blastocyst transfer cycles than in cleavage stage embryo transfer cycles regardless of a woman’s age.
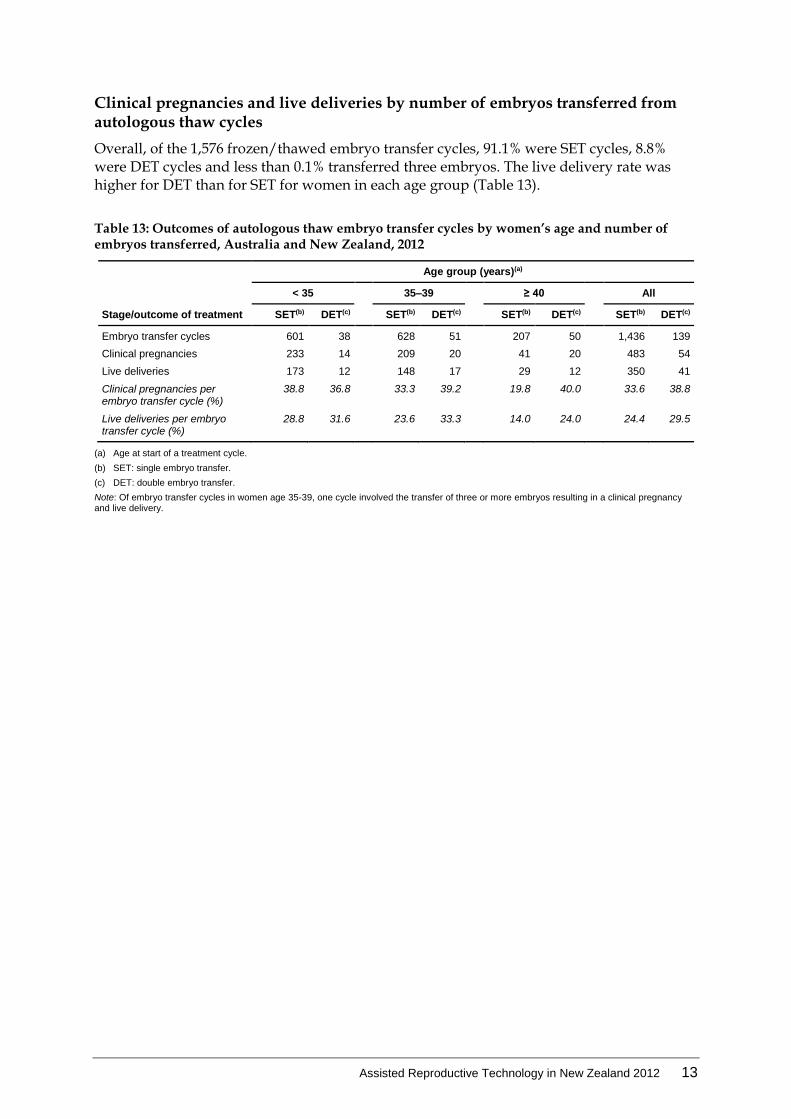
Autologous thaw cycles
The overall live delivery rate per autologous thaw embryo transfer cycle was 24.9%. The highest live delivery rate per embryo transfer cycle was in women aged under 30 (30.1%) and declined with advancing women’s age. Of the 1,576 frozen/thawed embryo transfer cycles, 91.1% were SET cycles, 8.8% were DET cycles and less than 0.1% transferred three embryos. Overall, the rates of clinical pregnancy and live delivery were higher in blastocyst transfer cycles than in cleavage stage embryo transfer cycles regardless of woman’s age.

x Assisted Reproductive Technology in New Zealand 2012
Deliveries by gestation and women’s age
Of the 1,219 deliveries, 5.2% were multiple gestation deliveries. Women aged less than 35 years had the lowest proportion of multiple gestation deliveries (3.8%) when compared to older women.
Cumulative success rates
Since 2009, the ANZARD has included data items which make it possible to follow a woman from her first fresh ART treatment cycle through subsequent fresh and thaw cycles. There were 1,492 women identified as having their first fresh autologous cycle in 2009. These women were followed through their subsequent fresh and thaw cycles until 31 December 2012 or until they achieved a live delivery (a delivery of at least one liveborn baby) up to and including 31 October 2013. For women identified in this cohort that undertook their first autologous fresh cycle in 2009, the cumulative live delivery rate was 25.8% after the first cycle, increasing to 35.6% after two cycles, 41.4% after three cycles, 43.8% after four cycles and 45.8% after five cycles.

Assisted Reproductive Technology in New Zealand 2012 1
1 Introduction
It is estimated that around 9% of couples at any given time experience infertility, representing the source of much personal suffering to millions around the world (Boivin et al 2007). The common medical definition of ‘infertility’ is the failure to achieve a clinical pregnancy after 12 or more months of regular unprotected sexual intercourse (Zegers-Hochschild et al 2009). Infertility is increasingly being overcome through advancements in fertility treatment, in particular assisted reproductive technologies (ARTs). ARTs have evolved over the last three decades into a suite of mainstream medical interventions that have resulted in the birth of more than 5 million children worldwide (ICMART 2012). The purpose of this annual report is to inform clinicians, researchers, government and the community about ART treatment and the resulting pregnancy and birth outcomes; to provide ongoing monitoring of ART treatment practices, success rates and perinatal outcomes; and to provide information for national and international comparisons. The Fertility Society of Australia (FSA), in collaboration with the University of New South Wales (UNSW), is committed to providing informative annual statistics on ART treatments and is pleased to present the 2012 annual report on the use of ART in New Zealand.
Treatments covered in this report
ART is a group of procedures that involve the in vitro (outside of body) handling of human oocytes (eggs) and sperm or embryos for the purposes of establishing a pregnancy (Zegers-Hochschild et al 2009). A typical fresh in vitro fertilisation (IVF) cycle involves the following five steps:
1. controlled ovarian hyperstimulation during which an ovarian stimulation regimen, typically using follicle stimulating hormone (FSH), is administered to a woman over a number of days to induce the maturation of multiple oocytes
2. oocyte pick-up (OPU) where mature oocytes are aspirated from ovarian follicles
3. fertilisation of the collected oocytes by incubating them with sperm (from the woman’s partner or donor) over a few hours in the laboratory
4. embryo maturation during which a fertilised oocyte is cultured for 2–3 days to form a cleavage stage embryo (6–8 cells) or 5–6 days to create a blastocyst (60–100 cells)
5. transfer of one or more fresh embryos into the uterus in order to achieve pregnancy. Treatment may be discontinued at any stage during a treatment cycle due to a number of reasons including inadequate response of ovaries to medication, excessive ovarian stimulation, failure to obtain oocytes, failure of oocyte fertilisation, inadequate embryo growth or patient choice. Over the last three decades, ART has evolved to encompass complex ovarian hyperstimulation protocols and numerous variations to the typical fresh IVF treatment cycle described above. Some of these variations include:
2 Assisted Reproductive Technology in New Zealand 2012
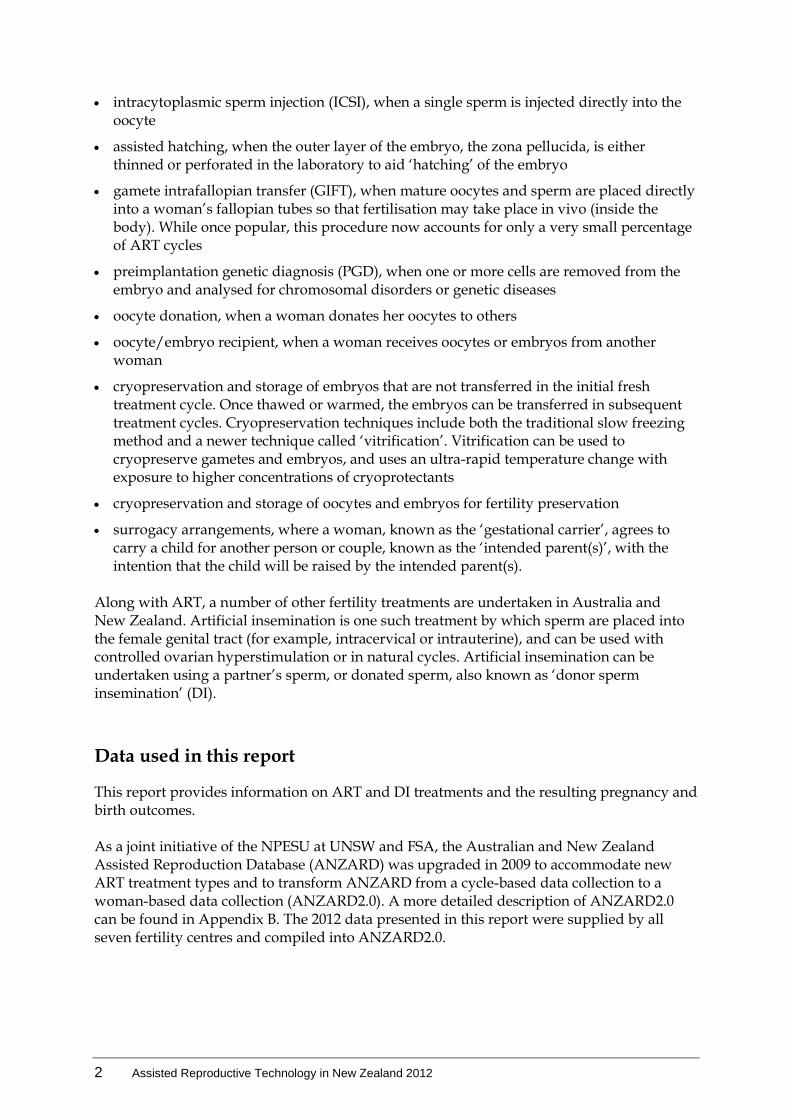
intracytoplasmic sperm injection (ICSI), when a single sperm is injected directly into the oocyte
assisted hatching, when the outer layer of the embryo, the zona pellucida, is either thinned or perforated in the laboratory to aid ‘hatching’ of the embryo
gamete intrafallopian transfer (GIFT), when mature oocytes and sperm are placed directly into a woman’s fallopian tubes so that fertilisation may take place in vivo (inside the body). While once popular, this procedure now accounts for only a very small percentage of ART cycles
preimplantation genetic diagnosis (PGD), when one or more cells are removed from the embryo and analysed for chromosomal disorders or genetic diseases
oocyte donation, when a woman donates her oocytes to others
oocyte/embryo recipient, when a woman receives oocytes or embryos from another woman
cryopreservation and storage of embryos that are not transferred in the initial fresh treatment cycle. Once thawed or warmed, the embryos can be transferred in subsequent treatment cycles. Cryopreservation techniques include both the traditional slow freezing method and a newer technique called ‘vitrification’. Vitrification can be used to cryopreserve gametes and embryos, and uses an ultra-rapid temperature change with exposure to higher concentrations of cryoprotectants
cryopreservation and storage of oocytes and embryos for fertility preservation
surrogacy arrangements, where a woman, known as the ‘gestational carrier’, agrees to carry a child for another person or couple, known as the ‘intended parent(s)’, with the intention that the child will be raised by the intended parent(s).
Along with ART, a number of other fertility treatments are undertaken in Australia and New Zealand. Artificial insemination is one such treatment by which sperm are placed into the female genital tract (for example, intracervical or intrauterine), and can be used with controlled ovarian hyperstimulation or in natural cycles. Artificial insemination can be undertaken using a partner’s sperm, or donated sperm, also known as ‘donor sperm insemination’ (DI).
Data used in this report
This report provides information on ART and DI treatments and the resulting pregnancy and birth outcomes. As a joint initiative of the NPESU at UNSW and FSA, the Australian and New Zealand Assisted Reproduction Database (ANZARD) was upgraded in 2009 to accommodate new ART treatment types and to transform ANZARD from a cycle-based data collection to a woman-based data collection (ANZARD2.0). A more detailed description of ANZARD2.0 can be found in Appendix B. The 2012 data presented in this report were supplied by all seven fertility centres and compiled into ANZARD2.0.

Assisted Reproductive Technology in New Zealand 2012 3
Structure of this report
This report has seven chapters, including this introductory chapter (Chapter 1). Chapter 2—’Overview of ART treatment in 2012’, provides an outline of the numbers and outcomes of all ART treatments undertaken in New Zealand. Chapter 3—’Autologous and donation/recipient cycles in 2012’, presents data on women undergoing treatment, cycle types, and the outcomes of treatment. Chapter 4—’Pregnancy and birth outcomes following embryo transfer cycles in 2012’, presents data on the outcomes of clinical pregnancies and deliveries following autologous and recipient cycles including a description of perinatal outcomes. Chapter 5—’Preimplantation genetic diagnosis’, includes information on the numbers of embryos that had cells removed and analysed for chromosomal disorders or genetic diseases before transfer. Chapter 6—’Donor sperm insemination cycles in 2012’, presents data on DI cycles and their outcomes, including a description of pregnancy and perinatal outcomes. Chapter 7—’ Cumulative success rates for women undertaking autologous treatment 2009-2012’, presents information on all women who started their first autologous fresh ART treatment cycle between 1 January 2009 and 31 December 2009. Appendices – Appendix A lists the contributing fertility clinics. Appendix B provides an overview of the ANZARD2.0 data collection that was used to prepare this report.

4 Assisted Reproductive Technology in New Zealand 2012
2 Overview of ART treatment in 2012
There were 5,177 assisted reproductive technology (ART) treatment cycles reported from New Zealand clinics in 2012. Of these 93.4% of cycles were autologous cycles (where a woman intended to use, or used her own oocytes or embryos). Of these 4,835 autologous cycles, 3,150 (65.1%) were fresh cycles and 1,685 (34.9%) were thaw cycles. Other treatment cycles accounted for a small proportion of cycles comprising 3.6% oocyte recipient cycles, 0.4% embryo recipient cycles, 2.1% oocyte donation cycles and 0.5% surrogacy cycles. Of all the ART treatments in 2012, 30.2% (1,564) resulted in a clinical pregnancy and 23.4% (1,209) in a live delivery. There were 1,272 liveborn babies, 79.8% (1,015) were singletons at term (gestational age of 37–41 weeks) with normal birthweight (≥2,500 grams).
Table 1: Number of initiated ART treatment cycles by treatment type, New Zealand, 2012
Treatment type
Number of initiated
ART cycles
Percent of treatment
types
Number of clinical
pregnancies
Number of live
deliveries
Number of liveborn
babies
Number of liveborn singletons at term with
normal birthweight
Autologous 4,835 93.4 1,495 1,156 1,217 969
Fresh 3,150 60.8 957 764 806 640
Thaw 1,685 32.5 538 392 411 329
Oocyte recipient 187 3.6 59 46 48 40
Embryo recipient 20 0.4 5 5 5 4
Oocyte donation 111 2.1 – – – –
Surrogacy arrangement cycles 24 0.5 5 2 2 2
Commissioning cycles(a) 10 0.2 – – – –
Gestational carrier cycles(b) 14 0.3 5 2 2 2
Total 5,177 100.0 1,564 1,209 1,272 1,015
(a) A variety of cycle types undertaken as part of surrogacy arrangements, e.g. cycles undertaken by intended parents or women donating their oocytes or embryos for use by the gestational carrier.
(b) A cycle undertaken by a woman who carries, or intends to carry, a pregnancy on behalf of the intended parents with an agreement that the child will be raised by the intended parent(s).

Assisted Reproductive Technology in New Zealand 2012 5
3 Autologous and donation/recipient cycles in 2012
This chapter presents data on initiated autologous cycles, oocyte donation cycles and oocyte/embryo recipient cycles. An ‘autologous cycle’ is defined as an ART treatment cycle in which a woman intends to use, or uses her own oocytes. A ‘donation cycle’ is defined as an ART treatment cycle in which a woman intends to donate, or donates her oocytes to others. A donation cycle may result in the donation of either oocytes or embryos to a recipient woman. The use of donor sperm does not influence the donor status of the cycle. A ‘recipient cycle’ is defined as an ART treatment cycle in which a woman receives oocytes or embryos from another woman. Autologous and donor/recipient cycles can involve the use of, or intended use of, either fresh or frozen/thawed embryos.
Overview of autologous and recipient cycles
Age of women and their partners
The average age of women undertaking autologous and oocyte/embryo recipient cycles was 35.9 years. For women undergoing oocyte/embryo recipient cycles, the mean age was 40.2 years, almost four years older than for autologous cycles (35.7 years). Of all autologous and oocyte/embryo recipient cycles, one in five (22.0%) was undertaken by women aged

6 Assisted Reproductive Technology in New Zealand 2012
40 ears or older (Table 2). The average age of partners was 38.7 years, with more than one-third (38.3%) aged 40 years or older (Table 3).
Table 2: Number of autologous and recipient cycles by women’s age group and treatment type, New Zealand, 2012
Age group (years)(a)
Autologous Oocyte /embryo
recipient
All Fresh Thaw
Number Percent Number Percent Number Percent Number Percent
< 30 320 10.2 148 8.8 5 2.4 473 9.4
30–34 800 25.4 526 31.2 22 10.6 1,348 26.7
35–39 1,328 42.2 727 43.1 59 28.5 2,114 41.9
40–44 677 21.5 276 16.4 81 39.1 1,034 20.5
≥ 45 25 0.8 8 0.5 40 19.3 73 1.4
Total 3,150 100.0 1,685 100.0 207 100.0 5,042 100.0
(a) Age at start of treatment cycle.
Note: Data are collected for each treatment cycle. Therefore, some individuals may be counted more than once.
Table 3: Number of autologous and recipient cycles by women’s partners’ age group and treatment type, New Zealand, 2012
Age group (years)(a)
Autologous Oocyte/embryo
recipient
All Fresh Thaw
Number Percent Number Percent Number Percent Number Percent
< 30 178 5.7 74 4.4 7 3.4 259 5.1
30–34 647 20.5 356 21.1 19 9.2 1,022 20.3
35–39 988 31.4 605 35.9 57 27.5 1,650 32.7
40–44 714 22.7 353 20.9 65 31.4 1,132 22.5
≥ 45 516 16.4 237 14.1 44 21.3 797 15.8
Not stated 107 3.4 60 3.6 15 7.2 182 3.6
Total 3,150 100.0 1,685 100.0 207 100.0 5,042 100.0
(a) Age at start of treatment cycle.
Note: Data are collected for each treatment cycle. Therefore, some individuals may be counted more than once.
Parity
Parity is the number of previous pregnancies of 20 weeks or more gestation experienced by a woman. A woman who has had no previous pregnancies of 20 or more weeks gestation is called nulliparous. A woman who has had at least one previous pregnancy of 20 weeks or more gestation is described as parous. Of autologous cycles (fresh and thaw), 72.6% were undertaken by nulliparous women compared with 72.5% for oocyte/embryo recipient cycles (Table 4).
Table 4: Number of autologous and recipient cycles by parity and treatment type, New Zealand, 2012
Parity Autologous Oocyte/embryo recipient
All
Fresh Thaw

Assisted Reproductive Technology in New Zealand 2012 7
Number Percent Number Percent Number Percent Number Percent
Nulliparous 2,453 77.9 1,056 62.7 150 72.5 3,659 72.6
Parous 696 22.1 628 37.3 57 27.5 1,381 27.4
Not stated 1 0.0 1 0.1 0 0.0 2 0.0
Total 3,150 100.0 1,685 100.0 207 100.0 5,042 100.0
Note: Data are collected for each treatment cycle. Therefore, some individuals may be counted more than once.
Table 5: Number of autologous and recipient cycles with fertilisation attempted by treatment type and procedure, New Zealand, 2012
Procedure
Autologous Oocyte/embryo recipient
Fresh(a) Thaw(b) Fresh(a) Thaw(b)
Number Percent Number Percent Number Percent Number Percent
IVF 1,309 46.1 825 52.3 52 51.0 61 61.6
ICSI(c) 1,532 53.9 751 47.7 50 49.0 38 38.4
Total 2,841 100.0 1,576 100.0 102 100.0 99 100.0
(a) Fresh cycles where fertilisation was attempted.
(b) Thaw cycles where embryos were transferred.
(c) Mixed IVF/ICSI cycles were classed as ICSI cycles.
Table 6: Number of autologous and recipient embryo transfer cycles by number of embryos transferred per cycle and women’s age group, New Zealand, 2012
Age group (years)(a)
Number of embryos transferred
One Two Three or more All
Number Percent Number Percent Number Percent Number Percent
< 30 363 94.8 20 5.2 0 0.0 383 100.0
30–34 1,058 91.3 101 8.7 0 0.0 1,159 100.0
35–39 1,425 78.2 397 21.8 1 0.1 1,823 100.0
40–44 456 53.6 362 42.5 33 3.9 851 100.0
≥ 45 48 77.4 10 16.1 4 6.5 62 100.0
Total 3,350 78.3 890 20.8 38 0.9 4,278 100.0
(a) Age at start of a treatment cycle.
Table 7: Number of autologous and recipient embryo transfer cycles by treatment type and stage of embryo development, New Zealand, 2012
Type and procedure
Autologous Oocyte/embryo recipient
Fresh Thaw Fresh Thaw
Number Percent Number Percent Number Percent Number Percent
Cleavage embryo
1,445 57.7 213 13.5 38 39.2 23 23.2
Blastocyst 1,061 42.3 1,363 86.5 59 60.8 76 76.8
Total 2,506 100.0 1,576 100.0 97 100.0 99 100.0
8 Assisted Reproductive Technology in New Zealand 2012
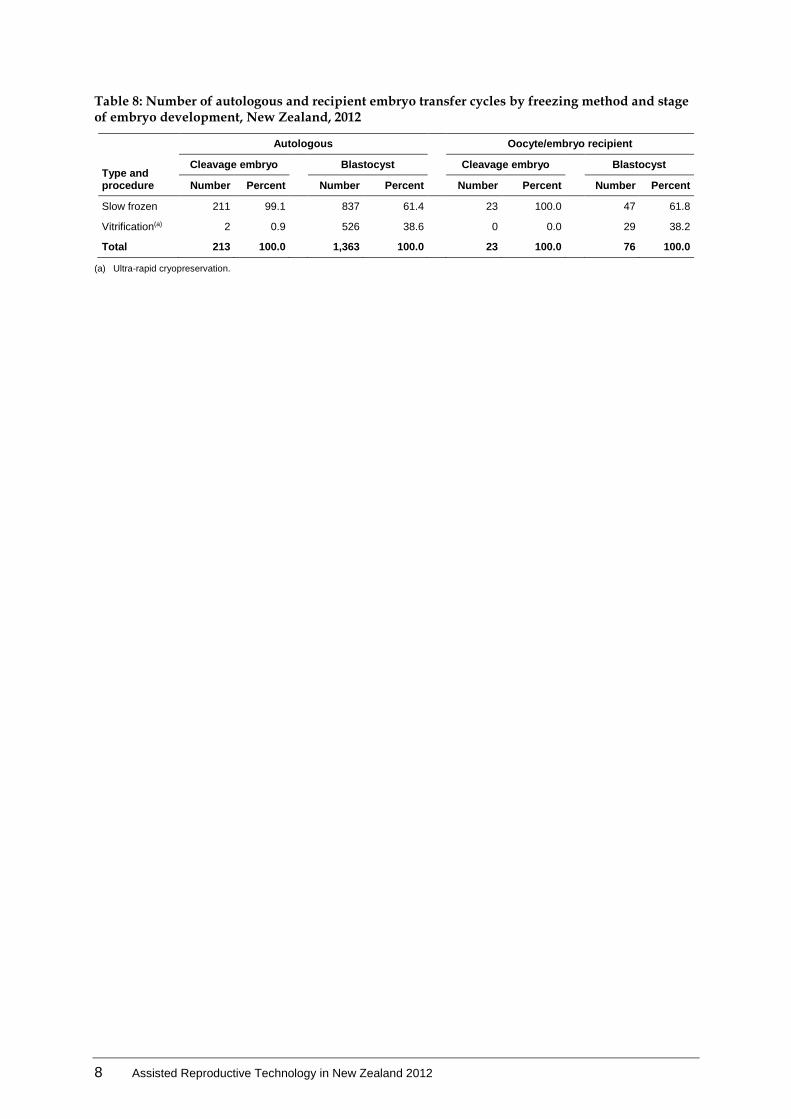
Table 8: Number of autologous and recipient embryo transfer cycles by freezing method and stage of embryo development, New Zealand, 2012
Type and procedure
Autologous Oocyte/embryo recipient
Cleavage embryo Blastocyst Cleavage embryo Blastocyst
Number Percent Number Percent Number Percent Number Percent
Slow frozen 211 99.1 837 61.4 23 100.0 47 61.8
Vitrification(a) 2 0.9 526 38.6 0 0.0 29 38.2
Total 213 100.0 1,363 100.0 23 100.0 76 100.0
(a) Ultra-rapid cryopreservation.

Assisted Reproductive Technology in New Zealand 2012 9
Clinical pregnancies and live deliveries from autologous fresh cycles by women’s age
The overall live delivery rate per autologous fresh embryo transfer cycle was 30.5%. The highest live delivery rate per embryo transfer cycle was in women aged less than 35 years (40.5%). The rate declined steadily with advancing women’s age (Table 9).
Table 9: Outcomes of autologous fresh cycles by women’s age group, New Zealand, 2012
Stage/outcome of treatment
Age group (years)(a)
< 30 30–34 35–39 40–44 ≥ 45 All
Initiated cycles 320 800 1,328 677 25 3,150
Cycles with OPU 300 761 1,228 594 21 2,904
Embryo transfers 242 636 1,085 525 18 2,506
Clinical pregnancies 109 295 421 130 2 957
Live deliveries 95 261 331 77 0 764
Live deliveries per initiated cycle (%) 29.7 32.6 24.9 11.4 0.0 24.3
Live deliveries per embryo transfer cycle (%) 39.3 41.0 30.5 14.7 0.0 30.5
Live deliveries per clinical pregnancy (%) 87.2 88.5 78.6 59.2 0.0 79.8
(a) Age at start of a treatment cycle.
10 Assisted Reproductive Technology in New Zealand 2012
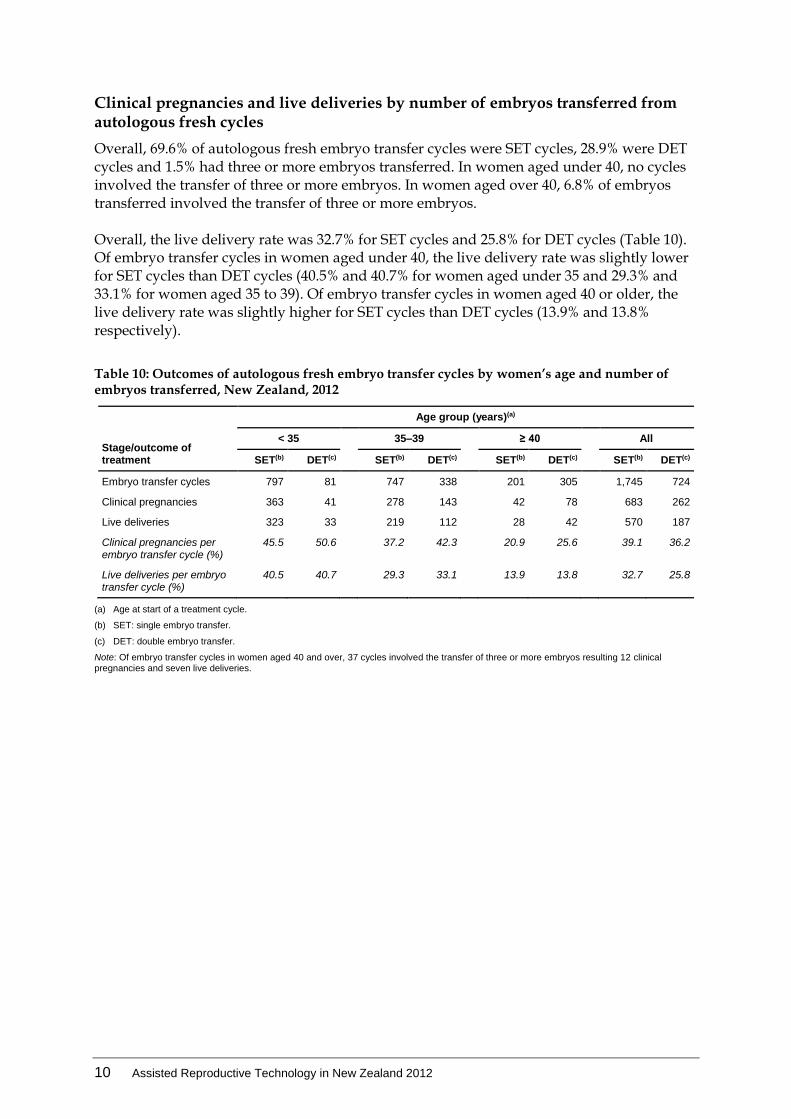
Clinical pregnancies and live deliveries by number of embryos transferred from autologous fresh cycles
Overall, 69.6% of autologous fresh embryo transfer cycles were SET cycles, 28.9% were DET cycles and 1.5% had three or more embryos transferred. In women aged under 40, no cycles involved the transfer of three or more embryos. In women aged over 40, 6.8% of embryos transferred involved the transfer of three or more embryos. Overall, the live delivery rate was 32.7% for SET cycles and 25.8% for DET cycles (Table 10). Of embryo transfer cycles in women aged under 40, the live delivery rate was slightly lower for SET cycles than DET cycles (40.5% and 40.7% for women aged under 35 and 29.3% and 33.1% for women aged 35 to 39). Of embryo transfer cycles in women aged 40 or older, the live delivery rate was slightly higher for SET cycles than DET cycles (13.9% and 13.8% respectively).
Table 10: Outcomes of autologous fresh embryo transfer cycles by women’s age and number of embryos transferred, New Zealand, 2012
Stage/outcome of treatment
Age group (years)(a)
< 35 35–39 ≥ 40 All
SET(b) DET(c) SET(b) DET(c) SET(b) DET(c) SET(b) DET(c)
Embryo transfer cycles 797 81 747 338 201 305 1,745 724
Clinical pregnancies 363 41 278 143 42 78 683 262
Live deliveries 323 33 219 112 28 42 570 187
Clinical pregnancies per embryo transfer cycle (%)
45.5 50.6 37.2 42.3 20.9 25.6 39.1 36.2
Live deliveries per embryo transfer cycle (%)
40.5 40.7 29.3 33.1 13.9 13.8 32.7 25.8
(a) Age at start of a treatment cycle.
(b) SET: single embryo transfer.
(c) DET: double embryo transfer.
Note: Of embryo transfer cycles in women aged 40 and over, 37 cycles involved the transfer of three or more embryos resulting 12 clinical pregnancies and seven live deliveries.
Assisted Reproductive Technology in New Zealand 2012 11
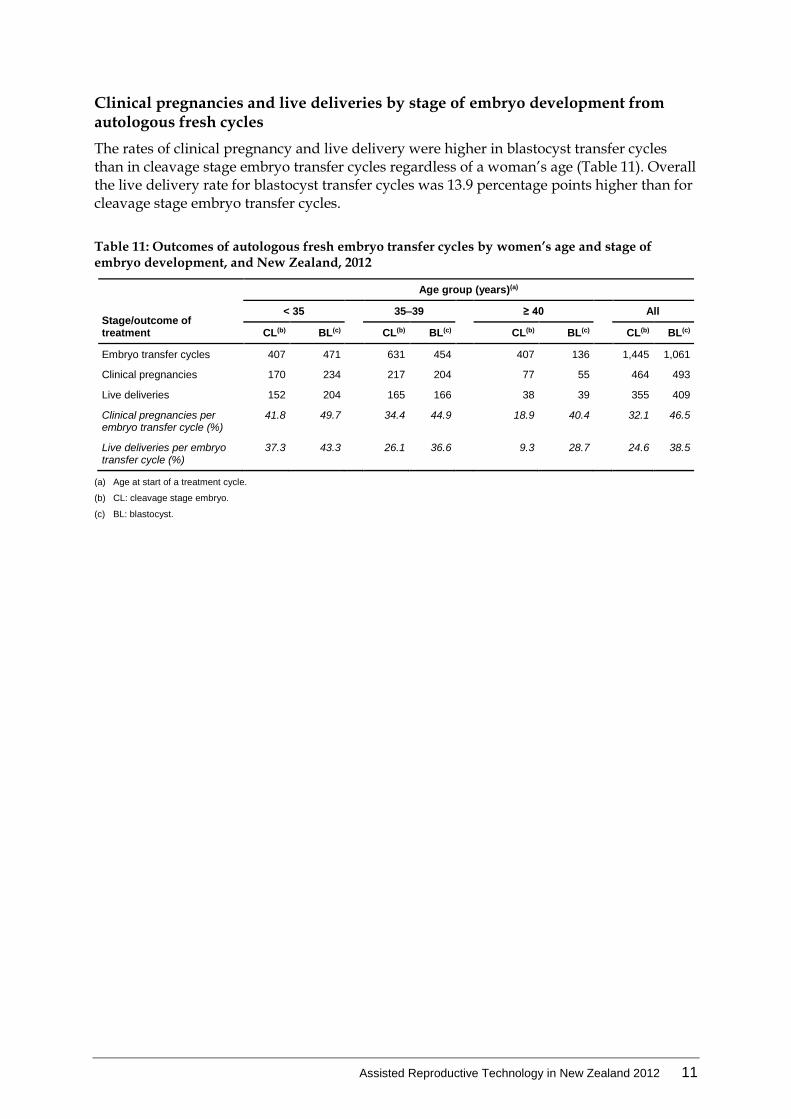
Clinical pregnancies and live deliveries by stage of embryo development from autologous fresh cycles
The rates of clinical pregnancy and live delivery were higher in blastocyst transfer cycles than in cleavage stage embryo transfer cycles regardless of a woman’s age (Table 11). Overall the live delivery rate for blastocyst transfer cycles was 13.9 percentage points higher than for cleavage stage embryo transfer cycles.
Table 11: Outcomes of autologous fresh embryo transfer cycles by women’s age and stage of embryo development, and New Zealand, 2012
Stage/outcome of treatment
Age group (years)(a)
< 35 35–39 ≥ 40 All
CL(b) BL(c) CL(b) BL(c) CL(b) BL(c) CL(b) BL(c)
Embryo transfer cycles 407 471 631 454 407 136 1,445 1,061
Clinical pregnancies 170 234 217 204 77 55 464 493
Live deliveries 152 204 165 166 38 39 355 409
Clinical pregnancies per embryo transfer cycle (%)
41.8 49.7 34.4 44.9 18.9 40.4 32.1 46.5
Live deliveries per embryo transfer cycle (%)
37.3 43.3 26.1 36.6 9.3 28.7 24.6 38.5
(a) Age at start of a treatment cycle.
(b) CL: cleavage stage embryo.
(c) BL: blastocyst.
12 Assisted Reproductive Technology in New Zealand 2012
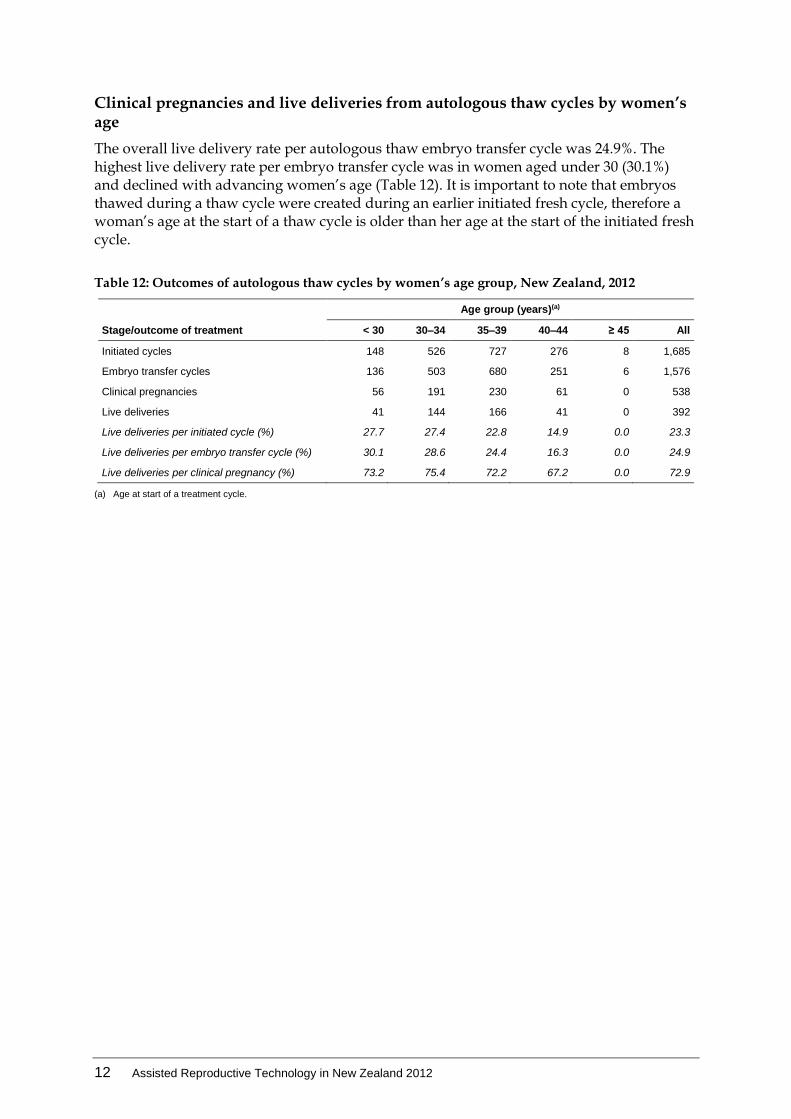
Clinical pregnancies and live deliveries from autologous thaw cycles by women’s age
The overall live delivery rate per autologous thaw embryo transfer cycle was 24.9%. The highest live delivery rate per embryo transfer cycle was in women aged under 30 (30.1%) and declined with advancing women’s age (Table 12). It is important to note that embryos thawed during a thaw cycle were created during an earlier initiated fresh cycle, therefore a woman’s age at the start of a thaw cycle is older than her age at the start of the initiated fresh cycle.
Table 12: Outcomes of autologous thaw cycles by women’s age group, New Zealand, 2012
Stage/outcome of treatment
Age group (years)(a)
< 30 30–34 35–39 40–44 ≥ 45 All
Initiated cycles 148 526 727 276 8 1,685
Embryo transfer cycles 136 503 680 251 6 1,576
Clinical pregnancies 56 191 230 61 0 538
Live deliveries 41 144 166 41 0 392
Live deliveries per initiated cycle (%) 27.7 27.4 22.8 14.9 0.0 23.3
Live deliveries per embryo transfer cycle (%) 30.1 28.6 24.4 16.3 0.0 24.9
Live deliveries per clinical pregnancy (%) 73.2 75.4 72.2 67.2 0.0 72.9
(a) Age at start of a treatment cycle.
Assisted Reproductive Technology in New Zealand 2012 13
Clinical pregnancies and live deliveries by number of embryos transferred from autologous thaw cycles
Overall, of the 1,576 frozen/thawed embryo transfer cycles, 91.1% were SET cycles, 8.8% were DET cycles and less than 0.1% transferred three embryos. The live delivery rate was higher for DET than for SET for women in each age group (Table 13).
Table 13: Outcomes of autologous thaw embryo transfer cycles by women’s age and number of embryos transferred, Australia and New Zealand, 2012
Stage/outcome of treatment
Age group (years)(a)
< 35 35–39 ≥ 40 All
SET(b) DET(c) SET(b) DET(c) SET(b) DET(c) SET(b) DET(c)
Embryo transfer cycles 601 38 628 51 207 50 1,436 139
Clinical pregnancies 233 14 209 20 41 20 483 54
Live deliveries 173 12 148 17 29 12 350 41
Clinical pregnancies per embryo transfer cycle (%)
38.8 36.8 33.3 39.2 19.8 40.0 33.6 38.8
Live deliveries per embryo transfer cycle (%)
28.8 31.6 23.6 33.3 14.0 24.0 24.4 29.5
(a) Age at start of a treatment cycle.
(b) SET: single embryo transfer.
(c) DET: double embryo transfer.
Note: Of embryo transfer cycles in women age 35-39, one cycle involved the transfer of three or more embryos resulting in a clinical pregnancy and live delivery.
14 Assisted Reproductive Technology in New Zealand 2012
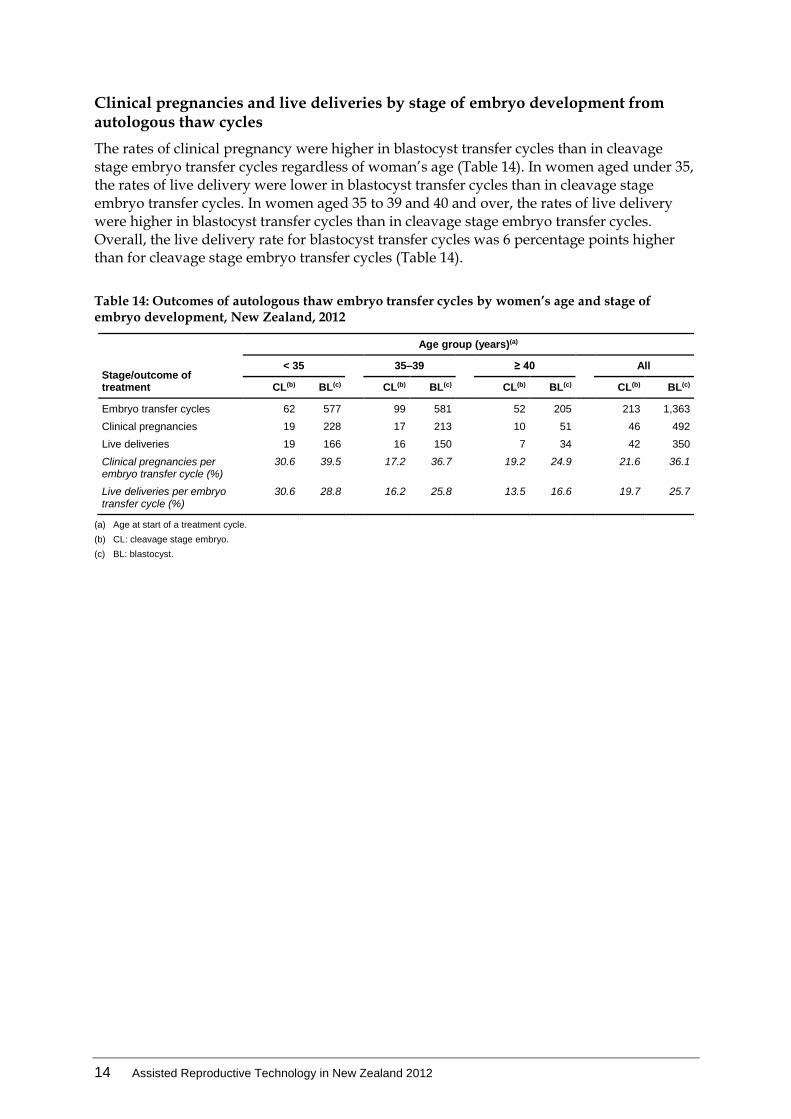
Clinical pregnancies and live deliveries by stage of embryo development from autologous thaw cycles
The rates of clinical pregnancy were higher in blastocyst transfer cycles than in cleavage stage embryo transfer cycles regardless of woman’s age (Table 14). In women aged under 35, the rates of live delivery were lower in blastocyst transfer cycles than in cleavage stage embryo transfer cycles. In women aged 35 to 39 and 40 and over, the rates of live delivery were higher in blastocyst transfer cycles than in cleavage stage embryo transfer cycles. Overall, the live delivery rate for blastocyst transfer cycles was 6 percentage points higher than for cleavage stage embryo transfer cycles (Table 14).
Table 14: Outcomes of autologous thaw embryo transfer cycles by women’s age and stage of embryo development, New Zealand, 2012
Stage/outcome of treatment
Age group (years)(a)
< 35 35–39 ≥ 40 All
CL(b) BL(c) CL(b) BL(c) CL(b) BL(c) CL(b) BL(c)
Embryo transfer cycles 62 577 99 581 52 205 213 1,363
Clinical pregnancies 19 228 17 213 10 51 46 492
Live deliveries 19 166 16 150 7 34 42 350
Clinical pregnancies per embryo transfer cycle (%)
30.6 39.5 17.2 36.7 19.2 24.9 21.6 36.1
Live deliveries per embryo transfer cycle (%)
30.6 28.8 16.2 25.8 13.5 16.6 19.7 25.7
(a) Age at start of a treatment cycle.
(b) CL: cleavage stage embryo.
(c) BL: blastocyst.
Assisted Reproductive Technology in New Zealand 2012 15
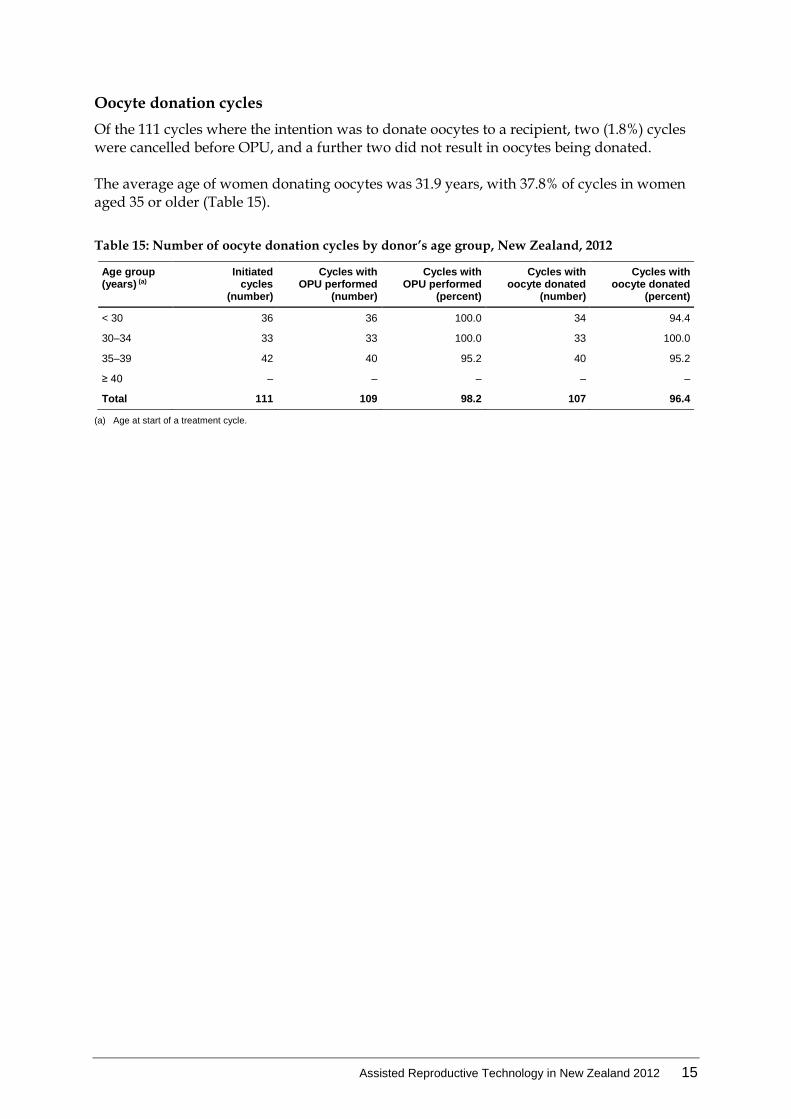
Oocyte donation cycles
Of the 111 cycles where the intention was to donate oocytes to a recipient, two (1.8%) cycles were cancelled before OPU, and a further two did not result in oocytes being donated. The average age of women donating oocytes was 31.9 years, with 37.8% of cycles in women aged 35 or older (Table 15).
Table 15: Number of oocyte donation cycles by donor’s age group, New Zealand, 2012
Age group (years) (a)
Initiated cycles
(number)
Cycles with OPU performed
(number)
Cycles with OPU performed
(percent)
Cycles with oocyte donated
(number)
Cycles with oocyte donated
(percent)
< 30 36 36 100.0 34 94.4
30–34 33 33 100.0 33 100.0
35–39 42 40 95.2 40 95.2
≥ 40 – – – – –
Total 111 109 98.2 107 96.4
(a) Age at start of a treatment cycle.
16 Assisted Reproductive Technology in New Zealand 2012
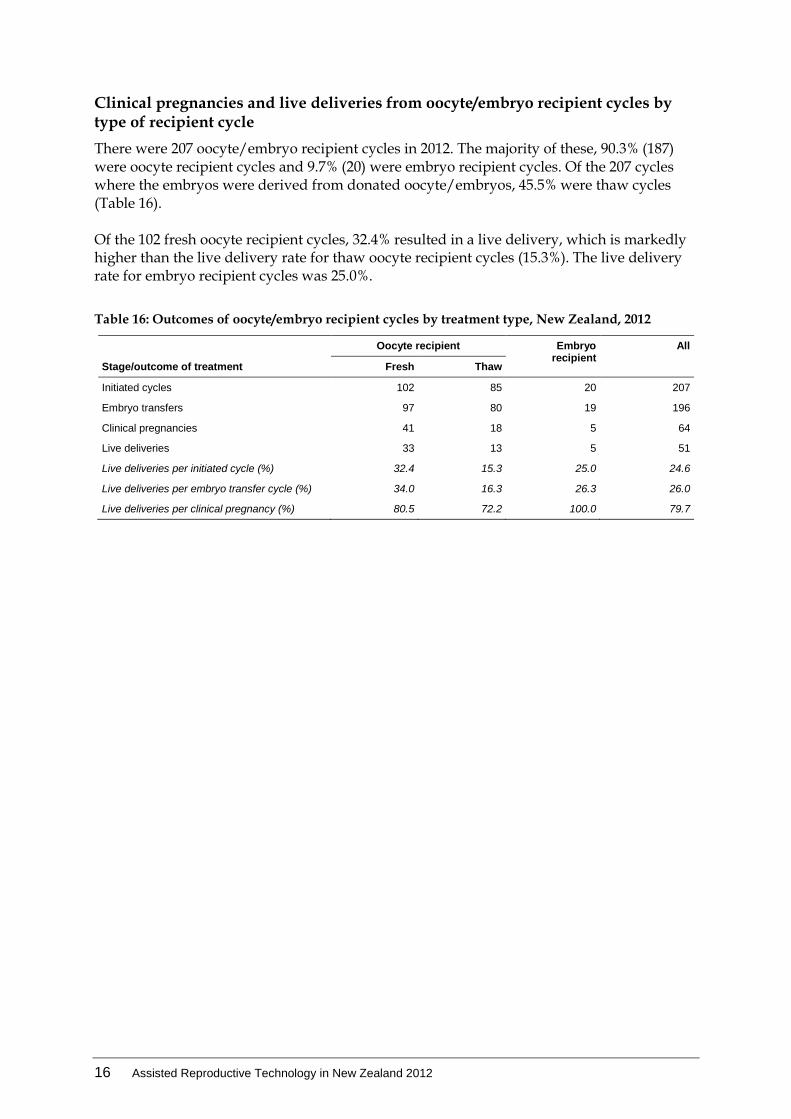
Clinical pregnancies and live deliveries from oocyte/embryo recipient cycles by type of recipient cycle
There were 207 oocyte/embryo recipient cycles in 2012. The majority of these, 90.3% (187) were oocyte recipient cycles and 9.7% (20) were embryo recipient cycles. Of the 207 cycles where the embryos were derived from donated oocyte/embryos, 45.5% were thaw cycles (Table 16). Of the 102 fresh oocyte recipient cycles, 32.4% resulted in a live delivery, which is markedly higher than the live delivery rate for thaw oocyte recipient cycles (15.3%). The live delivery rate for embryo recipient cycles was 25.0%.
Table 16: Outcomes of oocyte/embryo recipient cycles by treatment type, New Zealand, 2012
Stage/outcome of treatment
Oocyte recipient Embryo recipient
All
Fresh Thaw
Initiated cycles 102 85 20 207
Embryo transfers 97 80 19 196
Clinical pregnancies 41 18 5 64
Live deliveries 33 13 5 51
Live deliveries per initiated cycle (%) 32.4 15.3 25.0 24.6
Live deliveries per embryo transfer cycle (%) 34.0 16.3 26.3 26.0
Live deliveries per clinical pregnancy (%) 80.5 72.2 100.0 79.7
Assisted Reproductive Technology in New Zealand 2012 17
Clinical pregnancies and live deliveries from oocyte/embryo recipient cycles by recipient’s age
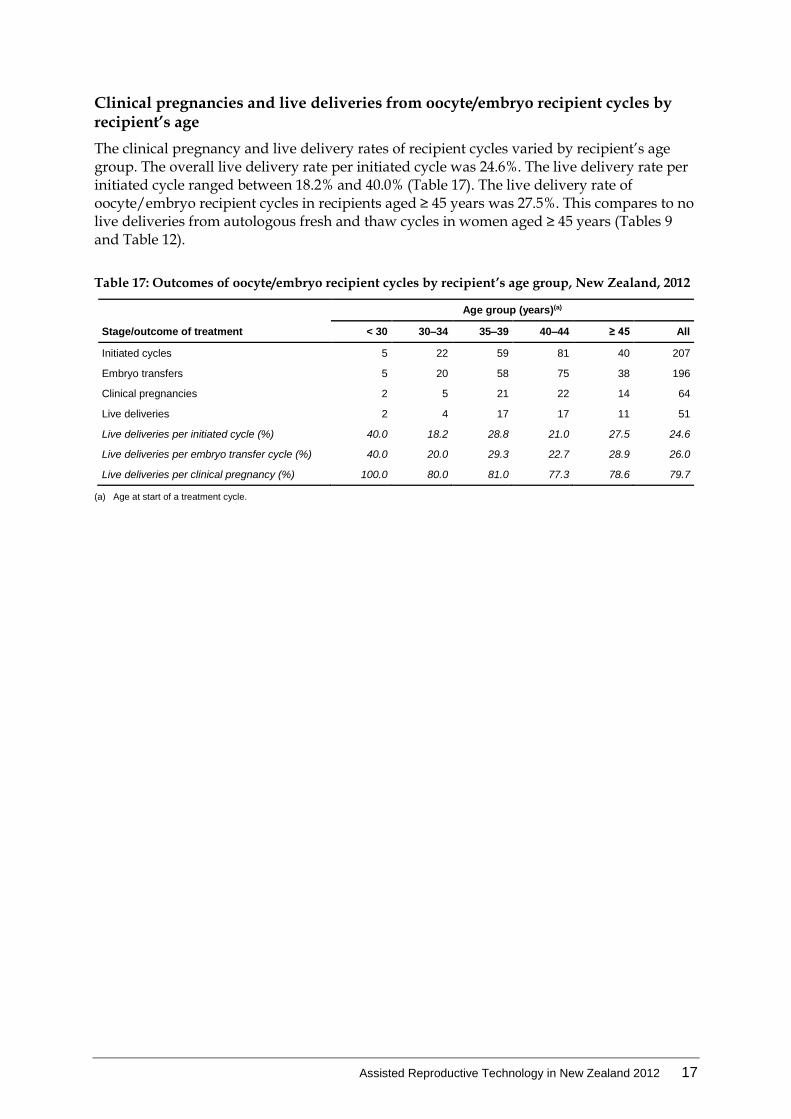
The clinical pregnancy and live delivery rates of recipient cycles varied by recipient’s age group. The overall live delivery rate per initiated cycle was 24.6%. The live delivery rate per initiated cycle ranged between 18.2% and 40.0% (Table 17). The live delivery rate of oocyte/embryo recipient cycles in recipients aged ≥ 45 years was 27.5%. This compares to no live deliveries from autologous fresh and thaw cycles in women aged ≥ 45 years (Tables 9 and Table 12).
Table 17: Outcomes of oocyte/embryo recipient cycles by recipient’s age group, New Zealand, 2012
Age group (years)(a)
Stage/outcome of treatment < 30 30–34 35–39 40–44 ≥ 45 All
Initiated cycles 5 22 59 81 40 207
Embryo transfers 5 20 58 75 38 196
Clinical pregnancies 2 5 21 22 14 64
Live deliveries 2 4 17 17 11 51
Live deliveries per initiated cycle (%) 40.0 18.2 28.8 21.0 27.5 24.6
Live deliveries per embryo transfer cycle (%) 40.0 20.0 29.3 22.7 28.9 26.0
Live deliveries per clinical pregnancy (%) 100.0 80.0 81.0 77.3 78.6 79.7
(a) Age at start of a treatment cycle.

18 Assisted Reproductive Technology in New Zealand 2012
Clinical pregnancies and live deliveries from oocyte/embryo recipient cycles by donor’s age
The live delivery rates were higher for recipient cycles where donors were in their 20s than in older age groups. The overall live delivery rate per embryo transfer cycle was 26.0%. This rate was 38.6% in donors aged less than 30 years and decreased with advancing donor age (Table 18).
Table 18: Outcomes of oocyte/embryo recipient cycles by donor’s age group, New Zealand, 2012
Stage/outcome of treatment
Donor age group (years)(a)
< 25 25–29 30–34 35–39 ≥ 40 All(b)
Initiated cycles 13 46 67 77 1 207
Embryo transfer cycles 12 45 63 72 1 196
Clinical pregnancies 5 18 24 17 0 64
Live deliveries 5 17 19 10 0 51
Live deliveries per initiated cycle (%) 38.5 37.0 28.4 13.0 0.0 24.6
Live deliveries per embryo transfer cycle (%) 41.7 37.8 30.2 13.9 0.0 26.0
Live deliveries per clinical pregnancy (%) 100.0 94.4 79.2 58.8 0.0 79.7
(a) Age at start of treatment cycle.
(b) Includes cycles where donor’s age was not stated.
Assisted Reproductive Technology in New Zealand 2012 19
4 Pregnancy and birth outcomes following autologous and recipient cycles in 2012
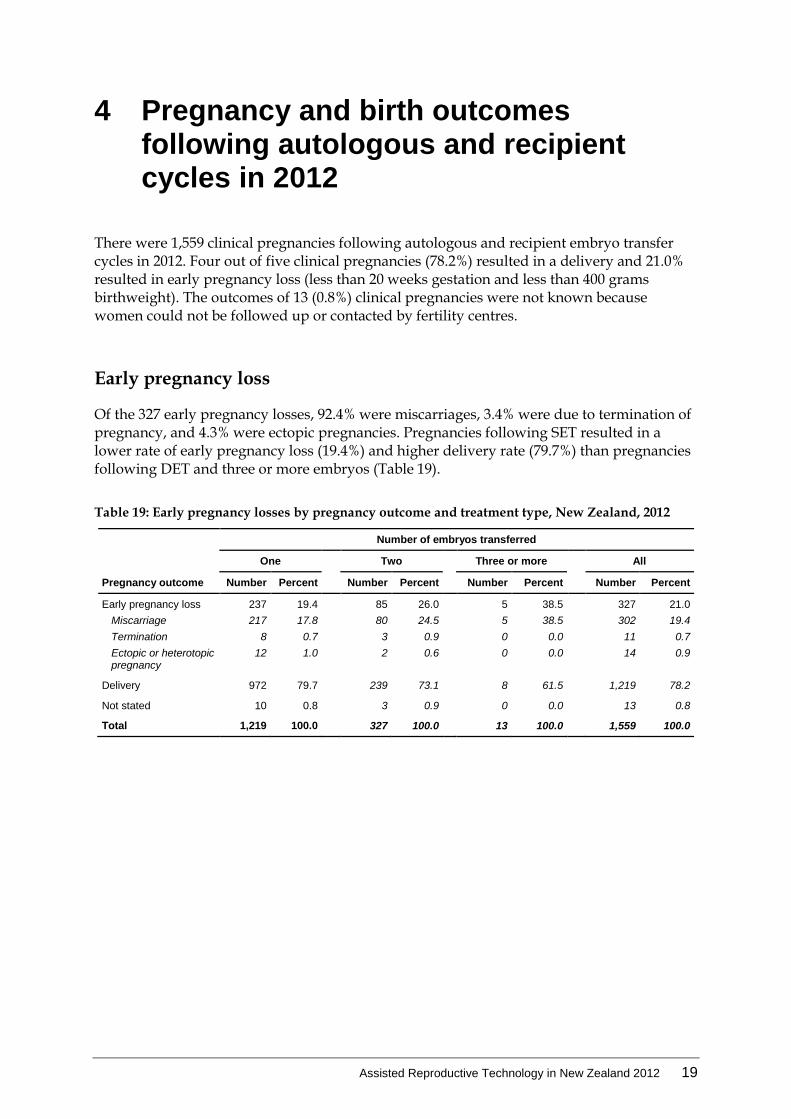
There were 1,559 clinical pregnancies following autologous and recipient embryo transfer cycles in 2012. Four out of five clinical pregnancies (78.2%) resulted in a delivery and 21.0% resulted in early pregnancy loss (less than 20 weeks gestation and less than 400 grams birthweight). The outcomes of 13 (0.8%) clinical pregnancies were not known because women could not be followed up or contacted by fertility centres.
Early pregnancy loss
Of the 327 early pregnancy losses, 92.4% were miscarriages, 3.4% were due to termination of pregnancy, and 4.3% were ectopic pregnancies. Pregnancies following SET resulted in a lower rate of early pregnancy loss (19.4%) and higher delivery rate (79.7%) than pregnancies following DET and three or more embryos (Table 19).
Table 19: Early pregnancy losses by pregnancy outcome and treatment type, New Zealand, 2012
Pregnancy outcome
Number of embryos transferred
One Two Three or more All
Number Percent Number Percent Number Percent Number Percent
Early pregnancy loss 237 19.4 85 26.0 5 38.5 327 21.0
Miscarriage 217 17.8 80 24.5 5 38.5 302 19.4
Termination 8 0.7 3 0.9 0 0.0 11 0.7
Ectopic or heterotopic pregnancy
12 1.0 2 0.6 0 0.0 14 0.9
Delivery 972 79.7 239 73.1 8 61.5 1,219 78.2
Not stated 10 0.8 3 0.9 0 0.0 13 0.8
Total 1,219 100.0 327 100.0 13 100.0 1,559 100.0
20 Assisted Reproductive Technology in New Zealand 2012
Deliveries by delivery outcomes and treatment type
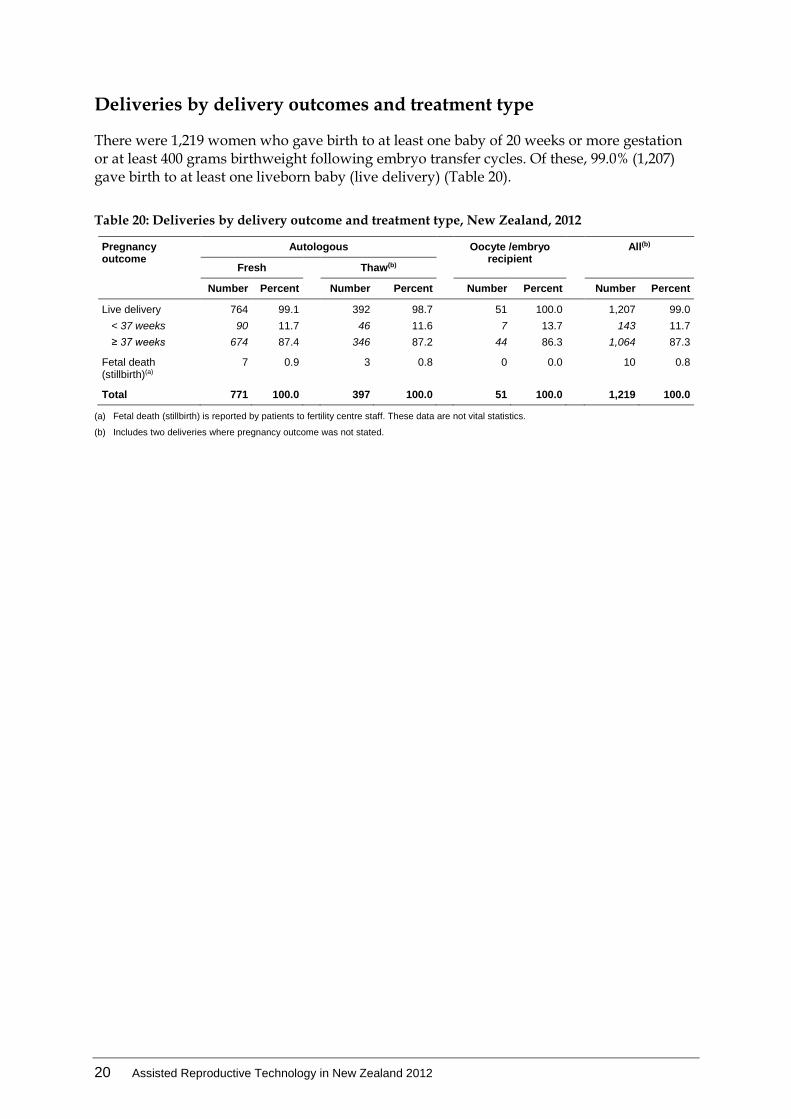
There were 1,219 women who gave birth to at least one baby of 20 weeks or more gestation or at least 400 grams birthweight following embryo transfer cycles. Of these, 99.0% (1,207) gave birth to at least one liveborn baby (live delivery) (Table 20).
Table 20: Deliveries by delivery outcome and treatment type, New Zealand, 2012
Pregnancy outcome
Autologous Oocyte /embryo recipient
All(b)
Fresh Thaw(b)
Number Percent Number Percent Number Percent Number Percent
Live delivery 764 99.1 392 98.7 51 100.0 1,207 99.0
< 37 weeks 90 11.7 46 11.6 7 13.7 143 11.7
≥ 37 weeks 674 87.4 346 87.2 44 86.3 1,064 87.3
Fetal death (stillbirth)(a)
7 0.9 3 0.8 0 0.0 10 0.8
Total 771 100.0 397 100.0 51 100.0 1,219 100.0
(a) Fetal death (stillbirth) is reported by patients to fertility centre staff. These data are not vital statistics.
(b) Includes two deliveries where pregnancy outcome was not stated.

Assisted Reproductive Technology in New Zealand 2012 21
Deliveries by maternal age
The average age of women at the time of delivery was 35.6 years. Of the 1,219 deliveries, 5.2% were multiple gestation deliveries. Women aged less than 35 years had the lowest proportion of multiple gestation deliveries (3.8%) (Table 21).
Table 21: Deliveries by gestation and maternal age group, New Zealand, 2012
Gestation
Age group (years)(a)
< 35 35–39 ≥ 40
One embryo
Two embryos
All(b) One embryo
Two embryos
All(b) One embryo
Two embryos
All(b)
Number
Singleton 436 23 459 395 96 492 124 75 205
Multiple 6 12 18 8 21 29 3 12 16
Twin 6 11 17 8 21 29 3 11 15
Higher order multiple 0 1 1 0 0 0 0 1 1
Total 442 35 477 403 117 521 127 87 221
Percent
Singleton 98.6 65.7 96.2 98.0 82.1 94.4 97.6 86.2 92.8
Multiple 1.4 34.3 3.8 2.0 17.9 5.6 2.4 13.8 7.2
Twin 1.4 31.4 3.6 2.0 17.9 5.6 2.4 12.6 6.8
Higher order multiple 0.0 2.9 0.2 0.0 0.0 0.0 0.0 1.1 0.5
Total 100.0 100.0 100.0 100.0 100.0 100.0 100.0 100.0 100.0
(a) Age at time of delivery.
(b) Includes three or more embryos.
22 Assisted Reproductive Technology in New Zealand 2012
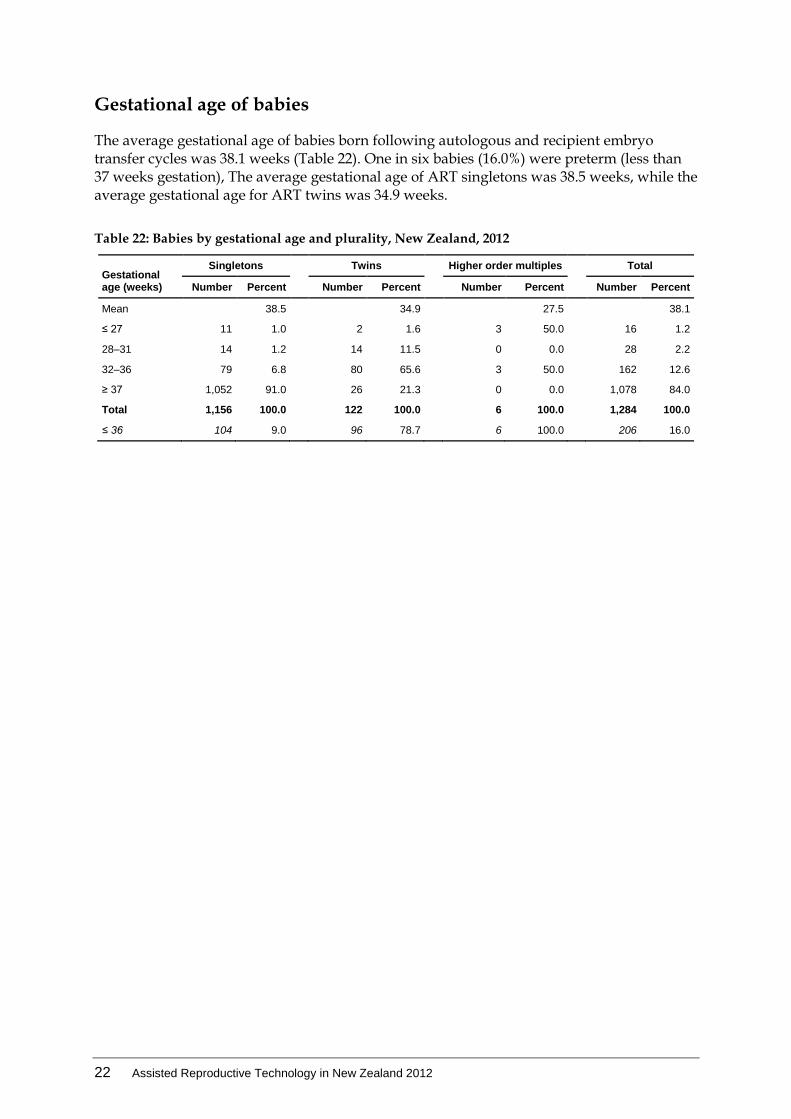
Gestational age of babies
The average gestational age of babies born following autologous and recipient embryo transfer cycles was 38.1 weeks (Table 22). One in six babies (16.0%) were preterm (less than 37 weeks gestation), The average gestational age of ART singletons was 38.5 weeks, while the average gestational age for ART twins was 34.9 weeks.
Table 22: Babies by gestational age and plurality, New Zealand, 2012
Gestational age (weeks)
Singletons Twins Higher order multiples Total
Number Percent Number Percent Number Percent Number Percent
Mean 38.5 34.9 27.5 38.1
≤ 27 11 1.0 2 1.6 3 50.0 16 1.2
28–31 14 1.2 14 11.5 0 0.0 28 2.2
32–36 79 6.8 80 65.6 3 50.0 162 12.6
≥ 37 1,052 91.0 26 21.3 0 0.0 1,078 84.0
Total 1,156 100.0 122 100.0 6 100.0 1,284 100.0
≤ 36 104 9.0 96 78.7 6 100.0 206 16.0

Assisted Reproductive Technology in New Zealand 2012 23
Birth outcomes
The average birthweight for liveborn babies to women who had autologous and recipient embryo transfer cycles was 3,305 grams. Of all liveborn babies, 11.4% were low birthweight (less than 2,500 grams) (Table 23). The average birthweight was 3,415 grams and 2,277 grams for liveborn ART singletons and twins respectively. Low birthweight was reported for 5.8% of liveborn singletons following SET, higher than the 5.2% of those following DET.
Table 23: Liveborn babies by birthweight group and plurality, New Zealand, 2012
Birthweight (g) Singletons Twins Higher order multiples
SET(a) DET(b) Total(c)
Number
< 1,000 4 0 1 0 5
1,000–1,499 4 1 8 0 13
1,500–1,999 12 4 26 2 44
2,000–2,499 35 5 41 1 83
2,500–2,999 122 28 31 0 182
3,000–3,499 337 62 10 0 411
3,500–3,999 276 64 1 0 344
≥ 4,000 149 27 0 0 176
Not stated 7 1 4 0 12
Total 946 192 122 3 1,270
< 2,500 55 10 76 3 145
Percent
< 1,000 0.4 0.0 0.8 0.0 0.4
1,000–1,499 0.4 0.5 6.6 0.0 1.0
1,500–1,999 1.3 2.1 21.3 66.7 3.5
2,000–2,499 3.7 2.6 33.6 33.3 6.5
2,500–2,999 12.9 14.6 25.4 0.0 14.3
3,000–3,499 35.6 32.3 8.2 0.0 32.4
3,500–3,999 29.2 33.3 0.8 0.0 27.1
≥ 4,000 15.8 14.1 0.0 0.0 13.9
Not stated 0.7 0.5 3.3 0.0 0.9
Total 100.0 100.0 100.0 100.0 100.0
< 2,500 5.8 5.2 62.3 100.0 11.4
(a) SET: single embryo transfer.
(b) DET: double embryo transfer.
(c) Included singletons following transfer of three or more embryos.
24 Assisted Reproductive Technology in New Zealand 2012
5 Preimplantation genetic diagnosis in 2012
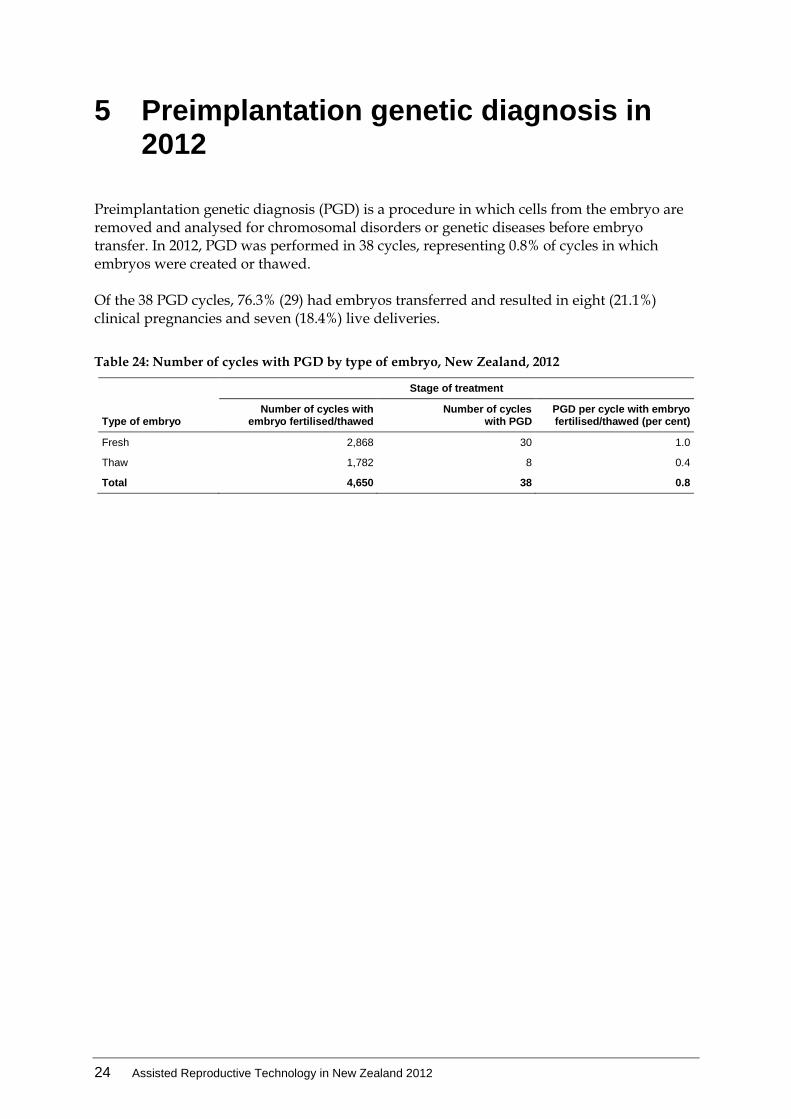
Preimplantation genetic diagnosis (PGD) is a procedure in which cells from the embryo are removed and analysed for chromosomal disorders or genetic diseases before embryo transfer. In 2012, PGD was performed in 38 cycles, representing 0.8% of cycles in which embryos were created or thawed. Of the 38 PGD cycles, 76.3% (29) had embryos transferred and resulted in eight (21.1%) clinical pregnancies and seven (18.4%) live deliveries.
Table 24: Number of cycles with PGD by type of embryo, New Zealand, 2012
Stage of treatment
Type of embryo Number of cycles with
embryo fertilised/thawed Number of cycles
with PGD PGD per cycle with embryo fertilised/thawed (per cent)
Fresh 2,868 30 1.0
Thaw 1,782 8 0.4
Total 4,650 38 0.8

Assisted Reproductive Technology in New Zealand 2012 25
6 Donor insemination cycles in 2012
In 2012, there were 390 donor insemination (DI) cycles reported from clinics in New Zealand. The average age of women who had a DI cycle was 35.9 years. The overall live delivery rate per DI cycle was 16.2%. The live delivery rate for women aged less than 30 years was 24.2% and decreased steadily with advancing women’s age.
Table 25: Outcomes of DI cycles by women’s age group, New Zealand, 2012
Stage/outcome of treatment
Age group (years)(a)
< 30 30–34 35–39 ≥ 40 Total
DI cycles 33 97 195 65 390
Clinical pregnancies 10 22 41 6 79
Live deliveries 8 18 31 6 63
Clinical pregnancies per DI cycle (%) 30.3 22.7 21.0 9.2 20.3
Live deliveries per DI cycle (%) 24.2 18.6 15.9 9.2 16.2
Live deliveries per clinical pregnancy (%) 80.0 81.8 75.6 100.0 79.7
(a) Age at start of treatment cycle.
Clinical pregnancies following DI cycles
Of the 79 clinical pregnancies following DI cycles, 79.7% resulted in a delivery, 20.3% ended in early pregnancy loss (including 19.0% miscarriages and 1.3% ectopic pregnancy). Of the 63 deliveries, 58 (92.1%) were singleton deliveries and 5 (7.9%) were twin deliveries.
Perinatal outcomes of babies
There were 68 babies born to women who had DI treatment and all were liveborn. Of these babies, 7 (10.3%) were born preterm (less than 37 weeks gestation). The mean birthweight of babies following DI treatment was 3,382 grams. Four liveborn babies (5.9%) were born with low birthweight (less than 2,500 grams).
26 Assisted Reproductive Technology in New Zealand 2012
7 Cumulative success rates for women undertaking autologous treatment 2009–2012
This section presents information on all women who started their first autologous fresh ART treatment cycle between 1 January 2009 and 31 December 2009. Women were followed from the start of their first autologous fresh cycle through subsequent fresh and thaw cycles until 31 December 2012 or until they achieved a live delivery (a delivery of at least one liveborn baby) up to and including 31 October 2013. This longitudinal perspective provides a measure of the outcomes of successive ART treatment cycles undertaken by the same woman up to her first birth following ART treatment. These women might have had additional treatment cycles after 2012 and their treatment information and resulting outcomes will be captured in subsequent annual reports. Therefore, in this dynamic cohort of women undergoing their first autologous fresh ART treatment between 1 January 2009 and 31 December 2009, the cumulative success rates may increase over time as more women return for treatment at a later date. ART treatment cycles presented in Tables 26 to 31 include all initiated autologous fresh and thaw cycles. Cycles which were cancelled at any stage and did not proceed to oocyte collection or embryo transfer are included. The following types of cycles were out of scope and were not included in Tables 26 to 31: donor sperm insemination cycles, oocyte/embryo recipient cycles, oocyte/embryo donation cycles, surrogacy arrangement cycles and gamete intrafallopian transfer cycles. A pregnancy that ended before 20 weeks or stillbirth (fetal death) are not counted as a live delivery. Table 26 presents the number of cycles by women’s age group. Tables 27 to 31 present cycle-specific live delivery rates, non-progression rates and cumulative live delivery rates for all age groups and women aged < 30, 30–34, 35–39 and ≥ 40. Only the first five cycles are presented due to the small number of women undertaking six or more treatment cycles between 1 January 2009 and 31 December 2012 (cycles subsequent to the first cycle can be fresh or thaw cycle).
Definition
Cycle-specific live delivery rate for a specific cycle number is calculated as the number of live deliveries resulting from a specific cycle number divided by the number of women who undertook that cycle number. For example, the cycle specific rate of 21.0% for cycle number 3 measures the proportion of women who undertook a third cycle and achieved a live delivery in that cycle (Table 27).
Non-progression rate for a specific cycle is calculated as the number of women who did not return for further ART treatment cycles before 31 December 2012 divided by the number of women who did not have a live delivery in that cycle. For example, the non-progression rate of 25.8% for cycle number 3 measures the proportion of women who did not achieve a live delivery in cycle number 3, and did not progress to a fourth cycle

Assisted Reproductive Technology in New Zealand 2012 27
(Table 27). Reasons why a woman/couple did not progress for further treatment, such as poor prognosis, natural pregnancy, migration, financial, psychological and other unrelated reasons are not collected by ANZARD.
Cumulative live delivery rate for a specific cycle is calculated as the total number of live deliveries following this cycle and all previous cycles divided by the total number of women who started their first autologous fresh ART treatment cycle between 1 January 2009 and 31 December 2009. For example, the cumulative live delivery rate of 41.4% for cycle number 3 measures the proportion of women who started ART treatment in 2009 and achieved a live delivery following their first three cycles (Table 27).
Note, only the first birth to a woman following ART is counted in cumulative live birth rates.
Table 26: Number of cycles by women’s age group for all women who started their first autologous fresh cycle between 1 January 2009 and 31 December 2009, New Zealand(a)
Cycle number(b)
Age group years(a)
< 30 30–34 35–39 40–44 All
Number
1 94 190 290 168 742
2 34 86 161 54 335
3 21 49 88 36 194
4 14 27 37 17 95
≥ 5 14 41 61 10 126
Total 177 393 637 285 1,492
Percent
1 53.1 48.3 45.5 58.9 49.7
2 19.2 21.9 25.3 18.9 22.5
3 11.9 12.5 13.8 12.6 13.0
4 7.9 6.9 5.8 6.0 6.4
≥ 5 7.9 10.4 9.6 3.5 8.4
Total 100.0 100.0 100.0 100.0 100.0
(a) Age at start of first autologous fresh ART treatment cycle.
(b) Women who started their first autologous fresh ART treatment cycle between 1 January 2009 and 31 December 2009 and were followed through subsequent fresh and thaw cycles until 31 December 2012 or delivery of a liveborn baby up to and including 31 October 2013.
Note: Totals and subtotals may not equal 100.0 due to rounding. Data should be interpreted with caution due to small numbers in certain cells.

28 Assisted Reproductive Technology in New Zealand 2012
Table 27: Cycle-specific and cumulative live delivery rates for all women who started their first autologous fresh cycle between 1 January 2009 and 31 December 2009, New Zealand
Cycle number
Number of women starting
cycle(a)
Number of women who
had a live delivery(b)
Cycle-specific live delivery
rate (%)(c)
Number of women who did not progress to next treatment
Non-progression
rate (%)(d)
Cumulative live delivery rate
(%)(a)(e)
1 1,492 385 25.8 357 32.2 25.8
2 750 146 19.5 189 31.3 35.6
3 415 87 21.0 107 32.6 41.4
4 221 36 16.3 59 31.9 43.8
≥ 5 126 30 23.8 34 35.4 45.8
(a) Women who started their first autologous fresh ART treatment cycle between 1 January 2009 and 31 December 2009 and were followed through subsequent fresh and thaw cycles until 31 December 2012 or delivery of a liveborn baby up to and including 31 October 2013.
(b) A live delivery is the delivery of one or more liveborn infants, with the birth of twins or higher order multiples counted as one live delivery.
(c) The cycle-specific live delivery rate is calculated as the number of live deliveries resulting from a specific ‘cycle number’ divided by the number of women who undertook that same ‘cycle number’.
(d) The non-progression rate for a specific ‘cycle number’ is calculated as the number of women who did not return for further ART treatment cycles before 31 December 2012 divided by the number of women who did not have a live delivery in that ‘cycle number’.
(e) The cumulative live delivery rate for a specific ‘cycle number’ is calculated as the total number of live deliveries following this ‘cycle number’ and all previous cycles divided by the total number of women who started their first autologous fresh ART treatment cycle between 1 January 2009 and 31 December 2009.
Note: Further treatment cycles after the fifth cycle and resulting live deliveries are not presented in this table due to small numbers. Data should be interpreted with caution due to small numbers in certain cells and measure of statistical variance are not supplied.
Table 28: Cycle-specific and cumulative live delivery rates for women aged less than 30 years who started their first autologous fresh cycle between 1 January 2009 and 31 December 2009, New Zealand
Cycle number
Number of women starting cycle(a)
Number of women who
had a live delivery(b)
Cycle-specific live delivery
rate (%)(c)
Number of women who did not progress to next treatment
Non-progression
rate (%)(d)
Cumulative live delivery
rate (%)(a)(e)
1 177 57 32.2 37 30.8 32.2
2 83 11 13.3 23 31.9 38.4
3 49 13 26.5 8 22.2 45.8
4 28 6 21.4 8 36.4 49.2
5 14 4 28.6 3 30.0 51.4
(a) Women who started their first autologous fresh ART treatment cycle between 1 January 2009 and 31 December 2009 and were followed through subsequent fresh and thaw cycles until 31 December 2012 or delivery of a liveborn baby up to and including 31 October 2013.
(b) A live delivery is the delivery of one or more liveborn infants, with the birth of twins or higher order multiples counted as one live delivery.
(c) The cycle-specific live delivery rate is calculated as the number of live deliveries resulting from a specific ‘cycle number’ divided by the
number of women who undertook that same ‘cycle number’.
(d) The non-progression rate for a specific ‘cycle number’ is calculated as the number of women who did not return for further ART treatment cycles before 31 December 2012 divided by the number of women who did not have a live delivery in that ‘cycle number’.
(e) The cumulative live delivery rate for a specific ‘cycle number’ is calculated as the total number of live deliveries following this ‘cycle number’ and all previous cycles divided by the total number of women who started their first autologous fresh ART treatment cycle between 1 January 2009 and 31 December 2009.
Note: Further treatment cycles after the fifth cycle and resulting live deliveries are not presented in this table due to small numbers. Data should be interpreted with caution due to small numbers in certain cells and measure of statistical variance are not supplied.

Assisted Reproductive Technology in New Zealand 2012 29
Table 29: Cycle-specific and cumulative live delivery rates for women aged 30–34 years who started their first autologous fresh cycle between 1 January 2009 and 31 December 2009, New Zealand
Cycle number
Number of women starting cycle(a)
Number of women who
had a live delivery(b)
Cycle-specific live delivery
rate (%)(c)
Number of women who did not progress to next treatment
Non-progression
rate (%)(d)
Cumulative live delivery
rate (%)(a)(e)
1 393 127 32.3 63 23.7 32.3
2 203 51 25.1 35 23.0 45.3
3 117 26 22.2 23 25.3 51.9
4 68 14 20.6 13 24.1 55.5
5 41 12 29.3 9 31.0 58.5
(a) Women who started their first autologous fresh ART treatment cycle between 1 January 2009 and 31 December 2009 and were followed through subsequent fresh and thaw cycles until 31 December 2012 or delivery of a liveborn baby up to and including 31 October 2013.
(b) A live delivery is the delivery of one or more liveborn infants, with the birth of twins or higher order multiples counted as one live delivery.
(c) The cycle-specific live delivery rate is calculated as the number of live deliveries resulting from a specific ‘cycle number’ divided by the number of women who undertook that same ‘cycle number’.
(d) The non-progression rate for a specific ‘cycle number’ is calculated as the number of women who did not return for further ART treatment cycles before 31 December 2012 divided by the number of women who did not have a live delivery in that ‘cycle number’.
(e) The cumulative live delivery rate for a specific ‘cycle number’ is calculated as the total number of live deliveries following this ‘cycle number’ and all previous cycles divided by the total number of women who started their first autologous fresh ART treatment cycle between 1 January 2009 and 31 December 2009.
Note: Further treatment cycles after the fifth cycle and resulting live deliveries are not presented in this table due to small numbers. Data should be interpreted with caution due to small numbers in certain cells and measure of statistical variance are not supplied.
Table 30: Cycle-specific and cumulative live delivery rates for women aged 35–39 years who started their first autologous fresh cycle between 1 January 2009 and 31 December 2009, New Zealand
Cycle number
Number of women starting cycle(a)
Number of women who
had a live delivery(b)
Cycle-specific live delivery
rate (%)(c)
Number of women who did not progress to next treatment
Non-progression
rate (%)(d)
Cumulative live delivery
rate (%)(a)(e)
1 637 161 25.3 129 27.1 25.3
2 347 71 20.5 90 32.6 36.4
3 186 42 22.6 46 31.9 43.0
4 98 14 14.3 23 27.4 45.2
5 61 12 19.7 20 40.8 47.1
(a) Women who started their first autologous fresh ART treatment cycle between 1 January 2009 and 31 December 2009 and were followed through subsequent fresh and thaw cycles until 31 December 2012 or delivery of a liveborn baby up to and including 31 October 2013.
(b) A live delivery is the delivery of one or more liveborn infants, with the birth of twins or higher order multiples counted as one live delivery.
(c) The cycle-specific live delivery rate is calculated as the number of live deliveries resulting from a specific ‘cycle number’ divided by the number of women who undertook that same ‘cycle number’.
(d) The non-progression rate for a specific ‘cycle number’ is calculated as the number of women who did not return for further ART treatment cycles before 31 December 2012 divided by the number of women who did not have a live delivery in that ‘cycle number’.
(e) The cumulative live delivery rate for a specific ‘cycle number’ is calculated as the total number of live deliveries following this ‘cycle number’ and all previous cycles divided by the total number of women who started their first autologous fresh ART treatment cycle between 1 January 2009 and 31 December 2009.
Note: Further treatment cycles after the fifth cycle and resulting live deliveries are not presented in this table due to small numbers. Data should be interpreted with caution due to small numbers in certain cells and measure of statistical variance are not supplied.
30 Assisted Reproductive Technology in New Zealand 2012
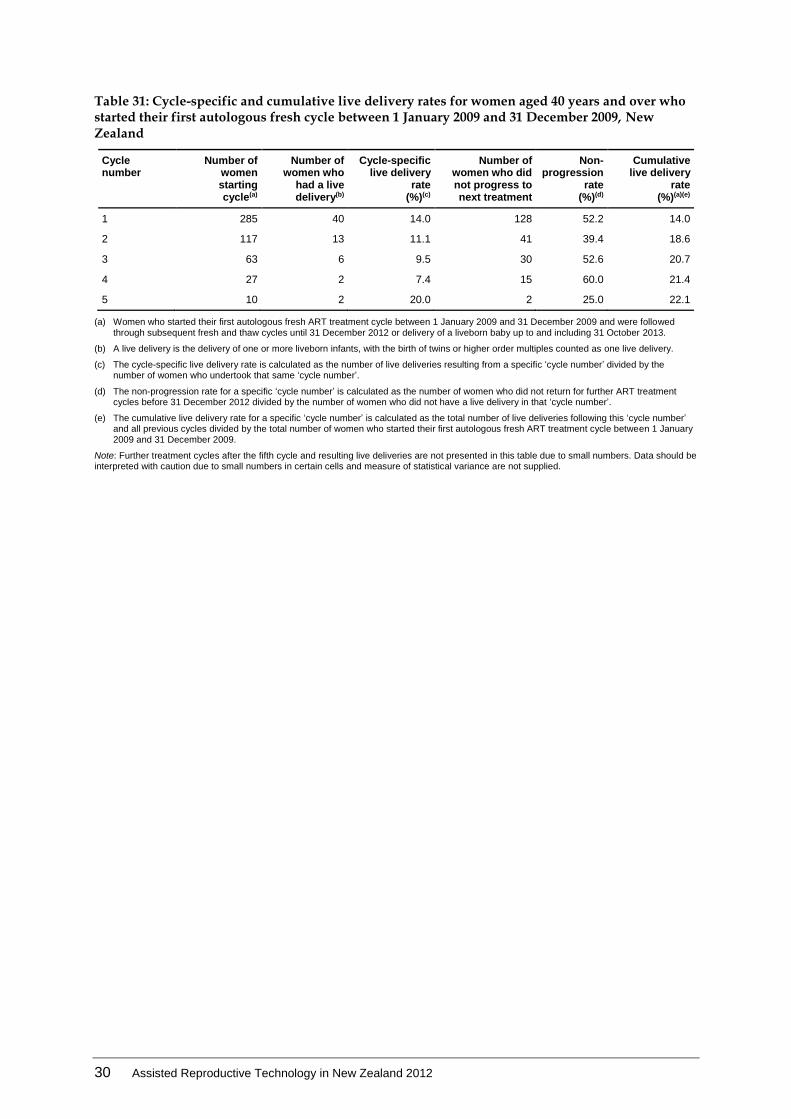
Table 31: Cycle-specific and cumulative live delivery rates for women aged 40 years and over who started their first autologous fresh cycle between 1 January 2009 and 31 December 2009, New Zealand
Cycle number
Number of women starting cycle(a)
Number of women who
had a live delivery(b)
Cycle-specific live delivery
rate (%)(c)
Number of women who did not progress to next treatment
Non-progression
rate (%)(d)
Cumulative live delivery
rate (%)(a)(e)
1 285 40 14.0 128 52.2 14.0
2 117 13 11.1 41 39.4 18.6
3 63 6 9.5 30 52.6 20.7
4 27 2 7.4 15 60.0 21.4
5 10 2 20.0 2 25.0 22.1
(a) Women who started their first autologous fresh ART treatment cycle between 1 January 2009 and 31 December 2009 and were followed through subsequent fresh and thaw cycles until 31 December 2012 or delivery of a liveborn baby up to and including 31 October 2013.
(b) A live delivery is the delivery of one or more liveborn infants, with the birth of twins or higher order multiples counted as one live delivery.
(c) The cycle-specific live delivery rate is calculated as the number of live deliveries resulting from a specific ‘cycle number’ divided by the number of women who undertook that same ‘cycle number’.
(d) The non-progression rate for a specific ‘cycle number’ is calculated as the number of women who did not return for further ART treatment cycles before 31 December 2012 divided by the number of women who did not have a live delivery in that ‘cycle number’.
(e) The cumulative live delivery rate for a specific ‘cycle number’ is calculated as the total number of live deliveries following this ‘cycle number’ and all previous cycles divided by the total number of women who started their first autologous fresh ART treatment cycle between 1 January 2009 and 31 December 2009.
Note: Further treatment cycles after the fifth cycle and resulting live deliveries are not presented in this table due to small numbers. Data should be interpreted with caution due to small numbers in certain cells and measure of statistical variance are not supplied.

Assisted Reproductive Technology in New Zealand 2012 31
Appendix A: Contributing fertility clinics
Fertility Associates, Auckland (Dr Mary Birdsall)
Fertility Associates Christchurch, Christchurch (Dr Greg Phillipson)
Fertility Associates Hamilton, Hamilton (Dr VP Singh)
Fertility Associates Wellington, Wellington (Dr Andrew Murray)
Fertility Plus, Auckland (Dr Barry Lowe)
Repromed Auckland, Auckland (Dr Guy Gudex)
The Otago Fertility Services, Dunedin (Associate Professor Wayne Gillett)

32 Assisted Reproductive Technology in New Zealand 2012
Appendix B: Data used in this report
The data presented in this report are supplied by 7 fertility centres in New Zealand and are compiled into ANZARD2.0. ANZARD2.0 includes autologous treatment cycles, treatment involving donated oocytes or embryos and treatment involving surrogacy arrangements. ANZARD2.0 collects data on the use of ART techniques such as ICSI, oocyte/embryo freezing methods, PGD and cleavage/blastocyst transfers. In addition to ART procedures, ANZARD2.0 also collects data from fertility centres about artificial insemination cycles using donated sperm. The outcomes of pregnancies, deliveries and babies born following ART and DI treatments are also maintained in ANZARD2.0. This includes the method of birth, birth status, birthweight, gestational age, plurality, perinatal mortality and selected information on maternal morbidity. This report presents information on ART and DI treatment cycles that took place in fertility clinics in New Zealand in 2012, and the resulting pregnancies and births. The babies included in this report were conceived through treatment cycles undertaken in 2012, and were born in either 2012 or 2013.
Data validation
Most fertility centres have computerised data information management systems and are able to provide the National Perinatal Epidemiology and Statistics Unit (NPESU) with high quality data. All data processed by NPESU undergo a validation process, with data queries being followed up with fertility centre staff. In 2012, information relating to pregnancy and birth outcomes was not provided for 0.8 percent of clinical pregnancies. The Reproductive Technology Accreditation Committee of the Fertility Society of Australia also plays a role in ensuring the quality of ANZARD2.0 data by validating selected records against clinic files in their annual inspections.
Data presentation
Data presented in Chapters 2 to 6 are for treatment cycles and not patients. It is possible for an individual woman to undergo more than one treatment cycle in a year or experience more than one pregnancy. This means that information reported about patient characteristics, such as age, parity and cause of infertility, is based on calculations in which individuals may be counted more than once. The rates of clinical pregnancy and live delivery in Chapters 2 to 6 were measured per initiated cycle. Where the number of initiated cycles was not available, the rates were measured per embryo transfer cycle. Where applicable, percentages in tables have been calculated including the ‘Not stated’ category. Throughout the report, for totals, percentages may not add up to 100.0 and, for subtotals, they may not add up to the sum of the percentages for the categories. This is due to rounding error.
Assisted Reproductive Technology in New Zealand 2012 33
Data limitations
Follow-up of pregnancy and birth outcomes is limited because the ongoing care of pregnant patients is often carried out by non-ART practitioners. The method of follow-up varies by fertility centre and includes follow-up with the patient or clinician or the use of routine data sourced from a health department. In a small proportion of cases this information is not available. For pregnancies in which there is successful follow-up, data are limited by the self-reported nature of the information. Fertility centre staff invest significant effort in validating such information by obtaining medical records from clinicians or hospitals. Data about previous ART treatment and history of pregnancies are, in some cases, reported by patients.

34 Assisted Reproductive Technology in New Zealand 2012
Glossary
This report categorises ART treatments according to whether a woman used her own oocytes or embryos, or oocytes/embryos were donated by another woman/couple, and whether the embryos were transferred soon after fertilisation or following cryopreservation.
Artificial insemination: a range of techniques of placing sperm into the female genital tract, and can be used with controlled ovarian hyperstimulation or in unstimulated cycles. These techniques are referred to as donor insemination (DI) in this report.
ART (assisted reproductive technology): treatments or procedures that involve the in vitro handling of human oocytes (eggs) and sperm or embryos for the purposes of establishing a pregnancy. ART does not include artificial insemination.
Assisted hatching: when the outer layer of the embryo, the zona pellucida, is either thinned or perforated in the laboratory to aid ‘hatching’ of the embryo, the aim being to potentially improve the chance of implantation in the uterus.
Autologous cycle: an ART treatment cycle in which a woman intends to use, or uses her own oocytes or embryos. GIFT cycles are classified separately from autologous cycles.
Blastocyst: an embryo comprising about 100 cells usually developed by five or six days after fertilisation.
Caesarean section: an operative delivery by surgical incision through the abdominal wall and uterus.
Cleavage stage embryo: an embryo comprising about 8 cells usually developed by two or three days after fertilisation.
Clinical pregnancy: a pregnancy in which at least one of the following criteria is met:
known to be ongoing at 20 weeks
evidence by ultrasound of an intrauterine sac (with or without a fetal heart)
examination of products of conception reveal chorionic villi, or
an ectopic pregnancy has been diagnosed by laparoscope or by ultrasound.
Controlled ovarian hyperstimulation: medical treatment to induce the development of multiple ovarian follicles in order to obtain multiple oocytes at oocyte pick-up (OPU).
Cryopreservation: freezing embryos for potential future ART treatment.
Delivery: a birth event in which one or more babies of 20 weeks or more gestation or of 400 grams or more birthweight are born.
DI (donor insemination) cycle: an artificial insemination cycle in which sperm not from the woman’s partner (donor sperm) is used.
Discontinued cycle: an ART cycle that does not proceed to oocyte pick-up (OPU) or embryo transfer.
Assisted Reproductive Technology in New Zealand 2012 35
Donation cycle: an ART treatment cycle where a woman intends to donate, or donates her oocytes to others. A donation cycle may result in the donation of either oocytes or embryos to a recipient woman. The use of donor sperm does not alter the donor status of the cycle.
Ectopic pregnancy: a pregnancy in which implantation takes place outside the uterine cavity.
Embryo: an egg that has been fertilised by a sperm and has undergone one or more divisions.
Embryo transfer: a procedure whereby embryo(s) are placed in the uterus or fallopian tube. The embryo(s) can be fresh or thawed following cryopreservation, and may include the transfer of cleavage stage embryos or blastocysts.
Fetal death (stillbirth): the birth of an infant after 20 or more weeks gestation or 400 grams or more birthweight that shows no signs of life.
Fresh cycle: an ART treatment cycle that intends to use, or uses embryo(s) that have not been cryopreserved (frozen).
Gestational age: the completed weeks of gestation of the fetus. This is calculated as follows:
Cycles with embryos transferred: (pregnancy end date – embryo transfer date + 16 days) for transfer of cleavage stage embryos and (pregnancy end date – embryo transfer date + 19 days) for transfer of blastocysts.
GIFT cycles: (pregnancy end date – OPU date) + 14 days.
DI cycles: (pregnancy end date – date of insemination) + 14 days.
GIFT (gamete intrafallopian transfer): an ART treatment where mature oocytes and sperm are placed directly into a woman’s fallopian tubes so that in vivo fertilisation may take place. GIFT cycles are classified separately from autologous cycles.
Heterotopic pregnancy: a double gestation pregnancy in which implantation takes place both inside and outside the uterine cavity.
ICSI (intracytoplasmic sperm injection): a procedure whereby a single sperm is injected directly into the oocyte to aid fertilisation. If an embryo transfer cycle involves the transfer of at least one embryo created using ICSI, it is counted as an ICSI cycle.
IVF (In vitro fertilisation): an ART procedure that involves extracorporeal fertilisation.
Live birth: according to the World Health Organization (WHO) definition, a live birth is defined as the complete expulsion or extraction from its mother of a product of conception irrespective of the duration of the pregnancy, after such separation, breathes or shows any other evidence of life, such as beating of the heart, pulsation of the umbilical cord, or definite movement of the voluntary muscles, whether or not the umbilical cord has been cut or the placenta is attached; each product of such a birth is considered liveborn. In this report, live births are included if they meet the WHO definition and if they are of 20 weeks or more gestation or 400 grams or more birthweight.
Live delivery: a live delivery is the delivery of one or more liveborn infants, with the birth of twins, triplets or more counted as one live delivery.
Low birthweight: a birthweight of less than 2,500 grams.

36 Assisted Reproductive Technology in New Zealand 2012
Oocyte (egg): a female reproductive cell.
OPU (oocyte pick-up): the procedure to collect oocytes from ovaries, usually by ultrasound guided transvaginal aspiration and rarely by laparoscopic surgery.
Parity: a classification of a woman in terms of the number of previous pregnancies experienced that reached 20 weeks or more gestation.
Parous: refers to a woman who has had at least one previous pregnancy of 20 weeks or more gestation.
PGD (preimplantation genetic diagnosis): a procedure where embryonic cells are removed and screened for chromosomal disorders or genetic diseases before embryo transfer.
Nulliparous: refers to a woman who has never had a pregnancy of 20 weeks or more gestation.
Perinatal death: a fetal death (stillbirth) or neonatal death of at least 20 weeks gestation or at least 400 grams birthweight.
Preterm: a gestation of less than 37 weeks.
Recipient cycle: an ART treatment cycle in which a woman receives oocytes or embryos from another woman.
Secondary sex ratio: the number of male liveborn babies per 100 female liveborn babies.
Surrogacy arrangement: an arrangement where a woman, known as the gestational carrier agrees to carry a child for another person or couple, known as the intended parent(s), with the intention that the child will be raised by the intended parent(s). The oocytes and/or sperm used to create the embryo(s) in the surrogacy cycle can be either from the intended parents or from a donor(s).
Thaw cycle: an ART treatment cycle in which cryopreserved embryos are thawed with the intention of performing embryo transfer.
Thawed embryo: an embryo thawed after cryopreservation. It is used in thaw cycles.
Vitrification: an ultra-rapid cryopreservation method that prevents ice formation within the suspension which is converted to a glass-like solid. Note: The International Committee Monitoring Assisted Reproductive Technologies (ICMART) has published an ART glossary for the terms used in ART data collections (Zegers-Hochschild et al 2009). However, the terminology used in this report may differ from that in the ICMART glossary.

Assisted Reproductive Technology in New Zealand 2012 37
References
Boivin J, Bunting L, Collins JA, et al. 2007. International estimates of infertility prevalence and treatment-seeking: potential need and demand for infertility medical care Human Reproduction 22: 1506–12.
ICMART (International Committee for Monitoring Assisted Reproductive Technology). 2012. Preliminary Global ART data for 2008. European Society of Human Embryology and reproduction Annual Meeting. Istanbul, Turkey, 1–4 July 2012.
Zegers-Hochschild F, Adamson GD, de Mouzon J, et al. on behalf of ICMART and WHO. 2009. The International Committee Monitoring Assisted Reproductive Technologies (ICMART) and the World Health Organization (WHO) revised glossary on ART terminology. Human Reproduction 24(11): 2683–87.