Embed Size (px)
Citation preview

Assurance de qualité pour le cancer rectal – phase 2:
développement et test d’un ensemble d’indicateurs
de qualité
KCE reports 81B
Federaal Kenniscentrum voor de Gezondheidszorg Centre fédéral d’expertise des soins de santé
2008

Le Centre fédéral d’expertise des soins de santé
Présentation : Le Centre fédéral d’expertise des soins de santé est un parastatal, créé le 24 décembre 2002 par la loi-programme (articles 262 à 266), sous tutelle du Ministre de la Santé publique et des Affaires sociales, qui est chargé de réaliser des études éclairant la décision politique dans le domaine des soins de santé et de l’assurance maladie.
Conseil d’administration
Membres effectifs : Gillet Pierre (Président), Cuypers Dirk (Vice-Président), Avontroodt Yolande, De Cock Jo (Vice-Président), De Meyere Frank, De Ridder Henri, Gillet Jean-Bernard, Godin Jean-Noël, Goyens Floris, Maes Jef, Mertens Pascal, Mertens Raf, Moens Marc, Perl François, Van Massenhove Frank, Vandermeeren Philippe, Verertbruggen Patrick, Vermeyen Karel.
Membres suppléants : Annemans Lieven, Bertels Jan, Collin Benoît, Cuypers Rita, Decoster Christiaan, Dercq Jean-Paul, Désir Daniel, Laasman Jean-Marc, Lemye Roland, Morel Amanda, Palsterman Paul, Ponce Annick, Remacle Anne, Schrooten Renaat, Vanderstappen Anne..
Commissaire du gouvernement : Roger Yves
Direction
Directeur général : Dirk Ramaekers
Directeur général adjoint : Jean-Pierre Closon
Contact
Centre fédéral d’expertise des soins de santé (KCE). Rue de la Loi 62 B-1040 Bruxelles Belgium
Tel: +32 [0]2 287 33 88 Fax: +32 [0]2 287 33 85
Email : [email protected] Web : http://www.kce.fgov.be
Assurance de qualité pour le cancer rectal – phase 2:
développement et test d’un ensemble d’indicateurs de
qualité
KCE reports 81B
VLAYEN J, VERSTREKEN M, MERTENS C, VAN EYCKEN E, PENNINCKX F
Federaal Kenniscentrum voor de gezondheidszorg
Centre fédéral d’expertise des soins de santé 2008
KCE REPORTS 81B
Titre : Assurance de qualité pour le cancer rectal – phase 2: développement et test d’un ensemble d’indicateurs de qualité
Auteurs : Vlayen J (KCE), Verstreken M (BCR), Mertens C (BCR), Van Eycken E (BCR), Penninckx F (PROCARE)
Experts externes : PROCARE Steering group (Belgian Section for Colorectal Surgery [BSCRS]: Bertrand C, De Coninck D, Duinslaeger M, Kartheuser A, Van de Stadt J, Vaneerdeweg W; Belgian Society of Surgical Oncology [BSSO]: Claeys D; Belgian Group for Endoscopic Surgery [BGES]: Burnon D; Belgian Society of Pathology and Digestive Pathology Club: Ectors N, Jouret A, Sempoux C; Belgian Society of Radiotherapy – Oncology [BSRO]: Haustermans K, Scalliet P, Spaas P; Belgian Group Digestive Oncology [BGDO]: Laurent S, Polus M, Van Cutsem E, Van Laethem JL; Belgian Society Medical Oncology [BSMO]: Bleiberg H, Humblet Y, Van Cutsem E; Royal Belgian Society Radiology [RBSR]: Danse E, Op De Beeck B, Smeets P; Vlaamse Vereniging Gastro-Enterologie [VVGE]: Cabooter M, Pattyn P, Peeters M; Société Royale Belge Gastro-Entérologie [SRBGE]: Melange M, Rahier J, Van Laethem JL; Belgian Society Endoscopy: Buset M; Belgian Professional Surgical Association [BPSA]: Haeck L, Mansvelt B; both Van Eycken E and Penninckx F are also member of the PROCARE Steering group); Roels S (UZ Leuven); Leonard D (UCL); Decaestecker J (UZ Leuven) ; De Vleeschouwer C (UZ Leuven); Remacle A (IMA) ; Boterberg T (representative of College of Oncology); Meeus P (RIZIV/INAMI); Baert E (UGent); Gilbert M (Fondation Contre le Cancer)
Validateurs : Faivre J (CHU Dijon, Frankrijk), Otter R (VIKC, Nederland), Van Belle S (College van Oncologie)
Conflict of interest : Penninckx F et la majorité des experts externes (sauf Remacle A, Meeus P, Baert E et Gilbert M) travaillent dans un service hospitalier où sont traités des patients souffrant de cancer rectal. Penninckx F, Haustermans K, Peeters M et Van Cutsem E ont reçu une rémunération pour des communications et des fonds de recherche (non liés au présent rapport).
Disclaimer: Les experts externes ont collaboré au rapport scientifique qui a ensuite été soumis aux validateurs. La validation du rapport résulte d’un consensus ou d’un vote majoritaire entre les validateurs. Le KCE reste seul responsable des erreurs ou omissions qui pourraient subsister de même que des recommandations faites aux autorités publiques.
Acknowledgements : Devriese S (KCE), Vrijens F (KCE), Van De Sande S (KCE), Huysegoms M (BCR), Vinck I (KCE)
Mise en Page : Ine Verhulst Bruxelles, 3 juli 2008 Etude n° 2006-03-1 Domaine : Good Clinical Practice (GCP) MeSH : Rectal Neoplasms; Rectal Diseases; Quality of Health Care; Quality Indicators, Health Care NLM classification : WI 610 Langage : français ; anglais Format : Adobe® PDF™ (A4) Dépôt légal : D/2008/10.273/39 La reproduction partielle de ce document est autorisée à condition que la source soit mentionnée. Ce document est disponible en téléchargement sur le site Web du Centre fédéral d’expertise des soins de santé. Comment citer ce rapport ?
Vlayen J, Verstreken M, Mertens C, Van Eycken E, Penninckx F. Assurance de qualité pour le cancer rectal – phase 2: développement et test d’un ensemble d’indicateurs de qualité. Good Clinical Practice (GCP). Bruxelles: Centre fédéral d'expertise des soins de santé (KCE); 2008. KCE reports 81B (D/2008/10.273/39)
KCE Reports 81B Cancer rectal – phase 2 i
PREFACE L'amélioration de la qualité des soins constitue l'une des priorités du Plan National Cancer. Dans ce cadre, la ministre a formulé un certain nombre de propositions concrètes, notamment la mise en place d'une structure au sein du Collège d'Oncologie qui serait chargée de définir des mécanismes de contrôle, le financement de datamanagers pour l'enregistrement des données sur les cancers dans les hôpitaux, etc. En outre, la Fondation Registre du Cancer sera renforcée afin d'optimiser l'enregistrement et l'analyse des données sur les cancers.
L'initiative PROCARE (PROject on CAncer of the REctum) s'inscrit parfaitement dans un tel contexte. Il y a peu, dans le cadre d'une première phase de ce projet, des recommandations de bonne pratique evidence-based ont été définies en collaboration avec le KCE par un groupe multidisciplinaire de spécialistes belges en cancer du rectum. Dans un second temps, ces recommandations ont été traduites par ce même groupe, en critères de qualité concrets. Avec l'aide de la Fondation Registre du Cancer, le présent rapport étudie dans quelle mesure ces critères de qualité sont mesurables avec les données belges sur les cancers dont nous disposons et quelles conditions doivent être remplies pour pouvoir transposer cette mesure de la qualité dans la pratique. Il apparaît qu’il ne s’agit pas d’un exercice évident.
Quelques primeurs caractérisent ce projet et méritent d'être épinglées. Ainsi, c'est la première fois que les données de la Fondation Registre du Cancer sont utilisées à des fins qualitatives. En outre, dans PROCARE, un couplage inédit entre les données de la Fondation Registre du Cancer, de l'Agence Intermutualiste et de la Cellule technique de l'INAMI, a été réalisé. Nul doute que de futurs projets de la même veine pourront s'inspirer de l'expérience engrangée dans le cadre de PROCARE.
Il est bien entendu que la mesure de la qualité ne représente qu'un premier pas dans un processus d'amélioration continue. L'interprétation des résultats et des actions d'amélioration ciblées sont les étapes logiques suivantes. Il incombe maintenant aux acteurs intéressés de prouver dans les années qui viennent que cette initiative aura vraiment eu pour résultat une amélioration de la qualité des soins.
Jean Pierre Closon Dirk Ramaekers
Directeur général adjoint Directeur général
ii Cancer rectal – phase 2 KCE Reports 81B
Résumé
1 INTRODUCTION Le projet PROCARE (PROject on CAncer of the REctum) a démarré en 2004 en Belgique. Cette initiative a pour but d'améliorer et de standardiser la qualité des soins dans le cancer rectal grâce à la définition et à la mise en œuvre de recommandations spécifiques et à une surveillance de la qualité via un enregistrement et un feedback. Toutes les spécialités médicales impliquées dans le traitement du cancer du rectum ont été rassemblées au sein d'un groupe de travail multidisciplinaire avec des représentants de leurs associations scientifiques respectives. Une première version provisoire des recommandations PROCARE a été rédigée en 2005. Elles ont été diffusées via des ateliers (chirurgie, pathologie, radiothérapie, chimiothérapie et radiologie). Une base de données prospective contenant les données individuelles des patients a été développée et un enregistrement volontaire par l'intermédiaire de la Fondation Registre du Cancer a débuté en 2006. Toutes les données pertinentes (du staging au follow-up) des centres participants relatives aux nouveaux patients atteints de cancer du rectum ont été introduites dans cette base de données prospective. Enfin, fin 2007, les recommandations provisoires PROCARE ont été actualisées par un groupe de travail multidisciplinaire en collaboration avec le KCE (phase 1 du projet).
Afin de permettre un feed-back individuel et une comparaison (inter)nationale, il a été décidé de construire d'abord un système d’indicateurs de qualité. Le but étant de se concentrer sur le traitement primaire des patients atteints de cancer du rectum, et ce, pour l'ensemble de leur parcours de soins (à partir du diagnostic et du staging jusqu'au suivi).
Le présent rapport décrit le processus de recherche d'une sélection d'indicateurs de qualité pertinents. La faisabilité d'une mesure des indicateurs sélectionnés a été testée dans la base de données prospective PROCARE, d'une part, et une base de données administratives d'autre part. Le rapport apporte une réponse aux questions suivantes:
1. Parmi les indicateurs de qualité sélectionnés, lesquels sont mesurables ?
2. A quel niveau ces indicateurs sont-ils mesurables (national, hôpital, prestataire de soins) ?
3. Quelles données minimales sont-elles nécessaires pour mesurer et interpréter les indicateurs ? La base de données PROCARE et la base de données administratives sont-elles complémentaires ?
4. Comment seront présentés les résultats de la mesure ?
En outre, sur la base de cet exercice, on s'efforcera de définir une méthodologie générique de mesure des indicateurs de qualité oncologiques en Belgique. Enfin, le rapport fournit encore un tour d'horizon des expériences internationales en matière de mesure de la qualité des soins dans le cancer du rectum.
KCE Reports 81B Cancer rectal – phase 2 iii
2 ÉLABORATION D'UNE SÉRIE D'INDICATEURS DE QUALITÉ
2.1 MÉTHODOLOGIE Les auteurs ont consulté aussi bien la littérature indexée (Medline et Cochrane Library) que la littérature grise (recommandations de bonne pratique, sites Internet d'organisations, National Quality Measures Clearinghouse).
Les critères suivants ont été utilisés pour sélectionner les indicateurs de qualité:
• pertinence;
• niveau de preuve;
• lien avec les recommandations PROCARE;
• niveau de qualité (niveau 1 : indicateurs de qualité influencés par toutes les phases de soins ; niveau 2 : indicateurs de qualité essentiels, influencés par un phase de soins spécifique (par exemple chirurgie) ; niveau 3 : indicateurs de qualité nécessaires pour l’interprétation des indicateurs de niveau 1 et 2).
Seuls les indicateurs de qualité de niveau 1 et 2 ont été pris en considération pour leur inclusion. Un groupe de travail multidisciplinaire a proposé des indicateurs de qualité additionnels avec comme point de départ les recommandations PROCARE.
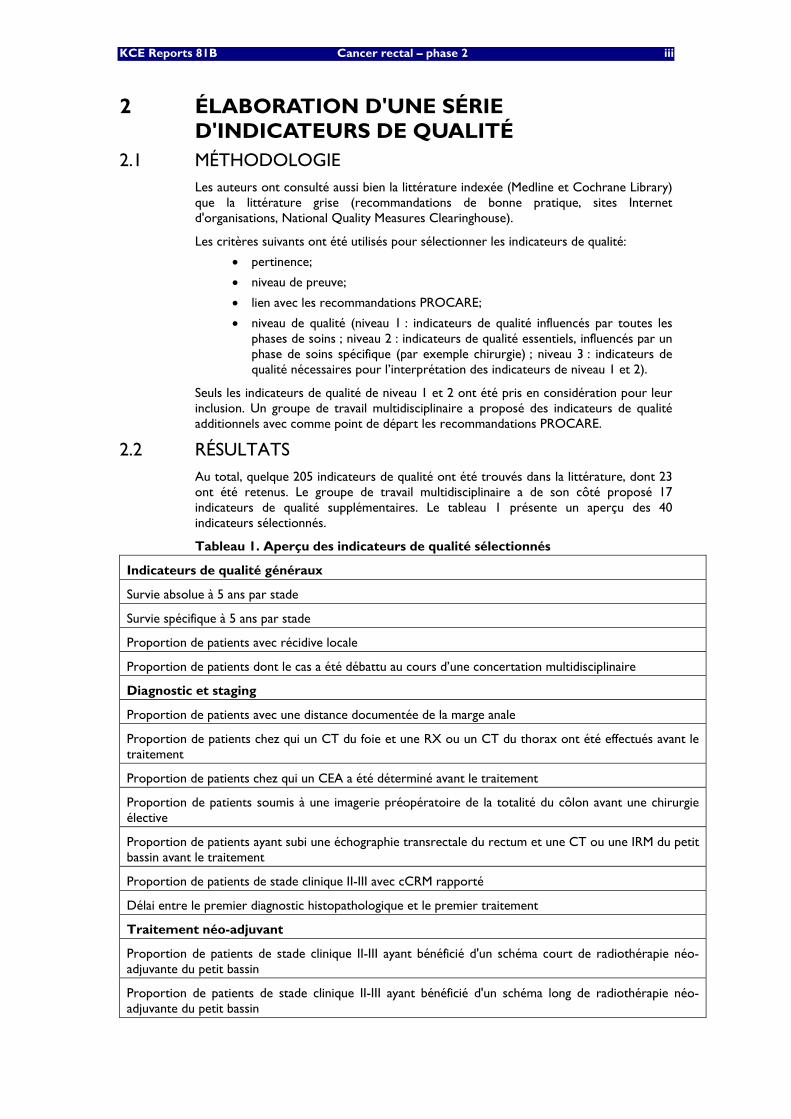
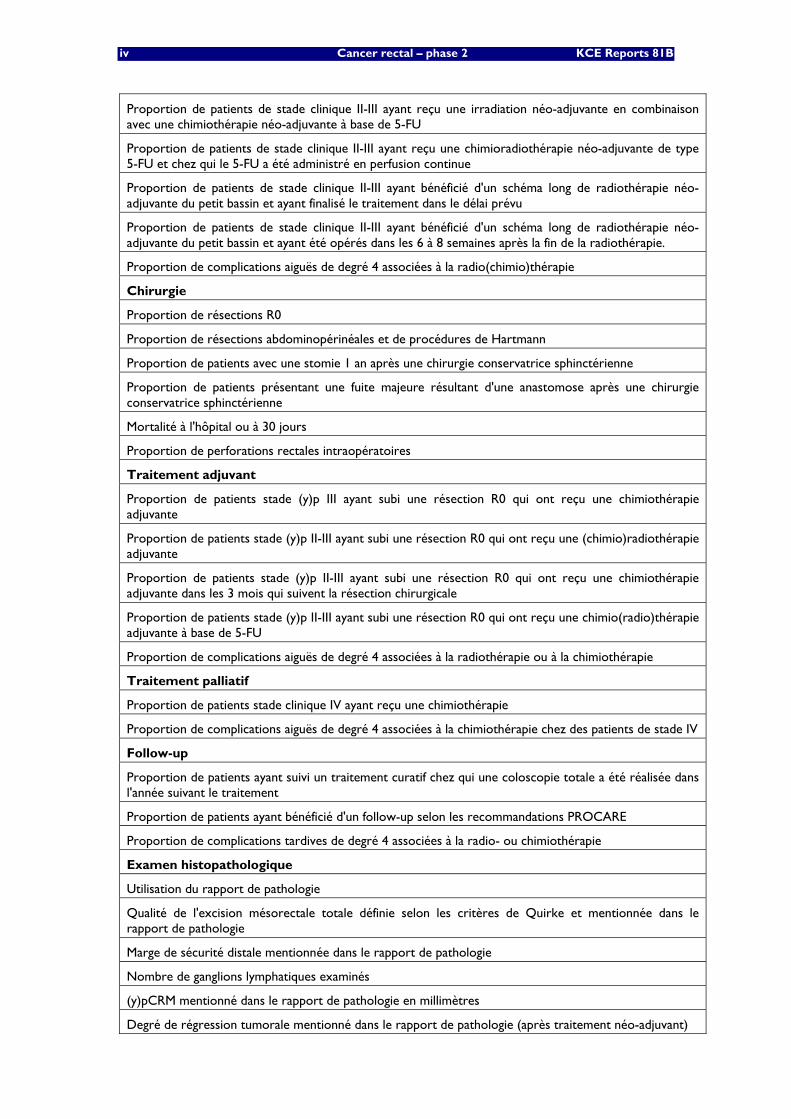
2.2 RÉSULTATS Au total, quelque 205 indicateurs de qualité ont été trouvés dans la littérature, dont 23 ont été retenus. Le groupe de travail multidisciplinaire a de son côté proposé 17 indicateurs de qualité supplémentaires. Le tableau 1 présente un aperçu des 40 indicateurs sélectionnés.
Tableau 1. Aperçu des indicateurs de qualité sélectionnés
Indicateurs de qualité généraux
Survie absolue à 5 ans par stade
Survie spécifique à 5 ans par stade
Proportion de patients avec récidive locale
Proportion de patients dont le cas a été débattu au cours d’une concertation multidisciplinaire
Diagnostic et staging
Proportion de patients avec une distance documentée de la marge anale
Proportion de patients chez qui un CT du foie et une RX ou un CT du thorax ont été effectués avant le traitement
Proportion de patients chez qui un CEA a été déterminé avant le traitement
Proportion de patients soumis à une imagerie préopératoire de la totalité du côlon avant une chirurgie élective
Proportion de patients ayant subi une échographie transrectale du rectum et une CT ou une IRM du petit bassin avant le traitement
Proportion de patients de stade clinique II-III avec cCRM rapporté
Délai entre le premier diagnostic histopathologique et le premier traitement
Traitement néo-adjuvant
Proportion de patients de stade clinique II-III ayant bénéficié d'un schéma court de radiothérapie néo-adjuvante du petit bassin
Proportion de patients de stade clinique II-III ayant bénéficié d'un schéma long de radiothérapie néo-adjuvante du petit bassin
iv Cancer rectal – phase 2 KCE Reports 81B
Proportion de patients de stade clinique II-III ayant reçu une irradiation néo-adjuvante en combinaison avec une chimiothérapie néo-adjuvante à base de 5-FU
Proportion de patients de stade clinique II-III ayant reçu une chimioradiothérapie néo-adjuvante de type 5-FU et chez qui le 5-FU a été administré en perfusion continue
Proportion de patients de stade clinique II-III ayant bénéficié d'un schéma long de radiothérapie néo-adjuvante du petit bassin et ayant finalisé le traitement dans le délai prévu
Proportion de patients de stade clinique II-III ayant bénéficié d'un schéma long de radiothérapie néo-adjuvante du petit bassin et ayant été opérés dans les 6 à 8 semaines après la fin de la radiothérapie.
Proportion de complications aiguës de degré 4 associées à la radio(chimio)thérapie
Chirurgie
Proportion de résections R0
Proportion de résections abdominopérinéales et de procédures de Hartmann
Proportion de patients avec une stomie 1 an après une chirurgie conservatrice sphinctérienne
Proportion de patients présentant une fuite majeure résultant d'une anastomose après une chirurgie conservatrice sphinctérienne
Mortalité à l'hôpital ou à 30 jours
Proportion de perforations rectales intraopératoires
Traitement adjuvant
Proportion de patients stade (y)p III ayant subi une résection R0 qui ont reçu une chimiothérapie adjuvante
Proportion de patients stade (y)p II-III ayant subi une résection R0 qui ont reçu une (chimio)radiothérapie adjuvante
Proportion de patients stade (y)p II-III ayant subi une résection R0 qui ont reçu une chimiothérapie adjuvante dans les 3 mois qui suivent la résection chirurgicale
Proportion de patients stade (y)p II-III ayant subi une résection R0 qui ont reçu une chimio(radio)thérapie adjuvante à base de 5-FU
Proportion de complications aiguës de degré 4 associées à la radiothérapie ou à la chimiothérapie
Traitement palliatif
Proportion de patients stade clinique IV ayant reçu une chimiothérapie
Proportion de complications aiguës de degré 4 associées à la chimiothérapie chez des patients de stade IV
Follow-up
Proportion de patients ayant suivi un traitement curatif chez qui une coloscopie totale a été réalisée dans l'année suivant le traitement
Proportion de patients ayant bénéficié d'un follow-up selon les recommandations PROCARE
Proportion de complications tardives de degré 4 associées à la radio- ou chimiothérapie
Examen histopathologique
Utilisation du rapport de pathologie
Qualité de l'excision mésorectale totale définie selon les critères de Quirke et mentionnée dans le rapport de pathologie
Marge de sécurité distale mentionnée dans le rapport de pathologie
Nombre de ganglions lymphatiques examinés
(y)pCRM mentionné dans le rapport de pathologie en millimètres
Degré de régression tumorale mentionné dans le rapport de pathologie (après traitement néo-adjuvant)
KCE Reports 81B Cancer rectal – phase 2 v
3 ETUDE DE FAISABILITÉ POUR LA MESURE DES INDICATEURS DE QUALITE
3.1 METHODOLOGIE La faisabilité de la mesure des indicateurs de qualité sélectionnés a été testée sur deux bases de données différentes:
1. Base de données prospective PROCARE: aux fins de cette étude, on a utilisé les données de 1071 premiers patients atteints d'un cancer du rectum enregistrés en 2006-2007.
2. Base de données administratives: aux fins de cette étude, on a réalisé un couplage entre les données de la Fondation Registre du Cancer (FRC) (2000-2004), de l'Agence Intermutualiste (AIM) (2001-2004) et de la Cellule technique (CT) (juillet 2001-2004). Pour la sélection primaire des patients, on a utilisé les codes topographiques ICD-O-3 de la FRC (C20.9, tumeur maligne du rectum). Une sélection complémentaire via la base de données de la CT (ICD-9-CM 154.1, cancer du rectum) est apparue impossible. La sélection finale comprenait 7074 patients souffrant de cancer du rectum.
Pour chaque indicateur de qualité sélectionné, le dénominateur et le numérateur ont été traduits en codes mesurables des bases de données respectives. Dans la base de données PROCARE, chaque variable s'est vu attribuer un code spécifique. Pour les données administratives, on a utilisé les codes de la nomenclature, les codes ICD-9-CM, les codes FRC et les codes ATC.
Pour chaque indicateur de qualité mesurable, les résultats ont été exprimés en tant que moyenne pondérée et non pondérée (avec un intervalle de confiance de 95%). Les résultats ont par ailleurs été déclinés par centre.
Enfin, les résultats ont été agrégés selon deux méthodes. D'une part, on a calculé une moyenne globale de tous les résultats par centre. D'autre part, un "classement moyen corrigé" a été calculé en attribuant à chaque centre par indicateur un classement, celui-ci étant corrigé pour le nombre de centres pour lesquels l'indicateur était mesurable. Ensuite, une moyenne de tous les classements corrigés a été calculée par centre. Pour les centres participants au projet PROCARE, on a en outre calculé la corrélation entre le classement moyen corrigé calculé avec, d'une part, la base de données PROCARE et, d'autre part, la base de données administrative.
3.2 RÉSULTATS Au total, il est apparu que 30 indicateurs étaient mesurables avec la base de données PROCARE et 9 avec la base de données administratives. Six indicateurs sont mesurables avec les deux bases de données, tandis que 7 autres indicateurs ne sont mesurables avec aucune des deux. L'absence de codes (spécifiques) est la principale raison pour laquelle les indicateurs ne sont pas mesurables. Pour la base de données administrative, il s'agit surtout de l'absence de codes pour les issues cliniques (par exemple, résection R0) ou les résultats cliniques (par exemple, cCRM).
Il est apparu que différents indicateurs avaient des dénominateurs et numérateurs relativement petits. Ceci s'explique en raison de deux problèmes. D'une part, dans la base de données PROCARE, on a constaté qu'un nombre important de données faisaient défaut. Par ailleurs, pour des raisons techniques, dans le cas de 6 indicateurs, il n'a pas été possible de calculer les données manquantes. Enfin, le nombre de patients inclus par centre est apparu relativement faible.
La plupart des indicateurs individuels affichent une variation suffisante pour rendre possible une distinction entre les centres qui dispensent des soins de haute qualité par rapport à ceux dont les soins sont de qualité médiocre. Toutefois, la variation entre les moyennes globales par centre et les classements moyens corrigés est moins accentuée. De plus, on n'a trouvé aucune corrélation entre le classement moyen corrigé calculé avec la base de données PROCARE, d'une part, et la base de données administratives, d'autre part.
vi Cancer rectal – phase 2 KCE Reports 81B
4 EXPERIENCES INTERNATIONALES En janvier 2008, des experts de quelques pays d'Europe occidentale (Danemark, France, Allemagne, Norvège, Suède, Espagne, Pays-Bas et Grande-Bretagne) ont été contactés. On les a, d'une part, interrogés à propos des caractéristiques principales de leur base de données/registre. D'autre part, les auteurs de l'étude ont vérifié dans quelle mesure les informations nécessaires pour mesurer les indicateurs de qualité sélectionnés étaient disponibles.
La Suède, la Norvège, le Danemark et la Grande-Bretagne disposent d'une base de données nationale fonctionnelle de type "population-based" des patients atteints de cancer du rectum. Aux Pays-Bas, une base de ce type a été introduite récemment. La France, l'Allemagne et les Pays-Bas possèdent des bases de données régionales.
Il ressort qu'en Suède et en Norvège, les informations nécessaires sont disponibles pour la plupart des indicateurs de qualité. Certains indicateurs de niveau 1, notamment la survie à 5 ans, sont manifestement mesurables dans la plupart des pays contactés.
5 CONCLUSIONS ET RECOMMANDATIONS • Pour la plupart des indicateurs sélectionnés, les informations sont disponibles
dans les bases de données PROCARE et/ou administrative. Sur la base de l'exercice actuel, une adaptation de certains indicateurs et données/variables PROCARE est toutefois nécessaire.
• Afin de réduire le nombre de données manquantes dans PROCARE et d'améliorer les performances au niveau de l'enregistrement des données, une application Internet s'impose. Pour diminuer la charge administrative, le formulaire d'enregistrement des données PROCARE – qui est pour l'instant très exhaustif – doit être adapté. Le nombre de données à enregistrer doit être fortement diminuées, d’une part en intégrant les données prospectives et administratives et d’autre part en ne sélectionnant que quelques indicateurs clés. De plus, l’accès aux données administratives nécessaires devrait être octroyé automatiquement à la FRC.
• Le couplage entre la base de données de la FRC et d'autres bases de données administratives est faisable et fiable. Les données de la FRC sont exploitables et pertinentes pour certains indicateurs. En outre, la FRC possède la capacité nécessaire pour un enregistrement prospectif et une analyse des données. En conséquence, la FRC représente un partenaire crucial pour des projets similaires futurs.
• Pour ce projet, c'est le couplage entre les bases de données de la FRC et de l'AIM qui est apparu le plus pertinent. En revanche, l'apport de la base de la CT a été limité.
• Compte tenu du fait que pour l'heure, l'interprétation de la plupart des indicateurs est encore difficile en raison de leur nombre réduit, provisoirement, il est préférable que le feedback individuel soit donné sans interprétation. Fin 2009, la pertinence et la possibilité d'interprétation des indicateurs devront être réévaluées. Cette évaluation doit permettre la sélection d’indicateurs clés. L’étape suivante devrait être l’implémentation du système.
• Aux fins d'une comparaison internationale "population-based" qui soit significative, l'enregistrement PROCARE doit être garanti dans sa totalité (par exemple, via un couplage avec les bases de données administratives) et il convient d'inclure un nombre plus élevé de patients.
KCE Reports 81 PROCARE – phase 2 1
Scientific summary Table of contents
1 INTRODUCTION............................................................................................................ 4 2 DEVELOPMENT OF A QUALITY INDICATOR SET................................................. 7 2.1 METHODOLOGY........................................................................................................................................ 7
2.1.1 Literature search .............................................................................................................................. 7 2.1.2 Definition of quality levels .............................................................................................................. 7 2.1.3 Selection process of quality indicators ........................................................................................ 7
2.2 RESULTS......................................................................................................................................................... 8 2.2.1 Search for and selection of quality indicators ............................................................................ 8 2.2.2 Overview of selected quality indicators ...................................................................................... 9
2.3 DISCUSSION...............................................................................................................................................13 3 FEASIBILITY STUDY OF QUALITY INDICATOR MEASUREMENT ................... 14 3.1 METHODOLOGY......................................................................................................................................14
3.1.1 Definition of selected quality indicators ....................................................................................14 3.1.2 Source databases ............................................................................................................................14 3.1.3 Translation of selected quality indicators into measurable codes .......................................16 3.1.4 Per-centre-analysis .........................................................................................................................17 3.1.5 Statistics............................................................................................................................................17 3.1.6 Aggregation of the results ............................................................................................................18
3.2 RESULTS.......................................................................................................................................................19 3.2.1 Description of study cohorts.......................................................................................................19 3.2.2 Results of pilot testing per sub-discipline..................................................................................22 3.2.2.1 General quality indicators............................................................................................................................... 22 3.2.2.2 Quality indicators related to diagnosis and staging................................................................................. 30 3.2.2.3 Quality indicators related to neoadjuvant treatment.............................................................................. 38 3.2.2.4 Quality indicators related to surgery ........................................................................................................... 43 3.2.2.5 Quality indicators related to adjuvant treatment..................................................................................... 50 3.2.2.6 Quality indicators related to palliative treatment .................................................................................... 54 3.2.2.7 Quality indicators related to follow-up........................................................................................................ 56 3.2.2.8 Quality indicators related to histopathologic examination .................................................................... 57 3.2.3 Aggregation of the results at hospital level...............................................................................62
3.3 DISCUSSION...............................................................................................................................................66 3.3.1 Measurability of the selected quality indicators .......................................................................66 3.3.2 Definition of quality indicators ....................................................................................................66 3.3.3 Possible problems with the interpretation of the quality indicators ...................................66 3.3.4 Complementarity of both databases ..........................................................................................71 3.3.5 High versus low performance on quality indicators ...............................................................72 3.3.6 Generalisability of this project.....................................................................................................73
4 INTERNATIONAL EXPERIENCES WITH QUALITY MEASUREMENT OF RECTAL CANCER CARE............................................................................................. 74
4.1 INTRODUCTION......................................................................................................................................74 4.2 METHODOLOGY......................................................................................................................................74 4.3 RESULTS.......................................................................................................................................................75
4.3.1 Rectal cancer databases in Western Europe............................................................................75 4.3.2 Availability of PROCARE quality indicators in Western European databases ..................77
4.4 DISCUSSION...............................................................................................................................................78 5 CONCLUSIONS ............................................................................................................ 80 6 APPENDICES................................................................................................................. 82
2 PROCARE – phase 2 KCE reports 81
ABBREVIATIONS 5-FU 5-fluorouracil
95% CI 95 percent confidence interval
ACPGBI Association of Coloproctology of Great Brittain and Ireland
AHRQ Agency for Healthcare Research and Quality
AJCC American Joint Committee on Cancer
APR Abdomino-perineal resection of the rectum
ASA American Association of Anaesthetists score
ATC Anatomical Therapeutic Chemical
BCR Foundation Belgian Cancer Registry
CEA Carcinoembryonic antigen
CIST Clinical Indicator Support Team
CNK Code National(e) Kode
CPG Clinical practice guideline
CRM Circumferential resection margin
CRT Chemoradiation therapy
CTV Clinical Target Volume
CT Computed tomography
DFS Disease-free survival
ECCO European CanCer Organisation
EPJ Electronic Patient Journal
EUS Endoscopic ultrasonography
Gy Gray
HIC Health Insurance Companies
ICD International classification of diseases
IMA Common Sickness Funds Agency (Intermutualistisch Agentschap/ L'Agence Intermutualiste)
IV Intravenous
LBI Large bowel-imaging
LE Local excision
MDT Multidisciplinary team
MeSH Medical Subject Headings
MCD Minimal Clinical Data (Minimale klinische gegevens/Résumé clinique minimum)
MFD Minimal Financial Data (Minimale financiële gegevens/Résumé financier minimum)
MRI Magnetic resonance imaging
NBOCAP National Bowel Cancer Audit Programme
NCASP National Clinical Audit Support Programme
NICCQ National Initiative on Cancer Care Quality
NYCRIS Northern and Yorkshire Cancer Registry Information Services
KCE Reports 81 PROCARE – phase 2 3
PET Positron Emission Tomography
PROCARE PROject on CAncer of the REctum
QI Quality indicator
RCT Randomised controlled trial
RT Radiotherapy
RX X-ray
SD Standard deviation
SSO Sphincter-sparing surgery
TC Technical Cell
TEMS Transanal endoscopic microsurgical resection
TME Total mesorectal excision
TRUS Transrectal ultrasonography
UICC International Union Against Cancer
4 PROCARE – phase 2 KCE reports 81
1 INTRODUCTION In 2004, the Belgian Section for Colorectal Surgery, a section of the Royal Belgian Society for Surgery, decided to start PROCARE (PROject on CAncer of the REctum) as a multidisciplinary, profession-driven and decentralized project (www.belgiancancerregistry.be). All medical specialties involved in the care of rectal cancer established a multidisciplinary steering group in 2005. Delegates from the respective scientific societies as well as from the Belgian Professional Association were included from the start, as it was evident that the project should not only have a scientific backbone, but should be driven by the professionals. In a questionnaire more than 80 % of the Belgian hospitals expressed their willingness to participate in the project.
The main objective of this multidisciplinary project is to reduce diagnostic and therapeutic variability and to improve outcome in patients with rectal cancer by means of:
• standardization through guidelines;
• implementation of these guidelines (workshops, meetings, training for TME, pathology, radiotherapy and radiology);
• quality assurance through registration and feedback.
Multidisciplinary guidelines on the management of rectal cancer were discussed and a first draft was written in 2005. This first version of the PROCARE guidelines was made available by the respective scientific societies. In the context of a study assigned by the KCE to PROCARE (summer 2006), the guidelines were updated with recently published evidence (part I of the study) [1].
During the years 2005 – 2008, several workshops, postgraduate courses and seminars on rectal cancer were organised in the context of the PROCARE project. Specific documents (e.g. an atlas on Clinical Target Volume [CTV] during radiotherapy for rectal cancer, a handbook on histopathologic examination of a TME specimen) were composed and discussed during discipline-specific workshops.
Central registration of credible and high-quality data is a key issue in a national project like this. Fortunately, PROCARE found a partner at the Belgian Cancer Registry (BCR). In 2005, a multidisciplinary dataset was elaborated for registration in a rectal cancer specific database at the BCR. Registration started in October 2005.
In 2007, the RIZIV/INAMI decided to financially support the project for 5 years. About half of the budget is dedicated to registration with feedback, while the other half is reserved for (re)training in order to foster implementation of the guidelines. The latter will be done by means of peer-review of radiological pre-treatment staging results, planned CTV and TME specimens, and by ‘TME training’ by peers or candidate TME trainers who fulfilled predefined criteria.
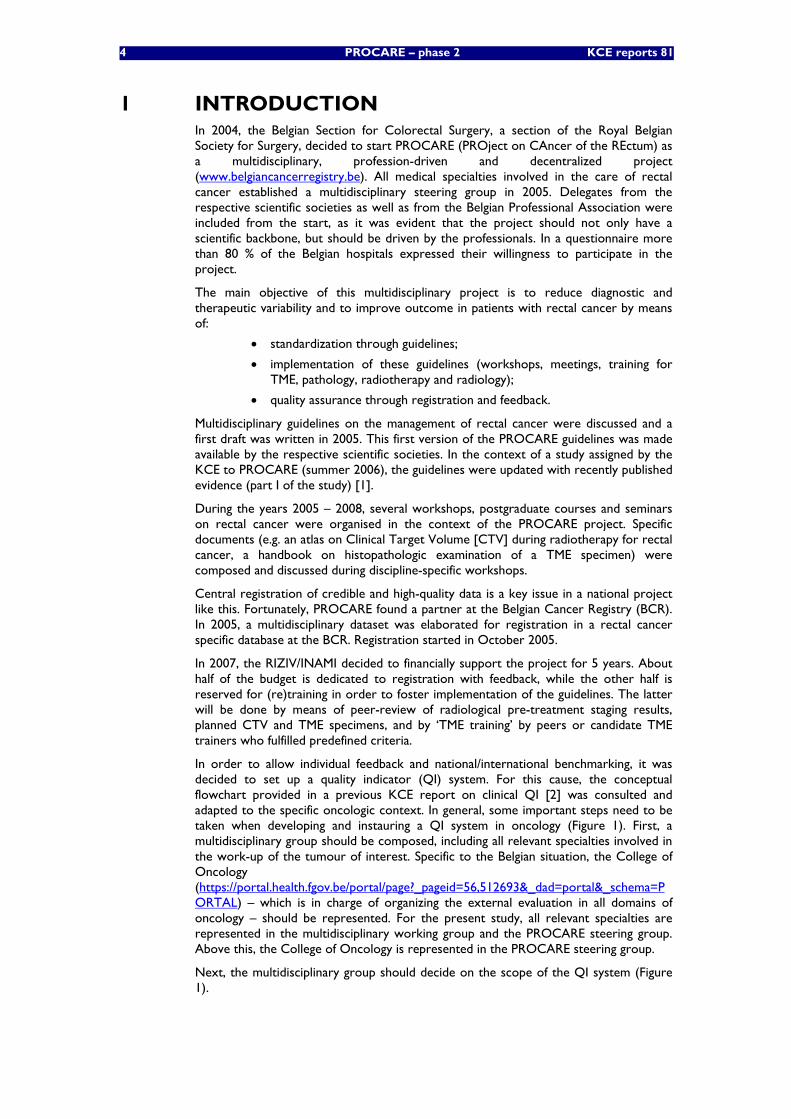
In order to allow individual feedback and national/international benchmarking, it was decided to set up a quality indicator (QI) system. For this cause, the conceptual flowchart provided in a previous KCE report on clinical QI [2] was consulted and adapted to the specific oncologic context. In general, some important steps need to be taken when developing and instauring a QI system in oncology (Figure 1). First, a multidisciplinary group should be composed, including all relevant specialties involved in the work-up of the tumour of interest. Specific to the Belgian situation, the College of Oncology (https://portal.health.fgov.be/portal/page?_pageid=56,512693&_dad=portal&_schema=PORTAL) – which is in charge of organizing the external evaluation in all domains of oncology – should be represented. For the present study, all relevant specialties are represented in the multidisciplinary working group and the PROCARE steering group. Above this, the College of Oncology is represented in the PROCARE steering group.
Next, the multidisciplinary group should decide on the scope of the QI system (Figure 1).
KCE Reports 81 PROCARE – phase 2 5
This not only involves the decision on which phases of the clinical work-up to include in the quality assessment, but also the decision on the quality of care dimensions of interest [2].
The present project aims at measuring the quality of care during the entire clinical course of patients with primary rectal cancer, including diagnosis and staging, treatment (neoadjuvant treatment, surgery, adjuvant treatment, palliative treatment), pathology and follow-up. This project focuses on the primary treatment of rectal cancer, but not on the treatment of recurrent or progressive disease. The quality of care dimensions ‘effectiveness’, ‘efficiency’, ‘safety’, ‘timeliness’ and ‘continuity’ are the focus of the PROCARE QI system.
Once the scope is defined, a literature search (including grey literature and clinical practice guidelines) should identify existing QI (Figure 1). Based on predefined criteria, a selection of QI should be made ensuring the coverage of all predefined treatment phases and quality of care dimensions. In case the identified QI do not cover all important aspects, the selection should be complemented by additional QI, preferentially based on recent clinical practice guidelines. The methodology used for the present project is described in chapter 2.1.
For the selected QI the specifications should be written (Figure 1), including a definition, in- and exclusion criteria, data sources and data collection specifications. Based on this information, the selected QI should be piloted in order to detect potential problems and to modify the QI set accordingly. Finally, the QI system should be disseminated, implemented and evaluated.
An important aim of the present project is to identify QI for the management of rectal cancer and to construct a QI set for the quality assessment of rectal cancer care in Belgium (chapter 2). Furthermore, the feasibility of measuring the selected QI will be tested on 2 different databases: the prospective PROCARE database and an administrative database (chapter 3). This feasibility test will allow a fine-tuning and/or adaptation of the selected QI. Consequently, it cannot be the intention of the authors to measure the quality already. Therefore, no judgement about quality or target values will be provided in this report or can be deduced from this report.
To construct and pilot test the QI set, the following questions will be addressed:
1. Which of the selected quality indicators can be measured using a) the prospective PROCARE database and b) administrative databases?
2. If the quality indicators are measurable, at what level are they (national, hospital, individual care provider)?
3. Which data are needed at the minimum to measure and interpret these quality indicators? Can the PROCARE database and the administrative databases complement each other?
4. How will results of the quality measurement be presented?
In addition, an attempt will be made to project the results of this exercise to other cancers, in order to have a generic methodology to measure oncologic quality indicators in Belgium.
Finally, an overview will be given of international experiences with measuring the quality of rectal cancer care (chapter 4). This will allow a judgment on how the present project can connect to similar international projects.
6 PROCARE – phase 2 KCE reports 81
Figure 1. Conceptual flowchart for the set-up of a quality indicator system in oncology.
KCE Reports 81 PROCARE – phase 2 7
2 DEVELOPMENT OF A QUALITY INDICATOR SET
2.1 METHODOLOGY
2.1.1 Literature search
During the pre-assessment of the literature, an interesting good-quality systematic review of colorectal cancer quality indicators was identified [3] . Although only studies with US data were included in this review, it was decided to take this study as a starting point, and to perform an update of the review, expanding the inclusion criteria to studies with non-US data.
The Medline database was searched using the following combination of MeSH terms: ("Colorectal Neoplasms" [MeSH] or "Rectal Neoplasms" [MeSH] or "Colonic Neoplasms" [MeSH]) AND ("Quality of Health Care" [MeSH] OR "Patient Care Management" [MeSH] OR "Organization and Administration" [MeSH] OR "Health Care Quality, Access, and Evaluation" [MeSH] OR "Quality Indicators, Health Care" [MeSH]). The Cochrane Library was also searched using the free text words rectal and indicator. The search was done in January 2007 by 2 independent researchers (LVE and JV), and limited to papers published from 2005 on. Studies were only considered if they concerned the description of a quality indicator set for (colo)rectal cancer. Papers were excluded if they were already included in the study of Patwardhan et al. The search was limited to humans and to papers published in English, French, German or Dutch.
The websites of the following organizations were also searched: the Agency for Healthcare Research and Quality (http://www.ahrq.gov/), the Joint Commission (http://www.jointcommission.org/), the Clinical Indicators Support Team (http://www.indicators.scot.nhs.uk/), and the National Health Service (http://www.nhs.uk/). The CPGs that were selected for the development of the PROCARE guideline were also evaluated for included QI [1]. Finally, the National Quality Measures Clearinghouse was also searched (http://www.qualitymeasures.ahrq.gov/).
2.1.2 Definition of quality levels
Three quality levels were defined. The first level covers the QI that are affected by all treatment phases and that were considered essential for general quality measurement. Second level QI were also considered essential for general quality measurement, but are affected by one specific treatment phase (e.g. surgery). Finally, third level QI were defined as those QI that deserved attention from individual centres if possible quality problems were identified through a level 1 or 2 QI. In other words, level 3 QI are required to interpret the results of level 1 and 2 QI.
2.1.3 Selection process of quality indicators
The quality indicators identified through the literature search were summarized in an Excel-table per subdiscipline. For each quality indicator, an assessment was made by a small working group, taking into account the following items:
• relevance
• level of evidence
• related PROCARE recommendation(s)
• quality level
Only level 1 and 2 QI were considered for inclusion in the final quality indicator set. QI were excluded if they did not specifically address rectal cancer care. Importantly, availability of data to allow measurement of the selected QI was not taken into account during the selection process.
The final selection was discussed by a multidisciplinary team. In case important areas were not covered by a QI from the literature, this multidisciplinary team proposed additional QI based on key elements from the PROCARE guideline [1].
8 PROCARE – phase 2 KCE reports 81
2.2 RESULTS
2.2.1 Search for and selection of quality indicators
The Medline search yielded 4421 articles of which 4 were selected based on title and abstract [4-7]. However, the study of Prosnitz et al. [7] was excluded because it was part of the study of Patwardhan et al. [3]. No relevant studies were found in the Cochrane Library. Of the consulted websites, only the Clinical Indicators Support Team included QI on rectal cancer care (http://www.indicators.scot.nhs.uk/). No QI were identified in the CPGs that were selected for the development of the PROCARE guideline [1].
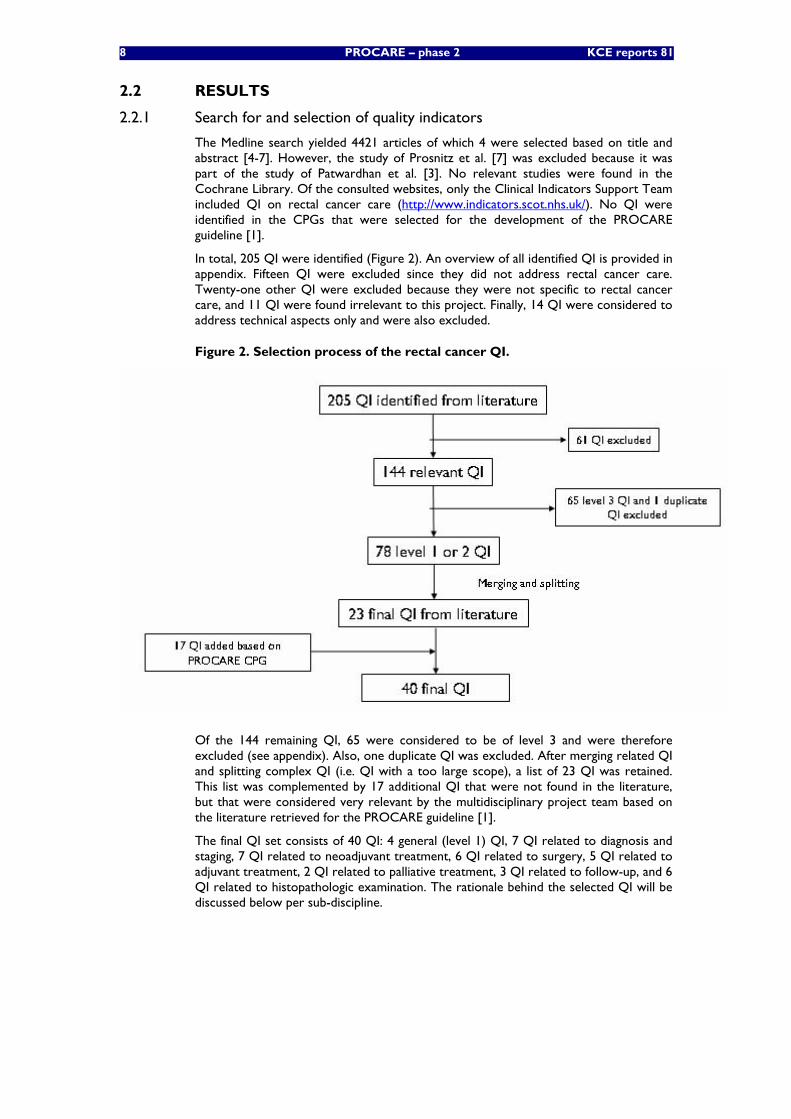
In total, 205 QI were identified (Figure 2). An overview of all identified QI is provided in appendix. Fifteen QI were excluded since they did not address rectal cancer care. Twenty-one other QI were excluded because they were not specific to rectal cancer care, and 11 QI were found irrelevant to this project. Finally, 14 QI were considered to address technical aspects only and were also excluded.
Figure 2. Selection process of the rectal cancer QI.
Of the 144 remaining QI, 65 were considered to be of level 3 and were therefore excluded (see appendix). Also, one duplicate QI was excluded. After merging related QI and splitting complex QI (i.e. QI with a too large scope), a list of 23 QI was retained. This list was complemented by 17 additional QI that were not found in the literature, but that were considered very relevant by the multidisciplinary project team based on the literature retrieved for the PROCARE guideline [1].
The final QI set consists of 40 QI: 4 general (level 1) QI, 7 QI related to diagnosis and staging, 7 QI related to neoadjuvant treatment, 6 QI related to surgery, 5 QI related to adjuvant treatment, 2 QI related to palliative treatment, 3 QI related to follow-up, and 6 QI related to histopathologic examination. The rationale behind the selected QI will be discussed below per sub-discipline.
KCE Reports 81 PROCARE – phase 2 9
2.2.2 Overview of selected quality indicators
2.2.2.1 General quality indicators
Four general QI were selected:
• Overall 5-year survival by stage (QI 1111) (high level of evidence)
• Disease-specific 5-year survival by stage (QI 1112) (high level of evidence)
• Proportion of patients with local recurrence (QI 1113) (high level of evidence)
• Proportion of patients discussed at a multidisciplinary team meeting (QI 1114) (low level of evidence)
Both overall and disease-specific 5-year survival by stage and the local recurrence rate were identified in the literature [3, 4]. Another QI on survival (relative 3-year survival) was identified on the website of the Clinical Indicator Support Team (CIST) (http://www.indicators.scot.nhs.uk/). Both survival and local recurrence rate are affected by most processes of rectal cancer care [1]. In fact, several studies have concluded that using combined modalities and total mesorectal excision (TME), local recurrence remains acceptable (< 10%), with overall survival of 64% compared with conventional surgical techniques, where local failure rate was 27% [8].
Disease-free survival (DFS) is frequently used as an outcome in clinical studies. In our opinion, DFS is sufficiently covered by using disease-specific 5-year survival and local recurrence rate as QI.
Several QI were identified referring to the importance of a multidisciplinary approach in the work-up of rectal cancer [3-6]. Several recommendations in the PROCARE CPG stress the need of such a multidisciplinary approach, although the supporting evidence is low [1]. In Belgium, a specific nomenclature code is available for a multidisciplinary oncologic consultation (see below). It was therefore decided to merge all identified QI into 1 QI referring to this multidisciplinary consultation.
2.2.2.2 Quality indicators related to diagnosis and staging
Seven QI related to diagnosis and staging were selected:
• Proportion of patients with a documented distance from the anal verge (QI 1211) (low level of evidence)
• Proportion of patients in whom a CT of the liver and RX or CT of the thorax was performed before any treatment (QI 1212) (moderate level of evidence)
• Proportion of patients in whom a CEA was performed before any treatment (QI 1213) (moderate level of evidence)
• Proportion of patients undergoing elective surgery that had preoperative complete large bowel-imaging (QI 1214) (low level of evidence)
• Proportion of patients in whom a TRUS and pelvic CT and/or pelvic MRI was performed before any treatment (QI 1215) (moderate level of evidence)
• Proportion of patients with cStage II-III that have a reported cCRM (QI 1216) (moderate level of evidence)
• Time between first histopathologic diagnosis and first treatment (QI 1217) (low level of evidence)
The distance from the lower edge of the tumour to the anal verge is an important clinical parameter, since it co-determines the indication for neoadjuvant treatment, the type of surgery and outcome [1]. This QI was identified through the literature search [5, 6], and – although supported by low-quality evidence – was deemed very relevant by the project team.
The aim of imaging techniques such as CT, MRI and PET is to detect hepatic and extra-hepatic metastatic disease [1].
10 PROCARE – phase 2 KCE reports 81
A combined thorax and abdomen/pelvis spiral contrast-enhanced CT is recommended for routine use. A QI measuring this standard was identified through the literature search [4].
Pre-treatment CEA levels have been related to cancer stage and survival independent of pTN stage in nonmetastatic colorectal cancer [1]. Therefore, the serum CEA level should be determined in all patients before the start of any treatment. This QI was also identified through the literature search [6].
It is recommended that patients with rectal cancer undergo a total colonoscopy with resection of concomitant polyps if possible [1]. However, if total colonoscopy is judged to be too risky or if colonoscopy is refused after informed consent, a high-quality double contrast barium enema should be performed. Numerous QI related to this recommendation were identified in the literature [3-6].
Patients with rectal cancer should have locoregional cTN staging. TRUS and high-resolution MRI (or CT) play an important role in the staging of rectal cancer [1]. Numerous related QI were identified in the literature [4-6]. An important outcome of the preoperative staging is the circumferential resection margin (CRM), which is a predictor of local and distant recurrence as well as survival. The CRM status can be reliably predicted by preoperative high-resolution MRI [1]. No related QI was identified in the literature. Therefore, the PROCARE recommendations served as a basis for the formulation of an additional QI.
According to the guidelines of the Association of Coloproctology of Great Britain and Ireland (ACPGBI), the interval between making a diagnosis of cancer and the start of treatment should be less than 4 weeks [1, 9]. One related QI was identified in the literature [6].
2.2.2.3 Quality indicators related to neoadjuvant treatment
Seven QI on neoadjuvant treatment were included:
• Proportion of cStage II-III patients that received a short course of neoadjuvant pelvic RT (QI 1221) (high level of evidence)
• Proportion of cStage II-III patients that received a long course of neoadjuvant pelvic RT (QI 1222) (high level of evidence)
• Proportion of cStage II-III patients that received neoadjuvant chemoradiation with a regimen containing 5-FU (QI 1223) (high level of evidence)
• Proportion of cStage II-III patients treated with neoadjuvant 5-FU based chemoradiation, that received a continuous infusion of 5-FU (QI 1224) (low level of evidence)
• Proportion of cStage II-III patients treated with a long course of preoperative pelvic RT or chemoradiation, that completed this neoadjuvant treatment within the planned timing (QI 1225) (high level of evidence)
• Proportion of cStage II-III patients treated with a long course of preoperative pelvic RT or chemoradiation, that was operated 6 to 8 weeks after completion of the (chemo)radiation (QI 1226) (high level of evidence).
• Rate of acute grade 4 radio(chemo)therapy-related complications (QI 1227) (moderate level of evidence)
Although many QI on chemotherapy and radiotherapy were identified in the literature [3, 5, 6], none of these specifically addressed neoadjuvant treatment. Therefore, the PROCARE recommendations on neoadjuvant treatment were used as a basis to formulate additional QI [1]. We refer to these recommendations for the background of the selected QI (recommendation 21 – 31).
KCE Reports 81 PROCARE – phase 2 11
2.2.2.4 Quality indicators related to surgery
Six QI related to surgery were selected:
• Proportion of R0 resections (QI 1231) (moderate level of evidence)
• Proportion of APR and Hartmann’s procedures (QI1232a) (moderate level of evidence)
• Proportion of patients with stoma 1 year after sphincter-sparing surgery (QI 1232b) (high level of evidence)
• Rate of patients with major leakage of the anastomosis after sphincter-sparing surgery (QI 1233) (high level of evidence)
• Inpatient or 30-day mortality (QI 1234) (high level of evidence)
• Rate of intra-operative rectal perforation (QI 1235) (moderate level of evidence)
Curative resection rate is used very often as a QI [3, 4, 6]. Indeed, the main emphasis of surgery is to obtain clear surgical margins yielding a curative R0 resection (no residual tumour) [1].
The proportion of APR and Hartmann operations is considered a very important QI (being an outcome of importance to patients) and was identified in the AHRQ report [3]. Surgeons should aim, wherever possible and desirable, to preserve the anal sphincter [1].
QI 1232b and QI 1233 [4] are related in that a temporary defunctioning stoma should be considered each time the anastomosis is at risk for leakage after sphincter-sparing surgery [1]. Results of a recent RCT even suggest that a derivative stoma should be constructed routinely. In general, a temporary stoma is closed within 1 year after surgery, i.e. after the end of adjuvant chemotherapy.
Inpatient or 30-day mortality is an outcome that is affected by many processes in the perioperative period [1]. This QI was identified in 2 studies [3, 4]. Importantly, for the interpretation of this QI several factors (stage, age, comorbidity, mode of surgery i.e. elective/scheduled vs. urgent/emergency) need to be taken into account for risk adjustment [3].
One QI on intra-operative rectal perforation was added based on recommendation 42 of the PROCARE CPG [1]. Intra-operative perforation increases local recurrence and decreases survival. It occurs more frequently during abdominoperineal rectum excision as compared with anterior resection [1].
2.2.2.5 Quality indicators related to adjuvant treatment
Five QI on adjuvant treatment were selected:
• Proportion of p-ypStage III patients with R0 resection that received adjuvant chemotherapy (QI 1241) (moderate level of evidence)
• Proportion of pStage II-III patients with R0 resection that received adjuvant radiotherapy or chemoradiotherapy (QI 1242) (moderate level of evidence)
• Proportion of p-ypStage II-III patients with R0 resection that started adjuvant chemotherapy within 3 months after surgical resection (QI 1243) (expert opinion)
• Proportion of p-ypStage II-III patients with R0 resection treated with adjuvant chemo(radio)therapy, that received 5-FU based chemotherapy (QI 1244) (high level of evidence)
• Rate of acute grade 4 radio- or chemotherapy-related complications (QI 1245) (expert opinion)
Several QI were identified in the literature [3, 5]. The first two selected QI (QI 1241 & 1242) provide an overview of the relative proportion of the 3 possible adjuvant treatment modalities (chemotherapy, radiotherapy and chemoradiotherapy). The supporting evidence and treatment algorithm can be found in the PROCARE CPG [1].
12 PROCARE – phase 2 KCE reports 81
One QI was found addressing the need to start adjuvant chemotherapy within 8 weeks of surgical resection [5]. The rationale is that adjuvant therapy is able to treat micrometastatic disease at a time when tumour burden is at a minimum. This QI was selected, but adapted to the PROCARE recommendation of administering adjuvant chemotherapy within 3 months of surgery [1].
QI 1244 and 1245 were not found in the literature, but were added to the final QI selection based on the PROCARE recommendations [1]. The rationale behind QI 1244 is that 5-FU given by IV injection for 5 days every 4 weeks for 6 cycles is the regimen for which the most evidence is available and that is clearly effective in prolonging survival in patients with stage III [1]. Treatment with chemotherapy is associated with an acceptable complication rate. However, complication rate is dose-dependent and can be artificially kept low by lowering the dose.
2.2.2.6 Quality indicators related to palliative care
Two QI on palliative care were selected:
• Rate of cStage IV patients receiving chemotherapy (QI 1251) (high level of evidence
• Rate of acute grade 4 chemotherapy-related complications in stage IV patients (QI 1252) (expert opinion)
Two QI were identified in the literature addressing palliative chemotherapy [3]. The aim of palliative systemic therapy is to improve survival and quality of live in patients with advanced rectal cancer [1].
No QI was identified in the literature addressing chemotherapy-related complications. However, this was considered a very important topic related to many recommendations of the PROCARE guideline [1]. It was therefore added to the final QI selection.
2.2.2.7 Quality indicators related to follow-up
Three QI on follow-up were selected:
• Rate of curatively treated patients that received a total colonoscopy within 1 year after resection (QI 1261) (moderate level of evidence)
• Rate of patients undergoing regular follow-up (according to the PROCARE recommendations) (QI 1262) (moderate level of evidence)
• Late grade 4 complications of radiotherapy or chemoradiation (QI 1263) (expert opinion)
For curatively treated patients it is recommended to perform a colonoscopy 1 year after the resection [1]. Several related QI were identified in the literature [3], and merged into 1 final QI.
The aim of regular follow-up is to detect local recurrence and/or metastasis at an early potentially (surgically) curable stage, and to detect new primary tumours [1]. Patients that are fit for further treatment in case of recurrent disease should be offered intensive follow-up. However, individual randomised trials show no advantage of follow-up in terms of survival. Meta-analyses indicate that follow-up can offer survival benefit by means of earlier detection of metastatic or recurrent disease. There is some evidence that intensive follow-up does improve long-term survival for stage II and III colorectal cancer [1]. No related QI were identified in the literature, but based on the PROCARE recommendations this QI was added to the final selection.
QI addressing late (chemo)radiotherapy-related complications were also not found in the literature, but was added to the final selection in view of the relation with several PROCARE recommendations [1].
KCE Reports 81 PROCARE – phase 2 13
2.2.2.8 Quality indicators related to histopathologic examination
Six QI related to histopathologic were selected:
• Use of the pathology report sheet (QI 1271) (expert opinion)
• Quality of TME assessed according to Quirke and mentioned in the pathology report (QI 1272) (low level of evidence)
• Distal tumour-free margin mentioned in the pathology report (QI 1273) (low level of evidence)
• Number of lymph nodes examined (QI 1274) (low level of evidence)
• (y)pCRM mentioned in mm in the pathology report (QI 1275) (low level of evidence)
• Tumour regression grade mentioned in the pathology report (after neoadjuvant treatment) (QI 1276) (low level of evidence)
For most of the selected QI on pathology, no QI were identified in the literature. The final selection is therefore primarily based on the PROCARE recommendations [1].
Only for QI 1274, several QI were found in the literature [5, 6]. The pathologist should find as many lymph nodes as possible. The median number found is an indication of the quality of the pathological examination. Ideally, it should exceed 12 lymph nodes [1].
During the first external expert meeting of this project, it was suggested to use the mentioning of the (y)pTN in the pathology report as a QI. However, to our opinion this is not a QI, since it has no direct relation with the quality of care. Nevertheless, it is essential information for stage grouping and adjustment, and resultantly for the calculation of many selected QI. Therefore, this information will always be reported along the results of the QI where relevant.
2.3 DISCUSSION
In total, 40 QI were selected covering all aspects of the management of rectal cancer and representing a balanced mix of process and outcome indicators. The selection of these QI was based on a literature search and completed with QI based on the PROCARE recommendations [1]. No formalised procedure was used to select the QI, but on different occasions the selection was discussed with a multidisciplinary expert panel. Above this, the selection was approved by the PROCARE board and an external expert panel. The final selection is therefore considered very relevant.
Several selected (mainly outcome) QI are also relevant for other cancers, such as 5-year survival, local recurrence rate, multidisciplinary discussion, time to treatment, rate of (late) grade 4 chemotherapy and/or radiotherapy-related complications, proportion of R0 resections, and the inpatient or 30-day mortality. The routine registration of these parameters for all cancers would therefore be of high relevance for the measurement of the quality of care in oncology.
The final QI selection represents the current state of the art according to the PROCARE recommendations [1]. In view of the changing evidence, this QI set will probably need an update in about 5 years.
14 PROCARE – phase 2 KCE reports 81
3 FEASIBILITY STUDY OF QUALITY INDICATOR MEASUREMENT
3.1 METHODOLOGY
3.1.1 Definition of selected quality indicators
For each selected quality indicator, numerator and denominator (and their respective in- and exclusion criteria) were defined by a small working group (LVE, JV, DDC, FP) and afterwards discussed by the multidisciplinary team.
3.1.2 Source databases
3.1.2.1 Prospective PROCARE data
The PROCARE registration form was constructed in consensus by a multidisciplinary group based on the data entry for the Dutch TME trial (van de Velde C, personal communication) and on data from the literature considered to be relevant for quality assessment and assurance. The form has undergone two revisions and currently the third version is being prepared for data collection based on the evidence as presented in the PROCARE guidelines [1]. Participating centres prospectively submit their data on a voluntary basis to the Belgian Cancer Registry, where they are put into an Access Database. A data manager checks the data on quality and completeness, and purchases correct data if necessary.
Active input into the database was started in January 2006. Currently (April 2008), data are available from more than 1400 rectal cancer patients. Sixty-one centres (with 105 surgeons) are participating at present. However, for the present study, inclusion was stopped on December 4th 2007. At that time, 1071 patients with rectal cancer were included, involving 56 centres and 98 surgeons.
3.1.2.2 Coupled administrative data
General description of the used databases
For the present study, data from the following 3 administrative databases were coupled:
1. The Technical Cell (TC) of the RIZIV/INAMI and Ministry of Health, Food Chain Safety and Environment (MOH) yearly composes a database of coupled hospital registration data. These data are based on a) the Minimal Clinical Data (MCD) collected in the hospitals by the MOH for each hospital stay (including day care), and b) the Minimal Financial Data (MFD) collected by the RIZIV/INAMI in the Sickness Funds. This coupled database contains clinical data and facturation data per hospital stay. For the present study these data are available from July 2001 – December 2004.
2. The Belgian Cancer Registry (BCR) has a database containing records on incident rectal cancer. Tumour data consist of the ICD-O-3 and ICD-10 code, TNM classification (cStage and pStage), incidence date (i.e. date of first diagnosis), received and planned treatment. For each cancer patient, these data are registered in a continuous longitudinal way. Moreover, this database is coupled with administrative data, making it possible to retrieve the date of decease (before December 31st 2006).
Patients are identified based on their unique identification number of social security (identificatienummer sociale zekerheid, INSZ) and a specific patient pseudonym (Hs), which is obtained by irreversible hashing of the full name, birth date and sex by all data providers of the BCR. For the present study these data are available from 2000 – 2004 (the year 2004 was only partially covered at the moment of data closure).
3. The Health Insurance Companies (HIC) possess nomenclature data and individual facturation data of all their members. They also have data on social security and date of death (if applicable). All these data can be obtained through the Common Sickness Funds Agency (IMA). For the present study, these data are available from 2000 – 2004.
KCE Reports 81 PROCARE – phase 2 15
Selection criteria for data extraction
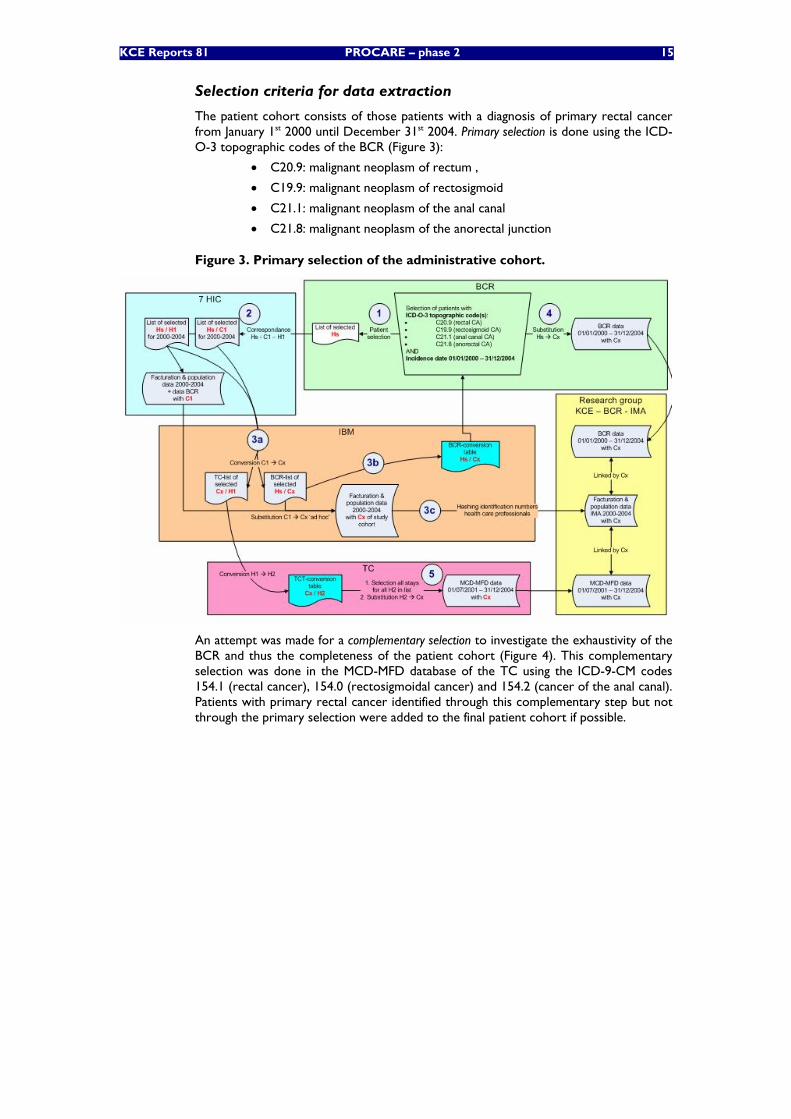
The patient cohort consists of those patients with a diagnosis of primary rectal cancer from January 1st 2000 until December 31st 2004. Primary selection is done using the ICD-O-3 topographic codes of the BCR (Figure 3):
• C20.9: malignant neoplasm of rectum ,
• C19.9: malignant neoplasm of rectosigmoid
• C21.1: malignant neoplasm of the anal canal
• C21.8: malignant neoplasm of the anorectal junction
Figure 3. Primary selection of the administrative cohort.
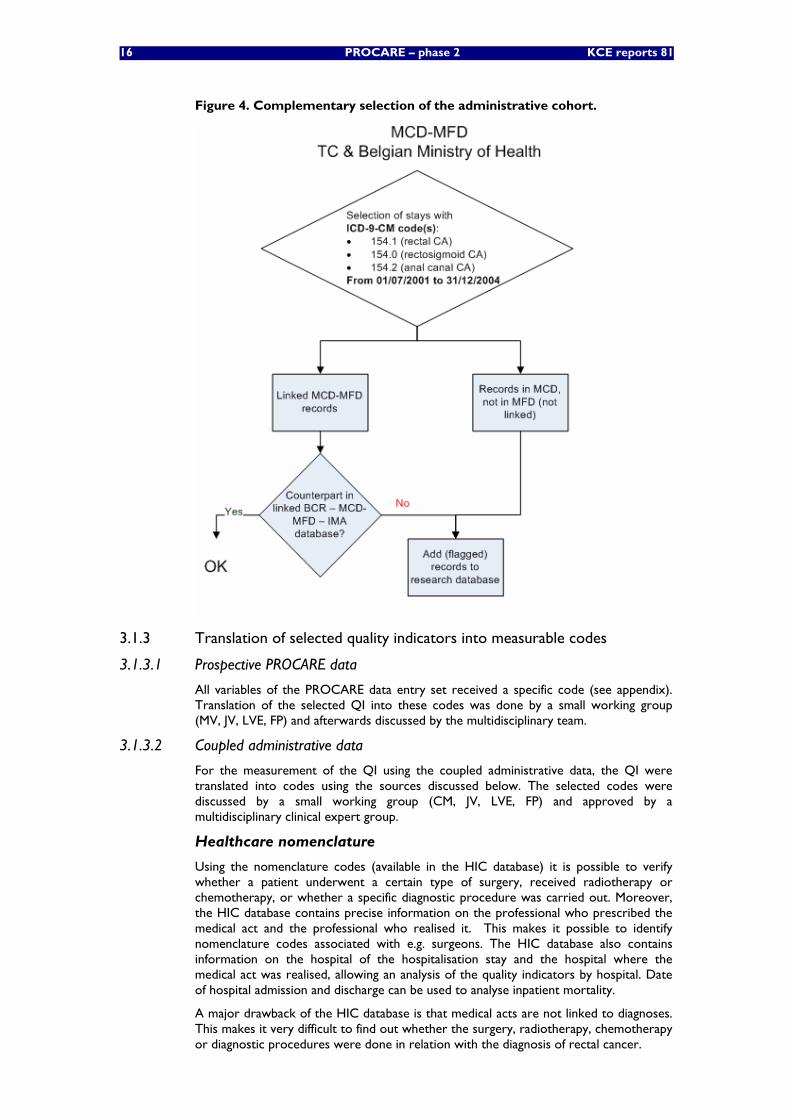
An attempt was made for a complementary selection to investigate the exhaustivity of the BCR and thus the completeness of the patient cohort (Figure 4). This complementary selection was done in the MCD-MFD database of the TC using the ICD-9-CM codes 154.1 (rectal cancer), 154.0 (rectosigmoidal cancer) and 154.2 (cancer of the anal canal). Patients with primary rectal cancer identified through this complementary step but not through the primary selection were added to the final patient cohort if possible.
16 PROCARE – phase 2 KCE reports 81
Figure 4. Complementary selection of the administrative cohort.
3.1.3 Translation of selected quality indicators into measurable codes
3.1.3.1 Prospective PROCARE data
All variables of the PROCARE data entry set received a specific code (see appendix). Translation of the selected QI into these codes was done by a small working group (MV, JV, LVE, FP) and afterwards discussed by the multidisciplinary team.
3.1.3.2 Coupled administrative data
For the measurement of the QI using the coupled administrative data, the QI were translated into codes using the sources discussed below. The selected codes were discussed by a small working group (CM, JV, LVE, FP) and approved by a multidisciplinary clinical expert group.
Healthcare nomenclature
Using the nomenclature codes (available in the HIC database) it is possible to verify whether a patient underwent a certain type of surgery, received radiotherapy or chemotherapy, or whether a specific diagnostic procedure was carried out. Moreover, the HIC database contains precise information on the professional who prescribed the medical act and the professional who realised it. This makes it possible to identify nomenclature codes associated with e.g. surgeons. The HIC database also contains information on the hospital of the hospitalisation stay and the hospital where the medical act was realised, allowing an analysis of the quality indicators by hospital. Date of hospital admission and discharge can be used to analyse inpatient mortality.
A major drawback of the HIC database is that medical acts are not linked to diagnoses. This makes it very difficult to find out whether the surgery, radiotherapy, chemotherapy or diagnostic procedures were done in relation with the diagnosis of rectal cancer.
KCE Reports 81 PROCARE – phase 2 17
On the other hand, as the date of the medical act is recorded, it is possible to determine whether the intervention took place in a certain time interval close to the diagnosis of rectal cancer.
Another drawback of the database is that it only concerns medical acts that are reimbursed. No information is available on treatments received as part of a clinical trial.
ICD-9-CM
For the present study the version of ICD-9-CM was used according to the recommendations of the ‘FOD Volksgezondheid, Veiligheid van de Voedselketen, Leefmilieu’ (‘SPF Santé Publique, Sécurité de la Chaîne alimentaire et Environnement’). For each intervention or diagnosis, all relevant ICD-9-CM codes were identified.
The registration of procedures and diagnoses necessary to assign a patient to a homogenous patient group is obligatory in the Technical Cell database. For other procedures and diagnoses registration is free. Importantly, in this database each procedure is linked to a diagnosis and a code reflecting the emergency. This is a major advantage in comparison to the HIC database.
Belgian Cancer registry
See above.
ATC classification
In the HIC database, information is available on prescribed medication (Farmanet). Each drug is linked to a specific CNK code (code national – nationale kode), which can be translated in an ATC code (http://www.whocc.no/atcddd/).
3.1.4 Per-centre-analysis
For each measurable QI the result was computed per centre. However, this per-centre-analysis was done without risk-adjustment, since it was not the intention of the authors to judge the quality already. The centre where the surgery was performed was considered the unit of analysis. If no surgery was performed, the centre where the radiotherapy or chemotherapy was performed was selected.
In the PROCARE database, this information was readily available for each individual patient. For the administrative database, an anonymous code was available in the HIC database for each individual centre. However, different codes could correspond to the same centre. Therefore, a correspondence table was prepared by the KCE, enabling the identification of unique centres. Moreover, it was possible to identify whether the anonymous code corresponded to a centre participating at the PROCARE project.
Importantly, since no risk-adjustment was performed, the results of the per-centre-analyses in this report cannot be used to position centres to one another. Therefore, in order to avoid an inappropriate quality judgement, it was also decided to present graphs for only some examples.
3.1.5 Statistics
Statistical analysis was done using SAS/Base Version 9.1 and SAS EG 4 (SAS Institute, Cary, NC, USA). A chi-square test was used to compare the age and cStage distribution between the PROCARE database and the administrative database.
For each measurable QI a weighted and unweighted mean were calculated. The weighted mean corresponds to the QI result for the cohort as a whole, while the unweighted mean corresponds to the average of the QI results of each centre. The 95% confidence interval (CI) was computed for the unweighted mean using a normal
18 PROCARE – phase 2 KCE reports 81
distribution ( ⎥⎦
⎤⎢⎣
⎡ ⋅+⋅−=Nsa
NsaCI 2;2%95 with a the unweighted mean,
1)(
12
−
−= ∑ =
Nax
sN
i i, and N the number of centres). The 95%CI was computed for
the weighted mean using a binomial distribution
( ⎥⎦
⎤⎢⎣
⎡ −⋅⋅+
−⋅⋅−=
Nppp
NpppCI )1(2;)1(2%95 with p the weighted
mean).
3.1.6 Aggregation of the results
In order to examine the ability of the set of QI to provide a global impression on the quality of care for rectal cancer patients, the QI results were aggregated for the 2 databases separately using two different methods.
First, a global mean of the values of all measurable QI was computed per centre. For each centre, only the values of the QI with a denominator of 10 or more were taken into account. A complementary analysis was performed with the values of those QI with a denominator of 20 or more. For the presentation of the results, centres with less than 15 measurable QI for the prospective database or less than 6 measurable QI for the administrative database were not selected. These cut-off values relate to the overall number of measurable QI for each database (30 QI for the prospective database, 10 QI for the administrative database; see below).
To allow a calculation of the global mean, all QI needed to be reported in the same way (i.e. a proportion) and needed to point in the same direction. For most QI a high proportion reflects good quality of care. However, for some QI a low proportion is desired. These QI were ‘redirected’ by calculating the complement, i.e. 1 – the QI value. One QI (time between first histopathologic diagnosis and first treatment) is reported in days, and was transformed in the proportion of patients for whom the first treatment started within 28 days after the first histopathologic diagnosis.
A second method consisted of the calculation of a ‘mean corrected rank’ per centre. For this calculation, the same selection criteria were applied as above. Only centres with at least 15 measurable QI for the prospective database or 6 measurable QI for the administrative database using a minimum of 10 (20) patients in the denominator were taken into account. For each QI, a rank was assigned to each centre using the proc rank procedure in SAS (rank 1 for the best centre). The lowest rank was assigned in case of ties. A corrected rank per centre was obtained by dividing the rank by the number of centres for which the QI was measurable. Finally, for each centre the mean of all corrected ranks was calculated.
A correlation analysis was done to verify whether the PROCARE centres were ranked in the same way using the prospective and the administrative database. A Spearman’s rank correlation coefficient was calculated on the mean corrected ranks for the centres with at least 10 patients in the denominator for at least 15 QI in the prospective database and at least 6 QI in the administrative database. The link between the anonymous codes in the prospective and administrative databases for the centres participating at the PROCARE project was provided by the KCE. The null hypothesis of the Spearman’s rank correlation test corresponded to no association between the mean corrected ranks. As we were only interested to know whether the correlation between the mean corrected ranks was positive, the test was one-tailed with alpha = 0.05. The Spearman’s rank correlation coefficient and p-value were calculated using the correlation procedure (proc corr) in SAS.
KCE Reports 81 PROCARE – phase 2 19
3.2 RESULTS
3.2.1 Description of study cohorts
3.2.1.1 Prospective PROCARE cohort
For the present study, patient inclusion was stopped on December 4th 2007. At that time, 1071 patients with rectal cancer were included, involving 56 centres and 98 surgeons. More then 60% of these patients are males, and about 75% is 60 years or older (Table 1). Mean age is 67 years (SD 12).
The number of included patients per hospital ranges from 1 to 87, with a mean of 19 patients per hospital (SD 16). Twenty-one centres included 20 patients or more.
For about one third of patients the clinical stage is unknown (Table 2). The main reason is insufficient information on the cT and/or cN to calculate the clinical stage. Of the patients with a known clinical stage, 49% has cStage III.
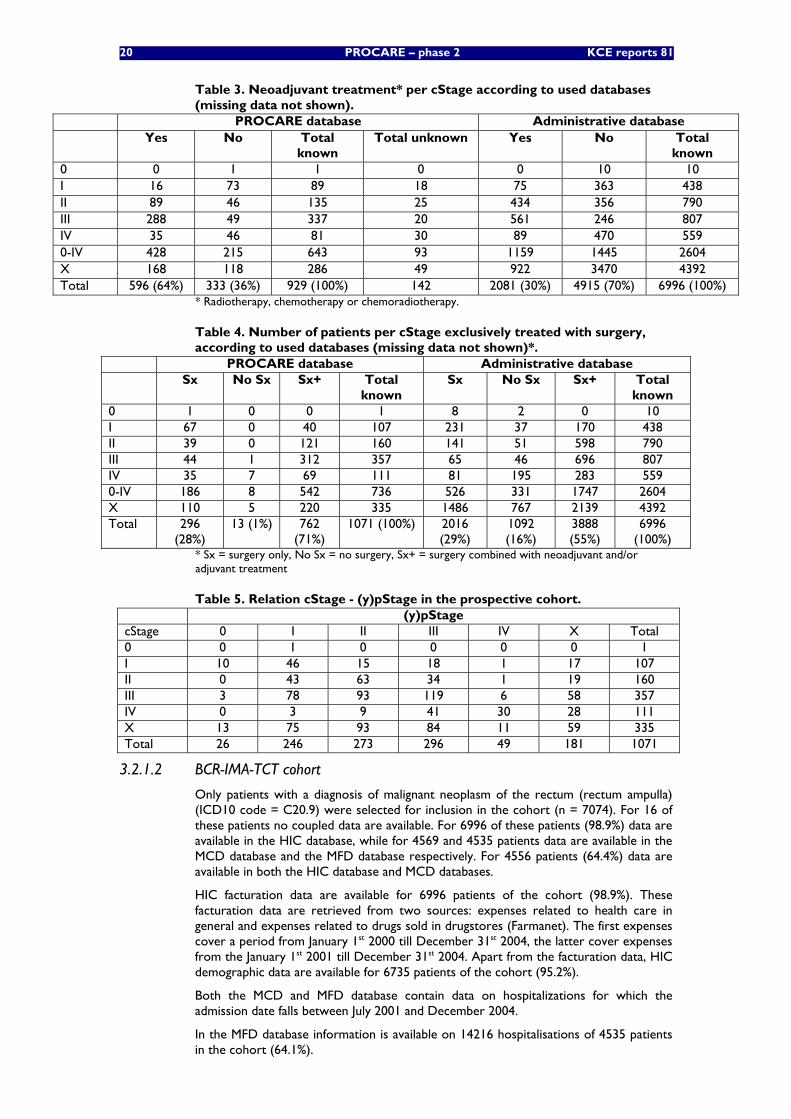
About 64% of all patients received neoadjuvant treatment (Table 3). More specifically, 66% of the cStage II patients and 85% of the cStage III patients received neoadjuvant treatment. Only 1% of the patients was not treated with surgery, while 28% was exclusively treated with surgery (Table 4). Table 5 clearly shows a shift towards lower stages from cStage to (y)pStage. Importantly, two different elements are covered by the (y)pStage. First, in patients not treated with neoadjuvant treatment (and more specifically those patients not treated with a long course of neoadjuvant radiotherapy), the shift from cStage to pStage could represent a wrong clinical staging. On the other hand, in patients treated with neoadjuvant treatment (mainly those patients treated with a long course of neoadjuvant radiotherapy), a shift from a given cStage to a lower ypStage also represents a downstaging.
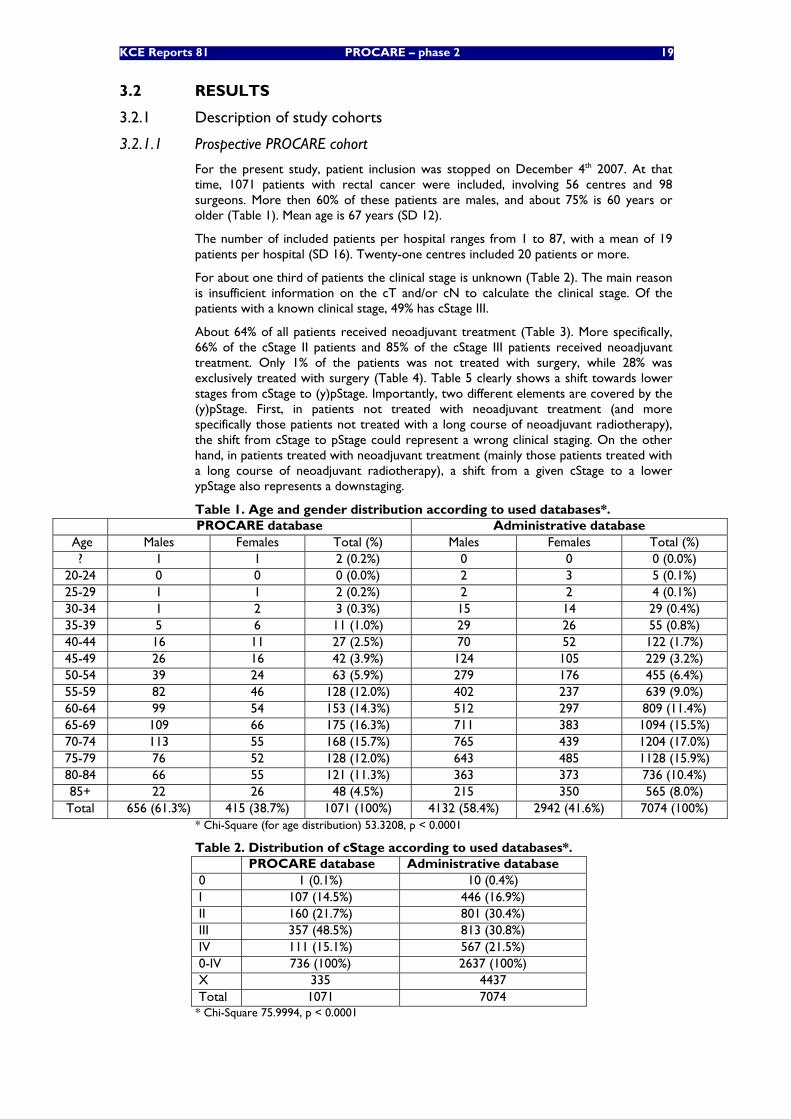
Table 1. Age and gender distribution according to used databases*. PROCARE database Administrative database
Age Males Females Total (%) Males Females Total (%) ? 1 1 2 (0.2%) 0 0 0 (0.0%)
20-24 0 0 0 (0.0%) 2 3 5 (0.1%) 25-29 1 1 2 (0.2%) 2 2 4 (0.1%) 30-34 1 2 3 (0.3%) 15 14 29 (0.4%) 35-39 5 6 11 (1.0%) 29 26 55 (0.8%) 40-44 16 11 27 (2.5%) 70 52 122 (1.7%) 45-49 26 16 42 (3.9%) 124 105 229 (3.2%) 50-54 39 24 63 (5.9%) 279 176 455 (6.4%) 55-59 82 46 128 (12.0%) 402 237 639 (9.0%) 60-64 99 54 153 (14.3%) 512 297 809 (11.4%) 65-69 109 66 175 (16.3%) 711 383 1094 (15.5%) 70-74 113 55 168 (15.7%) 765 439 1204 (17.0%) 75-79 76 52 128 (12.0%) 643 485 1128 (15.9%) 80-84 66 55 121 (11.3%) 363 373 736 (10.4%) 85+ 22 26 48 (4.5%) 215 350 565 (8.0%) Total 656 (61.3%) 415 (38.7%) 1071 (100%) 4132 (58.4%) 2942 (41.6%) 7074 (100%)
* Chi-Square (for age distribution) 53.3208, p < 0.0001
Table 2. Distribution of cStage according to used databases*. PROCARE database Administrative database 0 1 (0.1%) 10 (0.4%) I 107 (14.5%) 446 (16.9%) II 160 (21.7%) 801 (30.4%) III 357 (48.5%) 813 (30.8%) IV 111 (15.1%) 567 (21.5%) 0-IV 736 (100%) 2637 (100%) X 335 4437 Total 1071 7074
* Chi-Square 75.9994, p < 0.0001
20 PROCARE – phase 2 KCE reports 81
Table 3. Neoadjuvant treatment* per cStage according to used databases (missing data not shown).
PROCARE database Administrative database Yes No Total
known Total unknown Yes No Total
known 0 0 1 1 0 0 10 10 I 16 73 89 18 75 363 438 II 89 46 135 25 434 356 790 III 288 49 337 20 561 246 807 IV 35 46 81 30 89 470 559 0-IV 428 215 643 93 1159 1445 2604 X 168 118 286 49 922 3470 4392 Total 596 (64%) 333 (36%) 929 (100%) 142 2081 (30%) 4915 (70%) 6996 (100%)
* Radiotherapy, chemotherapy or chemoradiotherapy.
Table 4. Number of patients per cStage exclusively treated with surgery, according to used databases (missing data not shown)*.
PROCARE database Administrative database Sx No Sx Sx+ Total
known Sx No Sx Sx+ Total
known 0 1 0 0 1 8 2 0 10 I 67 0 40 107 231 37 170 438 II 39 0 121 160 141 51 598 790 III 44 1 312 357 65 46 696 807 IV 35 7 69 111 81 195 283 559 0-IV 186 8 542 736 526 331 1747 2604 X 110 5 220 335 1486 767 2139 4392 Total 296
(28%) 13 (1%) 762
(71%) 1071 (100%) 2016
(29%) 1092 (16%)
3888 (55%)
6996 (100%)
* Sx = surgery only, No Sx = no surgery, Sx+ = surgery combined with neoadjuvant and/or adjuvant treatment
Table 5. Relation cStage - (y)pStage in the prospective cohort. (y)pStage
cStage 0 I II III IV X Total 0 0 1 0 0 0 0 1 I 10 46 15 18 1 17 107 II 0 43 63 34 1 19 160 III 3 78 93 119 6 58 357 IV 0 3 9 41 30 28 111 X 13 75 93 84 11 59 335 Total 26 246 273 296 49 181 1071
3.2.1.2 BCR-IMA-TCT cohort
Only patients with a diagnosis of malignant neoplasm of the rectum (rectum ampulla) (ICD10 code = C20.9) were selected for inclusion in the cohort (n = 7074). For 16 of these patients no coupled data are available. For 6996 of these patients (98.9%) data are available in the HIC database, while for 4569 and 4535 patients data are available in the MCD database and the MFD database respectively. For 4556 patients (64.4%) data are available in both the HIC database and MCD databases.
HIC facturation data are available for 6996 patients of the cohort (98.9%). These facturation data are retrieved from two sources: expenses related to health care in general and expenses related to drugs sold in drugstores (Farmanet). The first expenses cover a period from January 1st 2000 till December 31st 2004, the latter cover expenses from the January 1st 2001 till December 31st 2004. Apart from the facturation data, HIC demographic data are available for 6735 patients of the cohort (95.2%).
Both the MCD and MFD database contain data on hospitalizations for which the admission date falls between July 2001 and December 2004.
In the MFD database information is available on 14216 hospitalisations of 4535 patients in the cohort (64.1%).
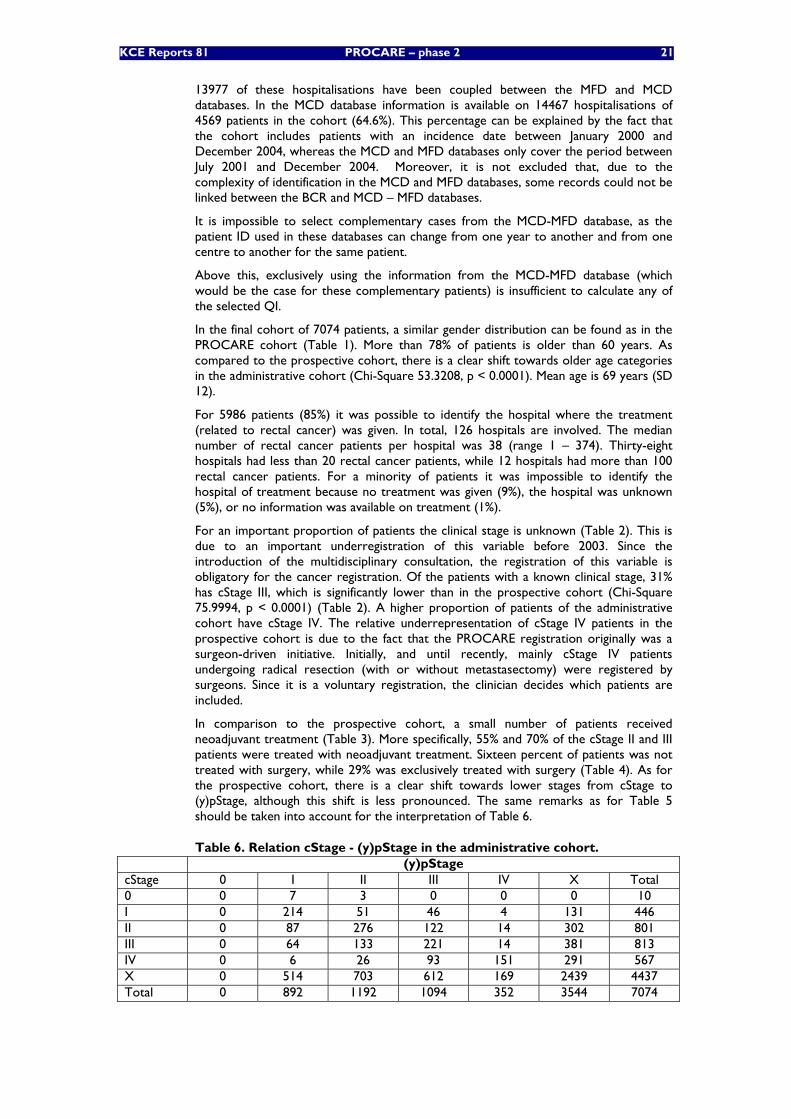
KCE Reports 81 PROCARE – phase 2 21
13977 of these hospitalisations have been coupled between the MFD and MCD databases. In the MCD database information is available on 14467 hospitalisations of 4569 patients in the cohort (64.6%). This percentage can be explained by the fact that the cohort includes patients with an incidence date between January 2000 and December 2004, whereas the MCD and MFD databases only cover the period between July 2001 and December 2004. Moreover, it is not excluded that, due to the complexity of identification in the MCD and MFD databases, some records could not be linked between the BCR and MCD – MFD databases.
It is impossible to select complementary cases from the MCD-MFD database, as the patient ID used in these databases can change from one year to another and from one centre to another for the same patient.
Above this, exclusively using the information from the MCD-MFD database (which would be the case for these complementary patients) is insufficient to calculate any of the selected QI.
In the final cohort of 7074 patients, a similar gender distribution can be found as in the PROCARE cohort (Table 1). More than 78% of patients is older than 60 years. As compared to the prospective cohort, there is a clear shift towards older age categories in the administrative cohort (Chi-Square 53.3208, p < 0.0001). Mean age is 69 years (SD 12).
For 5986 patients (85%) it was possible to identify the hospital where the treatment (related to rectal cancer) was given. In total, 126 hospitals are involved. The median number of rectal cancer patients per hospital was 38 (range 1 – 374). Thirty-eight hospitals had less than 20 rectal cancer patients, while 12 hospitals had more than 100 rectal cancer patients. For a minority of patients it was impossible to identify the hospital of treatment because no treatment was given (9%), the hospital was unknown (5%), or no information was available on treatment (1%).
For an important proportion of patients the clinical stage is unknown (Table 2). This is due to an important underregistration of this variable before 2003. Since the introduction of the multidisciplinary consultation, the registration of this variable is obligatory for the cancer registration. Of the patients with a known clinical stage, 31% has cStage III, which is significantly lower than in the prospective cohort (Chi-Square 75.9994, p < 0.0001) (Table 2). A higher proportion of patients of the administrative cohort have cStage IV. The relative underrepresentation of cStage IV patients in the prospective cohort is due to the fact that the PROCARE registration originally was a surgeon-driven initiative. Initially, and until recently, mainly cStage IV patients undergoing radical resection (with or without metastasectomy) were registered by surgeons. Since it is a voluntary registration, the clinician decides which patients are included.
In comparison to the prospective cohort, a small number of patients received neoadjuvant treatment (Table 3). More specifically, 55% and 70% of the cStage II and III patients were treated with neoadjuvant treatment. Sixteen percent of patients was not treated with surgery, while 29% was exclusively treated with surgery (Table 4). As for the prospective cohort, there is a clear shift towards lower stages from cStage to (y)pStage, although this shift is less pronounced. The same remarks as for Table 5 should be taken into account for the interpretation of Table 6.
Table 6. Relation cStage - (y)pStage in the administrative cohort. (y)pStage
cStage 0 I II III IV X Total 0 0 7 3 0 0 0 10 I 0 214 51 46 4 131 446 II 0 87 276 122 14 302 801 III 0 64 133 221 14 381 813 IV 0 6 26 93 151 291 567 X 0 514 703 612 169 2439 4437 Total 0 892 1192 1094 352 3544 7074
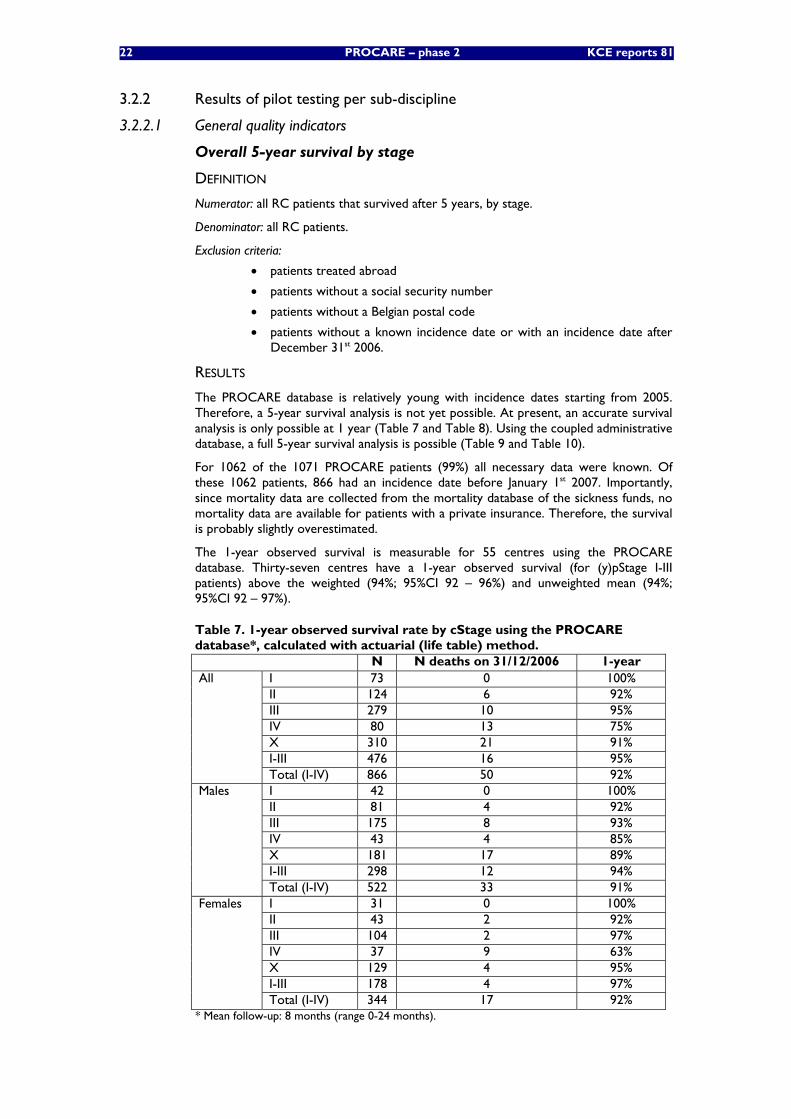
22 PROCARE – phase 2 KCE reports 81
3.2.2 Results of pilot testing per sub-discipline
3.2.2.1 General quality indicators
Overall 5-year survival by stage
DEFINITION
Numerator: all RC patients that survived after 5 years, by stage.
Denominator: all RC patients.
Exclusion criteria:
• patients treated abroad
• patients without a social security number
• patients without a Belgian postal code
• patients without a known incidence date or with an incidence date after December 31st 2006.
RESULTS
The PROCARE database is relatively young with incidence dates starting from 2005. Therefore, a 5-year survival analysis is not yet possible. At present, an accurate survival analysis is only possible at 1 year (Table 7 and Table 8). Using the coupled administrative database, a full 5-year survival analysis is possible (Table 9 and Table 10).
For 1062 of the 1071 PROCARE patients (99%) all necessary data were known. Of these 1062 patients, 866 had an incidence date before January 1st 2007. Importantly, since mortality data are collected from the mortality database of the sickness funds, no mortality data are available for patients with a private insurance. Therefore, the survival is probably slightly overestimated.
The 1-year observed survival is measurable for 55 centres using the PROCARE database. Thirty-seven centres have a 1-year observed survival (for (y)pStage I-III patients) above the weighted (94%; 95%CI 92 – 96%) and unweighted mean (94%; 95%CI 92 – 97%).
Table 7. 1-year observed survival rate by cStage using the PROCARE database*, calculated with actuarial (life table) method.
N N deaths on 31/12/2006 1-year I 73 0 100% II 124 6 92% III 279 10 95% IV 80 13 75% X 310 21 91% I-III 476 16 95%
All
Total (I-IV) 866 50 92% I 42 0 100% II 81 4 92% III 175 8 93% IV 43 4 85% X 181 17 89% I-III 298 12 94%
Males
Total (I-IV) 522 33 91% I 31 0 100% II 43 2 92% III 104 2 97% IV 37 9 63% X 129 4 95% I-III 178 4 97%
Females
Total (I-IV) 344 17 92% * Mean follow-up: 8 months (range 0-24 months).
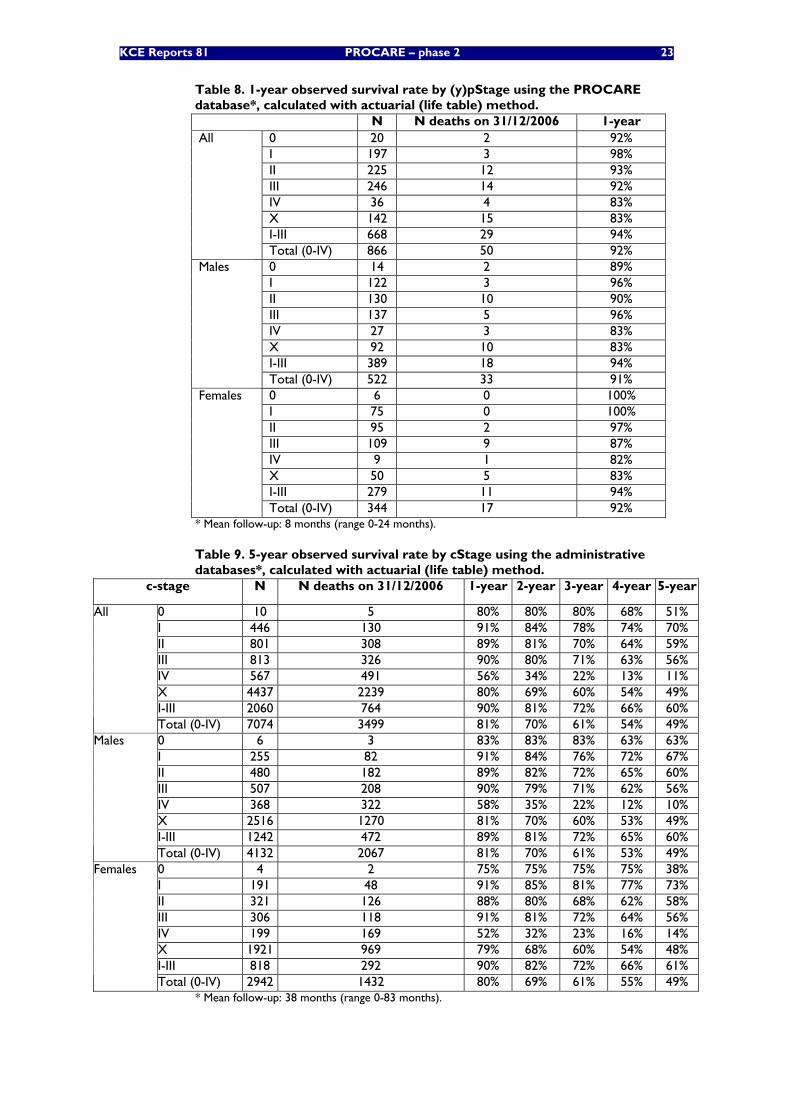
KCE Reports 81 PROCARE – phase 2 23
Table 8. 1-year observed survival rate by (y)pStage using the PROCARE database*, calculated with actuarial (life table) method.
N N deaths on 31/12/2006 1-year 0 20 2 92% I 197 3 98% II 225 12 93% III 246 14 92% IV 36 4 83% X 142 15 83% I-III 668 29 94%
All
Total (0-IV) 866 50 92% 0 14 2 89% I 122 3 96% II 130 10 90% III 137 5 96% IV 27 3 83% X 92 10 83% I-III 389 18 94%
Males
Total (0-IV) 522 33 91% 0 6 0 100% I 75 0 100% II 95 2 97% III 109 9 87% IV 9 1 82% X 50 5 83% I-III 279 11 94%
Females
Total (0-IV) 344 17 92% * Mean follow-up: 8 months (range 0-24 months).
Table 9. 5-year observed survival rate by cStage using the administrative databases*, calculated with actuarial (life table) method.
c-stage N N deaths on 31/12/2006 1-year 2-year 3-year 4-year 5-year
0 10 5 80% 80% 80% 68% 51% I 446 130 91% 84% 78% 74% 70% II 801 308 89% 81% 70% 64% 59% III 813 326 90% 80% 71% 63% 56% IV 567 491 56% 34% 22% 13% 11% X 4437 2239 80% 69% 60% 54% 49% I-III 2060 764 90% 81% 72% 66% 60%
All
Total (0-IV) 7074 3499 81% 70% 61% 54% 49% 0 6 3 83% 83% 83% 63% 63% I 255 82 91% 84% 76% 72% 67% II 480 182 89% 82% 72% 65% 60% III 507 208 90% 79% 71% 62% 56% IV 368 322 58% 35% 22% 12% 10% X 2516 1270 81% 70% 60% 53% 49% I-III 1242 472 89% 81% 72% 65% 60%
Males
Total (0-IV) 4132 2067 81% 70% 61% 53% 49% 0 4 2 75% 75% 75% 75% 38% I 191 48 91% 85% 81% 77% 73% II 321 126 88% 80% 68% 62% 58% III 306 118 91% 81% 72% 64% 56% IV 199 169 52% 32% 23% 16% 14% X 1921 969 79% 68% 60% 54% 48% I-III 818 292 90% 82% 72% 66% 61%
Females
Total (0-IV) 2942 1432 80% 69% 61% 55% 49% * Mean follow-up: 38 months (range 0-83 months).
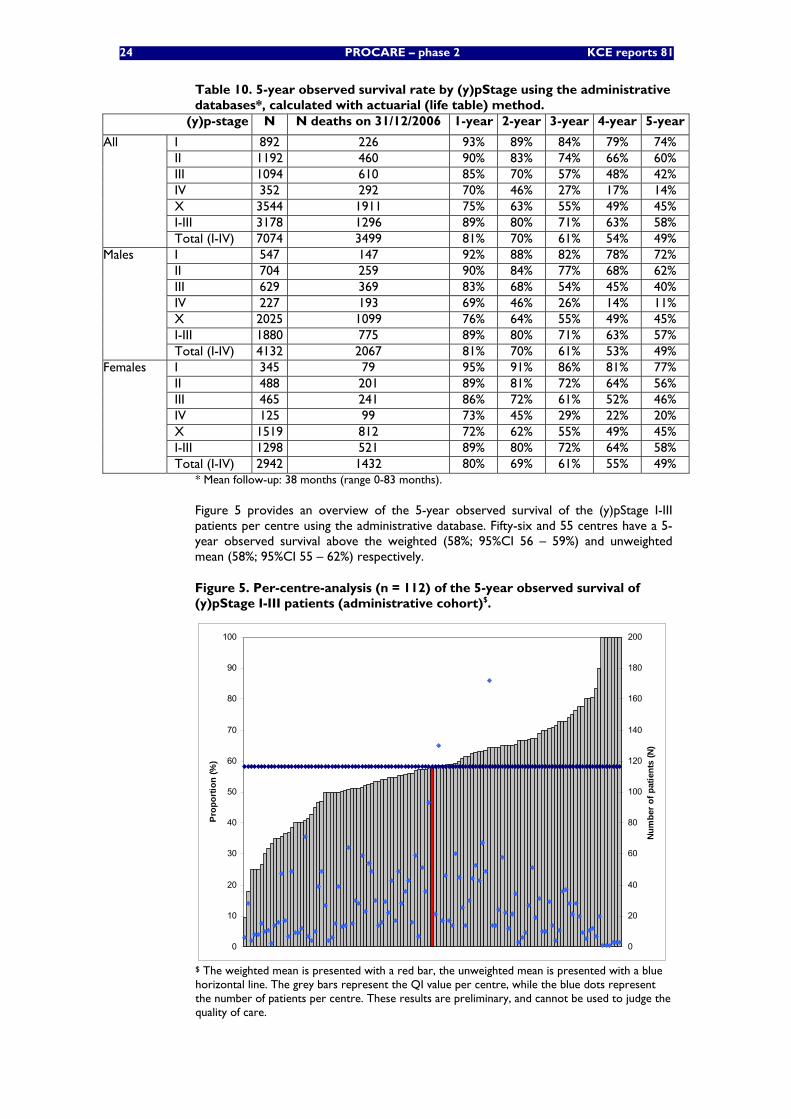
24 PROCARE – phase 2 KCE reports 81
Table 10. 5-year observed survival rate by (y)pStage using the administrative databases*, calculated with actuarial (life table) method.
(y)p-stage N N deaths on 31/12/2006 1-year 2-year 3-year 4-year 5-year
I 892 226 93% 89% 84% 79% 74% II 1192 460 90% 83% 74% 66% 60% III 1094 610 85% 70% 57% 48% 42% IV 352 292 70% 46% 27% 17% 14% X 3544 1911 75% 63% 55% 49% 45% I-III 3178 1296 89% 80% 71% 63% 58%
All
Total (I-IV) 7074 3499 81% 70% 61% 54% 49% I 547 147 92% 88% 82% 78% 72% II 704 259 90% 84% 77% 68% 62% III 629 369 83% 68% 54% 45% 40% IV 227 193 69% 46% 26% 14% 11% X 2025 1099 76% 64% 55% 49% 45% I-III 1880 775 89% 80% 71% 63% 57%
Males
Total (I-IV) 4132 2067 81% 70% 61% 53% 49% I 345 79 95% 91% 86% 81% 77% II 488 201 89% 81% 72% 64% 56% III 465 241 86% 72% 61% 52% 46% IV 125 99 73% 45% 29% 22% 20% X 1519 812 72% 62% 55% 49% 45% I-III 1298 521 89% 80% 72% 64% 58%
Females
Total (I-IV) 2942 1432 80% 69% 61% 55% 49% * Mean follow-up: 38 months (range 0-83 months).
Figure 5 provides an overview of the 5-year observed survival of the (y)pStage I-III patients per centre using the administrative database. Fifty-six and 55 centres have a 5-year observed survival above the weighted (58%; 95%CI 56 – 59%) and unweighted mean (58%; 95%CI 55 – 62%) respectively.
Figure 5. Per-centre-analysis (n = 112) of the 5-year observed survival of (y)pStage I-III patients (administrative cohort)$.
0
10
20
30
40
50
60
70
80
90
100
Pro
porti
on (%
)
0
20
40
60
80
100
120
140
160
180
200N
umbe
r of p
atie
nts
(N)
$ The weighted mean is presented with a red bar, the unweighted mean is presented with a blue horizontal line. The grey bars represent the QI value per centre, while the blue dots represent the number of patients per centre. These results are preliminary, and cannot be used to judge the quality of care.
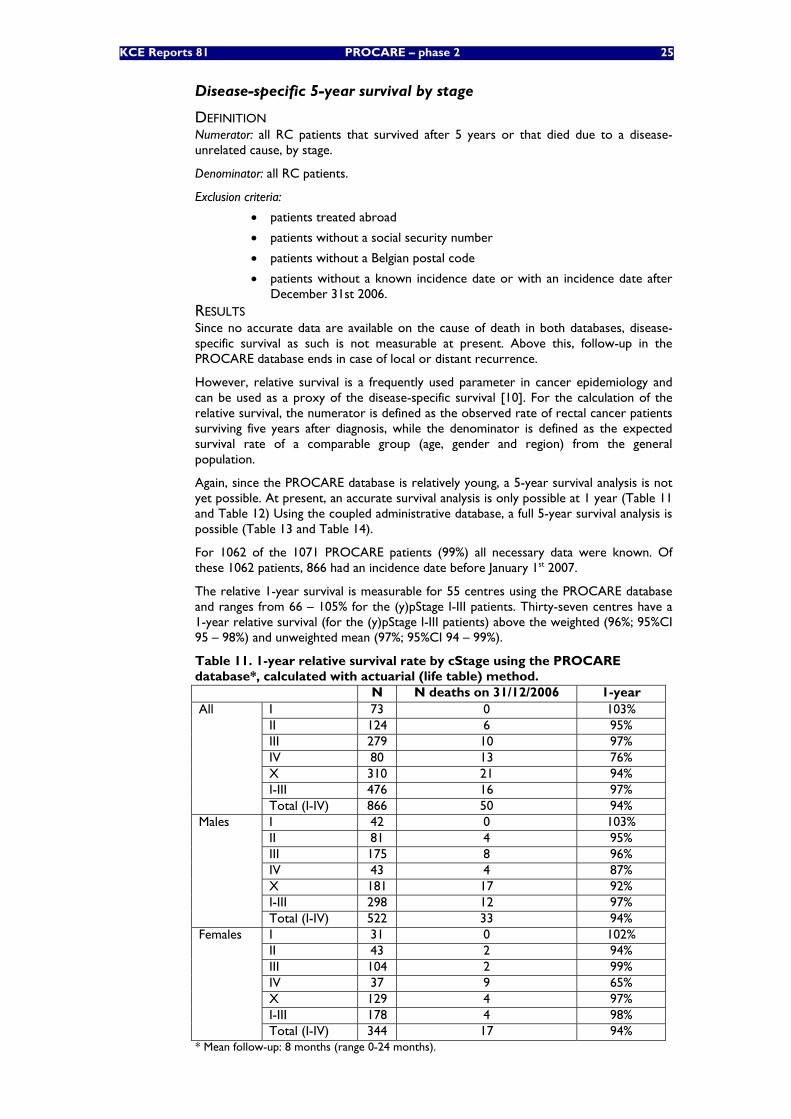
KCE Reports 81 PROCARE – phase 2 25
Disease-specific 5-year survival by stage
DEFINITION Numerator: all RC patients that survived after 5 years or that died due to a disease-unrelated cause, by stage.
Denominator: all RC patients.
Exclusion criteria:
• patients treated abroad
• patients without a social security number
• patients without a Belgian postal code
• patients without a known incidence date or with an incidence date after December 31st 2006.
RESULTS Since no accurate data are available on the cause of death in both databases, disease-specific survival as such is not measurable at present. Above this, follow-up in the PROCARE database ends in case of local or distant recurrence.
However, relative survival is a frequently used parameter in cancer epidemiology and can be used as a proxy of the disease-specific survival [10]. For the calculation of the relative survival, the numerator is defined as the observed rate of rectal cancer patients surviving five years after diagnosis, while the denominator is defined as the expected survival rate of a comparable group (age, gender and region) from the general population.
Again, since the PROCARE database is relatively young, a 5-year survival analysis is not yet possible. At present, an accurate survival analysis is only possible at 1 year (Table 11 and Table 12) Using the coupled administrative database, a full 5-year survival analysis is possible (Table 13 and Table 14).
For 1062 of the 1071 PROCARE patients (99%) all necessary data were known. Of these 1062 patients, 866 had an incidence date before January 1st 2007.
The relative 1-year survival is measurable for 55 centres using the PROCARE database and ranges from 66 – 105% for the (y)pStage I-III patients. Thirty-seven centres have a 1-year relative survival (for the (y)pStage I-III patients) above the weighted (96%; 95%CI 95 – 98%) and unweighted mean (97%; 95%CI 94 – 99%).
Table 11. 1-year relative survival rate by cStage using the PROCARE database*, calculated with actuarial (life table) method.
N N deaths on 31/12/2006 1-year I 73 0 103% II 124 6 95% III 279 10 97% IV 80 13 76% X 310 21 94% I-III 476 16 97%
All
Total (I-IV) 866 50 94% I 42 0 103% II 81 4 95% III 175 8 96% IV 43 4 87% X 181 17 92% I-III 298 12 97%
Males
Total (I-IV) 522 33 94% I 31 0 102% II 43 2 94% III 104 2 99% IV 37 9 65% X 129 4 97% I-III 178 4 98%
Females
Total (I-IV) 344 17 94% * Mean follow-up: 8 months (range 0-24 months).
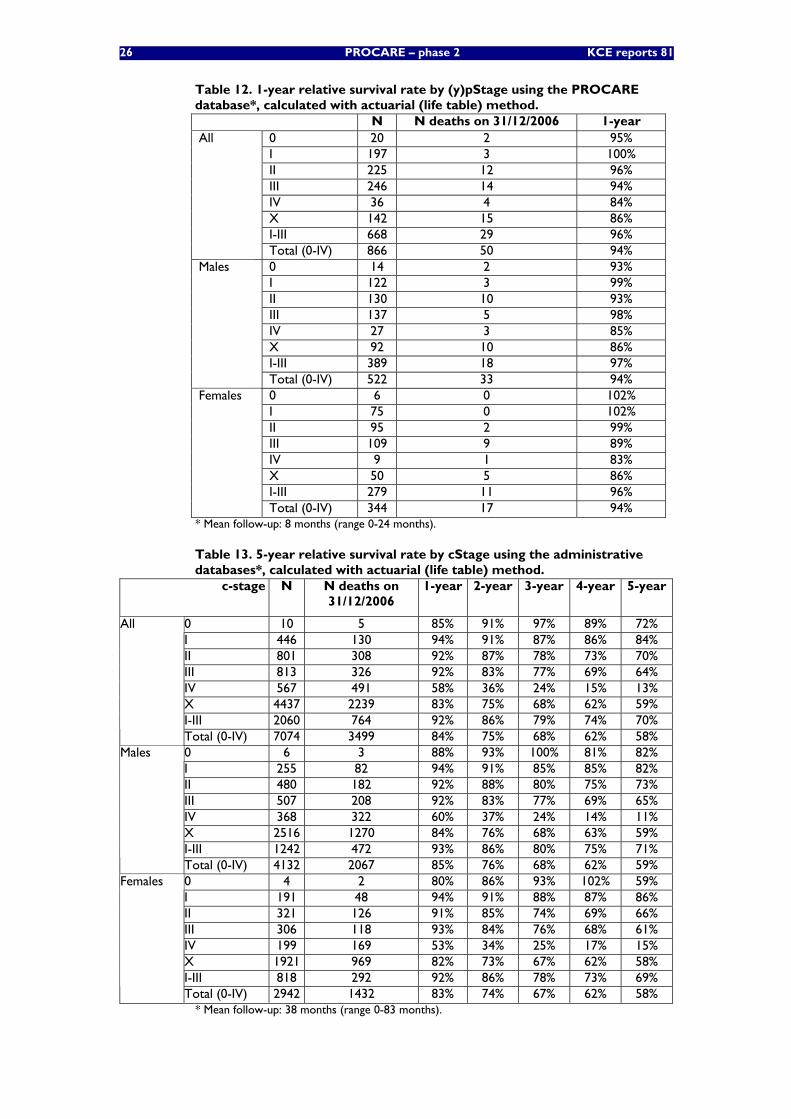
26 PROCARE – phase 2 KCE reports 81
Table 12. 1-year relative survival rate by (y)pStage using the PROCARE database*, calculated with actuarial (life table) method.
N N deaths on 31/12/2006 1-year 0 20 2 95% I 197 3 100% II 225 12 96% III 246 14 94% IV 36 4 84% X 142 15 86% I-III 668 29 96%
All
Total (0-IV) 866 50 94% 0 14 2 93% I 122 3 99% II 130 10 93% III 137 5 98% IV 27 3 85% X 92 10 86% I-III 389 18 97%
Males
Total (0-IV) 522 33 94% 0 6 0 102% I 75 0 102% II 95 2 99% III 109 9 89% IV 9 1 83% X 50 5 86% I-III 279 11 96%
Females
Total (0-IV) 344 17 94% * Mean follow-up: 8 months (range 0-24 months).
Table 13. 5-year relative survival rate by cStage using the administrative databases*, calculated with actuarial (life table) method.
c-stage N N deaths on 31/12/2006
1-year 2-year 3-year 4-year 5-year
0 10 5 85% 91% 97% 89% 72% I 446 130 94% 91% 87% 86% 84% II 801 308 92% 87% 78% 73% 70% III 813 326 92% 83% 77% 69% 64% IV 567 491 58% 36% 24% 15% 13% X 4437 2239 83% 75% 68% 62% 59% I-III 2060 764 92% 86% 79% 74% 70%
All
Total (0-IV) 7074 3499 84% 75% 68% 62% 58% 0 6 3 88% 93% 100% 81% 82% I 255 82 94% 91% 85% 85% 82% II 480 182 92% 88% 80% 75% 73% III 507 208 92% 83% 77% 69% 65% IV 368 322 60% 37% 24% 14% 11% X 2516 1270 84% 76% 68% 63% 59% I-III 1242 472 93% 86% 80% 75% 71%
Males
Total (0-IV) 4132 2067 85% 76% 68% 62% 59% 0 4 2 80% 86% 93% 102% 59% I 191 48 94% 91% 88% 87% 86% II 321 126 91% 85% 74% 69% 66% III 306 118 93% 84% 76% 68% 61% IV 199 169 53% 34% 25% 17% 15% X 1921 969 82% 73% 67% 62% 58% I-III 818 292 92% 86% 78% 73% 69%
Females
Total (0-IV) 2942 1432 83% 74% 67% 62% 58% * Mean follow-up: 38 months (range 0-83 months).
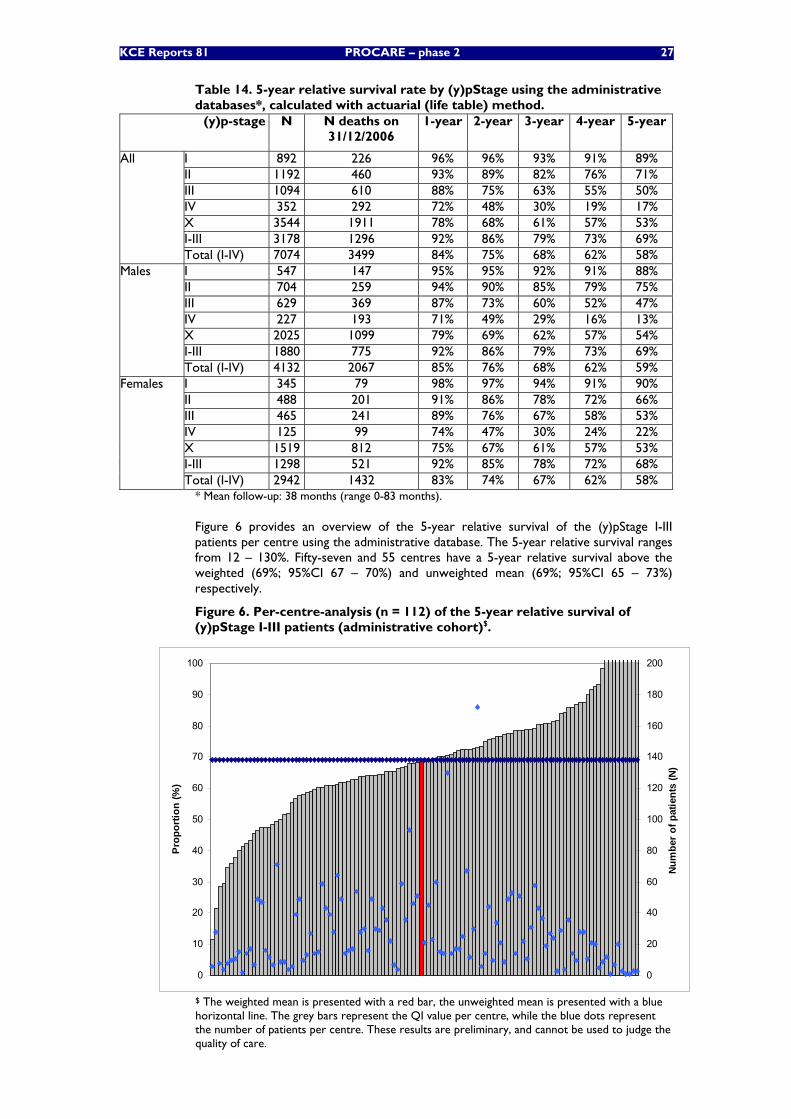
KCE Reports 81 PROCARE – phase 2 27
Table 14. 5-year relative survival rate by (y)pStage using the administrative databases*, calculated with actuarial (life table) method.
(y)p-stage N N deaths on 31/12/2006
1-year 2-year 3-year 4-year 5-year
I 892 226 96% 96% 93% 91% 89% II 1192 460 93% 89% 82% 76% 71% III 1094 610 88% 75% 63% 55% 50% IV 352 292 72% 48% 30% 19% 17% X 3544 1911 78% 68% 61% 57% 53% I-III 3178 1296 92% 86% 79% 73% 69%
All
Total (I-IV) 7074 3499 84% 75% 68% 62% 58% I 547 147 95% 95% 92% 91% 88% II 704 259 94% 90% 85% 79% 75% III 629 369 87% 73% 60% 52% 47% IV 227 193 71% 49% 29% 16% 13% X 2025 1099 79% 69% 62% 57% 54% I-III 1880 775 92% 86% 79% 73% 69%
Males
Total (I-IV) 4132 2067 85% 76% 68% 62% 59% I 345 79 98% 97% 94% 91% 90% II 488 201 91% 86% 78% 72% 66% III 465 241 89% 76% 67% 58% 53% IV 125 99 74% 47% 30% 24% 22% X 1519 812 75% 67% 61% 57% 53% I-III 1298 521 92% 85% 78% 72% 68%
Females
Total (I-IV) 2942 1432 83% 74% 67% 62% 58% * Mean follow-up: 38 months (range 0-83 months).
Figure 6 provides an overview of the 5-year relative survival of the (y)pStage I-III patients per centre using the administrative database. The 5-year relative survival ranges from 12 – 130%. Fifty-seven and 55 centres have a 5-year relative survival above the weighted (69%; 95%CI 67 – 70%) and unweighted mean (69%; 95%CI 65 – 73%) respectively.
Figure 6. Per-centre-analysis (n = 112) of the 5-year relative survival of (y)pStage I-III patients (administrative cohort)$.
0
10
20
30
40
50
60
70
80
90
100
Prop
ortio
n (%
)
0
20
40
60
80
100
120
140
160
180
200Nu
mbe
r of p
atie
nts
(N)
$ The weighted mean is presented with a red bar, the unweighted mean is presented with a blue horizontal line. The grey bars represent the QI value per centre, while the blue dots represent the number of patients per centre. These results are preliminary, and cannot be used to judge the quality of care.
28 PROCARE – phase 2 KCE reports 81
Proportion of patients with local recurrence
DEFINITION
Numerator: all (y)pStage 0-III patients with an R0 resection that developed a local recurrence.
Denominator: all curatively treated (y)pStage 0-III patients (defined as all R0 resections).
Exclusion criteria:
• patients not treated with surgery
• patients with R1 or R2 resection, or with type of resection uncertain or unknown
• patients without follow-up data
• patients with c or pStage IV
• patients with unknown (y)pStage
RESULTS
Local recurrence rate at 1 year (calculated with Kaplan-Meier analysis) is 3% for the PROCARE cohort (Table 15). This figure should be interpreted with caution because of the low follow-up rate at present (registration started in 2006): of the 707 patients with (y)pStage 0-III and an R0 resection, only 233 patients (33%) had follow-up data available. However, in a few years it should be possible to accurately calculate the local recurrence rate at 3 years.
For 76 of the 1071 patients, no information was available on the type of resection. Above this, for 122 of the 914 patients with an R0 resection, no information was available on the (y)pStage. Missing data for local recurrence cannot be measured, since the default value of the variable is ‘0’ (i.e. missing values also receive value ‘0’). Therefore, the total number of missing data is at least 672/1071 (63%), including the 474 patients with (y)pStage 0-III and an R0 resection without follow-up data at 1 year.
Importantly, the number of patients with an R0 resection is probably overestimated, since the results of the pathology report are not taken into account in the variable used to register R0 resections (see appendix). Ideally, the real R0 should be used in the future, taking into account the pathology results (CRM > 1 mm for R0) and absence of intraoperative rectal perforation.
Local recurrence (free) rate is measurable for 38 centres using the PROCARE database. The 1-year local recurrence free rate ranges from 50 – 100%. Thirty-three centres have a 1-year local recurrence free rate above the weighted (97%; 95%CI 95 – 99%) and unweighted mean (97%; 95%CI 94 – 100%). Risk-adjustment (tumour localisation [low – mid – upper], stage) is necessary for more appropriate interpretation of the results.
This QI is not measurable using the administrative databases due to an absence of specific codes for R0 resection and local recurrence.
Table 15. Number of (y)pStage 0-III patients with local recurrence at 1 year, measured with prospective PROCARE data.
N Patients with rectal cancer 1071 Patients with rectal cancer that underwent R0 resection 914 Patients with (y)pStage 0-III rectal cancer that underwent R0 resection 707 Proportion with follow-up data at 1 year 233 Proportion with local recurrence at 1 year 5 (2%)* * This result represents a ratio, in contrast to the calculation with the Kaplan-Meier analysis.
Proportion of patients discussed at a multidisciplinary team meeting
DEFINITION
Numerator: all patients with RC, cT3-4, cN+ and/or cStage IV, discussed at a multidisciplinary team (MDT) meeting within 6 months after the incidence date.
Denominator: all patients with RC, cT3-4, cN+ and/or cStage IV.
KCE Reports 81 PROCARE – phase 2 29
Exclusion criteria:
• patients with an incidence date before February 1st 2003 (date at which the administrative code became available)
• patients with cT, cN and/or cStage unknown
RESULTS
Overall, 65% of patients with rectal cancer cT3-4, cN+ and/or cStage IV were discussed at the MDT in 2003 (Table 16). The results of 2004 are not presented since the BCR data were not complete for 2004 at the time of the study. Of the 1473 patients with a correct incidence date, it was not possible to retrieve the cStage and/or cN and/or cT for 617 patients (total missings: 617/7074, 9%).
Discussion at the MDT is measurable for 100 centres using the administrative database. Thirty-two of the 101 centres have a score of 100%, while 13 centres have a score of 0%. All these 13 centres treated less than 5 eligible patients. Sixty-four centres have a score above the weighted (65%; 95%CI 61 – 69%) and unweighted mean (66%; 95%CI 59 – 73%).
The QI is not measurable for the prospective cohort, since this information is not registered.
Table 16. Number of patients with rectal cancer (cT3-4, cN+ and/or cStage IV) discussed at a multidisciplinary meeting in 2003, measured with administrative data. N Patients with rectal cancer: cT3-4, cN+ and/or cStage IV (denominator) 673 Proportion discussed at the MDT (numerator) 435 (65%)
Discussion
At present, only one general QI (local recurrence rate) is measurable using the PROCARE database, while one other QI will only be measurable in the future (overall 5-year survival by stage) (Table 17). Using administrative databases, overall 5-year survival by stage and discussion at a multidisciplinary team meeting are both measurable.
Disease-specific 5-year survival by stage is not measurable for both databases. However, this QI will be replaced by the relative 5-year survival by stage, which is (potentially) measurable for both databases. Another option would be to add a specific code to the PROCARE data entry form that registers the cause of death both in the postoperative period and during follow-up (providing a choice between cancer-related and cancer-unrelated cause of death). However, in this case an important precondition is to continue the registration of events after local or distant recurrence. Obviously, this is not a solution for the administrative database.
For the interpretation of the overall survival, it is important to take into account the postoperative mortality, which has an important impact on the 1-year survival. Postoperative mortality is measured in QI 1234 (see below).
Finally, QI 1114 can be rendered measurable using the PROCARE database by adding a specific code to the PROCARE data entry form, or by linking the PROCARE database to the administrative databases using the unique patient identification number. The latter option is preferred, since it would reduce the registration burden of the participating centres. However, in view of a changing law (making a discussion at the MDT obligatory for all oncologic patients) and in view of the inability to check the quality of the multidisciplinary discussion itself, one can discuss on the value of this indicator as a quality indicator.

30 PROCARE – phase 2 KCE reports 81
Table 17. Measurability of selected general QI. QI Prospective Db Administrative Db
Measurable? If not: reason? Measurable? If not: reason? 1111 Not yet Follow-up too short Yes - 1112 No No code No No code 1113 Yes - No No code 1114 No No code Yes -
3.2.2.2 Quality indicators related to diagnosis and staging
Proportion of patients with a documented distance from the anal verge
DEFINITION
Numerator: all RC patients that underwent resection for rectal cancer (endoscopic, LE/TEMS, radical resection) and who have a documented distance from the anal verge.
Denominator: all patients with RC that underwent resection (endoscopic, LE/TEMS, radical resection) for rectal cancer.
Exclusion:
• patients that didn’t undergo resection
RESULTS
More than 97% of patients with rectal cancer undergoing resectional surgery have a documented distance from the anal verge (Table 18). No missing data were identified. A potential problem with the measurement of this QI is that the distance from the anal verge is registered in the PROCARE database on 3 occasions (pre-treatment data, intra-operative data and pathology report; see appendix). This may lead to inconsistencies which may need interpretation by a clinician.
Figure 7 provides an overview of the documented distance from the anal verge per participating centre using the prospective database. Forty-six of the 56 centres have a score of 100%. Forty-seven centres have a score above the weighted (97%; 95%CI 96 – 98%) and unweighted mean (97%; 95%CI 95 – 100%).
The QI is not measurable for the administrative cohort, since no administrative code exists for the (documentation of the) distance from the anal verge.
Table 18. Number of patients with a documented distance from the anal verge, measured with prospective PROCARE data.
N Patients with rectal cancer 1071 Patients with rectal cancer that underwent surgery 1058 Patients with rectal cancer that underwent resectional surgery (local or radical) (denominator)
1018
Patients with documented distance to anal verge (numerator) 990 (97%)
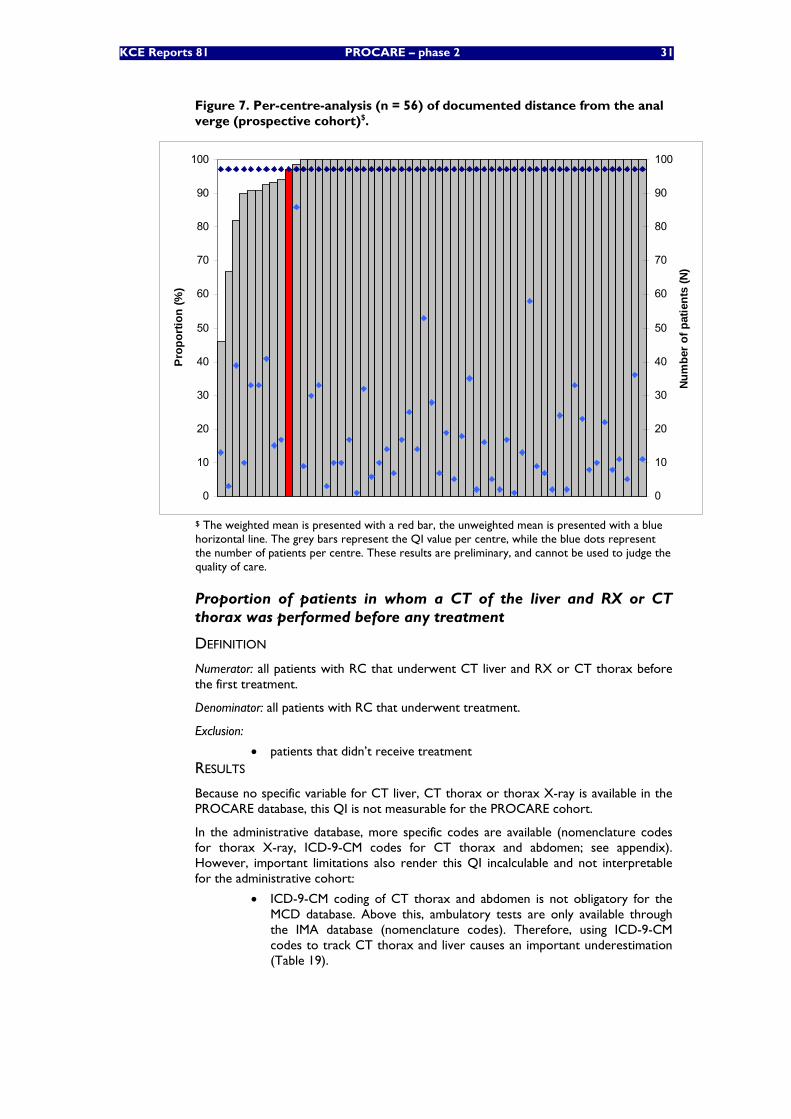
KCE Reports 81 PROCARE – phase 2 31
Figure 7. Per-centre-analysis (n = 56) of documented distance from the anal verge (prospective cohort)$.
0
10
20
30
40
50
60
70
80
90
100Pr
opor
tion
(%)
0
10
20
30
40
50
60
70
80
90
100
Num
ber o
f pat
ient
s (N
)
$ The weighted mean is presented with a red bar, the unweighted mean is presented with a blue horizontal line. The grey bars represent the QI value per centre, while the blue dots represent the number of patients per centre. These results are preliminary, and cannot be used to judge the quality of care.
Proportion of patients in whom a CT of the liver and RX or CT thorax was performed before any treatment
DEFINITION
Numerator: all patients with RC that underwent CT liver and RX or CT thorax before the first treatment.
Denominator: all patients with RC that underwent treatment.
Exclusion:
• patients that didn’t receive treatment RESULTS
Because no specific variable for CT liver, CT thorax or thorax X-ray is available in the PROCARE database, this QI is not measurable for the PROCARE cohort.
In the administrative database, more specific codes are available (nomenclature codes for thorax X-ray, ICD-9-CM codes for CT thorax and abdomen; see appendix). However, important limitations also render this QI incalculable and not interpretable for the administrative cohort:
• ICD-9-CM coding of CT thorax and abdomen is not obligatory for the MCD database. Above this, ambulatory tests are only available through the IMA database (nomenclature codes). Therefore, using ICD-9-CM codes to track CT thorax and liver causes an important underestimation (Table 19).
32 PROCARE – phase 2 KCE reports 81
Table 19. Proportion of patients with a CT thorax or abdomen in the Technicall Cell database (ICD-9-CM codes).
N (%) CT thorax 191 (4%) CT abdomen 608 (13%) Total 4556 (100%)
• When using the ICD-9-CM codes to select these imaging techniques, it is difficult to determine the exact date of the intervention. In the Technical Cell database, information is only available on the hospitalisation period during which the intervention was carried out. Above this, only year, month and day of the week of the admission and discharge are available. Theoretically, this could be solved by linking the interventions encoded in the Technical Cell database to those in the IMA database. However, the correspondence between these two databases is low (data not shown).
• In the administrative database, it is impossible to determine if an imaging study was carried out in relation with the rectal cancer.
Proportion of patients in whom a CEA was performed before any treatment
DEFINITION
Numerator: all patients with RC that underwent CEA measurement before the first treatment.
Denominator: all patients with RC that underwent treatment.
Exclusion:
• patients that didn’t receive treatment
RESULTS
CEA measurement before any treatment occurs in 84% of patients in the PROCARE cohort vs. 66% in the administrative cohort (Table 20). No missings were identified in the PROCARE database. For 78 of the 7074 patients from the administrative cohort, it was impossible to identify the treatment (1%).
An important difference between the two measurements is the time frame. In the PROCARE database, the serum CEA before treatment is registered, without justification of the actual date of the test. In the administrative database, the date of the test and first treatment are available. A timeframe of 3 months before the incidence date was chosen, since in some cases the CEA measurement can be done before the actual diagnosis of rectal cancer, and duplication of the test is unnecessary in these cases.
Importantly, unavailability of the CEA result in the PROCARE registry does not mean that the measurement was not carried out.
Table 20. Number of patients in whom a CEA was performed before any treatment.
PROCARE cohort
Administrative cohort
Patients with rectal cancer 1071 6996 Patients with rectal cancer that received treatment (denominator)
1067 6337
Patients with rectal cancer in whom a CEA was performed before any treatment (numerator)
894 (84%) 4198 (66%)
Figure 8 provides an overview of the CEA registration per participating centre using the prospective database. Eighteen centres have a score of 100%, while in 5 centres less than 50% of patients have a pre-treatment CEA registration. Thirty-eight centres have a score above the weighted (84%; 95%CI 82 – 86%) and unweighted mean (83%; 95%CI 77 – 89%).
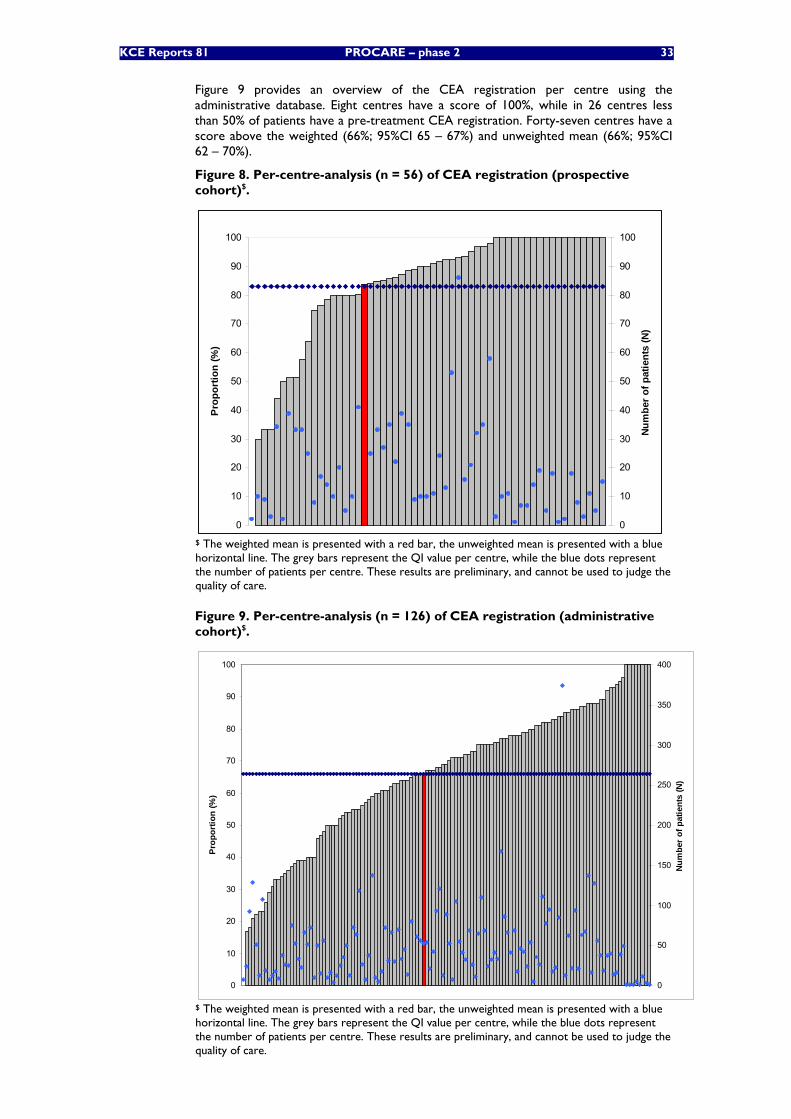
KCE Reports 81 PROCARE – phase 2 33
Figure 9 provides an overview of the CEA registration per centre using the administrative database. Eight centres have a score of 100%, while in 26 centres less than 50% of patients have a pre-treatment CEA registration. Forty-seven centres have a score above the weighted (66%; 95%CI 65 – 67%) and unweighted mean (66%; 95%CI 62 – 70%).
Figure 8. Per-centre-analysis (n = 56) of CEA registration (prospective cohort)$.
0
10
20
30
40
50
60
70
80
90
100
Prop
ortio
n (%
)
0
10
20
30
40
50
60
70
80
90
100
Num
ber
of p
atie
nts
(N)
$ The weighted mean is presented with a red bar, the unweighted mean is presented with a blue horizontal line. The grey bars represent the QI value per centre, while the blue dots represent the number of patients per centre. These results are preliminary, and cannot be used to judge the quality of care.
Figure 9. Per-centre-analysis (n = 126) of CEA registration (administrative cohort)$.
0
10
20
30
40
50
60
70
80
90
100
Prop
ortio
n (%
)
0
50
100
150
200
250
300
350
400N
umbe
r of
pat
ient
s (N
)
$ The weighted mean is presented with a red bar, the unweighted mean is presented with a blue horizontal line. The grey bars represent the QI value per centre, while the blue dots represent the number of patients per centre. These results are preliminary, and cannot be used to judge the quality of care.
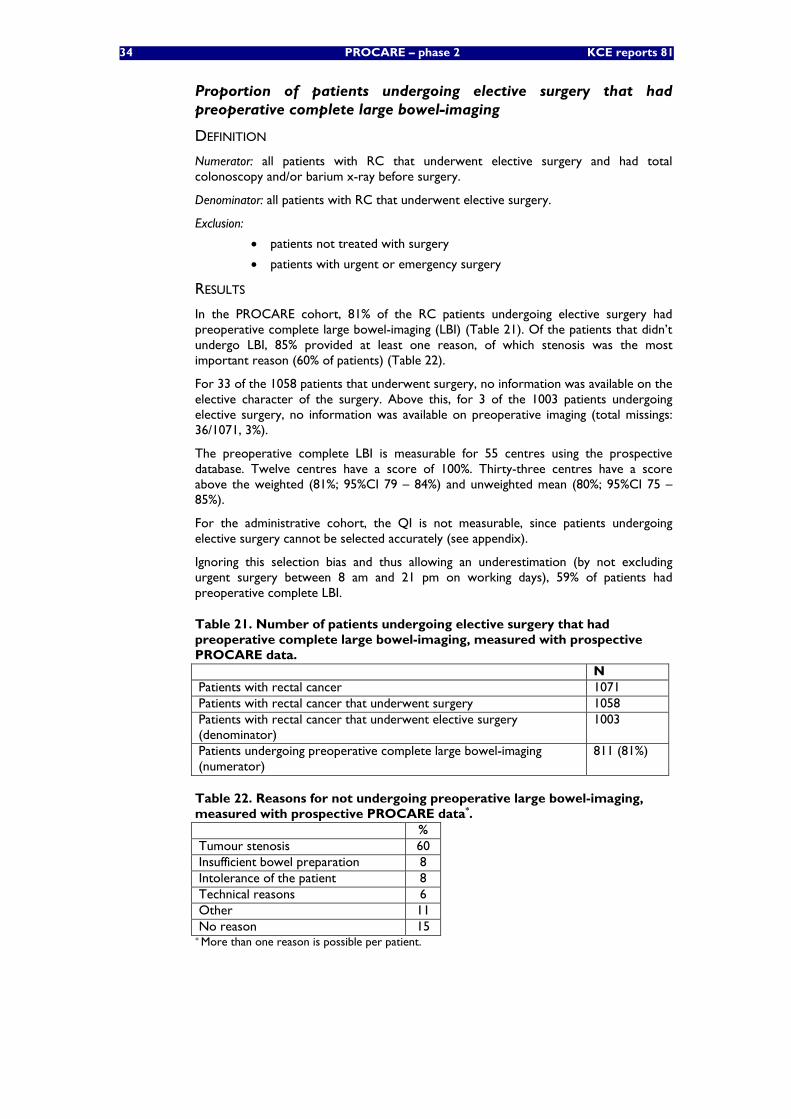
34 PROCARE – phase 2 KCE reports 81
Proportion of patients undergoing elective surgery that had preoperative complete large bowel-imaging
DEFINITION
Numerator: all patients with RC that underwent elective surgery and had total colonoscopy and/or barium x-ray before surgery.
Denominator: all patients with RC that underwent elective surgery.
Exclusion:
• patients not treated with surgery
• patients with urgent or emergency surgery
RESULTS
In the PROCARE cohort, 81% of the RC patients undergoing elective surgery had preoperative complete large bowel-imaging (LBI) (Table 21). Of the patients that didn’t undergo LBI, 85% provided at least one reason, of which stenosis was the most important reason (60% of patients) (Table 22).
For 33 of the 1058 patients that underwent surgery, no information was available on the elective character of the surgery. Above this, for 3 of the 1003 patients undergoing elective surgery, no information was available on preoperative imaging (total missings: 36/1071, 3%).
The preoperative complete LBI is measurable for 55 centres using the prospective database. Twelve centres have a score of 100%. Thirty-three centres have a score above the weighted (81%; 95%CI 79 – 84%) and unweighted mean (80%; 95%CI 75 – 85%).
For the administrative cohort, the QI is not measurable, since patients undergoing elective surgery cannot be selected accurately (see appendix).
Ignoring this selection bias and thus allowing an underestimation (by not excluding urgent surgery between 8 am and 21 pm on working days), 59% of patients had preoperative complete LBI.
Table 21. Number of patients undergoing elective surgery that had preoperative complete large bowel-imaging, measured with prospective PROCARE data.
N Patients with rectal cancer 1071 Patients with rectal cancer that underwent surgery 1058 Patients with rectal cancer that underwent elective surgery (denominator)
1003
Patients undergoing preoperative complete large bowel-imaging (numerator)
811 (81%)
Table 22. Reasons for not undergoing preoperative large bowel-imaging, measured with prospective PROCARE data*.
% Tumour stenosis 60 Insufficient bowel preparation 8 Intolerance of the patient 8 Technical reasons 6 Other 11 No reason 15
* More than one reason is possible per patient.
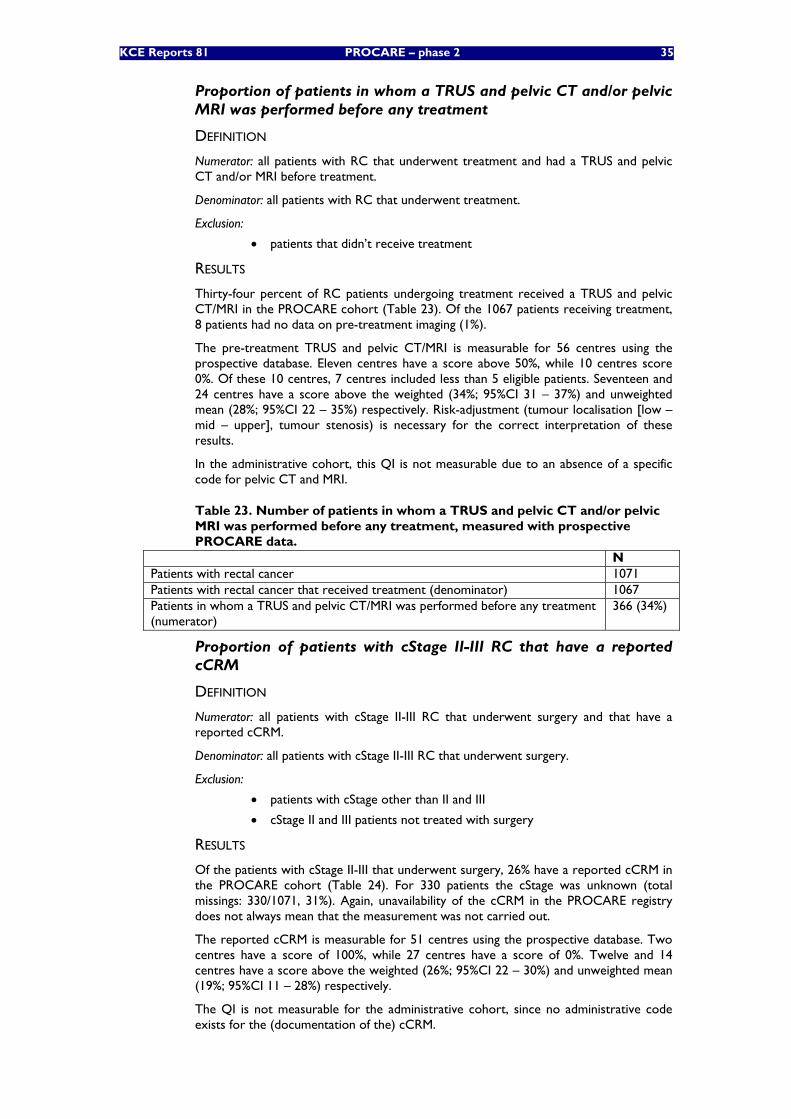
KCE Reports 81 PROCARE – phase 2 35
Proportion of patients in whom a TRUS and pelvic CT and/or pelvic MRI was performed before any treatment
DEFINITION
Numerator: all patients with RC that underwent treatment and had a TRUS and pelvic CT and/or MRI before treatment.
Denominator: all patients with RC that underwent treatment.
Exclusion:
• patients that didn’t receive treatment
RESULTS
Thirty-four percent of RC patients undergoing treatment received a TRUS and pelvic CT/MRI in the PROCARE cohort (Table 23). Of the 1067 patients receiving treatment, 8 patients had no data on pre-treatment imaging (1%).
The pre-treatment TRUS and pelvic CT/MRI is measurable for 56 centres using the prospective database. Eleven centres have a score above 50%, while 10 centres score 0%. Of these 10 centres, 7 centres included less than 5 eligible patients. Seventeen and 24 centres have a score above the weighted (34%; 95%CI 31 – 37%) and unweighted mean (28%; 95%CI 22 – 35%) respectively. Risk-adjustment (tumour localisation [low – mid – upper], tumour stenosis) is necessary for the correct interpretation of these results.
In the administrative cohort, this QI is not measurable due to an absence of a specific code for pelvic CT and MRI.
Table 23. Number of patients in whom a TRUS and pelvic CT and/or pelvic MRI was performed before any treatment, measured with prospective PROCARE data.
N Patients with rectal cancer 1071 Patients with rectal cancer that received treatment (denominator) 1067 Patients in whom a TRUS and pelvic CT/MRI was performed before any treatment (numerator)
366 (34%)
Proportion of patients with cStage II-III RC that have a reported cCRM
DEFINITION
Numerator: all patients with cStage II-III RC that underwent surgery and that have a reported cCRM.
Denominator: all patients with cStage II-III RC that underwent surgery.
Exclusion:
• patients with cStage other than II and III
• cStage II and III patients not treated with surgery
RESULTS
Of the patients with cStage II-III that underwent surgery, 26% have a reported cCRM in the PROCARE cohort (Table 24). For 330 patients the cStage was unknown (total missings: 330/1071, 31%). Again, unavailability of the cCRM in the PROCARE registry does not always mean that the measurement was not carried out.
The reported cCRM is measurable for 51 centres using the prospective database. Two centres have a score of 100%, while 27 centres have a score of 0%. Twelve and 14 centres have a score above the weighted (26%; 95%CI 22 – 30%) and unweighted mean (19%; 95%CI 11 – 28%) respectively.
The QI is not measurable for the administrative cohort, since no administrative code exists for the (documentation of the) cCRM.
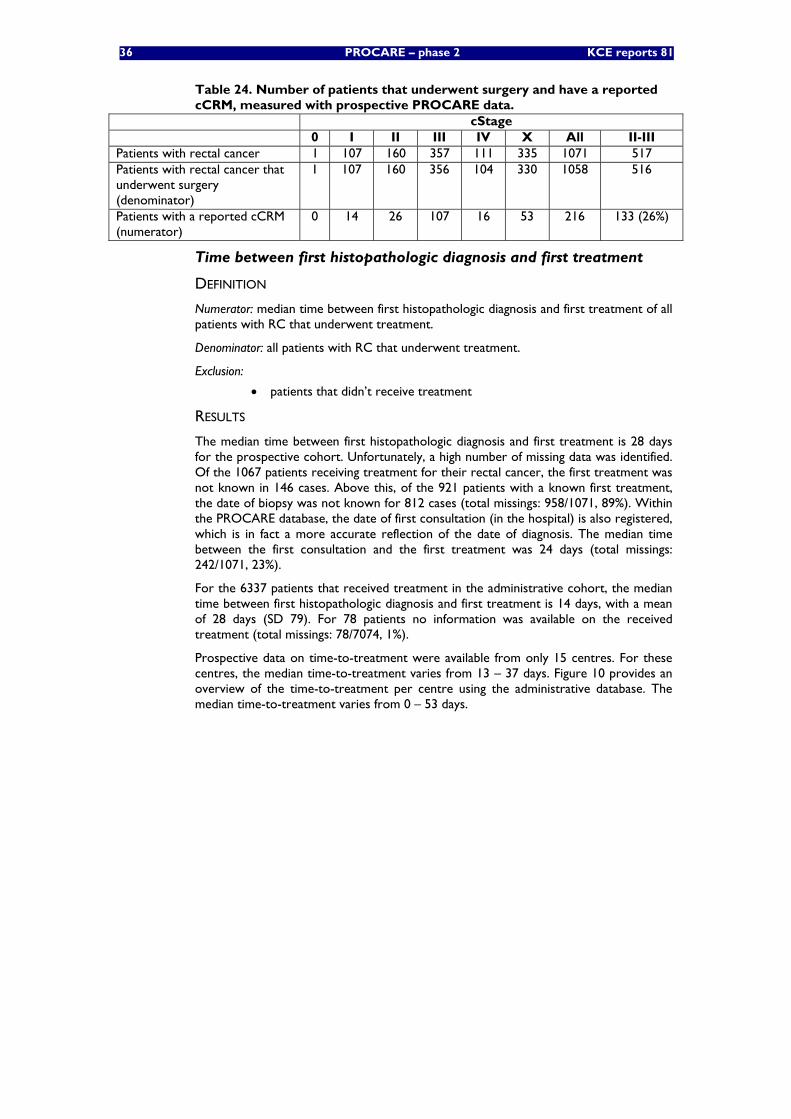
36 PROCARE – phase 2 KCE reports 81
Table 24. Number of patients that underwent surgery and have a reported cCRM, measured with prospective PROCARE data.
cStage 0 I II III IV X All II-III
Patients with rectal cancer 1 107 160 357 111 335 1071 517 Patients with rectal cancer that underwent surgery (denominator)
1 107 160 356 104 330 1058 516
Patients with a reported cCRM (numerator)
0 14 26 107 16 53 216 133 (26%)
Time between first histopathologic diagnosis and first treatment
DEFINITION
Numerator: median time between first histopathologic diagnosis and first treatment of all patients with RC that underwent treatment.
Denominator: all patients with RC that underwent treatment.
Exclusion:
• patients that didn’t receive treatment
RESULTS
The median time between first histopathologic diagnosis and first treatment is 28 days for the prospective cohort. Unfortunately, a high number of missing data was identified. Of the 1067 patients receiving treatment for their rectal cancer, the first treatment was not known in 146 cases. Above this, of the 921 patients with a known first treatment, the date of biopsy was not known for 812 cases (total missings: 958/1071, 89%). Within the PROCARE database, the date of first consultation (in the hospital) is also registered, which is in fact a more accurate reflection of the date of diagnosis. The median time between the first consultation and the first treatment was 24 days (total missings: 242/1071, 23%).
For the 6337 patients that received treatment in the administrative cohort, the median time between first histopathologic diagnosis and first treatment is 14 days, with a mean of 28 days (SD 79). For 78 patients no information was available on the received treatment (total missings: 78/7074, 1%).
Prospective data on time-to-treatment were available from only 15 centres. For these centres, the median time-to-treatment varies from 13 – 37 days. Figure 10 provides an overview of the time-to-treatment per centre using the administrative database. The median time-to-treatment varies from 0 – 53 days.

KCE Reports 81 PROCARE – phase 2 37
Figure 10. Per-centre-analysis (n = 126) of time-to-treatment (days) (administrative cohort)$.
0
10
20
30
40
50
60M
edia
n tim
e in
terv
al (d
ays)
0
50
100
150
200
250
300
350
400
Num
ber o
f pat
ient
s (N
)
$ The weighted mean is presented with a red bar. The grey bars represent the QI value per centre, while the blue dots represent the number of patients per centre. These results are preliminary, and cannot be used to judge the quality of care.
Discussion
Using the PROCARE database, only one QI (CT liver and CT/RX thorax before treatment) is not measurable (Table 25). This can be easily solved by adding a specific code registering the receiving of preoperative imaging studies (CT liver yes/no, CT thorax yes/no, etc.). Using administrative databases, only 2 QI are measurable, mainly because of the absence of codes for clinical data (e.g. distance to the anal verge), the absence of specific codes (e.g. pelvic CT or MRI), or the fact that some codes are not obligatory (e.g. CT thorax and abdomen in the MCD database).
For both CEA and cCRM, unavailability of the parameter in the PROCARE registry does not always mean that the measurement was not carried out. Therefore, real missing data cannot be distinguished from unavailable data. This can be solved by asking for the availability of the result (yes/no), and for the result itself if available.
At present, QI 1214 only measures the proportion of preoperative total colonoscopy and/or barium x-ray. However, although not recommended for routine use, virtual colonoscopy can also be considered a valuable option for complete large-bowel imaging (e.g. in case of stenosing rectal cancer) [1]. Therefore, a variable should be added to the PROCARE data entry form registering virtual colonoscopies.
QI 1215 measures the proportion of patients in whom a TRUS and pelvic CT and/or pelvic MRI was performed before any treatment. For feedback to individual healthcare providers, it is necessary to have this information per stage and level of the tumour (risk-adjustment). Above this, since this QI involves three different imaging techniques, separate information on the proportion of TRUS only, pelvic CT only, pelvic MRI only, TRUS and CT, etc. would be useful to allow specific quality improvement actions (level 3 information). This information is readily available in the PROCARE database.
Importantly, most selected QI on diagnosis and staging measure procedures for patients undergoing treatment/surgery.
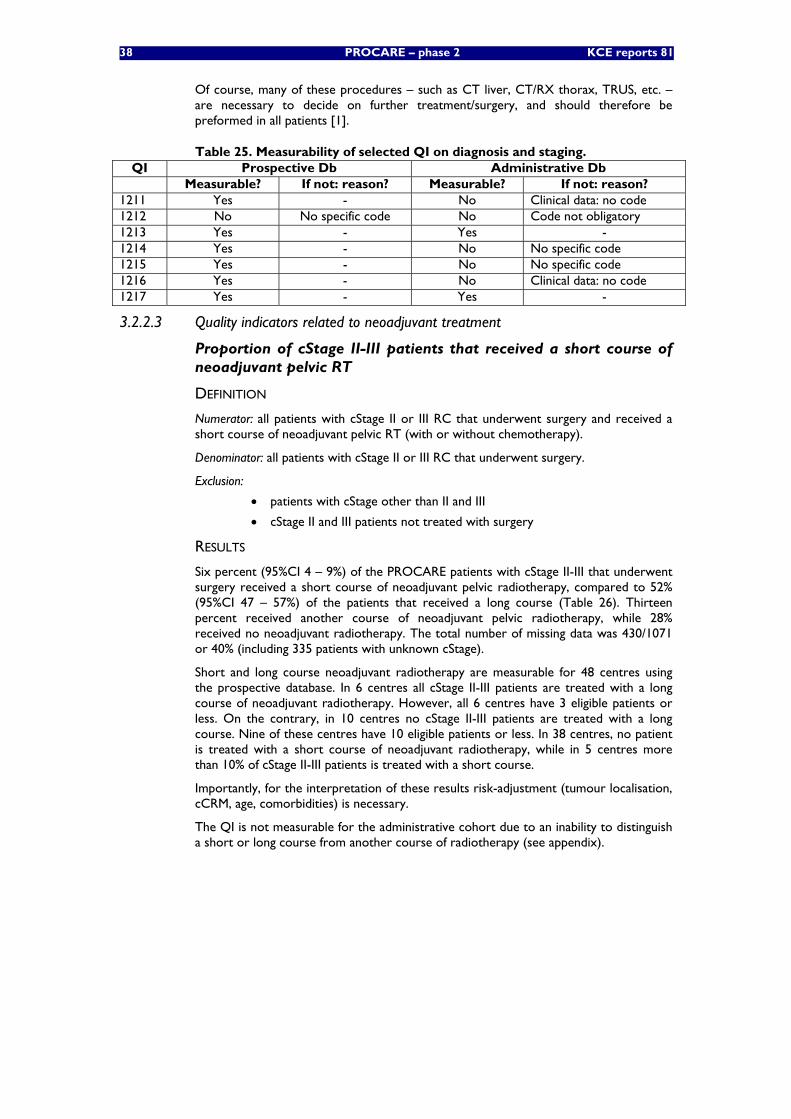
38 PROCARE – phase 2 KCE reports 81
Of course, many of these procedures – such as CT liver, CT/RX thorax, TRUS, etc. – are necessary to decide on further treatment/surgery, and should therefore be preformed in all patients [1].
Table 25. Measurability of selected QI on diagnosis and staging. QI Prospective Db Administrative Db
Measurable? If not: reason? Measurable? If not: reason? 1211 Yes - No Clinical data: no code 1212 No No specific code No Code not obligatory 1213 Yes - Yes - 1214 Yes - No No specific code 1215 Yes - No No specific code 1216 Yes - No Clinical data: no code 1217 Yes - Yes -
3.2.2.3 Quality indicators related to neoadjuvant treatment
Proportion of cStage II-III patients that received a short course of neoadjuvant pelvic RT
DEFINITION
Numerator: all patients with cStage II or III RC that underwent surgery and received a short course of neoadjuvant pelvic RT (with or without chemotherapy).
Denominator: all patients with cStage II or III RC that underwent surgery.
Exclusion:
• patients with cStage other than II and III
• cStage II and III patients not treated with surgery
RESULTS
Six percent (95%CI 4 – 9%) of the PROCARE patients with cStage II-III that underwent surgery received a short course of neoadjuvant pelvic radiotherapy, compared to 52% (95%CI 47 – 57%) of the patients that received a long course (Table 26). Thirteen percent received another course of neoadjuvant pelvic radiotherapy, while 28% received no neoadjuvant radiotherapy. The total number of missing data was 430/1071 or 40% (including 335 patients with unknown cStage).
Short and long course neoadjuvant radiotherapy are measurable for 48 centres using the prospective database. In 6 centres all cStage II-III patients are treated with a long course of neoadjuvant radiotherapy. However, all 6 centres have 3 eligible patients or less. On the contrary, in 10 centres no cStage II-III patients are treated with a long course. Nine of these centres have 10 eligible patients or less. In 38 centres, no patient is treated with a short course of neoadjuvant radiotherapy, while in 5 centres more than 10% of cStage II-III patients is treated with a short course.
Importantly, for the interpretation of these results risk-adjustment (tumour localisation, cCRM, age, comorbidities) is necessary.
The QI is not measurable for the administrative cohort due to an inability to distinguish a short or long course from another course of radiotherapy (see appendix).
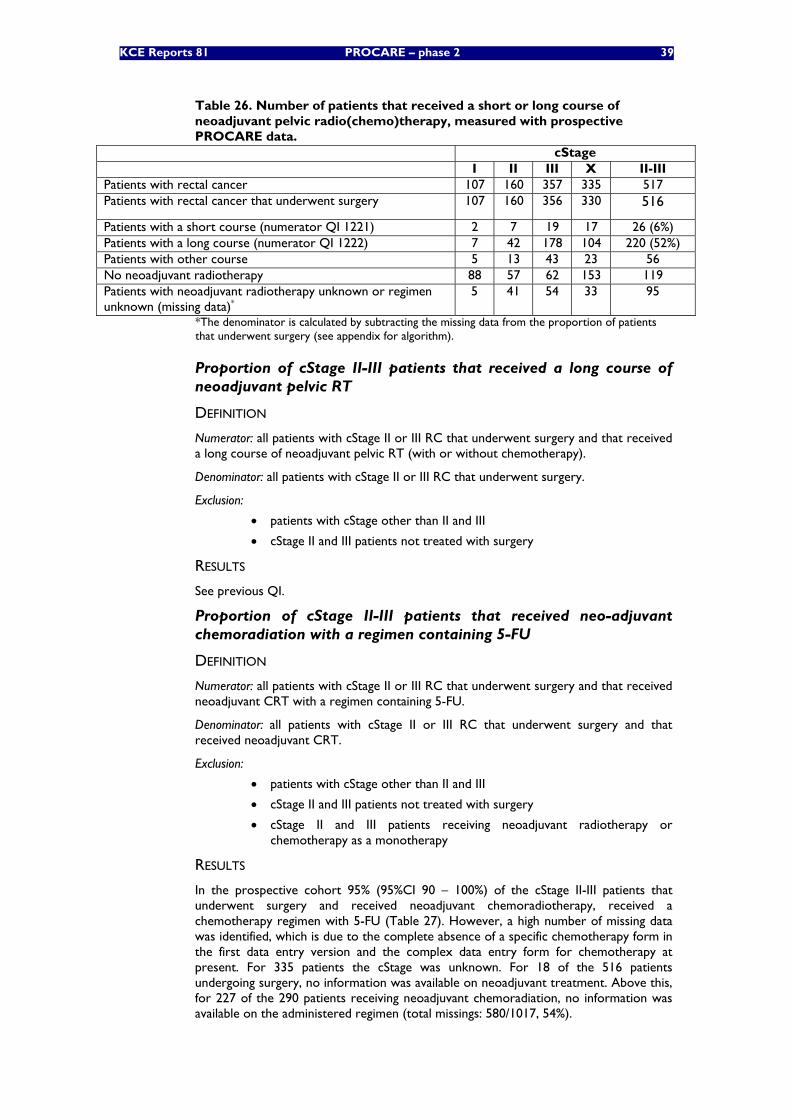
KCE Reports 81 PROCARE – phase 2 39
Table 26. Number of patients that received a short or long course of neoadjuvant pelvic radio(chemo)therapy, measured with prospective PROCARE data.
cStage I II III X II-III Patients with rectal cancer 107 160 357 335 517 Patients with rectal cancer that underwent surgery 107 160 356 330 516
Patients with a short course (numerator QI 1221) 2 7 19 17 26 (6%) Patients with a long course (numerator QI 1222) 7 42 178 104 220 (52%) Patients with other course 5 13 43 23 56 No neoadjuvant radiotherapy 88 57 62 153 119 Patients with neoadjuvant radiotherapy unknown or regimen unknown (missing data)*
5 41 54 33 95
*The denominator is calculated by subtracting the missing data from the proportion of patients that underwent surgery (see appendix for algorithm).
Proportion of cStage II-III patients that received a long course of neoadjuvant pelvic RT
DEFINITION
Numerator: all patients with cStage II or III RC that underwent surgery and that received a long course of neoadjuvant pelvic RT (with or without chemotherapy).
Denominator: all patients with cStage II or III RC that underwent surgery.
Exclusion:
• patients with cStage other than II and III
• cStage II and III patients not treated with surgery
RESULTS
See previous QI.
Proportion of cStage II-III patients that received neo-adjuvant chemoradiation with a regimen containing 5-FU
DEFINITION
Numerator: all patients with cStage II or III RC that underwent surgery and that received neoadjuvant CRT with a regimen containing 5-FU.
Denominator: all patients with cStage II or III RC that underwent surgery and that received neoadjuvant CRT.
Exclusion:
• patients with cStage other than II and III
• cStage II and III patients not treated with surgery
• cStage II and III patients receiving neoadjuvant radiotherapy or chemotherapy as a monotherapy
RESULTS
In the prospective cohort 95% (95%CI 90 – 100%) of the cStage II-III patients that underwent surgery and received neoadjuvant chemoradiotherapy, received a chemotherapy regimen with 5-FU (Table 27). However, a high number of missing data was identified, which is due to the complete absence of a specific chemotherapy form in the first data entry version and the complex data entry form for chemotherapy at present. For 335 patients the cStage was unknown. For 18 of the 516 patients undergoing surgery, no information was available on neoadjuvant treatment. Above this, for 227 of the 290 patients receiving neoadjuvant chemoradiation, no information was available on the administered regimen (total missings: 580/1017, 54%).
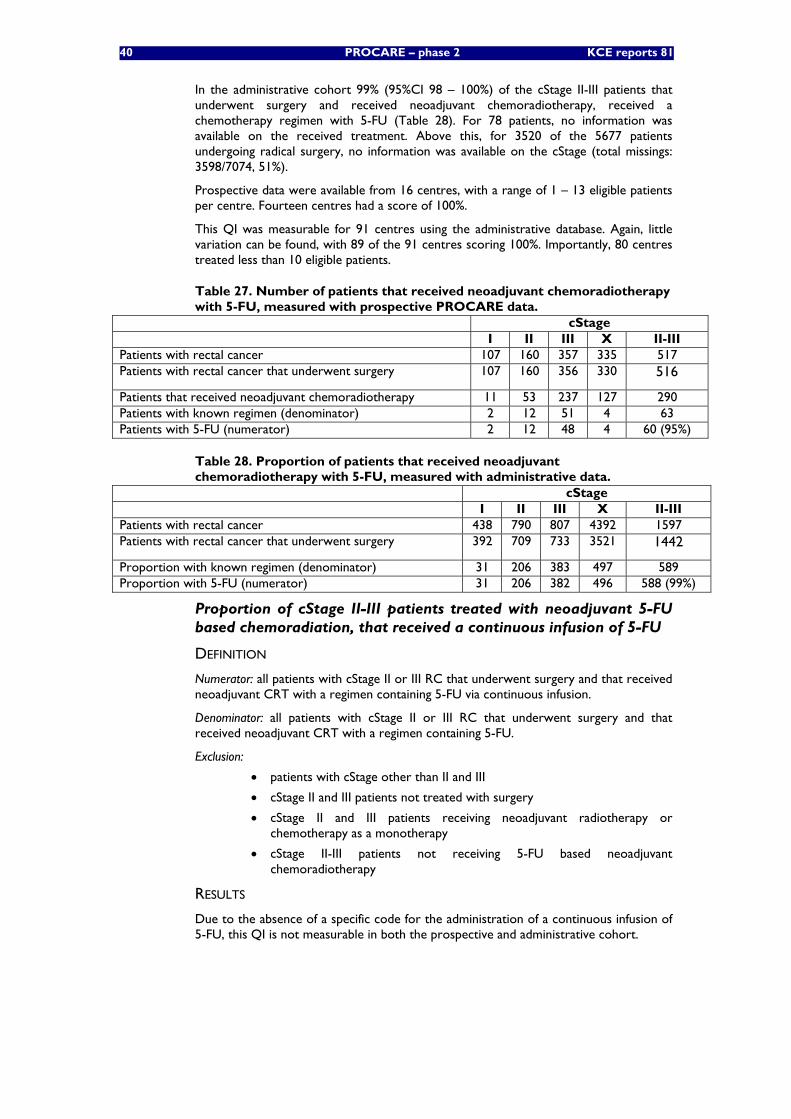
40 PROCARE – phase 2 KCE reports 81
In the administrative cohort 99% (95%CI 98 – 100%) of the cStage II-III patients that underwent surgery and received neoadjuvant chemoradiotherapy, received a chemotherapy regimen with 5-FU (Table 28). For 78 patients, no information was available on the received treatment. Above this, for 3520 of the 5677 patients undergoing radical surgery, no information was available on the cStage (total missings: 3598/7074, 51%).
Prospective data were available from 16 centres, with a range of 1 – 13 eligible patients per centre. Fourteen centres had a score of 100%.
This QI was measurable for 91 centres using the administrative database. Again, little variation can be found, with 89 of the 91 centres scoring 100%. Importantly, 80 centres treated less than 10 eligible patients.
Table 27. Number of patients that received neoadjuvant chemoradiotherapy with 5-FU, measured with prospective PROCARE data.
cStage I II III X II-III Patients with rectal cancer 107 160 357 335 517 Patients with rectal cancer that underwent surgery 107 160 356 330 516
Patients that received neoadjuvant chemoradiotherapy 11 53 237 127 290 Patients with known regimen (denominator) 2 12 51 4 63 Patients with 5-FU (numerator) 2 12 48 4 60 (95%)
Table 28. Proportion of patients that received neoadjuvant chemoradiotherapy with 5-FU, measured with administrative data.
cStage I II III X II-III Patients with rectal cancer 438 790 807 4392 1597 Patients with rectal cancer that underwent surgery 392 709 733 3521 1442
Proportion with known regimen (denominator) 31 206 383 497 589 Proportion with 5-FU (numerator) 31 206 382 496 588 (99%)
Proportion of cStage II-III patients treated with neoadjuvant 5-FU based chemoradiation, that received a continuous infusion of 5-FU
DEFINITION
Numerator: all patients with cStage II or III RC that underwent surgery and that received neoadjuvant CRT with a regimen containing 5-FU via continuous infusion.
Denominator: all patients with cStage II or III RC that underwent surgery and that received neoadjuvant CRT with a regimen containing 5-FU.
Exclusion:
• patients with cStage other than II and III
• cStage II and III patients not treated with surgery
• cStage II and III patients receiving neoadjuvant radiotherapy or chemotherapy as a monotherapy
• cStage II-III patients not receiving 5-FU based neoadjuvant chemoradiotherapy
RESULTS
Due to the absence of a specific code for the administration of a continuous infusion of 5-FU, this QI is not measurable in both the prospective and administrative cohort.
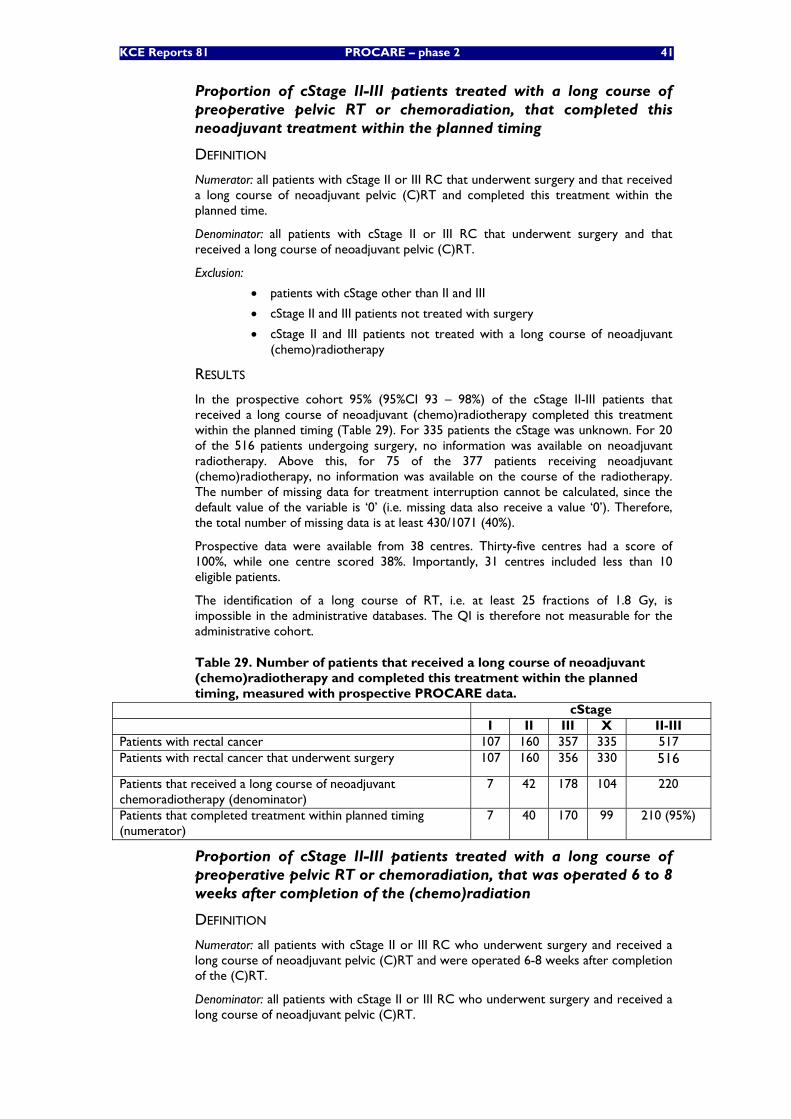
KCE Reports 81 PROCARE – phase 2 41
Proportion of cStage II-III patients treated with a long course of preoperative pelvic RT or chemoradiation, that completed this neoadjuvant treatment within the planned timing
DEFINITION
Numerator: all patients with cStage II or III RC that underwent surgery and that received a long course of neoadjuvant pelvic (C)RT and completed this treatment within the planned time.
Denominator: all patients with cStage II or III RC that underwent surgery and that received a long course of neoadjuvant pelvic (C)RT.
Exclusion:
• patients with cStage other than II and III
• cStage II and III patients not treated with surgery
• cStage II and III patients not treated with a long course of neoadjuvant (chemo)radiotherapy
RESULTS
In the prospective cohort 95% (95%CI 93 – 98%) of the cStage II-III patients that received a long course of neoadjuvant (chemo)radiotherapy completed this treatment within the planned timing (Table 29). For 335 patients the cStage was unknown. For 20 of the 516 patients undergoing surgery, no information was available on neoadjuvant radiotherapy. Above this, for 75 of the 377 patients receiving neoadjuvant (chemo)radiotherapy, no information was available on the course of the radiotherapy. The number of missing data for treatment interruption cannot be calculated, since the default value of the variable is ‘0’ (i.e. missing data also receive a value ‘0’). Therefore, the total number of missing data is at least 430/1071 (40%).
Prospective data were available from 38 centres. Thirty-five centres had a score of 100%, while one centre scored 38%. Importantly, 31 centres included less than 10 eligible patients.
The identification of a long course of RT, i.e. at least 25 fractions of 1.8 Gy, is impossible in the administrative databases. The QI is therefore not measurable for the administrative cohort.
Table 29. Number of patients that received a long course of neoadjuvant (chemo)radiotherapy and completed this treatment within the planned timing, measured with prospective PROCARE data.
cStage I II III X II-III Patients with rectal cancer 107 160 357 335 517 Patients with rectal cancer that underwent surgery 107 160 356 330 516
Patients that received a long course of neoadjuvant chemoradiotherapy (denominator)
7 42 178 104 220
Patients that completed treatment within planned timing (numerator)
7 40 170 99 210 (95%)
Proportion of cStage II-III patients treated with a long course of preoperative pelvic RT or chemoradiation, that was operated 6 to 8 weeks after completion of the (chemo)radiation
DEFINITION
Numerator: all patients with cStage II or III RC who underwent surgery and received a long course of neoadjuvant pelvic (C)RT and were operated 6-8 weeks after completion of the (C)RT.
Denominator: all patients with cStage II or III RC who underwent surgery and received a long course of neoadjuvant pelvic (C)RT.
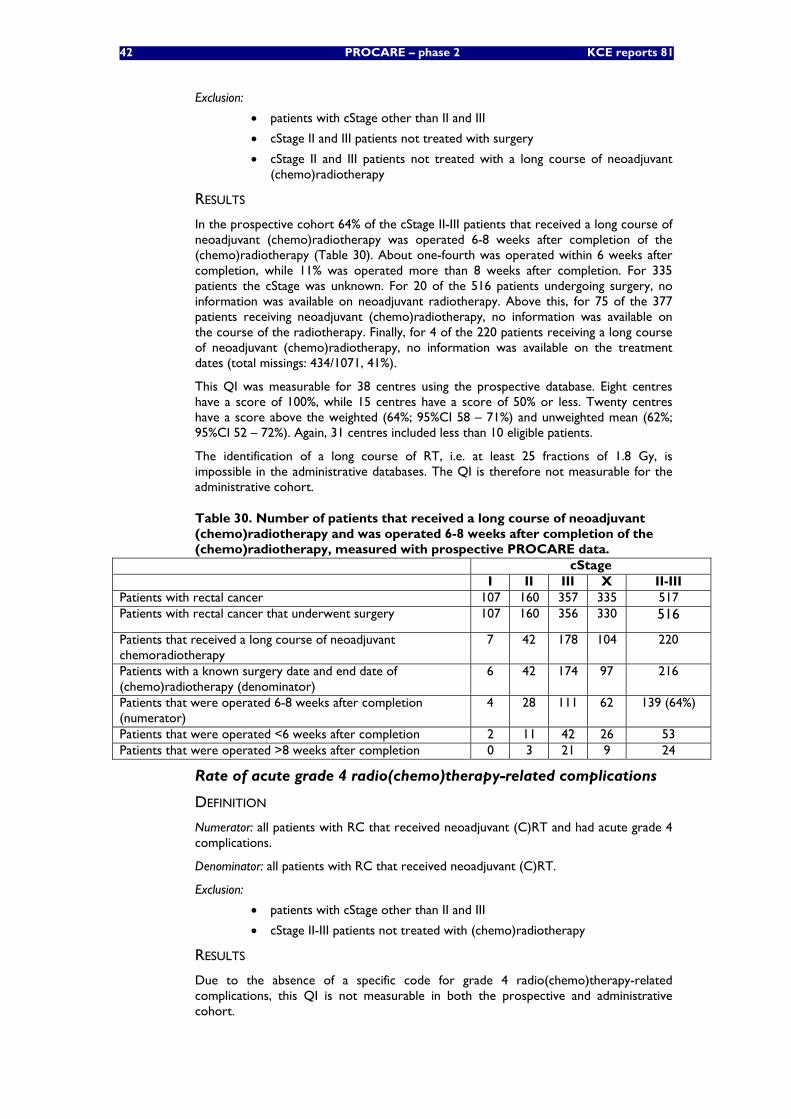
42 PROCARE – phase 2 KCE reports 81
Exclusion:
• patients with cStage other than II and III
• cStage II and III patients not treated with surgery
• cStage II and III patients not treated with a long course of neoadjuvant (chemo)radiotherapy
RESULTS
In the prospective cohort 64% of the cStage II-III patients that received a long course of neoadjuvant (chemo)radiotherapy was operated 6-8 weeks after completion of the (chemo)radiotherapy (Table 30). About one-fourth was operated within 6 weeks after completion, while 11% was operated more than 8 weeks after completion. For 335 patients the cStage was unknown. For 20 of the 516 patients undergoing surgery, no information was available on neoadjuvant radiotherapy. Above this, for 75 of the 377 patients receiving neoadjuvant (chemo)radiotherapy, no information was available on the course of the radiotherapy. Finally, for 4 of the 220 patients receiving a long course of neoadjuvant (chemo)radiotherapy, no information was available on the treatment dates (total missings: 434/1071, 41%).
This QI was measurable for 38 centres using the prospective database. Eight centres have a score of 100%, while 15 centres have a score of 50% or less. Twenty centres have a score above the weighted (64%; 95%CI 58 – 71%) and unweighted mean (62%; 95%CI 52 – 72%). Again, 31 centres included less than 10 eligible patients.
The identification of a long course of RT, i.e. at least 25 fractions of 1.8 Gy, is impossible in the administrative databases. The QI is therefore not measurable for the administrative cohort.
Table 30. Number of patients that received a long course of neoadjuvant (chemo)radiotherapy and was operated 6-8 weeks after completion of the (chemo)radiotherapy, measured with prospective PROCARE data.
cStage I II III X II-III Patients with rectal cancer 107 160 357 335 517 Patients with rectal cancer that underwent surgery 107 160 356 330 516
Patients that received a long course of neoadjuvant chemoradiotherapy
7 42 178 104 220
Patients with a known surgery date and end date of (chemo)radiotherapy (denominator)
6 42 174 97 216
Patients that were operated 6-8 weeks after completion (numerator)
4 28 111 62 139 (64%)
Patients that were operated <6 weeks after completion 2 11 42 26 53 Patients that were operated >8 weeks after completion 0 3 21 9 24
Rate of acute grade 4 radio(chemo)therapy-related complications
DEFINITION
Numerator: all patients with RC that received neoadjuvant (C)RT and had acute grade 4 complications.
Denominator: all patients with RC that received neoadjuvant (C)RT.
Exclusion:
• patients with cStage other than II and III
• cStage II-III patients not treated with (chemo)radiotherapy
RESULTS
Due to the absence of a specific code for grade 4 radio(chemo)therapy-related complications, this QI is not measurable in both the prospective and administrative cohort.
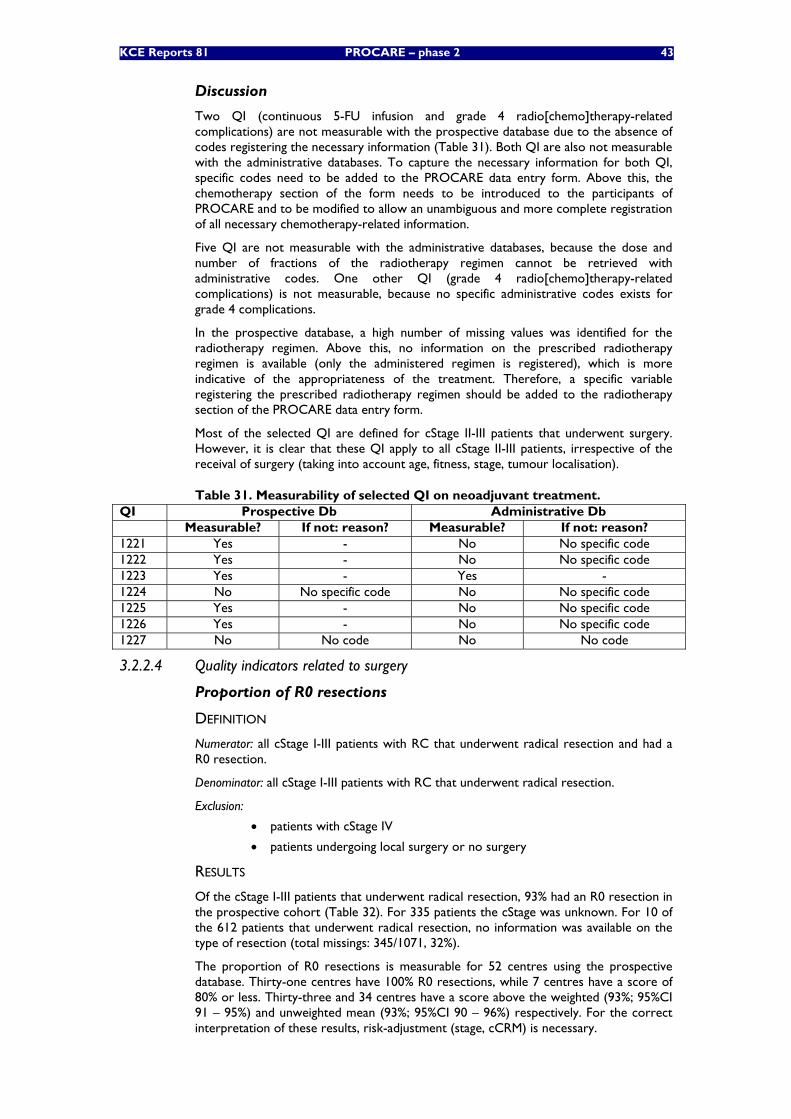
KCE Reports 81 PROCARE – phase 2 43
Discussion
Two QI (continuous 5-FU infusion and grade 4 radio[chemo]therapy-related complications) are not measurable with the prospective database due to the absence of codes registering the necessary information (Table 31). Both QI are also not measurable with the administrative databases. To capture the necessary information for both QI, specific codes need to be added to the PROCARE data entry form. Above this, the chemotherapy section of the form needs to be introduced to the participants of PROCARE and to be modified to allow an unambiguous and more complete registration of all necessary chemotherapy-related information.
Five QI are not measurable with the administrative databases, because the dose and number of fractions of the radiotherapy regimen cannot be retrieved with administrative codes. One other QI (grade 4 radio[chemo]therapy-related complications) is not measurable, because no specific administrative codes exists for grade 4 complications.
In the prospective database, a high number of missing values was identified for the radiotherapy regimen. Above this, no information on the prescribed radiotherapy regimen is available (only the administered regimen is registered), which is more indicative of the appropriateness of the treatment. Therefore, a specific variable registering the prescribed radiotherapy regimen should be added to the radiotherapy section of the PROCARE data entry form.
Most of the selected QI are defined for cStage II-III patients that underwent surgery. However, it is clear that these QI apply to all cStage II-III patients, irrespective of the receival of surgery (taking into account age, fitness, stage, tumour localisation).
Table 31. Measurability of selected QI on neoadjuvant treatment. QI Prospective Db Administrative Db Measurable? If not: reason? Measurable? If not: reason? 1221 Yes - No No specific code 1222 Yes - No No specific code 1223 Yes - Yes - 1224 No No specific code No No specific code 1225 Yes - No No specific code 1226 Yes - No No specific code 1227 No No code No No code
3.2.2.4 Quality indicators related to surgery
Proportion of R0 resections
DEFINITION
Numerator: all cStage I-III patients with RC that underwent radical resection and had a R0 resection.
Denominator: all cStage I-III patients with RC that underwent radical resection.
Exclusion:
• patients with cStage IV
• patients undergoing local surgery or no surgery
RESULTS
Of the cStage I-III patients that underwent radical resection, 93% had an R0 resection in the prospective cohort (Table 32). For 335 patients the cStage was unknown. For 10 of the 612 patients that underwent radical resection, no information was available on the type of resection (total missings: 345/1071, 32%).
The proportion of R0 resections is measurable for 52 centres using the prospective database. Thirty-one centres have 100% R0 resections, while 7 centres have a score of 80% or less. Thirty-three and 34 centres have a score above the weighted (93%; 95%CI 91 – 95%) and unweighted mean (93%; 95%CI 90 – 96%) respectively. For the correct interpretation of these results, risk-adjustment (stage, cCRM) is necessary.
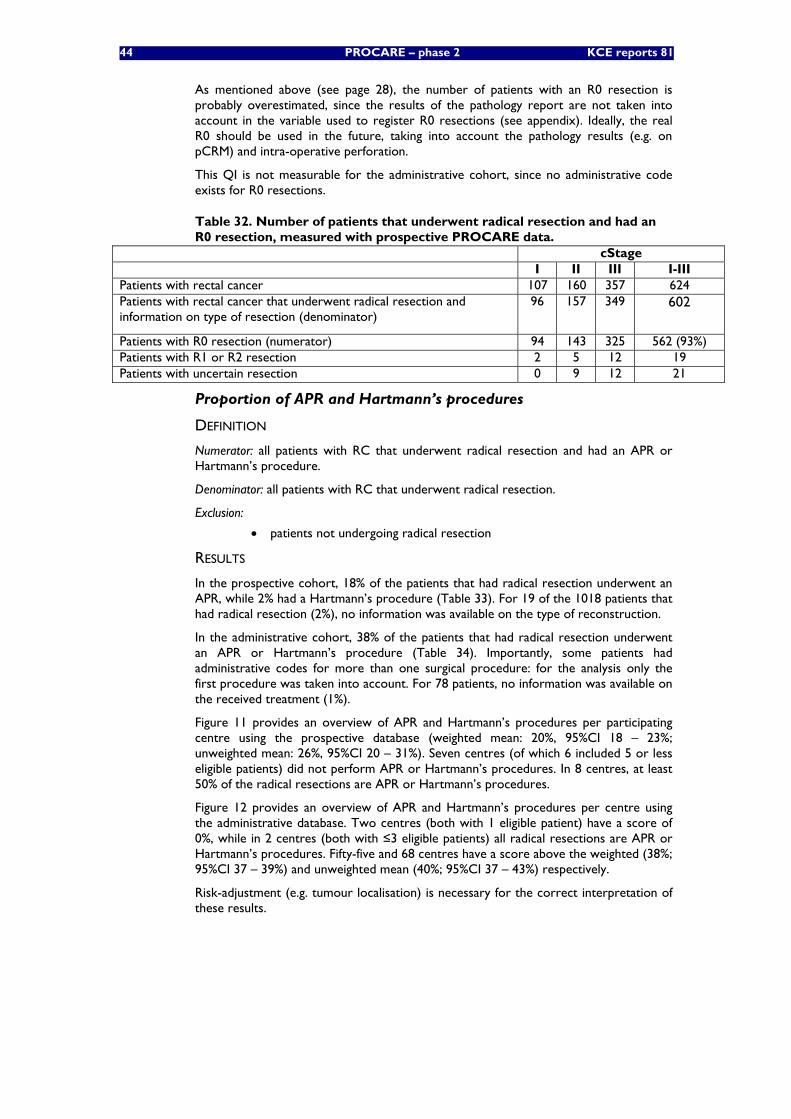
44 PROCARE – phase 2 KCE reports 81
As mentioned above (see page 28), the number of patients with an R0 resection is probably overestimated, since the results of the pathology report are not taken into account in the variable used to register R0 resections (see appendix). Ideally, the real R0 should be used in the future, taking into account the pathology results (e.g. on pCRM) and intra-operative perforation.
This QI is not measurable for the administrative cohort, since no administrative code exists for R0 resections.
Table 32. Number of patients that underwent radical resection and had an R0 resection, measured with prospective PROCARE data.
cStage I II III I-III Patients with rectal cancer 107 160 357 624 Patients with rectal cancer that underwent radical resection and information on type of resection (denominator)
96 157 349 602
Patients with R0 resection (numerator) 94 143 325 562 (93%) Patients with R1 or R2 resection 2 5 12 19 Patients with uncertain resection 0 9 12 21
Proportion of APR and Hartmann’s procedures
DEFINITION
Numerator: all patients with RC that underwent radical resection and had an APR or Hartmann’s procedure.
Denominator: all patients with RC that underwent radical resection.
Exclusion:
• patients not undergoing radical resection
RESULTS
In the prospective cohort, 18% of the patients that had radical resection underwent an APR, while 2% had a Hartmann’s procedure (Table 33). For 19 of the 1018 patients that had radical resection (2%), no information was available on the type of reconstruction.
In the administrative cohort, 38% of the patients that had radical resection underwent an APR or Hartmann’s procedure (Table 34). Importantly, some patients had administrative codes for more than one surgical procedure: for the analysis only the first procedure was taken into account. For 78 patients, no information was available on the received treatment (1%).
Figure 11 provides an overview of APR and Hartmann’s procedures per participating centre using the prospective database (weighted mean: 20%, 95%CI 18 – 23%; unweighted mean: 26%, 95%CI 20 – 31%). Seven centres (of which 6 included 5 or less eligible patients) did not perform APR or Hartmann’s procedures. In 8 centres, at least 50% of the radical resections are APR or Hartmann’s procedures.
Figure 12 provides an overview of APR and Hartmann’s procedures per centre using the administrative database. Two centres (both with 1 eligible patient) have a score of 0%, while in 2 centres (both with ≤3 eligible patients) all radical resections are APR or Hartmann’s procedures. Fifty-five and 68 centres have a score above the weighted (38%; 95%CI 37 – 39%) and unweighted mean (40%; 95%CI 37 – 43%) respectively.
Risk-adjustment (e.g. tumour localisation) is necessary for the correct interpretation of these results.
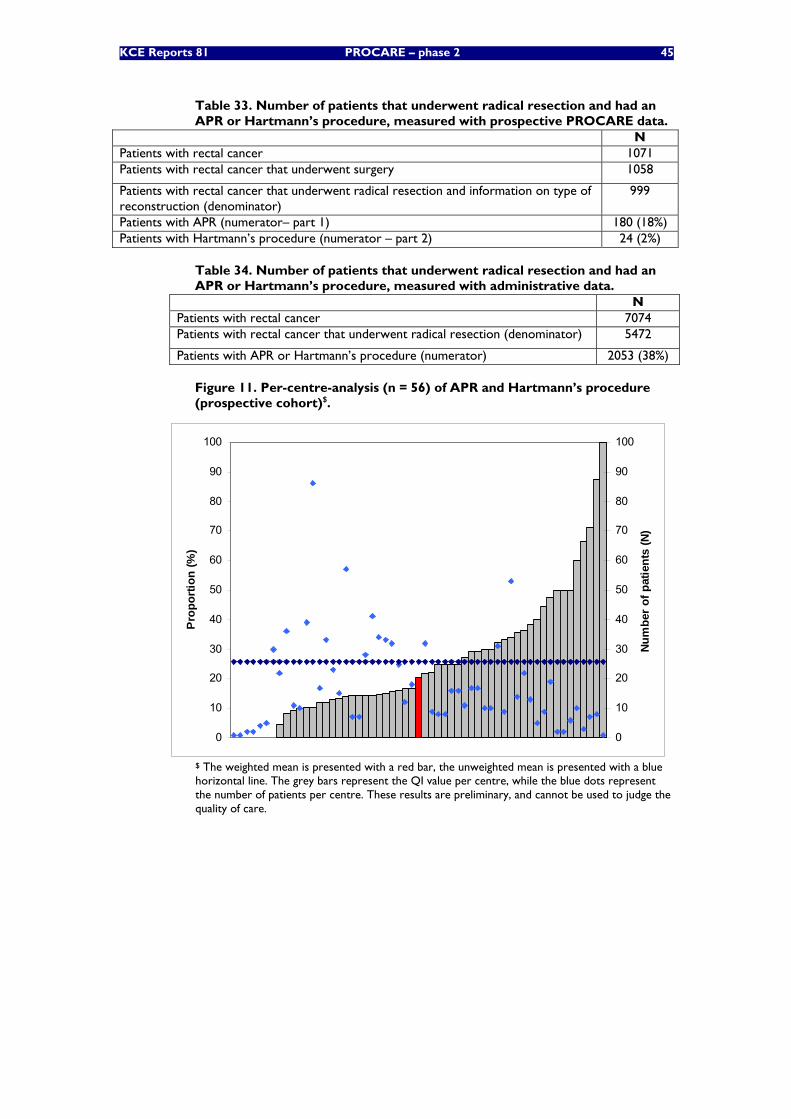
KCE Reports 81 PROCARE – phase 2 45
Table 33. Number of patients that underwent radical resection and had an APR or Hartmann’s procedure, measured with prospective PROCARE data.
N Patients with rectal cancer 1071 Patients with rectal cancer that underwent surgery 1058
Patients with rectal cancer that underwent radical resection and information on type of reconstruction (denominator)
999
Patients with APR (numerator– part 1) 180 (18%) Patients with Hartmann’s procedure (numerator – part 2) 24 (2%)
Table 34. Number of patients that underwent radical resection and had an APR or Hartmann’s procedure, measured with administrative data.
N Patients with rectal cancer 7074 Patients with rectal cancer that underwent radical resection (denominator) 5472
Patients with APR or Hartmann’s procedure (numerator) 2053 (38%)
Figure 11. Per-centre-analysis (n = 56) of APR and Hartmann’s procedure (prospective cohort)$.
0
10
20
30
40
50
60
70
80
90
100
Pro
port
ion
(%)
0
10
20
30
40
50
60
70
80
90
100
Num
ber
of p
atie
nts
(N)
$ The weighted mean is presented with a red bar, the unweighted mean is presented with a blue horizontal line. The grey bars represent the QI value per centre, while the blue dots represent the number of patients per centre. These results are preliminary, and cannot be used to judge the quality of care.
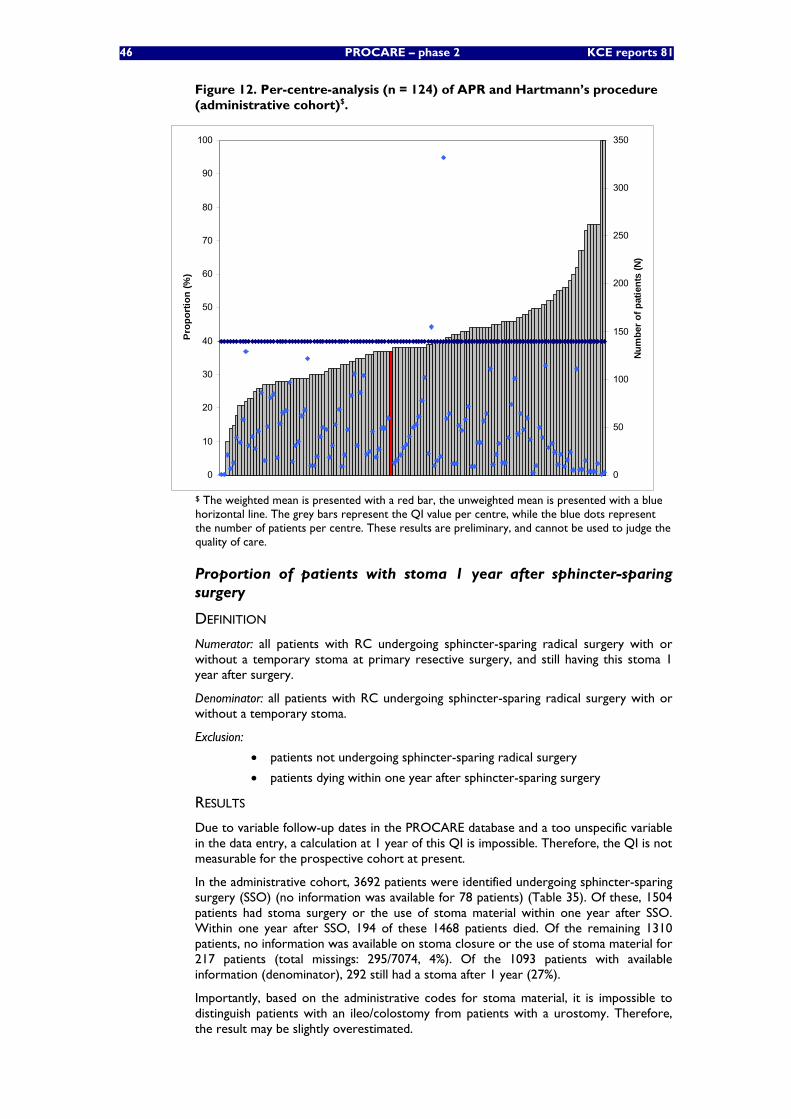
46 PROCARE – phase 2 KCE reports 81
Figure 12. Per-centre-analysis (n = 124) of APR and Hartmann’s procedure (administrative cohort)$.
0
10
20
30
40
50
60
70
80
90
100
Prop
ortio
n (%
)
0
50
100
150
200
250
300
350
Num
ber o
f pat
ient
s (N
)
$ The weighted mean is presented with a red bar, the unweighted mean is presented with a blue horizontal line. The grey bars represent the QI value per centre, while the blue dots represent the number of patients per centre. These results are preliminary, and cannot be used to judge the quality of care.
Proportion of patients with stoma 1 year after sphincter-sparing surgery
DEFINITION
Numerator: all patients with RC undergoing sphincter-sparing radical surgery with or without a temporary stoma at primary resective surgery, and still having this stoma 1 year after surgery.
Denominator: all patients with RC undergoing sphincter-sparing radical surgery with or without a temporary stoma.
Exclusion:
• patients not undergoing sphincter-sparing radical surgery
• patients dying within one year after sphincter-sparing surgery
RESULTS
Due to variable follow-up dates in the PROCARE database and a too unspecific variable in the data entry, a calculation at 1 year of this QI is impossible. Therefore, the QI is not measurable for the prospective cohort at present.
In the administrative cohort, 3692 patients were identified undergoing sphincter-sparing surgery (SSO) (no information was available for 78 patients) (Table 35). Of these, 1504 patients had stoma surgery or the use of stoma material within one year after SSO. Within one year after SSO, 194 of these 1468 patients died. Of the remaining 1310 patients, no information was available on stoma closure or the use of stoma material for 217 patients (total missings: 295/7074, 4%). Of the 1093 patients with available information (denominator), 292 still had a stoma after 1 year (27%).
Importantly, based on the administrative codes for stoma material, it is impossible to distinguish patients with an ileo/colostomy from patients with a urostomy. Therefore, the result may be slightly overestimated.
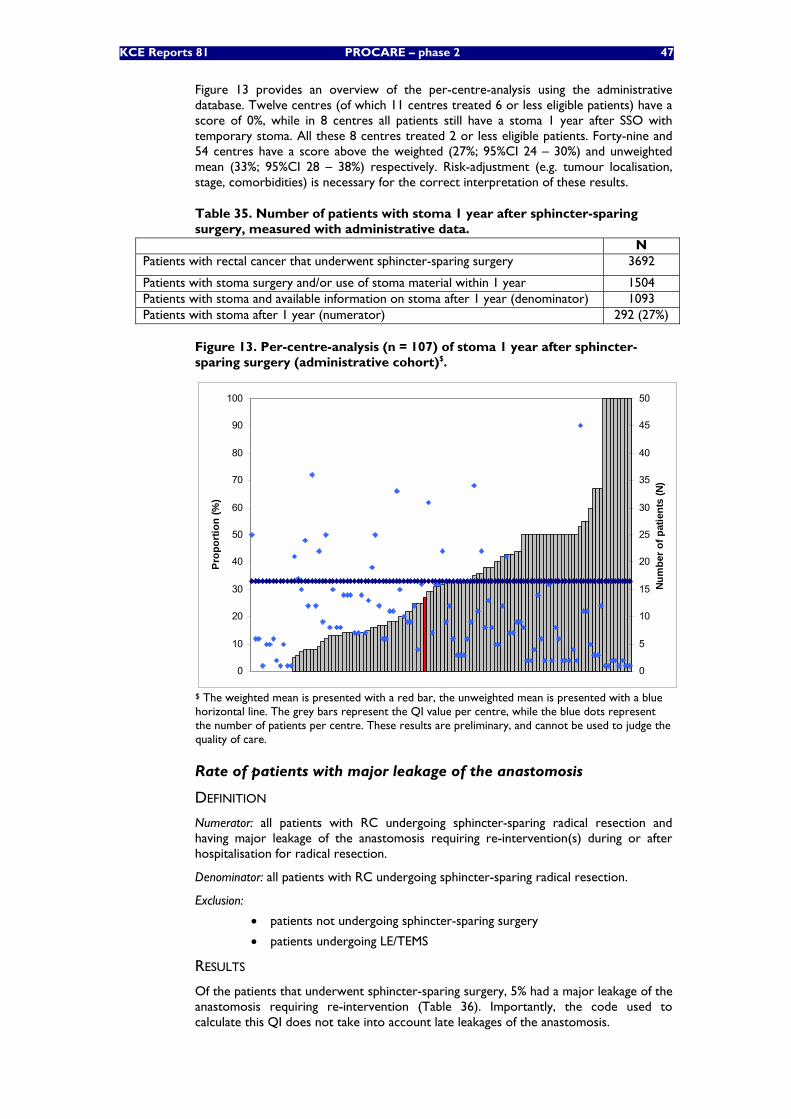
KCE Reports 81 PROCARE – phase 2 47
Figure 13 provides an overview of the per-centre-analysis using the administrative database. Twelve centres (of which 11 centres treated 6 or less eligible patients) have a score of 0%, while in 8 centres all patients still have a stoma 1 year after SSO with temporary stoma. All these 8 centres treated 2 or less eligible patients. Forty-nine and 54 centres have a score above the weighted (27%; 95%CI 24 – 30%) and unweighted mean (33%; 95%CI 28 – 38%) respectively. Risk-adjustment (e.g. tumour localisation, stage, comorbidities) is necessary for the correct interpretation of these results.
Table 35. Number of patients with stoma 1 year after sphincter-sparing surgery, measured with administrative data.
N Patients with rectal cancer that underwent sphincter-sparing surgery 3692
Patients with stoma surgery and/or use of stoma material within 1 year 1504 Patients with stoma and available information on stoma after 1 year (denominator) 1093 Patients with stoma after 1 year (numerator) 292 (27%)
Figure 13. Per-centre-analysis (n = 107) of stoma 1 year after sphincter-sparing surgery (administrative cohort)$.
0
10
20
30
40
50
60
70
80
90
100
Pro
port
ion
(%)
0
5
10
15
20
25
30
35
40
45
50
Num
ber
of p
atie
nts
(N)
$ The weighted mean is presented with a red bar, the unweighted mean is presented with a blue horizontal line. The grey bars represent the QI value per centre, while the blue dots represent the number of patients per centre. These results are preliminary, and cannot be used to judge the quality of care.
Rate of patients with major leakage of the anastomosis
DEFINITION
Numerator: all patients with RC undergoing sphincter-sparing radical resection and having major leakage of the anastomosis requiring re-intervention(s) during or after hospitalisation for radical resection.
Denominator: all patients with RC undergoing sphincter-sparing radical resection.
Exclusion:
• patients not undergoing sphincter-sparing surgery
• patients undergoing LE/TEMS
RESULTS
Of the patients that underwent sphincter-sparing surgery, 5% had a major leakage of the anastomosis requiring re-intervention (Table 36). Importantly, the code used to calculate this QI does not take into account late leakages of the anastomosis.
48 PROCARE – phase 2 KCE reports 81
For 108 of the 1058 patients that underwent surgery, no information was available on the type of surgery.
Above this, for 10 of the 734 patients undergoing sphincter-sparing surgery, no information was available on the occurrence of leakage of the anastomosis (total missings: 118/1071, 11%).
Major leakage of the anastomosis is measurable for 53 centres using the prospective database. Thirty-two centres have no major leakages, while 9 centres have a score of 10% or more. Thirty-seven and 35 centres have a score above the weighted (5%; 95%CI 3 – 6%) and unweighted mean (4%; 95%CI 2 – 5%) respectively. Risk-adjustment (tumour localisation, presence of stoma at primary surgery) is necessary for the correct interpretation of these results.
For the administrative cohort no specific code is available for leakage of the anastomosis. The QI is therefore not measurable for these patients.
Table 36. Number of patients that underwent sphincter-sparing surgery and had a major leakage of the anastomosis, measured with prospective PROCARE data.
N Patients with rectal cancer 1071 Patients with rectal cancer that underwent surgery 1058
Patients with rectal cancer that underwent sphincter-sparing surgery and have information on leakage (denominator)
724
Patients with major leakage (numerator) 33 (5%) Patients with minor leakage 22
Inpatient or 30-day mortality
DEFINITION
Numerator: all patients with RC that underwent surgery and died in hospital and/or within 30 days after primary surgery.
Denominator: all patients with RC that underwent surgery.
Exclusion:
• patients treated abroad
• patients without a social security number
• patients without a Belgian postal code
• patients without a known incidence date or with an incidence date after December 31st 2006
• patients with a surgery date after December 1st 2006
RESULTS
Inpatient or 30-day mortality in the prospective cohort is 3% (Table 37). For 7 patients no social security number and Belgian postal code was available.
Above this, for 26 of the 1064 patients with a social security number and Belgian postal code that underwent surgery, no surgery date was available (total missings: 33/1071, 3%).
In theory, the QI can be underestimated, since some patients having had surgery before December 2nd 2006 could have died in hospital after December 31st 2006. However, this was manually checked and didn’t occur.
In the administrative cohort, inpatient or 30-day mortality is 5% (281/5863). For 78 of the 7074 rectal cancer patients, no information was available on treatment. Above this, for 41 of the 5904 patients that underwent (resective) surgery, no information was available on hospitalisation date (total missings: 119/7074, 2%).
The inpatient or 30-day mortality is measurable for 54 centres using the prospective database. Thirty-seven centres have a score of 0%, while 7 centres have a score of 10% or more. Thirty-eight centres have a score above the weighted (3%; 95%CI 2 – 4%) and unweighted mean (3%; 95%CI 1 – 4%).
KCE Reports 81 PROCARE – phase 2 49
Using the administrative database, this QI is measurable for 124 centres. Thirty-two centres have a score of 0%, while in 14 centres the inpatient or 30-day mortality exceeds 10%. Sixty-three centres have a score above the weighted (5%; 95%CI 4 – 6%) and unweighted mean (5%; 95%CI 4 – 6%).
Importantly, extensive risk-adjustment (e.g. age, stage, comorbidities) is necessary for the correct interpretation of these results.
Table 37. Inpatient or 30-day mortality, measured with prospective PROCARE data.
N Patients with rectal cancer 1071 Patients with social security number and Belgian postal code, and underwent surgery 1064
Patients with surgery before December 2nd 2006 (denominator) 693 Patients that died in hospital or within 30 days after surgery (numerator) 20 (3%)
Rate of intra-operative rectal perforation
DEFINITION
Numerator: all patients with RC that underwent radical resection and had intra-operative rectal perforation.
Denominator: all patients with RC that underwent radical resection.
Exclusion:
• patients not undergoing radical resection
RESULTS
Seven percent of the PROCARE patients undergoing radical resection had a rectal perforation during surgery (Table 38). It was not possible to identify missing data, since the default value of the variable was ‘0’ (see appendix).
Intra-operative rectal perforation is measurable for 56 centres using the prospective database. Twenty-five centres have a score of 0%, while 17 centres have a score of 10% or more. Thirty-five centres have a score above the weighted (7%; 95%CI 5 – 8%) and unweighted mean (6%; 95%CI 4 – 8%). Risk-adjustment (tumour localisation [including dorsal – ventral], stage) is necessary for the correct interpretation of these results.
The QI is not measurable for the administrative cohort, since no specific code exists for intra-operative rectal perforation.
Table 38. Number of intra-operative rectal perforations, measured with prospective PROCARE data.
N Patients with rectal cancer 1071 Patients having radical resection (denominator) 1018
Patients with intra-operative rectal perforation (numerator) 69 (7%)
Discussion
Using the prospective database, 5 of the 6 surgical QI are measurable (Table 39). The rate of stoma at 1 year after SSO is not measurable at present, but can be rendered measurable by asking specifically for the presence of a stoma at 1 year. Another solution is to link the prospective database to the administrative databases, where this QI is already measurable. However, in that case, ileo/colostomies should be distinguished from urostomies, e.g. by excluding patients undergoing a Bricker’s procedure.
Three QI are not measurable using the administrative databases due to the absence of administrative codes (for R0 resection, major leakage of the anastomosis and intra-operative perforation). All three QI are measurable using the prospective database.
As already stated, in the number of R0 resections the results of the pathology report are not taken into account at present. Ideally, the real R0 should be used in the future, i.e. taking into account the pathology results and intra-operative perforation.
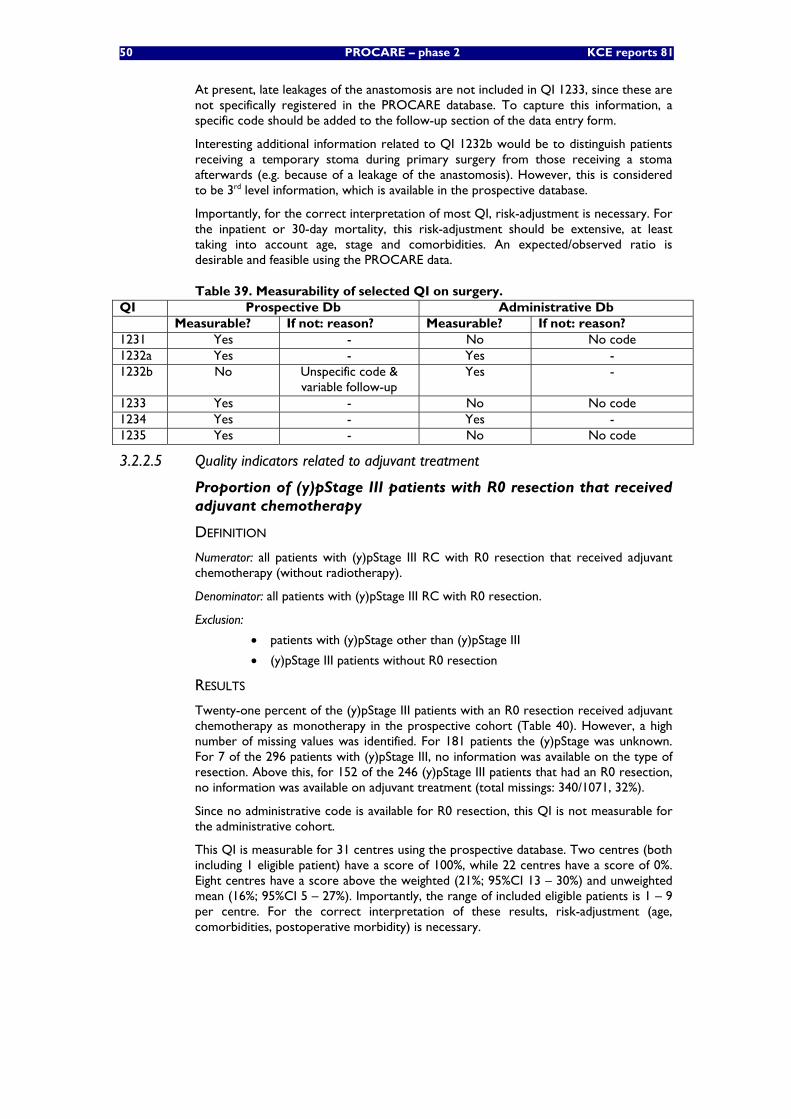
50 PROCARE – phase 2 KCE reports 81
At present, late leakages of the anastomosis are not included in QI 1233, since these are not specifically registered in the PROCARE database. To capture this information, a specific code should be added to the follow-up section of the data entry form.
Interesting additional information related to QI 1232b would be to distinguish patients receiving a temporary stoma during primary surgery from those receiving a stoma afterwards (e.g. because of a leakage of the anastomosis). However, this is considered to be 3rd level information, which is available in the prospective database.
Importantly, for the correct interpretation of most QI, risk-adjustment is necessary. For the inpatient or 30-day mortality, this risk-adjustment should be extensive, at least taking into account age, stage and comorbidities. An expected/observed ratio is desirable and feasible using the PROCARE data.
Table 39. Measurability of selected QI on surgery. QI Prospective Db Administrative Db Measurable? If not: reason? Measurable? If not: reason? 1231 Yes - No No code 1232a Yes - Yes - 1232b No Unspecific code &
variable follow-up Yes -
1233 Yes - No No code 1234 Yes - Yes - 1235 Yes - No No code
3.2.2.5 Quality indicators related to adjuvant treatment
Proportion of (y)pStage III patients with R0 resection that received adjuvant chemotherapy
DEFINITION
Numerator: all patients with (y)pStage III RC with R0 resection that received adjuvant chemotherapy (without radiotherapy).
Denominator: all patients with (y)pStage III RC with R0 resection.
Exclusion:
• patients with (y)pStage other than (y)pStage III
• (y)pStage III patients without R0 resection
RESULTS
Twenty-one percent of the (y)pStage III patients with an R0 resection received adjuvant chemotherapy as monotherapy in the prospective cohort (Table 40). However, a high number of missing values was identified. For 181 patients the (y)pStage was unknown. For 7 of the 296 patients with (y)pStage III, no information was available on the type of resection. Above this, for 152 of the 246 (y)pStage III patients that had an R0 resection, no information was available on adjuvant treatment (total missings: 340/1071, 32%).
Since no administrative code is available for R0 resection, this QI is not measurable for the administrative cohort.
This QI is measurable for 31 centres using the prospective database. Two centres (both including 1 eligible patient) have a score of 100%, while 22 centres have a score of 0%. Eight centres have a score above the weighted (21%; 95%CI 13 – 30%) and unweighted mean (16%; 95%CI 5 – 27%). Importantly, the range of included eligible patients is 1 – 9 per centre. For the correct interpretation of these results, risk-adjustment (age, comorbidities, postoperative morbidity) is necessary.
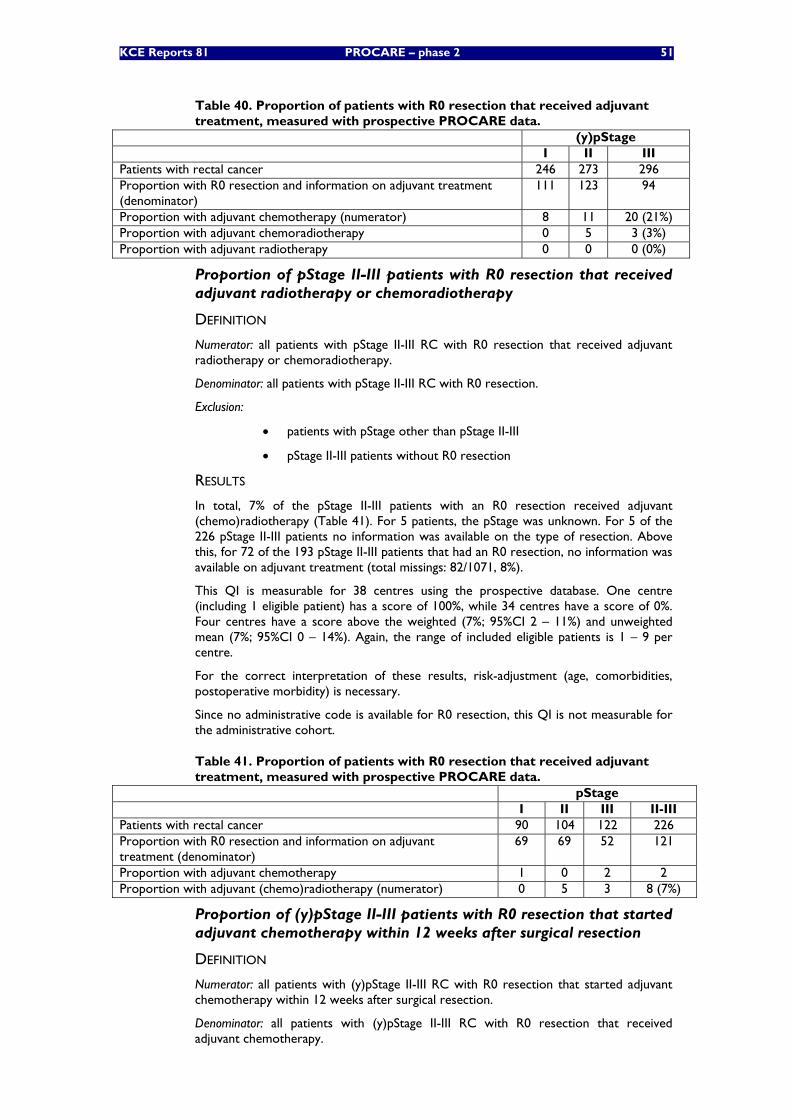
KCE Reports 81 PROCARE – phase 2 51
Table 40. Proportion of patients with R0 resection that received adjuvant treatment, measured with prospective PROCARE data.
(y)pStage I II III Patients with rectal cancer 246 273 296 Proportion with R0 resection and information on adjuvant treatment (denominator)
111 123 94
Proportion with adjuvant chemotherapy (numerator) 8 11 20 (21%) Proportion with adjuvant chemoradiotherapy 0 5 3 (3%) Proportion with adjuvant radiotherapy 0 0 0 (0%)
Proportion of pStage II-III patients with R0 resection that received adjuvant radiotherapy or chemoradiotherapy
DEFINITION
Numerator: all patients with pStage II-III RC with R0 resection that received adjuvant radiotherapy or chemoradiotherapy.
Denominator: all patients with pStage II-III RC with R0 resection.
Exclusion:
• patients with pStage other than pStage II-III
• pStage II-III patients without R0 resection
RESULTS
In total, 7% of the pStage II-III patients with an R0 resection received adjuvant (chemo)radiotherapy (Table 41). For 5 patients, the pStage was unknown. For 5 of the 226 pStage II-III patients no information was available on the type of resection. Above this, for 72 of the 193 pStage II-III patients that had an R0 resection, no information was available on adjuvant treatment (total missings: 82/1071, 8%).
This QI is measurable for 38 centres using the prospective database. One centre (including 1 eligible patient) has a score of 100%, while 34 centres have a score of 0%. Four centres have a score above the weighted (7%; 95%CI 2 – 11%) and unweighted mean (7%; 95%CI 0 – 14%). Again, the range of included eligible patients is 1 – 9 per centre.
For the correct interpretation of these results, risk-adjustment (age, comorbidities, postoperative morbidity) is necessary.
Since no administrative code is available for R0 resection, this QI is not measurable for the administrative cohort.
Table 41. Proportion of patients with R0 resection that received adjuvant treatment, measured with prospective PROCARE data.
pStage I II III II-III Patients with rectal cancer 90 104 122 226 Proportion with R0 resection and information on adjuvant treatment (denominator)
69 69 52 121
Proportion with adjuvant chemotherapy 1 0 2 2 Proportion with adjuvant (chemo)radiotherapy (numerator) 0 5 3 8 (7%)
Proportion of (y)pStage II-III patients with R0 resection that started adjuvant chemotherapy within 12 weeks after surgical resection
DEFINITION
Numerator: all patients with (y)pStage II-III RC with R0 resection that started adjuvant chemotherapy within 12 weeks after surgical resection.
Denominator: all patients with (y)pStage II-III RC with R0 resection that received adjuvant chemotherapy.
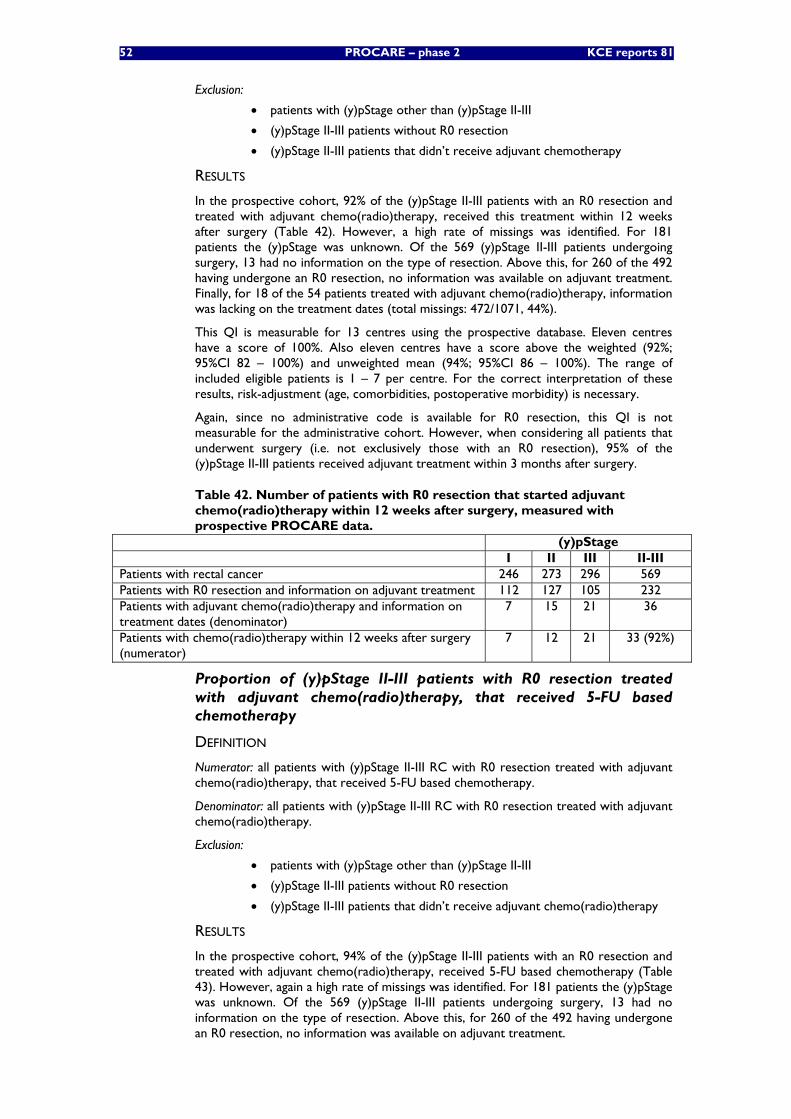
52 PROCARE – phase 2 KCE reports 81
Exclusion:
• patients with (y)pStage other than (y)pStage II-III
• (y)pStage II-III patients without R0 resection
• (y)pStage II-III patients that didn’t receive adjuvant chemotherapy
RESULTS
In the prospective cohort, 92% of the (y)pStage II-III patients with an R0 resection and treated with adjuvant chemo(radio)therapy, received this treatment within 12 weeks after surgery (Table 42). However, a high rate of missings was identified. For 181 patients the (y)pStage was unknown. Of the 569 (y)pStage II-III patients undergoing surgery, 13 had no information on the type of resection. Above this, for 260 of the 492 having undergone an R0 resection, no information was available on adjuvant treatment. Finally, for 18 of the 54 patients treated with adjuvant chemo(radio)therapy, information was lacking on the treatment dates (total missings: 472/1071, 44%).
This QI is measurable for 13 centres using the prospective database. Eleven centres have a score of 100%. Also eleven centres have a score above the weighted (92%; 95%CI 82 – 100%) and unweighted mean (94%; 95%CI 86 – 100%). The range of included eligible patients is 1 – 7 per centre. For the correct interpretation of these results, risk-adjustment (age, comorbidities, postoperative morbidity) is necessary.
Again, since no administrative code is available for R0 resection, this QI is not measurable for the administrative cohort. However, when considering all patients that underwent surgery (i.e. not exclusively those with an R0 resection), 95% of the (y)pStage II-III patients received adjuvant treatment within 3 months after surgery.
Table 42. Number of patients with R0 resection that started adjuvant chemo(radio)therapy within 12 weeks after surgery, measured with prospective PROCARE data.
(y)pStage I II III II-III Patients with rectal cancer 246 273 296 569 Patients with R0 resection and information on adjuvant treatment 112 127 105 232 Patients with adjuvant chemo(radio)therapy and information on treatment dates (denominator)
7 15 21 36
Patients with chemo(radio)therapy within 12 weeks after surgery (numerator)
7 12 21 33 (92%)
Proportion of (y)pStage II-III patients with R0 resection treated with adjuvant chemo(radio)therapy, that received 5-FU based chemotherapy
DEFINITION
Numerator: all patients with (y)pStage II-III RC with R0 resection treated with adjuvant chemo(radio)therapy, that received 5-FU based chemotherapy.
Denominator: all patients with (y)pStage II-III RC with R0 resection treated with adjuvant chemo(radio)therapy.
Exclusion:
• patients with (y)pStage other than (y)pStage II-III
• (y)pStage II-III patients without R0 resection
• (y)pStage II-III patients that didn’t receive adjuvant chemo(radio)therapy
RESULTS
In the prospective cohort, 94% of the (y)pStage II-III patients with an R0 resection and treated with adjuvant chemo(radio)therapy, received 5-FU based chemotherapy (Table 43). However, again a high rate of missings was identified. For 181 patients the (y)pStage was unknown. Of the 569 (y)pStage II-III patients undergoing surgery, 13 had no information on the type of resection. Above this, for 260 of the 492 having undergone an R0 resection, no information was available on adjuvant treatment.
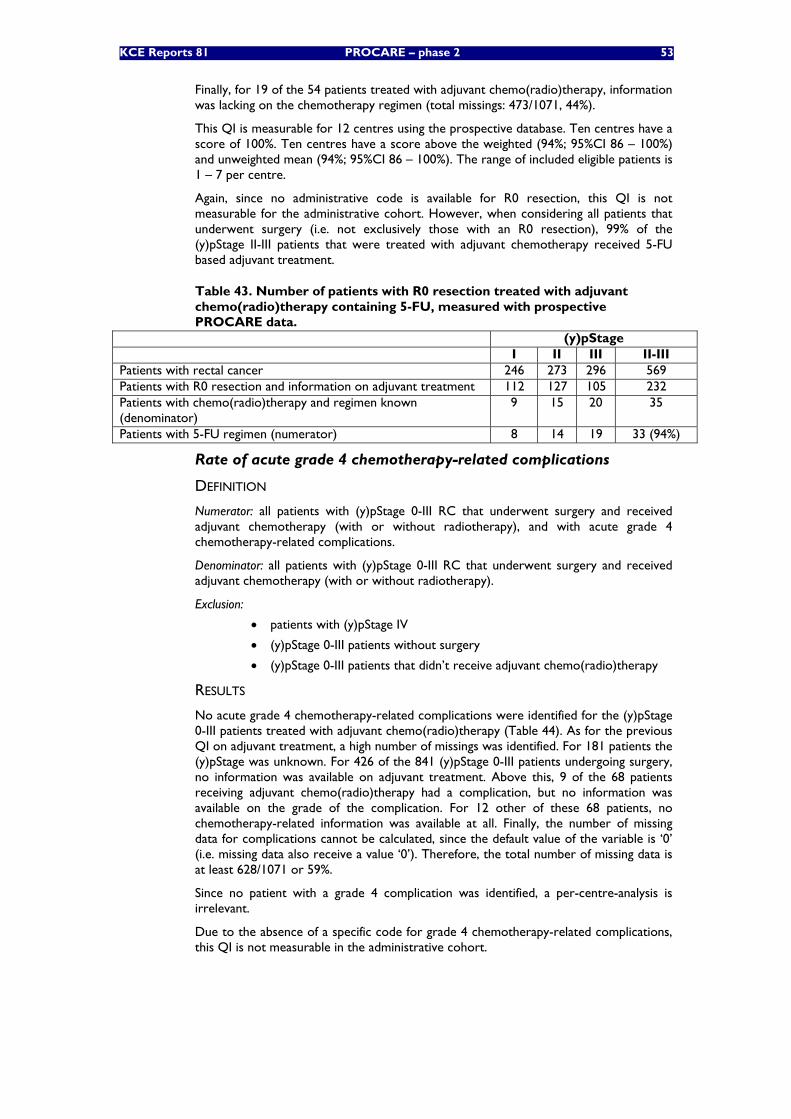
KCE Reports 81 PROCARE – phase 2 53
Finally, for 19 of the 54 patients treated with adjuvant chemo(radio)therapy, information was lacking on the chemotherapy regimen (total missings: 473/1071, 44%).
This QI is measurable for 12 centres using the prospective database. Ten centres have a score of 100%. Ten centres have a score above the weighted (94%; 95%CI 86 – 100%) and unweighted mean (94%; 95%CI 86 – 100%). The range of included eligible patients is 1 – 7 per centre.
Again, since no administrative code is available for R0 resection, this QI is not measurable for the administrative cohort. However, when considering all patients that underwent surgery (i.e. not exclusively those with an R0 resection), 99% of the (y)pStage II-III patients that were treated with adjuvant chemotherapy received 5-FU based adjuvant treatment.
Table 43. Number of patients with R0 resection treated with adjuvant chemo(radio)therapy containing 5-FU, measured with prospective PROCARE data.
(y)pStage I II III II-III Patients with rectal cancer 246 273 296 569 Patients with R0 resection and information on adjuvant treatment 112 127 105 232 Patients with chemo(radio)therapy and regimen known (denominator)
9 15 20 35
Patients with 5-FU regimen (numerator) 8 14 19 33 (94%)
Rate of acute grade 4 chemotherapy-related complications
DEFINITION
Numerator: all patients with (y)pStage 0-III RC that underwent surgery and received adjuvant chemotherapy (with or without radiotherapy), and with acute grade 4 chemotherapy-related complications.
Denominator: all patients with (y)pStage 0-III RC that underwent surgery and received adjuvant chemotherapy (with or without radiotherapy).
Exclusion:
• patients with (y)pStage IV
• (y)pStage 0-III patients without surgery
• (y)pStage 0-III patients that didn’t receive adjuvant chemo(radio)therapy
RESULTS
No acute grade 4 chemotherapy-related complications were identified for the (y)pStage 0-III patients treated with adjuvant chemo(radio)therapy (Table 44). As for the previous QI on adjuvant treatment, a high number of missings was identified. For 181 patients the (y)pStage was unknown. For 426 of the 841 (y)pStage 0-III patients undergoing surgery, no information was available on adjuvant treatment. Above this, 9 of the 68 patients receiving adjuvant chemo(radio)therapy had a complication, but no information was available on the grade of the complication. For 12 other of these 68 patients, no chemotherapy-related information was available at all. Finally, the number of missing data for complications cannot be calculated, since the default value of the variable is ‘0’ (i.e. missing data also receive a value ‘0’). Therefore, the total number of missing data is at least 628/1071 or 59%.
Since no patient with a grade 4 complication was identified, a per-centre-analysis is irrelevant.
Due to the absence of a specific code for grade 4 chemotherapy-related complications, this QI is not measurable in the administrative cohort.
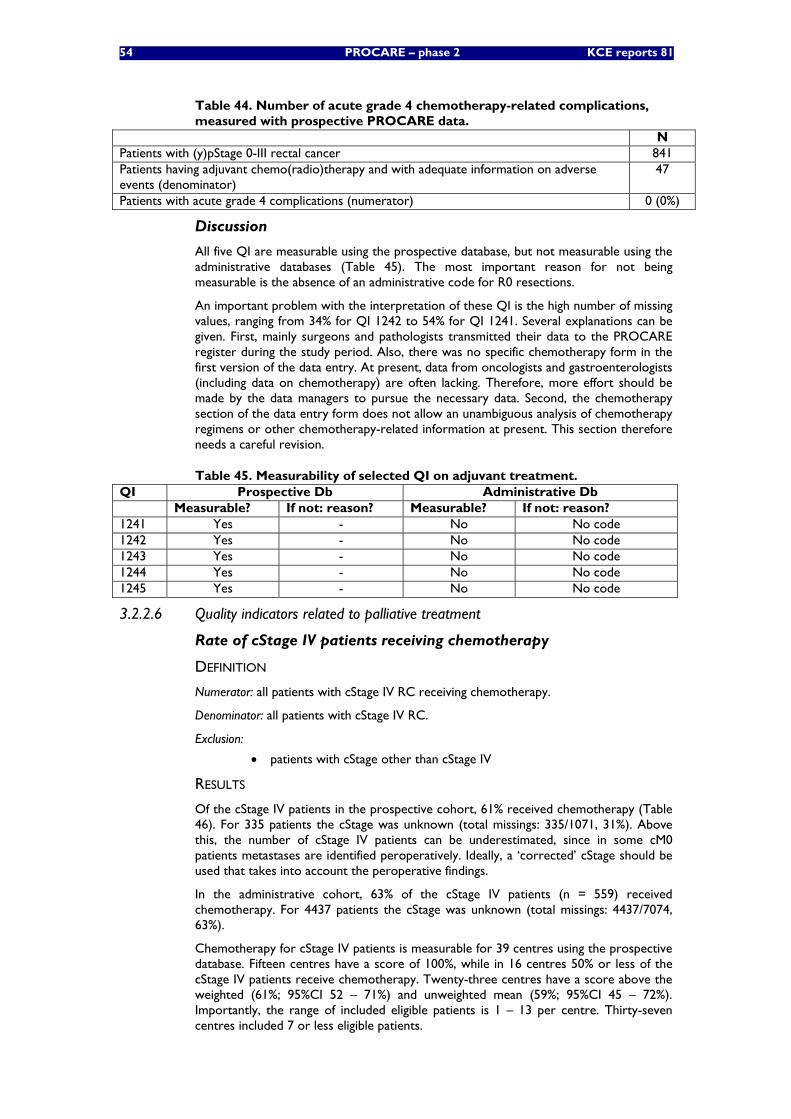
54 PROCARE – phase 2 KCE reports 81
Table 44. Number of acute grade 4 chemotherapy-related complications, measured with prospective PROCARE data.
N Patients with (y)pStage 0-III rectal cancer 841 Patients having adjuvant chemo(radio)therapy and with adequate information on adverse events (denominator)
47
Patients with acute grade 4 complications (numerator) 0 (0%)
Discussion
All five QI are measurable using the prospective database, but not measurable using the administrative databases (Table 45). The most important reason for not being measurable is the absence of an administrative code for R0 resections.
An important problem with the interpretation of these QI is the high number of missing values, ranging from 34% for QI 1242 to 54% for QI 1241. Several explanations can be given. First, mainly surgeons and pathologists transmitted their data to the PROCARE register during the study period. Also, there was no specific chemotherapy form in the first version of the data entry. At present, data from oncologists and gastroenterologists (including data on chemotherapy) are often lacking. Therefore, more effort should be made by the data managers to pursue the necessary data. Second, the chemotherapy section of the data entry form does not allow an unambiguous analysis of chemotherapy regimens or other chemotherapy-related information at present. This section therefore needs a careful revision.
Table 45. Measurability of selected QI on adjuvant treatment. QI Prospective Db Administrative Db Measurable? If not: reason? Measurable? If not: reason? 1241 Yes - No No code 1242 Yes - No No code 1243 Yes - No No code 1244 Yes - No No code 1245 Yes - No No code
3.2.2.6 Quality indicators related to palliative treatment
Rate of cStage IV patients receiving chemotherapy
DEFINITION
Numerator: all patients with cStage IV RC receiving chemotherapy.
Denominator: all patients with cStage IV RC.
Exclusion:
• patients with cStage other than cStage IV
RESULTS
Of the cStage IV patients in the prospective cohort, 61% received chemotherapy (Table 46). For 335 patients the cStage was unknown (total missings: 335/1071, 31%). Above this, the number of cStage IV patients can be underestimated, since in some cM0 patients metastases are identified peroperatively. Ideally, a ‘corrected’ cStage should be used that takes into account the peroperative findings.
In the administrative cohort, 63% of the cStage IV patients (n = 559) received chemotherapy. For 4437 patients the cStage was unknown (total missings: 4437/7074, 63%).
Chemotherapy for cStage IV patients is measurable for 39 centres using the prospective database. Fifteen centres have a score of 100%, while in 16 centres 50% or less of the cStage IV patients receive chemotherapy. Twenty-three centres have a score above the weighted (61%; 95%CI 52 – 71%) and unweighted mean (59%; 95%CI 45 – 72%). Importantly, the range of included eligible patients is 1 – 13 per centre. Thirty-seven centres included 7 or less eligible patients.
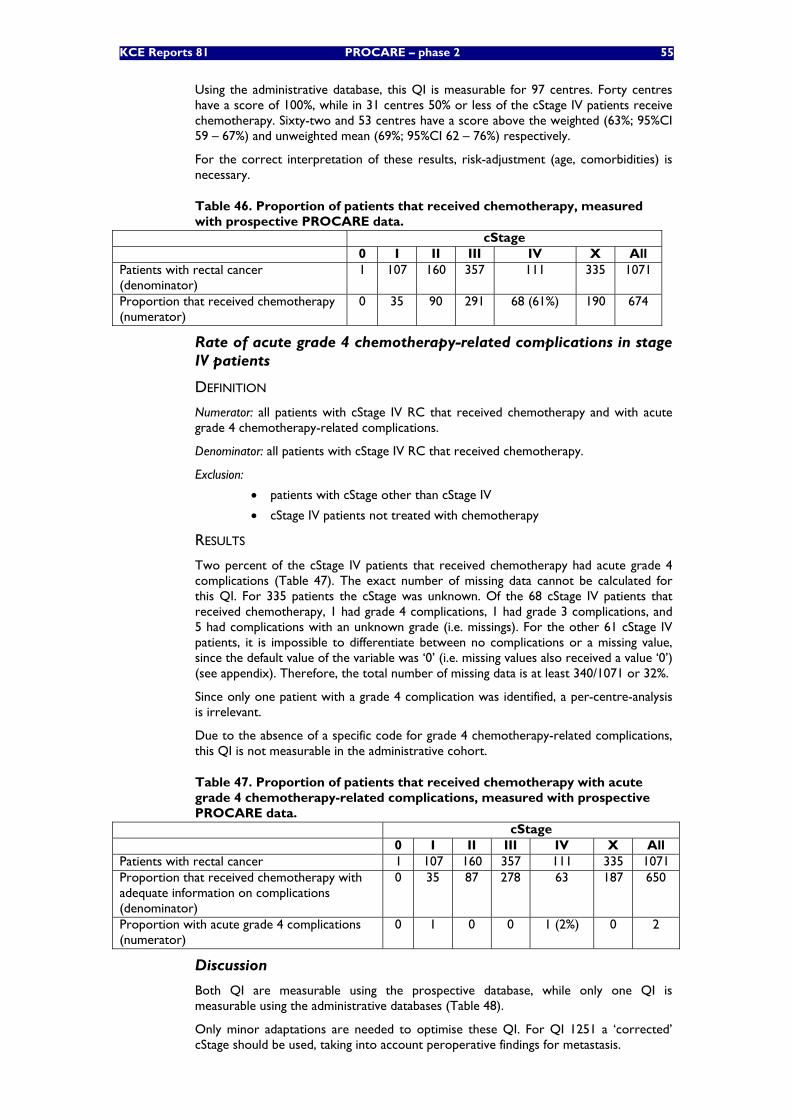
KCE Reports 81 PROCARE – phase 2 55
Using the administrative database, this QI is measurable for 97 centres. Forty centres have a score of 100%, while in 31 centres 50% or less of the cStage IV patients receive chemotherapy. Sixty-two and 53 centres have a score above the weighted (63%; 95%CI 59 – 67%) and unweighted mean (69%; 95%CI 62 – 76%) respectively.
For the correct interpretation of these results, risk-adjustment (age, comorbidities) is necessary.
Table 46. Proportion of patients that received chemotherapy, measured with prospective PROCARE data.
cStage 0 I II III IV X All Patients with rectal cancer (denominator)
1 107 160 357 111 335 1071
Proportion that received chemotherapy (numerator)
0 35 90 291 68 (61%) 190 674
Rate of acute grade 4 chemotherapy-related complications in stage IV patients
DEFINITION
Numerator: all patients with cStage IV RC that received chemotherapy and with acute grade 4 chemotherapy-related complications.
Denominator: all patients with cStage IV RC that received chemotherapy.
Exclusion:
• patients with cStage other than cStage IV
• cStage IV patients not treated with chemotherapy
RESULTS
Two percent of the cStage IV patients that received chemotherapy had acute grade 4 complications (Table 47). The exact number of missing data cannot be calculated for this QI. For 335 patients the cStage was unknown. Of the 68 cStage IV patients that received chemotherapy, 1 had grade 4 complications, 1 had grade 3 complications, and 5 had complications with an unknown grade (i.e. missings). For the other 61 cStage IV patients, it is impossible to differentiate between no complications or a missing value, since the default value of the variable was ‘0’ (i.e. missing values also received a value ‘0’) (see appendix). Therefore, the total number of missing data is at least 340/1071 or 32%.
Since only one patient with a grade 4 complication was identified, a per-centre-analysis is irrelevant.
Due to the absence of a specific code for grade 4 chemotherapy-related complications, this QI is not measurable in the administrative cohort.
Table 47. Proportion of patients that received chemotherapy with acute grade 4 chemotherapy-related complications, measured with prospective PROCARE data.
cStage 0 I II III IV X All Patients with rectal cancer 1 107 160 357 111 335 1071 Proportion that received chemotherapy with adequate information on complications (denominator)
0 35 87 278 63 187 650
Proportion with acute grade 4 complications (numerator)
0 1 0 0 1 (2%) 0 2
Discussion
Both QI are measurable using the prospective database, while only one QI is measurable using the administrative databases (Table 48).
Only minor adaptations are needed to optimise these QI. For QI 1251 a ‘corrected’ cStage should be used, taking into account peroperative findings for metastasis.
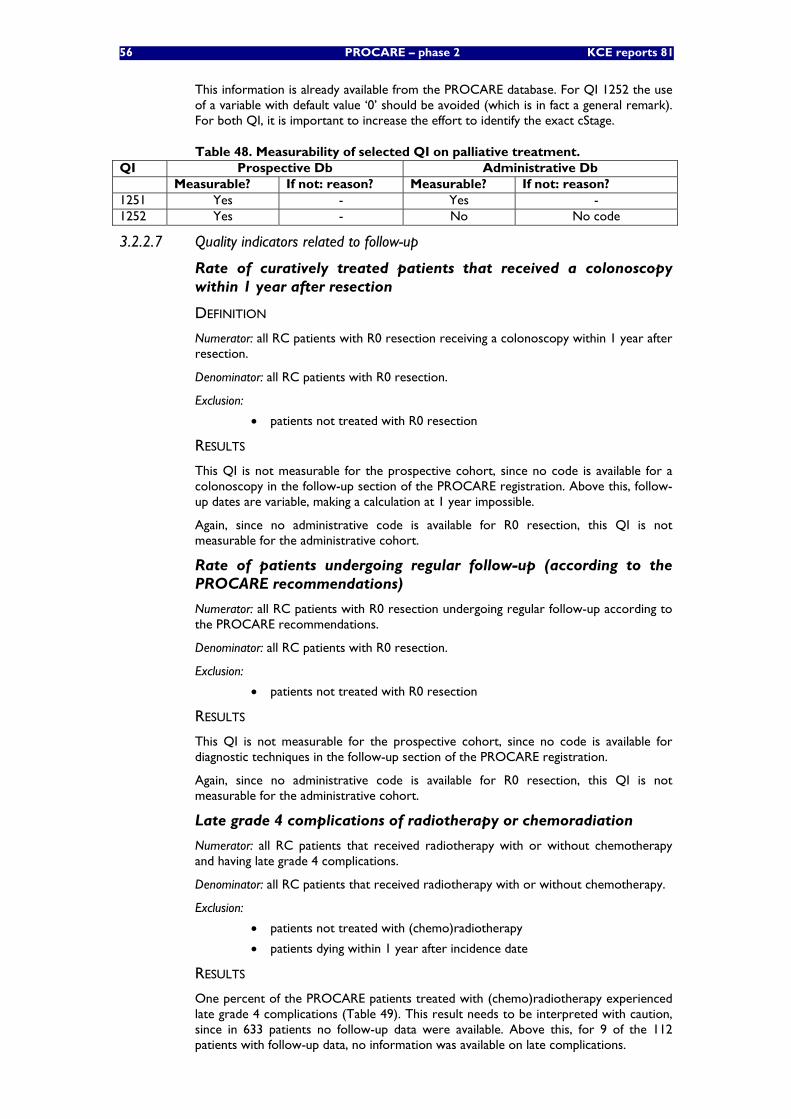
56 PROCARE – phase 2 KCE reports 81
This information is already available from the PROCARE database. For QI 1252 the use of a variable with default value ‘0’ should be avoided (which is in fact a general remark). For both QI, it is important to increase the effort to identify the exact cStage.
Table 48. Measurability of selected QI on palliative treatment. QI Prospective Db Administrative Db Measurable? If not: reason? Measurable? If not: reason? 1251 Yes - Yes - 1252 Yes - No No code
3.2.2.7 Quality indicators related to follow-up
Rate of curatively treated patients that received a colonoscopy within 1 year after resection
DEFINITION
Numerator: all RC patients with R0 resection receiving a colonoscopy within 1 year after resection.
Denominator: all RC patients with R0 resection.
Exclusion:
• patients not treated with R0 resection
RESULTS
This QI is not measurable for the prospective cohort, since no code is available for a colonoscopy in the follow-up section of the PROCARE registration. Above this, follow-up dates are variable, making a calculation at 1 year impossible.
Again, since no administrative code is available for R0 resection, this QI is not measurable for the administrative cohort.
Rate of patients undergoing regular follow-up (according to the PROCARE recommendations)
Numerator: all RC patients with R0 resection undergoing regular follow-up according to the PROCARE recommendations.
Denominator: all RC patients with R0 resection.
Exclusion:
• patients not treated with R0 resection
RESULTS
This QI is not measurable for the prospective cohort, since no code is available for diagnostic techniques in the follow-up section of the PROCARE registration.
Again, since no administrative code is available for R0 resection, this QI is not measurable for the administrative cohort.
Late grade 4 complications of radiotherapy or chemoradiation
Numerator: all RC patients that received radiotherapy with or without chemotherapy and having late grade 4 complications.
Denominator: all RC patients that received radiotherapy with or without chemotherapy.
Exclusion:
• patients not treated with (chemo)radiotherapy
• patients dying within 1 year after incidence date
RESULTS
One percent of the PROCARE patients treated with (chemo)radiotherapy experienced late grade 4 complications (Table 49). This result needs to be interpreted with caution, since in 633 patients no follow-up data were available. Above this, for 9 of the 112 patients with follow-up data, no information was available on late complications.
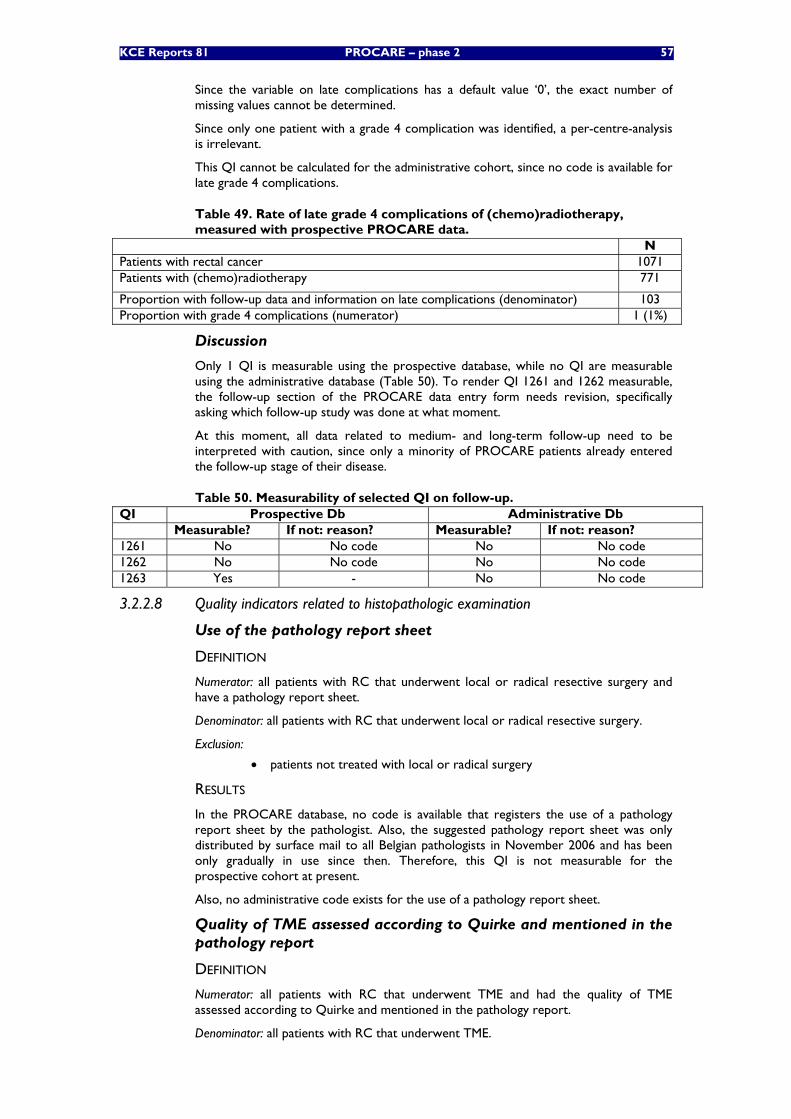
KCE Reports 81 PROCARE – phase 2 57
Since the variable on late complications has a default value ‘0’, the exact number of missing values cannot be determined.
Since only one patient with a grade 4 complication was identified, a per-centre-analysis is irrelevant.
This QI cannot be calculated for the administrative cohort, since no code is available for late grade 4 complications.
Table 49. Rate of late grade 4 complications of (chemo)radiotherapy, measured with prospective PROCARE data.
N Patients with rectal cancer 1071 Patients with (chemo)radiotherapy 771
Proportion with follow-up data and information on late complications (denominator) 103 Proportion with grade 4 complications (numerator) 1 (1%)
Discussion
Only 1 QI is measurable using the prospective database, while no QI are measurable using the administrative database (Table 50). To render QI 1261 and 1262 measurable, the follow-up section of the PROCARE data entry form needs revision, specifically asking which follow-up study was done at what moment.
At this moment, all data related to medium- and long-term follow-up need to be interpreted with caution, since only a minority of PROCARE patients already entered the follow-up stage of their disease.
Table 50. Measurability of selected QI on follow-up. QI Prospective Db Administrative Db Measurable? If not: reason? Measurable? If not: reason? 1261 No No code No No code 1262 No No code No No code 1263 Yes - No No code
3.2.2.8 Quality indicators related to histopathologic examination
Use of the pathology report sheet
DEFINITION
Numerator: all patients with RC that underwent local or radical resective surgery and have a pathology report sheet.
Denominator: all patients with RC that underwent local or radical resective surgery.
Exclusion:
• patients not treated with local or radical surgery
RESULTS
In the PROCARE database, no code is available that registers the use of a pathology report sheet by the pathologist. Also, the suggested pathology report sheet was only distributed by surface mail to all Belgian pathologists in November 2006 and has been only gradually in use since then. Therefore, this QI is not measurable for the prospective cohort at present.
Also, no administrative code exists for the use of a pathology report sheet.
Quality of TME assessed according to Quirke and mentioned in the pathology report
DEFINITION
Numerator: all patients with RC that underwent TME and had the quality of TME assessed according to Quirke and mentioned in the pathology report.
Denominator: all patients with RC that underwent TME.
58 PROCARE – phase 2 KCE reports 81
Exclusion:
• patients not treated with TME
RESULTS
In 30% of the PROCARE patients undergoing TME, the quality of TME was mentioned in the pathology report (Table 51). For 76 of the 1058 patients that underwent surgery, no information was available on used surgical technique (total missings: 76/1071, 7%). Importantly, registration of the quality of TME only gradually started in November 2006. Therefore, the reported result is probably an underestimation.
This QI is measurable for 56 centres using the prospective database. Five centres have a score of 100%, while 26 centres score 0%. Twenty-four centres have a score above the weighted (30%; 95%CI 27 – 33%) and unweighted mean (29%; 95%CI 19 – 38%). For the correct interpretation of these results, risk-adjustment (tumour localisation, stage) is necessary.
No administrative code exists for the result of a TME quality assessment, which in fact is information that can only be retrieved from the medical file and the anatomopathological report. The QI is therefore not measurable for the administrative cohort.
Table 51. Quality of TME mentioned in the pathology report, measured with prospective PROCARE data.
N Patients with rectal cancer 1071 Proportion treated with surgery 1058
Proportion treated with TME (denominator) 833 Porportion with quality of TME mentioned in the pathology report (numerator) 252 (30%)
Distal tumour-free margin mentioned in the pathology report DEFINITION
Numerator: all patients with RC that underwent sphincter saving surgery or Hartmann’s procedure having their distal tumour-free margin mentioned in the pathology report.
Denominator: all patients with RC that underwent sphincter saving surgery or Hartmann’s procedure.
Exclusion:
• patients not treated with sphincter-sparing surgery or Hartmann’s procedure
RESULTS
In 89% of the PROCARE patients undergoing sphincter saving surgery or Hartmann’s procedure the distal tumour-free margin is mentioned in the pathology report (Table 52). For 51 of the 1058 patients undergoing surgery, no information was available on the type of reconstruction. Above this, for 38 patients undergoing sphincter saving surgery or Hartmann’s procedure, no pathology data were available (total missings: 89/1071, 8%).
This QI is measurable for 53 centres using the prospective database. Twenty-three centres have a score of 100%. Thirty-four centres have a score above the weighted (89%; 95%CI 87 – 92%) and unweighted mean (89%; 95%CI 84 – 94%). For the correct interpretation of these results, risk-adjustment (tumour localisation) is necessary.
No administrative code exists for the distal tumour-free margin, which are also data that can only be retrieved from the medical file. The QI is therefore not measurable for the administrative cohort.
KCE Reports 81 PROCARE – phase 2 59
Table 52. Distal tumour-free margin mentioned in the pathology report, measured with prospective PROCARE data.
N Patients with rectal cancer 1071 Proportion treated with surgery 1058
Proportion treated with sphincter saving surgery or Hartmann’s procedure 815 Proportion with pathology data (denominator) 777 Proportion with distal tumour-free margin mentioned (numerator) 695 (89%)
Number of lymph nodes examined
DEFINITION
Numerator: total number of lymph nodes examined in patients with rectal cancer undergoing radical resection.
Denominator: all patients with RC that underwent radical resection.
Exclusion:
• patients not treated with radical resection
• patients treated with local surgery
RESULTS
In the prospective cohort, 1018 patients underwent radical surgery. For 956 patients (94%) the number of lymph nodes examined was available in the database. The mean number of lymph nodes examined for these patients was 12 (range 0 – 50). In 449 patients (47%), the number of lymph nodes examined was 12 or higher. Table 53 provides an overview of the number of lymph nodes examined according to the neoadjuvant treatment (n = 584).
Figure 14 provides an overview of the per-centre-analysis using the prospective database (% of patients with at least 12 lymph nodes examined). In three centres all patients have at least 12 lymph nodes examined, while in four centres the score is 0%. Twenty-seven centres have a score above the weighted (47%; 95%CI 44 – 50%) and unweighted mean (47%; 95%CI 40 – 53%). For the correct interpretation of these results, risk-adjustment (neoadjuvant treatment, (y)pN) is necessary.
No administrative code exists for the number of lymph nodes examined, which are also data that can only be retrieved from the medical file and the anatomopathological report. The QI is therefore not measurable for the administrative cohort.
Table 53. Number of lymph nodes examined according to neoadjuvant treatment, measured with prospective PROCARE data. Type of neoadjuvant treatment N Mean Median Radiotherapy, 1 – 25 Gy 66 14 12 Radiotherapy, 26 – 44 Gy 26 9 10 Radiotherapy, 45 Gy or more 415 10 9 Radiotherapy, dose unknown 76 13 13 No neoadjuvant radiotherapy 1 5 5
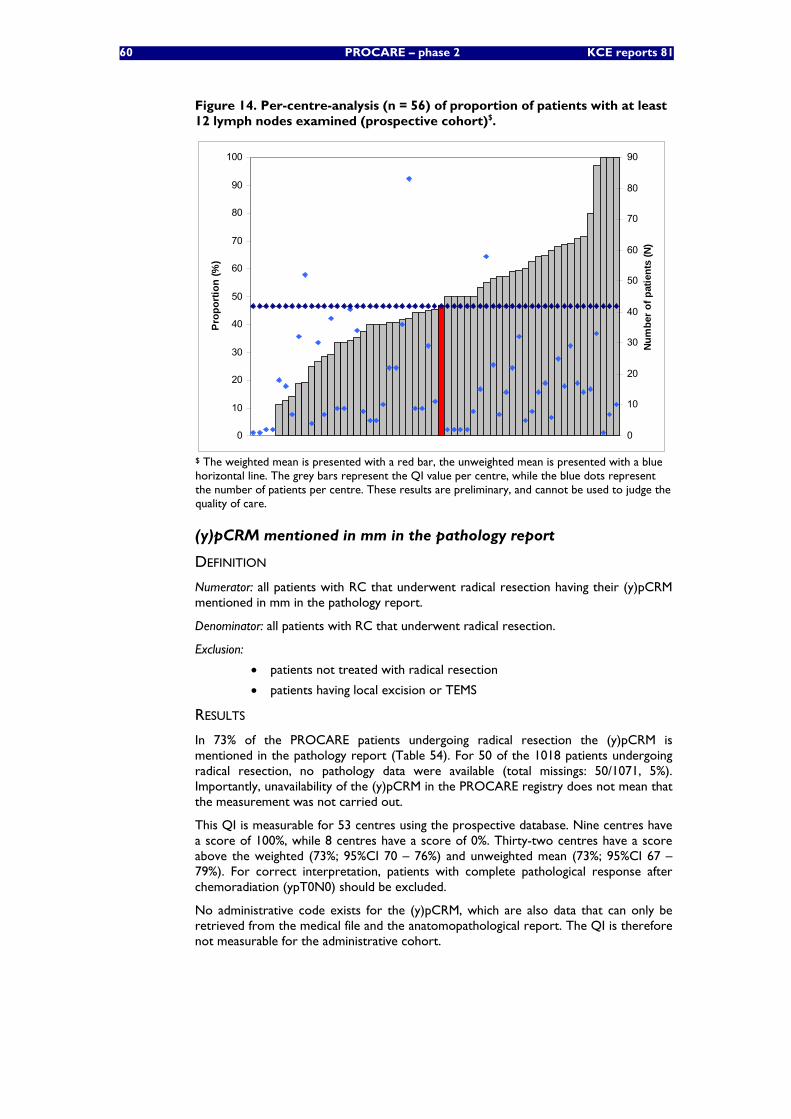
60 PROCARE – phase 2 KCE reports 81
Figure 14. Per-centre-analysis (n = 56) of proportion of patients with at least 12 lymph nodes examined (prospective cohort)$.
0
10
20
30
40
50
60
70
80
90
100
Prop
ortio
n (%
)
0
10
20
30
40
50
60
70
80
90
Num
ber o
f pat
ient
s (N
)
$ The weighted mean is presented with a red bar, the unweighted mean is presented with a blue horizontal line. The grey bars represent the QI value per centre, while the blue dots represent the number of patients per centre. These results are preliminary, and cannot be used to judge the quality of care.
(y)pCRM mentioned in mm in the pathology report
DEFINITION
Numerator: all patients with RC that underwent radical resection having their (y)pCRM mentioned in mm in the pathology report.
Denominator: all patients with RC that underwent radical resection.
Exclusion:
• patients not treated with radical resection
• patients having local excision or TEMS
RESULTS
In 73% of the PROCARE patients undergoing radical resection the (y)pCRM is mentioned in the pathology report (Table 54). For 50 of the 1018 patients undergoing radical resection, no pathology data were available (total missings: 50/1071, 5%). Importantly, unavailability of the (y)pCRM in the PROCARE registry does not mean that the measurement was not carried out.
This QI is measurable for 53 centres using the prospective database. Nine centres have a score of 100%, while 8 centres have a score of 0%. Thirty-two centres have a score above the weighted (73%; 95%CI 70 – 76%) and unweighted mean (73%; 95%CI 67 – 79%). For correct interpretation, patients with complete pathological response after chemoradiation (ypT0N0) should be excluded.
No administrative code exists for the (y)pCRM, which are also data that can only be retrieved from the medical file and the anatomopathological report. The QI is therefore not measurable for the administrative cohort.
KCE Reports 81 PROCARE – phase 2 61
Table 54. (y)pCRM mentioned in mm in the pathology report, measured with prospective PROCARE data. N Patients with rectal cancer 1071 Proportion treated with surgery 1058
Proportion treated with radical resection 1018 Proportion with pathology data (denominator) 968 Proportion with (y)pCRM mentioned in mm (numerator) 706 (73%)
Tumour regression grade mentioned in the pathology report (after neoadjuvant treatment)
DEFINITION
Numerator: all patients with RC that underwent surgery and neoadjuvant treatment, and having their tumour regression grade mentioned in the pathology report.
Denominator: all patients with RC that underwent surgery and neoadjuvant treatment.
Exclusion:
• patients not treated with surgery
• patients not treated with neoadjuvant treatment
RESULTS
In only 9% of the PROCARE patients treated with neoadjuvant therapy and surgery, the tumour regression grade is mentioned in the report (Table 55). For 129 of the 1058 patients treated with surgery, no information was available on neoadjuvant treatment. Above this, for 21 of the 596 patients receiving neoadjuvant treatment, no pathology data were available (total missings: 150/1071, 14%).
As for the quality of TME, registration of the tumour regression grade only started in November 2006. Above this, different classification systems are used across the participating centres. Therefore, the result is probably underestimated and not reliable. Also, ideally only long course radiotherapy is taken into account.
This QI is measurable for 52 centres using the prospective database. Four centres have a score of at least 50%, while 39 centres have a score of 0%. Eight and 9 centres have a score above the weighted (9%; 95%CI 7 – 12%) and unweighted mean (8%; 95%CI 2 – 13%) respectively. For the correct interpretation of these results, risk-adjustment (e.g. neoadjuvant treatment regimen, interval to surgery) is necessary.
No administrative code exists for the tumour regression grade, which are also data that can only be retrieved from the medical file. The QI is therefore not measurable for the administrative cohort.
Table 55. Tumour regression grade mentioned in the pathology report, measured with prospective PROCARE data. N Patients with rectal cancer 1071 Proportion treated with surgery 1058
Proportion treated neoadjuvant therapy 596 Proportion with pathology data (denominator) 575 Proportion with tumour regression grade mentioned (numerator) 53
Discussion
Overall, 5 QI related to histopathologic examination were measurable using the prospective database, while none were measurable using the administrative databases (Table 56). The most important reason for not being measurable is the absence of administrative codes for clinical results, e.g. (y)pCRM. Such clinical information can only be retrieved from medical files and the anatomopathological report itself.
In November 2006, the pathology section of the PROCARE data entry form underwent revision, with some variables only being registered from then on.
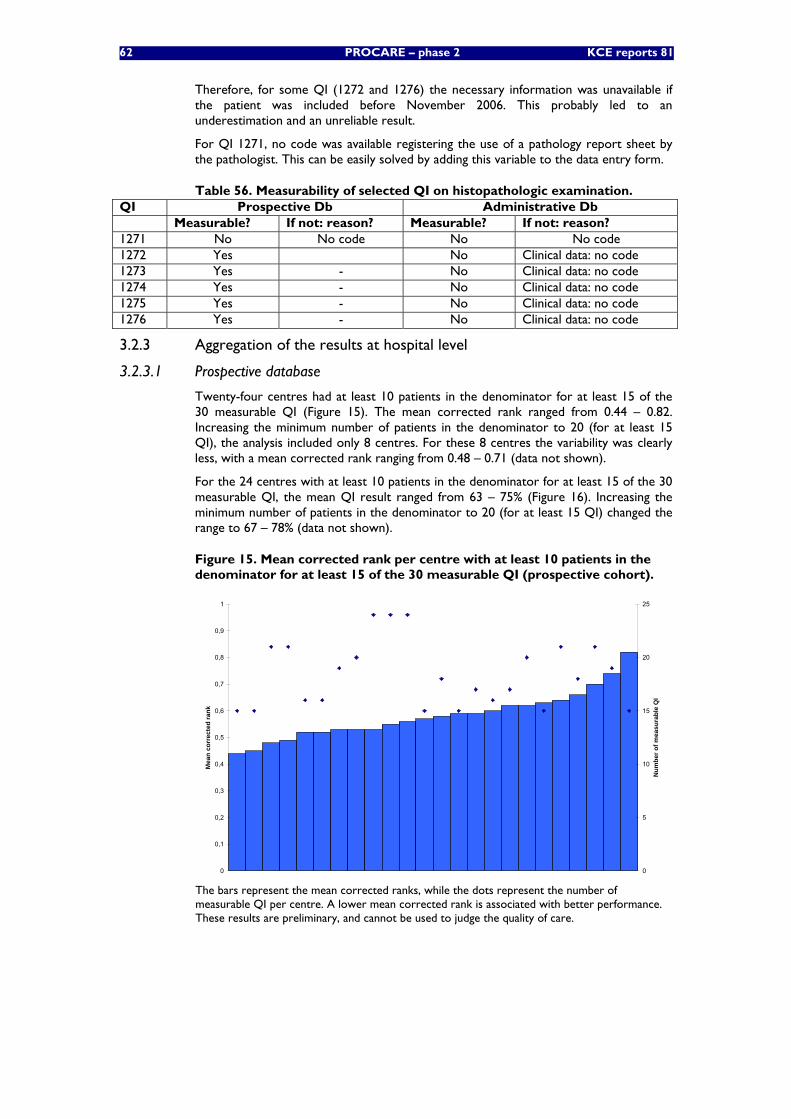
62 PROCARE – phase 2 KCE reports 81
Therefore, for some QI (1272 and 1276) the necessary information was unavailable if the patient was included before November 2006. This probably led to an underestimation and an unreliable result.
For QI 1271, no code was available registering the use of a pathology report sheet by the pathologist. This can be easily solved by adding this variable to the data entry form.
Table 56. Measurability of selected QI on histopathologic examination. QI Prospective Db Administrative Db Measurable? If not: reason? Measurable? If not: reason? 1271 No No code No No code 1272 Yes No Clinical data: no code 1273 Yes - No Clinical data: no code 1274 Yes - No Clinical data: no code 1275 Yes - No Clinical data: no code 1276 Yes - No Clinical data: no code
3.2.3 Aggregation of the results at hospital level
3.2.3.1 Prospective database
Twenty-four centres had at least 10 patients in the denominator for at least 15 of the 30 measurable QI (Figure 15). The mean corrected rank ranged from 0.44 – 0.82. Increasing the minimum number of patients in the denominator to 20 (for at least 15 QI), the analysis included only 8 centres. For these 8 centres the variability was clearly less, with a mean corrected rank ranging from 0.48 – 0.71 (data not shown).
For the 24 centres with at least 10 patients in the denominator for at least 15 of the 30 measurable QI, the mean QI result ranged from 63 – 75% (Figure 16). Increasing the minimum number of patients in the denominator to 20 (for at least 15 QI) changed the range to 67 – 78% (data not shown).
Figure 15. Mean corrected rank per centre with at least 10 patients in the denominator for at least 15 of the 30 measurable QI (prospective cohort).
0
0,1
0,2
0,3
0,4
0,5
0,6
0,7
0,8
0,9
1
Mea
n co
rrec
ted
rank
0
5
10
15
20
25
Num
ber o
f mea
sura
ble
QI
The bars represent the mean corrected ranks, while the dots represent the number of measurable QI per centre. A lower mean corrected rank is associated with better performance. These results are preliminary, and cannot be used to judge the quality of care.
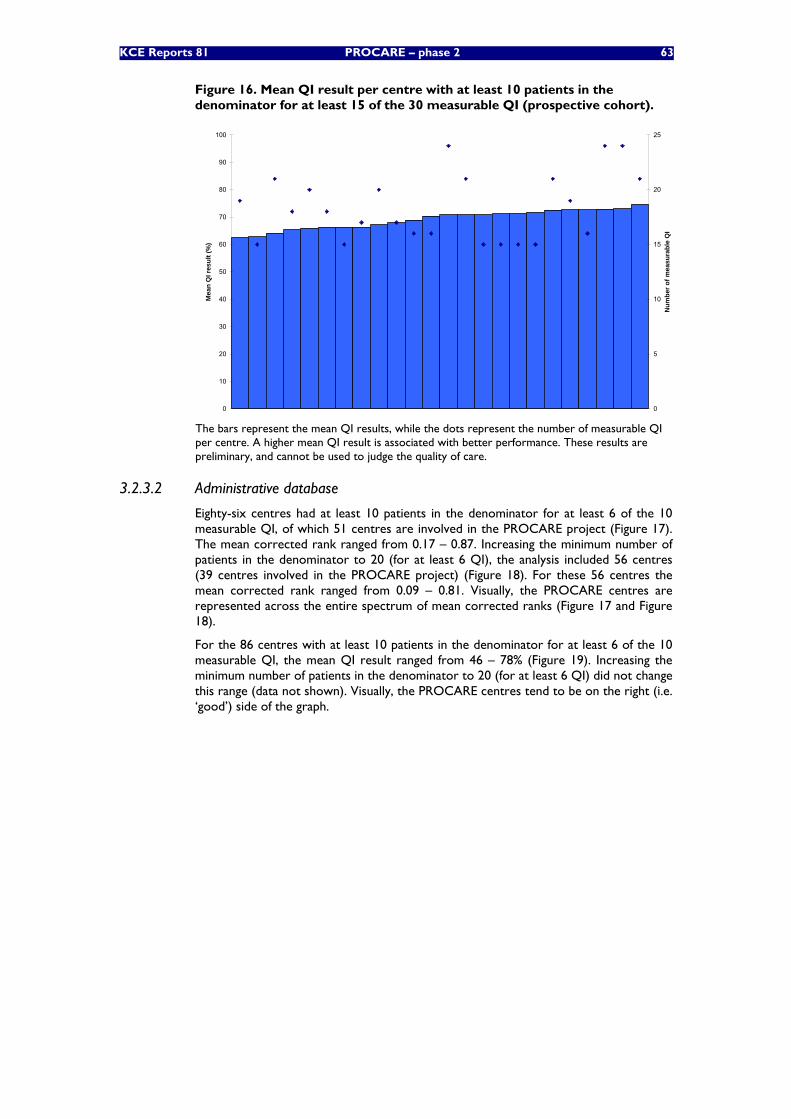
KCE Reports 81 PROCARE – phase 2 63
Figure 16. Mean QI result per centre with at least 10 patients in the denominator for at least 15 of the 30 measurable QI (prospective cohort).
0
10
20
30
40
50
60
70
80
90
100
Mea
n Q
I res
ult (
%)
0
5
10
15
20
25
Num
ber o
f mea
sura
ble
QI
The bars represent the mean QI results, while the dots represent the number of measurable QI per centre. A higher mean QI result is associated with better performance. These results are preliminary, and cannot be used to judge the quality of care.
3.2.3.2 Administrative database
Eighty-six centres had at least 10 patients in the denominator for at least 6 of the 10 measurable QI, of which 51 centres are involved in the PROCARE project (Figure 17). The mean corrected rank ranged from 0.17 – 0.87. Increasing the minimum number of patients in the denominator to 20 (for at least 6 QI), the analysis included 56 centres (39 centres involved in the PROCARE project) (Figure 18). For these 56 centres the mean corrected rank ranged from 0.09 – 0.81. Visually, the PROCARE centres are represented across the entire spectrum of mean corrected ranks (Figure 17 and Figure 18).
For the 86 centres with at least 10 patients in the denominator for at least 6 of the 10 measurable QI, the mean QI result ranged from 46 – 78% (Figure 19). Increasing the minimum number of patients in the denominator to 20 (for at least 6 QI) did not change this range (data not shown). Visually, the PROCARE centres tend to be on the right (i.e. ‘good’) side of the graph.
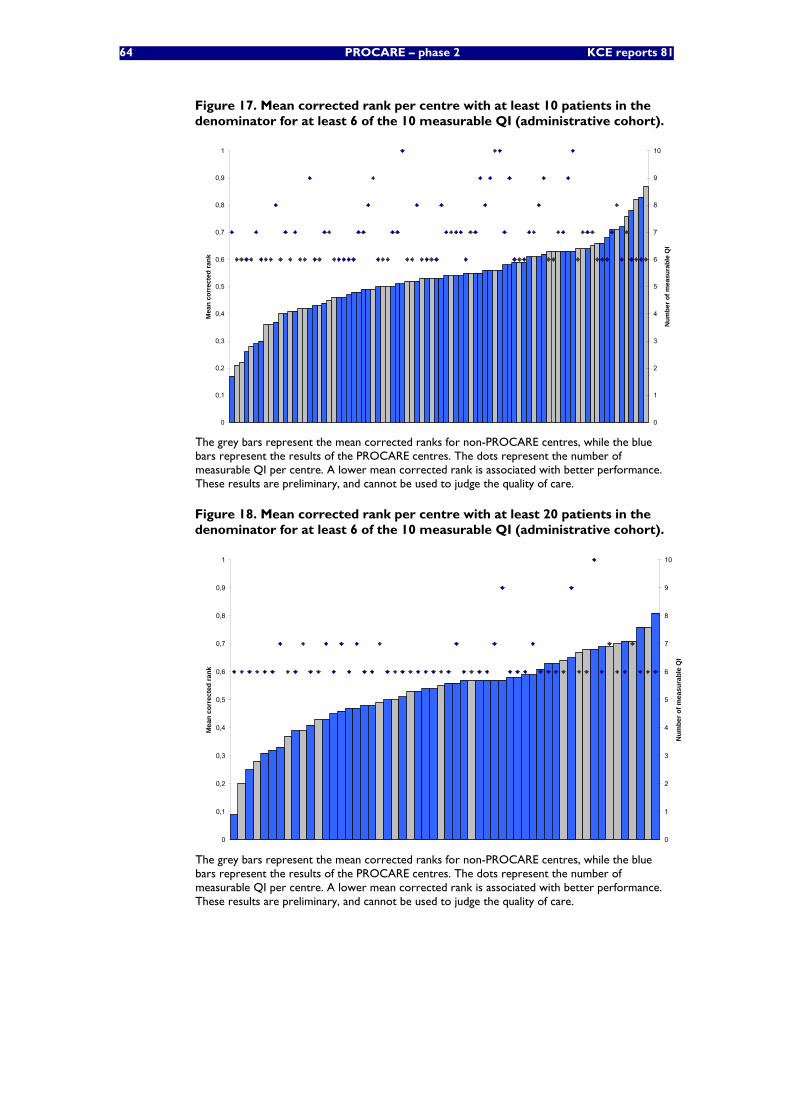
64 PROCARE – phase 2 KCE reports 81
Figure 17. Mean corrected rank per centre with at least 10 patients in the denominator for at least 6 of the 10 measurable QI (administrative cohort).
0
0,1
0,2
0,3
0,4
0,5
0,6
0,7
0,8
0,9
1
Mea
n co
rrec
ted
rank
0
1
2
3
4
5
6
7
8
9
10
Num
ber o
f mea
sura
ble
QI
The grey bars represent the mean corrected ranks for non-PROCARE centres, while the blue bars represent the results of the PROCARE centres. The dots represent the number of measurable QI per centre. A lower mean corrected rank is associated with better performance. These results are preliminary, and cannot be used to judge the quality of care.
Figure 18. Mean corrected rank per centre with at least 20 patients in the denominator for at least 6 of the 10 measurable QI (administrative cohort).
0
0,1
0,2
0,3
0,4
0,5
0,6
0,7
0,8
0,9
1
Mea
n co
rrec
ted
rank
0
1
2
3
4
5
6
7
8
9
10
Num
ber o
f mea
sura
ble
QI
The grey bars represent the mean corrected ranks for non-PROCARE centres, while the blue bars represent the results of the PROCARE centres. The dots represent the number of measurable QI per centre. A lower mean corrected rank is associated with better performance. These results are preliminary, and cannot be used to judge the quality of care.
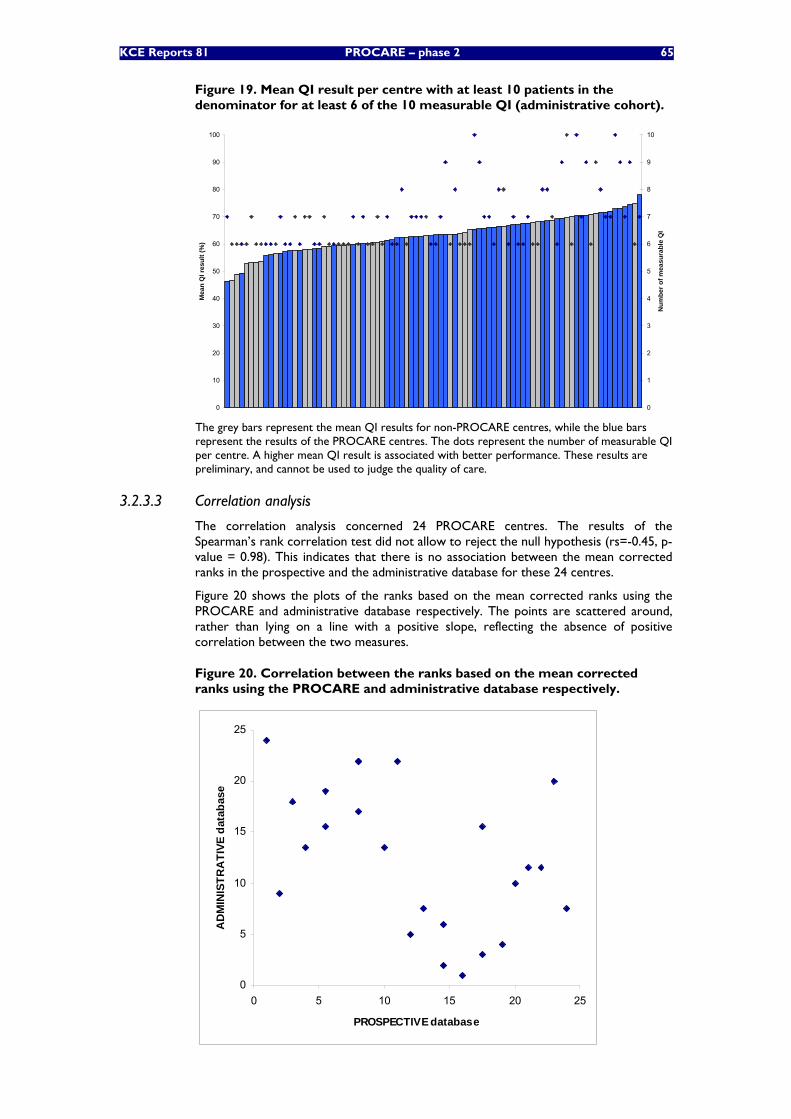
KCE Reports 81 PROCARE – phase 2 65
Figure 19. Mean QI result per centre with at least 10 patients in the denominator for at least 6 of the 10 measurable QI (administrative cohort).
0
10
20
30
40
50
60
70
80
90
100
Mea
n Q
I res
ult (
%)
0
1
2
3
4
5
6
7
8
9
10
Num
ber o
f mea
sura
ble
QI
The grey bars represent the mean QI results for non-PROCARE centres, while the blue bars represent the results of the PROCARE centres. The dots represent the number of measurable QI per centre. A higher mean QI result is associated with better performance. These results are preliminary, and cannot be used to judge the quality of care.
3.2.3.3 Correlation analysis
The correlation analysis concerned 24 PROCARE centres. The results of the Spearman’s rank correlation test did not allow to reject the null hypothesis (rs=-0.45, p-value = 0.98). This indicates that there is no association between the mean corrected ranks in the prospective and the administrative database for these 24 centres.
Figure 20 shows the plots of the ranks based on the mean corrected ranks using the PROCARE and administrative database respectively. The points are scattered around, rather than lying on a line with a positive slope, reflecting the absence of positive correlation between the two measures.
Figure 20. Correlation between the ranks based on the mean corrected ranks using the PROCARE and administrative database respectively.
0
5
10
15
20
25
0 5 10 15 20 25
PROSPECTIVE database
AD
MIN
ISTR
ATI
VE d
atab
ase
66 PROCARE – phase 2 KCE reports 81
3.3 DISCUSSION
3.3.1 Measurability of the selected quality indicators
A major objective of the present study was to analyse the feasibility of measuring QI for rectal cancer care using a prospective database and an administrative database. Of the 40 final QI, 30 were measurable for the prospective cohort and 9 were measurable for the administrative cohort. For the overall 5-year survival (and relative 5-year survival) the follow-up in the prospective cohort was too short to be measurable yet. This QI (and the relative 5-year survival) was measurable for the administrative cohort. Of the 8 QI that were not measurable for the prospective cohort, 2 were measurable for the administrative cohort (discussion in MDT and proportion of patients with stoma 1 year after sphincter-sparing surgery). Six QI were measurable for both cohorts, while 7 other QI were not measurable for both cohorts (including the disease-specific 5-year survival).
In the prospective database, the main reason for not being measurable was the absence of a code (n = 5) or a specific code (n = 2). One QI was not measurable because of inconsistencies in the database. In theory, these problems can be solved by adding variables to or adjusting existing variables in the PROCARE registration form. However, adding variables would increase the burden of registration for the involved healthcare providers. Ideally and where possible, the PROCARE database should be linked to the administrative databases for those QI that are not measurable using the PROCARE database alone. In theory, this is possible through the unique patient identifier.
In the administrative database, the absence of codes for clinical outcomes (mainly R0 resection) and results (e.g. cCRM) was the main reason for not being measurable (n = 21). For 7 other QI, the available administrative codes were too unspecific. In comparison to the prospective database, it is much more difficult (and probably impossible) to add codes. The used administrative databases, in particular the HIC and TC databases, were build for financing reasons rather than for measuring the quality of care.
3.3.2 Definition of quality indicators
Some of the selected QI are defined for specific subpopulations, such as patients undergoing surgery or treatment in general. Of course, many of these QI are also applicable to a broader group of patients with rectal cancer. For example, staging procedures (such as pelvic CT, large bowel-imaging, etc.) are necessary to decide on further treatment for all patients, and not only for patients eventually undergoing treatment [1]. Nevertheless, the message of this study should be that most QI are measurable or can be rendered measurable. In a later phase, it can be decided to enlarge the scope of each individual QI. Additional risk-adjustment will then be necessary for some QI.
3.3.3 Possible problems with the interpretation of the quality indicators
A high number of missing data was identified. For 18 of the 30 QI measurable with the prospective database, the % missing data exceeded 10% (Table 57). Most frequently, missing data were caused by an unknown cStage or (y)pStage or an unknown chemotherapy or radiotherapy regimen. The % missing data was lower for the administrative database, with more than 10% missing data for 2 of the 10 measurable QI. The single most important cause was an unknown cStage.
For 6 QI it was impossible to calculate the exact % of missing data in the prospective database because of the presence of variables with a default value ‘0’. To increase the reliability of the PROCARE database, all variables with default value ‘0’ should be identified and adapted to allow an identification of missing data.
KCE Reports 81 PROCARE – phase 2 67
Partially related to the problem of missing data, a high number of QI – measurable with the PROCARE database – had small denominators, with 13 QI having less than 250 patients included in the denominator (Table 57). For some QI, the follow-up was too short to include an adequate number of patients in the denominator. The problem of sample size is also reflected in the number of patients included in the denominator per centre (Table 57). For 15 QI measurable with the PROCARE database this number is less than 10. This problem emphasizes the need to improve the exhaustiveness of the PROCARE database, not only in terms of participating centres, but also in terms of patients. Indeed, it is not inconceivable that some centres did not register all of their patients or even selectively transmitted their ‘good’ patients. Also, in some centres only one surgeon is involved in the project, while others aren’t. To avoid this threat of selection bias, the PROCARE database can be coupled with the administrative database to check the completeness of the patient inclusion.
In order to provide meaningful feedback to the participating centres, their individual score should be positioned against the other (anonymized) centres and against a desired score. For most QI these desired scores are available from the literature [9, 11] and/or the PROCARE guideline [1]. However, since it is not the intention of the authors to judge the quality already, these desired scores are not provided in the document. For the interpretation of most QI, it is also necessary to risk-adjust and to provide additional ‘third level’ information to the participating centres. For example stage and level of the tumour (upper vs. middle vs. lower third of the rectum) have an important influence on the choice of treatment and on patient outcomes.
It is important to emphasize that the results of the 6 QI that are measurable in both databases cannot be compared between the 2 databases. First, a time lag exists between the 2 databases, with different treatment standards available. Second, both cohorts differ in terms of age and stage distribution (see chapter 3.2.1), mainly because of the selection bias mentioned above.
Based on the results of this feasibility study, suggestions were made for each individual QI to improve the measurability or interpretability. These suggestions are summarised in Table 58. Although it is tempting for the reader to already interpret the QI results presented in this report, the suggested adaptations are first needed. Therefore, these results cannot be used to judge the quality of rectal cancer care at present.
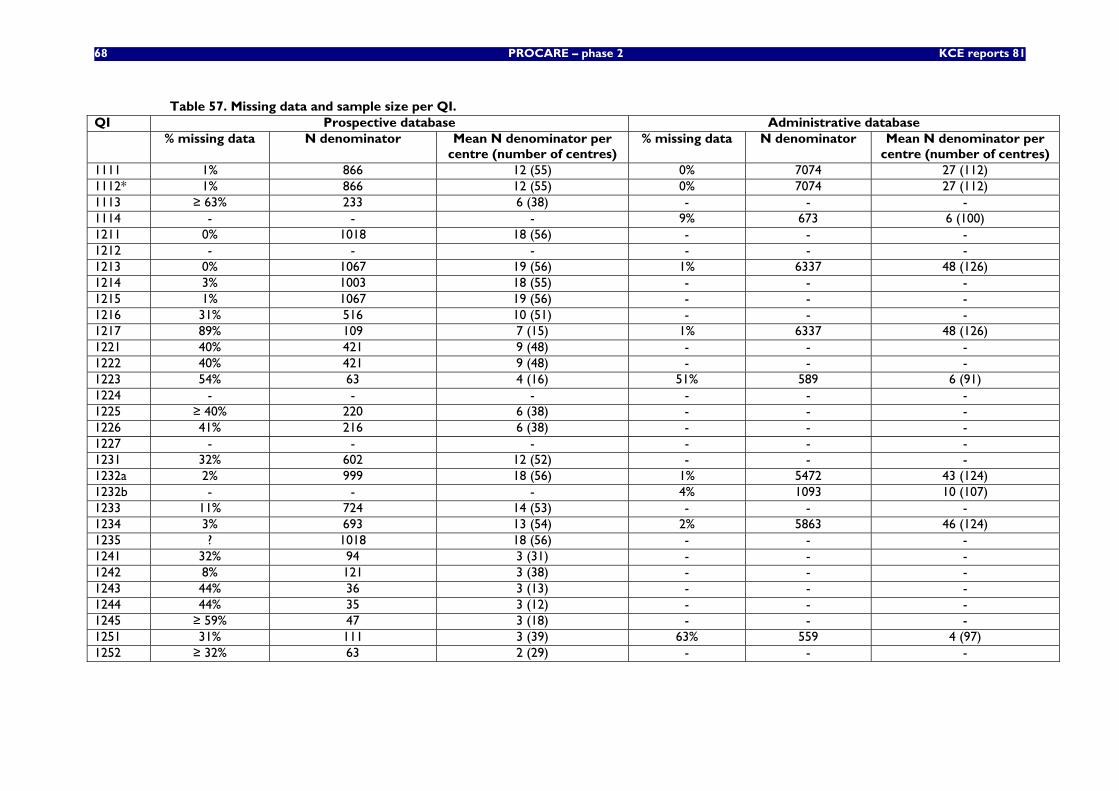
68 PROCARE – phase 2 KCE reports 81
Table 57. Missing data and sample size per QI. QI Prospective database Administrative database % missing data N denominator Mean N denominator per
centre (number of centres) % missing data N denominator Mean N denominator per
centre (number of centres) 1111 1% 866 12 (55) 0% 7074 27 (112) 1112* 1% 866 12 (55) 0% 7074 27 (112) 1113 ≥ 63% 233 6 (38) - - - 1114 - - - 9% 673 6 (100) 1211 0% 1018 18 (56) - - - 1212 - - - - - - 1213 0% 1067 19 (56) 1% 6337 48 (126) 1214 3% 1003 18 (55) - - - 1215 1% 1067 19 (56) - - - 1216 31% 516 10 (51) - - - 1217 89% 109 7 (15) 1% 6337 48 (126) 1221 40% 421 9 (48) - - - 1222 40% 421 9 (48) - - - 1223 54% 63 4 (16) 51% 589 6 (91) 1224 - - - - - - 1225 ≥ 40% 220 6 (38) - - - 1226 41% 216 6 (38) - - - 1227 - - - - - - 1231 32% 602 12 (52) - - - 1232a 2% 999 18 (56) 1% 5472 43 (124) 1232b - - - 4% 1093 10 (107) 1233 11% 724 14 (53) - - - 1234 3% 693 13 (54) 2% 5863 46 (124) 1235 ? 1018 18 (56) - - - 1241 32% 94 3 (31) - - - 1242 8% 121 3 (38) - - - 1243 44% 36 3 (13) - - - 1244 44% 35 3 (12) - - - 1245 ≥ 59% 47 3 (18) - - - 1251 31% 111 3 (39) 63% 559 4 (97) 1252 ≥ 32% 63 2 (29) - - -
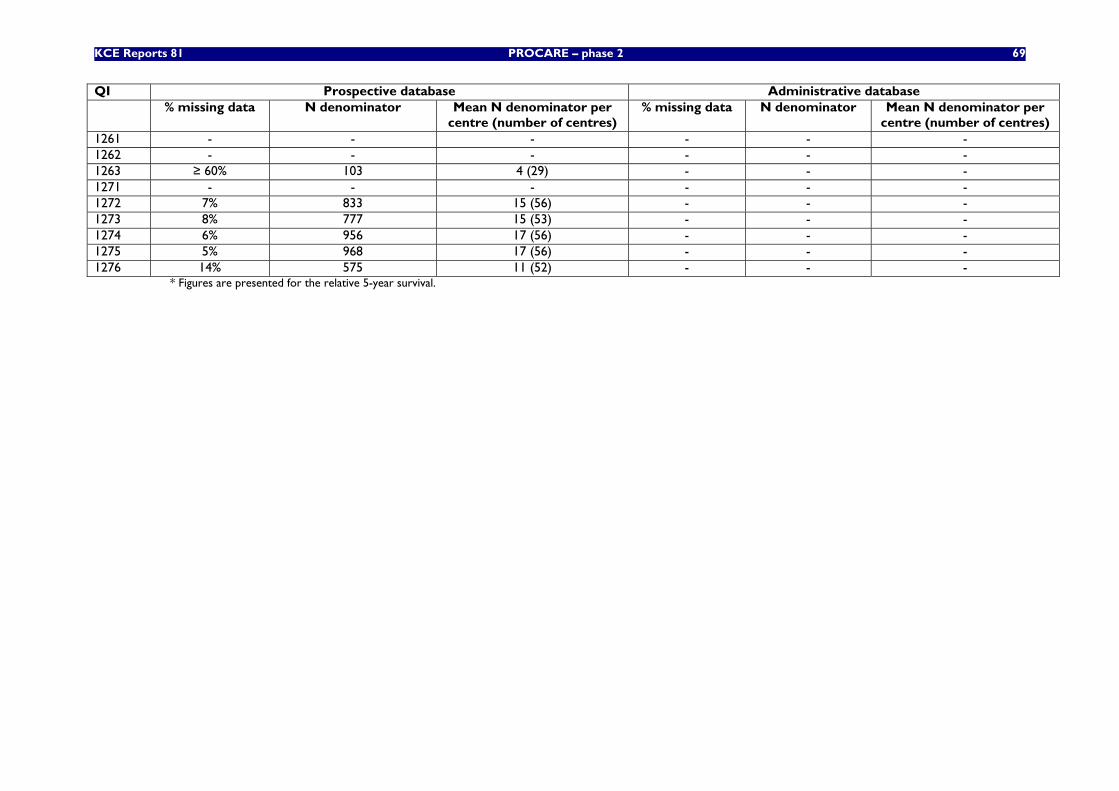
KCE Reports 81 PROCARE – phase 2 69
QI Prospective database Administrative database % missing data N denominator Mean N denominator per
centre (number of centres) % missing data N denominator Mean N denominator per
centre (number of centres) 1261 - - - - - - 1262 - - - - - - 1263 ≥ 60% 103 4 (29) - - - 1271 - - - - - - 1272 7% 833 15 (56) - - - 1273 8% 777 15 (53) - - - 1274 6% 956 17 (56) - - - 1275 5% 968 17 (56) - - - 1276 14% 575 11 (52) - - -
* Figures are presented for the relative 5-year survival.
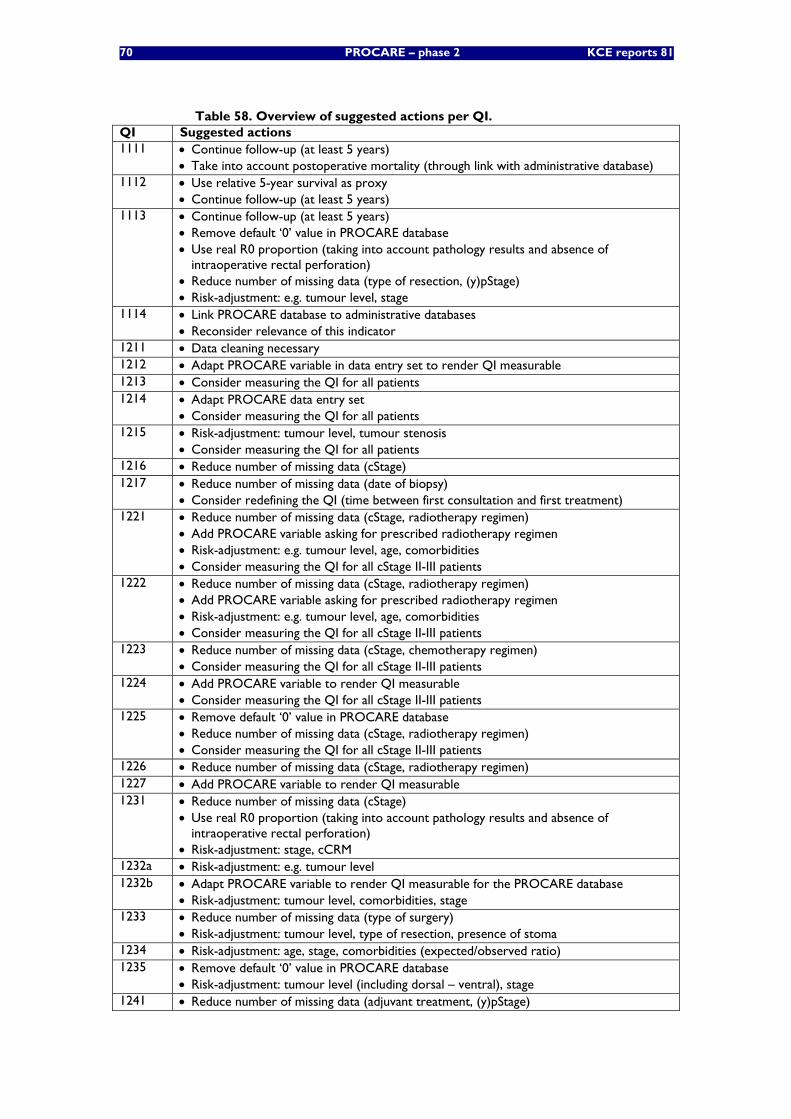
70 PROCARE – phase 2 KCE reports 81
Table 58. Overview of suggested actions per QI. QI Suggested actions 1111 • Continue follow-up (at least 5 years)
• Take into account postoperative mortality (through link with administrative database) 1112 • Use relative 5-year survival as proxy
• Continue follow-up (at least 5 years) 1113 • Continue follow-up (at least 5 years)
• Remove default ‘0’ value in PROCARE database • Use real R0 proportion (taking into account pathology results and absence of
intraoperative rectal perforation) • Reduce number of missing data (type of resection, (y)pStage) • Risk-adjustment: e.g. tumour level, stage
1114 • Link PROCARE database to administrative databases • Reconsider relevance of this indicator
1211 • Data cleaning necessary 1212 • Adapt PROCARE variable in data entry set to render QI measurable 1213 • Consider measuring the QI for all patients 1214 • Adapt PROCARE data entry set
• Consider measuring the QI for all patients 1215 • Risk-adjustment: tumour level, tumour stenosis
• Consider measuring the QI for all patients 1216 • Reduce number of missing data (cStage) 1217 • Reduce number of missing data (date of biopsy)
• Consider redefining the QI (time between first consultation and first treatment) 1221 • Reduce number of missing data (cStage, radiotherapy regimen)
• Add PROCARE variable asking for prescribed radiotherapy regimen • Risk-adjustment: e.g. tumour level, age, comorbidities • Consider measuring the QI for all cStage II-III patients
1222 • Reduce number of missing data (cStage, radiotherapy regimen) • Add PROCARE variable asking for prescribed radiotherapy regimen • Risk-adjustment: e.g. tumour level, age, comorbidities • Consider measuring the QI for all cStage II-III patients
1223 • Reduce number of missing data (cStage, chemotherapy regimen) • Consider measuring the QI for all cStage II-III patients
1224 • Add PROCARE variable to render QI measurable • Consider measuring the QI for all cStage II-III patients
1225 • Remove default ‘0’ value in PROCARE database • Reduce number of missing data (cStage, radiotherapy regimen) • Consider measuring the QI for all cStage II-III patients
1226 • Reduce number of missing data (cStage, radiotherapy regimen) 1227 • Add PROCARE variable to render QI measurable 1231 • Reduce number of missing data (cStage)
• Use real R0 proportion (taking into account pathology results and absence of intraoperative rectal perforation)
• Risk-adjustment: stage, cCRM 1232a • Risk-adjustment: e.g. tumour level 1232b • Adapt PROCARE variable to render QI measurable for the PROCARE database
• Risk-adjustment: tumour level, comorbidities, stage 1233 • Reduce number of missing data (type of surgery)
• Risk-adjustment: tumour level, type of resection, presence of stoma 1234 • Risk-adjustment: age, stage, comorbidities (expected/observed ratio) 1235 • Remove default ‘0’ value in PROCARE database
• Risk-adjustment: tumour level (including dorsal – ventral), stage 1241 • Reduce number of missing data (adjuvant treatment, (y)pStage)
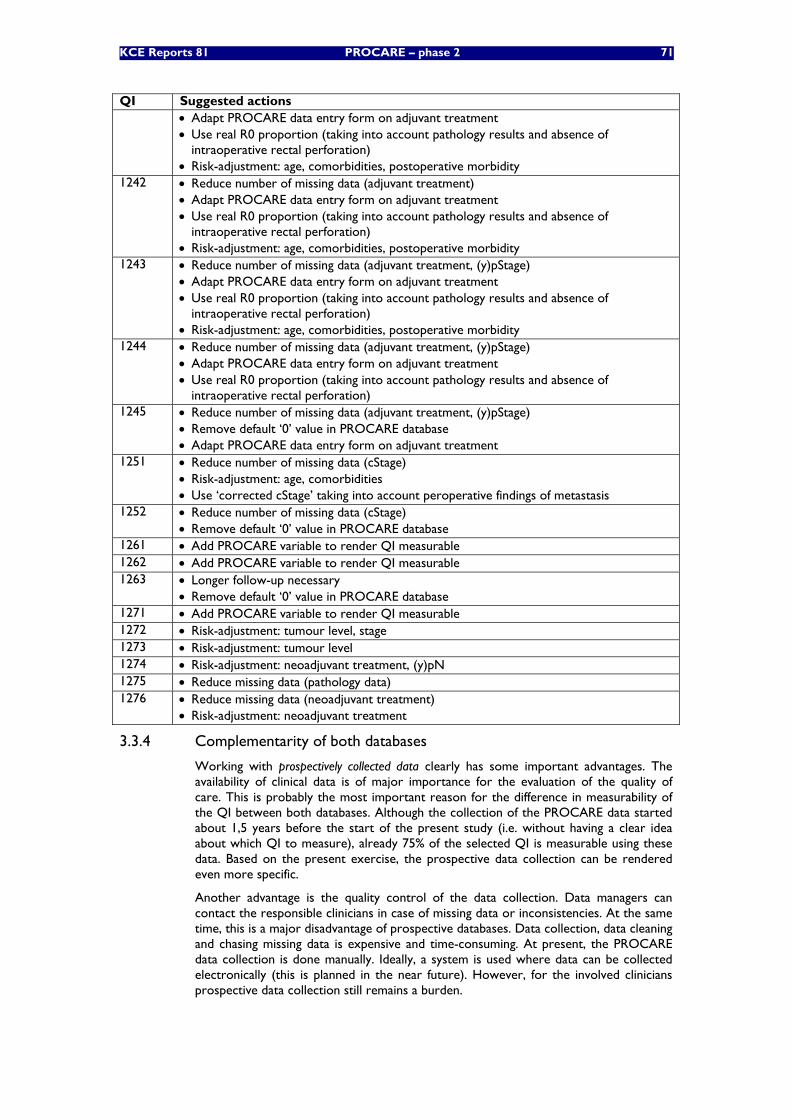
KCE Reports 81 PROCARE – phase 2 71
QI Suggested actions • Adapt PROCARE data entry form on adjuvant treatment • Use real R0 proportion (taking into account pathology results and absence of
intraoperative rectal perforation) • Risk-adjustment: age, comorbidities, postoperative morbidity
1242 • Reduce number of missing data (adjuvant treatment) • Adapt PROCARE data entry form on adjuvant treatment • Use real R0 proportion (taking into account pathology results and absence of
intraoperative rectal perforation) • Risk-adjustment: age, comorbidities, postoperative morbidity
1243 • Reduce number of missing data (adjuvant treatment, (y)pStage) • Adapt PROCARE data entry form on adjuvant treatment • Use real R0 proportion (taking into account pathology results and absence of
intraoperative rectal perforation) • Risk-adjustment: age, comorbidities, postoperative morbidity
1244 • Reduce number of missing data (adjuvant treatment, (y)pStage) • Adapt PROCARE data entry form on adjuvant treatment • Use real R0 proportion (taking into account pathology results and absence of
intraoperative rectal perforation) 1245 • Reduce number of missing data (adjuvant treatment, (y)pStage)
• Remove default ‘0’ value in PROCARE database • Adapt PROCARE data entry form on adjuvant treatment
1251 • Reduce number of missing data (cStage) • Risk-adjustment: age, comorbidities • Use ‘corrected cStage’ taking into account peroperative findings of metastasis
1252 • Reduce number of missing data (cStage) • Remove default ‘0’ value in PROCARE database
1261 • Add PROCARE variable to render QI measurable 1262 • Add PROCARE variable to render QI measurable 1263 • Longer follow-up necessary
• Remove default ‘0’ value in PROCARE database 1271 • Add PROCARE variable to render QI measurable 1272 • Risk-adjustment: tumour level, stage 1273 • Risk-adjustment: tumour level 1274 • Risk-adjustment: neoadjuvant treatment, (y)pN 1275 • Reduce missing data (pathology data) 1276 • Reduce missing data (neoadjuvant treatment)
• Risk-adjustment: neoadjuvant treatment
3.3.4 Complementarity of both databases
Working with prospectively collected data clearly has some important advantages. The availability of clinical data is of major importance for the evaluation of the quality of care. This is probably the most important reason for the difference in measurability of the QI between both databases. Although the collection of the PROCARE data started about 1,5 years before the start of the present study (i.e. without having a clear idea about which QI to measure), already 75% of the selected QI is measurable using these data. Based on the present exercise, the prospective data collection can be rendered even more specific.
Another advantage is the quality control of the data collection. Data managers can contact the responsible clinicians in case of missing data or inconsistencies. At the same time, this is a major disadvantage of prospective databases. Data collection, data cleaning and chasing missing data is expensive and time-consuming. At present, the PROCARE data collection is done manually. Ideally, a system is used where data can be collected electronically (this is planned in the near future). However, for the involved clinicians prospective data collection still remains a burden.
72 PROCARE – phase 2 KCE reports 81
As already mentioned above, a possible threat for the PROCARE database is the selective inclusion of ‘good’ patients. Coupling with the administrative database to check the completeness of inclusion can be a solution.
The advantage of administrative data is their efficiency. Since these data are already collected for other reasons (e.g. epidemiology, financing, accreditation, etc.), the extra workload for clinicians is negligible. Above this, in contrast to the PROCARE database, the administrative database (which is population-based) includes all Belgian patients with rectal cancer.
However, administrative data lack specificity and detail. Indeed, the selected QI in this report were often not measurable using administrative data, because of the absence of specific administrative codes or clinical data. Although the MCD database offers the advantage to link procedures to diagnoses (in contrast to the HIC database), the linkage of the 3 different administrative databases did not have much impact on the measurability of the QI.
Administrative data are only available 2 to 3 years after registration. The quality of care is therefore measured with an important delay. Above this, the request for the administrative data and the coupling of the 3 databases turned out to be a long procedure taking several months. Furthermore, many weeks were needed to gain insight in the information available from this large database. Of course, the experience from the present study can be used for future exercises.
Importantly, since these administrative data are collected for (often financing) reasons other than quality and are therefore associated with risks of up- or under-coding, their use for the measurement of the quality of care is at least questionable.
3.3.5 High versus low performance on quality indicators
Most individual QI show enough variation to allow a distinction between centres offering high vs. less quality care. This is essential and very relevant, since it offers centres the opportunity to act on specific procedures and outcomes.
However, the QI set as a whole has less potential to distinguish overall high from low performance. While the variation in mean corrected rank is acceptable using the PROCARE database (with a high number of measurable QI, but a low number of centres) (Figure 15), the variation in mean QI result is less pronounced (Figure 16). On the contrary, the variation in both mean corrected rank and mean QI result increases using the administrative database (with a low number of measurable QI, but a high number of centres).
It is difficult to give straightforward explanations for these results. One possible reason is that most PROCARE centres are performing on a similar overall quality level. This is supported by the analysis of the mean QI result using the administrative databases, where the PROCARE centres tend to be on the right side of the graph (Figure 19), but refuted by the analysis of the mean corrected rank using the administrative databases, where the PROCARE centres are represented on both sides of the graph (Figure 17 and Figure 18).
Another possible explanation is that this QI set is simply not balanced enough to allow a distinction between overall high and less quality care. Nevertheless, it is obvious that more centres and more patients per centre need to get involved in order to increase the relevance of these results. This would also allow risk-adjustment (e.g. ASA score for postoperative mortality, tumour level for type of resection, tumour stage for (y)pCRM, etc.), which is essential for the distinction between high and low performance.
No correlation was shown between the mean corrected ranks of 24 PROCARE centres using the prospective and administrative databases respectively. This can have several reasons. First, for some hospitals the data in the PROCARE database are not representative for their entire rectal cancer population because of the selection bias (see above). Above this, a time lag exists between the 2 databases, reflecting different standards of care. Finally, the mean corrected ranks are not calculated using the same QI for both databases, and therefore may reflect other aspects of quality of care.
KCE Reports 81 PROCARE – phase 2 73
Most importantly, several QI need to be risk-adjusted (e.g. postoperative mortality, type of resection, (y)pCRM, etc.). Risk-adjustment is essential for the identification of potentially low performance.
3.3.6 Generalisability of this project
Although it is irrelevant to project the algorithms and results of the QI using the prospective database – which was set up specifically for rectal cancer – to other cancer types, at least part of the reasoning behind some QI measurable with the administrative database can be generalised.
First, it is essential to identify an ‘anchor time point’ for each patient, at which the clinical trajectory starts. Ideally, this is the date of first (histopathological) diagnosis, which is available from the BCR. Second, several other milestones of the trajectory need to be identified. For patients undergoing surgery, the date of surgery is essential to allow a distinction between neoadjuvant and adjuvant treatment (if applicable). Above this, it allows a distinction between preoperative and follow-up diagnostic studies. The date of surgery (and the dates of other diagnostic and therapeutic procedures) is available from the HIC database using surgical procedural codes specific to the cancer type. Another important milestone is death, which is available from the health insurers.
Once all possible milestones are identified (which should be possible for most cancer types), it depends on the available administrative codes specific to the cancer type how detailed the selected QI can be measured. Some QI, such as 5-year survival, time to treatment and inpatient or 30-day mortality, should be measurable for most cancer types using the same algorithm as in the present study. Therefore, for these QI and for the identification of common milestones, a manual will be prepared internally, including the program algorithms using SAS and the necessary administrative codes and their sources.
Finally, the coupling procedure that was used for the present study can also be used for future exercises.
74 PROCARE – phase 2 KCE reports 81
4 INTERNATIONAL EXPERIENCES WITH QUALITY MEASUREMENT OF RECTAL CANCER CARE
4.1 INTRODUCTION
In addition to national benchmarking, i.e. comparing results from individual hospitals or teams with national performances with feedback to participating teams, PROCARE also aims for international benchmarking. This would allow an audit of the national quality of care and can be performed by comparing the results in Belgium with those in other comparable countries or foreign populations. This comparison could indicate whether further improvement is possible and/or warranted. Comparison of Belgian performances can be done with nationwide or population-based databases or with results from multicentre prospective trials. For international benchmarking, comparison with population-based data is preferred above a comparison with results from large trials. While the latter give an indication of potentially reachable targets, population-based results more accurately represent the quality of care in a given nation/region.
Nationwide initiatives in other European countries, e.g. Norway, Denmark and Sweden, have illustrated the positive impact on multiple aspects of rectal cancer care by means of registration with feedback to participating hospitals [12-15]. In Sweden, a national cancer registry already started in 1995. The well-known Swedish rectal cancer trial was performed afterwards [16]. Thus, it can be expected that an exchange of data with Sweden would allow adequate national quality comparison with Belgium. In Denmark and Norway, national initiatives have been undertaken in order to introduce TME as the standard for rectal cancer surgery. Its impact on improved quality of care was demonstrated [15]. Moreover, Norway has installed a national rectal cancer database.
Although a Dutch nationwide colorectal cancer database will only start in 2008 or afterwards, some regional databases have been installed and exemplary results and consequences are available from the Dutch TME trial [17]. The same applies for Germany where a large trial on rectal cancer comparing pre- and postoperative chemoradiotherapy was performed [18]. Nationwide data are absent in Germany, but regional databases are functioning. In France, several smaller regional databases seem to be functioning [19, 20]. In Spain, colorectal surgeons recently started a national database for quality control [21]. Finally, the national bowel cancer audit programme in the United Kingdom – instaured since several years – is well-known (http://www.nbocap.org.uk/). It is expected that data specific for rectal cancer will become available. Also, regional data from the Northern and Yorkshire County seem to be available [22, 23].
4.2 METHODOLOGY
Contacts were made with other Western European countries in May 2006. These contacts were updated in January 2008 with Denmark, France, Germany, Norway, Sweden, Spain, The Netherlands and the United Kingdom.
In January 2008, a questionnaire was sent to contact persons mentioned in Table 59. The questionnaire consisted of a first part related to characteristics of the database/registry, while the second part asked for information on the availability for cross-border comparison of quality of care indicators, as determined in the present study. A reminder was sent to these contact persons who did not answer by February 1st, asking for a reply before the end of February 2008. All contacted persons responded within 3 weeks, except for the registry of the NBOCAP. However, the NYCRIS and NBOCAP registries were found to be linked (cfr. infra).
KCE Reports 81 PROCARE – phase 2 75
Table 59. Overview of contacted persons for international benchmarking. Country Organisation/project Contacted person(s) Denmark Danish Colorectal Cancer Registry Dr. H. Harling France Registre Bourguignon des Cancers Digestifs Prof. Dr. J. Faivre Germany Baverian Cancer Register Dr. M. Meyer The Netherlands LUMC Leiden Prof. Dr. C. van de Velde Association of Comprehensive Cancer
Centres (ACCC) Dr. R. Otter
Norway Norwegian Colorectal Cancer Registry Prof. B. Vonen L. Dørum
Spain Asociación Española de Cirujanos Prof. Dr. H. Ortiz Sweden Swedish Rectal Cancer Registry Prof. Dr. L. Pahlman UK National bowel cancer audit project
(NBOCAP) Prof. M. Thompson
Northern and Yorkshire Cancer Registry (NYCRIS)
Prof. D. Froman
4.3 RESULTS
4.3.1 Rectal cancer databases in Western Europe
A database with specific (hence more detailed) data on patients with rectal cancer exists for more than a decade in most of the evaluated countries (Table 60). In the Netherlands and UK, rectal and colon cancer data are registered together, but it seems that specific data related to rectal cancer can be retrieved (at least in the regional database of the Netherlands). Registration started very recently in Spain (2006) and the Netherlands (2008).
Data registration is compulsory in the national databases of Denmark, Norway, Sweden and the UK, where the completeness of patient inclusion is checked. Data are managed and analysed by scientific/professional bodies or associations, and several registries are funded by the government. The frequency of feedback to participating centres is variable, but at least on an annual basis. The Danish registry uses a system with ‘on-line’ feedback.
Based on the characteristics of the respective databases, those of Denmark, Norway, Sweden and the UK seem to be of greatest interest for benchmarking with the PROCARE data/results. These registries are compulsory and national, and have experience with analysis and regular feedback since several years. The Spanish registry started recently (2006) and participation is partial (based on voluntary collaboration, mainly from sub-specialised colorectal surgeons).
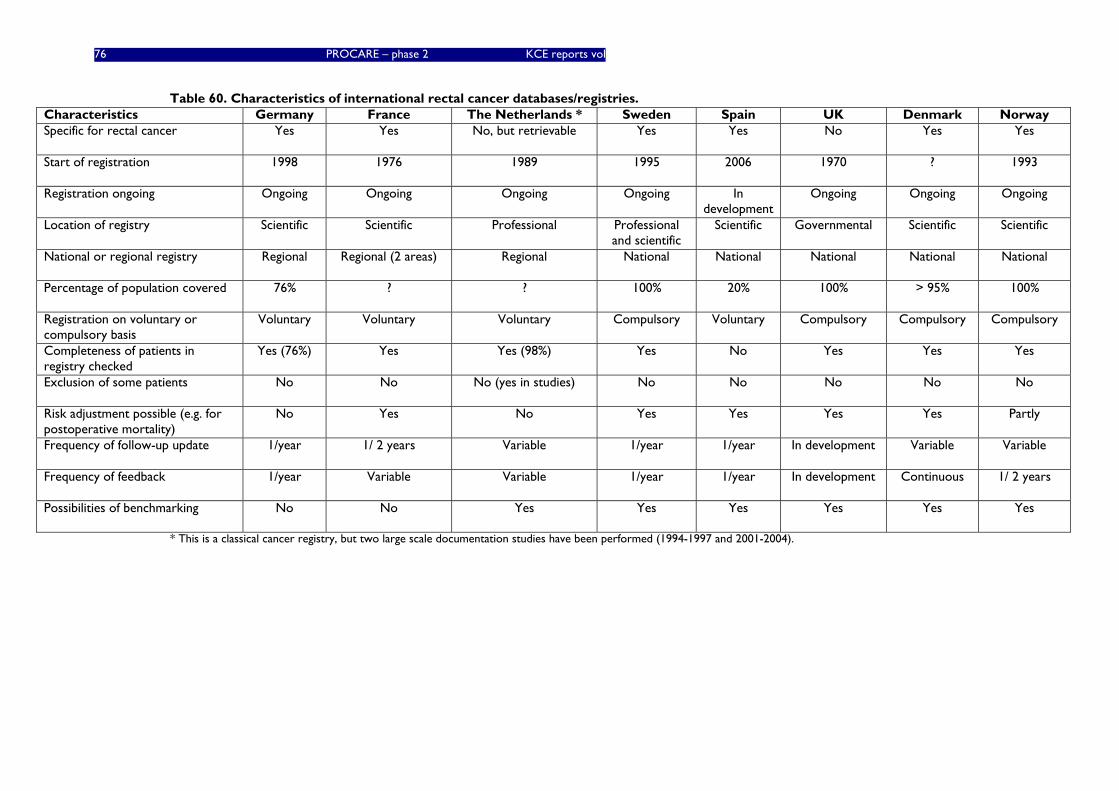
76 PROCARE – phase 2 KCE reports vol
Table 60. Characteristics of international rectal cancer databases/registries. Characteristics Germany France The Netherlands * Sweden Spain UK Denmark Norway Specific for rectal cancer Yes Yes No, but retrievable Yes Yes No Yes Yes
Start of registration 1998 1976 1989 1995 2006 1970 ? 1993
Registration ongoing Ongoing Ongoing Ongoing Ongoing In development
Ongoing Ongoing Ongoing
Location of registry Scientific Scientific Professional Professional and scientific
Scientific Governmental Scientific Scientific
National or regional registry Regional Regional (2 areas) Regional National National National National National
Percentage of population covered 76% ? ? 100% 20% 100% > 95% 100%
Registration on voluntary or compulsory basis
Voluntary Voluntary Voluntary Compulsory Voluntary Compulsory Compulsory Compulsory
Completeness of patients in registry checked
Yes (76%) Yes Yes (98%) Yes No Yes Yes Yes
Exclusion of some patients No No No (yes in studies) No No No No No
Risk adjustment possible (e.g. for postoperative mortality)
No Yes No Yes Yes Yes Yes Partly
Frequency of follow-up update 1/year 1/ 2 years Variable 1/year 1/year In development Variable Variable
Frequency of feedback 1/year Variable Variable 1/year 1/year In development Continuous 1/ 2 years
Possibilities of benchmarking No No Yes Yes Yes Yes Yes Yes
* This is a classical cancer registry, but two large scale documentation studies have been performed (1994-1997 and 2001-2004).
KCE Reports 81 PROCARE – Phase 2 77
4.3.2 Availability of PROCARE quality indicators in Western European databases
In chapter 2, quality of care indicators for the management of patients with rectal cancer have been identified. It was explored whether these QI could be compared with data from other Western European rectal cancer databases. In view of their characteristics (cfr. supra), the results from Denmark, Norway, Sweden and the UK are of most interest (see appendix).
It appears that benchmarking with the national and compulsory registries from Norway and Sweden have the best potential to be explored. The Norwegian registry remarked that neoadjuvant short course radiotherapy as well as adjuvant chemotherapy is not (routinely) used in Norway, in contrast to Sweden. Also, the quality of TME is not registered in Norway. Data from the Danish registry do not allow benchmarking for disease-free survival and use of neoadjuvant or adjuvant therapy. Data from the UK would not allow stratification of patients according to the level/location of rectal cancer. Most of the other QI are able to be compared, although some only on subsets of patients.
The following additional information was provided at the occasion of the above mentioned questionnaire:
4.3.2.1 Denmark
Until now, the Danish Colorectal Cancer Database has been a surgical-based database with only basic radiological, pathological and oncological data. However, they are in the process of extending the database with data relevant to the PROCARE project.
4.3.2.2 The Netherlands
A nationwide specific database on rectal cancer is not installed. At this moment, only data on rectal cancer patients in randomized trials and limited data from retrospective analyses in rectal cancer are available. As of January 1st 2008, prospective data registration on colorectal cancer has started in 2 regions, eventually to cover the entire country (cfr. infra). It was proposed to the new ECCO organisational board to set up a European structure preferably also including the PROCARE study (Van de Velde C., February 2008, personal communication).
The contacted persons also confirmed and specified that their regional cancer registry of the Northern Netherlands does only allow for a limited analysis of treatment quality, i.e. only for some main indicators of completeness of treatment. In the last decade two large documentation studies were performed which allow for more in depth analysis. The first and most extensive study was started in 1994, and is likely of limited interest for current quality of rectal cancer care. The second study concerns patients diagnosed and treated between 2001 and 2004 and might be more relevant for this project.
4.3.2.3 United Kingdom
There are 8 regional cancer registries in England. Each registry collects data on all cancers diagnosed in the country and NYCRIS covers the Northern and Yorkshire regions. Each registry records the diagnosis of all cancers, but they also collect varying amounts of additional information on treatment and stage. The national data registered at NYCRIS are specific to colorectal cancer. Colorectal cancer specialists have looked at patterns of care across the country in the respective databases for colorectal cancer. To do so, extracts of colorectal cancer data were taken from each cancer registry and pooled to form a national dataset. Currently, the data set covers the period of 1996 – 2005 and incorporates information on about 300.000 patients. However, because of the varying amounts of treatment information available in the different registries, patterns of practice in some areas of the country could not really be distinguished using the registry data alone. Therefore, these data have been linked to a dataset known as hospital episode statistics which holds information about every inpatient stay in an NHS hospital. This gives information about all treatments that require a stay in an NHS hospital.
78 PROCARE – phase 2 KCE reports 81
Also, an attempt is made to extend the dataset to incorporate extra information on other aspects of care by linking it to other routine data sources, such as radiotherapy, chemotherapy and pathology databases. However, variable amounts of information on these aspects of care are available across the country.
The National Bowel Cancer Audit Project (NBOCAP) is a collaboration between the Association of Coloproctologists of Great Britain and Ireland (ACPGBI) and the National Clinical Audit Support Programme (NCASP). It is a voluntary audit and members of the ACPGBI can submit information about their patients to it. It is not population-based and only covers about one third of the colorectal cancer patients at most. The NBOCAP dataset has more detailed clinical information than the PROCARE database (e.g. ASA grade), but unfortunately – as it is a voluntary audit – it is often very incomplete and many key fields are missing. When comparing their data to the population-based data at NYCRIS, it was found that members of the ACPGBI have significantly better outcomes than non-members. Therefore, using NBOCAP data as a proxy for national work may be biased as it overestimates outcomes. NYCRIS is very keen, however, to link its data to the NBOCAP data as this would supplement the dataset with more clinical information and it would give them national coverage. They are actively trying to collaborate with NBOCAP to achieve this.
NYCRIS is also interested to collaborate with colleagues in Dutch cancer registries, and they suggested that a Belgian dimension could be of interest (personal communication with David Forman).
4.3.2.4 Spain
The Spanish registry has recently been set up by professionals and the Spanish surgical society. Participation is on a voluntary basis. Unfortunately, resources are lacking to pay for a data manager travelling around Spain.
The database was based on an agreement between surgeons, pathologists, radiologists and oncologists. Unfortunately, data concerning adverse effects or the use of new drug combinations are incomplete.
No unequivocal mechanism is available to check whether all participating teams/hospitals submit their consecutive patients for registration. Hospitals willing to be included have to complete a questionnaire, which includes two questions about the annual case load (number of cases treated in the last 5 years, number of cases treated in the last year). If the number of observed cases from a hospital is less than 5% of the expected cases, all data of this hospital are excluded from the registry for that particular year.
4.3.2.5 Germany
The population-based cancer registry Bavaria is one of the 10 regional cancer registries in Germany (http://www.ekr.med.uni-erlangen.de/GEKID/Doc/kid2006_english.pdf). It is a classical epidemiologic cancer registry that does not provide data for benchmarking (except for non-adjusted overall survival).
4.3.2.6 Norway
The Norwegian rectal cancer registry has more or less "automatic" merges with the national cause of death registry and all EPJ systems in Norway.
4.4 DISCUSSION
A nationwide population-based database on rectal cancer has been installed and is functioning in Sweden, Norway, Denmark, and the UK. Participation in these registries is compulsory. In the Netherlands, a similar database was installed only very recently (January 2008). On the other hand, regional population-based databases on patients with rectal cancer, with participation on a voluntary basis, are available in France, Germany, and the Netherlands.
Most of these databases are located in a scientific organisation, supported by the clinicians and financially supported by the government (at least in Sweden and the UK).
KCE Reports 81 PROCARE – Phase 2 79
Data in these registries are regularly checked for completeness of coverage (i.e. missing patients). No type of patients or tumour is excluded from registration. Frequency of follow-up varies from 4 times during the first 2 postoperative years (Norway) to every two year. Usually, an annual feedback to participating centres and teams is provided. In Denmark, ‘on-line’ feedback has been installed.
It appears that most QI that have been identified in the context of the present PROCARE project can best be compared with data from Sweden and Norway. However, several level 1 QI such as overall five-year survival and disease-specific survival at 2 and 5 years, can be compared with almost all databases.
In conclusion, it seems to be of most interest to intensify and regularise contacts with Sweden and Norway because of the comparability of QI in the respective databases. Of course, benchmarking is subject to regulatory approval and permission of (national) data-governing bodies will have to be obtained. In addition, the information obtained through the present survey will need further exploration and updating once the plans for international benchmarking are much more concrete.
80 PROCARE – phase 2 KCE reports 81
5 CONCLUSIONS The ultimate aim of PROCARE is to decrease diagnostic and therapeutic variability between centres and to improve the quality of care for all patients presenting with rectal cancer. The identification of teams with suboptimal performance is a delicate matter and requires well-developed quality indicators, high-quality data (with adequate application of definitions), and adjustment for risk factors. The combination of a literature search and expert opinion made it possible to construct a set of 40 relevant QI for rectal cancer. For most selected QI, all necessary elements to be measurable are available in the PROCARE database and/or administrative databases. However, based on the results of the present study, a refinement of some QI and of the PROCARE data entry form is necessary. Also, in order to minimise the number of missing data and to increase the performance of the PROCARE data registration and analysis, a web application for data submission should be developed. Training of datamanagers is essential for an efficient and correct collection of patient data.
The present study shows that a linkage between the BCR database and other administrative databases is feasible and highly accurate (at least for the linkage between the BCR and HIC databases). The BCR data were shown to be exploitable and relevant for at least part of the selected quality indicators. Apart from the administrative BCR data, the BCR has also proved to have the necessary capacity for prospective data registration and analysis. Therefore, the BCR is an essential partner for future similar projects.
Using the administrative databases, some relevant QI were measurable. However, the total number of measurable QI was rather low. Of these, the outcome indicators on survival and mortality, measurable with data coming from the Sickness Funds, can probably be considered the most meaningful. For this project, the contribution of the MCD-MFD database was limited.
The PROCARE project is a pilot project for Belgium. So far, many centres involved in the PROCARE project only included a low number of patients, making an interpretation of most QI difficult at present. Nevertheless, the involved centres expect a first individual feedback very soon. Therefore, it should be considered to give this feedback without further interpretation until the end of 2009. By then, the total amount of included patients can be expected to exceed 2500. At that time, the relevance and interpretability of the QI should be reassessed, e.g. by comparing the PROCARE data to the administrative data for the same time period and by performing risk-adjustment where necessary. At a later stage, it can also be considered to pool the results of the smaller centres (i.e. with 5 or less patients per year), and to provide these pooled results in addition to the individual feedback.
In view of the needed refinements and difficult interpretation of the QI at present, it should be stressed again that the preliminary QI results presented in this report cannot be used to judge the quality of rectal cancer care. Indeed, given the relatively low number of included patients per PROCARE centre, this study seems to be done too soon to draw firm conclusions. Ideally, this exercise was piloted with a much more frequent cancer, such as breast cancer.
The prospective PROCARE registration is on a voluntary basis, and to increase the ownership of the project, this voluntarism should be encouraged. Registration burden is an important threat for this project, and it is therefore recommended to revise the current data entry form, which is very exhaustive at present. By providing the individual feedback in an attractive, professional and comprehensible lay-out, additional centres can be convinced to join the project.
In the long run, the coverage of the PROCARE registration needs to be improved and assured, e.g. by providing incentives or by checking the coverage through linkage with administrative databases. Indeed, as complete as possible coverage is essential to allow a meaningful population-based international benchmarking. The present study has shown the potential for such an international exercise. However, it is recommended to await a higher amount of included patients.

KCE Reports 81 PROCARE – Phase 2 81
Recommendations
• For most selected quality indicators the necessary elements to be measurable are available in the PROCARE database and/or administrative databases. Based on the present exercise, an adaptation of some indicators and of the PROCARE data/variables is necessary.
• In order to reduce the number of missing PROCARE data and to improve the performance of the PROCARE data registration, a web application for data submission is necessary. To reduce the administrative burden, the PROCARE data entry form – which is very exhaustive at the moment – needs to be adapted. The number of data to register should be reduced significantly, on the one hand by maximally integrating the prospective and administrative data, and on the other hand by selecting a limited number of key indicators. Above this, the BCR should have an automatic access to the necessary administrative data.
• The link between the BCR database and other administrative database is feasible and accurate. The BCR data are exploitable and relevant for at least some quality indicators. Furthermore, the BCR has the necessary capacity for prospective data registration and analysis. Therefore, the BCR is an essential partner for future similar projects.
• For this project the link between the BCR and HIC database was the most relevant. The contribution of the MCD-MFD database was limited.
• In view of the small sample size at present, it is recommended to provide the individual feedback without further interpretation. By the end of 2009, the relevance and interpretability of the quality indicators needs to be reassessed. This evaluation should allow the selection of the key indicators. In a next phase, the system should be implemented.
• In order to allow a meaningful population-based international benchmarking, a complete coverage needs to be garantueed (e.g. through linkage with administrative databases) and a higher number of included patients is necessary.
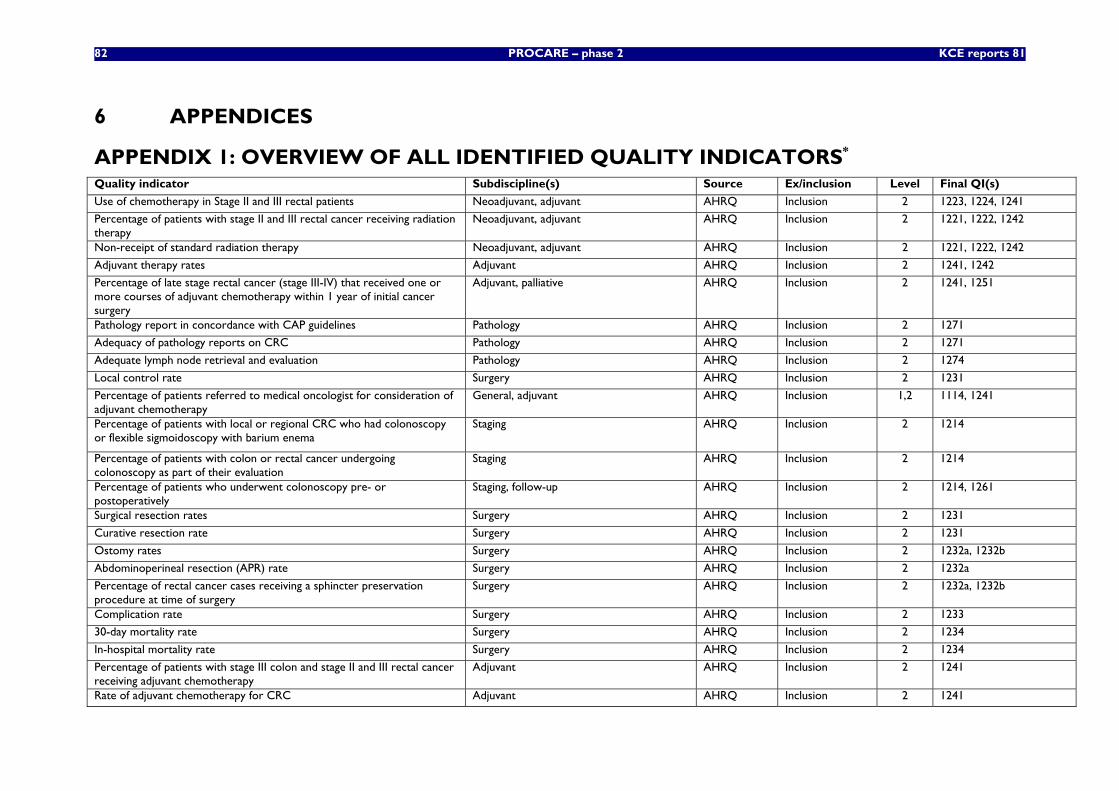
82 PROCARE – phase 2 KCE reports 81
6 APPENDICES
APPENDIX 1: OVERVIEW OF ALL IDENTIFIED QUALITY INDICATORS*
Quality indicator Subdiscipline(s) Source Ex/inclusion Level Final QI(s)
Use of chemotherapy in Stage II and III rectal patients Neoadjuvant, adjuvant AHRQ Inclusion 2 1223, 1224, 1241
Percentage of patients with stage II and III rectal cancer receiving radiation therapy
Neoadjuvant, adjuvant AHRQ Inclusion 2 1221, 1222, 1242
Non-receipt of standard radiation therapy Neoadjuvant, adjuvant AHRQ Inclusion 2 1221, 1222, 1242
Adjuvant therapy rates Adjuvant AHRQ Inclusion 2 1241, 1242
Percentage of late stage rectal cancer (stage III-IV) that received one or more courses of adjuvant chemotherapy within 1 year of initial cancer surgery
Adjuvant, palliative AHRQ Inclusion 2 1241, 1251
Pathology report in concordance with CAP guidelines Pathology AHRQ Inclusion 2 1271
Adequacy of pathology reports on CRC Pathology AHRQ Inclusion 2 1271
Adequate lymph node retrieval and evaluation Pathology AHRQ Inclusion 2 1274
Local control rate Surgery AHRQ Inclusion 2 1231
Percentage of patients referred to medical oncologist for consideration of adjuvant chemotherapy
General, adjuvant AHRQ Inclusion 1,2 1114, 1241
Percentage of patients with local or regional CRC who had colonoscopy or flexible sigmoidoscopy with barium enema
Staging AHRQ Inclusion 2 1214
Percentage of patients with colon or rectal cancer undergoing colonoscopy as part of their evaluation
Staging AHRQ Inclusion 2 1214
Percentage of patients who underwent colonoscopy pre- or postoperatively
Staging, follow-up AHRQ Inclusion 2 1214, 1261
Surgical resection rates Surgery AHRQ Inclusion 2 1231
Curative resection rate Surgery AHRQ Inclusion 2 1231
Ostomy rates Surgery AHRQ Inclusion 2 1232a, 1232b
Abdominoperineal resection (APR) rate Surgery AHRQ Inclusion 2 1232a
Percentage of rectal cancer cases receiving a sphincter preservation procedure at time of surgery
Surgery AHRQ Inclusion 2 1232a, 1232b
Complication rate Surgery AHRQ Inclusion 2 1233
30-day mortality rate Surgery AHRQ Inclusion 2 1234
In-hospital mortality rate Surgery AHRQ Inclusion 2 1234
Percentage of patients with stage III colon and stage II and III rectal cancer receiving adjuvant chemotherapy
Adjuvant AHRQ Inclusion 2 1241
Rate of adjuvant chemotherapy for CRC Adjuvant AHRQ Inclusion 2 1241
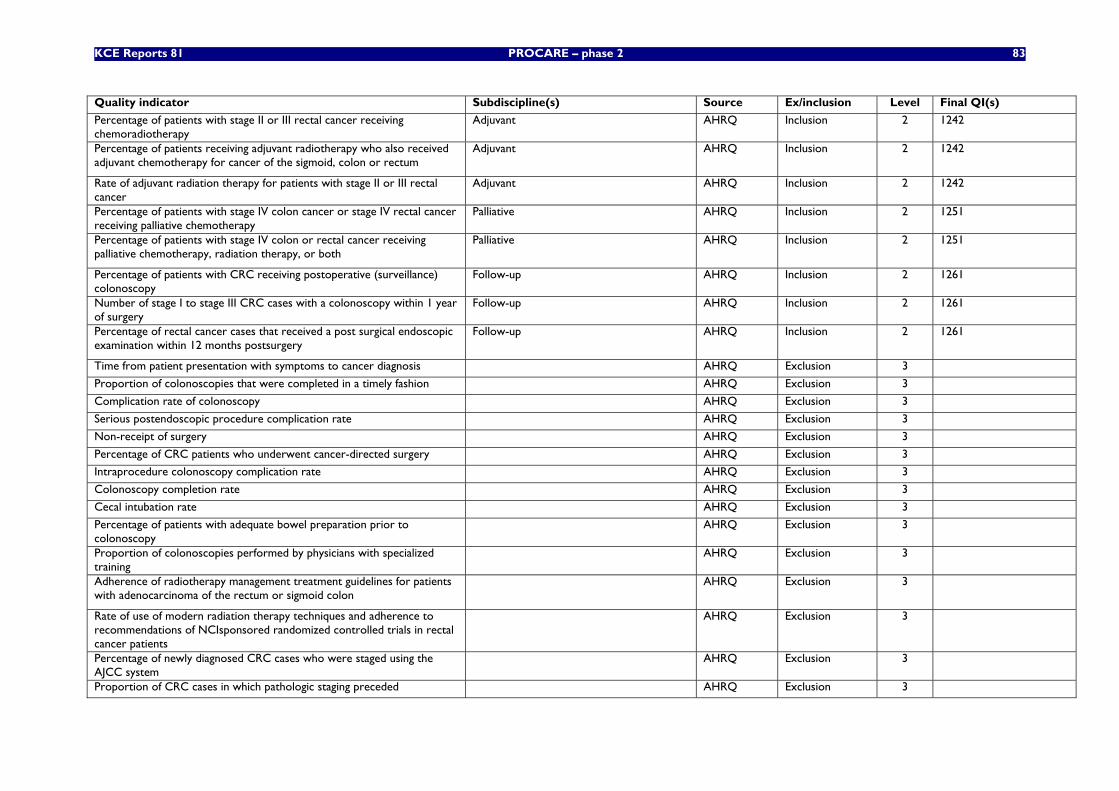
KCE Reports 81 PROCARE – phase 2 83
Quality indicator Subdiscipline(s) Source Ex/inclusion Level Final QI(s)
Percentage of patients with stage II or III rectal cancer receiving chemoradiotherapy
Adjuvant AHRQ Inclusion 2 1242
Percentage of patients receiving adjuvant radiotherapy who also received adjuvant chemotherapy for cancer of the sigmoid, colon or rectum
Adjuvant AHRQ Inclusion 2 1242
Rate of adjuvant radiation therapy for patients with stage II or III rectal cancer
Adjuvant AHRQ Inclusion 2 1242
Percentage of patients with stage IV colon cancer or stage IV rectal cancer receiving palliative chemotherapy
Palliative AHRQ Inclusion 2 1251
Percentage of patients with stage IV colon or rectal cancer receiving palliative chemotherapy, radiation therapy, or both
Palliative AHRQ Inclusion 2 1251
Percentage of patients with CRC receiving postoperative (surveillance) colonoscopy
Follow-up AHRQ Inclusion 2 1261
Number of stage I to stage III CRC cases with a colonoscopy within 1 year of surgery
Follow-up AHRQ Inclusion 2 1261
Percentage of rectal cancer cases that received a post surgical endoscopic examination within 12 months postsurgery
Follow-up AHRQ Inclusion 2 1261
Time from patient presentation with symptoms to cancer diagnosis AHRQ Exclusion 3
Proportion of colonoscopies that were completed in a timely fashion AHRQ Exclusion 3
Complication rate of colonoscopy AHRQ Exclusion 3
Serious postendoscopic procedure complication rate AHRQ Exclusion 3
Non-receipt of surgery AHRQ Exclusion 3
Percentage of CRC patients who underwent cancer-directed surgery AHRQ Exclusion 3
Intraprocedure colonoscopy complication rate AHRQ Exclusion 3
Colonoscopy completion rate AHRQ Exclusion 3
Cecal intubation rate AHRQ Exclusion 3
Percentage of patients with adequate bowel preparation prior to colonoscopy
AHRQ Exclusion 3
Proportion of colonoscopies performed by physicians with specialized training
AHRQ Exclusion 3
Adherence of radiotherapy management treatment guidelines for patients with adenocarcinoma of the rectum or sigmoid colon
AHRQ Exclusion 3
Rate of use of modern radiation therapy techniques and adherence to recommendations of NCIsponsored randomized controlled trials in rectal cancer patients
AHRQ Exclusion 3
Percentage of newly diagnosed CRC cases who were staged using the AJCC system
AHRQ Exclusion 3
Proportion of CRC cases in which pathologic staging preceded AHRQ Exclusion 3
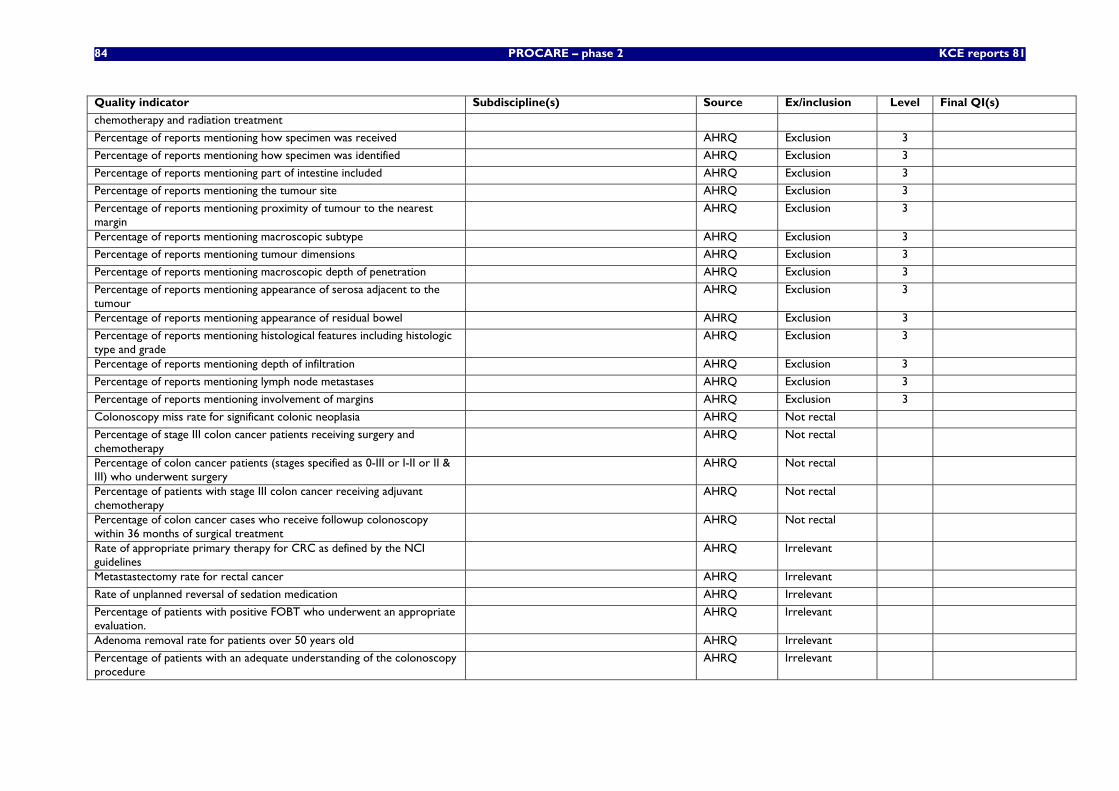
84 PROCARE – phase 2 KCE reports 81
Quality indicator Subdiscipline(s) Source Ex/inclusion Level Final QI(s)
chemotherapy and radiation treatment
Percentage of reports mentioning how specimen was received AHRQ Exclusion 3
Percentage of reports mentioning how specimen was identified AHRQ Exclusion 3
Percentage of reports mentioning part of intestine included AHRQ Exclusion 3
Percentage of reports mentioning the tumour site AHRQ Exclusion 3
Percentage of reports mentioning proximity of tumour to the nearest margin
AHRQ Exclusion 3
Percentage of reports mentioning macroscopic subtype AHRQ Exclusion 3
Percentage of reports mentioning tumour dimensions AHRQ Exclusion 3
Percentage of reports mentioning macroscopic depth of penetration AHRQ Exclusion 3
Percentage of reports mentioning appearance of serosa adjacent to the tumour
AHRQ Exclusion 3
Percentage of reports mentioning appearance of residual bowel AHRQ Exclusion 3
Percentage of reports mentioning histological features including histologic type and grade
AHRQ Exclusion 3
Percentage of reports mentioning depth of infiltration AHRQ Exclusion 3
Percentage of reports mentioning lymph node metastases AHRQ Exclusion 3
Percentage of reports mentioning involvement of margins AHRQ Exclusion 3
Colonoscopy miss rate for significant colonic neoplasia AHRQ Not rectal
Percentage of stage III colon cancer patients receiving surgery and chemotherapy
AHRQ Not rectal
Percentage of colon cancer patients (stages specified as 0-III or I-II or II & III) who underwent surgery
AHRQ Not rectal
Percentage of patients with stage III colon cancer receiving adjuvant chemotherapy
AHRQ Not rectal
Percentage of colon cancer cases who receive followup colonoscopy within 36 months of surgical treatment
AHRQ Not rectal
Rate of appropriate primary therapy for CRC as defined by the NCI guidelines
AHRQ Irrelevant
Metastastectomy rate for rectal cancer AHRQ Irrelevant
Rate of unplanned reversal of sedation medication AHRQ Irrelevant
Percentage of patients with positive FOBT who underwent an appropriate evaluation.
AHRQ Irrelevant
Adenoma removal rate for patients over 50 years old AHRQ Irrelevant
Percentage of patients with an adequate understanding of the colonoscopy procedure
AHRQ Irrelevant
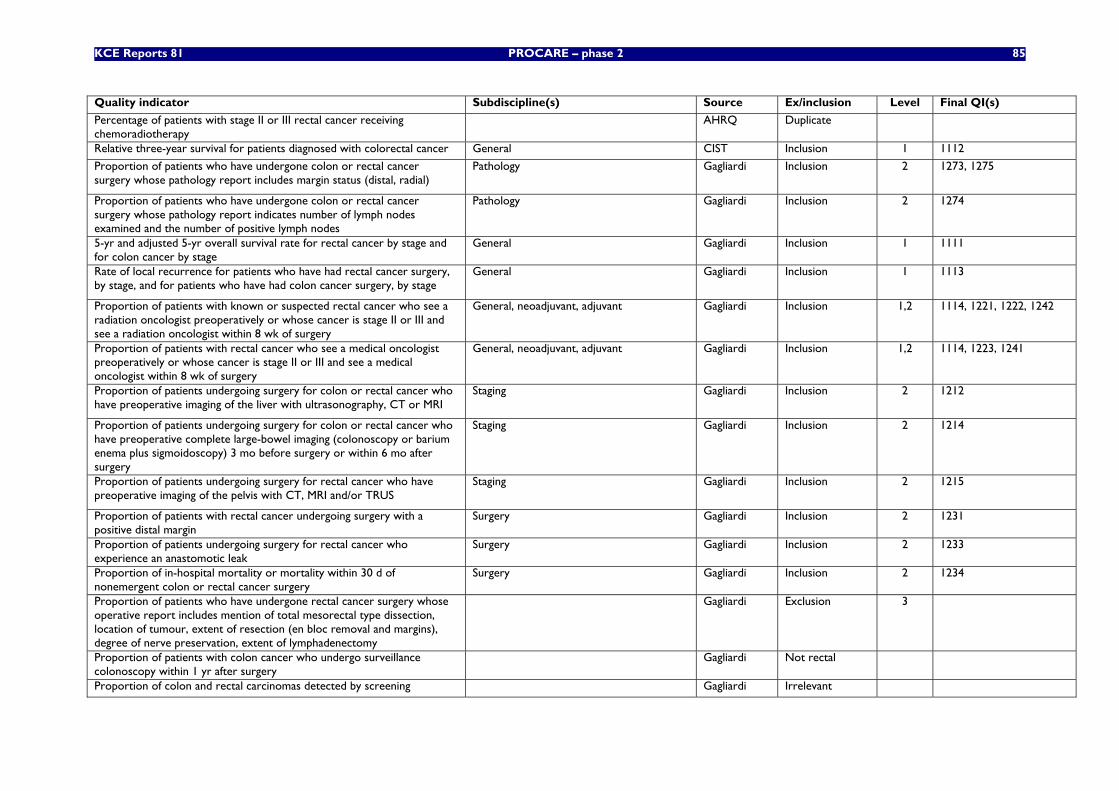
KCE Reports 81 PROCARE – phase 2 85
Quality indicator Subdiscipline(s) Source Ex/inclusion Level Final QI(s)
Percentage of patients with stage II or III rectal cancer receiving chemoradiotherapy
AHRQ Duplicate
Relative three-year survival for patients diagnosed with colorectal cancer General CIST Inclusion 1 1112
Proportion of patients who have undergone colon or rectal cancer surgery whose pathology report includes margin status (distal, radial)
Pathology Gagliardi Inclusion 2 1273, 1275
Proportion of patients who have undergone colon or rectal cancer surgery whose pathology report indicates number of lymph nodes examined and the number of positive lymph nodes
Pathology Gagliardi Inclusion 2 1274
5-yr and adjusted 5-yr overall survival rate for rectal cancer by stage and for colon cancer by stage
General Gagliardi Inclusion 1 1111
Rate of local recurrence for patients who have had rectal cancer surgery, by stage, and for patients who have had colon cancer surgery, by stage
General Gagliardi Inclusion 1 1113
Proportion of patients with known or suspected rectal cancer who see a radiation oncologist preoperatively or whose cancer is stage II or III and see a radiation oncologist within 8 wk of surgery
General, neoadjuvant, adjuvant Gagliardi Inclusion 1,2 1114, 1221, 1222, 1242
Proportion of patients with rectal cancer who see a medical oncologist preoperatively or whose cancer is stage II or III and see a medical oncologist within 8 wk of surgery
General, neoadjuvant, adjuvant Gagliardi Inclusion 1,2 1114, 1223, 1241
Proportion of patients undergoing surgery for colon or rectal cancer who have preoperative imaging of the liver with ultrasonography, CT or MRI
Staging Gagliardi Inclusion 2 1212
Proportion of patients undergoing surgery for colon or rectal cancer who have preoperative complete large-bowel imaging (colonoscopy or barium enema plus sigmoidoscopy) 3 mo before surgery or within 6 mo after surgery
Staging Gagliardi Inclusion 2 1214
Proportion of patients undergoing surgery for rectal cancer who have preoperative imaging of the pelvis with CT, MRI and/or TRUS
Staging Gagliardi Inclusion 2 1215
Proportion of patients with rectal cancer undergoing surgery with a positive distal margin
Surgery Gagliardi Inclusion 2 1231
Proportion of patients undergoing surgery for rectal cancer who experience an anastomotic leak
Surgery Gagliardi Inclusion 2 1233
Proportion of in-hospital mortality or mortality within 30 d of nonemergent colon or rectal cancer surgery
Surgery Gagliardi Inclusion 2 1234
Proportion of patients who have undergone rectal cancer surgery whose operative report includes mention of total mesorectal type dissection, location of tumour, extent of resection (en bloc removal and margins), degree of nerve preservation, extent of lymphadenectomy
Gagliardi Exclusion 3
Proportion of patients with colon cancer who undergo surveillance colonoscopy within 1 yr after surgery
Gagliardi Not rectal
Proportion of colon and rectal carcinomas detected by screening Gagliardi Irrelevant
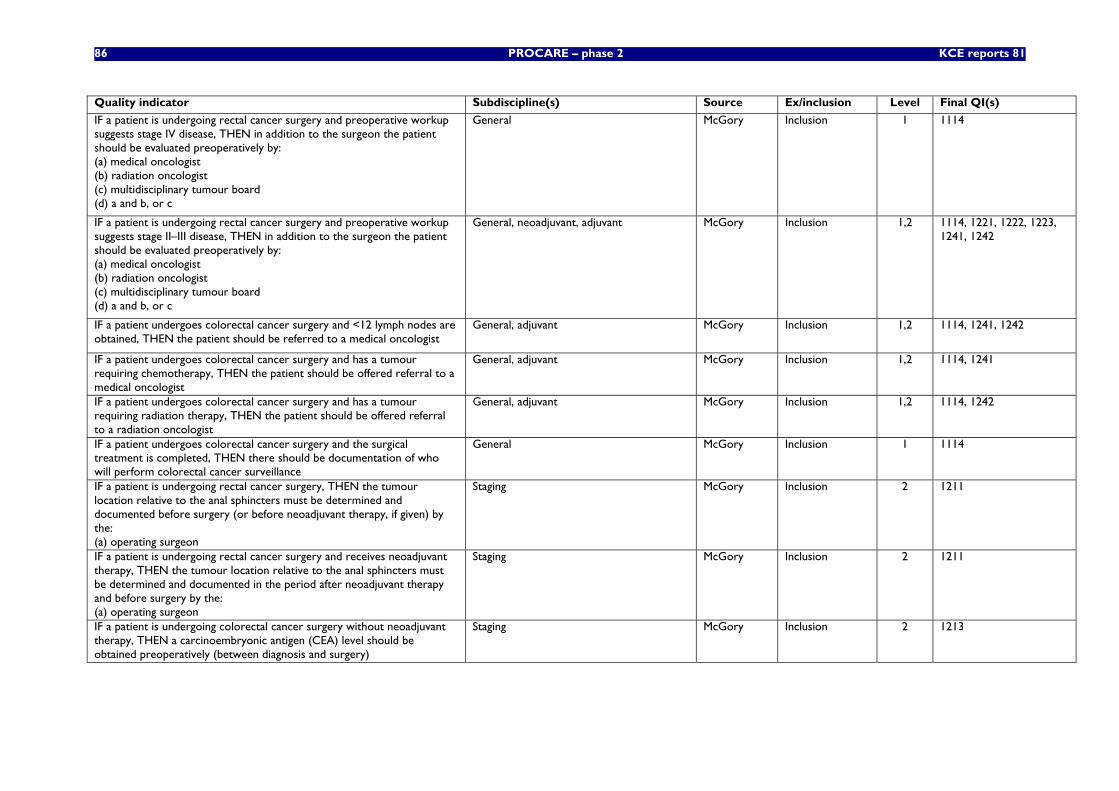
86 PROCARE – phase 2 KCE reports 81
Quality indicator Subdiscipline(s) Source Ex/inclusion Level Final QI(s)
IF a patient is undergoing rectal cancer surgery and preoperative workup suggests stage IV disease, THEN in addition to the surgeon the patient should be evaluated preoperatively by: (a) medical oncologist (b) radiation oncologist (c) multidisciplinary tumour board (d) a and b, or c
General McGory Inclusion 1 1114
IF a patient is undergoing rectal cancer surgery and preoperative workup suggests stage II–III disease, THEN in addition to the surgeon the patient should be evaluated preoperatively by: (a) medical oncologist (b) radiation oncologist (c) multidisciplinary tumour board (d) a and b, or c
General, neoadjuvant, adjuvant McGory Inclusion 1,2 1114, 1221, 1222, 1223, 1241, 1242
IF a patient undergoes colorectal cancer surgery and <12 lymph nodes are obtained, THEN the patient should be referred to a medical oncologist
General, adjuvant McGory Inclusion 1,2 1114, 1241, 1242
IF a patient undergoes colorectal cancer surgery and has a tumour requiring chemotherapy, THEN the patient should be offered referral to a medical oncologist
General, adjuvant McGory Inclusion 1,2 1114, 1241
IF a patient undergoes colorectal cancer surgery and has a tumour requiring radiation therapy, THEN the patient should be offered referral to a radiation oncologist
General, adjuvant McGory Inclusion 1,2 1114, 1242
IF a patient undergoes colorectal cancer surgery and the surgical treatment is completed, THEN there should be documentation of who will perform colorectal cancer surveillance
General McGory Inclusion 1 1114
IF a patient is undergoing rectal cancer surgery, THEN the tumour location relative to the anal sphincters must be determined and documented before surgery (or before neoadjuvant therapy, if given) by the: (a) operating surgeon
Staging McGory Inclusion 2 1211
IF a patient is undergoing rectal cancer surgery and receives neoadjuvant therapy, THEN the tumour location relative to the anal sphincters must be determined and documented in the period after neoadjuvant therapy and before surgery by the: (a) operating surgeon
Staging McGory Inclusion 2 1211
IF a patient is undergoing colorectal cancer surgery without neoadjuvant therapy, THEN a carcinoembryonic antigen (CEA) level should be obtained preoperatively (between diagnosis and surgery)
Staging McGory Inclusion 2 1213
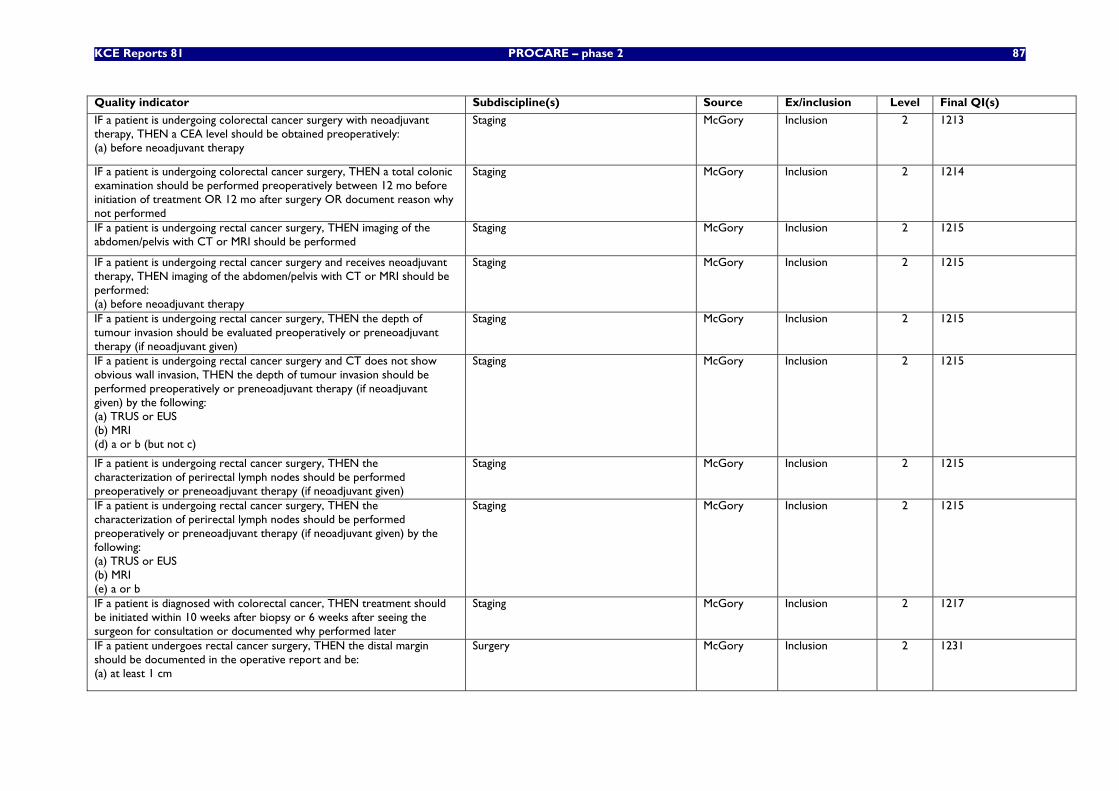
KCE Reports 81 PROCARE – phase 2 87
Quality indicator Subdiscipline(s) Source Ex/inclusion Level Final QI(s)
IF a patient is undergoing colorectal cancer surgery with neoadjuvant therapy, THEN a CEA level should be obtained preoperatively: (a) before neoadjuvant therapy
Staging McGory Inclusion 2 1213
IF a patient is undergoing colorectal cancer surgery, THEN a total colonic examination should be performed preoperatively between 12 mo before initiation of treatment OR 12 mo after surgery OR document reason why not performed
Staging McGory Inclusion 2 1214
IF a patient is undergoing rectal cancer surgery, THEN imaging of the abdomen/pelvis with CT or MRI should be performed
Staging McGory Inclusion 2 1215
IF a patient is undergoing rectal cancer surgery and receives neoadjuvant therapy, THEN imaging of the abdomen/pelvis with CT or MRI should be performed: (a) before neoadjuvant therapy
Staging McGory Inclusion 2 1215
IF a patient is undergoing rectal cancer surgery, THEN the depth of tumour invasion should be evaluated preoperatively or preneoadjuvant therapy (if neoadjuvant given)
Staging McGory Inclusion 2 1215
IF a patient is undergoing rectal cancer surgery and CT does not show obvious wall invasion, THEN the depth of tumour invasion should be performed preoperatively or preneoadjuvant therapy (if neoadjuvant given) by the following: (a) TRUS or EUS (b) MRI (d) a or b (but not c)
Staging McGory Inclusion 2 1215
IF a patient is undergoing rectal cancer surgery, THEN the characterization of perirectal lymph nodes should be performed preoperatively or preneoadjuvant therapy (if neoadjuvant given)
Staging McGory Inclusion 2 1215
IF a patient is undergoing rectal cancer surgery, THEN the characterization of perirectal lymph nodes should be performed preoperatively or preneoadjuvant therapy (if neoadjuvant given) by the following: (a) TRUS or EUS (b) MRI (e) a or b
Staging McGory Inclusion 2 1215
IF a patient is diagnosed with colorectal cancer, THEN treatment should be initiated within 10 weeks after biopsy or 6 weeks after seeing the surgeon for consultation or documented why performed later
Staging McGory Inclusion 2 1217
IF a patient undergoes rectal cancer surgery, THEN the distal margin should be documented in the operative report and be: (a) at least 1 cm
Surgery McGory Inclusion 2 1231
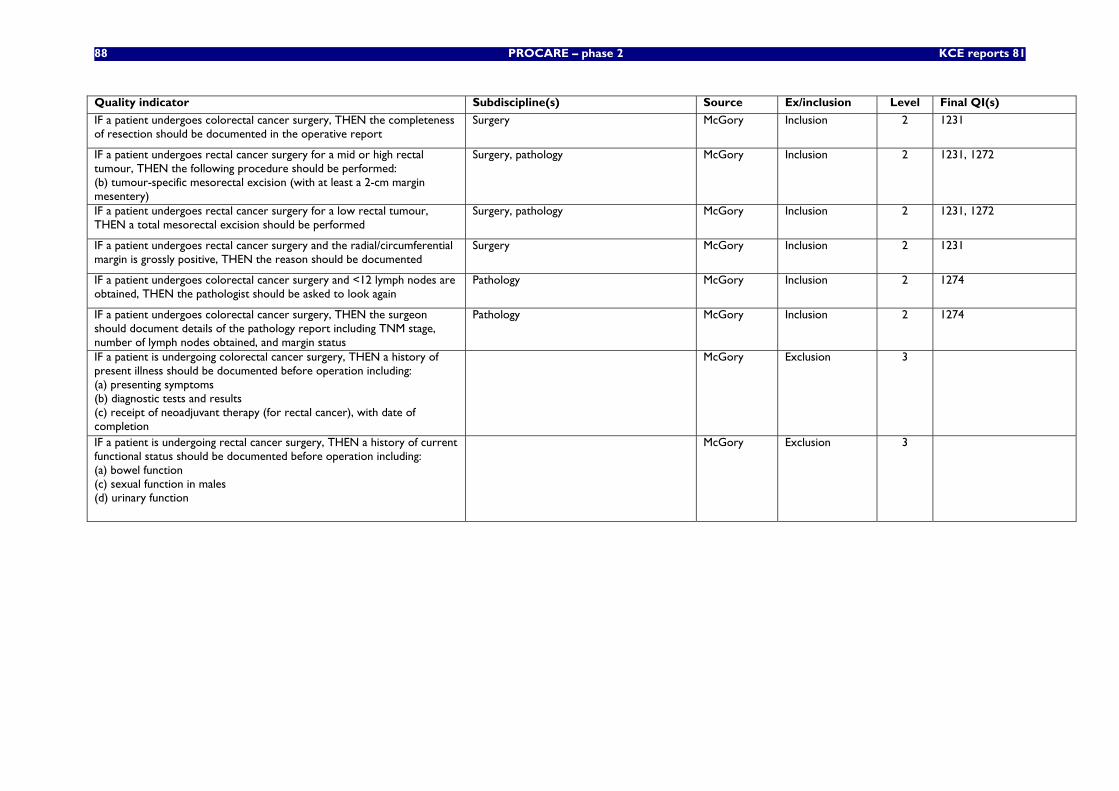
88 PROCARE – phase 2 KCE reports 81
Quality indicator Subdiscipline(s) Source Ex/inclusion Level Final QI(s)
IF a patient undergoes colorectal cancer surgery, THEN the completeness of resection should be documented in the operative report
Surgery McGory Inclusion 2 1231
IF a patient undergoes rectal cancer surgery for a mid or high rectal tumour, THEN the following procedure should be performed: (b) tumour-specific mesorectal excision (with at least a 2-cm margin mesentery)
Surgery, pathology McGory Inclusion 2 1231, 1272
IF a patient undergoes rectal cancer surgery for a low rectal tumour, THEN a total mesorectal excision should be performed
Surgery, pathology McGory Inclusion 2 1231, 1272
IF a patient undergoes rectal cancer surgery and the radial/circumferential margin is grossly positive, THEN the reason should be documented
Surgery McGory Inclusion 2 1231
IF a patient undergoes colorectal cancer surgery and <12 lymph nodes are obtained, THEN the pathologist should be asked to look again
Pathology McGory Inclusion 2 1274
IF a patient undergoes colorectal cancer surgery, THEN the surgeon should document details of the pathology report including TNM stage, number of lymph nodes obtained, and margin status
Pathology McGory Inclusion 2 1274
IF a patient is undergoing colorectal cancer surgery, THEN a history of present illness should be documented before operation including: (a) presenting symptoms (b) diagnostic tests and results (c) receipt of neoadjuvant therapy (for rectal cancer), with date of completion
McGory Exclusion 3
IF a patient is undergoing rectal cancer surgery, THEN a history of current functional status should be documented before operation including: (a) bowel function (c) sexual function in males (d) urinary function
McGory Exclusion 3
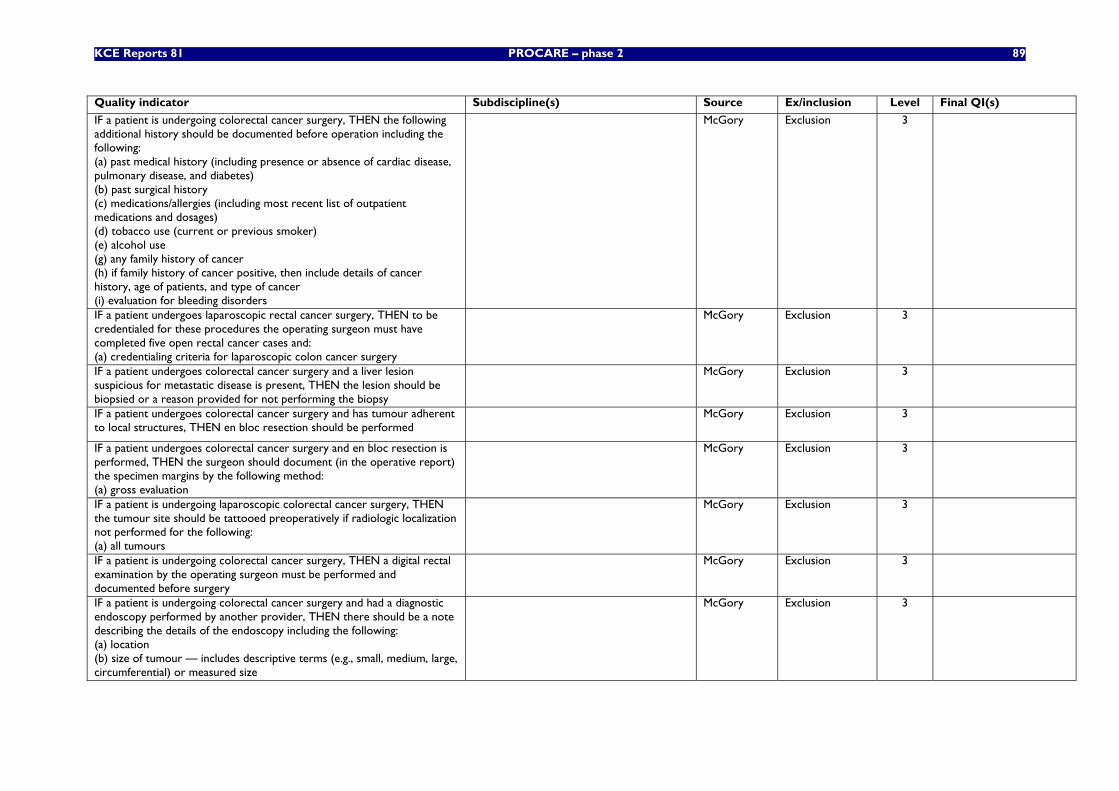
KCE Reports 81 PROCARE – phase 2 89
Quality indicator Subdiscipline(s) Source Ex/inclusion Level Final QI(s)
IF a patient is undergoing colorectal cancer surgery, THEN the following additional history should be documented before operation including the following: (a) past medical history (including presence or absence of cardiac disease, pulmonary disease, and diabetes) (b) past surgical history (c) medications/allergies (including most recent list of outpatient medications and dosages) (d) tobacco use (current or previous smoker) (e) alcohol use (g) any family history of cancer (h) if family history of cancer positive, then include details of cancer history, age of patients, and type of cancer (i) evaluation for bleeding disorders
McGory Exclusion 3
IF a patient undergoes laparoscopic rectal cancer surgery, THEN to be credentialed for these procedures the operating surgeon must have completed five open rectal cancer cases and: (a) credentialing criteria for laparoscopic colon cancer surgery
McGory Exclusion 3
IF a patient undergoes colorectal cancer surgery and a liver lesion suspicious for metastatic disease is present, THEN the lesion should be biopsied or a reason provided for not performing the biopsy
McGory Exclusion 3
IF a patient undergoes colorectal cancer surgery and has tumour adherent to local structures, THEN en bloc resection should be performed
McGory Exclusion 3
IF a patient undergoes colorectal cancer surgery and en bloc resection is performed, THEN the surgeon should document (in the operative report) the specimen margins by the following method: (a) gross evaluation
McGory Exclusion 3
IF a patient is undergoing laparoscopic colorectal cancer surgery, THEN the tumour site should be tattooed preoperatively if radiologic localization not performed for the following: (a) all tumours
McGory Exclusion 3
IF a patient is undergoing colorectal cancer surgery, THEN a digital rectal examination by the operating surgeon must be performed and documented before surgery
McGory Exclusion 3
IF a patient is undergoing colorectal cancer surgery and had a diagnostic endoscopy performed by another provider, THEN there should be a note describing the details of the endoscopy including the following: (a) location (b) size of tumour — includes descriptive terms (e.g., small, medium, large, circumferential) or measured size
McGory Exclusion 3
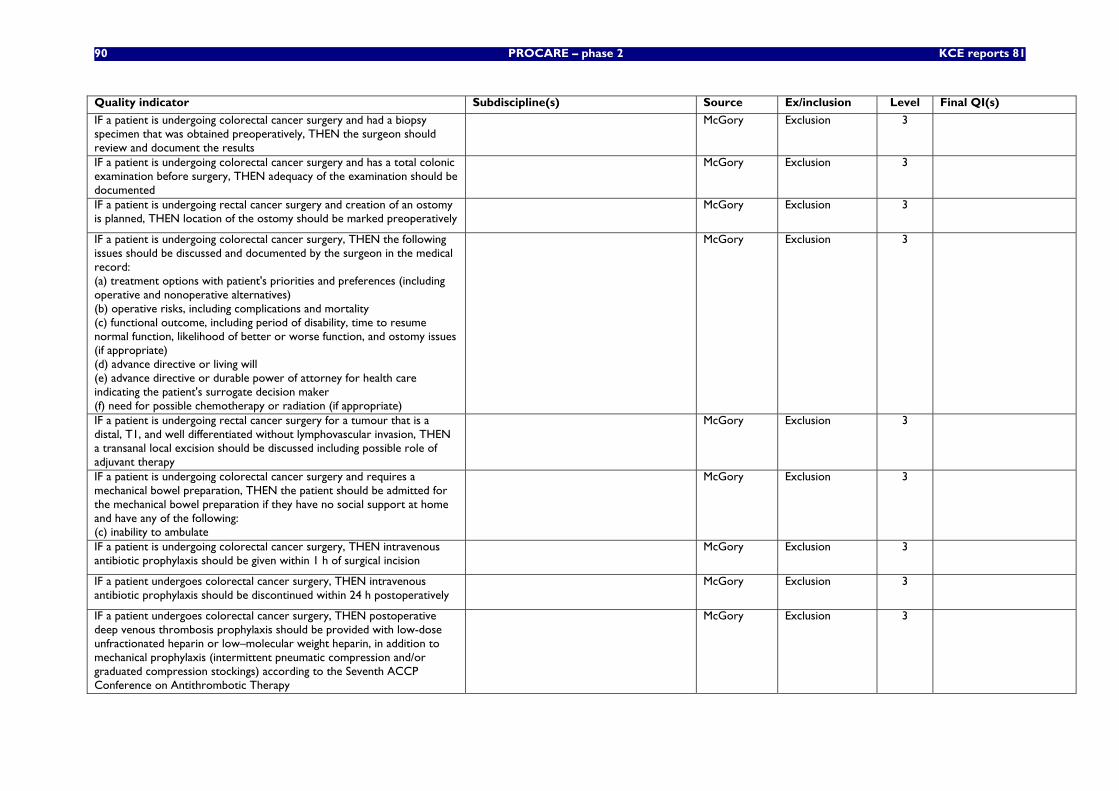
90 PROCARE – phase 2 KCE reports 81
Quality indicator Subdiscipline(s) Source Ex/inclusion Level Final QI(s)
IF a patient is undergoing colorectal cancer surgery and had a biopsy specimen that was obtained preoperatively, THEN the surgeon should review and document the results
McGory Exclusion 3
IF a patient is undergoing colorectal cancer surgery and has a total colonic examination before surgery, THEN adequacy of the examination should be documented
McGory Exclusion 3
IF a patient is undergoing rectal cancer surgery and creation of an ostomy is planned, THEN location of the ostomy should be marked preoperatively
McGory Exclusion 3
IF a patient is undergoing colorectal cancer surgery, THEN the following issues should be discussed and documented by the surgeon in the medical record: (a) treatment options with patient's priorities and preferences (including operative and nonoperative alternatives) (b) operative risks, including complications and mortality (c) functional outcome, including period of disability, time to resume normal function, likelihood of better or worse function, and ostomy issues (if appropriate) (d) advance directive or living will (e) advance directive or durable power of attorney for health care indicating the patient's surrogate decision maker (f) need for possible chemotherapy or radiation (if appropriate)
McGory Exclusion 3
IF a patient is undergoing rectal cancer surgery for a tumour that is a distal, T1, and well differentiated without lymphovascular invasion, THEN a transanal local excision should be discussed including possible role of adjuvant therapy
McGory Exclusion 3
IF a patient is undergoing colorectal cancer surgery and requires a mechanical bowel preparation, THEN the patient should be admitted for the mechanical bowel preparation if they have no social support at home and have any of the following: (c) inability to ambulate
McGory Exclusion 3
IF a patient is undergoing colorectal cancer surgery, THEN intravenous antibiotic prophylaxis should be given within 1 h of surgical incision
McGory Exclusion 3
IF a patient undergoes colorectal cancer surgery, THEN intravenous antibiotic prophylaxis should be discontinued within 24 h postoperatively
McGory Exclusion 3
IF a patient undergoes colorectal cancer surgery, THEN postoperative deep venous thrombosis prophylaxis should be provided with low-dose unfractionated heparin or low–molecular weight heparin, in addition to mechanical prophylaxis (intermittent pneumatic compression and/or graduated compression stockings) according to the Seventh ACCP Conference on Antithrombotic Therapy
McGory Exclusion 3
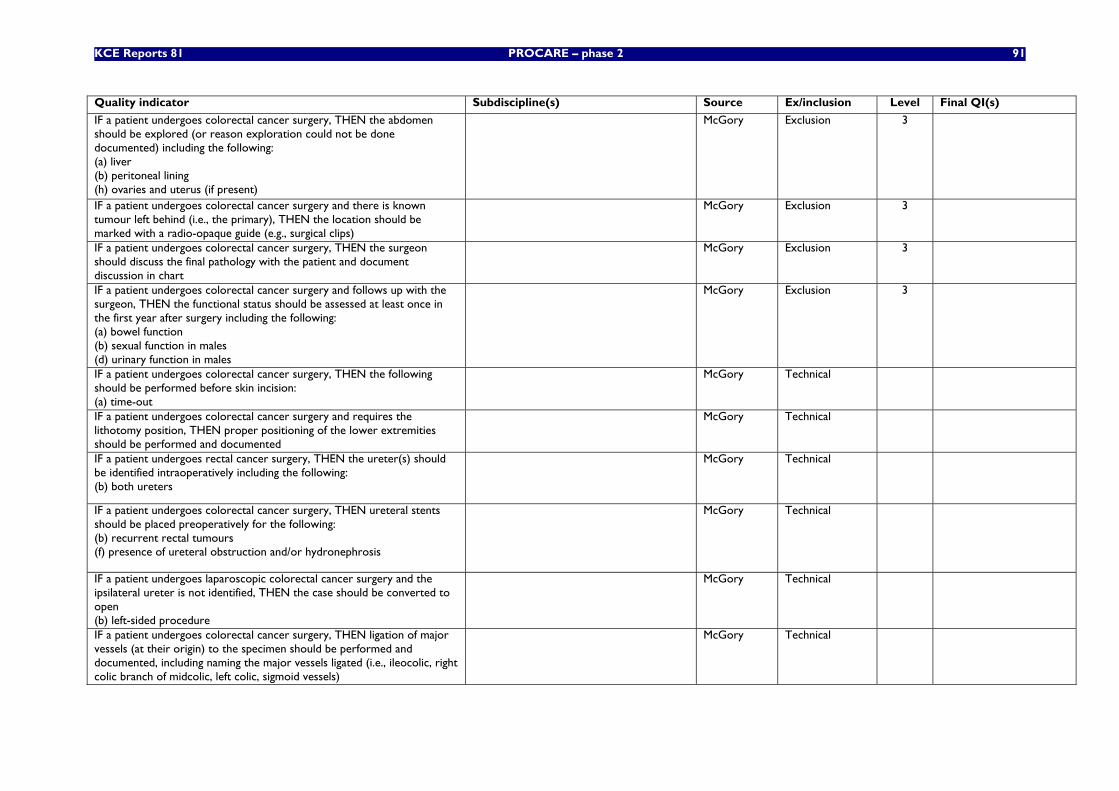
KCE Reports 81 PROCARE – phase 2 91
Quality indicator Subdiscipline(s) Source Ex/inclusion Level Final QI(s)
IF a patient undergoes colorectal cancer surgery, THEN the abdomen should be explored (or reason exploration could not be done documented) including the following: (a) liver (b) peritoneal lining (h) ovaries and uterus (if present)
McGory Exclusion 3
IF a patient undergoes colorectal cancer surgery and there is known tumour left behind (i.e., the primary), THEN the location should be marked with a radio-opaque guide (e.g., surgical clips)
McGory Exclusion 3
IF a patient undergoes colorectal cancer surgery, THEN the surgeon should discuss the final pathology with the patient and document discussion in chart
McGory Exclusion 3
IF a patient undergoes colorectal cancer surgery and follows up with the surgeon, THEN the functional status should be assessed at least once in the first year after surgery including the following: (a) bowel function (b) sexual function in males (d) urinary function in males
McGory Exclusion 3
IF a patient undergoes colorectal cancer surgery, THEN the following should be performed before skin incision: (a) time-out
McGory Technical
IF a patient undergoes colorectal cancer surgery and requires the lithotomy position, THEN proper positioning of the lower extremities should be performed and documented
McGory Technical
IF a patient undergoes rectal cancer surgery, THEN the ureter(s) should be identified intraoperatively including the following: (b) both ureters
McGory Technical
IF a patient undergoes colorectal cancer surgery, THEN ureteral stents should be placed preoperatively for the following: (b) recurrent rectal tumours (f) presence of ureteral obstruction and/or hydronephrosis
McGory Technical
IF a patient undergoes laparoscopic colorectal cancer surgery and the ipsilateral ureter is not identified, THEN the case should be converted to open (b) left-sided procedure
McGory Technical
IF a patient undergoes colorectal cancer surgery, THEN ligation of major vessels (at their origin) to the specimen should be performed and documented, including naming the major vessels ligated (i.e., ileocolic, right colic branch of midcolic, left colic, sigmoid vessels)
McGory Technical
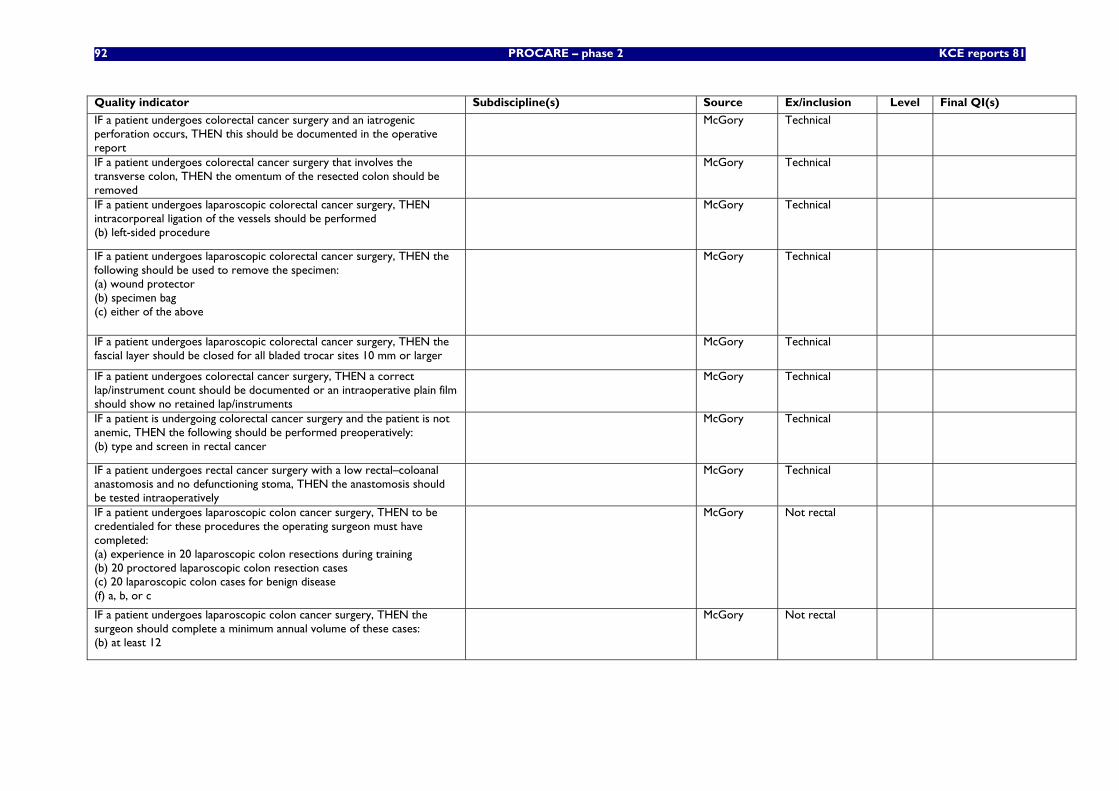
92 PROCARE – phase 2 KCE reports 81
Quality indicator Subdiscipline(s) Source Ex/inclusion Level Final QI(s)
IF a patient undergoes colorectal cancer surgery and an iatrogenic perforation occurs, THEN this should be documented in the operative report
McGory Technical
IF a patient undergoes colorectal cancer surgery that involves the transverse colon, THEN the omentum of the resected colon should be removed
McGory Technical
IF a patient undergoes laparoscopic colorectal cancer surgery, THEN intracorporeal ligation of the vessels should be performed (b) left-sided procedure
McGory Technical
IF a patient undergoes laparoscopic colorectal cancer surgery, THEN the following should be used to remove the specimen: (a) wound protector (b) specimen bag (c) either of the above
McGory Technical
IF a patient undergoes laparoscopic colorectal cancer surgery, THEN the fascial layer should be closed for all bladed trocar sites 10 mm or larger
McGory Technical
IF a patient undergoes colorectal cancer surgery, THEN a correct lap/instrument count should be documented or an intraoperative plain film should show no retained lap/instruments
McGory Technical
IF a patient is undergoing colorectal cancer surgery and the patient is not anemic, THEN the following should be performed preoperatively: (b) type and screen in rectal cancer
McGory Technical
IF a patient undergoes rectal cancer surgery with a low rectal–coloanal anastomosis and no defunctioning stoma, THEN the anastomosis should be tested intraoperatively
McGory Technical
IF a patient undergoes laparoscopic colon cancer surgery, THEN to be credentialed for these procedures the operating surgeon must have completed: (a) experience in 20 laparoscopic colon resections during training (b) 20 proctored laparoscopic colon resection cases (c) 20 laparoscopic colon cases for benign disease (f) a, b, or c
McGory Not rectal
IF a patient undergoes laparoscopic colon cancer surgery, THEN the surgeon should complete a minimum annual volume of these cases: (b) at least 12
McGory Not rectal
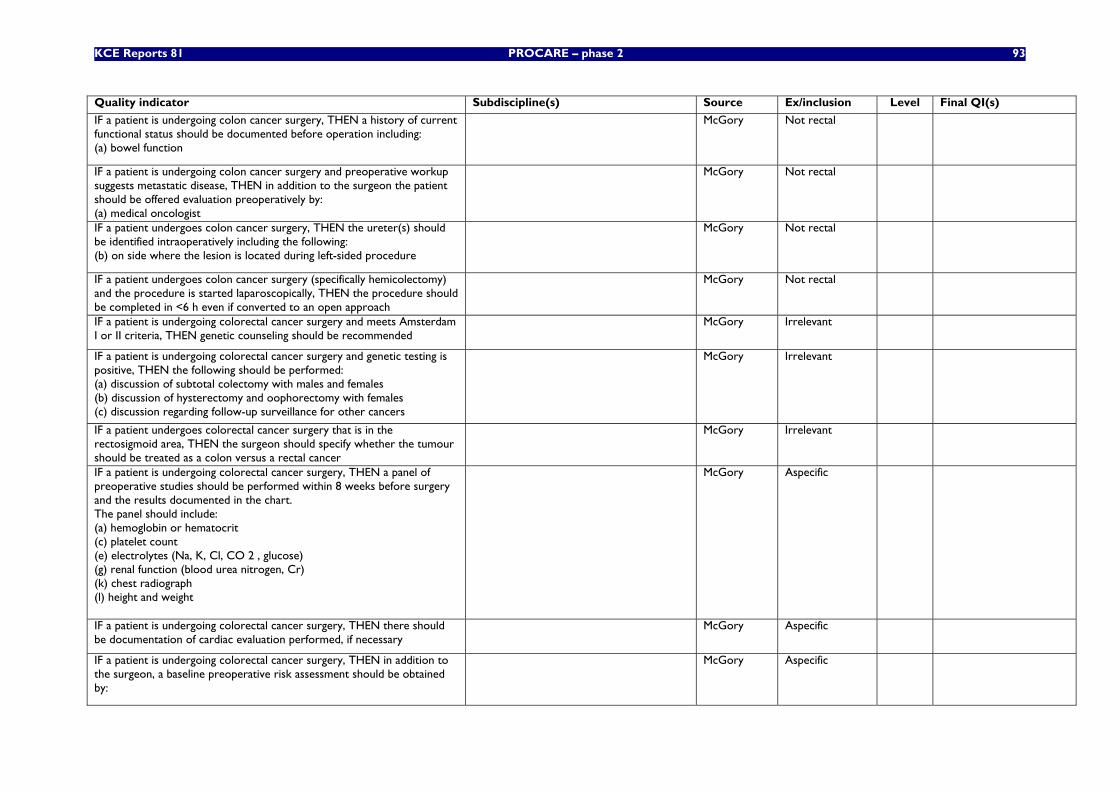
KCE Reports 81 PROCARE – phase 2 93
Quality indicator Subdiscipline(s) Source Ex/inclusion Level Final QI(s)
IF a patient is undergoing colon cancer surgery, THEN a history of current functional status should be documented before operation including: (a) bowel function
McGory Not rectal
IF a patient is undergoing colon cancer surgery and preoperative workup suggests metastatic disease, THEN in addition to the surgeon the patient should be offered evaluation preoperatively by: (a) medical oncologist
McGory Not rectal
IF a patient undergoes colon cancer surgery, THEN the ureter(s) should be identified intraoperatively including the following: (b) on side where the lesion is located during left-sided procedure
McGory Not rectal
IF a patient undergoes colon cancer surgery (specifically hemicolectomy) and the procedure is started laparoscopically, THEN the procedure should be completed in <6 h even if converted to an open approach
McGory Not rectal
IF a patient is undergoing colorectal cancer surgery and meets Amsterdam I or II criteria, THEN genetic counseling should be recommended
McGory Irrelevant
IF a patient is undergoing colorectal cancer surgery and genetic testing is positive, THEN the following should be performed: (a) discussion of subtotal colectomy with males and females (b) discussion of hysterectomy and oophorectomy with females (c) discussion regarding follow-up surveillance for other cancers
McGory Irrelevant
IF a patient undergoes colorectal cancer surgery that is in the rectosigmoid area, THEN the surgeon should specify whether the tumour should be treated as a colon versus a rectal cancer
McGory Irrelevant
IF a patient is undergoing colorectal cancer surgery, THEN a panel of preoperative studies should be performed within 8 weeks before surgery and the results documented in the chart. The panel should include: (a) hemoglobin or hematocrit (c) platelet count (e) electrolytes (Na, K, Cl, CO 2 , glucose) (g) renal function (blood urea nitrogen, Cr) (k) chest radiograph (l) height and weight
McGory Aspecific
IF a patient is undergoing colorectal cancer surgery, THEN there should be documentation of cardiac evaluation performed, if necessary
McGory Aspecific
IF a patient is undergoing colorectal cancer surgery, THEN in addition to the surgeon, a baseline preoperative risk assessment should be obtained by:
McGory Aspecific
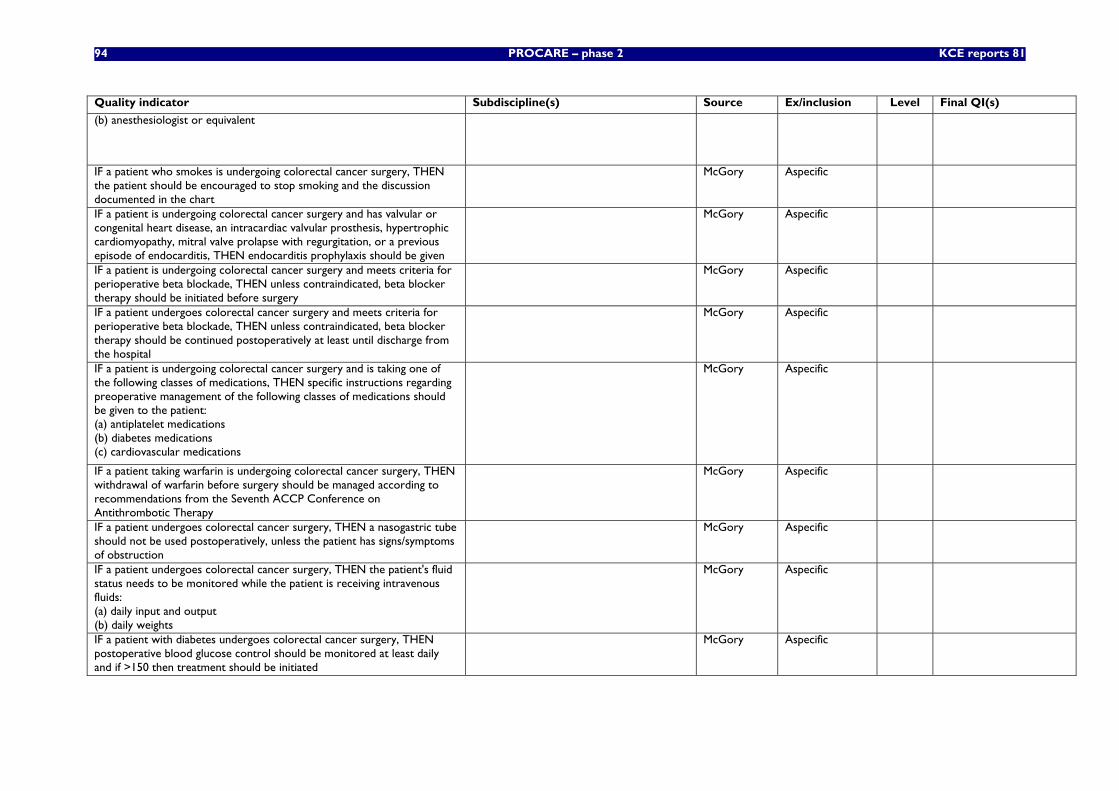
94 PROCARE – phase 2 KCE reports 81
Quality indicator Subdiscipline(s) Source Ex/inclusion Level Final QI(s)
(b) anesthesiologist or equivalent
IF a patient who smokes is undergoing colorectal cancer surgery, THEN the patient should be encouraged to stop smoking and the discussion documented in the chart
McGory Aspecific
IF a patient is undergoing colorectal cancer surgery and has valvular or congenital heart disease, an intracardiac valvular prosthesis, hypertrophic cardiomyopathy, mitral valve prolapse with regurgitation, or a previous episode of endocarditis, THEN endocarditis prophylaxis should be given
McGory Aspecific
IF a patient is undergoing colorectal cancer surgery and meets criteria for perioperative beta blockade, THEN unless contraindicated, beta blocker therapy should be initiated before surgery
McGory Aspecific
IF a patient undergoes colorectal cancer surgery and meets criteria for perioperative beta blockade, THEN unless contraindicated, beta blocker therapy should be continued postoperatively at least until discharge from the hospital
McGory Aspecific
IF a patient is undergoing colorectal cancer surgery and is taking one of the following classes of medications, THEN specific instructions regarding preoperative management of the following classes of medications should be given to the patient: (a) antiplatelet medications (b) diabetes medications (c) cardiovascular medications
McGory Aspecific
IF a patient taking warfarin is undergoing colorectal cancer surgery, THEN withdrawal of warfarin before surgery should be managed according to recommendations from the Seventh ACCP Conference on Antithrombotic Therapy
McGory Aspecific
IF a patient undergoes colorectal cancer surgery, THEN a nasogastric tube should not be used postoperatively, unless the patient has signs/symptoms of obstruction
McGory Aspecific
IF a patient undergoes colorectal cancer surgery, THEN the patient's fluid status needs to be monitored while the patient is receiving intravenous fluids: (a) daily input and output (b) daily weights
McGory Aspecific
IF a patient with diabetes undergoes colorectal cancer surgery, THEN postoperative blood glucose control should be monitored at least daily and if >150 then treatment should be initiated
McGory Aspecific
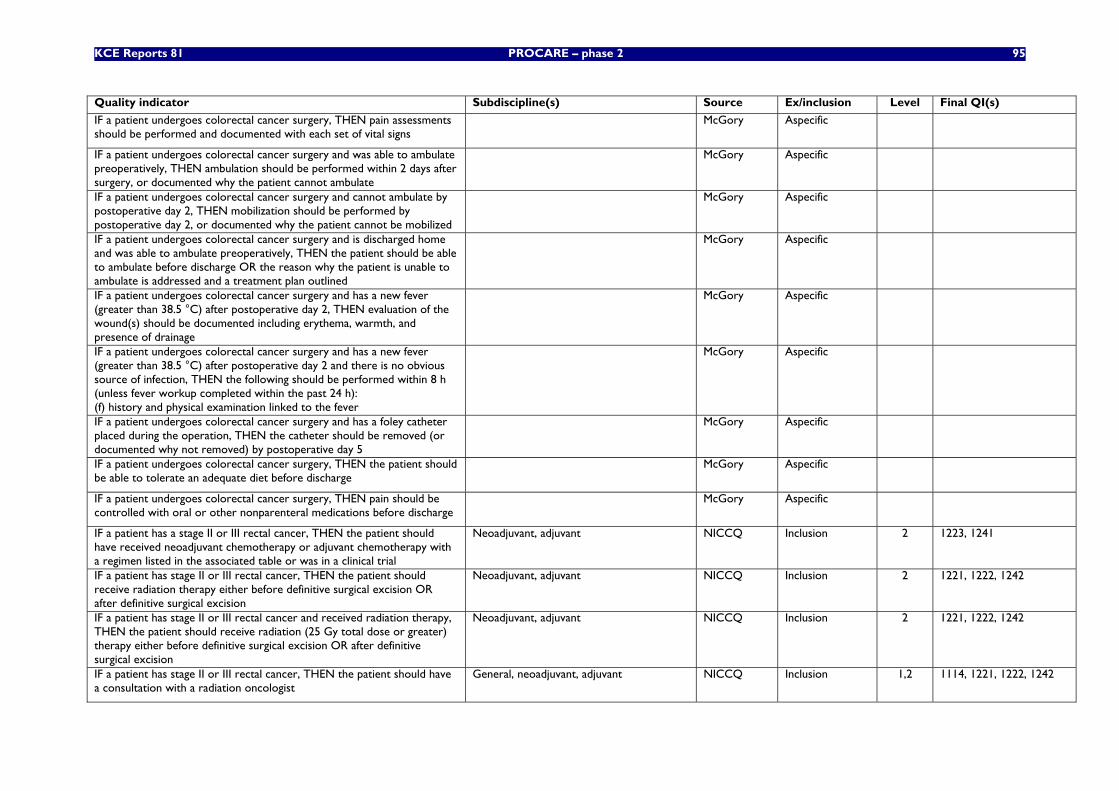
KCE Reports 81 PROCARE – phase 2 95
Quality indicator Subdiscipline(s) Source Ex/inclusion Level Final QI(s)
IF a patient undergoes colorectal cancer surgery, THEN pain assessments should be performed and documented with each set of vital signs
McGory Aspecific
IF a patient undergoes colorectal cancer surgery and was able to ambulate preoperatively, THEN ambulation should be performed within 2 days after surgery, or documented why the patient cannot ambulate
McGory Aspecific
IF a patient undergoes colorectal cancer surgery and cannot ambulate by postoperative day 2, THEN mobilization should be performed by postoperative day 2, or documented why the patient cannot be mobilized
McGory Aspecific
IF a patient undergoes colorectal cancer surgery and is discharged home and was able to ambulate preoperatively, THEN the patient should be able to ambulate before discharge OR the reason why the patient is unable to ambulate is addressed and a treatment plan outlined
McGory Aspecific
IF a patient undergoes colorectal cancer surgery and has a new fever (greater than 38.5 °C) after postoperative day 2, THEN evaluation of the wound(s) should be documented including erythema, warmth, and presence of drainage
McGory Aspecific
IF a patient undergoes colorectal cancer surgery and has a new fever (greater than 38.5 °C) after postoperative day 2 and there is no obvious source of infection, THEN the following should be performed within 8 h (unless fever workup completed within the past 24 h): (f) history and physical examination linked to the fever
McGory Aspecific
IF a patient undergoes colorectal cancer surgery and has a foley catheter placed during the operation, THEN the catheter should be removed (or documented why not removed) by postoperative day 5
McGory Aspecific
IF a patient undergoes colorectal cancer surgery, THEN the patient should be able to tolerate an adequate diet before discharge
McGory Aspecific
IF a patient undergoes colorectal cancer surgery, THEN pain should be controlled with oral or other nonparenteral medications before discharge
McGory Aspecific
IF a patient has a stage II or III rectal cancer, THEN the patient should have received neoadjuvant chemotherapy or adjuvant chemotherapy with a regimen listed in the associated table or was in a clinical trial
Neoadjuvant, adjuvant NICCQ Inclusion 2 1223, 1241
IF a patient has stage II or III rectal cancer, THEN the patient should receive radiation therapy either before definitive surgical excision OR after definitive surgical excision
Neoadjuvant, adjuvant NICCQ Inclusion 2 1221, 1222, 1242
IF a patient has stage II or III rectal cancer and received radiation therapy, THEN the patient should receive radiation (25 Gy total dose or greater) therapy either before definitive surgical excision OR after definitive surgical excision
Neoadjuvant, adjuvant NICCQ Inclusion 2 1221, 1222, 1242
IF a patient has stage II or III rectal cancer, THEN the patient should have a consultation with a radiation oncologist
General, neoadjuvant, adjuvant NICCQ Inclusion 1,2 1114, 1221, 1222, 1242
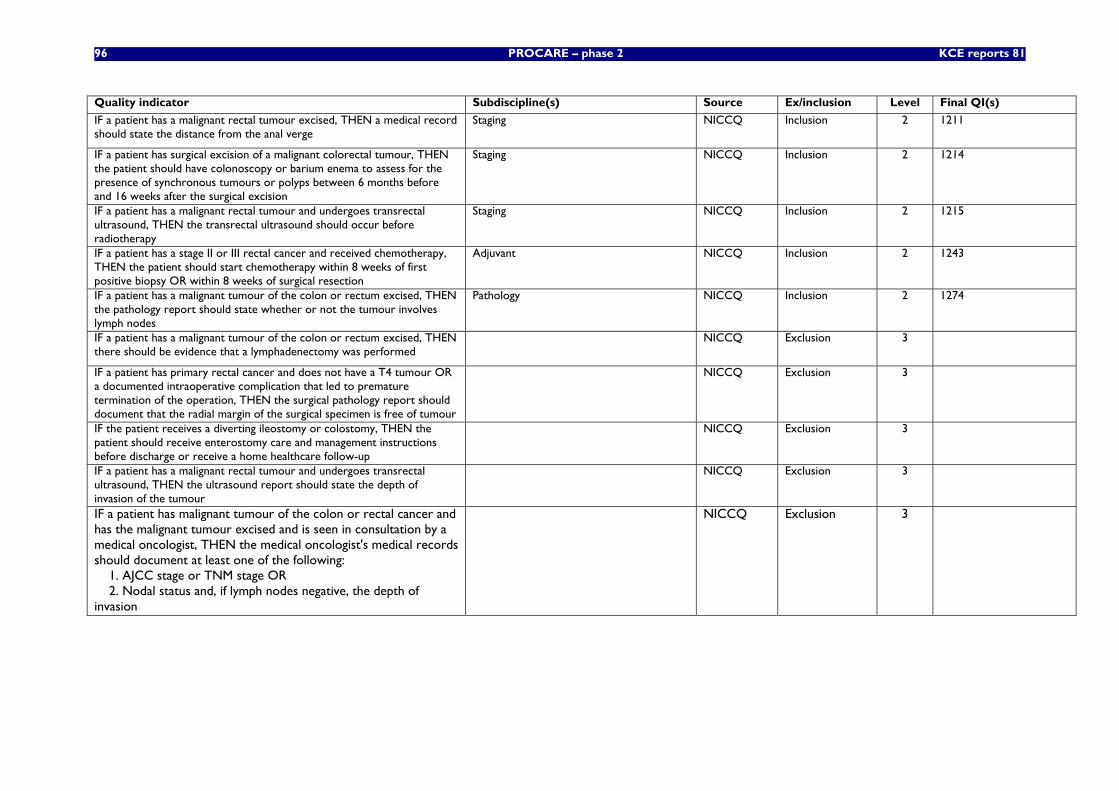
96 PROCARE – phase 2 KCE reports 81
Quality indicator Subdiscipline(s) Source Ex/inclusion Level Final QI(s)
IF a patient has a malignant rectal tumour excised, THEN a medical record should state the distance from the anal verge
Staging NICCQ Inclusion 2 1211
IF a patient has surgical excision of a malignant colorectal tumour, THEN the patient should have colonoscopy or barium enema to assess for the presence of synchronous tumours or polyps between 6 months before and 16 weeks after the surgical excision
Staging NICCQ Inclusion 2 1214
IF a patient has a malignant rectal tumour and undergoes transrectal ultrasound, THEN the transrectal ultrasound should occur before radiotherapy
Staging NICCQ Inclusion 2 1215
IF a patient has a stage II or III rectal cancer and received chemotherapy, THEN the patient should start chemotherapy within 8 weeks of first positive biopsy OR within 8 weeks of surgical resection
Adjuvant NICCQ Inclusion 2 1243
IF a patient has a malignant tumour of the colon or rectum excised, THEN the pathology report should state whether or not the tumour involves lymph nodes
Pathology NICCQ Inclusion 2 1274
IF a patient has a malignant tumour of the colon or rectum excised, THEN there should be evidence that a lymphadenectomy was performed
NICCQ Exclusion 3
IF a patient has primary rectal cancer and does not have a T4 tumour OR a documented intraoperative complication that led to premature termination of the operation, THEN the surgical pathology report should document that the radial margin of the surgical specimen is free of tumour
NICCQ Exclusion 3
IF the patient receives a diverting ileostomy or colostomy, THEN the patient should receive enterostomy care and management instructions before discharge or receive a home healthcare follow-up
NICCQ Exclusion 3
IF a patient has a malignant rectal tumour and undergoes transrectal ultrasound, THEN the ultrasound report should state the depth of invasion of the tumour
NICCQ Exclusion 3
IF a patient has malignant tumour of the colon or rectal cancer and has the malignant tumour excised and is seen in consultation by a medical oncologist, THEN the medical oncologist's medical records should document at least one of the following: 1. AJCC stage or TNM stage OR 2. Nodal status and, if lymph nodes negative, the depth of invasion
NICCQ Exclusion 3
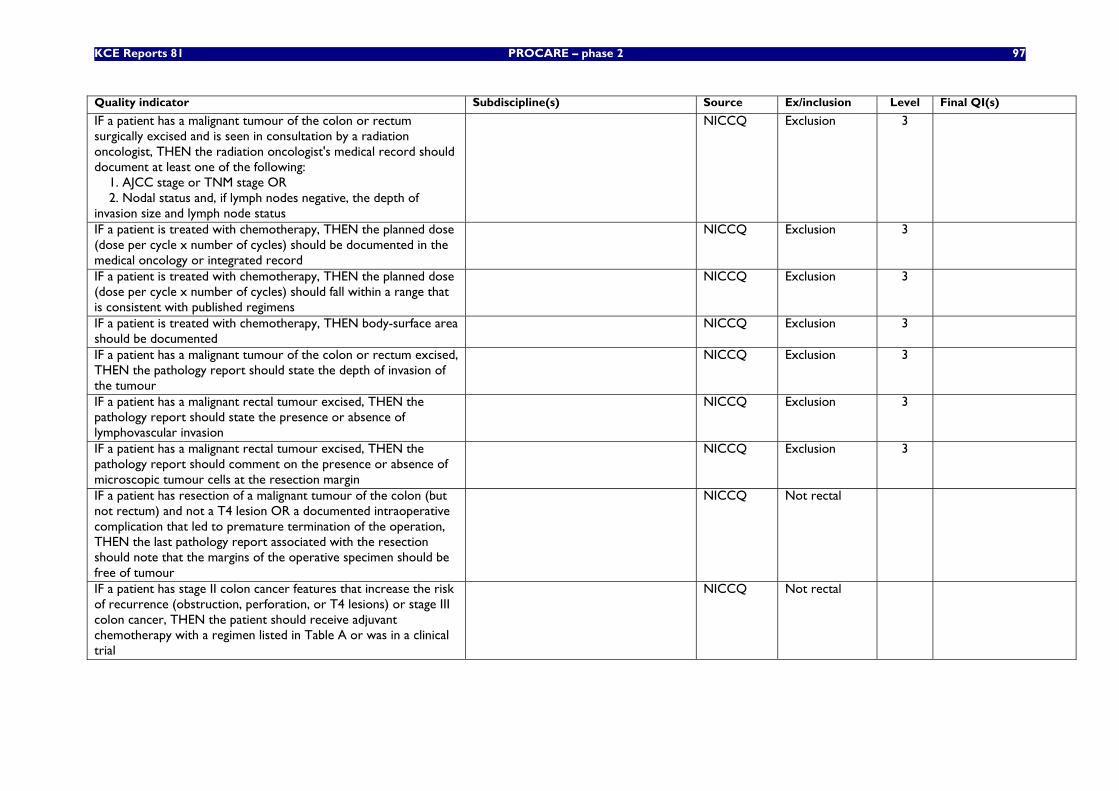
KCE Reports 81 PROCARE – phase 2 97
Quality indicator Subdiscipline(s) Source Ex/inclusion Level Final QI(s)
IF a patient has a malignant tumour of the colon or rectum surgically excised and is seen in consultation by a radiation oncologist, THEN the radiation oncologist's medical record should document at least one of the following: 1. AJCC stage or TNM stage OR 2. Nodal status and, if lymph nodes negative, the depth of invasion size and lymph node status
NICCQ Exclusion 3
IF a patient is treated with chemotherapy, THEN the planned dose (dose per cycle x number of cycles) should be documented in the medical oncology or integrated record
NICCQ Exclusion 3
IF a patient is treated with chemotherapy, THEN the planned dose (dose per cycle x number of cycles) should fall within a range that is consistent with published regimens
NICCQ Exclusion 3
IF a patient is treated with chemotherapy, THEN body-surface area should be documented
NICCQ Exclusion 3
IF a patient has a malignant tumour of the colon or rectum excised, THEN the pathology report should state the depth of invasion of the tumour
NICCQ Exclusion 3
IF a patient has a malignant rectal tumour excised, THEN the pathology report should state the presence or absence of lymphovascular invasion
NICCQ Exclusion 3
IF a patient has a malignant rectal tumour excised, THEN the pathology report should comment on the presence or absence of microscopic tumour cells at the resection margin
NICCQ Exclusion 3
IF a patient has resection of a malignant tumour of the colon (but not rectum) and not a T4 lesion OR a documented intraoperative complication that led to premature termination of the operation, THEN the last pathology report associated with the resection should note that the margins of the operative specimen should be free of tumour
NICCQ Not rectal
IF a patient has stage II colon cancer features that increase the risk of recurrence (obstruction, perforation, or T4 lesions) or stage III colon cancer, THEN the patient should receive adjuvant chemotherapy with a regimen listed in Table A or was in a clinical trial
NICCQ Not rectal
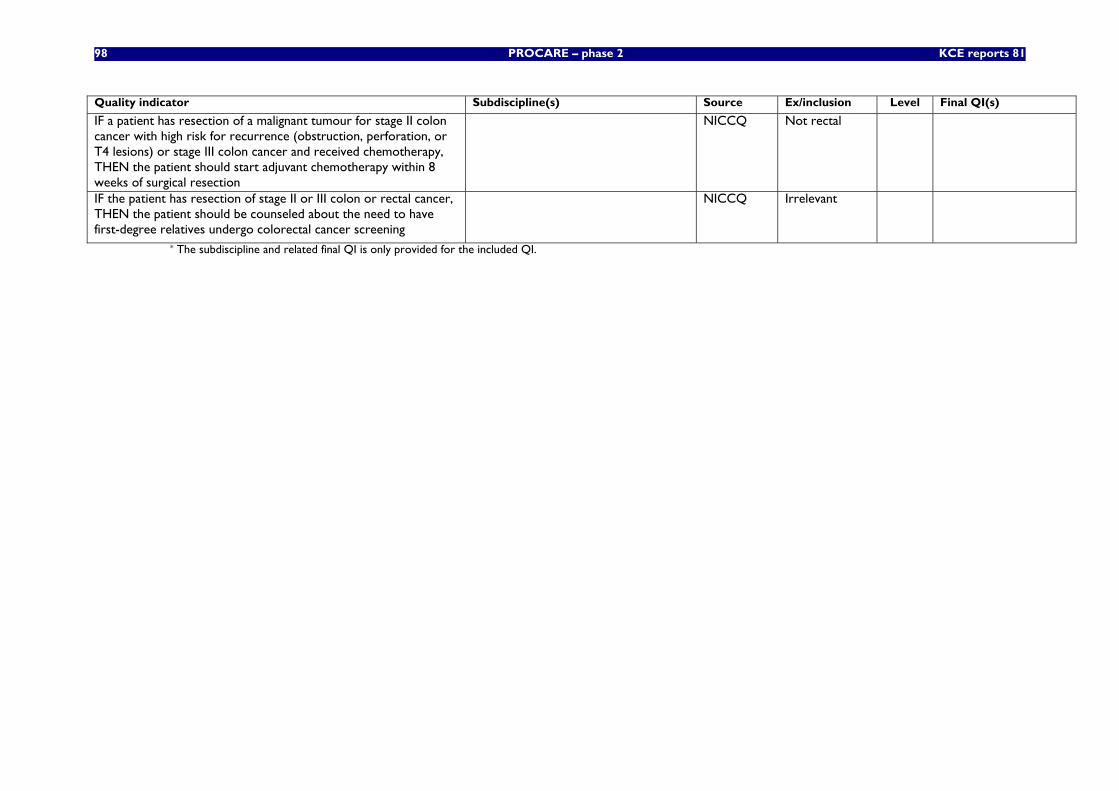
98 PROCARE – phase 2 KCE reports 81
Quality indicator Subdiscipline(s) Source Ex/inclusion Level Final QI(s)
IF a patient has resection of a malignant tumour for stage II colon cancer with high risk for recurrence (obstruction, perforation, or T4 lesions) or stage III colon cancer and received chemotherapy, THEN the patient should start adjuvant chemotherapy within 8 weeks of surgical resection
NICCQ Not rectal
IF the patient has resection of stage II or III colon or rectal cancer, THEN the patient should be counseled about the need to have first-degree relatives undergo colorectal cancer screening
NICCQ Irrelevant
* The subdiscipline and related final QI is only provided for the included QI.
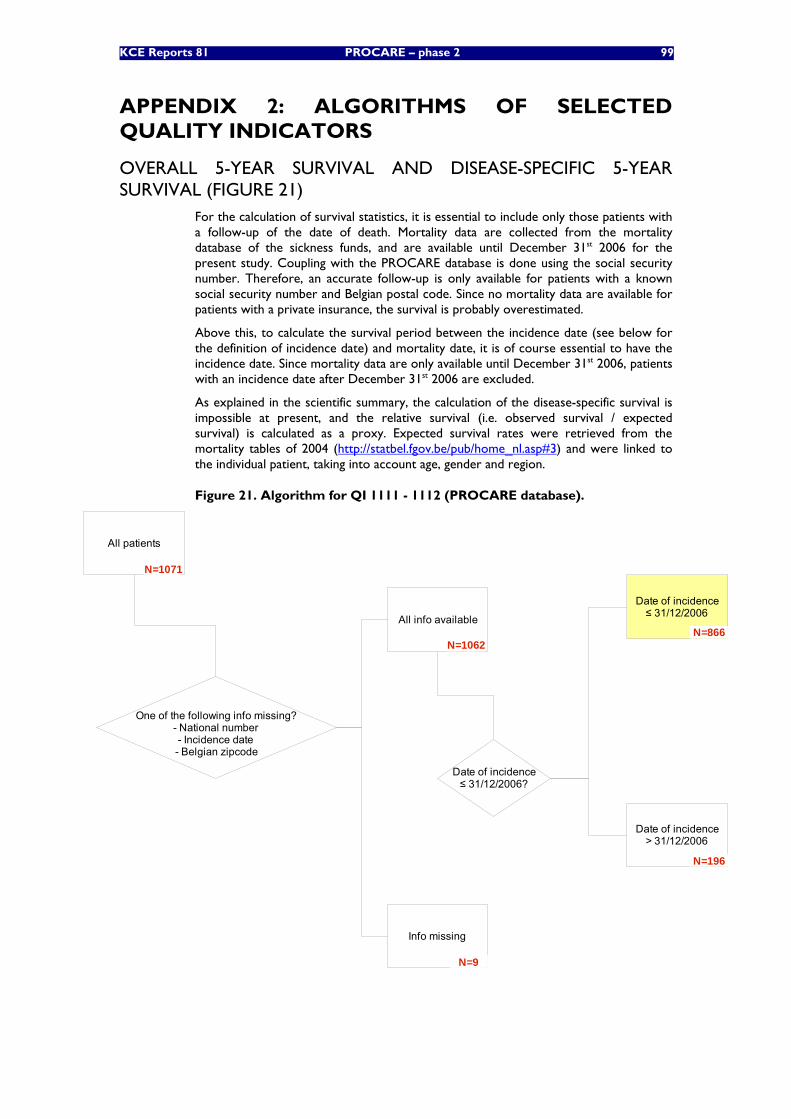
KCE Reports 81 PROCARE – phase 2 99
APPENDIX 2: ALGORITHMS OF SELECTED QUALITY INDICATORS
OVERALL 5-YEAR SURVIVAL AND DISEASE-SPECIFIC 5-YEAR SURVIVAL (FIGURE 21)
For the calculation of survival statistics, it is essential to include only those patients with a follow-up of the date of death. Mortality data are collected from the mortality database of the sickness funds, and are available until December 31st 2006 for the present study. Coupling with the PROCARE database is done using the social security number. Therefore, an accurate follow-up is only available for patients with a known social security number and Belgian postal code. Since no mortality data are available for patients with a private insurance, the survival is probably overestimated.
Above this, to calculate the survival period between the incidence date (see below for the definition of incidence date) and mortality date, it is of course essential to have the incidence date. Since mortality data are only available until December 31st 2006, patients with an incidence date after December 31st 2006 are excluded.
As explained in the scientific summary, the calculation of the disease-specific survival is impossible at present, and the relative survival (i.e. observed survival / expected survival) is calculated as a proxy. Expected survival rates were retrieved from the mortality tables of 2004 (http://statbel.fgov.be/pub/home_nl.asp#3) and were linked to the individual patient, taking into account age, gender and region.
Figure 21. Algorithm for QI 1111 - 1112 (PROCARE database).
All patients
One of the following info missing?- National number- Incidence date- Belgian zipcode
All info available
Info missing
Date of incidence≤ 31/12/2006?
Date of incidence≤ 31/12/2006
Date of incidence> 31/12/2006
N=1071
N=196
N=866
N=9
N=1062
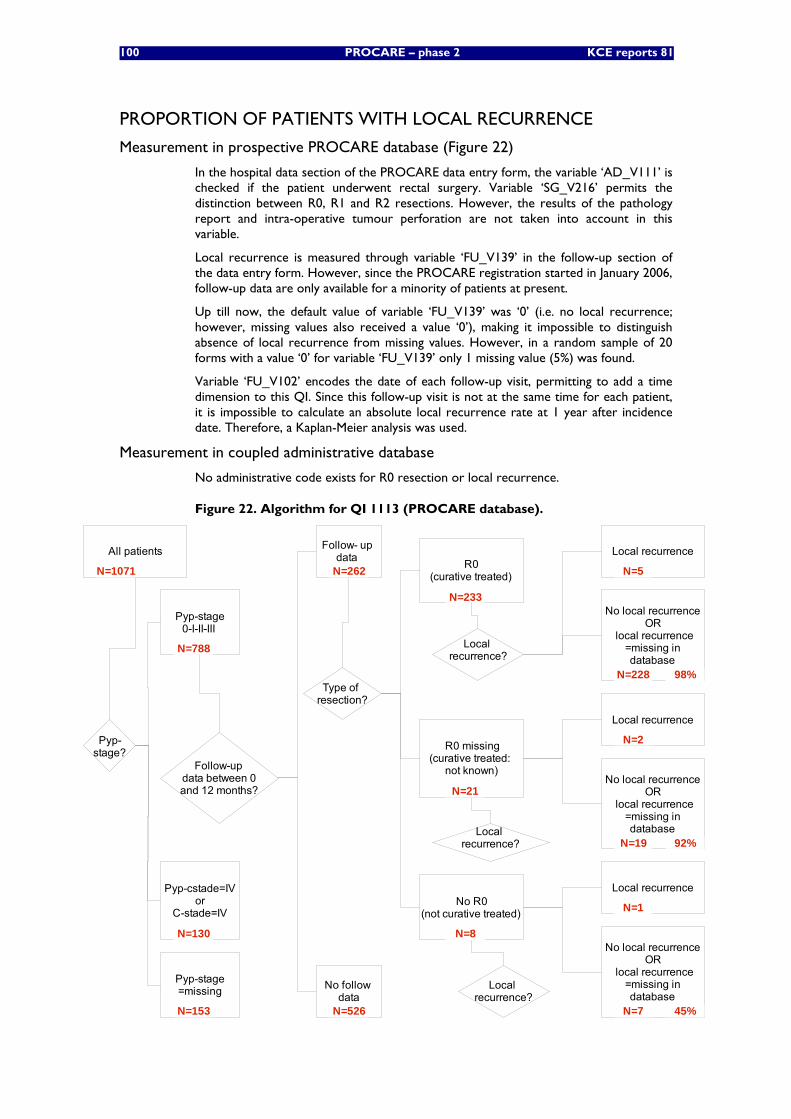
100 PROCARE – phase 2 KCE reports 81
PROPORTION OF PATIENTS WITH LOCAL RECURRENCE
Measurement in prospective PROCARE database (Figure 22)
In the hospital data section of the PROCARE data entry form, the variable ‘AD_V111’ is checked if the patient underwent rectal surgery. Variable ‘SG_V216’ permits the distinction between R0, R1 and R2 resections. However, the results of the pathology report and intra-operative tumour perforation are not taken into account in this variable.
Local recurrence is measured through variable ‘FU_V139’ in the follow-up section of the data entry form. However, since the PROCARE registration started in January 2006, follow-up data are only available for a minority of patients at present.
Up till now, the default value of variable ‘FU_V139’ was ‘0’ (i.e. no local recurrence; however, missing values also received a value ‘0’), making it impossible to distinguish absence of local recurrence from missing values. However, in a random sample of 20 forms with a value ‘0’ for variable ‘FU_V139’ only 1 missing value (5%) was found.
Variable ‘FU_V102’ encodes the date of each follow-up visit, permitting to add a time dimension to this QI. Since this follow-up visit is not at the same time for each patient, it is impossible to calculate an absolute local recurrence rate at 1 year after incidence date. Therefore, a Kaplan-Meier analysis was used.
Measurement in coupled administrative database
No administrative code exists for R0 resection or local recurrence.
Figure 22. Algorithm for QI 1113 (PROCARE database).
All patients
R0 missing(curative treated:
not known)
No R0(not curative treated)
R0(curative treated)
Type of resection?
Follow- up data
Local recurrence?
Follow-up data between 0and 12 months?
Local recurrence?
N=1071
N=21
N=262
N=233
N=8
Local recurrence?
Pyp-stage0-I-II-III
Pyp-cstade=IVor
C-stade=IV
Pyp-stage=missing
Pyp-stage?
N=788
N=130
N=153
No follow data
N=526
Local recurrence
No local recurrenceOR
local recurrence=missing indatabase
N=228
N=5
Local recurrence
Local recurrence
No local recurrenceOR
local recurrence=missing indatabase
No local recurrenceOR
local recurrence=missing indatabase
N=7
N=1
N=19
N=2
98%
45%
92%
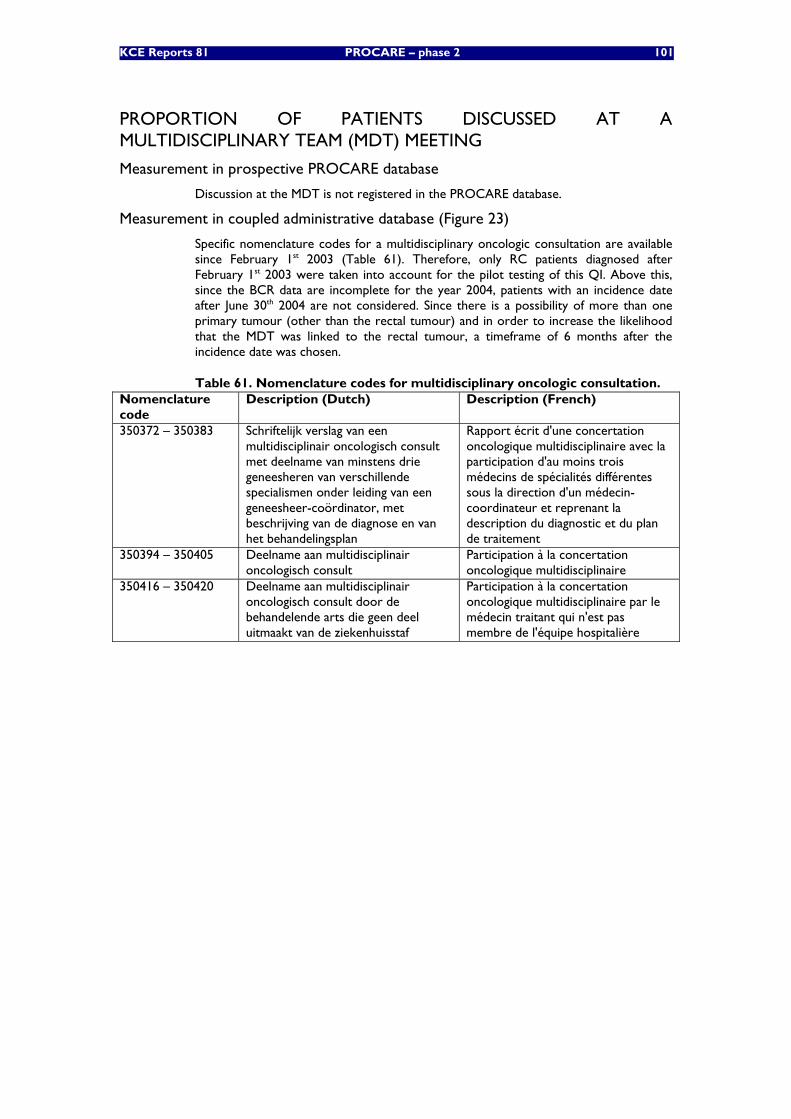
KCE Reports 81 PROCARE – phase 2 101
PROPORTION OF PATIENTS DISCUSSED AT A MULTIDISCIPLINARY TEAM (MDT) MEETING
Measurement in prospective PROCARE database
Discussion at the MDT is not registered in the PROCARE database.
Measurement in coupled administrative database (Figure 23)
Specific nomenclature codes for a multidisciplinary oncologic consultation are available since February 1st 2003 (Table 61). Therefore, only RC patients diagnosed after February 1st 2003 were taken into account for the pilot testing of this QI. Above this, since the BCR data are incomplete for the year 2004, patients with an incidence date after June 30th 2004 are not considered. Since there is a possibility of more than one primary tumour (other than the rectal tumour) and in order to increase the likelihood that the MDT was linked to the rectal tumour, a timeframe of 6 months after the incidence date was chosen.
Table 61. Nomenclature codes for multidisciplinary oncologic consultation. Nomenclature code
Description (Dutch) Description (French)
350372 – 350383 Schriftelijk verslag van een multidisciplinair oncologisch consult met deelname van minstens drie geneesheren van verschillende specialismen onder leiding van een geneesheer-coördinator, met beschrijving van de diagnose en van het behandelingsplan
Rapport écrit d'une concertation oncologique multidisciplinaire avec la participation d'au moins trois médecins de spécialités différentes sous la direction d'un médecin-coordinateur et reprenant la description du diagnostic et du plan de traitement
350394 – 350405 Deelname aan multidisciplinair oncologisch consult
Participation à la concertation oncologique multidisciplinaire
350416 – 350420 Deelname aan multidisciplinair oncologisch consult door de behandelende arts die geen deel uitmaakt van de ziekenhuisstaf
Participation à la concertation oncologique multidisciplinaire par le médecin traitant qui n'est pas membre de l'équipe hospitalière
102 PROCARE – phase 2 KCE reports 81
Figure 23. Algorithm for QI 1114 (administrative database).
All patients
N = 7074c-staging = IV
or cN=1 or cN=2or cT=3 or cT=4 ?
N = 183
False
Incidence date between 01.02.2003
and 31.12.2003 ?
N = 5601
N = 1473
True
False
TrueN = 673
N = 617
Missing
MOC within 6 months
after incidence date ?
N = 435
FalseN = 238
True
PROPORTION OF PATIENTS WITH DOCUMENTED DISTANCE FROM THE ANAL VERGE
Measurement in prospective PROCARE database (Figure 24)
In the hospital data section of the PROCARE data entry form, the variable ‘AD_V111’ is checked if the patient underwent rectal surgery. Within this group of patients, those undergoing resection (i.e. endoscopic, LE/TEMS, radical resection) are selected using variables ‘SG_V168’, ‘SG_V210’, ‘SG_V216’ and ‘SG_V234’. The distance from the anal verge is available from 3 variables: two before any treatment (‘SPR_V110’ and ‘SPR_V112’) and one at surgery (‘SG_V110’, which can have another value than the previous two variables because of neoadjuvant treatment). A fourth variable is available in the pathology section (‘PT_V105’), but this was not used because it is often based on inaccurate information. Importantly, unavailability of the distance from the anal verge in the PROCARE dataset does not necessarily mean that the distance was not documented, but that the distance was not registered.
Measurement in coupled administrative database
No administrative code exists for the (documentation of the) distance from the anal verge.
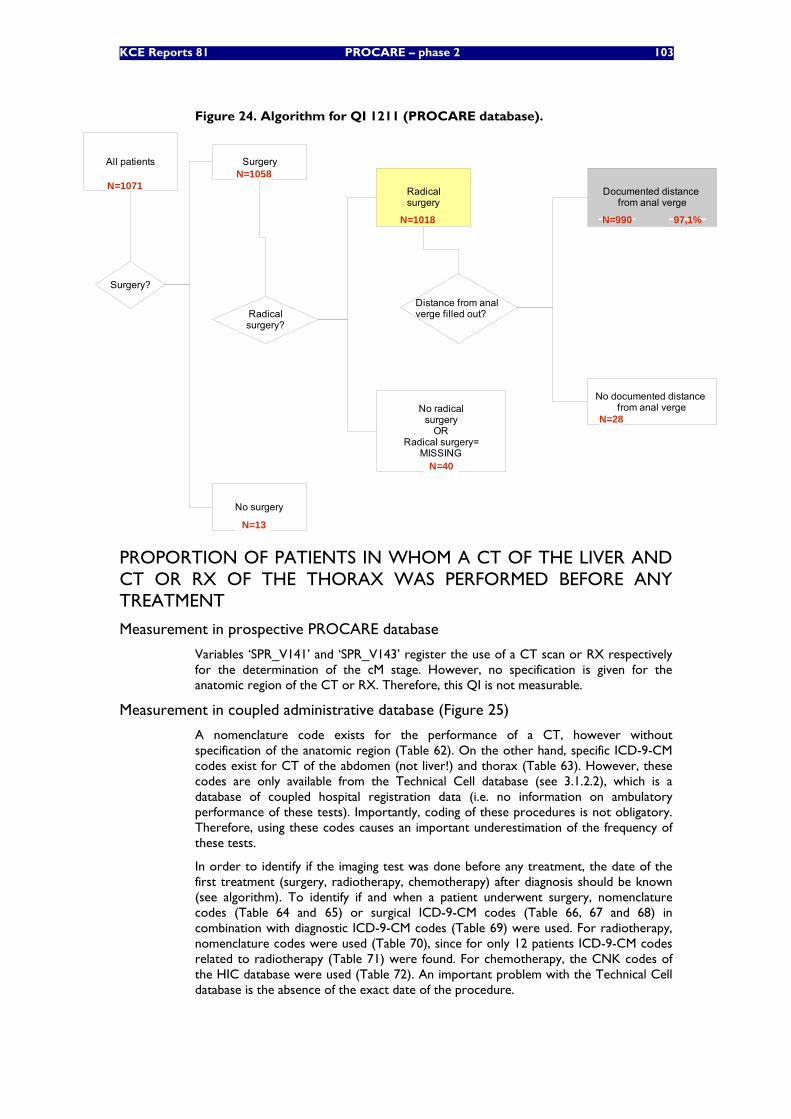
KCE Reports 81 PROCARE – phase 2 103
Figure 24. Algorithm for QI 1211 (PROCARE database).
All patients
Surgery?
Surgery
No surgery
Distance from anal verge filled out?
Documented distance from anal verge
No documented distance from anal verge
N=1071N=1058
N=13
N=990 97,1%
Radicalsurgery?
Radicalsurgery
No radicalsurgery
ORRadical surgery=
MISSINGN=40
N=28
N=1018
PROPORTION OF PATIENTS IN WHOM A CT OF THE LIVER AND CT OR RX OF THE THORAX WAS PERFORMED BEFORE ANY TREATMENT
Measurement in prospective PROCARE database
Variables ‘SPR_V141’ and ‘SPR_V143’ register the use of a CT scan or RX respectively for the determination of the cM stage. However, no specification is given for the anatomic region of the CT or RX. Therefore, this QI is not measurable.
Measurement in coupled administrative database (Figure 25)
A nomenclature code exists for the performance of a CT, however without specification of the anatomic region (Table 62). On the other hand, specific ICD-9-CM codes exist for CT of the abdomen (not liver!) and thorax (Table 63). However, these codes are only available from the Technical Cell database (see 3.1.2.2), which is a database of coupled hospital registration data (i.e. no information on ambulatory performance of these tests). Importantly, coding of these procedures is not obligatory. Therefore, using these codes causes an important underestimation of the frequency of these tests.
In order to identify if the imaging test was done before any treatment, the date of the first treatment (surgery, radiotherapy, chemotherapy) after diagnosis should be known (see algorithm). To identify if and when a patient underwent surgery, nomenclature codes (Table 64 and 65) or surgical ICD-9-CM codes (Table 66, 67 and 68) in combination with diagnostic ICD-9-CM codes (Table 69) were used. For radiotherapy, nomenclature codes were used (Table 70), since for only 12 patients ICD-9-CM codes related to radiotherapy (Table 71) were found. For chemotherapy, the CNK codes of the HIC database were used (Table 72). An important problem with the Technical Cell database is the absence of the exact date of the procedure.
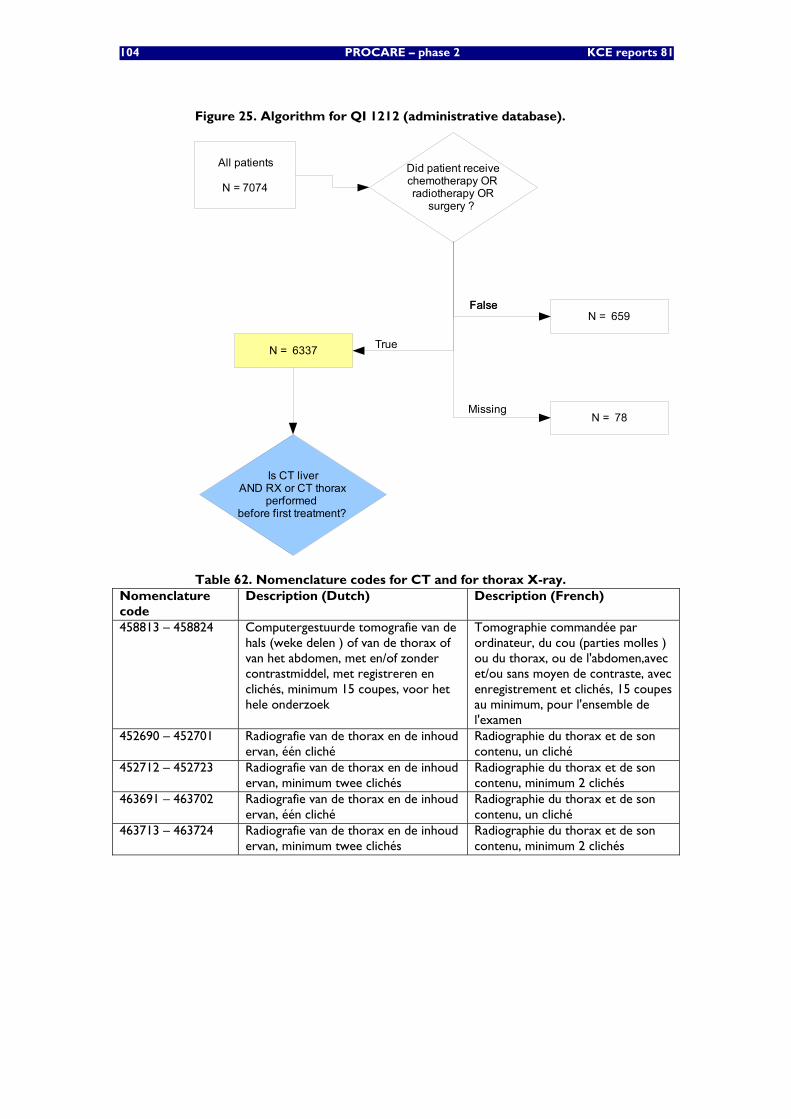
104 PROCARE – phase 2 KCE reports 81
Figure 25. Algorithm for QI 1212 (administrative database).
All patients
N = 7074
Did patient receivechemotherapy ORradiotherapy OR
surgery ?
Is CT liverAND RX or CT thorax
performed before first treatment?
FalseFalse
True
N = 659
N = 6337
N = 78Missing
Table 62. Nomenclature codes for CT and for thorax X-ray. Nomenclature code
Description (Dutch) Description (French)
458813 – 458824 Computergestuurde tomografie van de hals (weke delen ) of van de thorax of van het abdomen, met en/of zonder contrastmiddel, met registreren en clichés, minimum 15 coupes, voor het hele onderzoek
Tomographie commandée par ordinateur, du cou (parties molles ) ou du thorax, ou de l'abdomen,avec et/ou sans moyen de contraste, avec enregistrement et clichés, 15 coupes au minimum, pour l'ensemble de l'examen
452690 – 452701 Radiografie van de thorax en de inhoud ervan, één cliché
Radiographie du thorax et de son contenu, un cliché
452712 – 452723 Radiografie van de thorax en de inhoud ervan, minimum twee clichés
Radiographie du thorax et de son contenu, minimum 2 clichés
463691 – 463702 Radiografie van de thorax en de inhoud ervan, één cliché
Radiographie du thorax et de son contenu, un cliché
463713 – 463724 Radiografie van de thorax en de inhoud ervan, minimum twee clichés
Radiographie du thorax et de son contenu, minimum 2 clichés
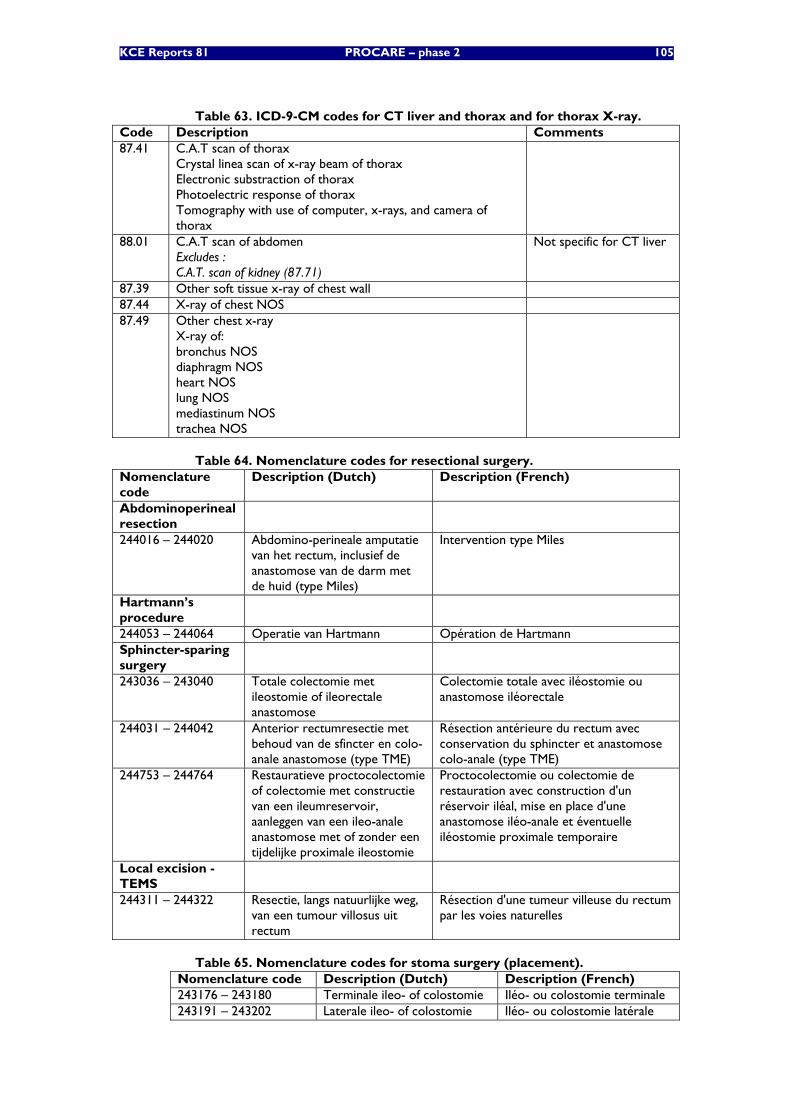
KCE Reports 81 PROCARE – phase 2 105
Table 63. ICD-9-CM codes for CT liver and thorax and for thorax X-ray. Code Description Comments 87.41 C.A.T scan of thorax
Crystal linea scan of x-ray beam of thorax Electronic substraction of thorax Photoelectric response of thorax Tomography with use of computer, x-rays, and camera of thorax
88.01 C.A.T scan of abdomen Excludes : C.A.T. scan of kidney (87.71)
Not specific for CT liver
87.39 Other soft tissue x-ray of chest wall 87.44 X-ray of chest NOS 87.49 Other chest x-ray
X-ray of: bronchus NOS diaphragm NOS heart NOS lung NOS mediastinum NOS trachea NOS
Table 64. Nomenclature codes for resectional surgery. Nomenclature code
Description (Dutch) Description (French)
Abdominoperineal resection
244016 – 244020 Abdomino-perineale amputatie van het rectum, inclusief de anastomose van de darm met de huid (type Miles)
Intervention type Miles
Hartmann’s procedure
244053 – 244064 Operatie van Hartmann Opération de Hartmann Sphincter-sparing surgery
243036 – 243040 Totale colectomie met ileostomie of ileorectale anastomose
Colectomie totale avec iléostomie ou anastomose iléorectale
244031 – 244042 Anterior rectumresectie met behoud van de sfincter en colo-anale anastomose (type TME)
Résection antérieure du rectum avec conservation du sphincter et anastomose colo-anale (type TME)
244753 – 244764 Restauratieve proctocolectomie of colectomie met constructie van een ileumreservoir, aanleggen van een ileo-anale anastomose met of zonder een tijdelijke proximale ileostomie
Proctocolectomie ou colectomie de restauration avec construction d'un réservoir iléal, mise en place d'une anastomose iléo-anale et éventuelle iléostomie proximale temporaire
Local excision - TEMS
244311 – 244322 Resectie, langs natuurlijke weg, van een tumour villosus uit rectum
Résection d'une tumeur villeuse du rectum par les voies naturelles
Table 65. Nomenclature codes for stoma surgery (placement). Nomenclature code Description (Dutch) Description (French) 243176 – 243180 Terminale ileo- of colostomie Iléo- ou colostomie terminale 243191 – 243202 Laterale ileo- of colostomie Iléo- ou colostomie latérale
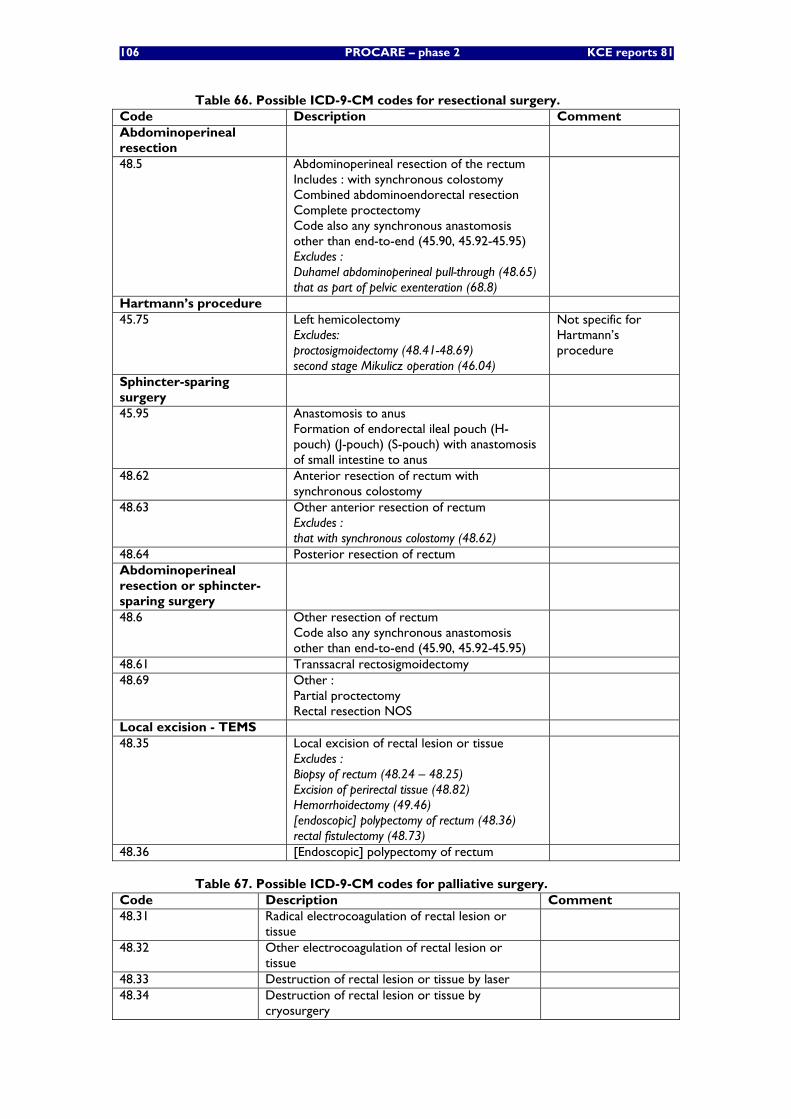
106 PROCARE – phase 2 KCE reports 81
Table 66. Possible ICD-9-CM codes for resectional surgery. Code Description Comment Abdominoperineal resection
48.5 Abdominoperineal resection of the rectum Includes : with synchronous colostomy Combined abdominoendorectal resection Complete proctectomy Code also any synchronous anastomosis other than end-to-end (45.90, 45.92-45.95) Excludes : Duhamel abdominoperineal pull-through (48.65) that as part of pelvic exenteration (68.8)
Hartmann’s procedure 45.75 Left hemicolectomy
Excludes: proctosigmoidectomy (48.41-48.69) second stage Mikulicz operation (46.04)
Not specific for Hartmann’s procedure
Sphincter-sparing surgery
45.95 Anastomosis to anus Formation of endorectal ileal pouch (H-pouch) (J-pouch) (S-pouch) with anastomosis of small intestine to anus
48.62 Anterior resection of rectum with synchronous colostomy
48.63 Other anterior resection of rectum Excludes : that with synchronous colostomy (48.62)
48.64 Posterior resection of rectum Abdominoperineal resection or sphincter-sparing surgery
48.6 Other resection of rectum Code also any synchronous anastomosis other than end-to-end (45.90, 45.92-45.95)
48.61 Transsacral rectosigmoidectomy 48.69 Other :
Partial proctectomy Rectal resection NOS
Local excision - TEMS 48.35 Local excision of rectal lesion or tissue
Excludes : Biopsy of rectum (48.24 – 48.25) Excision of perirectal tissue (48.82) Hemorrhoidectomy (49.46) [endoscopic] polypectomy of rectum (48.36) rectal fistulectomy (48.73)
48.36 [Endoscopic] polypectomy of rectum
Table 67. Possible ICD-9-CM codes for palliative surgery. Code Description Comment 48.31 Radical electrocoagulation of rectal lesion or
tissue
48.32 Other electrocoagulation of rectal lesion or tissue
48.33 Destruction of rectal lesion or tissue by laser 48.34 Destruction of rectal lesion or tissue by
cryosurgery
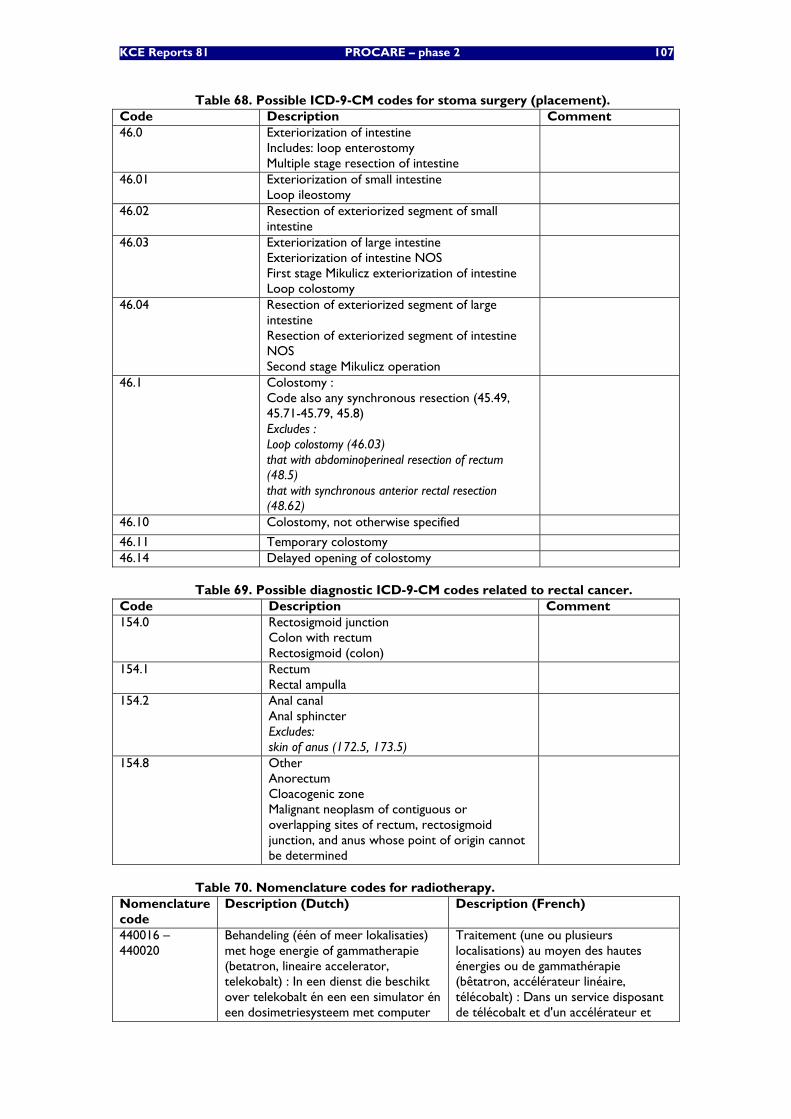
KCE Reports 81 PROCARE – phase 2 107
Table 68. Possible ICD-9-CM codes for stoma surgery (placement). Code Description Comment 46.0 Exteriorization of intestine
Includes: loop enterostomy Multiple stage resection of intestine
46.01 Exteriorization of small intestine Loop ileostomy
46.02 Resection of exteriorized segment of small intestine
46.03 Exteriorization of large intestine Exteriorization of intestine NOS First stage Mikulicz exteriorization of intestine Loop colostomy
46.04 Resection of exteriorized segment of large intestine Resection of exteriorized segment of intestine NOS Second stage Mikulicz operation
46.1 Colostomy : Code also any synchronous resection (45.49, 45.71-45.79, 45.8) Excludes : Loop colostomy (46.03) that with abdominoperineal resection of rectum (48.5) that with synchronous anterior rectal resection (48.62)
46.10 Colostomy, not otherwise specified
46.11 Temporary colostomy 46.14 Delayed opening of colostomy
Table 69. Possible diagnostic ICD-9-CM codes related to rectal cancer. Code Description Comment 154.0 Rectosigmoid junction
Colon with rectum Rectosigmoid (colon)
154.1 Rectum Rectal ampulla
154.2 Anal canal Anal sphincter Excludes: skin of anus (172.5, 173.5)
154.8 Other Anorectum Cloacogenic zone Malignant neoplasm of contiguous or overlapping sites of rectum, rectosigmoid junction, and anus whose point of origin cannot be determined
Table 70. Nomenclature codes for radiotherapy. Nomenclature code
Description (Dutch) Description (French)
440016 – 440020
Behandeling (één of meer lokalisaties) met hoge energie of gammatherapie (betatron, lineaire accelerator, telekobalt) : In een dienst die beschikt over telekobalt én een een simulator én een dosimetriesysteem met computer
Traitement (une ou plusieurs localisations) au moyen des hautes énergies ou de gammathérapie (bêtatron, accélérateur linéaire, télécobalt) : Dans un service disposant de télécobalt et d'un accélérateur et
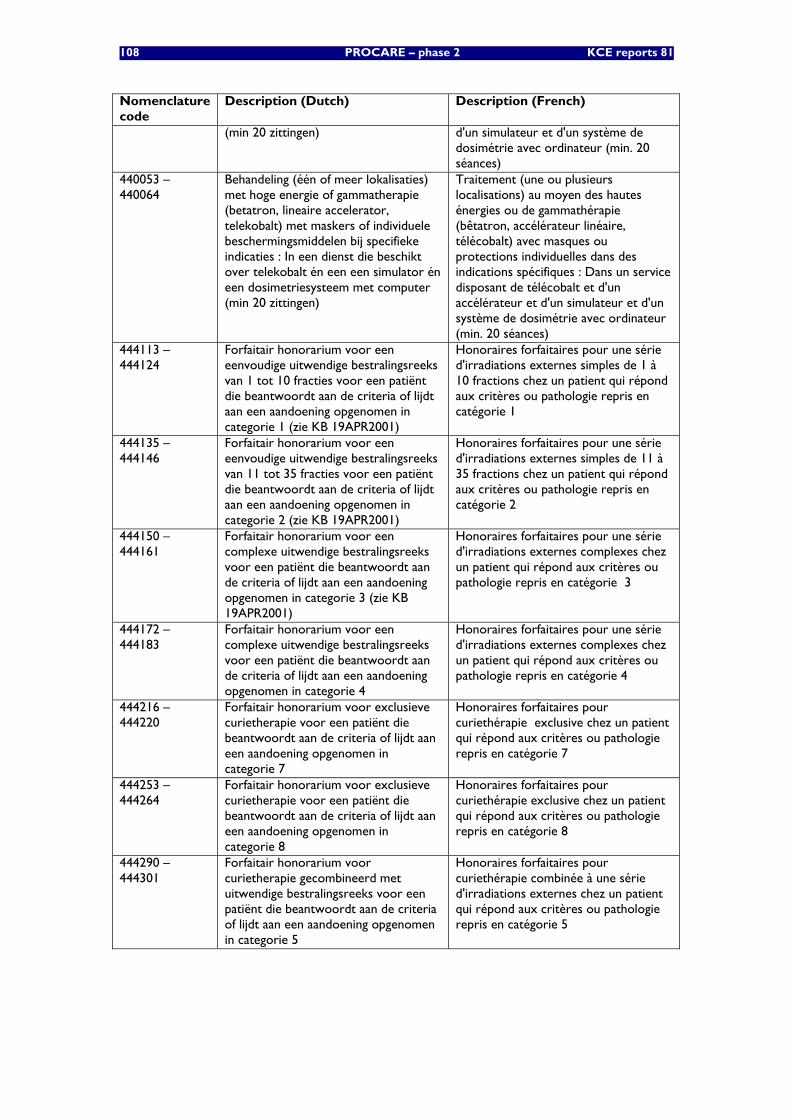
108 PROCARE – phase 2 KCE reports 81
Nomenclature code
Description (Dutch) Description (French)
(min 20 zittingen) d'un simulateur et d'un système de dosimétrie avec ordinateur (min. 20 séances)
440053 – 440064
Behandeling (één of meer lokalisaties) met hoge energie of gammatherapie (betatron, lineaire accelerator, telekobalt) met maskers of individuele beschermingsmiddelen bij specifieke indicaties : In een dienst die beschikt over telekobalt én een een simulator én een dosimetriesysteem met computer (min 20 zittingen)
Traitement (une ou plusieurs localisations) au moyen des hautes énergies ou de gammathérapie (bêtatron, accélérateur linéaire, télécobalt) avec masques ou protections individuelles dans des indications spécifiques : Dans un service disposant de télécobalt et d'un accélérateur et d'un simulateur et d'un système de dosimétrie avec ordinateur (min. 20 séances)
444113 – 444124
Forfaitair honorarium voor een eenvoudige uitwendige bestralingsreeks van 1 tot 10 fracties voor een patiënt die beantwoordt aan de criteria of lijdt aan een aandoening opgenomen in categorie 1 (zie KB 19APR2001)
Honoraires forfaitaires pour une série d'irradiations externes simples de 1 à 10 fractions chez un patient qui répond aux critères ou pathologie repris en catégorie 1
444135 – 444146
Forfaitair honorarium voor een eenvoudige uitwendige bestralingsreeks van 11 tot 35 fracties voor een patiënt die beantwoordt aan de criteria of lijdt aan een aandoening opgenomen in categorie 2 (zie KB 19APR2001)
Honoraires forfaitaires pour une série d'irradiations externes simples de 11 à 35 fractions chez un patient qui répond aux critères ou pathologie repris en catégorie 2
444150 – 444161
Forfaitair honorarium voor een complexe uitwendige bestralingsreeks voor een patiënt die beantwoordt aan de criteria of lijdt aan een aandoening opgenomen in categorie 3 (zie KB 19APR2001)
Honoraires forfaitaires pour une série d'irradiations externes complexes chez un patient qui répond aux critères ou pathologie repris en catégorie 3
444172 – 444183
Forfaitair honorarium voor een complexe uitwendige bestralingsreeks voor een patiënt die beantwoordt aan de criteria of lijdt aan een aandoening opgenomen in categorie 4
Honoraires forfaitaires pour une série d'irradiations externes complexes chez un patient qui répond aux critères ou pathologie repris en catégorie 4
444216 – 444220
Forfaitair honorarium voor exclusieve curietherapie voor een patiënt die beantwoordt aan de criteria of lijdt aan een aandoening opgenomen in categorie 7
Honoraires forfaitaires pour curiethérapie exclusive chez un patient qui répond aux critères ou pathologie repris en catégorie 7
444253 – 444264
Forfaitair honorarium voor exclusieve curietherapie voor een patiënt die beantwoordt aan de criteria of lijdt aan een aandoening opgenomen in categorie 8
Honoraires forfaitaires pour curiethérapie exclusive chez un patient qui répond aux critères ou pathologie repris en catégorie 8
444290 – 444301
Forfaitair honorarium voor curietherapie gecombineerd met uitwendige bestralingsreeks voor een patiënt die beantwoordt aan de criteria of lijdt aan een aandoening opgenomen in categorie 5
Honoraires forfaitaires pour curiethérapie combinée à une série d'irradiations externes chez un patient qui répond aux critères ou pathologie repris en catégorie 5
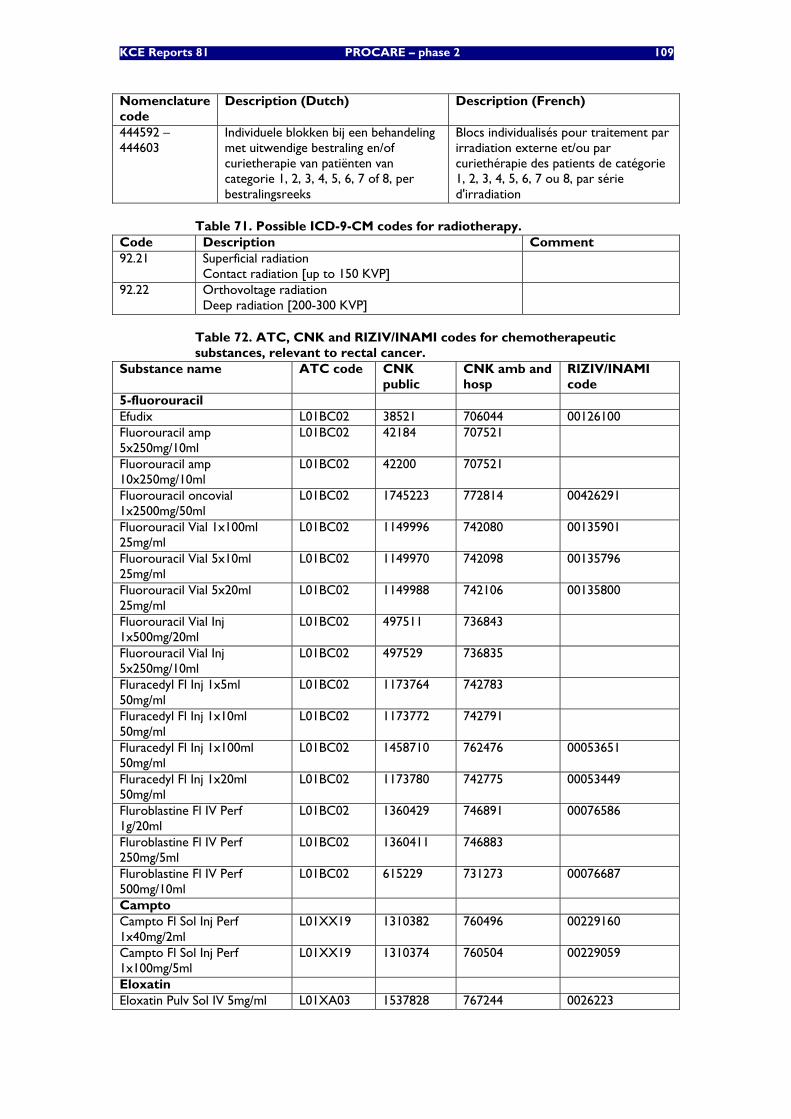
KCE Reports 81 PROCARE – phase 2 109
Nomenclature code
Description (Dutch) Description (French)
444592 – 444603
Individuele blokken bij een behandeling met uitwendige bestraling en/of curietherapie van patiënten van categorie 1, 2, 3, 4, 5, 6, 7 of 8, per bestralingsreeks
Blocs individualisés pour traitement par irradiation externe et/ou par curiethérapie des patients de catégorie 1, 2, 3, 4, 5, 6, 7 ou 8, par série d'irradiation
Table 71. Possible ICD-9-CM codes for radiotherapy. Code Description Comment 92.21 Superficial radiation
Contact radiation [up to 150 KVP]
92.22 Orthovoltage radiation Deep radiation [200-300 KVP]
Table 72. ATC, CNK and RIZIV/INAMI codes for chemotherapeutic substances, relevant to rectal cancer.
Substance name ATC code CNK public
CNK amb and hosp
RIZIV/INAMI code
5-fluorouracil Efudix L01BC02 38521 706044 00126100 Fluorouracil amp 5x250mg/10ml
L01BC02 42184 707521
Fluorouracil amp 10x250mg/10ml
L01BC02 42200 707521
Fluorouracil oncovial 1x2500mg/50ml
L01BC02 1745223 772814 00426291
Fluorouracil Vial 1x100ml 25mg/ml
L01BC02 1149996 742080 00135901
Fluorouracil Vial 5x10ml 25mg/ml
L01BC02 1149970 742098 00135796
Fluorouracil Vial 5x20ml 25mg/ml
L01BC02 1149988 742106 00135800
Fluorouracil Vial Inj 1x500mg/20ml
L01BC02 497511 736843
Fluorouracil Vial Inj 5x250mg/10ml
L01BC02 497529 736835
Fluracedyl Fl Inj 1x5ml 50mg/ml
L01BC02 1173764 742783
Fluracedyl Fl Inj 1x10ml 50mg/ml
L01BC02 1173772 742791
Fluracedyl Fl Inj 1x100ml 50mg/ml
L01BC02 1458710 762476 00053651
Fluracedyl Fl Inj 1x20ml 50mg/ml
L01BC02 1173780 742775 00053449
Fluroblastine Fl IV Perf 1g/20ml
L01BC02 1360429 746891 00076586
Fluroblastine Fl IV Perf 250mg/5ml
L01BC02 1360411 746883
Fluroblastine Fl IV Perf 500mg/10ml
L01BC02 615229 731273 00076687
Campto Campto Fl Sol Inj Perf 1x40mg/2ml
L01XX19 1310382 760496 00229160
Campto Fl Sol Inj Perf 1x100mg/5ml
L01XX19 1310374 760504 00229059
Eloxatin Eloxatin Pulv Sol IV 5mg/ml L01XA03 1537828 767244 0026223
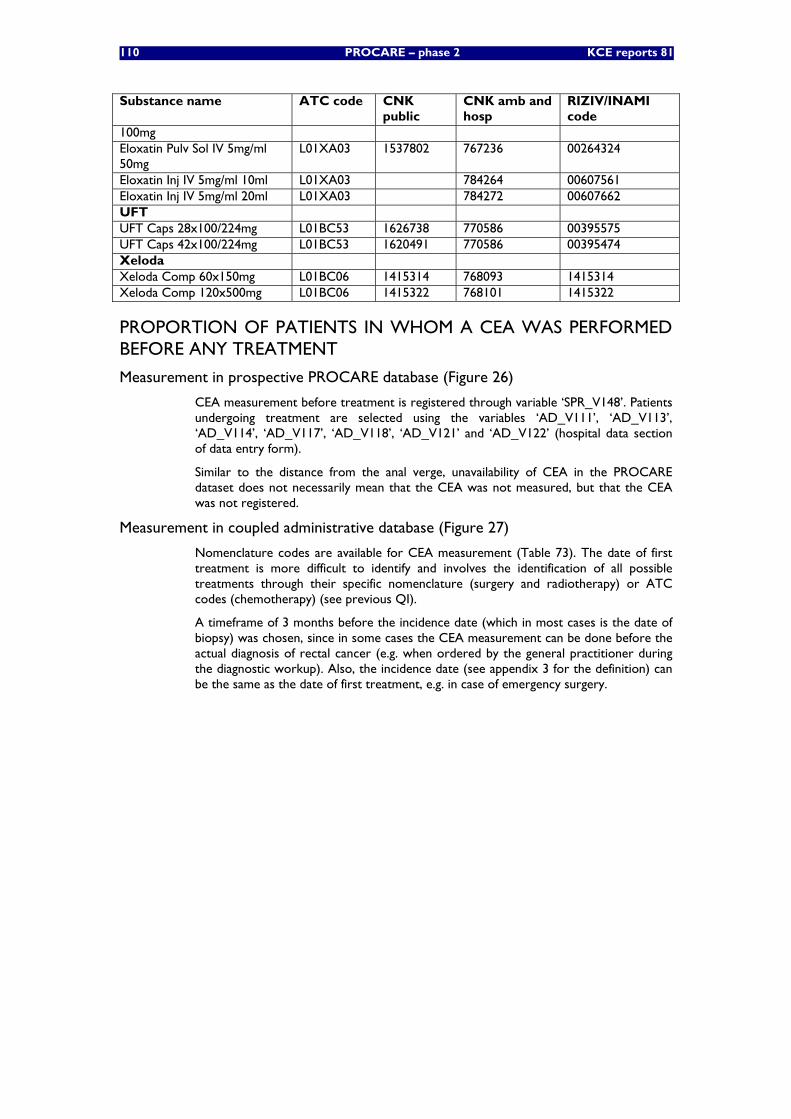
110 PROCARE – phase 2 KCE reports 81
Substance name ATC code CNK public
CNK amb and hosp
RIZIV/INAMI code
100mg Eloxatin Pulv Sol IV 5mg/ml 50mg
L01XA03 1537802 767236 00264324
Eloxatin Inj IV 5mg/ml 10ml L01XA03 784264 00607561 Eloxatin Inj IV 5mg/ml 20ml L01XA03 784272 00607662 UFT UFT Caps 28x100/224mg L01BC53 1626738 770586 00395575 UFT Caps 42x100/224mg L01BC53 1620491 770586 00395474 Xeloda Xeloda Comp 60x150mg L01BC06 1415314 768093 1415314 Xeloda Comp 120x500mg L01BC06 1415322 768101 1415322
PROPORTION OF PATIENTS IN WHOM A CEA WAS PERFORMED BEFORE ANY TREATMENT
Measurement in prospective PROCARE database (Figure 26)
CEA measurement before treatment is registered through variable ‘SPR_V148’. Patients undergoing treatment are selected using the variables ‘AD_V111’, ‘AD_V113’, ‘AD_V114’, ‘AD_V117’, ‘AD_V118’, ‘AD_V121’ and ‘AD_V122’ (hospital data section of data entry form).
Similar to the distance from the anal verge, unavailability of CEA in the PROCARE dataset does not necessarily mean that the CEA was not measured, but that the CEA was not registered.
Measurement in coupled administrative database (Figure 27)
Nomenclature codes are available for CEA measurement (Table 73). The date of first treatment is more difficult to identify and involves the identification of all possible treatments through their specific nomenclature (surgery and radiotherapy) or ATC codes (chemotherapy) (see previous QI).
A timeframe of 3 months before the incidence date (which in most cases is the date of biopsy) was chosen, since in some cases the CEA measurement can be done before the actual diagnosis of rectal cancer (e.g. when ordered by the general practitioner during the diagnostic workup). Also, the incidence date (see appendix 3 for the definition) can be the same as the date of first treatment, e.g. in case of emergency surgery.
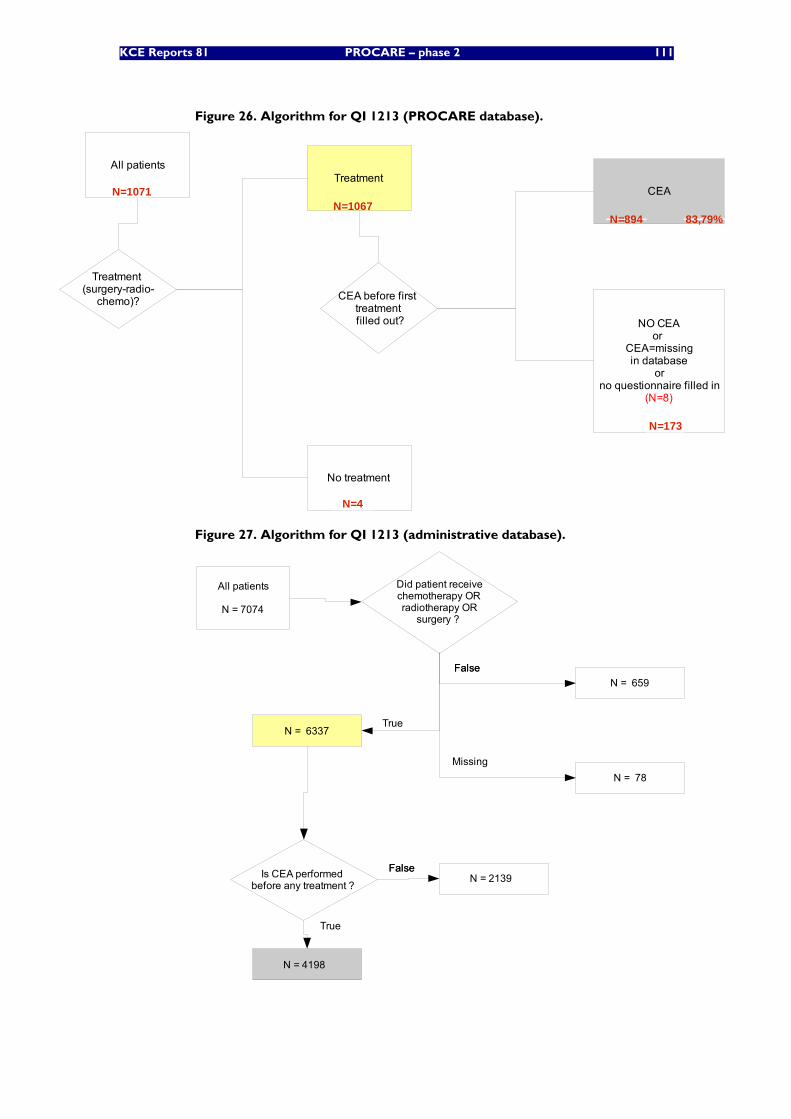
KCE Reports 81 PROCARE – phase 2 111
Figure 26. Algorithm for QI 1213 (PROCARE database).
All patients
Treatment (surgery-radio-
chemo)?
Treatment
No treatment
CEA
CEA before first treatment filled out? NO CEA
or CEA=missingin database
orno questionnaire filled in
(N=8)
N=1071N=1067
N=4
N=894
N=173
83,79%
Figure 27. Algorithm for QI 1213 (administrative database).
All patients
N = 7074
Is CEA performed before any treatment ?
Did patient receivechemotherapy ORradiotherapy OR
surgery ?
FalseFalse
True
N = 659
N = 6337
N = 78Missing
FalseFalseN = 2139
N = 4198
True
112 PROCARE – phase 2 KCE reports 81
Table 73. Nomenclature codes for CEA measurement. Nomenclature code
Description (Dutch) Description (French)
548332 – 548343 Doseren van C.E.A. met niet isotopen-methode (Maximum 1) (Cumulregel 201, 317) (Diagnoseregel 46) Klasse 15
Dosage de C.E.A. par méthode non-isotopique (Maximum 1) (Règle de cumul 201, 317) (Règle diagnostique 46) Classe 15
436192 – 436203 Doseren van C E A (Maximum 1) (Cumulregel 201, 317) (Diagnoseregel 46) Klasse 15
Dosage de C E A (Maximum 1) (Règle de cumul 201, 317) (Règle diagnostique 46) Classe 15
PROPORTION OF PATIENTS UNDERGOING PREOPERATIVE COMPLETE LARGE BOWEL-IMAGING
Measurement in prospective PROCARE database (Figure 28)
Again, variable ‘AD_V111’ is used to select patients undergoing surgery. Variable ‘SG_V109’ enables the selection of elective/scheduled vs. urgent/emergency surgery. In the pre-treatment section of the data entry, total colonoscopy is registered through the variable ‘SPR_V149’. The default value of this variable is ‘0’ (i.e. no colonoscopy; however, missing values also received a value ‘0’), making it impossible to distinguish non-performance of colonoscopy from missing values. Also in the pre-treatment section, complete double contrast barium enema (DCBE) is registered through variable ‘SPR_V171’.
If a patient did not undergo colonoscopy, the reason is registered through variables SPR_V154 – V159.
Measurement in coupled administrative database
Nomenclature codes are available for both total colonoscopy (codes for left colonoscopy were not included) and DCBE (Table 74). Above this, ICD-9-CM codes are available for both procedures (ICD-9-CM code 45.24 is for a left colonoscopy, and was not used), although the code of Barium Swallow is unspecific (Table 75). Furthermore, coding of DCBE in ICD-9-CM is not obligatory. The correspondence of the nomenclature and ICD-9-CM codes for colonoscopy for the 4556 patients that have both data is shown in Table 76.
Since complete large bowel-imaging can be done during the diagnostic work-up before the incidence date, a timeframe of 1 month before the incidence date was chosen. The surgery date was identified through specific nomenclature codes and ICD-9-CM codes for rectal surgery (Table 64, 65, 66, 67 and 68). The elective character of surgery was identified through nomenclature codes of urgency (exclusion of patients with these codes) (Table 77). However, these codes can only be used for interventions between 21 pm and 8 am or during the weekend. Urgent interventions between 8 am and 21 pm on working days are not captured with these codes. Apart from these codes, the MCD database also allows differentiation between urgent (code 1, within 6 hours after diagnosis) or elective (code 2, after 6 hours after diagnosis).
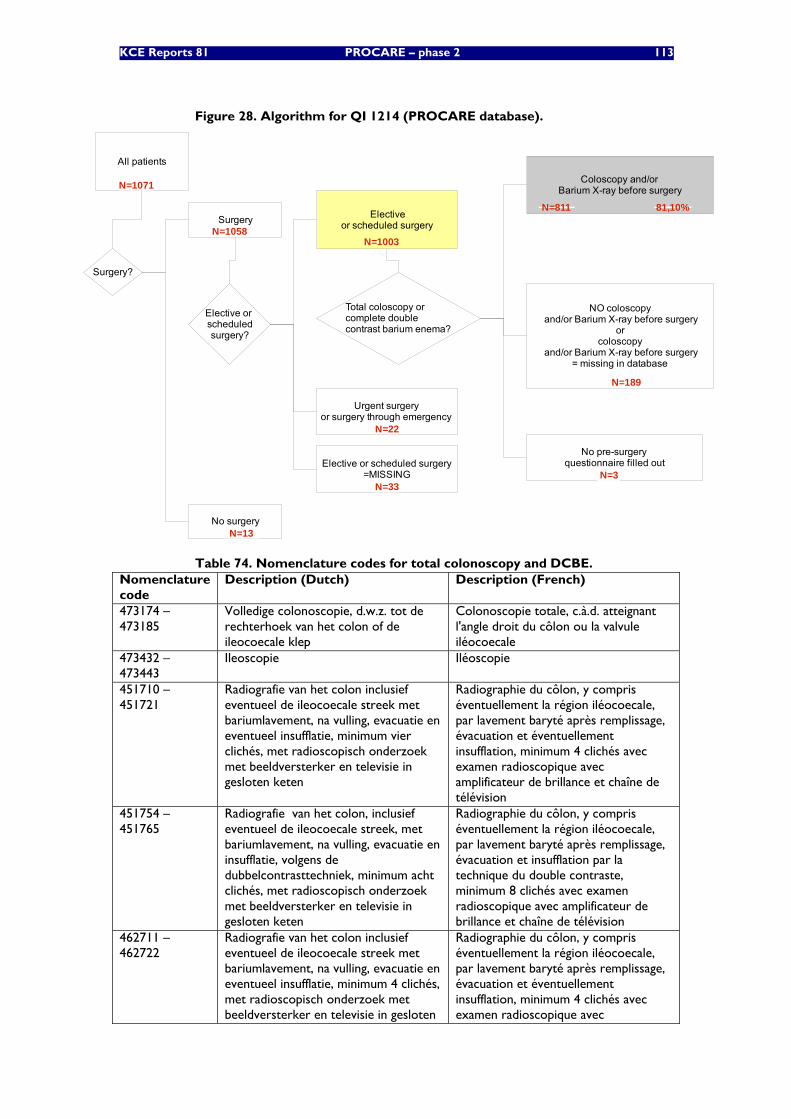
KCE Reports 81 PROCARE – phase 2 113
Figure 28. Algorithm for QI 1214 (PROCARE database).
All patients
Surgery
No surgery
Total coloscopy or complete double contrast barium enema?
Coloscopy and/or Barium X-ray before surgery
NO coloscopy and/or Barium X-ray before surgery
orcoloscopy
and/or Barium X-ray before surgery= missing in database
Surgery?
N=1071
N=1058
N=13
N=811
N=189
81,10%
Elective or scheduledsurgery?
Electiveor scheduled surgery
Urgent surgeryor surgery through emergency
Elective or scheduled surgery=MISSING
N=1003
N=22
N=33
No pre-surgeryquestionnaire filled out
N=3
Table 74. Nomenclature codes for total colonoscopy and DCBE. Nomenclature code
Description (Dutch) Description (French)
473174 – 473185
Volledige colonoscopie, d.w.z. tot de rechterhoek van het colon of de ileocoecale klep
Colonoscopie totale, c.à.d. atteignant l'angle droit du côlon ou la valvule iléocoecale
473432 – 473443
Ileoscopie Iléoscopie
451710 – 451721
Radiografie van het colon inclusief eventueel de ileocoecale streek met bariumlavement, na vulling, evacuatie en eventueel insufflatie, minimum vier clichés, met radioscopisch onderzoek met beeldversterker en televisie in gesloten keten
Radiographie du côlon, y compris éventuellement la région iléocoecale, par lavement baryté après remplissage, évacuation et éventuellement insufflation, minimum 4 clichés avec examen radioscopique avec amplificateur de brillance et chaîne de télévision
451754 – 451765
Radiografie van het colon, inclusief eventueel de ileocoecale streek, met bariumlavement, na vulling, evacuatie en insufflatie, volgens de dubbelcontrasttechniek, minimum acht clichés, met radioscopisch onderzoek met beeldversterker en televisie in gesloten keten
Radiographie du côlon, y compris éventuellement la région iléocoecale, par lavement baryté après remplissage, évacuation et insufflation par la technique du double contraste, minimum 8 clichés avec examen radioscopique avec amplificateur de brillance et chaîne de télévision
462711 – 462722
Radiografie van het colon inclusief eventueel de ileocoecale streek met bariumlavement, na vulling, evacuatie en eventueel insufflatie, minimum 4 clichés, met radioscopisch onderzoek met beeldversterker en televisie in gesloten
Radiographie du côlon, y compris éventuellement la région iléocoecale, par lavement baryté après remplissage, évacuation et éventuellement insufflation, minimum 4 clichés avec examen radioscopique avec
114 PROCARE – phase 2 KCE reports 81
Nomenclature code
Description (Dutch) Description (French)
keten amplificateur de brillance et chaîne de télévision
462755 – 462766
Radiografie van het colon, inclusief eventueel de ileocoecale streek, met bariumlavement, na vulling, evacuatie en insufflatie, volgens de dubbelcontrasttechniek, minimum 8 clichés, met radioscopisch onderzoek met beeldversterker en televisie in gesloten keten
Radiographie du côlon, y compris éventuellement la région iléocoecale, par lavement baryté après remplissage, évacuation et insufflation, par la technique du double contraste, minimum 8 clichés avec examen radioscopique avec amplificateur de brillance et chaîne de télévision
Table 75. ICD-9-CM codes for colonoscopy and DCBE. Code Description Comments 45.23 Flexible fiberoptic colonoscopy
Excludes : Endoscopy of large intestine through artificial stoma (45.22) Flexible sigmoidoscopy (45.24) Rigid proctosigmoidoscopy (48.23) Transabdominal endoscopy of large intestine (45.21)
Not specific for complete colonoscopy
87.61 Diagnostic radiology : Other X-ray of digestive system : Barium swallow
Not specific for DCBE
Table 76. Correspondance of nomenclature* and ICD-9-CM$ codes for colonoscopy. ICD-9-CM Yes No Total Nomenclature Yes 235 1355 1590 No 176 2790 2966 Total 411 4145 4556
² 473174 – 473185 and 473432 – 473443; $ 45.23
Table 77. Nomenclature codes for urgent interventions between 21 pm and 8 am or during the weekend.
Nomenclature code
Description (Dutch) Description (French)
599513 – 599524
Bijkomend honorarium voor de 's nachts, tijdens het weekend of op een feestdag verrichte dringende verstrekkingen, met uitzondering van de in § 8 vermelde verstrekkingen : Voor de verstrekkingen waarvan de betrekkelijke waarde hoger is dan K 300 of N 500 of I 500
Supplément d'honoraires pour les prestations urgentes effectuées pendant la nuit ou le week-end ou durant un jour férié, à l'exception des prestations citées au § 8 : Pour les prestations dont la valeur relative est supérieure à K 300 ou N 500 ou I 500
599535 – 599546
Bijkomend honorarium voor de 's nachts, tijdens het week of op een feestdag verrichte dringende verstrekkingen, met uitzondering van de in § 8 vermelde verstrekkingen : Voor de verstrekkingen waarvan de betrekkelijke waarde hoger is dan K 180 of N 300 of I 300 en gelijk aan of lager dan K 300 of N 500 of I 500
Supplément d'honoraires pour les prestations urgentes effectuées pendant la nuit ou le week-end ou durant un jour férié, à l'exception des prestations citées au § 8 : Pour les prestations dont la valeur relative est supérieure à K 180 ou N 300 ou I 300 et égale ou inférieure à K 300 ou N 500 ou I 500
599550 – 599561
Bijkomend honorarium voor de 's nachts, tijdens het weekend of op een
Supplément d'honoraires pour les prestations urgentes effectuées pendant
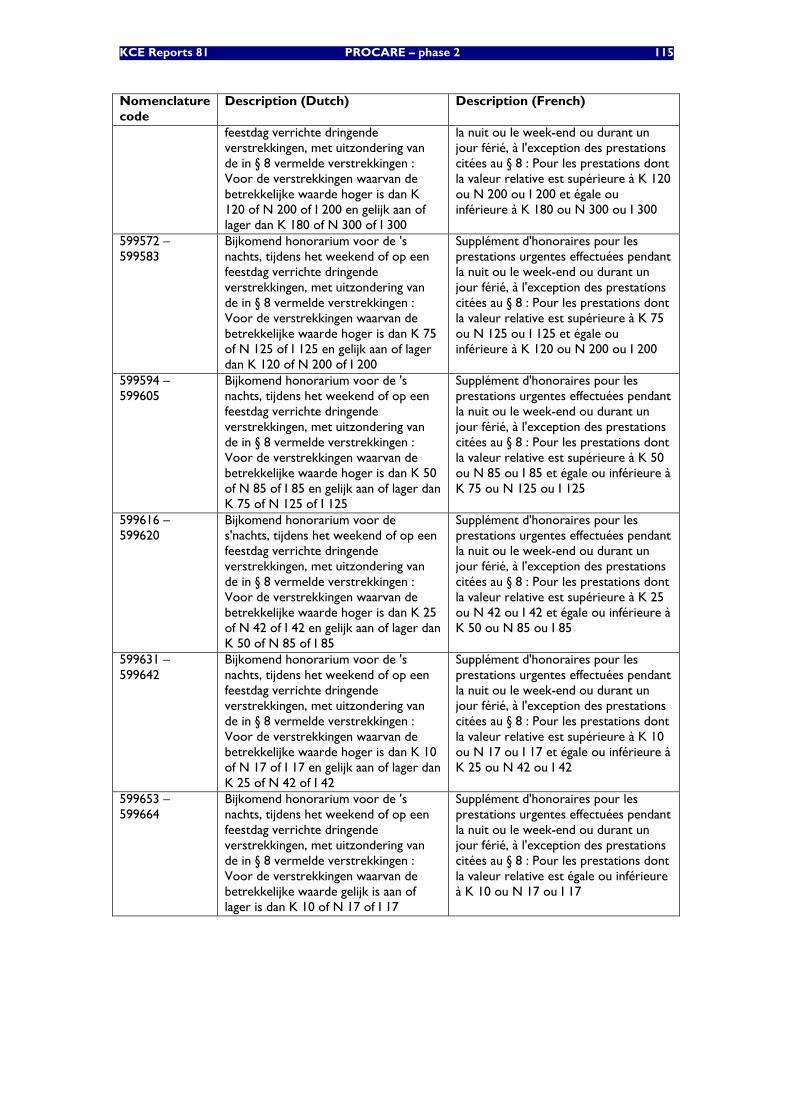
KCE Reports 81 PROCARE – phase 2 115
Nomenclature code
Description (Dutch) Description (French)
feestdag verrichte dringende verstrekkingen, met uitzondering van de in § 8 vermelde verstrekkingen : Voor de verstrekkingen waarvan de betrekkelijke waarde hoger is dan K 120 of N 200 of I 200 en gelijk aan of lager dan K 180 of N 300 of I 300
la nuit ou le week-end ou durant un jour férié, à l'exception des prestations citées au § 8 : Pour les prestations dont la valeur relative est supérieure à K 120 ou N 200 ou I 200 et égale ou inférieure à K 180 ou N 300 ou I 300
599572 – 599583
Bijkomend honorarium voor de 's nachts, tijdens het weekend of op een feestdag verrichte dringende verstrekkingen, met uitzondering van de in § 8 vermelde verstrekkingen : Voor de verstrekkingen waarvan de betrekkelijke waarde hoger is dan K 75 of N 125 of I 125 en gelijk aan of lager dan K 120 of N 200 of I 200
Supplément d'honoraires pour les prestations urgentes effectuées pendant la nuit ou le week-end ou durant un jour férié, à l'exception des prestations citées au § 8 : Pour les prestations dont la valeur relative est supérieure à K 75 ou N 125 ou I 125 et égale ou inférieure à K 120 ou N 200 ou I 200
599594 – 599605
Bijkomend honorarium voor de 's nachts, tijdens het weekend of op een feestdag verrichte dringende verstrekkingen, met uitzondering van de in § 8 vermelde verstrekkingen : Voor de verstrekkingen waarvan de betrekkelijke waarde hoger is dan K 50 of N 85 of I 85 en gelijk aan of lager dan K 75 of N 125 of I 125
Supplément d'honoraires pour les prestations urgentes effectuées pendant la nuit ou le week-end ou durant un jour férié, à l'exception des prestations citées au § 8 : Pour les prestations dont la valeur relative est supérieure à K 50 ou N 85 ou I 85 et égale ou inférieure à K 75 ou N 125 ou I 125
599616 – 599620
Bijkomend honorarium voor de s'nachts, tijdens het weekend of op een feestdag verrichte dringende verstrekkingen, met uitzondering van de in § 8 vermelde verstrekkingen : Voor de verstrekkingen waarvan de betrekkelijke waarde hoger is dan K 25 of N 42 of I 42 en gelijk aan of lager dan K 50 of N 85 of I 85
Supplément d'honoraires pour les prestations urgentes effectuées pendant la nuit ou le week-end ou durant un jour férié, à l'exception des prestations citées au § 8 : Pour les prestations dont la valeur relative est supérieure à K 25 ou N 42 ou I 42 et égale ou inférieure à K 50 ou N 85 ou I 85
599631 – 599642
Bijkomend honorarium voor de 's nachts, tijdens het weekend of op een feestdag verrichte dringende verstrekkingen, met uitzondering van de in § 8 vermelde verstrekkingen : Voor de verstrekkingen waarvan de betrekkelijke waarde hoger is dan K 10 of N 17 of I 17 en gelijk aan of lager dan K 25 of N 42 of I 42
Supplément d'honoraires pour les prestations urgentes effectuées pendant la nuit ou le week-end ou durant un jour férié, à l'exception des prestations citées au § 8 : Pour les prestations dont la valeur relative est supérieure à K 10 ou N 17 ou I 17 et égale ou inférieure à K 25 ou N 42 ou I 42
599653 – 599664
Bijkomend honorarium voor de 's nachts, tijdens het weekend of op een feestdag verrichte dringende verstrekkingen, met uitzondering van de in § 8 vermelde verstrekkingen : Voor de verstrekkingen waarvan de betrekkelijke waarde gelijk is aan of lager is dan K 10 of N 17 of I 17
Supplément d'honoraires pour les prestations urgentes effectuées pendant la nuit ou le week-end ou durant un jour férié, à l'exception des prestations citées au § 8 : Pour les prestations dont la valeur relative est égale ou inférieure à K 10 ou N 17 ou I 17
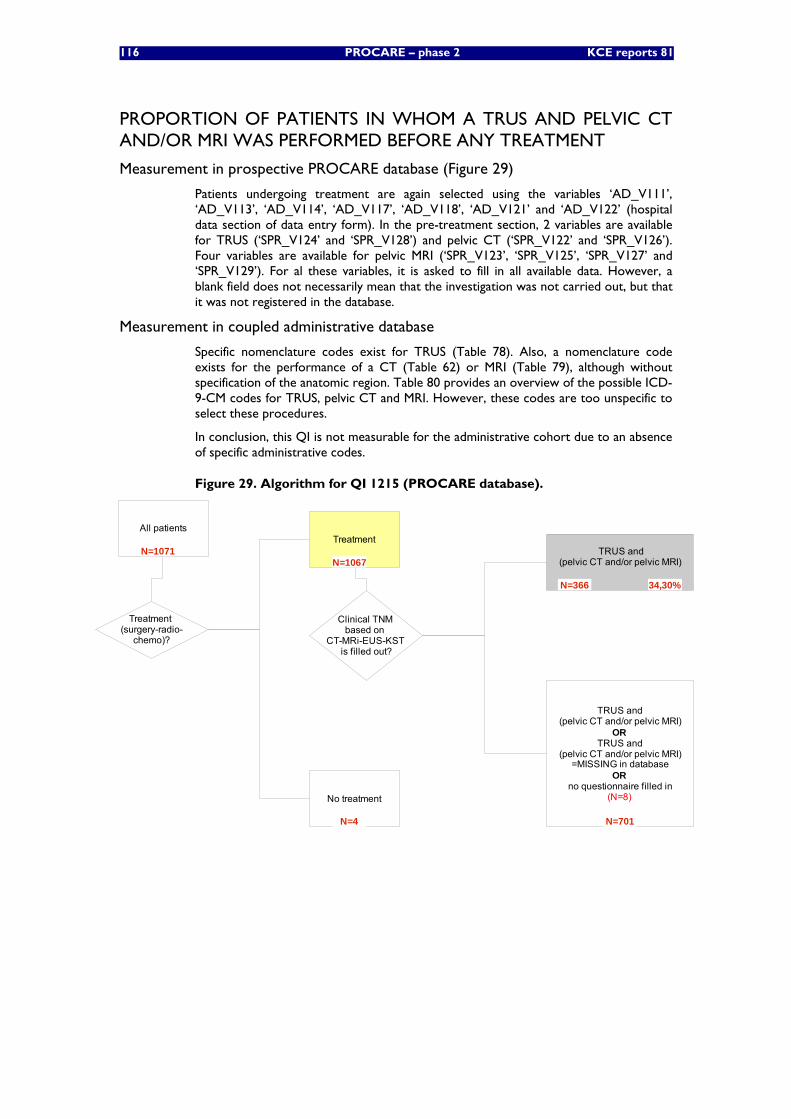
116 PROCARE – phase 2 KCE reports 81
PROPORTION OF PATIENTS IN WHOM A TRUS AND PELVIC CT AND/OR MRI WAS PERFORMED BEFORE ANY TREATMENT
Measurement in prospective PROCARE database (Figure 29)
Patients undergoing treatment are again selected using the variables ‘AD_V111’, ‘AD_V113’, ‘AD_V114’, ‘AD_V117’, ‘AD_V118’, ‘AD_V121’ and ‘AD_V122’ (hospital data section of data entry form). In the pre-treatment section, 2 variables are available for TRUS (‘SPR_V124’ and ‘SPR_V128’) and pelvic CT (‘SPR_V122’ and ‘SPR_V126’). Four variables are available for pelvic MRI (‘SPR_V123’, ‘SPR_V125’, ‘SPR_V127’ and ‘SPR_V129’). For al these variables, it is asked to fill in all available data. However, a blank field does not necessarily mean that the investigation was not carried out, but that it was not registered in the database.
Measurement in coupled administrative database
Specific nomenclature codes exist for TRUS (Table 78). Also, a nomenclature code exists for the performance of a CT (Table 62) or MRI (Table 79), although without specification of the anatomic region. Table 80 provides an overview of the possible ICD-9-CM codes for TRUS, pelvic CT and MRI. However, these codes are too unspecific to select these procedures.
In conclusion, this QI is not measurable for the administrative cohort due to an absence of specific administrative codes.
Figure 29. Algorithm for QI 1215 (PROCARE database).
All patientsTreatment
No treatment
Clinical TNM based on
CT-MRi-EUS-KST is filled out?
TRUS and (pelvic CT and/or pelvic MRI)
TRUS and (pelvic CT and/or pelvic MRI)
ORTRUS and
(pelvic CT and/or pelvic MRI) =MISSING in database
ORno questionnaire filled in
(N=8)
Treatment (surgery-radio-
chemo)?
N=1071N=1067
N=4
N=366
N=701
34,30%
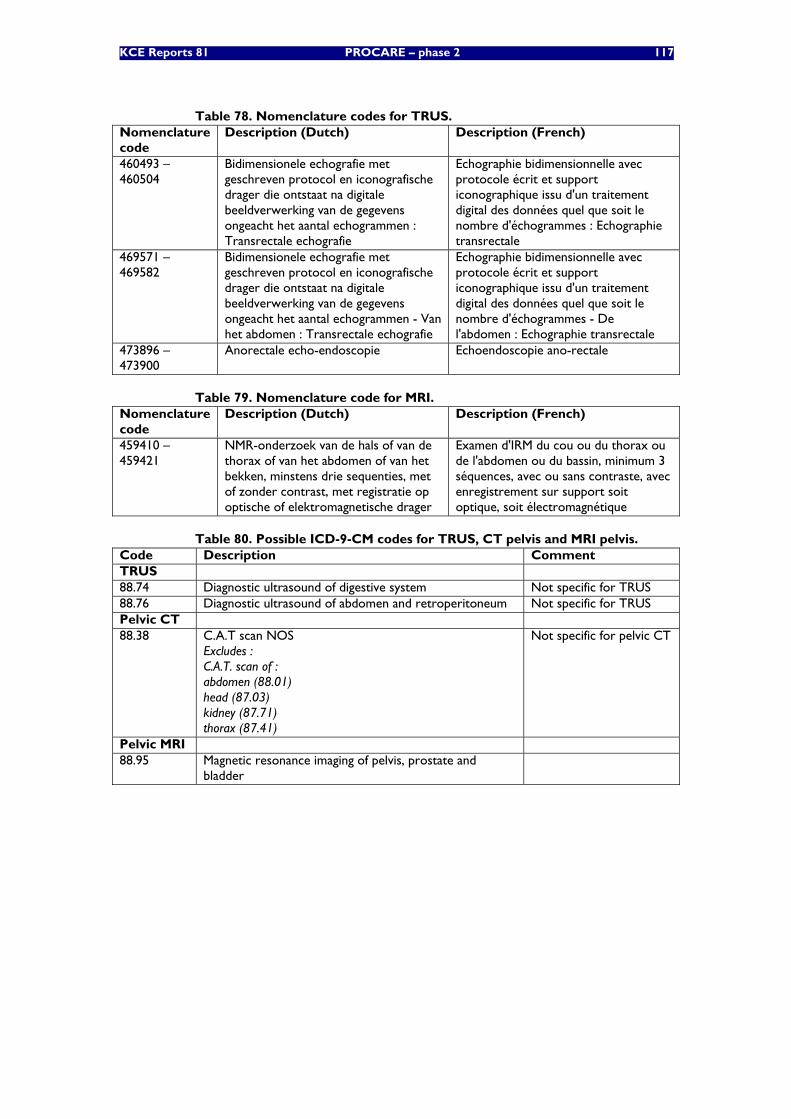
KCE Reports 81 PROCARE – phase 2 117
Table 78. Nomenclature codes for TRUS. Nomenclature code
Description (Dutch) Description (French)
460493 – 460504
Bidimensionele echografie met geschreven protocol en iconografische drager die ontstaat na digitale beeldverwerking van de gegevens ongeacht het aantal echogrammen : Transrectale echografie
Echographie bidimensionnelle avec protocole écrit et support iconographique issu d'un traitement digital des données quel que soit le nombre d'échogrammes : Echographie transrectale
469571 – 469582
Bidimensionele echografie met geschreven protocol en iconografische drager die ontstaat na digitale beeldverwerking van de gegevens ongeacht het aantal echogrammen - Van het abdomen : Transrectale echografie
Echographie bidimensionnelle avec protocole écrit et support iconographique issu d'un traitement digital des données quel que soit le nombre d'échogrammes - De l'abdomen : Echographie transrectale
473896 – 473900
Anorectale echo-endoscopie Echoendoscopie ano-rectale
Table 79. Nomenclature code for MRI. Nomenclature code
Description (Dutch) Description (French)
459410 – 459421
NMR-onderzoek van de hals of van de thorax of van het abdomen of van het bekken, minstens drie sequenties, met of zonder contrast, met registratie op optische of elektromagnetische drager
Examen d'IRM du cou ou du thorax ou de l'abdomen ou du bassin, minimum 3 séquences, avec ou sans contraste, avec enregistrement sur support soit optique, soit électromagnétique
Table 80. Possible ICD-9-CM codes for TRUS, CT pelvis and MRI pelvis. Code Description Comment TRUS 88.74 Diagnostic ultrasound of digestive system Not specific for TRUS 88.76 Diagnostic ultrasound of abdomen and retroperitoneum Not specific for TRUS Pelvic CT 88.38 C.A.T scan NOS
Excludes : C.A.T. scan of : abdomen (88.01) head (87.03) kidney (87.71) thorax (87.41)
Not specific for pelvic CT
Pelvic MRI 88.95 Magnetic resonance imaging of pelvis, prostate and
bladder
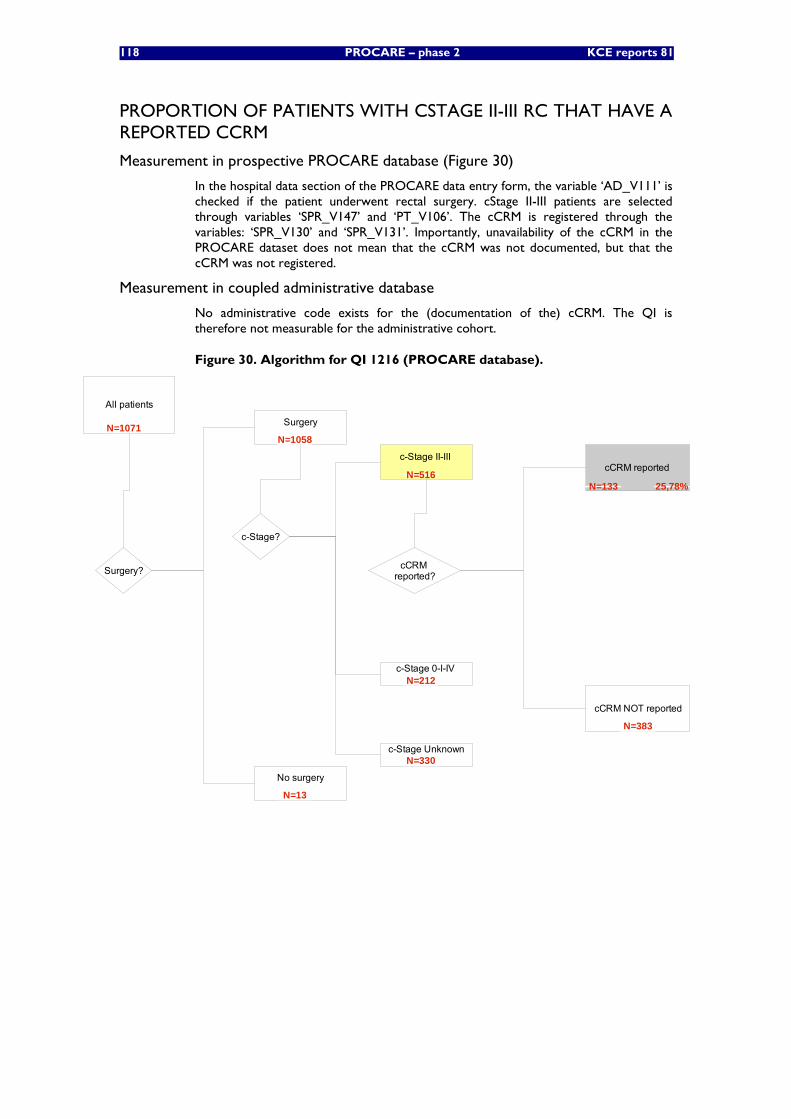
118 PROCARE – phase 2 KCE reports 81
PROPORTION OF PATIENTS WITH CSTAGE II-III RC THAT HAVE A REPORTED CCRM
Measurement in prospective PROCARE database (Figure 30)
In the hospital data section of the PROCARE data entry form, the variable ‘AD_V111’ is checked if the patient underwent rectal surgery. cStage II-III patients are selected through variables ‘SPR_V147’ and ‘PT_V106’. The cCRM is registered through the variables: ‘SPR_V130’ and ‘SPR_V131’. Importantly, unavailability of the cCRM in the PROCARE dataset does not mean that the cCRM was not documented, but that the cCRM was not registered.
Measurement in coupled administrative database
No administrative code exists for the (documentation of the) cCRM. The QI is therefore not measurable for the administrative cohort.
Figure 30. Algorithm for QI 1216 (PROCARE database).
All patients
cCRM reported?
cCRM reported
cCRM NOT reported
Surgery?
Surgery
No surgery
c-Stage?
c-Stage II-III
c-Stage 0-I-IV
c-Stage Unknown
N=1071N=1058
N=13
N=516
N=212
N=330
N=133
N=383
25,78%
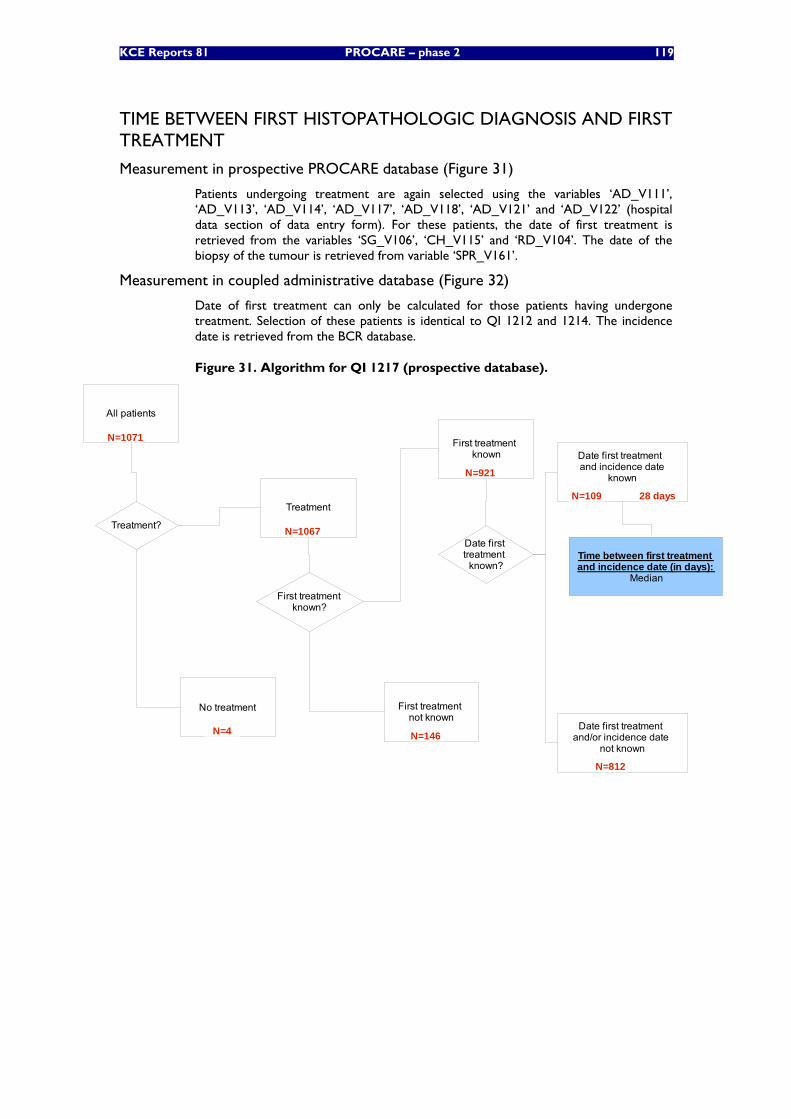
KCE Reports 81 PROCARE – phase 2 119
TIME BETWEEN FIRST HISTOPATHOLOGIC DIAGNOSIS AND FIRST TREATMENT
Measurement in prospective PROCARE database (Figure 31)
Patients undergoing treatment are again selected using the variables ‘AD_V111’, ‘AD_V113’, ‘AD_V114’, ‘AD_V117’, ‘AD_V118’, ‘AD_V121’ and ‘AD_V122’ (hospital data section of data entry form). For these patients, the date of first treatment is retrieved from the variables ‘SG_V106’, ‘CH_V115’ and ‘RD_V104’. The date of the biopsy of the tumour is retrieved from variable ‘SPR_V161’.
Measurement in coupled administrative database (Figure 32)
Date of first treatment can only be calculated for those patients having undergone treatment. Selection of these patients is identical to QI 1212 and 1214. The incidence date is retrieved from the BCR database.
Figure 31. Algorithm for QI 1217 (prospective database).
All patients
Treatment
No treatment
Treatment?
First treatmentknown?
First treatment known
First treatment not known
Date first treatment
known?
Date first treatment and incidence date
known
Date first treatment and/or incidence date
not known
Time between first treatmentand incidence date (in days):
Median
N=1071
N=1067
N=4
N=921
N=146
N=109
N=812
28 days
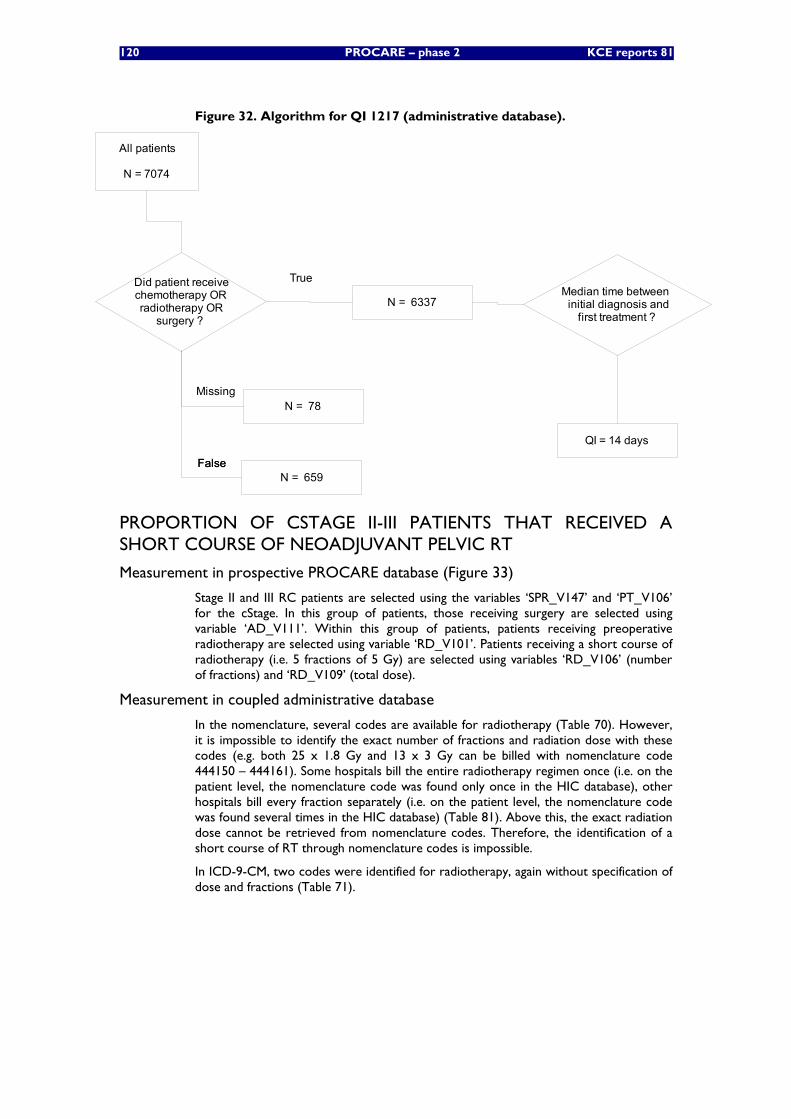
120 PROCARE – phase 2 KCE reports 81
Figure 32. Algorithm for QI 1217 (administrative database).
All patients
N = 7074
Median time between initial diagnosis and
first treatment ?
Did patient receivechemotherapy ORradiotherapy OR
surgery ?
FalseFalse
True
N = 659
N = 6337
N = 78Missing
QI = 14 days
PROPORTION OF CSTAGE II-III PATIENTS THAT RECEIVED A SHORT COURSE OF NEOADJUVANT PELVIC RT
Measurement in prospective PROCARE database (Figure 33)
Stage II and III RC patients are selected using the variables ‘SPR_V147’ and ‘PT_V106’ for the cStage. In this group of patients, those receiving surgery are selected using variable ‘AD_V111’. Within this group of patients, patients receiving preoperative radiotherapy are selected using variable ‘RD_V101’. Patients receiving a short course of radiotherapy (i.e. 5 fractions of 5 Gy) are selected using variables ‘RD_V106’ (number of fractions) and ‘RD_V109’ (total dose).
Measurement in coupled administrative database
In the nomenclature, several codes are available for radiotherapy (Table 70). However, it is impossible to identify the exact number of fractions and radiation dose with these codes (e.g. both 25 x 1.8 Gy and 13 x 3 Gy can be billed with nomenclature code 444150 – 444161). Some hospitals bill the entire radiotherapy regimen once (i.e. on the patient level, the nomenclature code was found only once in the HIC database), other hospitals bill every fraction separately (i.e. on the patient level, the nomenclature code was found several times in the HIC database) (Table 81). Above this, the exact radiation dose cannot be retrieved from nomenclature codes. Therefore, the identification of a short course of RT through nomenclature codes is impossible.
In ICD-9-CM, two codes were identified for radiotherapy, again without specification of dose and fractions (Table 71).
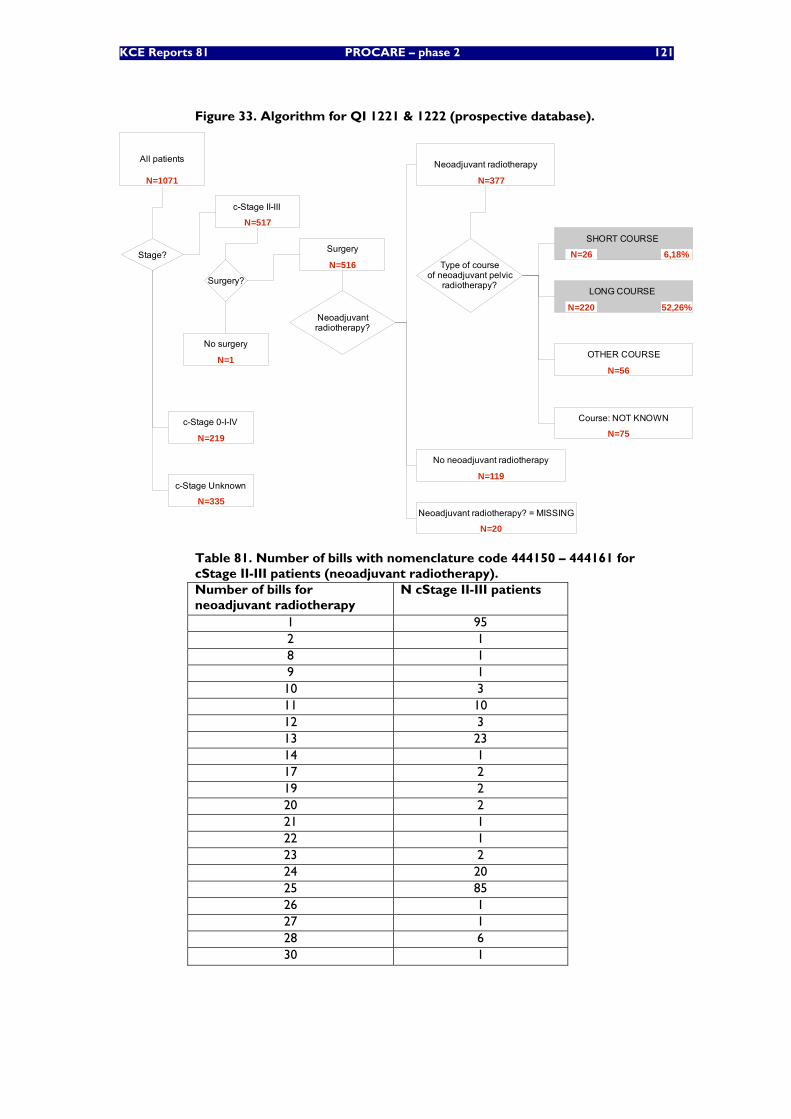
KCE Reports 81 PROCARE – phase 2 121
Figure 33. Algorithm for QI 1221 & 1222 (prospective database).
All patients
c-Stage II-III
Stage?
c-Stage 0-I-IV
c-Stage Unknown
Surgery?
Surgery
No surgery
Neoadjuvantradiotherapy?
SHORT COURSE
LONG COURSE
OTHER COURSE
Course: NOT KNOWN
Neoadjuvant radiotherapy
No neoadjuvant radiotherapy
Neoadjuvant radiotherapy? = MISSING
Type of courseof neoadjuvant pelvic
radiotherapy?
N=1071
N=517
N=219
N=335
N=516
N=1
N=377
N=119
N=20
N=26 6,18%
N=220 52,26%
N=56
N=75
Table 81. Number of bills with nomenclature code 444150 – 444161 for cStage II-III patients (neoadjuvant radiotherapy). Number of bills for neoadjuvant radiotherapy
N cStage II-III patients
1 95 2 1 8 1 9 1 10 3 11 10 12 3 13 23 14 1 17 2 19 2 20 2 21 1 22 1 23 2 24 20 25 85 26 1 27 1 28 6 30 1
122 PROCARE – phase 2 KCE reports 81
PROPORTION OF CSTAGE II-III PATIENTS THAT RECEIVED A LONG COURSE OF NEOADJUVANT PELVIC RT
(the same algorithm is used as the previous QI)
Measurement in prospective PROCARE database (Figure 33)
As for the previous QI, stage II and III RC patients are selected using the variables ‘SPR_V147’ and ‘PT_V106’ for the cStage. In this group of patients, those receiving surgery are selected using variable ‘AD_V111’. Within this group of patients, patients receiving preoperative radiotherapy are again selected using variable ‘RD_V101’. Patients receiving a long course of radiotherapy (i.e. at least 25 fractions of 1.8 Gy) are selected using variables ‘RD_V106’ (number of fractions) and ‘RD_V109’ (total dose).
Measurement in coupled administrative database
Again, in the nomenclature, codes are available for radiotherapy (Table 70). However, it is not possible to identify the exact number of fractions and radiation dose with these codes. Therefore, the identification of a long course of RT is impossible. The same applies to the ICD-9-CM codes (Table 71).
PROPORTION OF STAGE II-III PATIENTS THAT RECEIVED NEOADJUVANT CHEMORADIATION WITH A REGIMEN CONTAINING 5-FU
Measurement in prospective PROCARE database (Figure 34)
cStage II and III RC patients receiving surgery are selected in the same way as the two previous QI. When neoadjuvant CRT is provided (patients receiving neoadjuvant radiotherapy or chemotherapy as monotherapy are excluded), the variable ‘CH_V101’ is checked in the chemotherapy section of the data entry form. When the neoadjuvant chemotherapy regimen contained 5-FU, this is registered in variables ‘CH_V109’ and ‘CH_V110’ or in variables ‘CH_V119’ and ‘CH_V120’.
Measurement in coupled administrative database (Figure 35)
Patients with rectal cancer cStage II-III are selected from the BCR database. Those patients receiving surgery are selected using the nomenclature codes for abdominoperineal resection, Hartmann’s procedure and sphincter-sparing surgery (Table 64). The identified ICD-9-CM codes were not used for this selection (Table 66).
Within the group of cStage II-III patients undergoing surgery, those receiving neoadjuvant chemoradiotherapy are selected using the nomenclature codes for radiotherapy (Table 70) and the ATC codes for chemotherapy (Table 72), but only if the date of chemoradiotherapy falls within the interval between the incidence date and surgery date. The ATC codes for 5-fluorouracil are used to calculate the denominator (Table 72).
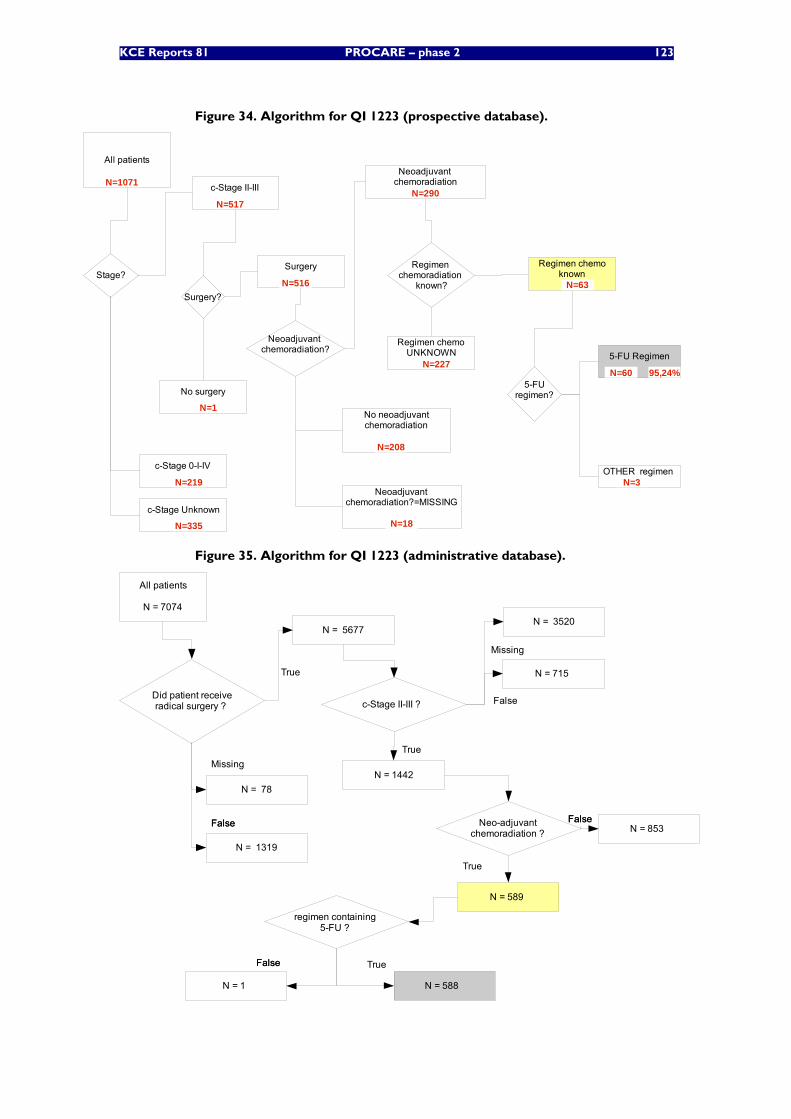
KCE Reports 81 PROCARE – phase 2 123
Figure 34. Algorithm for QI 1223 (prospective database).
All patients
c-Stage II-III
Stage?
c-Stage 0-I-IV
c-Stage Unknown
Surgery?
Surgery
No surgery
Neoadjuvant chemoradiation?
5-FU Regimen
OTHER regimen
Regimen chemoUNKNOWN
Neoadjuvant chemoradiation
Neoadjuvant chemoradiation?=MISSING
5-FUregimen?
Regimen chemoradiation
known?
Regimen chemoknown
N=1071
N=517
N=219
N=335
N=516
N=1
N=290
N=63
N=227N=60
N=3
95,24%
No neoadjuvantchemoradiation
N=208
N=18
Figure 35. Algorithm for QI 1223 (administrative database).
All patients
N = 7074
Did patient receiveradical surgery ?
FalseFalse
True
N = 5677
N = 78
Missing
False
True
N = 1442
c-Stage II-III ?
N = 1319
N = 715
N = 3520
Missing
Neo-adjuvant chemoradiation ?
FalseFalseN = 853
True
N = 589
FalseFalse True
N = 588
regimen containing 5-FU ?
N = 1
124 PROCARE – phase 2 KCE reports 81
PROPORTION OF CSTAGE II-III PATIENTS TREATED WITH NEOADJUVANT 5-FU BASED CHEMORADIATION, THAT RECEIVED A CONTINUOUS INFUSION OF 5-FU
Measurement in prospective PROCARE database
The calculation of the denominator of this QI is identical to that of the numerator of the previous QI. In the data entry form, no specific variable is available for the registration of continuous infusion. This information can be extracted from the variables ‘CH_V112’ and ‘CH_V122’, where the chemotherapy regimen is registered. However, this needs too much interpretation to allow a calculation in SAS, rendering the QI not measurable at this moment.
Measurement in coupled administrative database
Although it is possible to identify patients receiving 5-FU through a specific CNK-code in the IMA database (cfr. supra), it is impossible to know if this 5-FU is given via continuous infusion. Therefore, this QI is not measurable with the administrative databases.
PROPORTION OF CSTAGE II-III PATIENTS TREATED WITH A LONG COURSE OF PREOPERATIVE PELVIC RT OR CHEMORADIATION, THAT COMPLETED THIS NEOADJUVANT TREATMENT WITHIN THE PLANNED TIMING
Measurement in prospective PROCARE database (Figure 36)
The calculation of the denominator of this QI is identical to that of the numerator of QI 1222. Within this group of patients, those without a treatment interruption of more than 5 working days are selected using variable ‘RD_V107’. As for variable ‘FU_V139’ (see above), the default value of variable ‘RD_V107’ was ‘0’ (i.e. missing values also received a value ‘0’), making it impossible to distinguish absence of treatment interruption from missing values. However, in a random sample of 20 forms with a value ‘0’ for variable ‘RD_V107’ only 1 missing value (5%) was found.
Measurement in coupled administrative database
As mentioned before, the identification of a long course of RT, i.e. at least 25 fractions of 1.8 Gy, is impossible in the administrative databases.
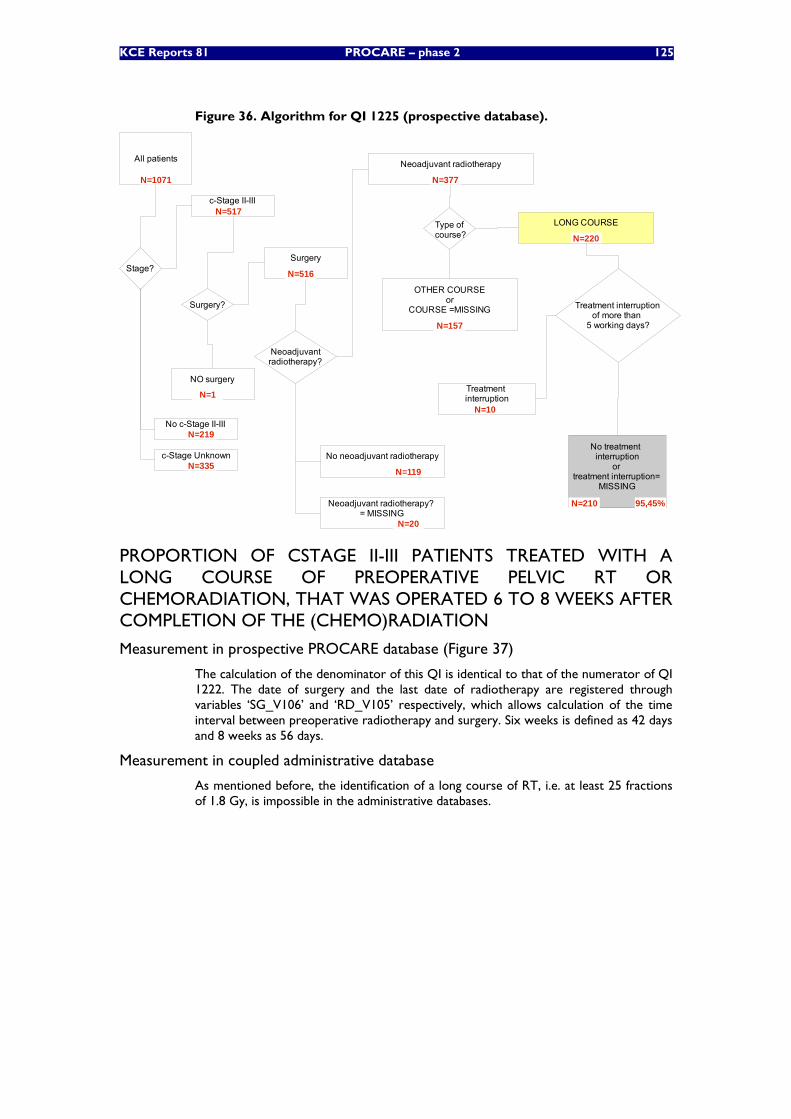
KCE Reports 81 PROCARE – phase 2 125
Figure 36. Algorithm for QI 1225 (prospective database).
All patients
c-Stage II-III
Stage?
No c-Stage II-III
c-Stage Unknown
Surgery?
Surgery
NO surgery
Neoadjuvantradiotherapy?
LONG COURSE
OTHER COURSEor
COURSE =MISSING
Neoadjuvant radiotherapy
No neoadjuvant radiotherapy
Neoadjuvant radiotherapy? = MISSING
Type of course?
Treatment interruptionof more than
5 working days?
Treatment interruption
No treatment interruption
or treatment interruption=
MISSING
N=1071
N=517
N=219
N=335
N=1
N=377
N=119
N=20
N=220
N=157
N=210
N=10
95,45%
N=516
PROPORTION OF CSTAGE II-III PATIENTS TREATED WITH A LONG COURSE OF PREOPERATIVE PELVIC RT OR CHEMORADIATION, THAT WAS OPERATED 6 TO 8 WEEKS AFTER COMPLETION OF THE (CHEMO)RADIATION
Measurement in prospective PROCARE database (Figure 37)
The calculation of the denominator of this QI is identical to that of the numerator of QI 1222. The date of surgery and the last date of radiotherapy are registered through variables ‘SG_V106’ and ‘RD_V105’ respectively, which allows calculation of the time interval between preoperative radiotherapy and surgery. Six weeks is defined as 42 days and 8 weeks as 56 days.
Measurement in coupled administrative database
As mentioned before, the identification of a long course of RT, i.e. at least 25 fractions of 1.8 Gy, is impossible in the administrative databases.
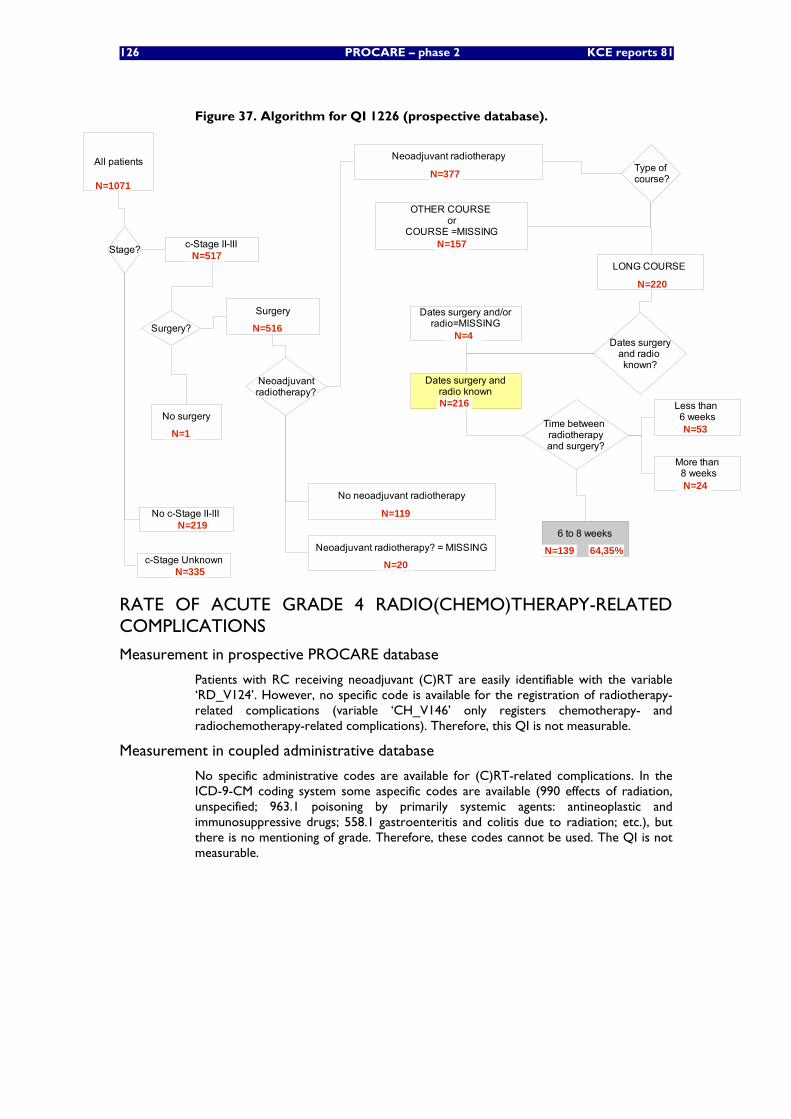
126 PROCARE – phase 2 KCE reports 81
Figure 37. Algorithm for QI 1226 (prospective database).
All patients
Stage?
Surgery?
No surgery
Neoadjuvantradiotherapy?
Type of course?
Dates surgeryand radio known?
Time between radiotherapyand surgery?
6 to 8 weeks
Less than 6 weeks
More than 8 weeks
N=1071
Surgery
N=516
No c-Stage II-IIIN=219
OTHER COURSE or
COURSE =MISSINGN=157
LONG COURSE
N=220
Neoadjuvant radiotherapy? = MISSING
N=20
No neoadjuvant radiotherapy
N=119
Neoadjuvant radiotherapy
N=377
c-Stage UnknownN=335
N=24
N=53
N=139
Dates surgery and/orradio=MISSING
N=4
Dates surgery andradio knownN=216
64,35%
N=1
c-Stage II-IIIN=517
RATE OF ACUTE GRADE 4 RADIO(CHEMO)THERAPY-RELATED COMPLICATIONS
Measurement in prospective PROCARE database
Patients with RC receiving neoadjuvant (C)RT are easily identifiable with the variable ‘RD_V124’. However, no specific code is available for the registration of radiotherapy-related complications (variable ‘CH_V146’ only registers chemotherapy- and radiochemotherapy-related complications). Therefore, this QI is not measurable.
Measurement in coupled administrative database
No specific administrative codes are available for (C)RT-related complications. In the ICD-9-CM coding system some aspecific codes are available (990 effects of radiation, unspecified; 963.1 poisoning by primarily systemic agents: antineoplastic and immunosuppressive drugs; 558.1 gastroenteritis and colitis due to radiation; etc.), but there is no mentioning of grade. Therefore, these codes cannot be used. The QI is not measurable.
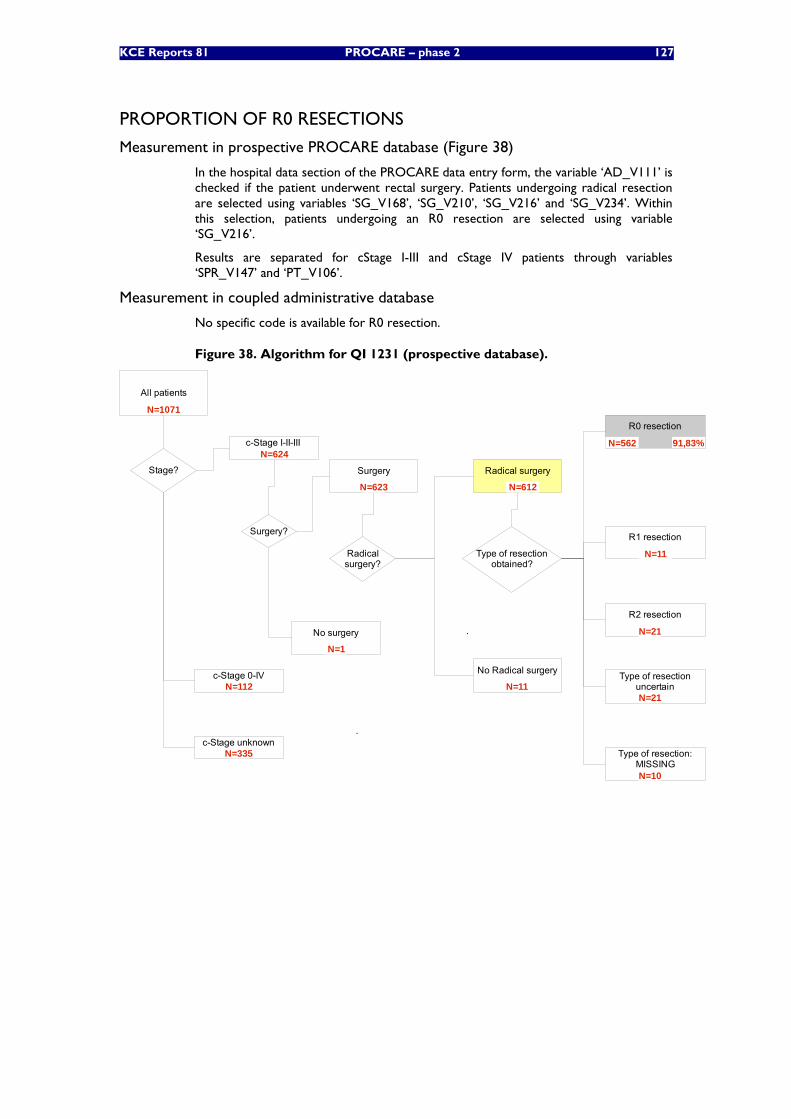
KCE Reports 81 PROCARE – phase 2 127
PROPORTION OF R0 RESECTIONS
Measurement in prospective PROCARE database (Figure 38)
In the hospital data section of the PROCARE data entry form, the variable ‘AD_V111’ is checked if the patient underwent rectal surgery. Patients undergoing radical resection are selected using variables ‘SG_V168’, ‘SG_V210’, ‘SG_V216’ and ‘SG_V234’. Within this selection, patients undergoing an R0 resection are selected using variable ‘SG_V216’.
Results are separated for cStage I-III and cStage IV patients through variables ‘SPR_V147’ and ‘PT_V106’.
Measurement in coupled administrative database
No specific code is available for R0 resection.
Figure 38. Algorithm for QI 1231 (prospective database).
All patients
Surgery
No surgery
Surgery?
.
Type of resectionobtained?
R0 resection
R2 resection
.
Type of resection:MISSING
Type of resectionuncertain
N=1071
N=562 91,83%
N=1
Radicalsurgery?
No Radical surgery
Radical surgeryStage?
c-Stage I-II-III
c-Stage 0-IV
c-Stage unknown
R1 resection
N=10
N=21
N=21
N=624
N=335
N=112
N=612N=623
N=11
N=11
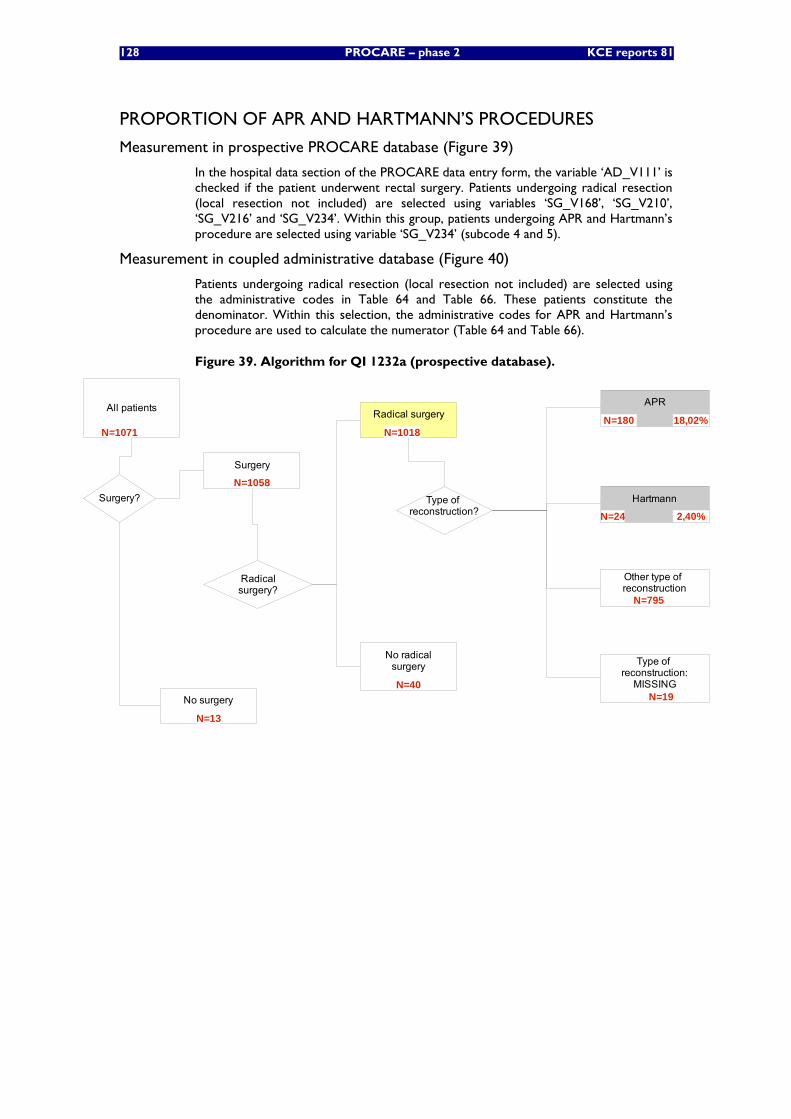
128 PROCARE – phase 2 KCE reports 81
PROPORTION OF APR AND HARTMANN’S PROCEDURES
Measurement in prospective PROCARE database (Figure 39)
In the hospital data section of the PROCARE data entry form, the variable ‘AD_V111’ is checked if the patient underwent rectal surgery. Patients undergoing radical resection (local resection not included) are selected using variables ‘SG_V168’, ‘SG_V210’, ‘SG_V216’ and ‘SG_V234’. Within this group, patients undergoing APR and Hartmann’s procedure are selected using variable ‘SG_V234’ (subcode 4 and 5).
Measurement in coupled administrative database (Figure 40)
Patients undergoing radical resection (local resection not included) are selected using the administrative codes in Table 64 and Table 66. These patients constitute the denominator. Within this selection, the administrative codes for APR and Hartmann’s procedure are used to calculate the numerator (Table 64 and Table 66).
Figure 39. Algorithm for QI 1232a (prospective database).
All patients
Surgery
No surgery
Surgery? Type of reconstruction?
Other type of reconstruction
APR
N=1071
N=1058
N=13
N=180
Hartmann
Type of reconstruction:
MISSINGN=19
N=795
2,40%N=24
18,02%
Radicalsurgery?
No radicalsurgery
Radical surgery
N=40
N=1018

KCE Reports 81 PROCARE – phase 2 129
Figure 40. Algorithm for QI 1232a (administrative database).
All patients
N = 7074
Did patient receiveradical surgery
without local excision ?
FalseFalse
True
N = 5472
N = 78
Missing
N = 1524
FalseFalse
True
N = 2053
APR or Hartmann's procedure?
N = 3419
PROPORTION OF PATIENTS WITH STOMA 1 YEAR AFTER SPHINCTER-SPARING SURGERY
Measurement in prospective PROCARE database
Patients undergoing sphincter-sparing surgery (SSO) are registered through variable ‘SG_V234’ (subcodes 6-9). Patients receiving a stoma during SSO are registered through variable ‘SG_V245’. The follow-up of stoma closure/presence is registered through variables ‘FU_V113’ and ‘FU_V114’. However, the follow-up dates are variable from one patient to another, making a calculation at 1 year impossible.
Measurement in coupled administrative database (Figure 41)
Patients undergoing sphincter-sparing surgery are selected using specific administrative codes (Table 64 and Table 66). Within this selection, patients with a stoma within 1 year after sphincter-sparing surgery are selected using the administrative codes for stoma surgery (Table 65, 68 and 82) or stoma material (Table 83). To calculate the numerator, those patients having received a permanent stoma (Table 82) not having undergone stoma closure within 1 year (Table 84; note that 243224 – 243213 also concerns closure of a colonic fistula) or still using stoma material after 1 year (Table 83) were selected.
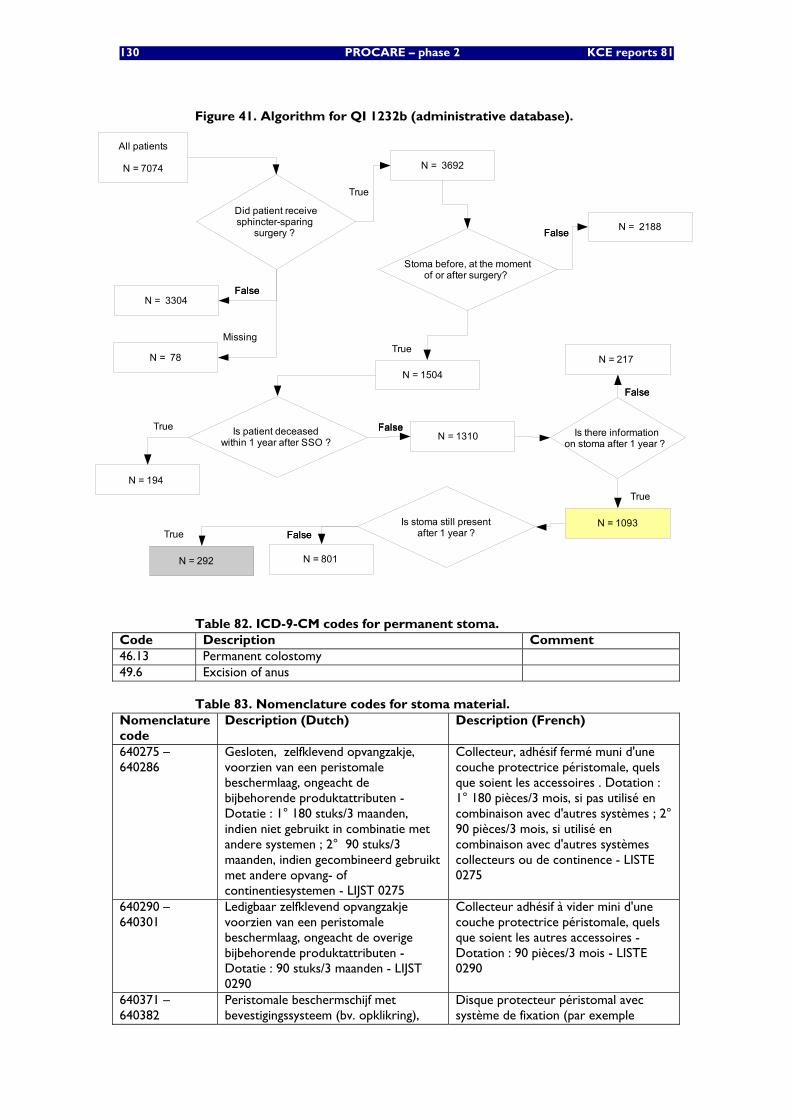
130 PROCARE – phase 2 KCE reports 81
Figure 41. Algorithm for QI 1232b (administrative database).
All patients
N = 7074
Did patient receivesphincter-sparing
surgery ?
FalseFalse
True
N = 3692
N = 78
Missing
N = 3304
FalseFalse
True
N = 1504
Stoma before, at the momentof or after surgery?
N = 2188
FalseFalseTrueN = 1310 Is patient deceased
within 1 year after SSO ?
N = 194
FalseFalse
True
N = 1093
Is there informationon stoma after 1 year ?
N = 217
FalseFalseTrue
N = 292
Is stoma still present after 1 year ?
N = 801
Table 82. ICD-9-CM codes for permanent stoma. Code Description Comment 46.13 Permanent colostomy 49.6 Excision of anus
Table 83. Nomenclature codes for stoma material. Nomenclature code
Description (Dutch) Description (French)
640275 – 640286
Gesloten, zelfklevend opvangzakje, voorzien van een peristomale beschermlaag, ongeacht de bijbehorende produktattributen - Dotatie : 1° 180 stuks/3 maanden, indien niet gebruikt in combinatie met andere systemen ; 2° 90 stuks/3 maanden, indien gecombineerd gebruikt met andere opvang- of continentiesystemen - LIJST 0275
Collecteur, adhésif fermé muni d'une couche protectrice péristomale, quels que soient les accessoires . Dotation : 1° 180 pièces/3 mois, si pas utilisé en combinaison avec d'autres systèmes ; 2° 90 pièces/3 mois, si utilisé en combinaison avec d'autres systèmes collecteurs ou de continence - LISTE 0275
640290 – 640301
Ledigbaar zelfklevend opvangzakje voorzien van een peristomale beschermlaag, ongeacht de overige bijbehorende produktattributen - Dotatie : 90 stuks/3 maanden - LIJST 0290
Collecteur adhésif à vider mini d'une couche protectrice péristomale, quels que soient les autres accessoires - Dotation : 90 pièces/3 mois - LISTE 0290
640371 – 640382
Peristomale beschermschijf met bevestigingssysteem (bv. opklikring),
Disque protecteur péristomal avec système de fixation (par exemple

KCE Reports 81 PROCARE – phase 2 131
Nomenclature code
Description (Dutch) Description (French)
ongeacht de overige bijbehorende produktattributen - Dotatie : 45 stuks/3 maanden(ileostomie), 35 stuks/3 maanden (colostomie) - LIJST 0371
anneau-clip), quels que soient les autres accessoires - Dotation : 45 pièces/3 mois(iléostomie), 35 pièces/3 mois (colostomie) - LISTE 0371
640430 Peristomale beschermschijf met kleefsysteem, ongeacht de overige bijbehorende produktattributen - Dotatie : 45 stuks/3 maanden (ileostomie) 35 stuks/3 maanden (colostomie) - LIJST 0430
Disques protecteur péristomal avec système adhésif, quels que soient les autres accessoires - Dotation : 45 pièces/3 mois (iléostomie) 35 pièces/3 mois (colostomie) - LISTE 0430
640533 – 640544
Minizakje met peristomale beschermlaag en geïntegreerde filter, ongeacht de overige bijbehorende produktattributen - Dotatie : 1° 180 stuks/3 maanden indien niet gebruikt in combinatie met andere opvang- of continentiesystemen ; 2° 90 stuks/3 maanden indien gecombineerd gebruikt met opvang- of continentiesystemen - LIJST 0533
Mini-poche avec couche protectrice péristomale et filtre intégré, quels que soient les autres accessoires - Dotation : 1° 180 pièces/3 mois, si pas utilisé en combinaison avec d'autres systèmes collecteurs ou de continence ; 2° 90 pièces/3 mois, si utilisé en combinaison avec des systèmes collecteurs ou de continence - LISTE 0533
640555 – 640566
Inwendige afsluitplug, voorzien van een peristomale beschermlaag, ongeacht de overige bijbehorende produktattributen - Dotatie : 1° 120 stuks/3 maanden indien niet gebruikt in combinatie met opvang- of andere continentiesystemen ; 2° 90 stuks/3 maanden indien gecombineerd gebruikt met opvang- of andere continentiesystemen - LIJST 0555
Bouchon de fermeture interne muni d'une couche protectrice péristomale, quels que soient les autres accessoires - Dotation : 1° 120 pièces/3 mois, si pas utilisé en combinaison avec des systèmes collecteurs ou d'autres systèmes de continence ; 2° 90 pièces/3 mois, si utilisé en combinaison avec des systèmes collecteurs ou d'autres systèmes de continence - LISTE 0555
640872 – 640883
Peristomale beschermschijf, voorzien van een bevestigingssysteem (bv. opklikring), ongeacht de overige bijbehorende produktattributen - Dotatie : 45 stuks/3 maanden - LIJST 0872
Disque protecteur péristomal muni d'un système de fixation (par ex. anneau-clip), quels que soient les autres accessoires - Dotation : 45 pièces/3 mois - LISTE 0872
641196 Ledigbaar opvangzakje voorzien van een individueel aanpasbare peristomale beschermschijf, waarvan de kleinste diameter minimum 70 mm bedraagt, ongeacht de overige bijkomende produktattributen - Dotatie : 90 suks/3 maanden - LIJST 1196
Collecteur à vider avec plaque protectrice péristomale individuellement adaptable, dont le plus petit diamètre est de 70 mm, quels que soient les autres accessoires - Dotation : 90 pièces/3 mois - LISTE 1196
641270 Individueel aanpasbare peristomale beschermschijf waarvan de kleinste diameter minimum 70 mm bedraagt, ongeacht de overige bijbehorende produktattributen - Dotatie : 45 stuks/3 maanden(ileostomie), 35 stuks/3 maanden (colostomie) - LIJST 1270
Plaque protectrice péristomale individuellement adaptable dont le plus petit diamètre s'élève au moins à 70 mm, quels que soient les autres accessoires - Dotation : 45 pièces/3 mois(iléostomie), 35 pièces/3 mois (colostomie) - LISTE 1270
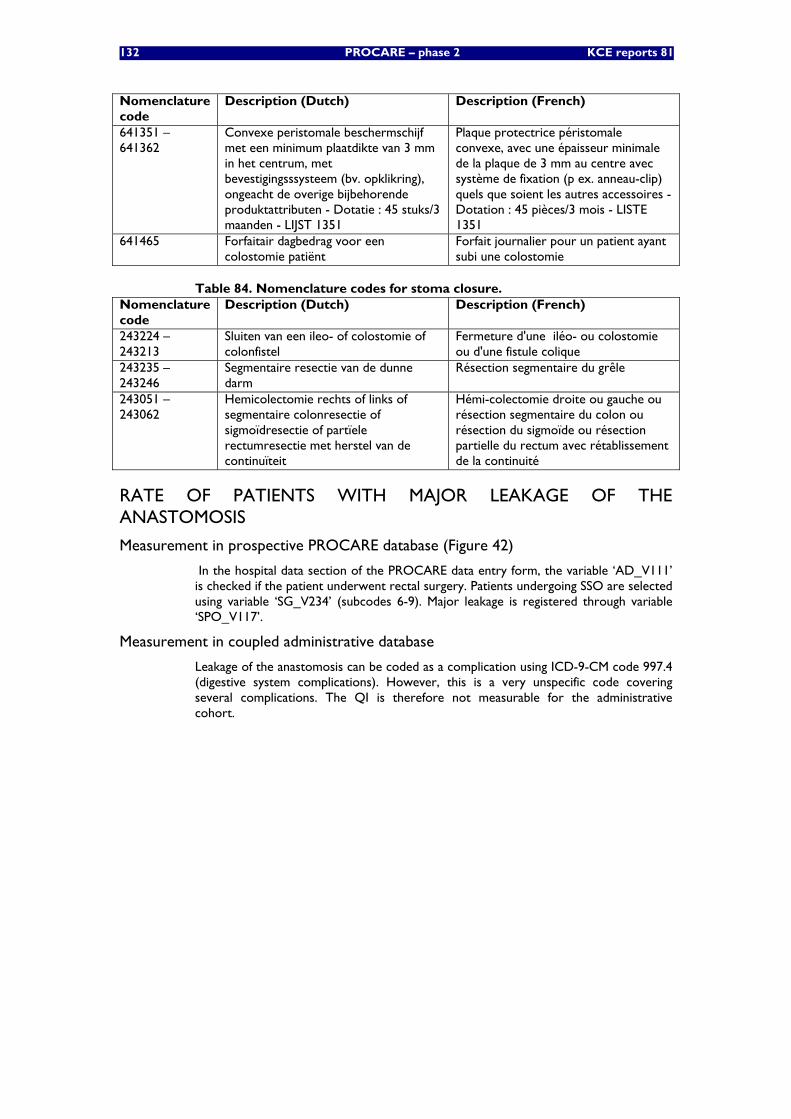
132 PROCARE – phase 2 KCE reports 81
Nomenclature code
Description (Dutch) Description (French)
641351 – 641362
Convexe peristomale beschermschijf met een minimum plaatdikte van 3 mm in het centrum, met bevestigingsssysteem (bv. opklikring), ongeacht de overige bijbehorende produktattributen - Dotatie : 45 stuks/3 maanden - LIJST 1351
Plaque protectrice péristomale convexe, avec une épaisseur minimale de la plaque de 3 mm au centre avec système de fixation (p ex. anneau-clip) quels que soient les autres accessoires - Dotation : 45 pièces/3 mois - LISTE 1351
641465 Forfaitair dagbedrag voor een colostomie patiënt
Forfait journalier pour un patient ayant subi une colostomie
Table 84. Nomenclature codes for stoma closure. Nomenclature code
Description (Dutch) Description (French)
243224 – 243213
Sluiten van een ileo- of colostomie of colonfistel
Fermeture d'une iléo- ou colostomie ou d'une fistule colique
243235 – 243246
Segmentaire resectie van de dunne darm
Résection segmentaire du grêle
243051 – 243062
Hemicolectomie rechts of links of segmentaire colonresectie of sigmoïdresectie of partïele rectumresectie met herstel van de continuïteit
Hémi-colectomie droite ou gauche ou résection segmentaire du colon ou résection du sigmoïde ou résection partielle du rectum avec rétablissement de la continuité
RATE OF PATIENTS WITH MAJOR LEAKAGE OF THE ANASTOMOSIS
Measurement in prospective PROCARE database (Figure 42)
In the hospital data section of the PROCARE data entry form, the variable ‘AD_V111’ is checked if the patient underwent rectal surgery. Patients undergoing SSO are selected using variable ‘SG_V234’ (subcodes 6-9). Major leakage is registered through variable ‘SPO_V117’.
Measurement in coupled administrative database
Leakage of the anastomosis can be coded as a complication using ICD-9-CM code 997.4 (digestive system complications). However, this is a very unspecific code covering several complications. The QI is therefore not measurable for the administrative cohort.
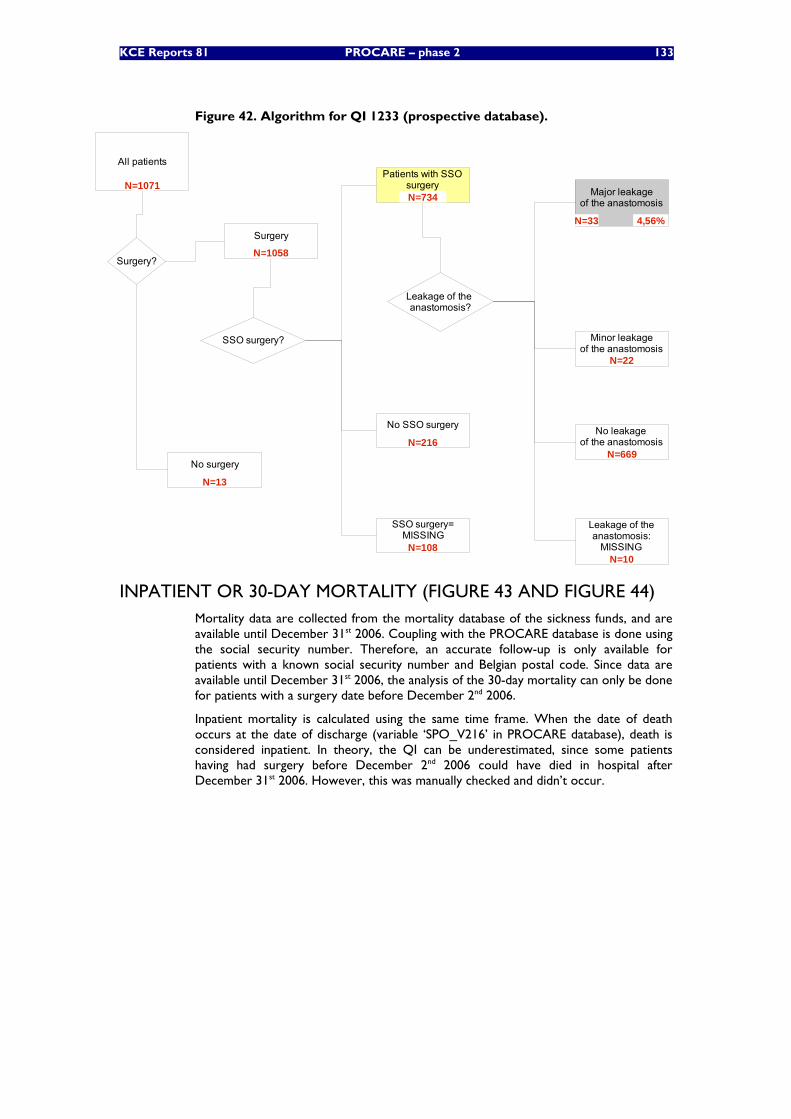
KCE Reports 81 PROCARE – phase 2 133
Figure 42. Algorithm for QI 1233 (prospective database).
All patients
Surgery
No surgery
Surgery?
SSO surgery?
Patients with SSOsurgery
SSO surgery=MISSING
No SSO surgery
Leakage of the anastomosis?
Major leakageof the anastomosis
Minor leakageof the anastomosis
No leakage of the anastomosis
Leakage of theanastomosis:
MISSING
N=1071
4,56%
N=10
N=669
N=22
N=33
N=108
N=216
N=734
N=13
N=1058
INPATIENT OR 30-DAY MORTALITY (FIGURE 43 AND FIGURE 44) Mortality data are collected from the mortality database of the sickness funds, and are available until December 31st 2006. Coupling with the PROCARE database is done using the social security number. Therefore, an accurate follow-up is only available for patients with a known social security number and Belgian postal code. Since data are available until December 31st 2006, the analysis of the 30-day mortality can only be done for patients with a surgery date before December 2nd 2006.
Inpatient mortality is calculated using the same time frame. When the date of death occurs at the date of discharge (variable ‘SPO_V216’ in PROCARE database), death is considered inpatient. In theory, the QI can be underestimated, since some patients having had surgery before December 2nd 2006 could have died in hospital after December 31st 2006. However, this was manually checked and didn’t occur.
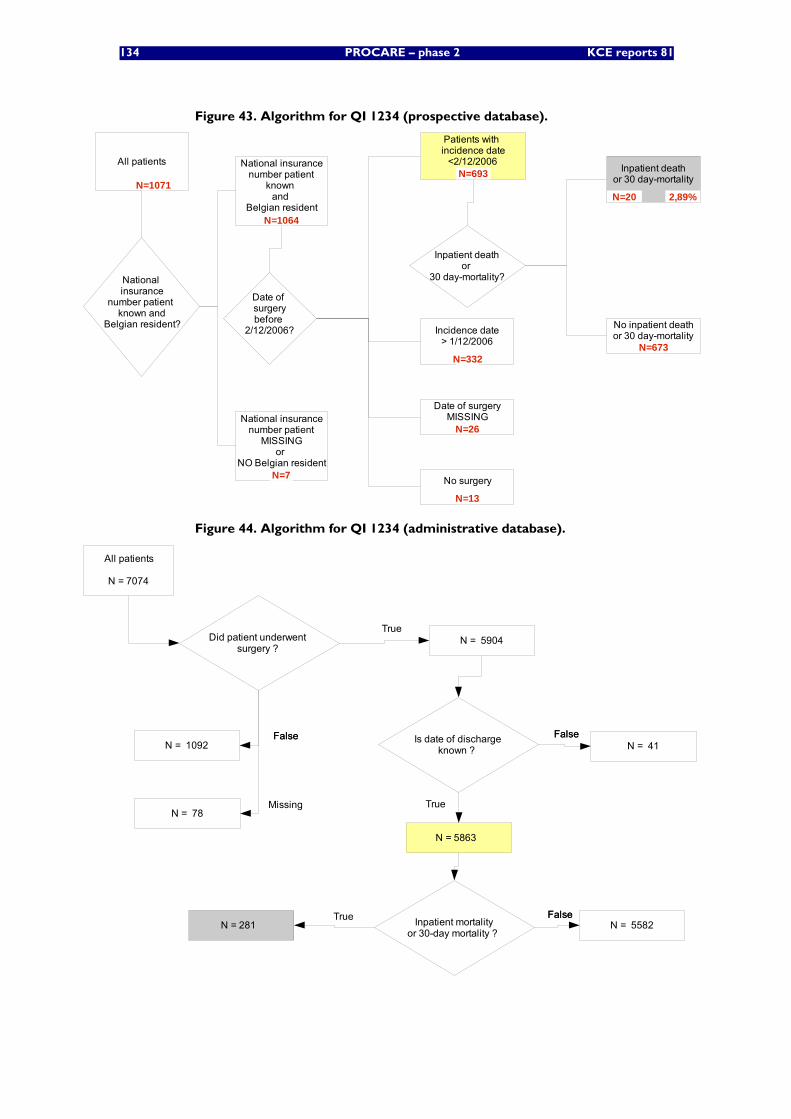
134 PROCARE – phase 2 KCE reports 81
Figure 43. Algorithm for QI 1234 (prospective database).
All patients
Patients with incidence date
<2/12/2006
Inpatient deathor
30 day-mortality?
Date of surgerybefore
2/12/2006? Incidence date> 1/12/2006
Date of surgeryMISSING
No surgery
Inpatient deathor 30 day-mortality
No inpatient deathor 30 day-mortality
National insurance
number patient known and
Belgian resident?
National insurancenumber patient
MISSINGor
NO Belgian resident
National insurancenumber patient
known and
Belgian resident
N=1071
N=673
2,89%N=20
N=13
N=26
N=332
N=693
N=7
N=1064
Figure 44. Algorithm for QI 1234 (administrative database).
All patients
N = 7074
Did patient underwent surgery ?
FalseFalse
TrueN = 5904
N = 78Missing
N = 1092 Is date of dischargeknown ?
FalseFalse
True
N = 5863
N = 41
Inpatient mortalityor 30-day mortality ?
FalseFalseTrueN = 281 N = 5582
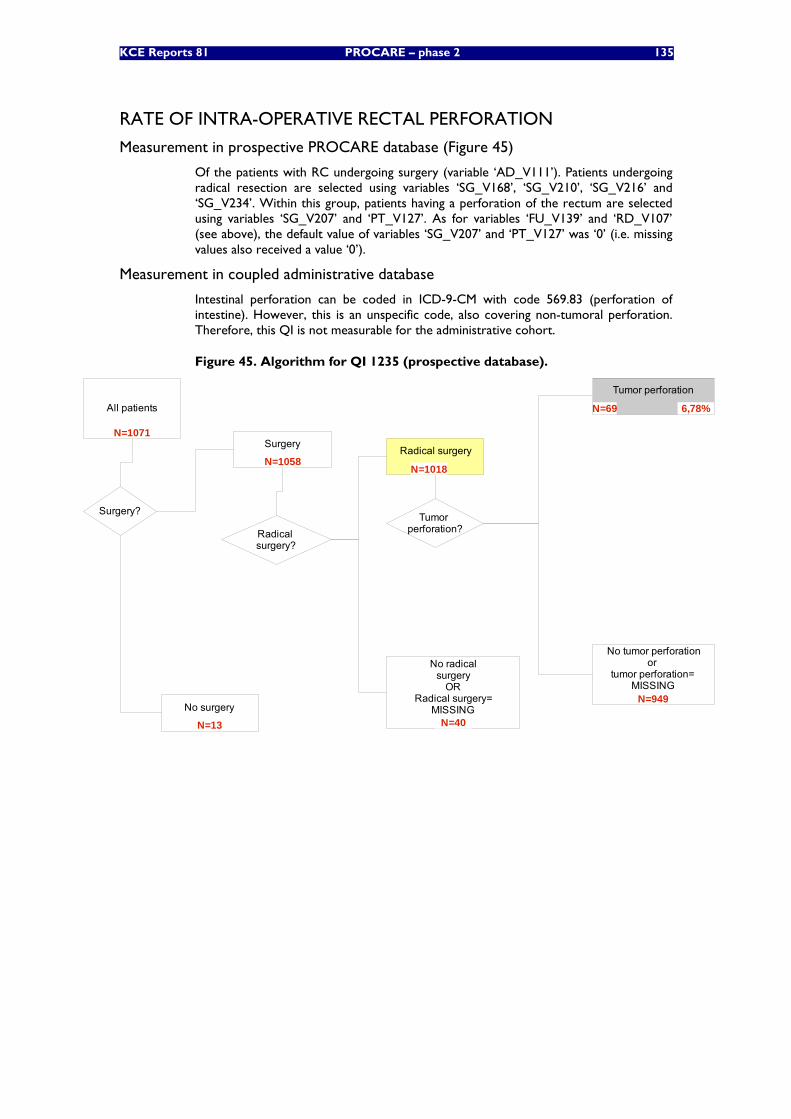
KCE Reports 81 PROCARE – phase 2 135
RATE OF INTRA-OPERATIVE RECTAL PERFORATION
Measurement in prospective PROCARE database (Figure 45)
Of the patients with RC undergoing surgery (variable ‘AD_V111’). Patients undergoing radical resection are selected using variables ‘SG_V168’, ‘SG_V210’, ‘SG_V216’ and ‘SG_V234’. Within this group, patients having a perforation of the rectum are selected using variables ‘SG_V207’ and ‘PT_V127’. As for variables ‘FU_V139’ and ‘RD_V107’ (see above), the default value of variables ‘SG_V207’ and ‘PT_V127’ was ‘0’ (i.e. missing values also received a value ‘0’).
Measurement in coupled administrative database
Intestinal perforation can be coded in ICD-9-CM with code 569.83 (perforation of intestine). However, this is an unspecific code, also covering non-tumoral perforation. Therefore, this QI is not measurable for the administrative cohort.
Figure 45. Algorithm for QI 1235 (prospective database).
All patients
Surgery
No surgery
Tumor perforation?
Surgery?
Tumor perforation
No tumor perforationor
tumor perforation=MISSING
N=1071
6,78%
N=949
N=69
N=13
N=1058
Radical surgery?
Radical surgery
No radicalsurgery
ORRadical surgery=
MISSINGN=40
N=1018
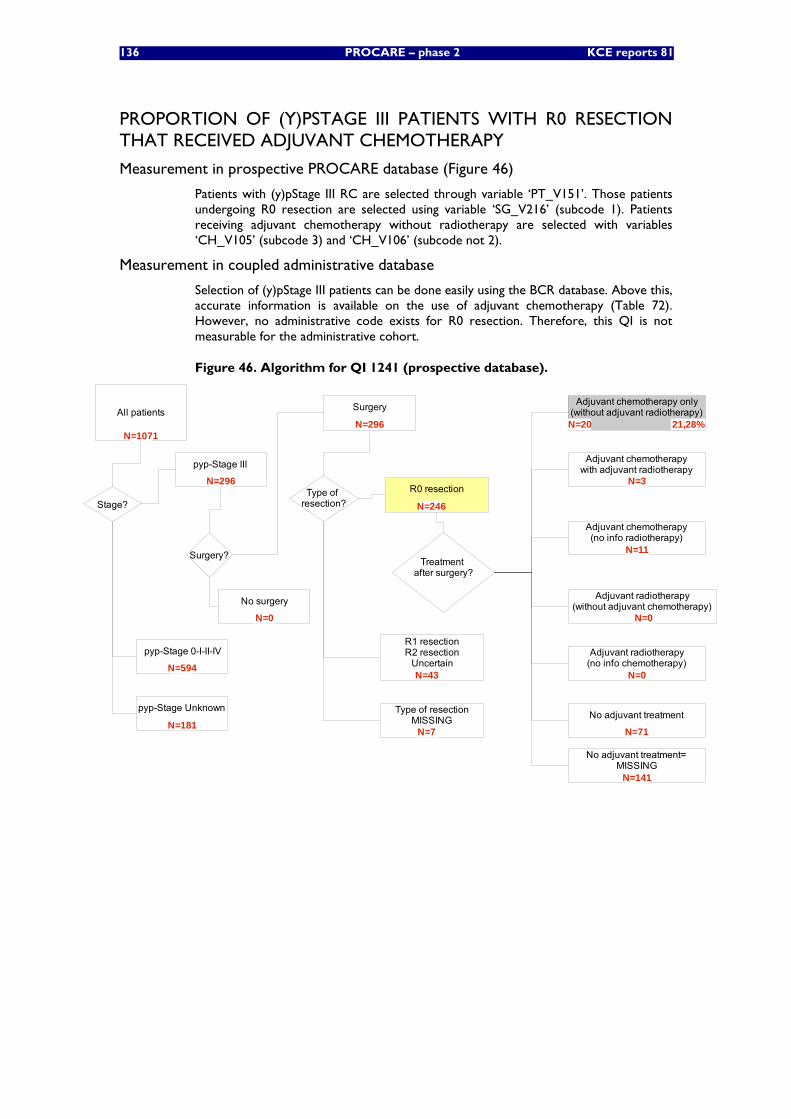
136 PROCARE – phase 2 KCE reports 81
PROPORTION OF (Y)PSTAGE III PATIENTS WITH R0 RESECTION THAT RECEIVED ADJUVANT CHEMOTHERAPY
Measurement in prospective PROCARE database (Figure 46)
Patients with (y)pStage III RC are selected through variable ‘PT_V151’. Those patients undergoing R0 resection are selected using variable ‘SG_V216’ (subcode 1). Patients receiving adjuvant chemotherapy without radiotherapy are selected with variables ‘CH_V105’ (subcode 3) and ‘CH_V106’ (subcode not 2).
Measurement in coupled administrative database
Selection of (y)pStage III patients can be done easily using the BCR database. Above this, accurate information is available on the use of adjuvant chemotherapy (Table 72). However, no administrative code exists for R0 resection. Therefore, this QI is not measurable for the administrative cohort.
Figure 46. Algorithm for QI 1241 (prospective database).
All patients
pyp-Stage III
Stage?
pyp-Stage 0-I-II-IV
pyp-Stage Unknown
Surgery?
Surgery
No surgery
Treatment after surgery?
Adjuvant chemotherapy only(without adjuvant radiotherapy)
Adjuvant chemotherapywith adjuvant radiotherapy
Adjuvant radiotherapy(no info chemotherapy)
No adjuvant treatment
Adjuvant chemotherapy(no info radiotherapy)
Type of resection?
R1 resectionR2 resection
Uncertain
Type of resectionMISSING
Adjuvant radiotherapy(without adjuvant chemotherapy)
No adjuvant treatment=MISSING
N=1071
N=296
N=594
N=181
N=0
N=7
N=43
R0 resection
N=246
N=296
N=71
N=0
N=0
N=11
N=3
N=20
N=141
21,28%
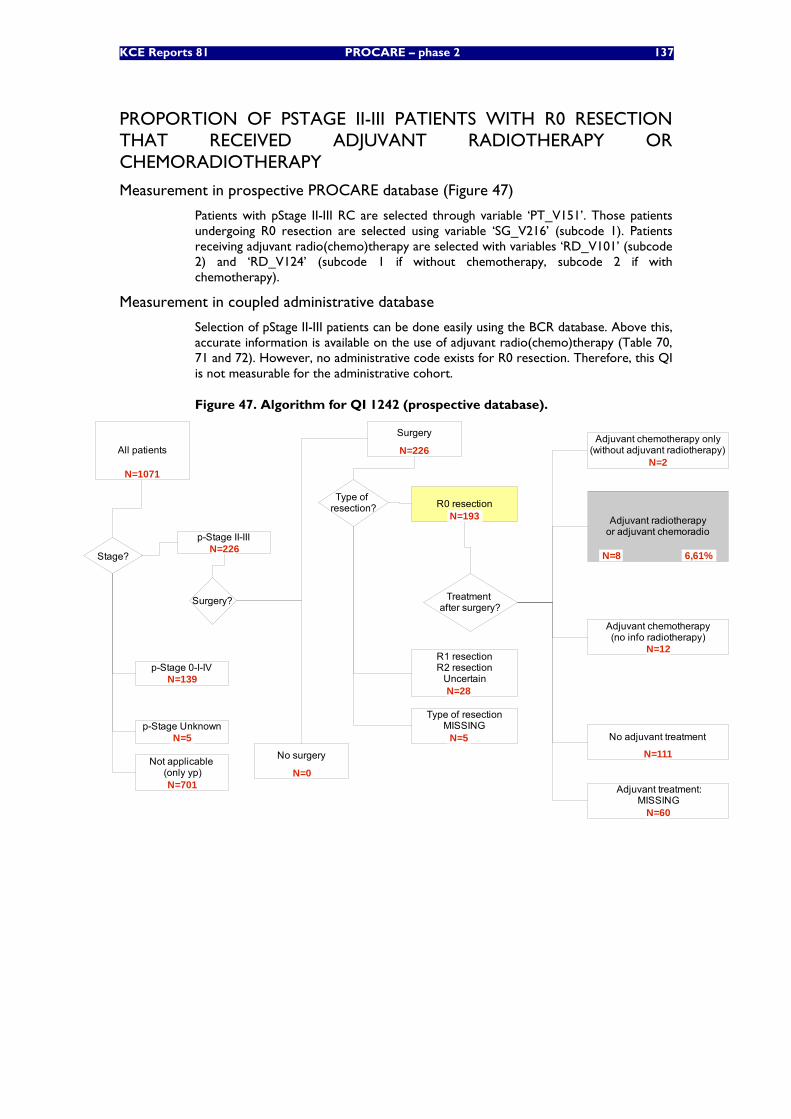
KCE Reports 81 PROCARE – phase 2 137
PROPORTION OF PSTAGE II-III PATIENTS WITH R0 RESECTION THAT RECEIVED ADJUVANT RADIOTHERAPY OR CHEMORADIOTHERAPY
Measurement in prospective PROCARE database (Figure 47)
Patients with pStage II-III RC are selected through variable ‘PT_V151’. Those patients undergoing R0 resection are selected using variable ‘SG_V216’ (subcode 1). Patients receiving adjuvant radio(chemo)therapy are selected with variables ‘RD_V101’ (subcode 2) and ‘RD_V124’ (subcode 1 if without chemotherapy, subcode 2 if with chemotherapy).
Measurement in coupled administrative database
Selection of pStage II-III patients can be done easily using the BCR database. Above this, accurate information is available on the use of adjuvant radio(chemo)therapy (Table 70, 71 and 72). However, no administrative code exists for R0 resection. Therefore, this QI is not measurable for the administrative cohort.
Figure 47. Algorithm for QI 1242 (prospective database).
All patients
p-Stage II-III
Stage?
p-Stage 0-I-IV
p-Stage Unknown
Surgery?
Not applicable (only yp)
Surgery
No surgery
Treatment after surgery?
Adjuvant chemotherapy only(without adjuvant radiotherapy)
Adjuvant radiotherapyor adjuvant chemoradio
No adjuvant treatment
Adjuvant chemotherapy(no info radiotherapy)
Type of resection? R0 resection
R1 resectionR2 resection
Uncertain
Type of resectionMISSING
Adjuvant treatment:MISSING
N=1071
N=226
N=139
N=5
N=701N=0
N=5
N=28
N=193
N=226
N=111
N=12
N=8
N=2
N=60
6,61%
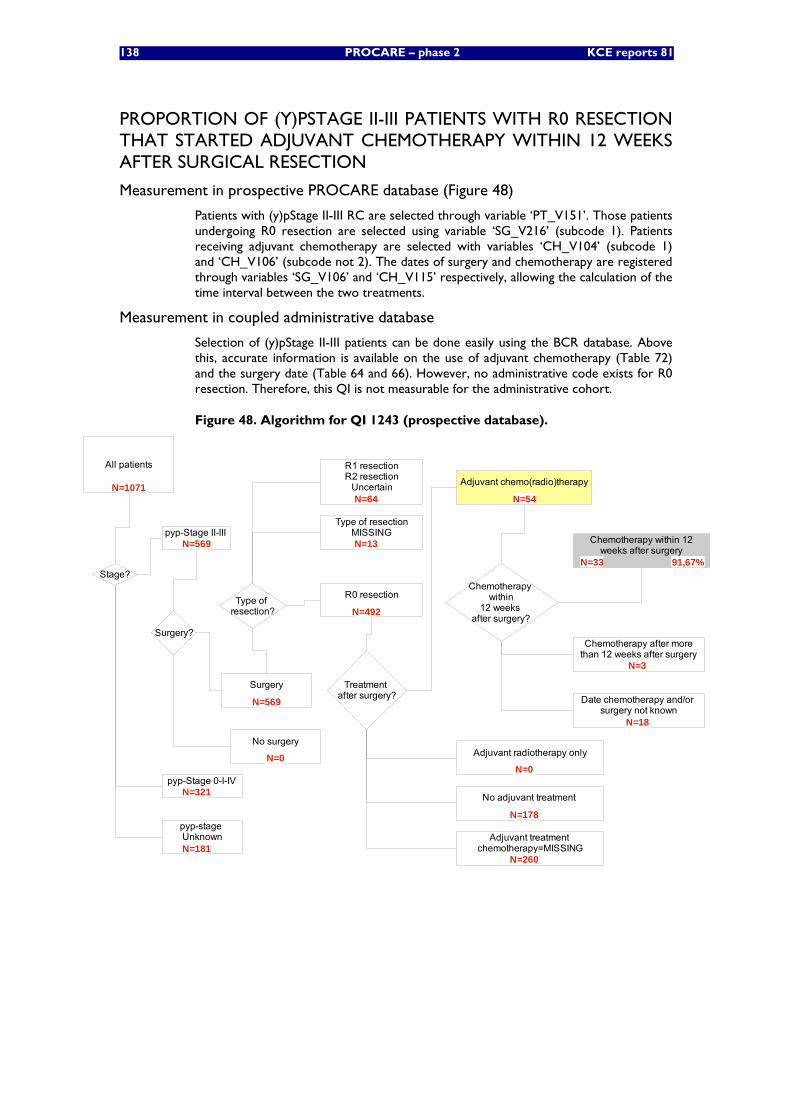
138 PROCARE – phase 2 KCE reports 81
PROPORTION OF (Y)PSTAGE II-III PATIENTS WITH R0 RESECTION THAT STARTED ADJUVANT CHEMOTHERAPY WITHIN 12 WEEKS AFTER SURGICAL RESECTION
Measurement in prospective PROCARE database (Figure 48)
Patients with (y)pStage II-III RC are selected through variable ‘PT_V151’. Those patients undergoing R0 resection are selected using variable ‘SG_V216’ (subcode 1). Patients receiving adjuvant chemotherapy are selected with variables ‘CH_V104’ (subcode 1) and ‘CH_V106’ (subcode not 2). The dates of surgery and chemotherapy are registered through variables ‘SG_V106’ and ‘CH_V115’ respectively, allowing the calculation of the time interval between the two treatments.
Measurement in coupled administrative database
Selection of (y)pStage II-III patients can be done easily using the BCR database. Above this, accurate information is available on the use of adjuvant chemotherapy (Table 72) and the surgery date (Table 64 and 66). However, no administrative code exists for R0 resection. Therefore, this QI is not measurable for the administrative cohort.
Figure 48. Algorithm for QI 1243 (prospective database).
All patients
pyp-Stage II-III
Stage?
pyp-Stage 0-I-IV
pyp-stage Unknown
Surgery?
Surgery
No surgery
Treatment after surgery?
Adjuvant chemo(radio)therapy
Chemotherapy within
12 weeks after surgery?
Chemotherapy within 12weeks after surgery
Chemotherapy after morethan 12 weeks after surgery
Date chemotherapy and/or surgery not known
N=1071
N=18
N=3
91,67%N=33
N=54
N=0
N=181
N=321
N=569
Type of resection?
R0 resection
R1 resectionR2 resection
Uncertain
Type of resectionMISSING
N=64
N=569
Adjuvant radiotherapy only
Adjuvant treatment chemotherapy=MISSING
No adjuvant treatment
N=178
N=0
N=492
N=13
N=260
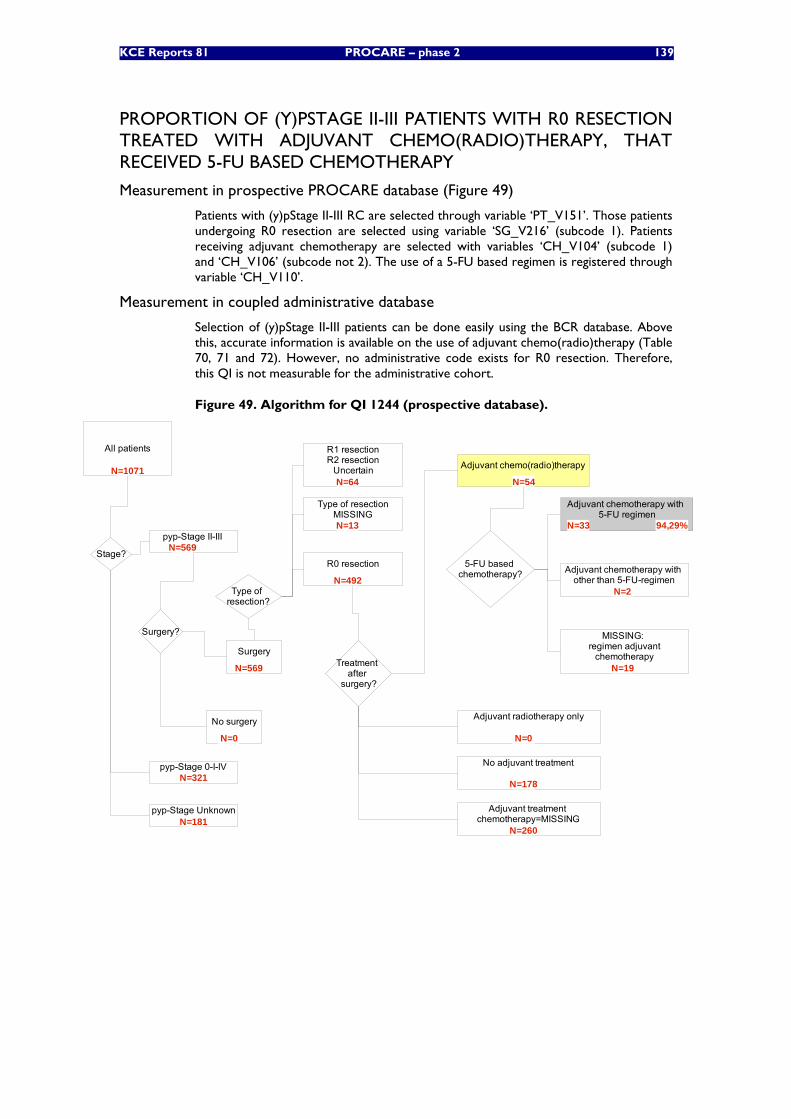
KCE Reports 81 PROCARE – phase 2 139
PROPORTION OF (Y)PSTAGE II-III PATIENTS WITH R0 RESECTION TREATED WITH ADJUVANT CHEMO(RADIO)THERAPY, THAT RECEIVED 5-FU BASED CHEMOTHERAPY
Measurement in prospective PROCARE database (Figure 49)
Patients with (y)pStage II-III RC are selected through variable ‘PT_V151’. Those patients undergoing R0 resection are selected using variable ‘SG_V216’ (subcode 1). Patients receiving adjuvant chemotherapy are selected with variables ‘CH_V104’ (subcode 1) and ‘CH_V106’ (subcode not 2). The use of a 5-FU based regimen is registered through variable ‘CH_V110’.
Measurement in coupled administrative database
Selection of (y)pStage II-III patients can be done easily using the BCR database. Above this, accurate information is available on the use of adjuvant chemo(radio)therapy (Table 70, 71 and 72). However, no administrative code exists for R0 resection. Therefore, this QI is not measurable for the administrative cohort.
Figure 49. Algorithm for QI 1244 (prospective database).
All patients
pyp-Stage II-III
Stage?
pyp-Stage 0-I-IV
pyp-Stage Unknown
Surgery?
Surgery
No surgery
Treatment after
surgery?
Adjuvant chemo(radio)therapy
5-FU based chemotherapy?
Adjuvant chemotherapy with 5-FU regimen
Adjuvant chemotherapy with other than 5-FU-regimen
MISSING: regimen adjuvant
chemotherapy
N=1071
N=19
N=2
N=33
N=569
N=321
N=181
N=569
N=0
N=54
94,29%
Type of resection?
R0 resection
R1 resectionR2 resection
Uncertain
Type of resectionMISSING
N=64
N=492
N=13
Adjuvant radiotherapy only
Adjuvant treatment chemotherapy=MISSING
No adjuvant treatment
N=178
N=0
N=260
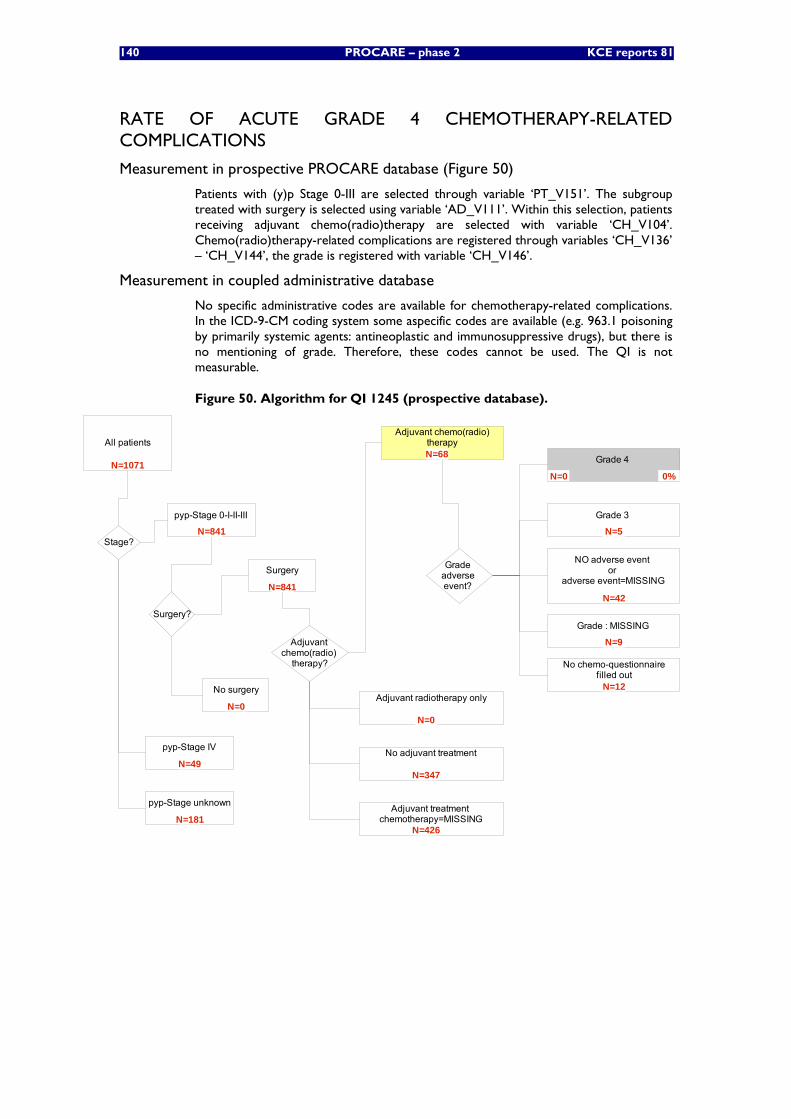
140 PROCARE – phase 2 KCE reports 81
RATE OF ACUTE GRADE 4 CHEMOTHERAPY-RELATED COMPLICATIONS
Measurement in prospective PROCARE database (Figure 50)
Patients with (y)p Stage 0-III are selected through variable ‘PT_V151’. The subgroup treated with surgery is selected using variable ‘AD_V111’. Within this selection, patients receiving adjuvant chemo(radio)therapy are selected with variable ‘CH_V104’. Chemo(radio)therapy-related complications are registered through variables ‘CH_V136’ – ‘CH_V144’, the grade is registered with variable ‘CH_V146’.
Measurement in coupled administrative database
No specific administrative codes are available for chemotherapy-related complications. In the ICD-9-CM coding system some aspecific codes are available (e.g. 963.1 poisoning by primarily systemic agents: antineoplastic and immunosuppressive drugs), but there is no mentioning of grade. Therefore, these codes cannot be used. The QI is not measurable.
Figure 50. Algorithm for QI 1245 (prospective database).
All patients
Surgery
No surgery
Adjuvant chemo(radio)
therapy?
Surgery?
Adjuvant chemo(radio)therapy
Grade adverse event?
Grade 4
Grade 3
Grade : MISSING
NO adverse event or
adverse event=MISSING
0%
N=42
N=5
N=0
N=68
N=0
N=841
N=1071
Stage?
pyp-Stage unknown
pyp-Stage IV
pyp-Stage 0-I-II-III
N=181
N=49
N=841
N=9
N=724
Adjuvant radiotherapy only
Adjuvant treatment chemotherapy=MISSING
No adjuvant treatment
N=347
N=0
N=426
No chemo-questionnairefilled out
N=12
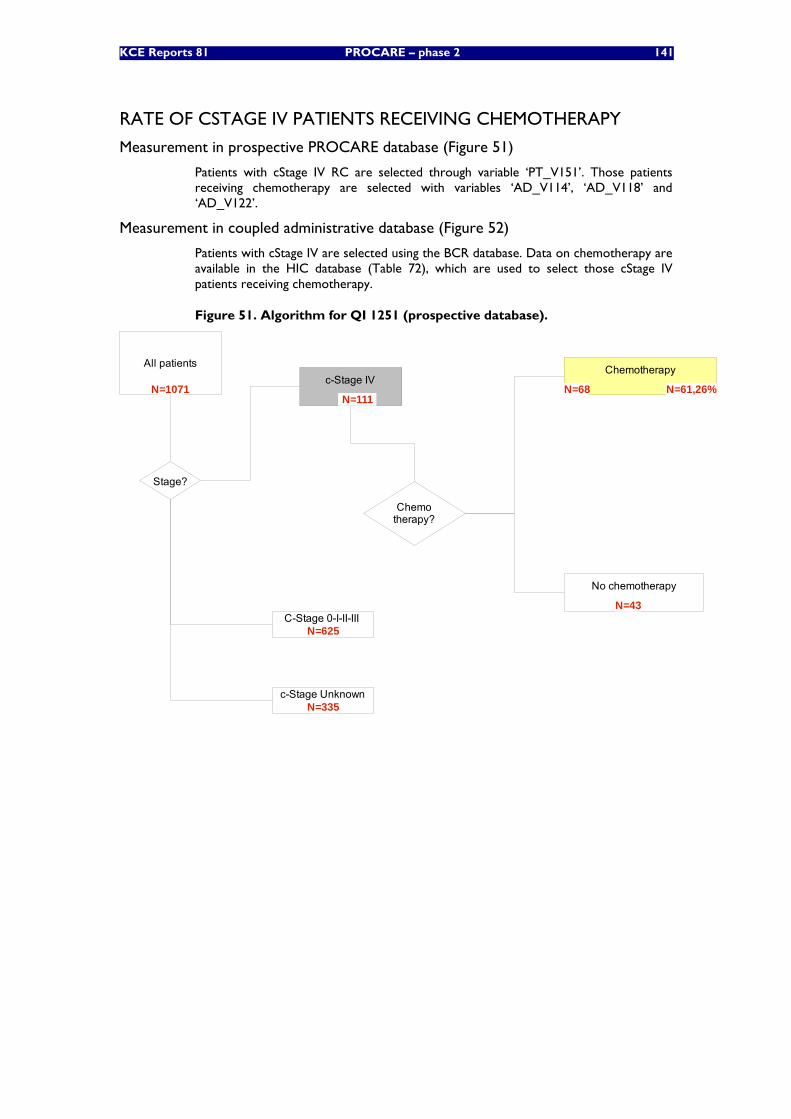
KCE Reports 81 PROCARE – phase 2 141
RATE OF CSTAGE IV PATIENTS RECEIVING CHEMOTHERAPY
Measurement in prospective PROCARE database (Figure 51)
Patients with cStage IV RC are selected through variable ‘PT_V151’. Those patients receiving chemotherapy are selected with variables ‘AD_V114’, ‘AD_V118’ and ‘AD_V122’.
Measurement in coupled administrative database (Figure 52)
Patients with cStage IV are selected using the BCR database. Data on chemotherapy are available in the HIC database (Table 72), which are used to select those cStage IV patients receiving chemotherapy.
Figure 51. Algorithm for QI 1251 (prospective database).
All patientsc-Stage IV
C-Stage 0-I-II-III
c-Stage Unknown
Chemotherapy?
Stage?
Chemotherapy
No chemotherapy
N=1071
N=43
N=68
N=335
N=625
N=111N=61,26%
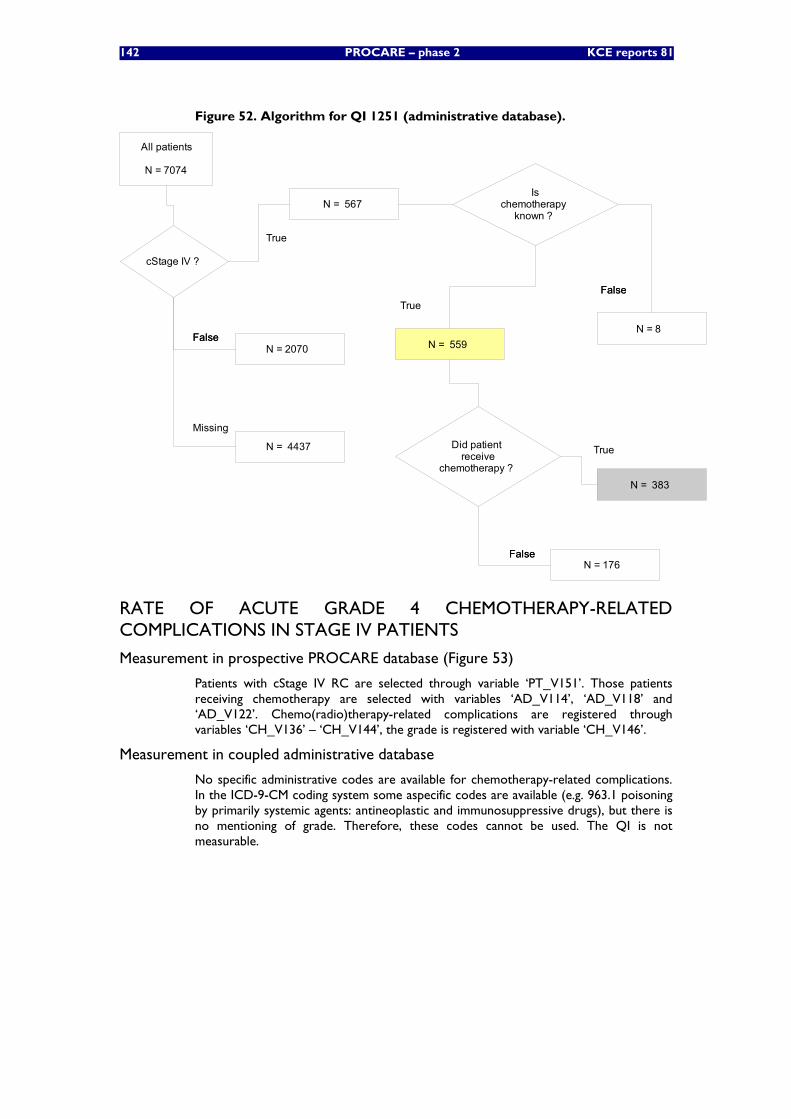
142 PROCARE – phase 2 KCE reports 81
Figure 52. Algorithm for QI 1251 (administrative database).
All patients
N = 7074
cStage IV ?
FalseFalse
N = 4437
Missing
N = 2070
Did patient receive
chemotherapy ?
FalseFalse
True
N = 383
N = 176
True
N = 567 Is
chemotherapy known ?
True
N = 559
FalseFalse
N = 8
RATE OF ACUTE GRADE 4 CHEMOTHERAPY-RELATED COMPLICATIONS IN STAGE IV PATIENTS
Measurement in prospective PROCARE database (Figure 53)
Patients with cStage IV RC are selected through variable ‘PT_V151’. Those patients receiving chemotherapy are selected with variables ‘AD_V114’, ‘AD_V118’ and ‘AD_V122’. Chemo(radio)therapy-related complications are registered through variables ‘CH_V136’ – ‘CH_V144’, the grade is registered with variable ‘CH_V146’.
Measurement in coupled administrative database
No specific administrative codes are available for chemotherapy-related complications. In the ICD-9-CM coding system some aspecific codes are available (e.g. 963.1 poisoning by primarily systemic agents: antineoplastic and immunosuppressive drugs), but there is no mentioning of grade. Therefore, these codes cannot be used. The QI is not measurable.
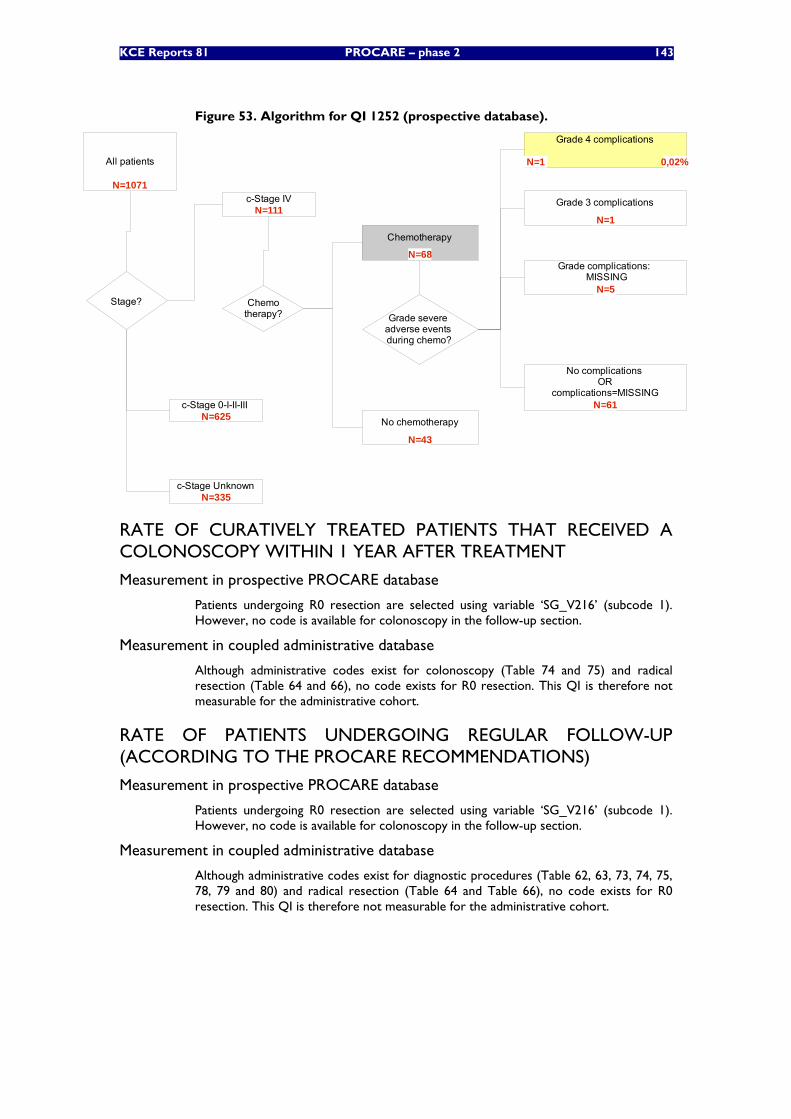
KCE Reports 81 PROCARE – phase 2 143
Figure 53. Algorithm for QI 1252 (prospective database).
All patients
c-Stage IV
c-Stage 0-I-II-III
c-Stage Unknown
Grade severe adverse events during chemo?
Stage?
Grade 4 complications
Grade 3 complications
Grade complications: MISSING
No complications OR
complications=MISSING
Chemotherapy?
Chemotherapy
No chemotherapy
N=1071
0,02%
N=61
N=5
N=1
N=1
N=43
N=68
N=335
N=625
N=111
RATE OF CURATIVELY TREATED PATIENTS THAT RECEIVED A COLONOSCOPY WITHIN 1 YEAR AFTER TREATMENT
Measurement in prospective PROCARE database
Patients undergoing R0 resection are selected using variable ‘SG_V216’ (subcode 1). However, no code is available for colonoscopy in the follow-up section.
Measurement in coupled administrative database
Although administrative codes exist for colonoscopy (Table 74 and 75) and radical resection (Table 64 and 66), no code exists for R0 resection. This QI is therefore not measurable for the administrative cohort.
RATE OF PATIENTS UNDERGOING REGULAR FOLLOW-UP (ACCORDING TO THE PROCARE RECOMMENDATIONS)
Measurement in prospective PROCARE database
Patients undergoing R0 resection are selected using variable ‘SG_V216’ (subcode 1). However, no code is available for colonoscopy in the follow-up section.
Measurement in coupled administrative database
Although administrative codes exist for diagnostic procedures (Table 62, 63, 73, 74, 75, 78, 79 and 80) and radical resection (Table 64 and Table 66), no code exists for R0 resection. This QI is therefore not measurable for the administrative cohort.
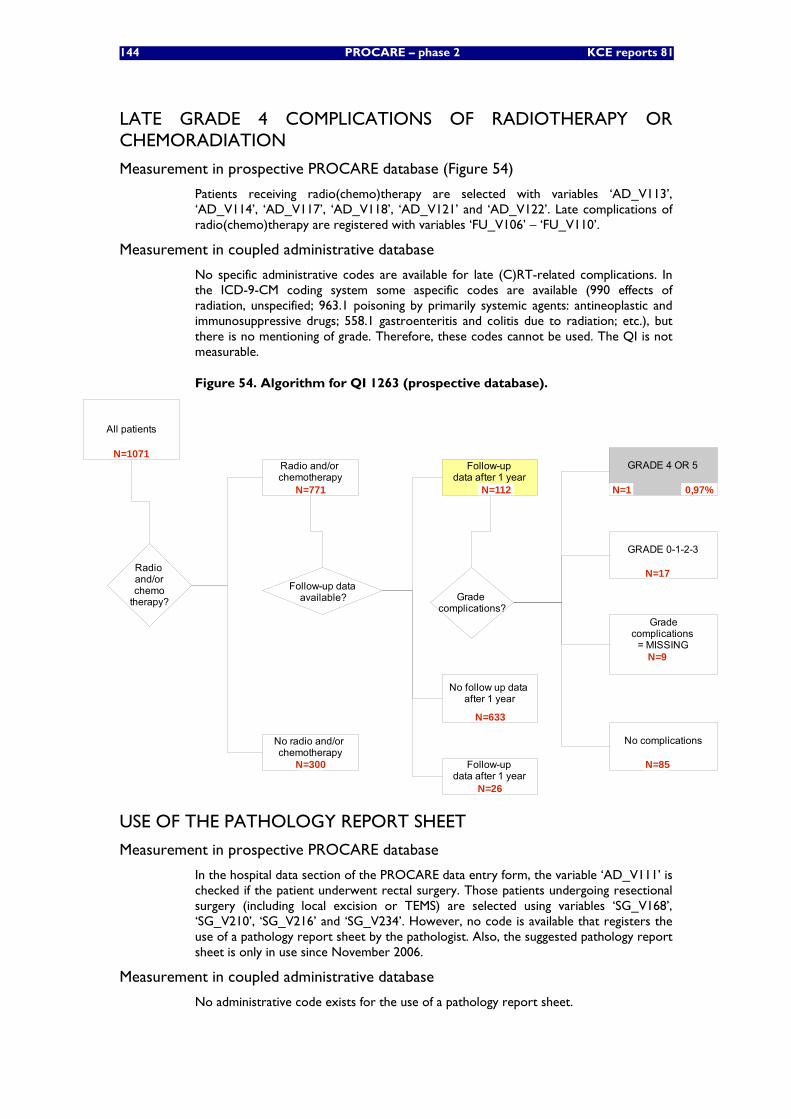
144 PROCARE – phase 2 KCE reports 81
LATE GRADE 4 COMPLICATIONS OF RADIOTHERAPY OR CHEMORADIATION
Measurement in prospective PROCARE database (Figure 54)
Patients receiving radio(chemo)therapy are selected with variables ‘AD_V113’, ‘AD_V114’, ‘AD_V117’, ‘AD_V118’, ‘AD_V121’ and ‘AD_V122’. Late complications of radio(chemo)therapy are registered with variables ‘FU_V106’ – ‘FU_V110’.
Measurement in coupled administrative database
No specific administrative codes are available for late (C)RT-related complications. In the ICD-9-CM coding system some aspecific codes are available (990 effects of radiation, unspecified; 963.1 poisoning by primarily systemic agents: antineoplastic and immunosuppressive drugs; 558.1 gastroenteritis and colitis due to radiation; etc.), but there is no mentioning of grade. Therefore, these codes cannot be used. The QI is not measurable.
Figure 54. Algorithm for QI 1263 (prospective database).
All patients
No radio and/or chemotherapy
Radio and/or chemotherapy
Radio and/orchemo
therapy?
No follow up data after 1 year
Follow-up dataavailable?
Follow-up data after 1 year
GRADE 4 OR 5
Gradecomplications
= MISSING
No complications
GRADE 0-1-2-3
Grade complications?
N=1071
N=85
N=9
N=17
N=1
N=633
N=112
N=300
N=771 0,97%
Follow-up data after 1 year
N=26
USE OF THE PATHOLOGY REPORT SHEET
Measurement in prospective PROCARE database
In the hospital data section of the PROCARE data entry form, the variable ‘AD_V111’ is checked if the patient underwent rectal surgery. Those patients undergoing resectional surgery (including local excision or TEMS) are selected using variables ‘SG_V168’, ‘SG_V210’, ‘SG_V216’ and ‘SG_V234’. However, no code is available that registers the use of a pathology report sheet by the pathologist. Also, the suggested pathology report sheet is only in use since November 2006.
Measurement in coupled administrative database
No administrative code exists for the use of a pathology report sheet.
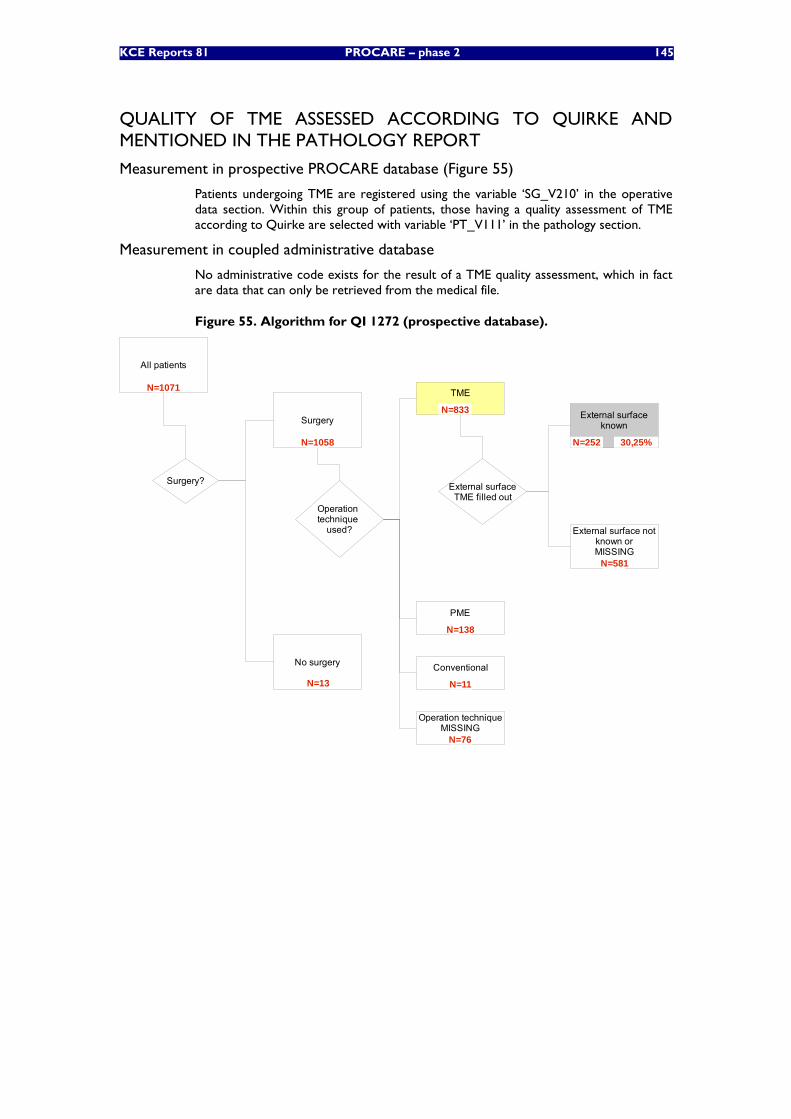
KCE Reports 81 PROCARE – phase 2 145
QUALITY OF TME ASSESSED ACCORDING TO QUIRKE AND MENTIONED IN THE PATHOLOGY REPORT
Measurement in prospective PROCARE database (Figure 55)
Patients undergoing TME are registered using the variable ‘SG_V210’ in the operative data section. Within this group of patients, those having a quality assessment of TME according to Quirke are selected with variable ‘PT_V111’ in the pathology section.
Measurement in coupled administrative database
No administrative code exists for the result of a TME quality assessment, which in fact are data that can only be retrieved from the medical file.
Figure 55. Algorithm for QI 1272 (prospective database).
All patients
Operation technique
used?
Surgery?
Surgery
No surgery
N=1071
N=13
N=1058
TME
PME
Operation techniqueMISSING
Conventional
N=833
N=138
N=11
N=76
External surfaceTME filled out
External surfaceknown
External surface notknown orMISSING
N=581
30,25%N=252
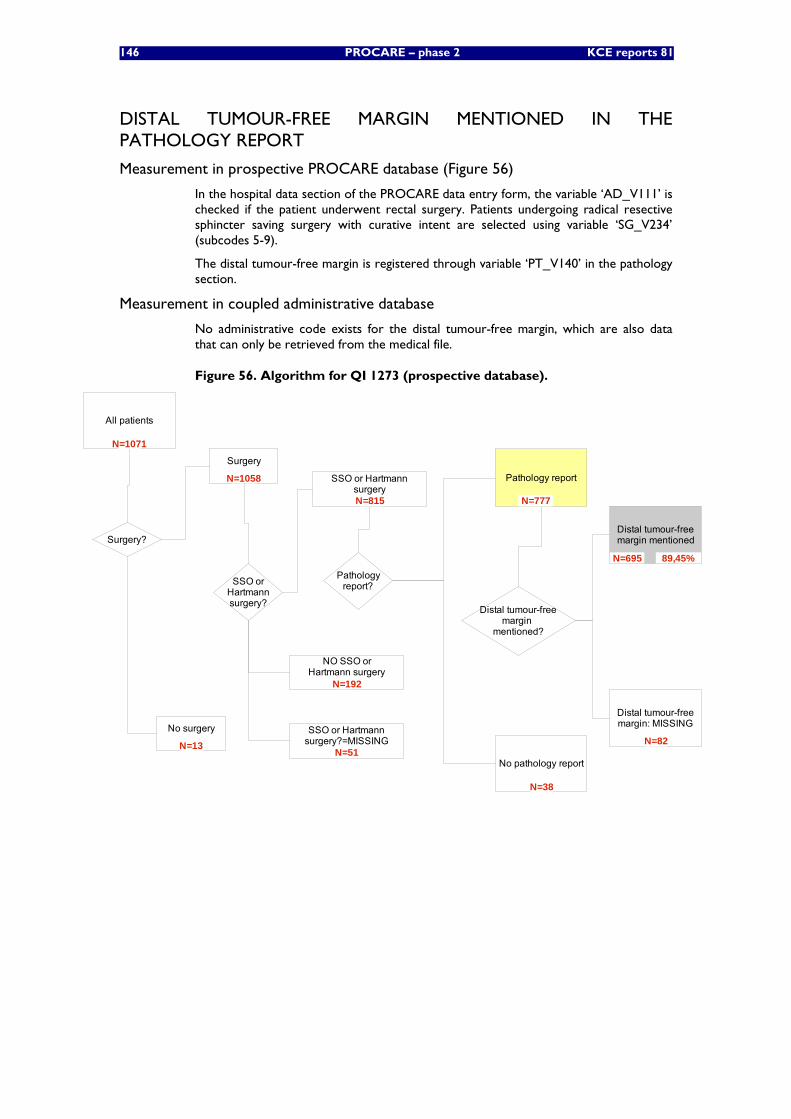
146 PROCARE – phase 2 KCE reports 81
DISTAL TUMOUR-FREE MARGIN MENTIONED IN THE PATHOLOGY REPORT
Measurement in prospective PROCARE database (Figure 56)
In the hospital data section of the PROCARE data entry form, the variable ‘AD_V111’ is checked if the patient underwent rectal surgery. Patients undergoing radical resective sphincter saving surgery with curative intent are selected using variable ‘SG_V234’ (subcodes 5-9).
The distal tumour-free margin is registered through variable ‘PT_V140’ in the pathology section.
Measurement in coupled administrative database
No administrative code exists for the distal tumour-free margin, which are also data that can only be retrieved from the medical file.
Figure 56. Algorithm for QI 1273 (prospective database).
All patients
Pathologyreport?
Pathology report
No pathology report
Surgery?
Surgery
No surgery
Distal tumour-freemargin
mentioned?
Distal tumour-freemargin mentioned
Distal tumour-freemargin: MISSING
SSO orHartmannsurgery?
NO SSO orHartmann surgery
SSO or Hartmannsurgery
SSO or Hartmannsurgery?=MISSING N=82
N=695
N=38
N=777
N=51
N=192
N=815
N=13
N=1058
N=1071
89,45%
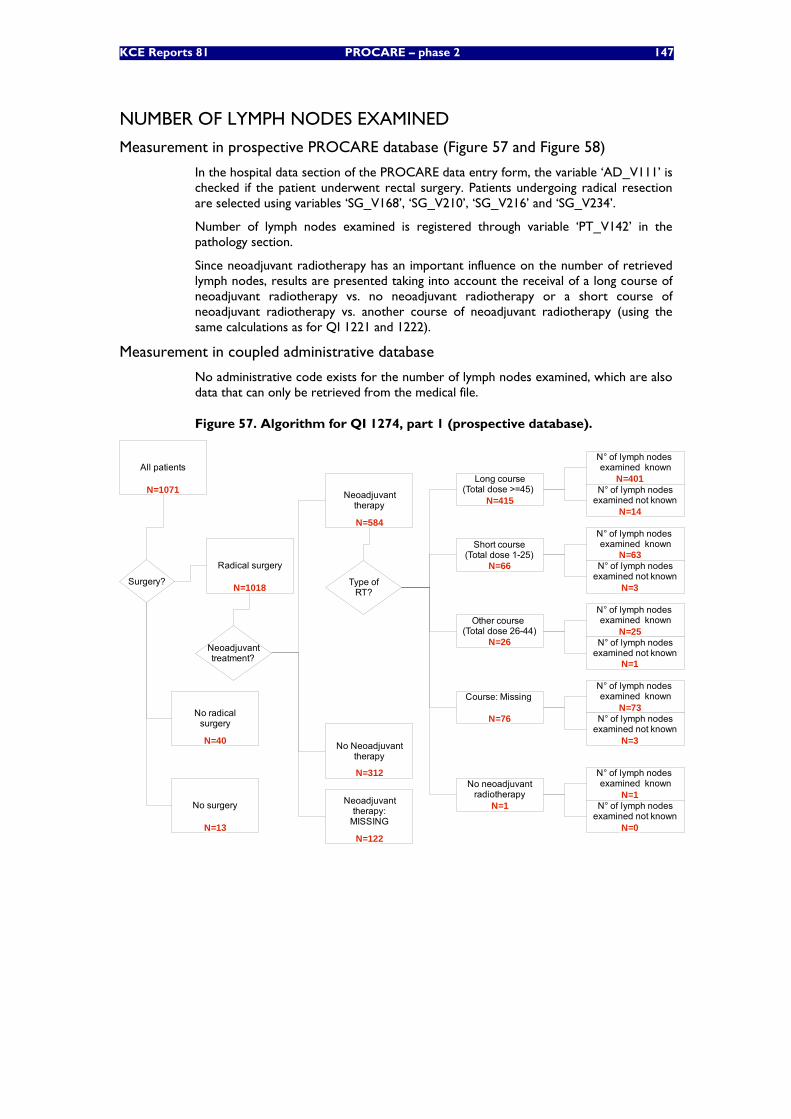
KCE Reports 81 PROCARE – phase 2 147
NUMBER OF LYMPH NODES EXAMINED
Measurement in prospective PROCARE database (Figure 57 and Figure 58)
In the hospital data section of the PROCARE data entry form, the variable ‘AD_V111’ is checked if the patient underwent rectal surgery. Patients undergoing radical resection are selected using variables ‘SG_V168’, ‘SG_V210’, ‘SG_V216’ and ‘SG_V234’.
Number of lymph nodes examined is registered through variable ‘PT_V142’ in the pathology section.
Since neoadjuvant radiotherapy has an important influence on the number of retrieved lymph nodes, results are presented taking into account the receival of a long course of neoadjuvant radiotherapy vs. no neoadjuvant radiotherapy or a short course of neoadjuvant radiotherapy vs. another course of neoadjuvant radiotherapy (using the same calculations as for QI 1221 and 1222).
Measurement in coupled administrative database
No administrative code exists for the number of lymph nodes examined, which are also data that can only be retrieved from the medical file.
Figure 57. Algorithm for QI 1274, part 1 (prospective database).
All patients
Surgery?
Radical surgery
No radicalsurgery
Neoadjuvanttherapy
No Neoadjuvanttherapy
Neoadjuvanttherapy:
MISSING
Neoadjuvanttreatment?
Long course(Total dose >=45)
Other course (Total dose 26-44)
Short course(Total dose 1-25)
Type ofRT?
N=1071
N=66
N=26
N=415
N=122
N=312
N=584
N=40
N=1018
No surgery
N=13
N° of lymph nodes examined known
N° of lymph nodesexamined not known
Course: Missing
No neoadjuvantradiotherapy
N° of lymph nodes examined known
N° of lymph nodesexamined not known
N=4
N=76
N° of lymph nodes examined known
N° of lymph nodesexamined not known
N=3
N° of lymph nodes examined known
N° of lymph nodesexamined not known
N=0
N=1
N° of lymph nodes examined known
N° of lymph nodesexamined not known
N=14
N=401
N=3
N=25
N=1
N=73
N=1
N=63
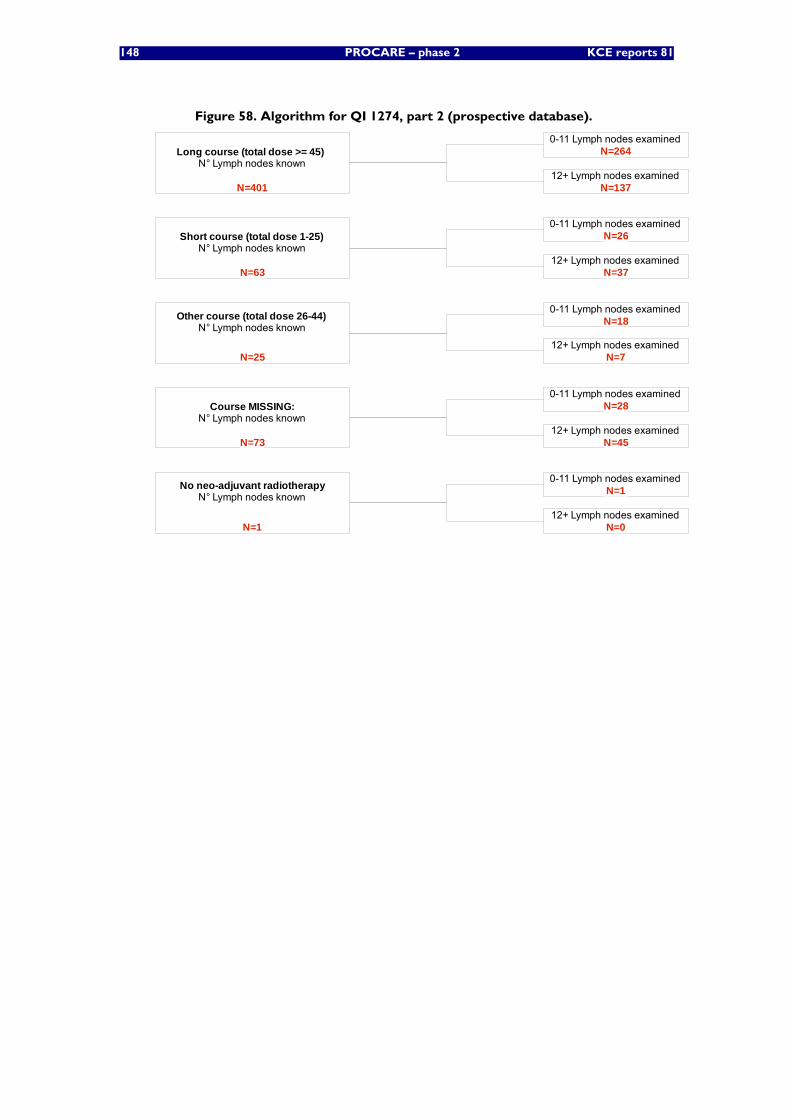
148 PROCARE – phase 2 KCE reports 81
Figure 58. Algorithm for QI 1274, part 2 (prospective database).
Long course (total dose >= 45) N° Lymph nodes known
Course MISSING:N° Lymph nodes known
Other course (total dose 26-44)N° Lymph nodes known
Short course (total dose 1-25)N° Lymph nodes known
N=25
N=63
N=401
N=73
0-11 Lymph nodes examined
0-11 Lymph nodes examined
12+ Lymph nodes examined
0-11 Lymph nodes examined
12+ Lymph nodes examined
0-11 Lymph nodes examined
12+ Lymph nodes examined
12+ Lymph nodes examinedN=45
N=28
N=7
N=18
N=37
N=26
N=137
N=264
No neo-adjuvant radiotherapyN° Lymph nodes known
0-11 Lymph nodes examined
12+ Lymph nodes examinedN=0
N=1
N=1

KCE Reports 81 PROCARE – phase 2 149
(Y)PCRM MENTIONED IN MM IN THE PATHOLOGY REPORT
Measurement in prospective PROCARE database (Figure 59)
In the hospital data section of the PROCARE data entry form, the variable ‘AD_V111’ is checked if the patient underwent rectal surgery. Patients undergoing radical resection (not local) are selected using variables ‘SG_V168’, ‘SG_V210’, ‘SG_V216’ and ‘SG_V234’.
The (y)pCRM is registered through variable ‘PT_V141’ in the pathology section.
Measurement in coupled administrative database
No administrative code exists for the (y)pCRM, which are also data that can only be retrieved from the medical file.
Figure 59. Algorithm for QI 1275 (prospective database).
All patients
Pathologyreport?
Pathology report
No pathology report
Surgery?
Surgery
No surgery
(y)pCRM mentioned?
(y)pCRM mentioned
(y)pCRM: MISSING
Radicalsurgery?
Radical surgery
No radical sugery
N=1058
N=13
N=40
N=1071
N=262
72,93%N=706
N=50
N=968
N=1018
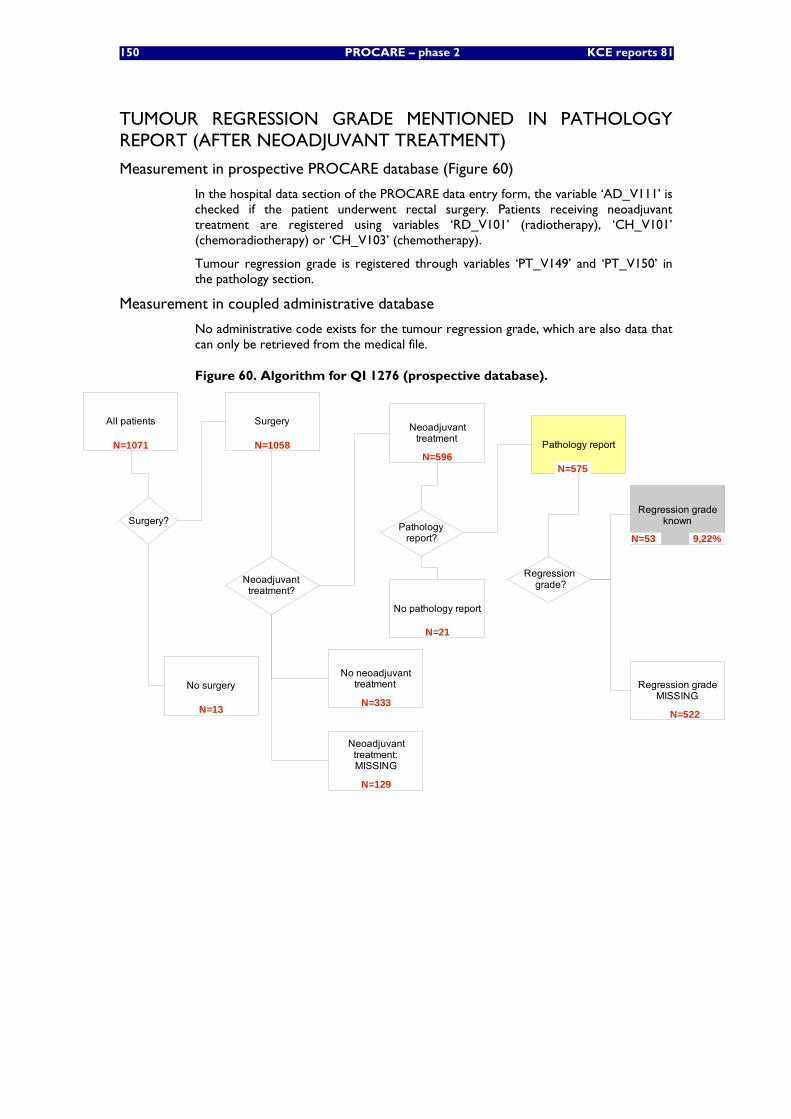
150 PROCARE – phase 2 KCE reports 81
TUMOUR REGRESSION GRADE MENTIONED IN PATHOLOGY REPORT (AFTER NEOADJUVANT TREATMENT)
Measurement in prospective PROCARE database (Figure 60)
In the hospital data section of the PROCARE data entry form, the variable ‘AD_V111’ is checked if the patient underwent rectal surgery. Patients receiving neoadjuvant treatment are registered using variables ‘RD_V101’ (radiotherapy), ‘CH_V101’ (chemoradiotherapy) or ‘CH_V103’ (chemotherapy).
Tumour regression grade is registered through variables ‘PT_V149’ and ‘PT_V150’ in the pathology section.
Measurement in coupled administrative database
No administrative code exists for the tumour regression grade, which are also data that can only be retrieved from the medical file.
Figure 60. Algorithm for QI 1276 (prospective database).
All patients
Neoadjuvant treatment?
Pathology report
No pathology report
Surgery?
Surgery
No surgery
Regression grade?
Neoadjuvanttreatment
No neoadjuvanttreatment
Neoadjuvanttreatment:MISSING
Pathology report?
Regression gradeknown
Regression gradeMISSING
N=1071
9,22%
N=522
N=53
N=21
N=575
N=129
N=333
N=596
N=13
N=1058
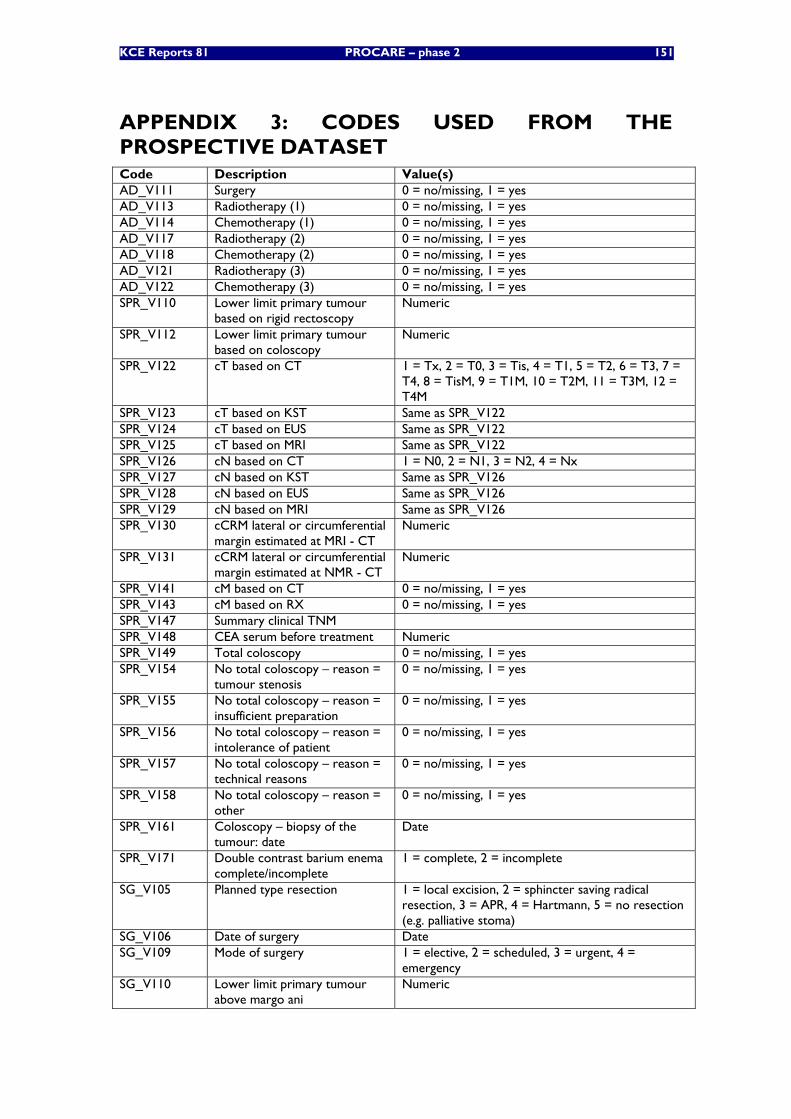
KCE Reports 81 PROCARE – phase 2 151
APPENDIX 3: CODES USED FROM THE PROSPECTIVE DATASET Code Description Value(s) AD_V111 Surgery 0 = no/missing, 1 = yes AD_V113 Radiotherapy (1) 0 = no/missing, 1 = yes AD_V114 Chemotherapy (1) 0 = no/missing, 1 = yes AD_V117 Radiotherapy (2) 0 = no/missing, 1 = yes AD_V118 Chemotherapy (2) 0 = no/missing, 1 = yes AD_V121 Radiotherapy (3) 0 = no/missing, 1 = yes AD_V122 Chemotherapy (3) 0 = no/missing, 1 = yes SPR_V110 Lower limit primary tumour
based on rigid rectoscopy Numeric
SPR_V112 Lower limit primary tumour based on coloscopy
Numeric
SPR_V122 cT based on CT 1 = Tx, 2 = T0, 3 = Tis, 4 = T1, 5 = T2, 6 = T3, 7 = T4, 8 = TisM, 9 = T1M, 10 = T2M, 11 = T3M, 12 = T4M
SPR_V123 cT based on KST Same as SPR_V122 SPR_V124 cT based on EUS Same as SPR_V122 SPR_V125 cT based on MRI Same as SPR_V122 SPR_V126 cN based on CT 1 = N0, 2 = N1, 3 = N2, 4 = Nx SPR_V127 cN based on KST Same as SPR_V126 SPR_V128 cN based on EUS Same as SPR_V126 SPR_V129 cN based on MRI Same as SPR_V126 SPR_V130 cCRM lateral or circumferential
margin estimated at MRI - CT Numeric
SPR_V131 cCRM lateral or circumferential margin estimated at NMR - CT
Numeric
SPR_V141 cM based on CT 0 = no/missing, 1 = yes SPR_V143 cM based on RX 0 = no/missing, 1 = yes SPR_V147 Summary clinical TNM SPR_V148 CEA serum before treatment Numeric SPR_V149 Total coloscopy 0 = no/missing, 1 = yes SPR_V154 No total coloscopy – reason =
tumour stenosis 0 = no/missing, 1 = yes
SPR_V155 No total coloscopy – reason = insufficient preparation
0 = no/missing, 1 = yes
SPR_V156 No total coloscopy – reason = intolerance of patient
0 = no/missing, 1 = yes
SPR_V157 No total coloscopy – reason = technical reasons
0 = no/missing, 1 = yes
SPR_V158 No total coloscopy – reason = other
0 = no/missing, 1 = yes
SPR_V161 Coloscopy – biopsy of the tumour: date
Date
SPR_V171 Double contrast barium enema complete/incomplete
1 = complete, 2 = incomplete
SG_V105 Planned type resection 1 = local excision, 2 = sphincter saving radical resection, 3 = APR, 4 = Hartmann, 5 = no resection (e.g. palliative stoma)
SG_V106 Date of surgery Date SG_V109 Mode of surgery 1 = elective, 2 = scheduled, 3 = urgent, 4 =
emergency SG_V110 Lower limit primary tumour
above margo ani Numeric
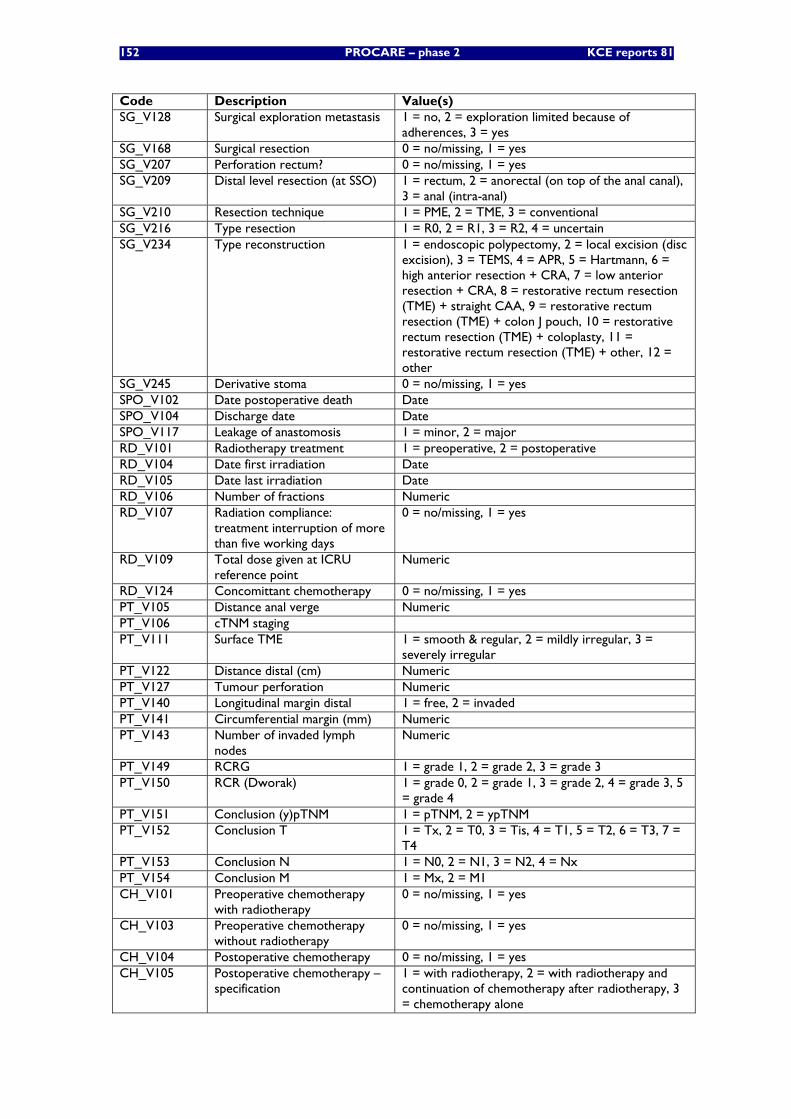
152 PROCARE – phase 2 KCE reports 81
Code Description Value(s) SG_V128 Surgical exploration metastasis 1 = no, 2 = exploration limited because of
adherences, 3 = yes SG_V168 Surgical resection 0 = no/missing, 1 = yes SG_V207 Perforation rectum? 0 = no/missing, 1 = yes SG_V209 Distal level resection (at SSO) 1 = rectum, 2 = anorectal (on top of the anal canal),
3 = anal (intra-anal) SG_V210 Resection technique 1 = PME, 2 = TME, 3 = conventional SG_V216 Type resection 1 = R0, 2 = R1, 3 = R2, 4 = uncertain SG_V234 Type reconstruction 1 = endoscopic polypectomy, 2 = local excision (disc
excision), 3 = TEMS, 4 = APR, 5 = Hartmann, 6 = high anterior resection + CRA, 7 = low anterior resection + CRA, 8 = restorative rectum resection (TME) + straight CAA, 9 = restorative rectum resection (TME) + colon J pouch, 10 = restorative rectum resection (TME) + coloplasty, 11 = restorative rectum resection (TME) + other, 12 = other
SG_V245 Derivative stoma 0 = no/missing, 1 = yes SPO_V102 Date postoperative death Date SPO_V104 Discharge date Date SPO_V117 Leakage of anastomosis 1 = minor, 2 = major RD_V101 Radiotherapy treatment 1 = preoperative, 2 = postoperative RD_V104 Date first irradiation Date RD_V105 Date last irradiation Date RD_V106 Number of fractions Numeric RD_V107 Radiation compliance:
treatment interruption of more than five working days
0 = no/missing, 1 = yes
RD_V109 Total dose given at ICRU reference point
Numeric
RD_V124 Concomittant chemotherapy 0 = no/missing, 1 = yes PT_V105 Distance anal verge Numeric PT_V106 cTNM staging PT_V111 Surface TME 1 = smooth & regular, 2 = mildly irregular, 3 =
severely irregular PT_V122 Distance distal (cm) Numeric PT_V127 Tumour perforation Numeric PT_V140 Longitudinal margin distal 1 = free, 2 = invaded PT_V141 Circumferential margin (mm) Numeric PT_V143 Number of invaded lymph
nodes Numeric
PT_V149 RCRG 1 = grade 1, 2 = grade 2, 3 = grade 3 PT_V150 RCR (Dworak) 1 = grade 0, 2 = grade 1, 3 = grade 2, 4 = grade 3, 5
= grade 4 PT_V151 Conclusion (y)pTNM 1 = pTNM, 2 = ypTNM PT_V152 Conclusion T 1 = Tx, 2 = T0, 3 = Tis, 4 = T1, 5 = T2, 6 = T3, 7 =
T4 PT_V153 Conclusion N 1 = N0, 2 = N1, 3 = N2, 4 = Nx PT_V154 Conclusion M 1 = Mx, 2 = M1 CH_V101 Preoperative chemotherapy
with radiotherapy 0 = no/missing, 1 = yes
CH_V103 Preoperative chemotherapy without radiotherapy
0 = no/missing, 1 = yes
CH_V104 Postoperative chemotherapy 0 = no/missing, 1 = yes CH_V105 Postoperative chemotherapy –
specification 1 = with radiotherapy, 2 = with radiotherapy and continuation of chemotherapy after radiotherapy, 3 = chemotherapy alone
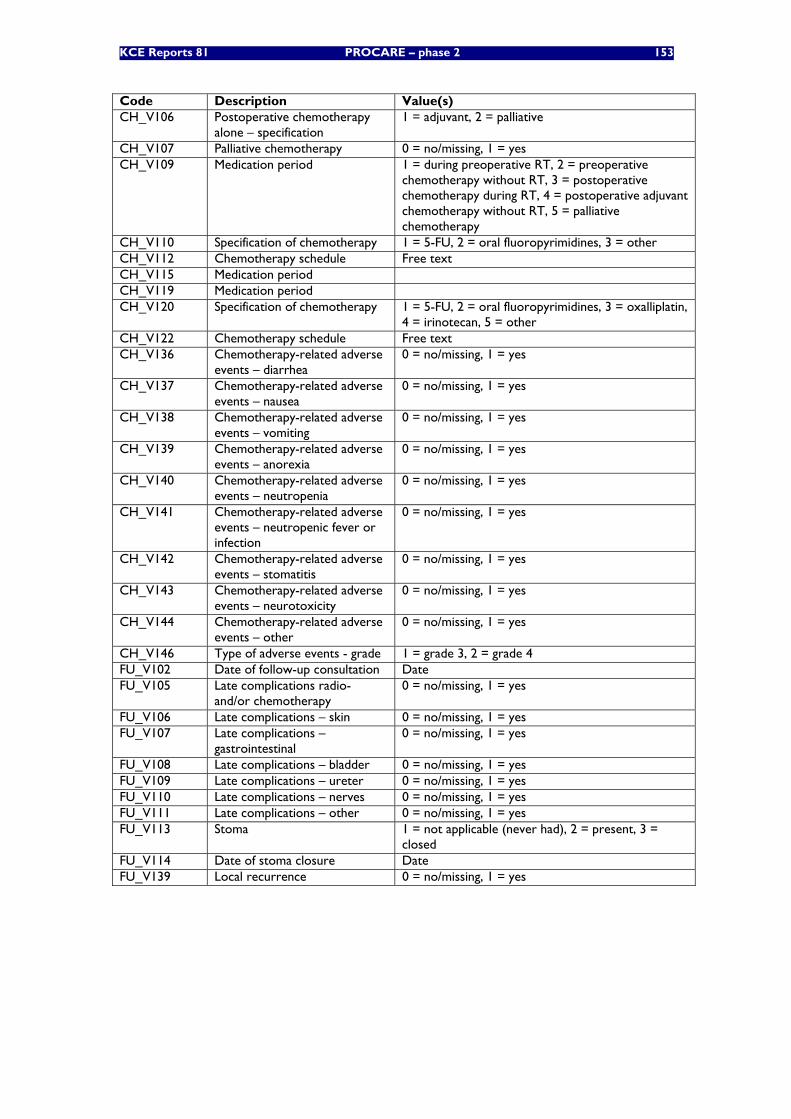
KCE Reports 81 PROCARE – phase 2 153
Code Description Value(s) CH_V106 Postoperative chemotherapy
alone – specification 1 = adjuvant, 2 = palliative
CH_V107 Palliative chemotherapy 0 = no/missing, 1 = yes CH_V109 Medication period 1 = during preoperative RT, 2 = preoperative
chemotherapy without RT, 3 = postoperative chemotherapy during RT, 4 = postoperative adjuvant chemotherapy without RT, 5 = palliative chemotherapy
CH_V110 Specification of chemotherapy 1 = 5-FU, 2 = oral fluoropyrimidines, 3 = other CH_V112 Chemotherapy schedule Free text CH_V115 Medication period CH_V119 Medication period CH_V120 Specification of chemotherapy 1 = 5-FU, 2 = oral fluoropyrimidines, 3 = oxalliplatin,
4 = irinotecan, 5 = other CH_V122 Chemotherapy schedule Free text CH_V136 Chemotherapy-related adverse
events – diarrhea 0 = no/missing, 1 = yes
CH_V137 Chemotherapy-related adverse events – nausea
0 = no/missing, 1 = yes
CH_V138 Chemotherapy-related adverse events – vomiting
0 = no/missing, 1 = yes
CH_V139 Chemotherapy-related adverse events – anorexia
0 = no/missing, 1 = yes
CH_V140 Chemotherapy-related adverse events – neutropenia
0 = no/missing, 1 = yes
CH_V141 Chemotherapy-related adverse events – neutropenic fever or infection
0 = no/missing, 1 = yes
CH_V142 Chemotherapy-related adverse events – stomatitis
0 = no/missing, 1 = yes
CH_V143 Chemotherapy-related adverse events – neurotoxicity
0 = no/missing, 1 = yes
CH_V144 Chemotherapy-related adverse events – other
0 = no/missing, 1 = yes
CH_V146 Type of adverse events - grade 1 = grade 3, 2 = grade 4 FU_V102 Date of follow-up consultation Date FU_V105 Late complications radio-
and/or chemotherapy 0 = no/missing, 1 = yes
FU_V106 Late complications – skin 0 = no/missing, 1 = yes FU_V107 Late complications –
gastrointestinal 0 = no/missing, 1 = yes
FU_V108 Late complications – bladder 0 = no/missing, 1 = yes FU_V109 Late complications – ureter 0 = no/missing, 1 = yes FU_V110 Late complications – nerves 0 = no/missing, 1 = yes FU_V111 Late complications – other 0 = no/missing, 1 = yes FU_V113 Stoma 1 = not applicable (never had), 2 = present, 3 =
closed FU_V114 Date of stoma closure Date FU_V139 Local recurrence 0 = no/missing, 1 = yes
154 PROCARE – phase 2 KCE reports 81
APPENDIX 4: GENERAL DEFINITIONS Incidence date
The first known date of the following list is considered the incidence date:
• date of biopsy of the tumour (variable ‘SPR_V161’ in the PROCARE database)
• date of first consultation or hospitalisation for rectal cancer (‘SPR_V102’)
• date of first treatment: surgery, chemotherapy, radiotherapy (‘SG_V106’, ‘CH_V115’ or ‘CH_V125’, ‘RD_V104’
cStage
Clinical stage (cStage) is based on all of the available information obtained before treatment. Thus, it may include information about the tumour obtained by physical examination, radiologic examination, endoscopy, etc.(including laparoscopy and surgical exploration) The cStage is obtained from the clinical TNM (cTNM) using the international Classification of Malignant Tumours (UICC, 6th edition, 2002).
Neoadjuvant treatment
Neoadjuvant treatment refers to treatment (chemotherapy, radiotherapy or a combination of both) given prior to surgery.
pStage
Pathologic stage (pStage) adds additional information gained by examination of the resected specimen and/or biopsies (metastasis) microscopically by a pathologist.
ypStage
If neoadjuvant preoperative chemoradiotherapy or radiotherapy (or both) has been given, the prefix ‘yp’ should be used to indicate that the original pStage may have been modified by therapy.
Adjuvant treatment
Adjuvant treatment refers to treatment (chemotherapy, radiotherapy or a combination of both) given after surgery.
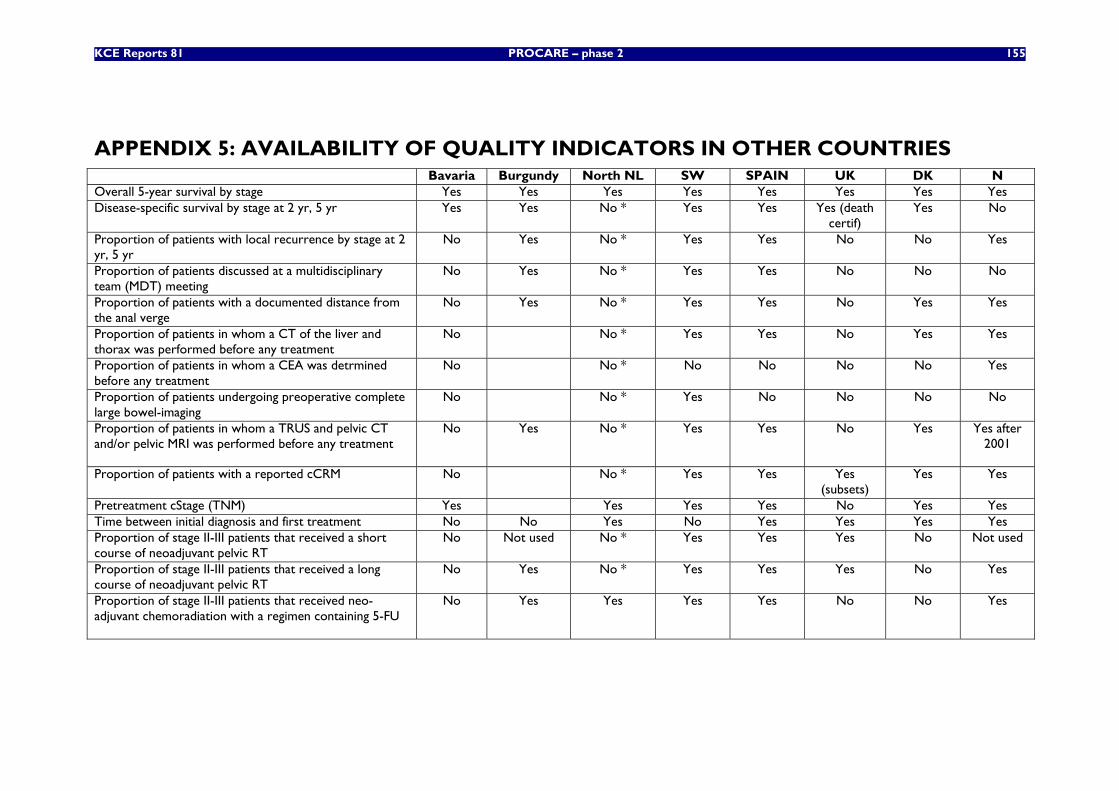
KCE Reports 81 PROCARE – phase 2 155
APPENDIX 5: AVAILABILITY OF QUALITY INDICATORS IN OTHER COUNTRIES Bavaria Burgundy North NL SW SPAIN UK DK N Overall 5-year survival by stage Yes Yes Yes Yes Yes Yes Yes Yes Disease-specific survival by stage at 2 yr, 5 yr Yes Yes No * Yes Yes Yes (death
certif) Yes No
Proportion of patients with local recurrence by stage at 2 yr, 5 yr
No Yes No * Yes Yes No No Yes
Proportion of patients discussed at a multidisciplinary team (MDT) meeting
No Yes No * Yes Yes No No No
Proportion of patients with a documented distance from the anal verge
No Yes No * Yes Yes No Yes Yes
Proportion of patients in whom a CT of the liver and thorax was performed before any treatment
No No * Yes Yes No Yes Yes
Proportion of patients in whom a CEA was detrmined before any treatment
No No * No No No No Yes
Proportion of patients undergoing preoperative complete large bowel-imaging
No No * Yes No No No No
Proportion of patients in whom a TRUS and pelvic CT and/or pelvic MRI was performed before any treatment
No Yes No * Yes Yes No Yes Yes after 2001
Proportion of patients with a reported cCRM No No * Yes Yes Yes (subsets)
Yes Yes
Pretreatment cStage (TNM) Yes Yes Yes Yes No Yes Yes Time between initial diagnosis and first treatment No No Yes No Yes Yes Yes Yes Proportion of stage II-III patients that received a short course of neoadjuvant pelvic RT
No Not used No * Yes Yes Yes No Not used
Proportion of stage II-III patients that received a long course of neoadjuvant pelvic RT
No Yes No * Yes Yes Yes No Yes
Proportion of stage II-III patients that received neo-adjuvant chemoradiation with a regimen containing 5-FU
No Yes Yes Yes Yes No No Yes
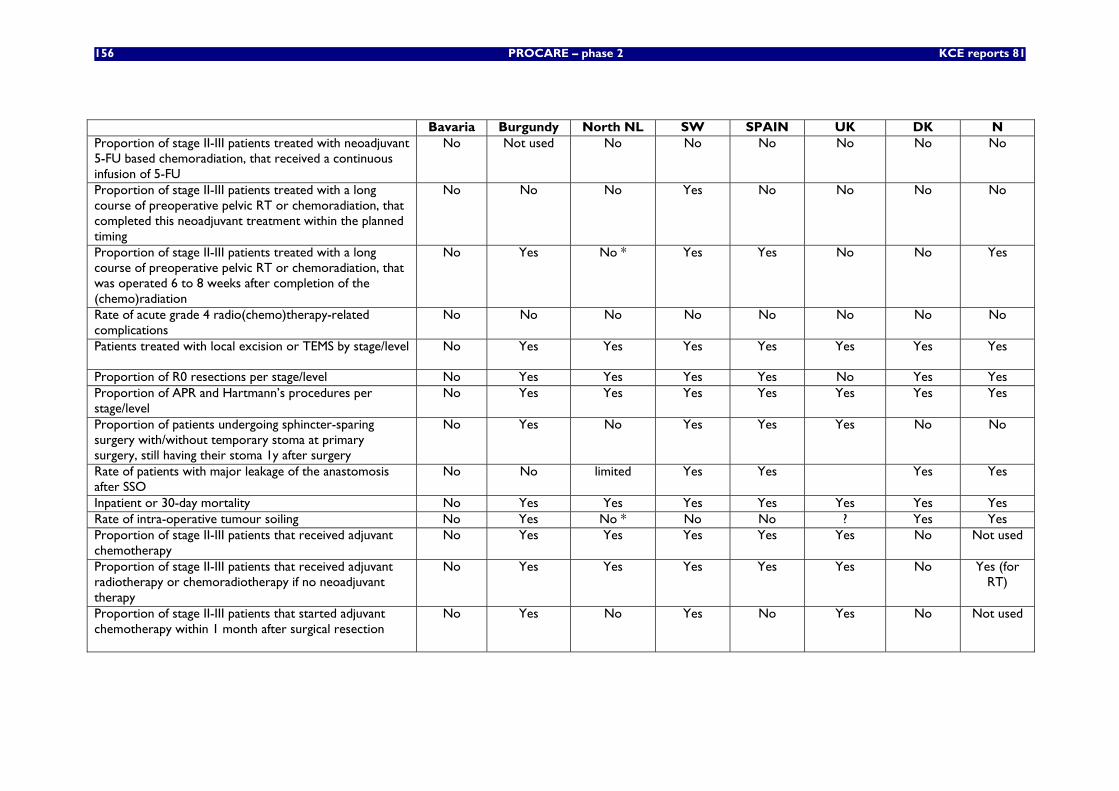
156 PROCARE – phase 2 KCE reports 81
Bavaria Burgundy North NL SW SPAIN UK DK N Proportion of stage II-III patients treated with neoadjuvant 5-FU based chemoradiation, that received a continuous infusion of 5-FU
No Not used No No No No No No
Proportion of stage II-III patients treated with a long course of preoperative pelvic RT or chemoradiation, that completed this neoadjuvant treatment within the planned timing
No No No Yes No No No No
Proportion of stage II-III patients treated with a long course of preoperative pelvic RT or chemoradiation, that was operated 6 to 8 weeks after completion of the (chemo)radiation
No Yes No * Yes Yes No No Yes
Rate of acute grade 4 radio(chemo)therapy-related complications
No No No No No No No No
Patients treated with local excision or TEMS by stage/level No Yes Yes Yes Yes Yes Yes Yes
Proportion of R0 resections per stage/level No Yes Yes Yes Yes No Yes Yes Proportion of APR and Hartmann’s procedures per stage/level
No Yes Yes Yes Yes Yes Yes Yes
Proportion of patients undergoing sphincter-sparing surgery with/without temporary stoma at primary surgery, still having their stoma 1y after surgery
No Yes No Yes Yes Yes No No
Rate of patients with major leakage of the anastomosis after SSO
No No limited Yes Yes Yes Yes
Inpatient or 30-day mortality No Yes Yes Yes Yes Yes Yes Yes Rate of intra-operative tumour soiling No Yes No * No No ? Yes Yes Proportion of stage II-III patients that received adjuvant chemotherapy
No Yes Yes Yes Yes Yes No Not used
Proportion of stage II-III patients that received adjuvant radiotherapy or chemoradiotherapy if no neoadjuvant therapy
No Yes Yes Yes Yes Yes No Yes (for RT)
Proportion of stage II-III patients that started adjuvant chemotherapy within 1 month after surgical resection
No Yes No Yes No Yes No Not used
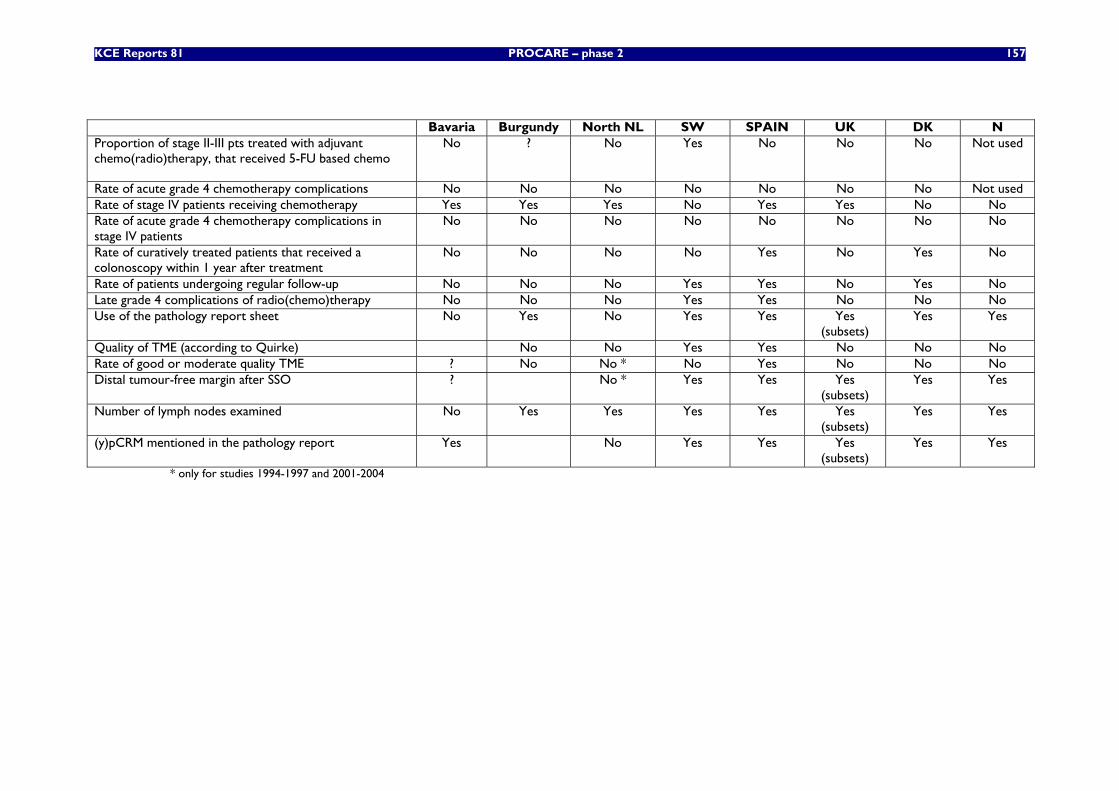
KCE Reports 81 PROCARE – phase 2 157
Bavaria Burgundy North NL SW SPAIN UK DK N Proportion of stage II-III pts treated with adjuvant chemo(radio)therapy, that received 5-FU based chemo
No ? No Yes No No No Not used
Rate of acute grade 4 chemotherapy complications No No No No No No No Not used Rate of stage IV patients receiving chemotherapy Yes Yes Yes No Yes Yes No No Rate of acute grade 4 chemotherapy complications in stage IV patients
No No No No No No No No
Rate of curatively treated patients that received a colonoscopy within 1 year after treatment
No No No No Yes No Yes No
Rate of patients undergoing regular follow-up No No No Yes Yes No Yes No Late grade 4 complications of radio(chemo)therapy No No No Yes Yes No No No Use of the pathology report sheet No Yes No Yes Yes Yes
(subsets) Yes Yes
Quality of TME (according to Quirke) No No Yes Yes No No No Rate of good or moderate quality TME ? No No * No Yes No No No Distal tumour-free margin after SSO ? No * Yes Yes Yes
(subsets) Yes Yes
Number of lymph nodes examined No Yes Yes Yes Yes Yes (subsets)
Yes Yes
(y)pCRM mentioned in the pathology report Yes No Yes Yes Yes (subsets)
Yes Yes
* only for studies 1994-1997 and 2001-2004

158 PROCARE- Phase 2 KCE Reports 81
APPENDIX 6: TNM CLASSIFICATION ADAPTED FROM UICC AND AJCC [24, 25]
T - Primary tumour Tx Primary tumour cannot be assessed T0 No evidence of primary tumour Tis* Carcinoma in situ: intraepithelial or invasion of lamina propria T1° Tumour invades submucosa T2 Tumour invades muscularis propria T3 Tumour invades through muscularis propria into subserosa or into non-peritonealized perirectal
tissues T4 Tumour perforates visceral peritoneum or directly invades other organs or structures
* The extent of mucosal cancer can be expressed in depth of invasion relative to the thickness of the mucosa: i.e. superficial third m1, middle third m2 and deepest third m3.
° The extent of submucosal cancer can be assessed absolutely (sm1 = less than 0.5 mm; sm2 = 0.5–1 mm; sm3 = more than 1 mm) or relatively (sm1 = superficial third; sm2 = middle third; sm3 = invasion reaching the deepest third) [26].
Tis – Primary tumour: invasion of lamina propria m1 Superficial third of the mucosa m2 Middle third of the mucosa m3 Deepest third of the mucosa
T1 – Primary tumour: invasion of submucosa sm1 Superficial third of the submucosa or invasion depth of less than 0.5 mm sm2 Middle third of the submucosa or invasion depth of between 0.5 and 1
mm sm3 Deepest third of the submucosa or invasion depth of more than 1 mm
N – Regional lymph nodes
Nx Regional lymph nodes cannot be assessed. It should be mentioned if no nodes are found.
N0 No regional lymph node metastasis. The number of nodes examined should be mentioned
N1 Metastasis in 1 to 3 regional lymph nodes N2 Metastasis in 4 or more regional lymph nodes
For this project, extramural deposits of tumour that are not obviously within lymph nodes are regarded as discontinuous extensions of the main tumour if they measure <3 mm in diameter, but as lymph node involvement if they measure >3 mm in diameter [25].
M – Distant metastasis Mx Distant metastasis cannot be assessed M0 No distant metastasis M1 Distant metastasis
Pathological M staging can only be based on distant metastases that are submitted for histology. Pathologists will therefore only be able to use M1 (distant metastasis present) or Mx (distant metastases unknown).
TNM Stage grouping Stage 0 Tis N0 M0 Stage I T1 or T2 N0 M0
T3 N0 M0 Stage II A Stage II B T4 N0 M0 Stage III A Stage III B Stage III C
T1 or T2 T3 or T4 Any T
N1 N1 N2
M0 M0 M0
Stage IV Any T Any N M1

KCE Reports 81 PROCARE – phase 2 159
APPENDIX 7 : REFERENCES 1. Penninckx, F., et al., Kwaliteit van rectale kankerzorg, fase 1: Een praktijkrichtlijn voor rectale kanker, in
KCE reports. 2007, Federaal Kenniscentrum voor de Gezondheidszorg (KCE): Brussel.
2. Vlayen, J., et al., Klinische kwaliteitsindicatoren, in KCE reports. 2006, Federaal Kenniscentrum voor de gezondheidszorg (KCE): Brussel.
3. Patwardhan, M.B., et al., Cancer care quality measures: diagnosis and treatment of colorectal cancer. Evid Rep Technol Assess (Full Rep), 2006(138): p. 1-116.
4. Gagliardi, A.R., et al., Development of quality indicators for colorectal cancer surgery, using a 3-step modified Delphi approach. Can J Surg, 2005. 48(6): p. 441-52.
5. Malin, J.L., et al., Results of the National Initiative for Cancer Care Quality: how can we improve the quality of cancer care in the United States? J Clin Oncol, 2006. 24(4): p. 626-34.
6. McGory, M.L., P.G. Shekelle, and C.Y. Ko, Development of quality indicators for patients undergoing colorectal cancer surgery. J Natl Cancer Inst, 2006. 98(22): p. 1623-33.
7. Prosnitz, R.G., et al., Quality measures for the use of adjuvant chemotherapy and radiation therapy in patients with colorectal cancer: a systematic review. Cancer, 2006. 107(10): p. 2352-60.
8. den Dulk, M. and C.J. van de Velde, Quality assurance in surgical oncology: the tale of the Dutch rectal cancer TME trial. J Surg Oncol, 2008. 97(1): p. 5-7.
9. ACPGBI, Guidelines for the management of colorectal cancer. 2007, The Association of Coloproctology of Great Britain and Ireland.
10. Brenner, H. and T. Hakulinen, Substantial overestimation of standard errors of relative survival rates of cancer patients. Am J Epidemiol, 2005. 161(8): p. 781-6.
11. Bittner, R., et al., [Quality indicators for diagnostic and therapy of rectal carcinoma]. Zentralbl Chir, 2007. 132(2): p. 85-94.
12. Harling, H., et al., Hospital volume and outcome of rectal cancer surgery in Denmark 1994-99. Colorectal Dis, 2005. 7(1): p. 90-5.
13. Pahlman, L., et al., The Swedish rectal cancer registry. Br J Surg, 2007. 94(10): p. 1285-92.
14. Wibe, A., et al., Nationwide quality assurance of rectal cancer treatment. Colorectal Dis, 2006. 8(3): p. 224-9.
15. Wibe, A., et al., A national strategic change in treatment policy for rectal cancer--implementation of total mesorectal excision as routine treatment in Norway. A national audit. Dis Colon Rectum, 2002. 45(7): p. 857-66.
16. Improved survival with preoperative radiotherapy in resectable rectal cancer. Swedish Rectal Cancer Trial. N Engl J Med, 1997. 336(14): p. 980-7.
17. Kapiteijn, E., H. Putter, and C.J. van de Velde, Impact of the introduction and training of total mesorectal excision on recurrence and survival in rectal cancer in The Netherlands. Br J Surg, 2002. 89(9): p. 1142-9.
18. Sauer, R., et al., Preoperative versus postoperative chemoradiotherapy for rectal cancer. N Engl J Med, 2004. 351(17): p. 1731-40.
19. Bouhier, K., et al., Changing practices for diagnosis and treatment of colorectal cancer in Calvados: 1990-1999. Gastroenterol Clin Biol, 2004. 28(4): p. 371-6.
20. Phelip, J.M., et al., Evaluation of the management of rectal cancers before and after the consensus conference in France. Eur J Gastroenterol Hepatol, 2004. 16(10): p. 1003-9.
21. Codina-Cazador, A., et al., [Audited teaching program for the treatment of rectal cancer in Spain: results of the first year]. Cir Esp, 2007. 82(4): p. 209-13.
22. Haward, R.A., et al., The long term survival of rectal cancer patients following abdominoperineal and anterior resection: results of a population-based observational study. Eur J Surg Oncol, 2005. 31(1): p. 22-8.
23. Morris, E., et al., The impact of the Calman-Hine report on the processes and outcomes of care for Yorkshire's colorectal cancer patients. Br J Cancer, 2006. 95(8): p. 979-85.
24. (UICC), I.U.A.C., TNM classification of malignant tumours. 6th ed. ed. 2002, Berlin: Springer-Verlag.
25. Sobin, L.H., C. Wittekind, and International Union Against Cancer (UICC), TNM classification on malignant tumours. 5th Ed. ed, ed. W.-L. Publications. 1997, New York: Wiley-Liss Publications.
26. Ueno, H., et al., Risk factors for an adverse outcome in early invasive colorectal carcinoma. Gastroenterology, 2004. 127(2): p. 385-94.


This page is left intentionally blank.

Dépôt légal : D/2008/10.273/39
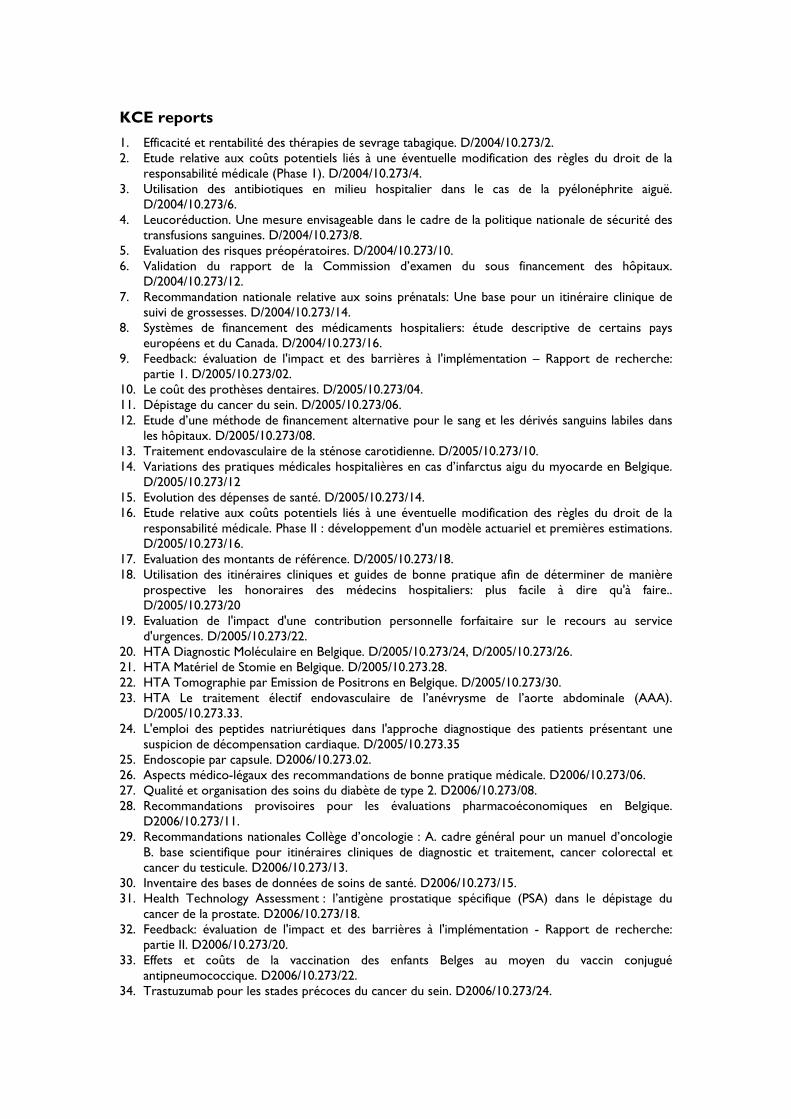
KCE reports
1. Efficacité et rentabilité des thérapies de sevrage tabagique. D/2004/10.273/2. 2. Etude relative aux coûts potentiels liés à une éventuelle modification des règles du droit de la
responsabilité médicale (Phase 1). D/2004/10.273/4. 3. Utilisation des antibiotiques en milieu hospitalier dans le cas de la pyélonéphrite aiguë.
D/2004/10.273/6. 4. Leucoréduction. Une mesure envisageable dans le cadre de la politique nationale de sécurité des
transfusions sanguines. D/2004/10.273/8. 5. Evaluation des risques préopératoires. D/2004/10.273/10. 6. Validation du rapport de la Commission d’examen du sous financement des hôpitaux.
D/2004/10.273/12. 7. Recommandation nationale relative aux soins prénatals: Une base pour un itinéraire clinique de
suivi de grossesses. D/2004/10.273/14. 8. Systèmes de financement des médicaments hospitaliers: étude descriptive de certains pays
européens et du Canada. D/2004/10.273/16. 9. Feedback: évaluation de l'impact et des barrières à l'implémentation – Rapport de recherche:
partie 1. D/2005/10.273/02. 10. Le coût des prothèses dentaires. D/2005/10.273/04. 11. Dépistage du cancer du sein. D/2005/10.273/06. 12. Etude d’une méthode de financement alternative pour le sang et les dérivés sanguins labiles dans
les hôpitaux. D/2005/10.273/08. 13. Traitement endovasculaire de la sténose carotidienne. D/2005/10.273/10. 14. Variations des pratiques médicales hospitalières en cas d’infarctus aigu du myocarde en Belgique.
D/2005/10.273/12 15. Evolution des dépenses de santé. D/2005/10.273/14. 16. Etude relative aux coûts potentiels liés à une éventuelle modification des règles du droit de la
responsabilité médicale. Phase II : développement d'un modèle actuariel et premières estimations. D/2005/10.273/16.
17. Evaluation des montants de référence. D/2005/10.273/18. 18. Utilisation des itinéraires cliniques et guides de bonne pratique afin de déterminer de manière
prospective les honoraires des médecins hospitaliers: plus facile à dire qu'à faire.. D/2005/10.273/20
19. Evaluation de l'impact d'une contribution personnelle forfaitaire sur le recours au service d'urgences. D/2005/10.273/22.
20. HTA Diagnostic Moléculaire en Belgique. D/2005/10.273/24, D/2005/10.273/26. 21. HTA Matériel de Stomie en Belgique. D/2005/10.273.28. 22. HTA Tomographie par Emission de Positrons en Belgique. D/2005/10.273/30. 23. HTA Le traitement électif endovasculaire de l’anévrysme de l’aorte abdominale (AAA).
D/2005/10.273.33. 24. L'emploi des peptides natriurétiques dans l'approche diagnostique des patients présentant une
suspicion de décompensation cardiaque. D/2005/10.273.35 25. Endoscopie par capsule. D2006/10.273.02. 26. Aspects médico-légaux des recommandations de bonne pratique médicale. D2006/10.273/06. 27. Qualité et organisation des soins du diabète de type 2. D2006/10.273/08. 28. Recommandations provisoires pour les évaluations pharmacoéconomiques en Belgique.
D2006/10.273/11. 29. Recommandations nationales Collège d’oncologie : A. cadre général pour un manuel d’oncologie
B. base scientifique pour itinéraires cliniques de diagnostic et traitement, cancer colorectal et cancer du testicule. D2006/10.273/13.
30. Inventaire des bases de données de soins de santé. D2006/10.273/15. 31. Health Technology Assessment : l’antigène prostatique spécifique (PSA) dans le dépistage du
cancer de la prostate. D2006/10.273/18. 32. Feedback: évaluation de l'impact et des barrières à l'implémentation - Rapport de recherche:
partie II. D2006/10.273/20. 33. Effets et coûts de la vaccination des enfants Belges au moyen du vaccin conjugué
antipneumococcique. D2006/10.273/22. 34. Trastuzumab pour les stades précoces du cancer du sein. D2006/10.273/24.

35. Etude relative aux coûts potentiels liés à une éventuelle modification des règles du droit de la responsabilité médicale – Phase III : affinement des estimations. D2006/10.273/27.
36. Traitement pharmacologique et chirurgical de l'obésité. Prise en charge résidentielle des enfants sévèrement obèses en Belgique. D/2006/10.273/29.
37. Health Technology Assessment Imagerie par Résonance Magnétique. D/2006/10.273/33. 38. Dépistage du cancer du col de l’utérus et recherche du Papillomavirus humain (HPV).
D/2006/10.273/36 39. Evaluation rapide de technologies émergentes s'appliquant à la colonne vertébrale : remplacement
de disque intervertébral et vertébro/cyphoplastie par ballonnet. D/2006/10.273/39. 40. Etat fonctionnel du patient: un instrument potentiel pour le remboursement de la kinésithérapie
en Belgique? D/2006/10.273/41. 41. Indicateurs de qualité cliniques. D/2006/10.273/44. 42. Etude des disparités de la chirurgie élective en Belgique. D/2006/10.273/46. 43. Mise à jour de recommandations de bonne pratique existantes. D/2006/10.273/49. 44. Procédure d'évaluation des dispositifs médicaux émergeants. D/2006/10.273/51. 45. HTA Dépistage du Cancer Colorectal : état des lieux scientifique et impact budgétaire pour la
Belgique. D/2006/10.273/54. 46. Health Technology Assessment. Polysomnographie et monitoring à domicile des nourrissons en
prévention de la mort subite. D/2006/10.273/60. 47. L'utilisation des médicaments dans les maisons de repos et les maisons de repos et de soins
Belges. D/2006/10.273/62 48. Lombalgie chronique. D/2006/10.273/64. 49. Médicaments antiviraux en cas de grippe saisonnière et pandémique. Revue de littérature et
recommandations de bonne pratique. D/2006/10.273/66. 50. Contributions personnelles en matière de soins de santé en Belgique. L'impact des suppléments.
D/2006/10.273/69. 51. Besoin de soins chroniques des personnes âgées de 18 à 65 ans et atteintes de lésions cérébrales
acquises. D/2007/10.273/02. 52. Rapid Assessment: Prévention cardiovasculaire primaire dans la pratique du médecin généraliste
en Belgique. D/2007/10.273/04. 53. Financement des soins Infirmiers Hospitaliers. D/2007/10 273/06 54. Vaccination des nourrissons contre le rotavirus en Belgique. Analyse coût-efficacité 55. Valeur en termes de données probantes des informations écrites de l’industrie pharmaceutique
destinées aux médecins généralistes. D/2007/10.273/13 56. Matériel orthopédique en Belgique: Health Technology Assessment. D/2007/10.273/15. 57. Organisation et Financement de la Réadaptation Locomotrice et Neurologique en Belgique
D/2007/10.273/19 58. Le Défibrillateur Cardiaque Implantable.: un rapport d’évaluation de technologie de santé
D/2007/10.273/22 59. Analyse de biologie clinique en médecine général. D/2007/10.273/25 60. Tests de la fonction pulmonaire chez l'adulte. D/2007/10.273/28 61. Traitement de plaies par pression négative: une évaluation rapide. D/2007/10.273/31 62. Radiothérapie Conformationelle avec Modulation d’intensité (IMRT). D/2007/10.273/33. 63. Support scientifique du Collège d’Oncologie: un guideline pour la prise en charge du cancer du
sein. D/2007/10.273/36. 64. Vaccination HPV pour la prévention du cancer du col de l’utérus en Belgique: Health Technology
Assessment. D/2007/10.273/42. 65. Organisation et financement du diagnostic génétique en Belgique. D/2007/10.273/45. 66. Drug Eluting Stents en Belgique: Health Technology Assessment. D/2007/10.273/48. 67. Hadronthérapie. D/2007/10.273/51. 68. Indemnisation des dommages résultant de soins de santé - Phase IV : Clé de répartition entre le
Fonds et les assureurs. D/2007/10.273/53. 69. Assurance de Qualité pour le cancer du rectum – Phase 1: Recommandation de bonne pratique
pour la prise en charge du cancer rectal D/2007/10.273/55 70. Etude comparative des programmes d’accréditation hospitalière en Europe. D/2008/10.273/02 71. Recommandation de bonne pratique clinique pour cinq tests ophtalmiques. D/2008/10.273/05 72. L’offre de médecins en Belgique. Situation actuelle et défis. D/2008/10.273/08 73. Financement du programme de soins pour le patient gériatrique dans l’hôpital
classique : Définition et évaluation du patient gériatrique, fonction de liaison et évaluation d’un instrument pour un financement approprié. D/2008/10.273/12

74. Oxygénothérapie Hyperbare: Rapid Assessment. D/2008/10.273/14. 75. Guideline pour la prise en charge du cancer oesophagien et gastrique: éléments scientifiques à
destination du Collège d’Oncologie. D/2008/10.273/17. 76. Promotion de la qualité de la médecine générale en Belgique: status quo ou quo vadis ?
D/2008/10.273/19. 77. Orthodontie chez les enfants et adolescents D/2008/10.273/21 78. Recommandations pour les évaluations pharmacoéconomiques en Belgique. D/2008/10.273/24. 79. Remboursement des radioisotopes en Belgique. D/2008/10.273/27. 80. Évaluation des effets du maximum à facturer sur la consommation et l’accessibilité financière des
soins de santé. D/2008/10.273/36. 81. Assurance de qualité pour le cancer rectal – phase 2: développement et test d’un ensemble
d’indicateurs de qualité. D/2008/10.273/39