Embed Size (px)
Citation preview
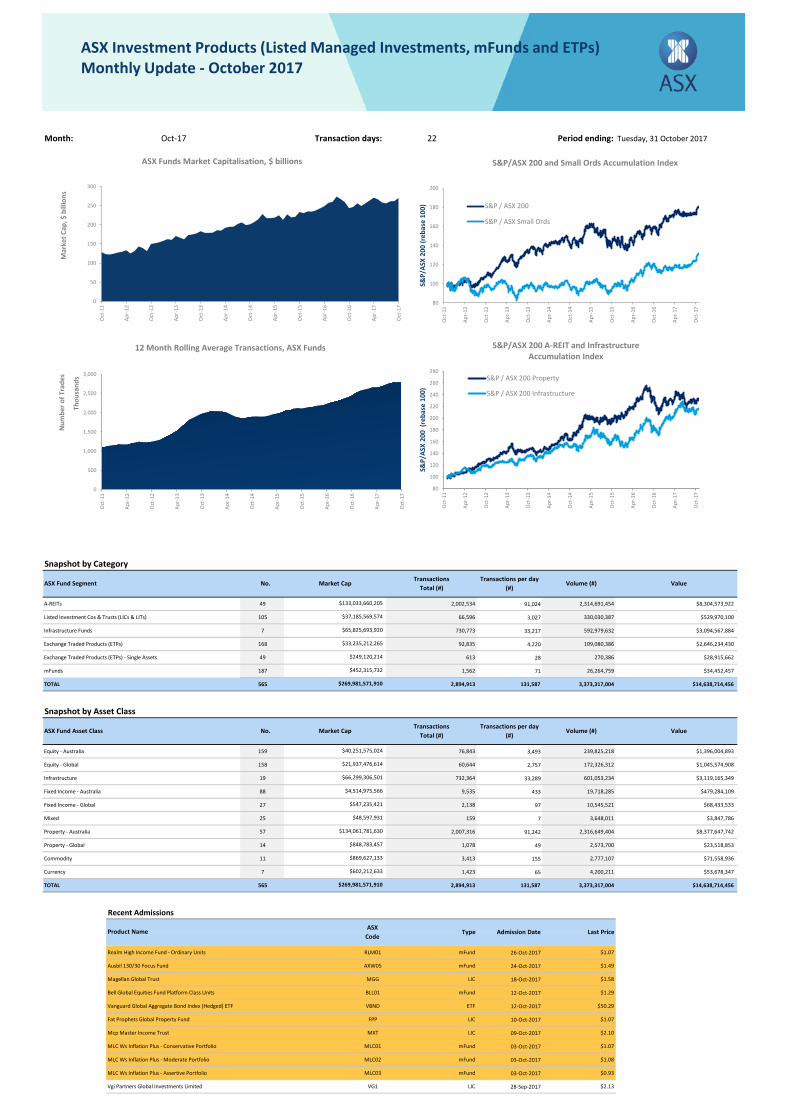
Month: Oct-17 Transaction days: 22 Period ending:
Snapshot by Category
A-REITs 49 2,002,534 91,024 2,314,691,454 $8,304,573,922
Listed Investment Cos & Trusts (LICs & LITs) 105 66,596 3,027 330,030,387 $529,970,100
Infrastructure Funds 7 730,773 33,217 592,979,632 $3,094,567,884
Exchange Traded Products (ETPs) 168 92,835 4,220 109,080,386 $2,646,234,430
Exchange Traded Products (ETPs) - Single Assets 49 613 28 270,386 $28,915,662
mFunds 187 1,562 71 26,264,759 $34,452,457
TOTAL 565 2,894,913 131,587 3,373,317,004 $14,638,714,456
Snapshot by Asset Class
Equity - Australia 159 76,843 3,493 239,825,218 $1,396,004,893
Equity - Global 158 60,644 2,757 172,326,312 $1,045,574,908
Infrastructure 19 732,364 33,289 601,053,234 $3,119,165,349
Fixed Income - Australia 88 9,535 433 19,718,285 $479,284,109
Fixed Income - Global 27 2,138 97 10,545,521 $68,433,533
Mixed 25 159 7 3,648,011 $3,847,786
Property - Australia 57 2,007,316 91,242 2,316,649,404 $8,377,647,742
Property - Global 14 1,078 49 2,573,700 $23,518,853
Commodity 11 3,413 155 2,777,107 $71,558,936
Currency 7 1,423 65 4,200,211 $53,678,347
TOTAL 565 2,894,913 131,587 3,373,317,004 $14,638,714,456
Recent Admissions
Realm High Income Fund - Ordinary Units RLM01 mFund 26-Oct-2017 $1.07
Ausbil 130/30 Focus Fund AXW05 mFund 24-Oct-2017 $1.49
Magellan Global Trust MGG LIC 18-Oct-2017 $1.58
Bell Global Equities Fund Platform Class Units BLL01 mFund 12-Oct-2017 $1.29
Vanguard Global Aggregate Bond Index (Hedged) ETF VBND ETF 12-Oct-2017 $50.29
Fat Prophets Global Property Fund FPP LIC 10-Oct-2017 $1.07
Mcp Master Income Trust MXT LIC 09-Oct-2017 $2.10
MLC Ws Inflation Plus - Conservative Portfolio MLC01 mFund 03-Oct-2017 $1.07
MLC Ws Inflation Plus - Moderate Portfolio MLC02 mFund 03-Oct-2017 $1.08
MLC Ws Inflation Plus - Assertive Portfolio MLC03 mFund 03-Oct-2017 $0.93
Vgi Partners Global Investments Limited VG1 LIC 28-Sep-2017 $2.13
Tuesday, 31 October 2017
Volume (#) Value
Value Volume (#)
Product Name
$452,315,732
$269,981,571,910
$249,120,214
$848,783,457
$869,627,133
$602,212,633
$269,981,571,910
$547,235,421
$48,597,931
$134,061,781,630
No.
ASX Code
No.ASX Fund Segment
ASX Fund Asset Class
Transactions per day (#)
Transactions per day (#)
TransactionsTotal (#)
TransactionsTotal (#)
Market Cap
$133,033,660,205
$37,185,569,574
$33,235,212,265
$65,825,693,920
Type Admission Date Last Price
$40,251,575,024
Market Cap
$21,937,476,614
$66,299,306,501
$4,514,975,566
0
50
100
150
200
250
300
Oct
-11
Apr-
12
Oct
-12
Apr-
13
Oct
-13
Apr-
14
Oct
-14
Apr-
15
Oct
-15
Apr-
16
Oct
-16
Apr-
17
Oct
-17
Mar
ket C
ap, $
bill
ions
ASX Funds Market Capitalisation, $ billions
0
500
1,000
1,500
2,000
2,500
3,000
Oct
-11
Apr-
12
Oct
-12
Apr-
13
Oct
-13
Apr-
14
Oct
-14
Apr-
15
Oct
-15
Apr-
16
Oct
-16
Apr-
17
Oct
-17
Num
ber o
f Tra
des
Thou
sand
s
12 Month Rolling Average Transactions, ASX Funds
80
100
120
140
160
180
200
Oct
-11
Apr-
12
Oct
-12
Apr-
13
Oct
-13
Apr-
14
Oct
-14
Apr-
15
Oct
-15
Apr-
16
Oct
-16
Apr-
17
Oct
-17
S&P/
ASX
200
(reb
ase
100)
S&P/ASX 200 and Small Ords Accumulation Index
S&P / ASX 200
S&P / ASX Small Ords
80
100
120
140
160
180
200
220
240
260
280
Oct
-11
Apr-
12
Oct
-12
Apr-
13
Oct
-13
Apr-
14
Oct
-14
Apr-
15
Oct
-15
Apr-
16
Oct
-16
Apr-
17
Oct
-17
S&P/
ASX
200
(reb
ase
100)
S&P/ASX 200 A-REIT and InfrastructureAccumulation Index
S&P / ASX 200 Property
S&P / ASX 200 Infrastructure
ASX Investment Products (Listed Managed Investments, mFunds and ETPs)Monthly Update - October 2017
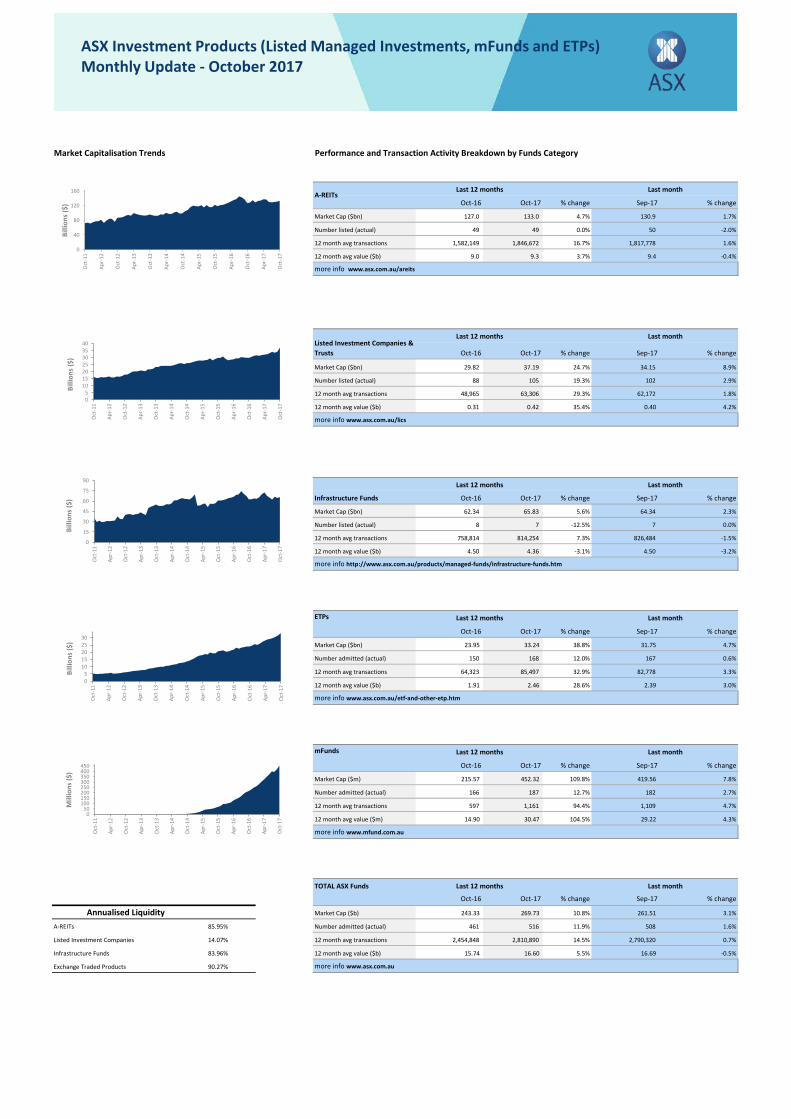
Market Capitalisation Trends Performance and Transaction Activity Breakdown by Funds Category
Oct-16 Oct-17 % change Sep-17 % change
Market Cap ($bn) 127.0 133.0 4.7% 130.9 1.7%
Number listed (actual) 49 49 0.0% 50 -2.0%
12 month avg transactions 1,582,149 1,846,672 16.7% 1,817,778 1.6%
12 month avg value ($b) 9.0 9.3 3.7% 9.4 -0.4%
more info www.asx.com.au/areits
Oct-16 Oct-17 % change Sep-17 % change
Market Cap ($bn) 29.82 37.19 24.7% 34.15 8.9%
Number listed (actual) 88 105 19.3% 102 2.9%
12 month avg transactions 48,965 63,306 29.3% 62,172 1.8%
12 month avg value ($b) 0.31 0.42 35.4% 0.40 4.2%
more info www.asx.com.au/lics
Oct-16 Oct-17 % change Sep-17 % change
Market Cap ($bn) 62.34 65.83 5.6% 64.34 2.3%
Number listed (actual) 8 7 -12.5% 7 0.0%
12 month avg transactions 758,814 814,254 7.3% 826,484 -1.5%
12 month avg value ($b) 4.50 4.36 -3.1% 4.50 -3.2%
more info http://www.asx.com.au/products/managed-funds/infrastructure-funds.htm
ETPs
Oct-16 Oct-17 % change Sep-17 % change
Market Cap ($bn) 23.95 33.24 38.8% 31.75 4.7%
Number admitted (actual) 150 168 12.0% 167 0.6%
12 month avg transactions 64,323 85,497 32.9% 82,778 3.3%
12 month avg value ($b) 1.91 2.46 28.6% 2.39 3.0%
more info www.asx.com.au/etf-and-other-etp.htm
mFunds
Oct-16 Oct-17 % change Sep-17 % change
Market Cap ($m) 215.57 452.32 109.8% 419.56 7.8%
Number admitted (actual) 166 187 12.7% 182 2.7%
12 month avg transactions 597 1,161 94.4% 1,109 4.7%
12 month avg value ($m) 14.90 30.47 104.5% 29.22 4.3%
more info www.mfund.com.au
TOTAL ASX Funds
Oct-16 Oct-17 % change Sep-17 % change
Market Cap ($b) 243.33 269.73 10.8% 261.51 3.1%
A-REITs 85.95% Number admitted (actual) 461 516 11.9% 508 1.6%
Listed Investment Companies 14.07% 12 month avg transactions 2,454,848 2,810,890 14.5% 2,790,320 0.7%
Infrastructure Funds 83.96% 12 month avg value ($b) 15.74 16.60 5.5% 16.69 -0.5%
Exchange Traded Products 90.27% more info www.asx.com.au
Annualised Liquidity
Last month
A-REITsLast month
Listed Investment Companies & Trusts
Last month
Infrastructure Funds
Last month
Last month
Last month
Last 12 months
Last 12 months
Last 12 months
Last 12 months
Last 12 months
Last 12 months
05
10152025303540
Oct
-11
Apr-
12
Oct
-12
Apr-
13
Oct
-13
Apr-
14
Oct
-14
Apr-
15
Oct
-15
Apr-
16
Oct
-16
Apr-
17
Oct
-17
Billi
ons
($)
0
15
30
45
60
75
90
Oct
-11
Apr-
12
Oct
-12
Apr-
13
Oct
-13
Apr-
14
Oct
-14
Apr-
15
Oct
-15
Apr-
16
Oct
-16
Apr-
17
Oct
-17
Billi
ons
($)
05
1015202530
Oct
-11
Apr-
12
Oct
-12
Apr-
13
Oct
-13
Apr-
14
Oct
-14
Apr-
15
Oct
-15
Apr-
16
Oct
-16
Apr-
17
Oct
-17
Billi
ons
($)
0
40
80
120
160
Oct
-11
Apr-
12
Oct
-12
Apr-
13
Oct
-13
Apr-
14
Oct
-14
Apr-
15
Oct
-15
Apr-
16
Oct
-16
Apr-
17
Oct
-17
Billi
ons
($)
050
100150200250300350400450
Oct
-11
Apr-
12
Oct
-12
Apr-
13
Oct
-13
Apr-
14
Oct
-14
Apr-
15
Oct
-15
Apr-
16
Oct
-16
Apr-
17
Oct
-17
Mill
ions
($)
ASX Investment Products (Listed Managed Investments, mFunds and ETPs)Monthly Update - October 2017
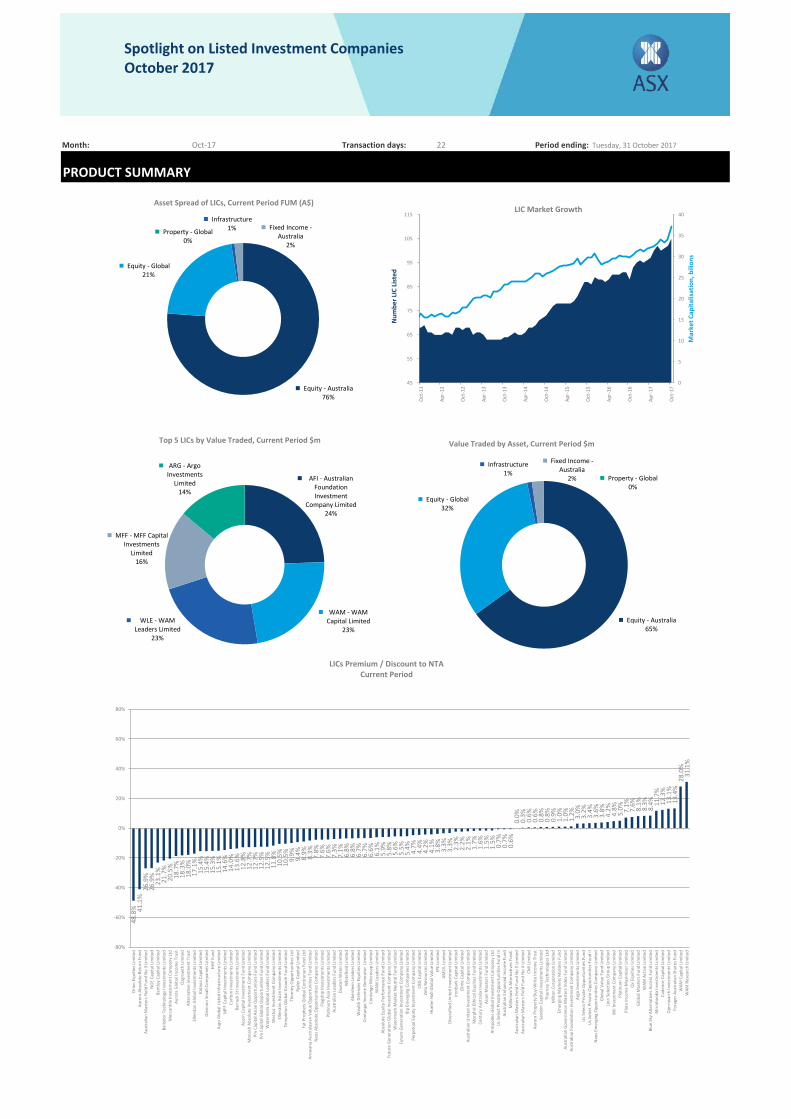
Month: Oct-17 Transaction days: 22 Period ending:
PRODUCT SUMMARY
n/a
n/a
0.5
Tuesday, 31 October 2017
Equity - Australia76%
Equity - Global21%
Infrastructure1% Fixed Income -
Australia2%
Property - Global0%
Asset Spread of LICs, Current Period FUM (A$)
0
5
10
15
20
25
30
35
40
45
55
65
75
85
95
105
115
Oct
-11
Apr-
12
Oct
-12
Apr-
13
Oct
-13
Apr-
14
Oct
-14
Apr-
15
Oct
-15
Apr-
16
Oct
-16
Apr-
17
Oct
-17
Mar
ket C
apita
lisat
ion,
bili
ons
Num
ber L
IC L
iste
d
LIC Market Growth
Equity - Australia65%
Equity - Global32%
Infrastructure1%
Fixed Income -Australia
2% Property - Global0%
Value Traded by Asset, Current Period $m
AFI - Australian Foundation Investment
Company Limited24%
WAM - WAM Capital Limited
23%WLE - WAM
Leaders Limited23%
MFF - MFF Capital Investments
Limited16%
ARG - Argo Investments
Limited14%
Top 5 LICs by Value Traded, Current Period $m
48.8
% 41.1
%26
.9%
26.9
%23
.1%
21.7
%20
.5%
18.7
%18
.3%
18.0
%17
.1%
15.4
%15
.4%
15.3
%15
.1%
14.6
%14
.0%
13.6
%12
.8%
12.7
%12
.7%
12.5
%12
.5%
11.8
%10
.5%
10.5
%9.
9%9.
4%8.
9%8.
3%7.
8%7.
6%7.
6%7.
3%7.
1%6.
8%6.
8%6.
7%6.
7%6.
6%6.
1%5.
9%5.
8%5.
6%5.
5%5.
4% 4.7%
4.4%
4.2%
4.1%
3.8%
3.3%
3.3% 2.3%
2.2%
2.1%
1.7%
1.6%
1.5%
1.5% 0.7%
0.7%
0.6%
0.0%
0.3%
0.6%
0.6%
0.8%
0.8%
0.9%
1.0%
1.0%
1.2% 3.0%
3.2%
3.4%
3.6%
3.8%
4.2%
4.8%
5.0% 7.1%
7.6%
8.1%
8.3%
8.4% 11
.7%
12.3
%13
.1%
13.4
%28
.0%
31.1
%
-80%
-60%
-40%
-20%
0%
20%
40%
60%
80%
Orio
n Eq
uitie
s Lim
ited
Auro
ra A
bsol
ute
Retu
rn F
und
Aust
ralia
n M
aste
rs Y
ield
Fun
d N
o 3
Lim
ited
NG
E Ca
pita
l Lim
ited
Bent
ley
Capi
tal L
imite
dBa
ilado
r Tec
hnol
ogy
Inve
stm
ents
Lim
ited
Mer
cant
ile In
vest
men
t Com
pany
Ltd
Auro
ra G
loba
l Inc
ome
Trus
tO
zgro
wth
Lim
ited
Alte
rnat
ive
Inve
stm
ent T
rust
Elle
rsto
n Gl
obal
Inve
stm
ents
Lim
ited
Kata
na C
apita
l Lim
ited
Gle
nnon
Sm
all C
ompa
nies
Lim
ited
HHY
Fund
Argo
Glo
bal L
isted
Infr
astr
uctu
re L
imite
dM
FF C
apita
l Inv
estm
ents
Lim
ited
Carlt
on In
vest
men
ts L
imite
dBa
rrac
k St
Inve
stm
ents
Lim
ited
Acor
n Ca
pita
l Inv
estm
ent F
und
Lim
ited
Mon
ash
Abso
lute
Inve
stm
ent C
ompa
ny L
imite
dPm
Cap
ital A
sian
Opp
ortu
nitie
s Fun
d Li
mite
dPm
Cap
ital G
loba
l Opp
ortu
nitie
s Fun
d Li
mite
dW
ater
mar
k Gl
obal
Lea
ders
Fun
d Li
mite
dW
esto
z Inv
estm
ent C
ompa
ny L
imite
dEl
lers
ton
Asia
n In
vest
men
ts L
imite
dTe
mpl
eton
Glo
bal G
row
th F
und
Lim
ited
Thor
ney
Opp
ortu
nitie
s Ltd
Ryde
r Cap
ital L
imite
dFa
t Pro
phet
s Glo
bal C
ontr
aria
n Fu
nd L
tdAr
owan
a Au
stra
lasia
n Va
lue
Opp
ortu
nitie
s Fun
d Li
mite
dN
aos A
bsol
ute
Opp
ortu
nitie
s Com
pany
Lim
ited
Flag
ship
Inve
stm
ents
Lim
ited
Plat
inum
Asia
Inve
stm
ents
Lim
ited
Aust
ralia
n Le
ader
s Fun
d Li
mite
dDu
xton
Wat
er L
imite
dW
hite
field
Lim
ited
Aber
deen
Lea
ders
Lim
ited
Wea
lth D
efen
der E
quiti
es L
imite
dCo
ntan
go In
com
e Ge
nera
tor
Lim
ited
Cont
ango
Mic
roca
p Li
mite
dW
AM L
eade
rs L
imite
dAb
solu
te E
quity
Per
form
ance
Fun
d Li
mite
dFu
ture
Gen
erat
ion
Glob
al In
vest
men
t Com
pany
Lim
ited
Wat
erm
ark
Mar
ket N
eutr
al F
und
Lim
ited
Futu
re G
ener
atio
n In
vest
men
t Com
pany
Lim
ited
8Ip
Emer
ging
Com
pani
es L
imite
dPe
rpet
ual E
quity
Inve
stm
ent C
ompa
ny L
imite
dCB
G Ca
pita
l Lim
ited
Zeta
Res
ourc
es L
imite
dHu
nter
Hal
l Glo
bal V
alue
Lim
ited
IPE
Lim
ited
AMCI
L Li
mite
dDi
vers
ified
Uni
ted
Inve
stm
ent L
imite
dIro
nbar
k Ca
pita
l Lim
ited
Clim
e Ca
pita
l Lim
ited
Aust
ralia
n U
nite
d In
vest
men
t Com
pany
Lim
ited
Mor
phic
Eth
ical
Equ
ities
Fun
d Li
mite
dCe
ntur
y Au
stra
lia In
vest
men
ts L
imite
dAs
ian
Mas
ters
Fun
d Li
mite
dAn
tipod
es G
loba
l Inv
estm
ent C
ompa
ny L
tdU
s Sel
ect P
rivat
e O
ppor
tuni
ties F
und
IiiAu
stra
lian
Enha
nced
Inco
me
Fund
Mill
iniu
m'S
Alte
rnat
ives
Fun
d.Au
stra
lian
Mas
ters
Yie
ld F
und
No
5 Li
mite
dAu
stra
lian
Mas
ters
Yie
ld F
und
No
4 Li
mite
dCM
I Lim
ited
Auro
ra P
rope
rty
Buy-
Writ
e In
com
e Tr
ust
Sand
on C
apita
l Inv
estm
ents
Lim
ited
Thor
ney
Tech
nolo
gies
Ltd
Milt
on C
orpo
ratio
n Li
mite
dEm
ergi
ng M
arke
ts M
aste
rs F
und
Aust
ralia
n G
over
nanc
e M
aste
rs In
dex
Fund
Lim
ited
Aust
ralia
n Fo
unda
tion
Inve
stm
ent C
ompa
ny L
imite
dAr
go In
vest
men
ts L
imite
dU
s Sel
ect P
rivat
e O
ppor
tuni
ties F
und
Us S
elec
t Priv
ate
Opp
ortu
nitie
s Fun
d II
Nao
s Em
ergi
ng O
ppor
tuni
ties C
ompa
ny L
imite
dG
loba
l Val
ue F
und
Lim
ited
Lion
Sel
ectio
n Gr
oup
Lim
ited
BKI I
nves
tmen
t Com
pany
Lim
ited
Plat
inum
Cap
ital L
imite
dPl
ato
Inco
me
Max
imise
r Lim
ited
Qv
Equi
ties L
imite
dG
loba
l Mas
ters
Fun
d Li
mite
dW
AM A
ctiv
e Li
mite
dBl
ue S
ky A
ltern
ativ
es A
cces
s Fun
d Li
mite
dM
irrab
ooka
Inve
stm
ents
Lim
ited
Cade
nce
Capi
tal L
imite
dDj
erriw
arrh
Inve
stm
ents
Lim
ited
Fora
ger A
ustr
alia
n Sh
ares
Fun
dW
AM C
apita
l Lim
ited
WAM
Res
earc
h Li
mite
d
LICs Premium / Discount to NTACurrent Period
Spotlight on Listed Investment CompaniesOctober 2017
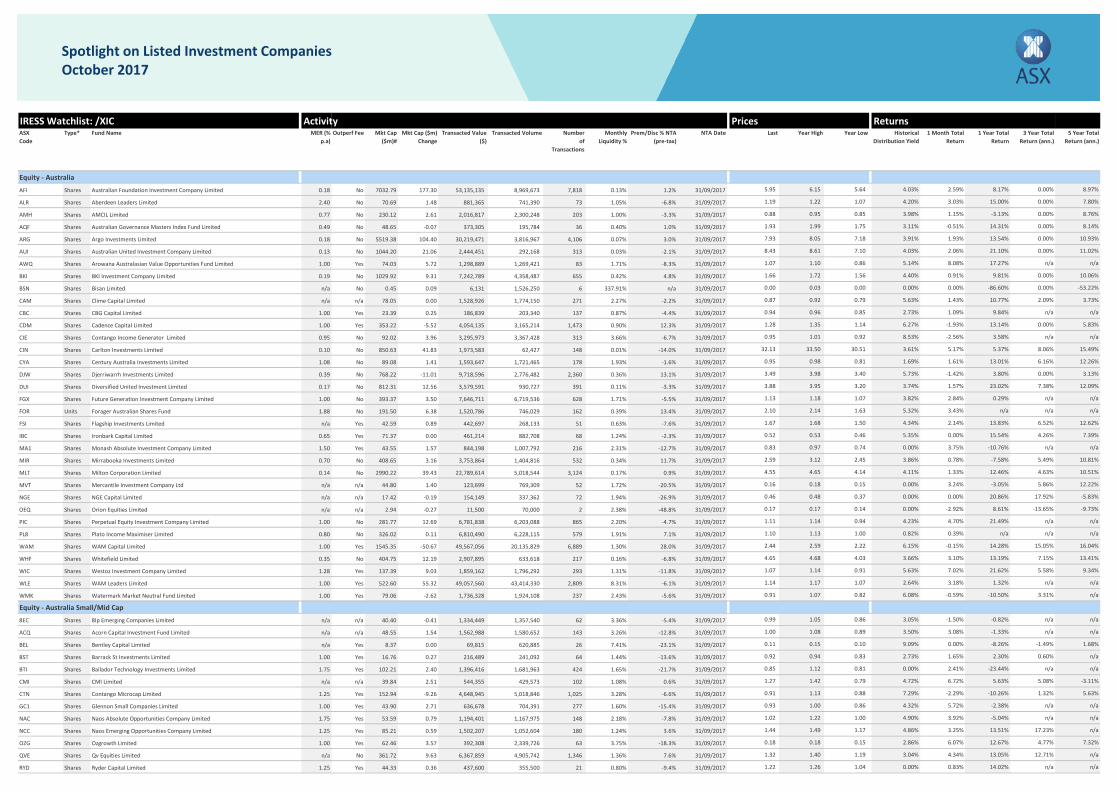
IRESS Watchlist: /XIC Activity Prices ReturnsASX Code
Type* MER (% p.a)
Outperf Fee Mkt Cap ($m)#
Mkt Cap ($m) Change
Transacted Value ($)
Transacted Volume Number of
Transactions
Monthly Liquidity %
Prem/Disc % NTA (pre-tax)
NTA Date Last Year High Year Low Historical Distribution Yield
1 Month Total Return
1 Year Total Return
3 Year Total Return (ann.)
5 Year Total Return (ann.)
Equity - Australia
AFI Shares 0.18 No 7032.79 177.30 53,135,135 8,969,673 7,818 0.13% 1.2% 31/09/2017 5.95 6.15 5.64 4.03% 2.59% 8.17% 0.00% 8.97%
ALR Shares 2.40 No 70.69 1.48 881,365 741,390 73 1.05% -6.8% 31/09/2017 1.19 1.22 1.07 4.20% 3.03% 15.00% 0.00% 7.80%
AMH Shares 0.77 No 230.12 2.61 2,016,817 2,300,248 203 1.00% -3.3% 31/09/2017 0.88 0.95 0.85 3.98% 1.15% -3.13% 0.00% 8.76%
AQF Shares 0.49 No 48.65 -0.07 373,305 195,784 36 0.40% 1.0% 31/09/2017 1.93 1.99 1.75 3.11% -0.51% 14.31% 0.00% 8.14%
ARG Shares 0.18 No 5519.38 104.40 30,219,471 3,816,967 4,106 0.07% 3.0% 31/09/2017 7.93 8.05 7.18 3.91% 1.93% 13.54% 0.00% 10.93%
AUI Shares 0.13 No 1044.20 21.06 2,444,451 292,168 313 0.03% -2.1% 31/09/2017 8.43 8.61 7.10 4.03% 2.06% 21.10% 0.00% 11.02%
AWQ Shares Arowana Australasian Value Opportunities Fund Limited 1.00 Yes 74.03 5.72 1,298,889 1,269,421 83 1.71% -8.3% 31/09/2017 1.07 1.10 0.86 5.14% 8.08% 17.27% n/a n/a
BKI Shares BKI Investment Company Limited 0.19 No 1029.92 9.31 7,242,789 4,358,487 655 0.42% 4.8% 31/09/2017 1.66 1.72 1.56 4.40% 0.91% 9.81% 0.00% 10.06%
BSN Shares Bisan Limited n/a No 0.45 0.09 6,131 1,526,250 6 337.91% n/a 31/09/2017 0.00 0.03 0.00 0.00% 0.00% -86.60% 0.00% -53.22%
CAM Shares Clime Capital Limited n/a n/a 78.05 0.00 1,528,926 1,774,150 271 2.27% -2.2% 31/09/2017 0.87 0.92 0.79 5.63% 1.43% 10.77% 2.09% 3.73%
CBC Shares CBG Capital Limited 1.00 Yes 23.39 0.25 186,839 203,340 137 0.87% -4.4% 31/09/2017 0.94 0.96 0.85 2.73% 1.09% 9.84% n/a n/a
CDM Shares Cadence Capital Limited 1.00 Yes 353.22 -5.52 4,054,135 3,165,214 1,473 0.90% 12.3% 31/09/2017 1.28 1.35 1.14 6.27% -1.93% 13.14% 0.00% 5.83%
CIE Shares Contango Income Generator Limited 0.95 No 92.02 3.96 3,295,973 3,367,428 313 3.66% -6.7% 31/09/2017 0.95 1.01 0.92 8.53% -2.56% 3.58% n/a n/a
CIN Shares Carlton Investments Limited 0.10 No 850.63 41.83 1,973,583 62,427 148 0.01% -14.0% 31/09/2017 32.13 33.50 30.51 3.61% 5.17% 5.37% 8.06% 15.49%
CYA Shares Century Australia Investments Limited 1.08 No 89.08 1.41 1,593,647 1,721,465 178 1.93% -1.6% 31/09/2017 0.95 0.98 0.81 1.69% 1.61% 13.01% 6.16% 12.26%
DJW Shares Djerriwarrh Investments Limited 0.39 No 768.22 -11.01 9,718,596 2,776,482 2,360 0.36% 13.1% 31/09/2017 3.49 3.98 3.40 5.73% -1.42% 3.80% 0.00% 3.13%
DUI Shares Diversified United Investment Limited 0.17 No 812.31 12.56 3,579,591 930,727 391 0.11% -3.3% 31/09/2017 3.88 3.95 3.20 3.74% 1.57% 23.02% 7.38% 12.09%
FGX Shares Future Generation Investment Company Limited 1.00 No 393.37 3.50 7,646,711 6,719,536 628 1.71% -5.5% 31/09/2017 1.13 1.18 1.07 3.82% 2.84% 0.29% n/a n/a
FOR Units Forager Australian Shares Fund 1.88 No 191.50 6.38 1,520,786 746,029 162 0.39% 13.4% 31/09/2017 2.10 2.14 1.63 5.32% 3.43% n/a n/a n/a
FSI Shares Flagship Investments Limited n/a Yes 42.59 0.89 442,697 268,133 51 0.63% -7.6% 31/09/2017 1.67 1.68 1.50 4.34% 2.14% 13.83% 6.52% 12.62%
IBC Shares Ironbark Capital Limited 0.65 Yes 71.37 0.00 461,214 882,708 68 1.24% -2.3% 31/09/2017 0.52 0.53 0.46 5.35% 0.00% 15.54% 4.26% 7.39%
MA1 Shares Monash Absolute Investment Company Limited 1.50 Yes 43.55 1.57 844,198 1,007,792 216 2.31% -12.7% 31/09/2017 0.83 0.97 0.74 0.00% 3.75% -10.76% n/a n/a
MIR Shares Mirrabooka Investments Limited 0.70 No 408.65 3.16 3,753,864 1,404,816 532 0.34% 11.7% 31/09/2017 2.59 3.12 2.45 3.86% 0.78% -7.58% 5.49% 10.81%
MLT Shares Milton Corporation Limited 0.14 No 2990.22 39.43 22,789,614 5,018,544 3,124 0.17% 0.9% 31/09/2017 4.55 4.65 4.14 4.11% 1.33% 12.46% 4.63% 10.51%
MVT Shares Mercantile Investment Company Ltd n/a n/a 44.80 1.40 123,699 769,309 52 1.72% -20.5% 31/09/2017 0.16 0.18 0.15 0.00% 3.24% -3.05% 5.86% 12.22%
NGE Shares NGE Capital Limited n/a n/a 17.42 -0.19 154,149 337,362 72 1.94% -26.9% 31/09/2017 0.46 0.48 0.37 0.00% 0.00% 20.86% 17.92% -5.83%
OEQ Shares Orion Equities Limited n/a n/a 2.94 -0.27 11,500 70,000 2 2.38% -48.8% 31/09/2017 0.17 0.17 0.14 0.00% -2.92% 8.61% -13.65% -9.73%
PIC Shares Perpetual Equity Investment Company Limited 1.00 No 281.77 12.69 6,781,838 6,203,088 865 2.20% -4.7% 31/09/2017 1.11 1.14 0.94 4.23% 4.70% 21.49% n/a n/a
PL8 Shares Plato Income Maximiser Limited 0.80 No 326.02 0.11 6,810,490 6,228,115 579 1.91% 7.1% 31/09/2017 1.10 1.13 1.00 0.82% 0.39% n/a n/a n/a
WAM Shares WAM Capital Limited 1.00 Yes 1545.35 -50.67 49,567,056 20,135,829 6,889 1.30% 28.0% 31/09/2017 2.44 2.59 2.22 6.15% -0.15% 14.28% 15.05% 16.04%
WHF Shares Whitefield Limited 0.35 No 404.75 12.19 2,907,895 633,618 217 0.16% -6.8% 31/09/2017 4.65 4.68 4.03 3.66% 3.10% 13.19% 7.15% 13.41%
WIC Shares Westoz Investment Company Limited 1.28 Yes 137.39 9.03 1,859,162 1,796,292 293 1.31% -11.8% 31/09/2017 1.07 1.14 0.91 5.63% 7.02% 21.62% 5.58% 9.34%
WLE Shares WAM Leaders Limited 1.00 Yes 522.60 55.32 49,057,560 43,414,330 2,809 8.31% -6.1% 31/09/2017 1.14 1.17 1.07 2.64% 3.18% 1.32% n/a n/a
WMK Shares Watermark Market Neutral Fund Limited 1.00 Yes 79.06 -2.62 1,736,328 1,924,108 237 2.43% -5.6% 31/09/2017 0.91 1.07 0.82 6.08% -0.59% -10.50% 3.31% n/a
Equity - Australia Small/Mid Cap
8EC Shares n/a n/a 40.40 -0.41 1,334,449 1,357,540 62 3.36% -5.4% 31/09/2017 0.99 1.05 0.86 3.05% -1.50% -0.82% n/a n/a
ACQ Shares n/a n/a 48.55 1.54 1,562,988 1,580,652 143 3.26% -12.8% 31/09/2017 1.00 1.08 0.89 3.50% 3.08% -1.33% n/a n/a
BEL Shares Bentley Capital Limited n/a Yes 8.37 0.00 69,815 620,885 26 7.41% -23.1% 31/09/2017 0.11 0.15 0.10 9.09% 0.00% -8.26% -1.49% 1.68%
BST Shares Barrack St Investments Limited 1.00 Yes 16.76 0.27 216,489 241,092 64 1.44% -13.6% 31/09/2017 0.92 0.94 0.83 2.73% 1.65% 2.30% 0.60% n/a
BTI Shares Bailador Technology Investments Limited 1.75 Yes 102.21 2.40 1,396,416 1,681,963 424 1.65% -21.7% 31/09/2017 0.85 1.12 0.81 0.00% 2.41% -23.44% n/a n/a
CMI Shares CMI Limited n/a n/a 39.84 2.51 544,355 429,573 102 1.08% 0.6% 31/09/2017 1.27 1.42 0.79 4.72% 6.72% 5.63% 5.08% -3.11%
CTN Shares Contango Microcap Limited 1.25 Yes 152.94 -9.26 4,648,945 5,018,846 1,025 3.28% -6.6% 31/09/2017 0.91 1.13 0.88 7.29% -2.29% -10.26% 1.32% 5.63%
GC1 Shares Glennon Small Companies Limited 1.00 Yes 43.90 2.71 636,678 704,391 277 1.60% -15.4% 31/09/2017 0.93 1.00 0.86 4.32% 5.72% -2.38% n/a n/a
NAC Shares Naos Absolute Opportunities Company Limited 1.75 Yes 53.59 0.79 1,194,401 1,167,975 148 2.18% -7.8% 31/09/2017 1.02 1.22 1.00 4.90% 3.92% -5.04% n/a n/a
NCC Shares Naos Emerging Opportunities Company Limited 1.25 Yes 85.21 0.59 1,502,207 1,052,604 180 1.24% 3.6% 31/09/2017 1.44 1.49 1.17 4.86% 3.25% 13.51% 17.23% n/a
OZG Shares Ozgrowth Limited 1.00 Yes 62.46 3.57 392,308 2,339,726 63 3.75% -18.3% 31/09/2017 0.18 0.18 0.15 2.86% 6.07% 12.67% 4.77% 7.32%
QVE Shares Qv Equities Limited n/a No 361.72 9.63 6,367,859 4,905,742 1,346 1.36% 7.6% 31/09/2017 1.32 1.40 1.19 3.04% 4.34% 13.05% 12.71% n/a
RYD Shares Ryder Capital Limited 1.25 Yes 44.33 0.36 437,600 355,500 21 0.80% -9.4% 31/09/2017 1.22 1.26 1.04 0.00% 0.83% 14.02% n/a n/a
Fund Name
Australian Foundation Investment Company Limited
Australian Governance Masters Index Fund Limited
Argo Investments Limited
Australian United Investment Company Limited
Aberdeen Leaders Limited
AMCIL Limited
Acorn Capital Investment Fund Limited
8Ip Emerging Companies Limited
Spotlight on Listed Investment CompaniesOctober 2017
IRESS Watchlist: /XIC Activity Prices ReturnsASX Code
Type* MER (% p.a)
Outperf Fee Mkt Cap ($m)#
Mkt Cap ($m) Change
Transacted Value ($)
Transacted Volume Number of
Transactions
Monthly Liquidity %
Prem/Disc % NTA (pre-tax)
NTA Date Last Year High Year Low Historical Distribution Yield
1 Month Total Return
1 Year Total Return
3 Year Total Return (ann.)
5 Year Total Return (ann.)
Fund Name
Spotlight on Listed Investment CompaniesOctober 2017
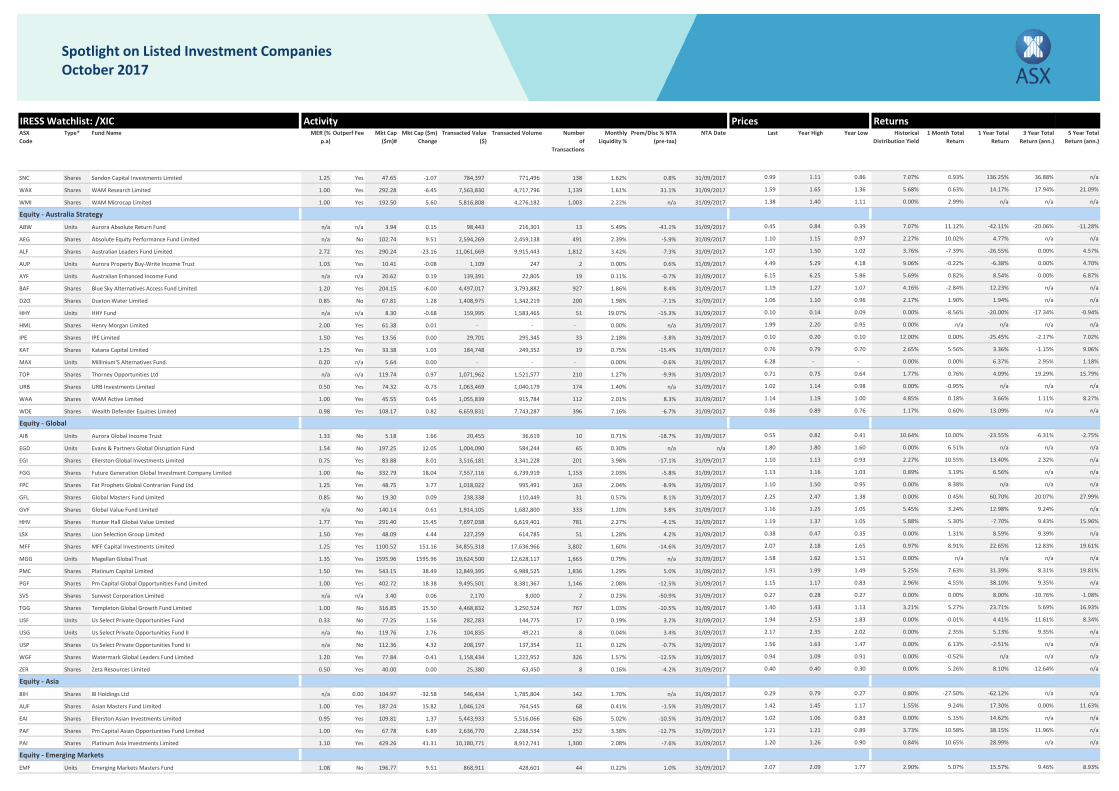
SNC Shares Sandon Capital Investments Limited 1.25 Yes 47.65 -1.07 784,397 771,496 138 1.62% 0.8% 31/09/2017 0.99 1.11 0.86 7.07% 0.93% 136.25% 36.88% n/a
WAX Shares WAM Research Limited 1.00 Yes 292.28 -6.45 7,563,830 4,717,796 1,139 1.61% 31.1% 31/09/2017 1.59 1.65 1.36 5.68% 0.63% 14.17% 17.94% 21.09%
WMI Shares WAM Microcap Limited 1.00 Yes 192.50 5.60 5,816,808 4,276,182 1,003 2.22% n/a 31/09/2017 1.38 1.40 1.11 0.00% 2.99% n/a n/a n/a
Equity - Australia Strategy
ABW Units Aurora Absolute Return Fund n/a n/a 3.94 0.15 98,443 216,301 13 5.49% -41.1% 31/09/2017 0.45 0.84 0.39 7.07% 11.12% -42.11% -20.06% -11.28%
AEG Shares Absolute Equity Performance Fund Limited n/a No 102.74 9.51 2,594,269 2,459,138 491 2.39% -5.9% 31/09/2017 1.10 1.15 0.97 2.27% 10.02% 4.77% n/a n/a
ALF Shares Australian Leaders Fund Limited 2.72 Yes 290.24 -23.16 11,061,669 9,915,443 1,812 3.42% -7.3% 31/09/2017 1.07 1.50 1.02 3.76% -7.39% -26.55% 0.00% 4.57%
AUP Units Aurora Property Buy-Write Income Trust 1.03 Yes 10.41 -0.08 1,109 247 2 0.00% 0.6% 31/09/2017 4.49 5.29 4.18 9.06% -0.22% -6.38% 0.00% 4.70%
AYF Units Australian Enhanced Income Fund n/a n/a 20.62 0.19 139,391 22,805 19 0.11% -0.7% 31/09/2017 6.15 6.25 5.86 5.69% 0.82% 8.54% 0.00% 6.87%
BAF Shares Blue Sky Alternatives Access Fund Limited 1.20 Yes 204.15 -6.00 4,497,017 3,793,882 927 1.86% 8.4% 31/09/2017 1.19 1.27 1.07 4.16% -2.84% 12.23% n/a n/a
D2O Shares Duxton Water Limited 0.85 No 67.81 1.28 1,408,975 1,342,219 200 1.98% -7.1% 31/09/2017 1.06 1.10 0.96 2.17% 1.90% 1.94% n/a n/a
HHY Units HHY Fund n/a n/a 8.30 -0.68 159,995 1,583,465 51 19.07% -15.3% 31/09/2017 0.10 0.14 0.09 0.00% -8.56% -20.00% -17.34% -0.94%
HML Shares Henry Morgan Limited 2.00 Yes 61.38 0.01 - - - 0.00% n/a 31/09/2017 1.99 2.20 0.95 0.00% n/a n/a n/a n/a
IPE Shares IPE Limited 1.50 Yes 13.56 0.00 29,701 295,345 33 2.18% -3.8% 31/09/2017 0.10 0.20 0.10 12.00% 0.00% -25.45% -2.17% 7.02%
KAT Shares Katana Capital Limited 1.25 Yes 33.38 1.03 184,748 249,352 19 0.75% -15.4% 31/09/2017 0.76 0.79 0.70 2.65% 5.56% 3.36% -1.15% 9.06%
MAX Units Millinium'S Alternatives Fund. 0.20 n/a 5.64 0.00 - - - 0.00% -0.6% 31/09/2017 6.28 - - 0.00% 0.00% 6.37% 2.95% 1.18%
TOP Shares Thorney Opportunities Ltd n/a n/a 119.74 0.97 1,071,962 1,521,577 210 1.27% -9.9% 31/09/2017 0.71 0.75 0.64 1.77% 0.76% 4.09% 19.29% 15.79%
URB Shares URB Investments Limited 0.50 Yes 74.32 -0.73 1,063,469 1,040,179 174 1.40% n/a 31/09/2017 1.02 1.14 0.98 0.00% -0.95% n/a n/a n/a
WAA Shares WAM Active Limited 1.00 Yes 45.55 0.45 1,055,839 915,784 112 2.01% 8.3% 31/09/2017 1.14 1.19 1.00 4.85% 0.18% 3.66% 1.11% 8.27%
WDE Shares Wealth Defender Equities Limited 0.98 Yes 108.17 0.82 6,659,831 7,743,287 396 7.16% -6.7% 31/09/2017 0.86 0.89 0.76 1.17% 0.60% 13.09% n/a n/a
Equity - Global
AIB Units Aurora Global Income Trust 1.33 No 5.18 1.66 20,455 36,619 10 0.71% -18.7% 31/09/2017 0.55 0.82 0.41 10.64% 10.00% -23.55% -6.31% -2.75%
EGD Units Evans & Partners Global Disruption Fund 1.54 No 197.25 12.05 1,004,090 584,244 65 0.30% n/a n/a 1.80 1.80 1.60 0.00% 6.51% n/a n/a n/a
EGI Shares Ellerston Global Investments Limited 0.75 Yes 83.88 8.01 3,516,181 3,341,228 201 3.98% -17.1% 31/09/2017 1.10 1.13 0.93 2.27% 10.55% 13.40% 2.32% n/a
FGG Shares Future Generation Global Investment Company Limited 1.00 No 332.79 18.04 7,557,116 6,739,919 1,153 2.03% -5.8% 31/09/2017 1.13 1.16 1.03 0.89% 3.19% 6.56% n/a n/a
FPC Shares Fat Prophets Global Contrarian Fund Ltd 1.25 Yes 48.75 3.77 1,018,022 995,491 163 2.04% -8.9% 31/09/2017 1.10 1.50 0.95 0.00% 8.38% n/a n/a n/a
GFL Shares Global Masters Fund Limited 0.85 No 19.30 0.09 238,338 110,449 31 0.57% 8.1% 31/09/2017 2.25 2.47 1.38 0.00% 0.45% 60.70% 20.07% 27.99%
GVF Shares Global Value Fund Limited n/a No 140.14 0.61 1,914,105 1,682,800 333 1.20% 3.8% 31/09/2017 1.16 1.25 1.05 5.45% 3.24% 12.98% 9.24% n/a
HHV Shares Hunter Hall Global Value Limited 1.77 Yes 291.40 15.45 7,697,038 6,619,401 781 2.27% -4.1% 31/09/2017 1.19 1.37 1.05 5.88% 5.30% -7.70% 9.43% 15.96%
LSX Shares Lion Selection Group Limited 1.50 Yes 48.09 4.44 227,259 614,785 51 1.28% 4.2% 31/09/2017 0.38 0.47 0.35 0.00% 1.31% 8.59% 9.39% n/a
MFF Shares MFF Capital Investments Limited 1.25 Yes 1100.52 151.16 34,855,318 17,636,966 3,802 1.60% -14.6% 31/09/2017 2.07 2.18 1.65 0.97% 8.91% 22.65% 12.83% 19.61%
MGG Units Magellan Global Trust 1.35 Yes 1595.96 1595.96 19,624,500 12,628,117 1,663 0.79% n/a 31/09/2017 1.58 1.62 1.51 0.00% n/a n/a n/a n/a
PMC Shares Platinum Capital Limited 1.50 Yes 543.15 38.49 12,849,395 6,988,525 1,836 1.29% 5.0% 31/09/2017 1.91 1.99 1.49 5.25% 7.63% 31.39% 8.31% 19.81%
PGF Shares Pm Capital Global Opportunities Fund Limited 1.00 Yes 402.72 18.38 9,495,501 8,381,367 1,146 2.08% -12.5% 31/09/2017 1.15 1.17 0.83 2.96% 4.55% 38.10% 9.35% n/a
SVS Shares Sunvest Corporation Limited n/a n/a 3.40 0.06 2,170 8,000 2 0.23% -50.9% 31/09/2017 0.27 0.28 0.27 0.00% 0.00% 8.00% -10.76% -1.08%
TGG Shares Templeton Global Growth Fund Limited 1.00 No 316.85 15.50 4,468,832 3,250,524 767 1.03% -10.5% 31/09/2017 1.40 1.43 1.13 3.21% 5.27% 23.71% 5.69% 16.93%
USF Units Us Select Private Opportunities Fund 0.33 No 77.25 1.56 282,283 144,775 17 0.19% 3.2% 31/09/2017 1.94 2.53 1.83 0.00% -0.01% 4.41% 11.61% 8.34%
USG Units Us Select Private Opportunities Fund II n/a No 119.76 2.76 104,835 49,221 8 0.04% 3.4% 31/09/2017 2.17 2.35 2.02 0.00% 2.35% 5.13% 9.35% n/a
USP Shares Us Select Private Opportunities Fund Iii n/a No 112.36 4.32 208,197 137,354 11 0.12% -0.7% 31/09/2017 1.56 1.63 1.47 0.00% 6.13% -2.51% n/a n/a
WGF Shares Watermark Global Leaders Fund Limited 1.20 Yes 77.84 -0.41 1,158,434 1,222,952 326 1.57% -12.5% 31/09/2017 0.94 1.09 0.91 0.00% -0.52% n/a n/a n/a
ZER Shares Zeta Resources Limited 0.50 Yes 40.00 0.00 25,380 63,450 8 0.16% -4.2% 31/09/2017 0.40 0.40 0.30 0.00% 5.26% 8.10% -12.64% n/a
Equity - Asia
8IH Shares 8I Holdings Ltd n/a 0.00 104.97 -32.58 546,434 1,785,804 142 1.70% n/a 31/09/2017 0.29 0.79 0.27 0.80% -27.50% -62.12% n/a n/a
AUF Shares Asian Masters Fund Limited 1.00 Yes 187.24 15.82 1,046,124 764,545 68 0.41% -1.5% 31/09/2017 1.42 1.45 1.17 1.55% 9.24% 17.30% 0.00% 11.63%
EAI Shares Ellerston Asian Investments Limited 0.95 Yes 109.81 1.37 5,443,933 5,516,066 626 5.02% -10.5% 31/09/2017 1.02 1.06 0.83 0.00% 5.15% 14.62% n/a n/a
PAF Shares Pm Capital Asian Opportunities Fund Limited 1.00 Yes 67.78 6.89 2,636,770 2,288,534 252 3.38% -12.7% 31/09/2017 1.21 1.21 0.89 3.73% 10.58% 38.15% 11.96% n/a
PAI Shares Platinum Asia Investments Limited 1.10 Yes 429.26 41.31 10,180,771 8,912,741 1,300 2.08% -7.6% 31/09/2017 1.20 1.26 0.90 0.84% 10.65% 28.99% n/a n/a
Equity - Emerging Markets
EMF Units Emerging Markets Masters Fund 1.08 No 196.77 9.51 868,911 428,601 44 0.22% 1.0% 31/09/2017 2.07 2.09 1.77 2.90% 5.07% 15.57% 9.46% 8.93%
IRESS Watchlist: /XIC Activity Prices ReturnsASX Code
Type* MER (% p.a)
Outperf Fee Mkt Cap ($m)#
Mkt Cap ($m) Change
Transacted Value ($)
Transacted Volume Number of
Transactions
Monthly Liquidity %
Prem/Disc % NTA (pre-tax)
NTA Date Last Year High Year Low Historical Distribution Yield
1 Month Total Return
1 Year Total Return
3 Year Total Return (ann.)
5 Year Total Return (ann.)
Fund Name
Spotlight on Listed Investment CompaniesOctober 2017
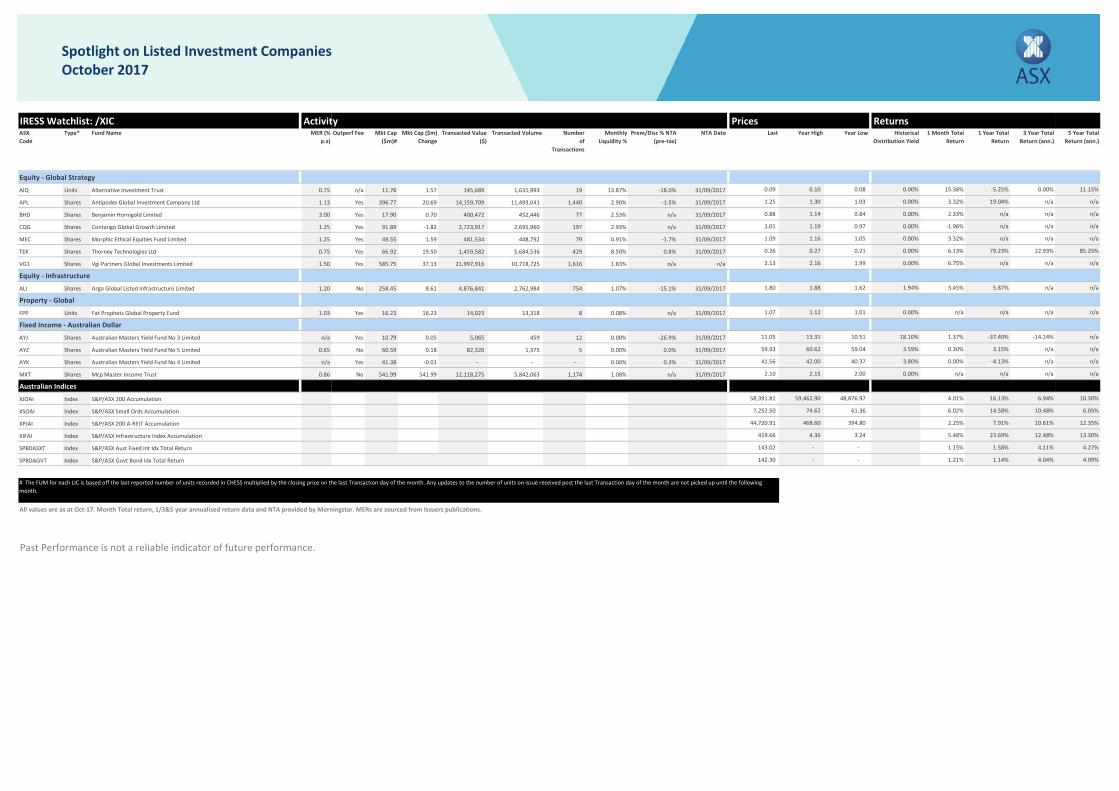
Equity - Global Strategy
AIQ Units Alternative Investment Trust 0.75 n/a 11.76 1.57 145,689 1,631,993 19 13.87% -18.0% 31/09/2017 0.09 0.10 0.08 0.00% 15.38% -5.25% 0.00% 11.15%
APL Shares Antipodes Global Investment Company Ltd 1.13 Yes 396.77 20.69 14,159,709 11,493,041 1,440 2.90% -1.5% 31/09/2017 1.25 1.30 1.03 0.00% 3.32% 19.04% n/a n/a
BHD Shares Benjamin Hornigold Limited 3.00 Yes 17.90 0.70 400,472 452,446 77 2.53% n/a 31/09/2017 0.88 1.14 0.84 0.00% 2.33% n/a n/a n/a
CQG Shares Contango Global Growth Limited 1.25 Yes 91.89 -1.82 2,723,917 2,695,960 197 2.93% n/a 31/09/2017 1.01 1.19 0.97 0.00% -1.96% n/a n/a n/a
MEC Shares Morphic Ethical Equities Fund Limited 1.25 Yes 49.55 1.59 481,534 448,792 79 0.91% -1.7% 31/09/2017 1.09 1.16 1.05 0.00% 3.32% n/a n/a n/a
TEK Shares Thorney Technologies Ltd 0.75 Yes 66.92 19.50 1,459,582 5,684,536 429 8.50% 0.8% 31/09/2017 0.26 0.27 0.21 0.00% 6.13% 79.23% 22.93% 85.25%
VG1 Shares Vgi Partners Global Investments Limited 1.50 Yes 585.75 37.13 21,997,916 10,718,725 1,616 1.83% n/a n/a 2.13 2.16 1.99 0.00% 6.75% n/a n/a n/a
Equity - Infrastructure
ALI Shares Argo Global Listed Infrastructure Limited 1.20 No 258.45 8.61 4,876,841 2,762,984 754 1.07% -15.1% 31/09/2017 1.80 1.88 1.62 1.94% 3.45% 5.87% n/a n/a
Property - Global
FPP Units Fat Prophets Global Property Fund 1.03 Yes 16.23 16.23 14,023 13,318 8 0.08% n/a 31/09/2017 1.07 1.12 1.01 0.00% n/a n/a n/a n/a
Fixed Income - Australian Dollar
AYJ Shares Australian Masters Yield Fund No 3 Limited n/a Yes 10.79 0.05 5,065 459 12 0.00% -26.9% 31/09/2017 11.05 13.31 10.51 18.10% 1.37% -37.40% -14.24% n/a
AYZ Shares Australian Masters Yield Fund No 5 Limited 0.65 No 60.59 0.18 82,320 1,375 5 0.00% 0.0% 31/09/2017 59.93 60.62 59.04 3.59% 0.30% 3.15% n/a n/a
AYK Shares Australian Masters Yield Fund No 4 Limited n/a Yes 41.38 -0.01 - - - 0.00% 0.3% 31/09/2017 41.56 42.00 40.37 3.80% 0.00% -4.13% n/a n/a
MXT Shares Mcp Master Income Trust 0.86 No 541.99 541.99 12,118,275 5,842,063 1,174 1.08% n/a 31/09/2017 2.10 2.15 2.00 0.00% n/a n/a n/a n/a
Australian Indices
XJOAI Index S&P/ASX 200 Accumulation 58,391.81 59,462.90 48,876.97 4.01% 16.13% 6.94% 10.30%
XSOAI Index S&P/ASX Small Ords Accumulation 7,252.50 74.62 61.36 6.02% 14.58% 10.48% 6.05%
XPJAI Index S&P/ASX 200 A-REIT Accumulation 44,720.91 468.60 394.80 2.25% 7.91% 10.61% 12.35%
XIFAI Index S&P/ASX Infrastructure Index Accumulation 419.66 4.36 3.24 5.48% 23.69% 12.48% 13.30%
SPBDASXT Index S&P/ASX Aust Fixed Int Idx Total Return 143.02 - - 1.15% 1.58% 4.11% 4.27%
SPBDAGVT Index S&P/ASX Govt Bond Idx Total Return 142.30 - - 1.21% 1.14% 4.04% 4.09%
All values are as at Oct-17. Month Total return, 1/3&5 year annualised return data and NTA provided by Morningstar. MERs are sourced from Issuers publications.
Past Performance is not a reliable indicator of future performance.
# The FUM for each LIC is based off the last reported number of units recorded in CHESS multiplied by the closing price on the last Transaction day of the month. Any updates to the number of units on issue received post the last Transaction day of the month are not picked up until the following month.
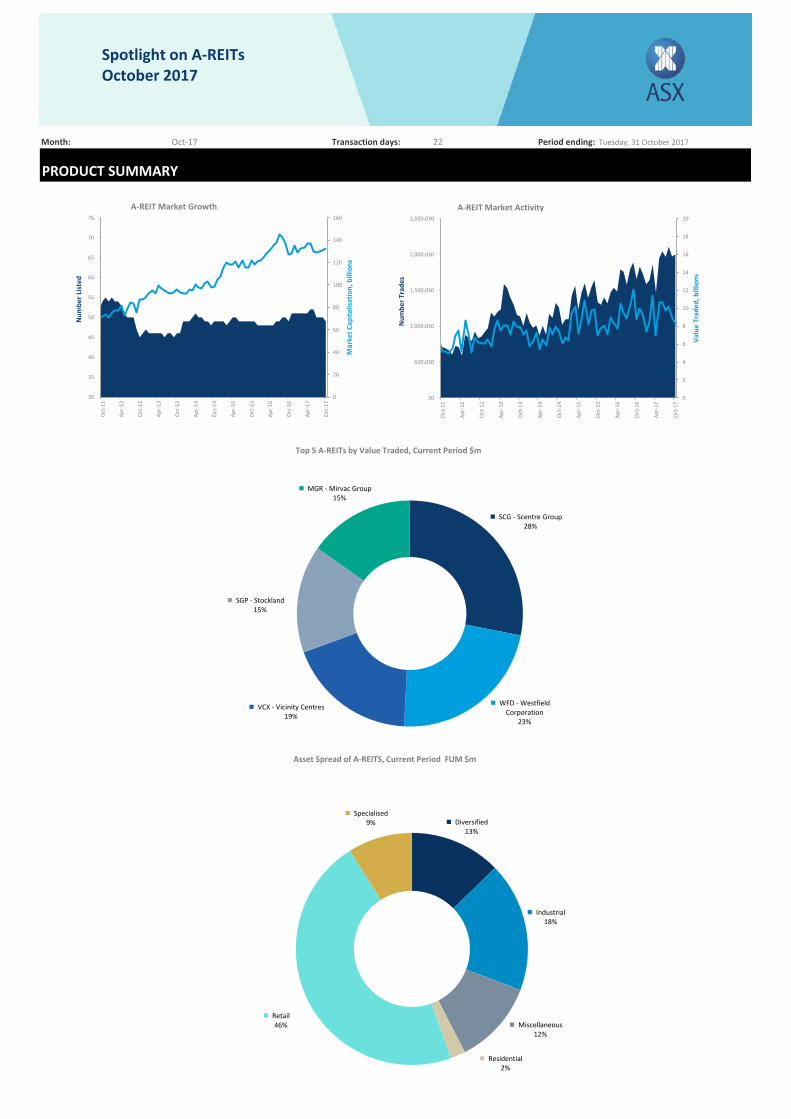
Month: Oct-17 Transaction days: 22 Period ending:
PRODUCT SUMMARY
0.5
Tuesday, 31 October 2017
0
20
40
60
80
100
120
140
160
30
35
40
45
50
55
60
65
70
75
Oct
-11
Apr-
12
Oct
-12
Apr-
13
Oct
-13
Apr-
14
Oct
-14
Apr-
15
Oct
-15
Apr-
16
Oct
-16
Apr-
17
Oct
-17
Mar
ket C
apita
lisat
ion,
bill
ions
Num
ber L
iste
d
A-REIT Market Growth
0
2
4
6
8
10
12
14
16
18
20
30
500,030
1,000,030
1,500,030
2,000,030
2,500,030
Oct
-11
Apr-
12
Oct
-12
Apr-
13
Oct
-13
Apr-
14
Oct
-14
Apr-
15
Oct
-15
Apr-
16
Oct
-16
Apr-
17
Oct
-17
Valu
e Tr
aded
, bill
ions
Num
ber T
rade
s
A-REIT Market Activity
SCG - Scentre Group28%
WFD - Westfield Corporation
23%
VCX - Vicinity Centres19%
SGP - Stockland15%
MGR - Mirvac Group15%
Top 5 A-REITs by Value Traded, Current Period $m
Diversified13%
Industrial18%
Miscellaneous12%
Residential2%
Retail46%
Specialised9%
Asset Spread of A-REITS, Current Period FUM $m
Spotlight on A-REITsOctober 2017
ASX A-REIT Profiles Activity Prices ReturnsASX Code
Type* Mkt Cap ($m)#
Mkt Cap Change ($m)
Transacted Value ($) Transacted Volume Number of Trades
Monthly Liquidity %
Last Year High Year Low Historical Distribution Yield
1 Month Total Return
1 Year Total Return
3 Year Total Return (ann.)
5 Year Total Return (ann.)
Property - Australia
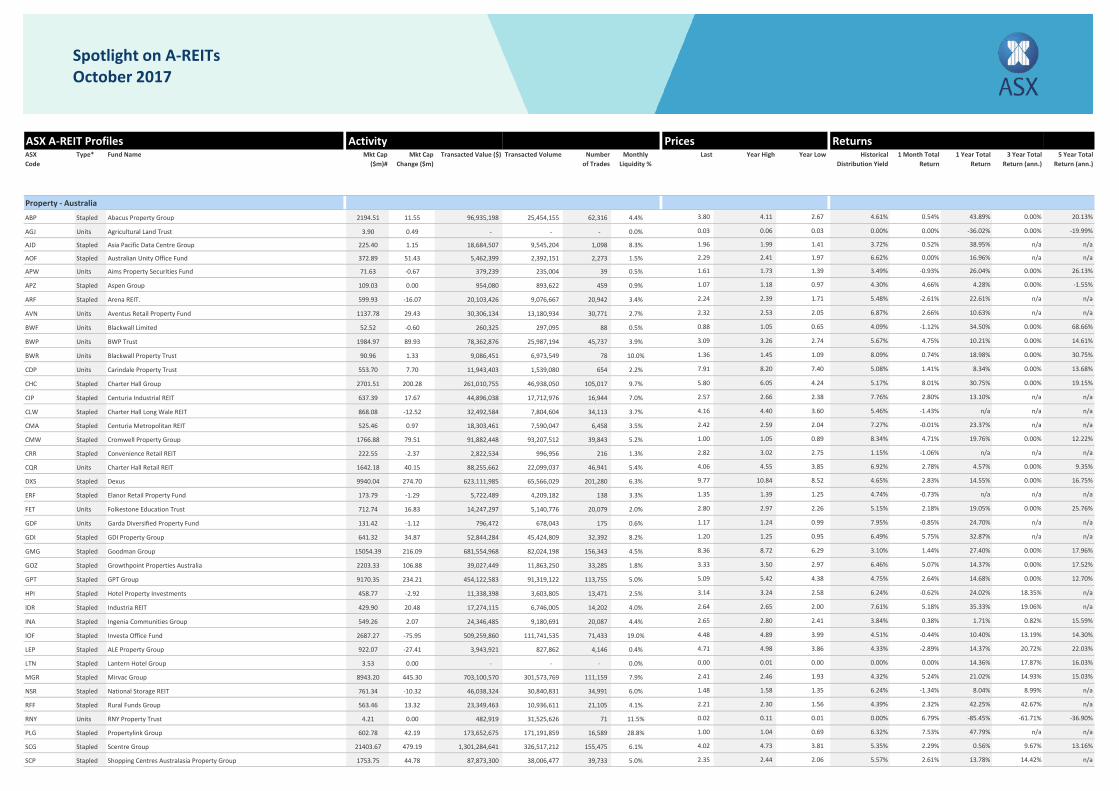
ABP Stapled Abacus Property Group 2194.51 11.55 96,935,198 25,454,155 62,316 4.4% 3.80 4.11 2.67 4.61% 0.54% 43.89% 0.00% 20.13%
AGJ Units Agricultural Land Trust 3.90 0.49 - - - 0.0% 0.03 0.06 0.03 0.00% 0.00% -36.02% 0.00% -19.99%
AJD Stapled Asia Pacific Data Centre Group 225.40 1.15 18,684,507 9,545,204 1,098 8.3% 1.96 1.99 1.41 3.72% 0.52% 38.95% n/a n/a
AOF Stapled Australian Unity Office Fund 372.89 51.43 5,462,399 2,392,151 2,273 1.5% 2.29 2.41 1.97 6.62% 0.00% 16.96% n/a n/a
APW Units Aims Property Securities Fund 71.63 -0.67 379,239 235,004 39 0.5% 1.61 1.73 1.39 3.49% -0.93% 26.04% 0.00% 26.13%
APZ Stapled Aspen Group 109.03 0.00 954,080 893,622 459 0.9% 1.07 1.18 0.97 4.30% 4.66% 4.28% 0.00% -1.55%
ARF Stapled Arena REIT. 599.93 -16.07 20,103,426 9,076,667 20,942 3.4% 2.24 2.39 1.71 5.48% -2.61% 22.61% n/a n/a
AVN Units Aventus Retail Property Fund 1137.78 29.43 30,306,134 13,180,934 30,771 2.7% 2.32 2.53 2.05 6.87% 2.66% 10.63% n/a n/a
BWF Units Blackwall Limited 52.52 -0.60 260,325 297,095 88 0.5% 0.88 1.05 0.65 4.09% -1.12% 34.50% 0.00% 68.66%
BWP Units BWP Trust 1984.97 89.93 78,362,876 25,987,194 45,737 3.9% 3.09 3.26 2.74 5.67% 4.75% 10.21% 0.00% 14.61%
BWR Units Blackwall Property Trust 90.96 1.33 9,086,451 6,973,549 78 10.0% 1.36 1.45 1.09 8.09% 0.74% 18.98% 0.00% 30.75%
CDP Units Carindale Property Trust 553.70 7.70 11,943,403 1,539,080 654 2.2% 7.91 8.20 7.40 5.08% 1.41% 8.34% 0.00% 13.68%
CHC Stapled Charter Hall Group 2701.51 200.28 261,010,755 46,938,050 105,017 9.7% 5.80 6.05 4.24 5.17% 8.01% 30.75% 0.00% 19.15%
CIP Stapled Centuria Industrial REIT 637.39 17.67 44,896,038 17,712,976 16,944 7.0% 2.57 2.66 2.38 7.76% 2.80% 13.10% n/a n/a
CLW Stapled Charter Hall Long Wale REIT 868.08 -12.52 32,492,584 7,804,604 34,113 3.7% 4.16 4.40 3.60 5.46% -1.43% n/a n/a n/a
CMA Stapled Centuria Metropolitan REIT 525.46 0.97 18,303,461 7,590,047 6,458 3.5% 2.42 2.59 2.04 7.27% -0.01% 23.37% n/a n/a
CMW Stapled Cromwell Property Group 1766.88 79.51 91,882,448 93,207,512 39,843 5.2% 1.00 1.05 0.89 8.34% 4.71% 19.76% 0.00% 12.22%
CRR Stapled Convenience Retail REIT 222.55 -2.37 2,822,534 996,956 216 1.3% 2.82 3.02 2.75 1.15% -1.06% n/a n/a n/a
CQR Units Charter Hall Retail REIT 1642.18 40.15 88,255,662 22,099,037 46,941 5.4% 4.06 4.55 3.85 6.92% 2.78% 4.57% 0.00% 9.35%
DXS Stapled Dexus 9940.04 274.70 623,111,985 65,566,029 201,280 6.3% 9.77 10.84 8.52 4.65% 2.83% 14.55% 0.00% 16.75%
ERF Stapled Elanor Retail Property Fund 173.79 -1.29 5,722,489 4,209,182 138 3.3% 1.35 1.39 1.25 4.74% -0.73% n/a n/a n/a
FET Units Folkestone Education Trust 712.74 16.83 14,247,297 5,140,776 20,079 2.0% 2.80 2.97 2.26 5.15% 2.18% 19.05% 0.00% 25.76%
GDF Units Garda Diversified Property Fund 131.42 -1.12 796,472 678,043 175 0.6% 1.17 1.24 0.99 7.95% -0.85% 24.70% n/a n/a
GDI Stapled GDI Property Group 641.32 34.87 52,844,284 45,424,809 32,392 8.2% 1.20 1.25 0.95 6.49% 5.75% 32.87% n/a n/a
GMG Stapled Goodman Group 15054.39 216.09 681,554,968 82,024,198 156,343 4.5% 8.36 8.72 6.29 3.10% 1.44% 27.40% 0.00% 17.96%
GOZ Stapled Growthpoint Properties Australia 2203.33 106.88 39,027,449 11,863,250 33,285 1.8% 3.33 3.50 2.97 6.46% 5.07% 14.37% 0.00% 17.52%
GPT Stapled GPT Group 9170.35 234.21 454,122,583 91,319,122 113,755 5.0% 5.09 5.42 4.38 4.75% 2.64% 14.68% 0.00% 12.70%
HPI Stapled Hotel Property Investments 458.77 -2.92 11,338,398 3,603,805 13,471 2.5% 3.14 3.24 2.58 6.24% -0.62% 24.02% 18.35% n/a
IDR Stapled Industria REIT 429.90 20.48 17,274,115 6,746,005 14,202 4.0% 2.64 2.65 2.00 7.61% 5.18% 35.33% 19.06% n/a
INA Stapled Ingenia Communities Group 549.26 2.07 24,346,485 9,180,691 20,087 4.4% 2.65 2.80 2.41 3.84% 0.38% 1.71% 0.82% 15.59%
IOF Stapled Investa Office Fund 2687.27 -75.95 509,259,860 111,741,535 71,433 19.0% 4.48 4.89 3.99 4.51% -0.44% 10.40% 13.19% 14.30%
LEP Stapled ALE Property Group 922.07 -27.41 3,943,921 827,862 4,146 0.4% 4.71 4.98 3.86 4.33% -2.89% 14.37% 20.72% 22.03%
LTN Stapled Lantern Hotel Group 3.53 0.00 - - - 0.0% 0.00 0.01 0.00 0.00% 0.00% 14.36% 17.87% 16.03%
MGR Stapled Mirvac Group 8943.20 445.30 703,100,570 301,573,769 111,159 7.9% 2.41 2.46 1.93 4.32% 5.24% 21.02% 14.93% 15.03%
NSR Stapled National Storage REIT 761.34 -10.32 46,038,324 30,840,831 34,991 6.0% 1.48 1.58 1.35 6.24% -1.34% 8.04% 8.99% n/a
RFF Stapled Rural Funds Group 563.46 13.32 23,349,463 10,936,611 21,105 4.1% 2.21 2.30 1.56 4.39% 2.32% 42.25% 42.67% n/a
RNY Units RNY Property Trust 4.21 0.00 482,919 31,525,626 71 11.5% 0.02 0.11 0.01 0.00% 6.79% -85.45% -61.71% -36.90%
PLG Stapled Propertylink Group 602.78 42.19 173,652,675 171,191,859 16,589 28.8% 1.00 1.04 0.69 6.32% 7.53% 47.79% n/a n/a
SCG Stapled Scentre Group 21403.67 479.19 1,301,284,641 326,517,212 155,475 6.1% 4.02 4.73 3.81 5.35% 2.29% 0.56% 9.67% 13.16%
SCP Stapled Shopping Centres Australasia Property Group 1753.75 44.78 87,873,300 38,006,477 39,733 5.0% 2.35 2.44 2.06 5.57% 2.61% 13.78% 14.42% n/a
Fund Name
Spotlight on A-REITsOctober 2017
ASX A-REIT Profiles Activity Prices ReturnsASX Code
Type* Mkt Cap ($m)#
Mkt Cap Change ($m)
Transacted Value ($) Transacted Volume Number of Trades
Monthly Liquidity %
Last Year High Year Low Historical Distribution Yield
1 Month Total Return
1 Year Total Return
3 Year Total Return (ann.)
5 Year Total Return (ann.)
Fund Name
Spotlight on A-REITsOctober 2017
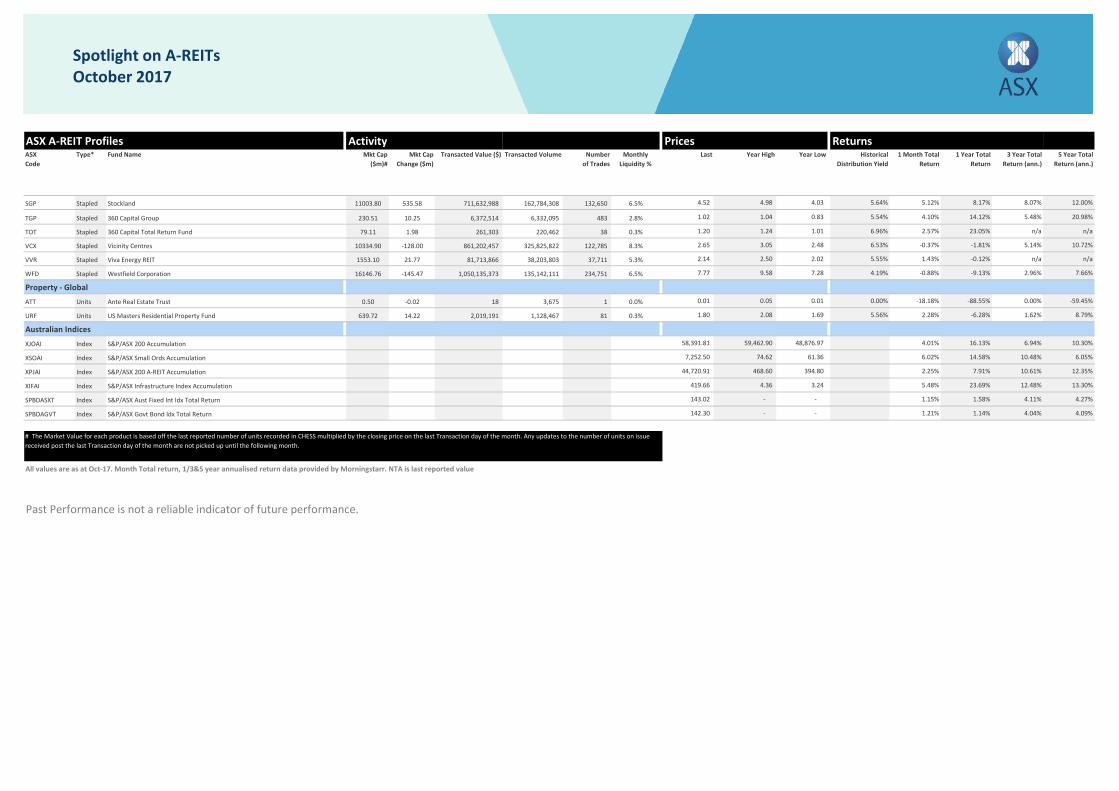
SGP Stapled Stockland 11003.80 535.58 711,632,988 162,784,308 132,650 6.5% 4.52 4.98 4.03 5.64% 5.12% 8.17% 8.07% 12.00%
TGP Stapled 360 Capital Group 230.51 10.25 6,372,514 6,332,095 483 2.8% 1.02 1.04 0.83 5.54% 4.10% 14.12% 5.48% 20.98%
TOT Stapled 360 Capital Total Return Fund 79.11 1.98 261,303 220,462 38 0.3% 1.20 1.24 1.01 6.96% 2.57% 23.05% n/a n/a
VCX Stapled Vicinity Centres 10334.90 -128.00 861,202,457 325,825,822 122,785 8.3% 2.65 3.05 2.48 6.53% -0.37% -1.81% 5.14% 10.72%
VVR Stapled Viva Energy REIT 1553.10 21.77 81,713,866 38,203,803 37,711 5.3% 2.14 2.50 2.02 5.55% 1.43% -0.12% n/a n/a
WFD Stapled Westfield Corporation 16146.76 -145.47 1,050,135,373 135,142,111 234,751 6.5% 7.77 9.58 7.28 4.19% -0.88% -9.13% 2.96% 7.66%
Property - Global
ATT Units Ante Real Estate Trust 0.50 -0.02 18 3,675 1 0.0% 0.01 0.05 0.01 0.00% -18.18% -88.55% 0.00% -59.45%
URF Units US Masters Residential Property Fund 639.72 14.22 2,019,191 1,128,467 81 0.3% 1.80 2.08 1.69 5.56% 2.28% -6.28% 1.62% 8.79%
Australian Indices
XJOAI Index S&P/ASX 200 Accumulation 58,391.81 59,462.90 48,876.97 4.01% 16.13% 6.94% 10.30%
XSOAI Index S&P/ASX Small Ords Accumulation 7,252.50 74.62 61.36 6.02% 14.58% 10.48% 6.05%
XPJAI Index S&P/ASX 200 A-REIT Accumulation 44,720.91 468.60 394.80 2.25% 7.91% 10.61% 12.35%
XIFAI Index S&P/ASX Infrastructure Index Accumulation 419.66 4.36 3.24 5.48% 23.69% 12.48% 13.30%
SPBDASXT Index S&P/ASX Aust Fixed Int Idx Total Return 143.02 - - 1.15% 1.58% 4.11% 4.27%
SPBDAGVT Index S&P/ASX Govt Bond Idx Total Return 142.30 - - 1.21% 1.14% 4.04% 4.09%
All values are as at Oct-17. Month Total return, 1/3&5 year annualised return data provided by Morningstarr. NTA is last reported value
Past Performance is not a reliable indicator of future performance.
# The Market Value for each product is based off the last reported number of units recorded in CHESS multiplied by the closing price on the last Transaction day of the month. Any updates to the number of units on issue received post the last Transaction day of the month are not picked up until the following month.
Month: Oct-17 Transaction days: 22 Period ending:
PRODUCT SUMMARY
0.5
Tuesday, 31 October 2017
0
10
20
30
40
50
60
70
80
6
8
10
12
14
16
18
20
22
24
Oct
-11
Apr-
12
Oct
-12
Apr-
13
Oct
-13
Apr-
14
Oct
-14
Apr-
15
Oct
-15
Apr-
16
Oct
-16
Apr-
17
Oct
-17
Mar
ket C
apita
lisat
ion,
bill
ions
Num
ber L
iste
d
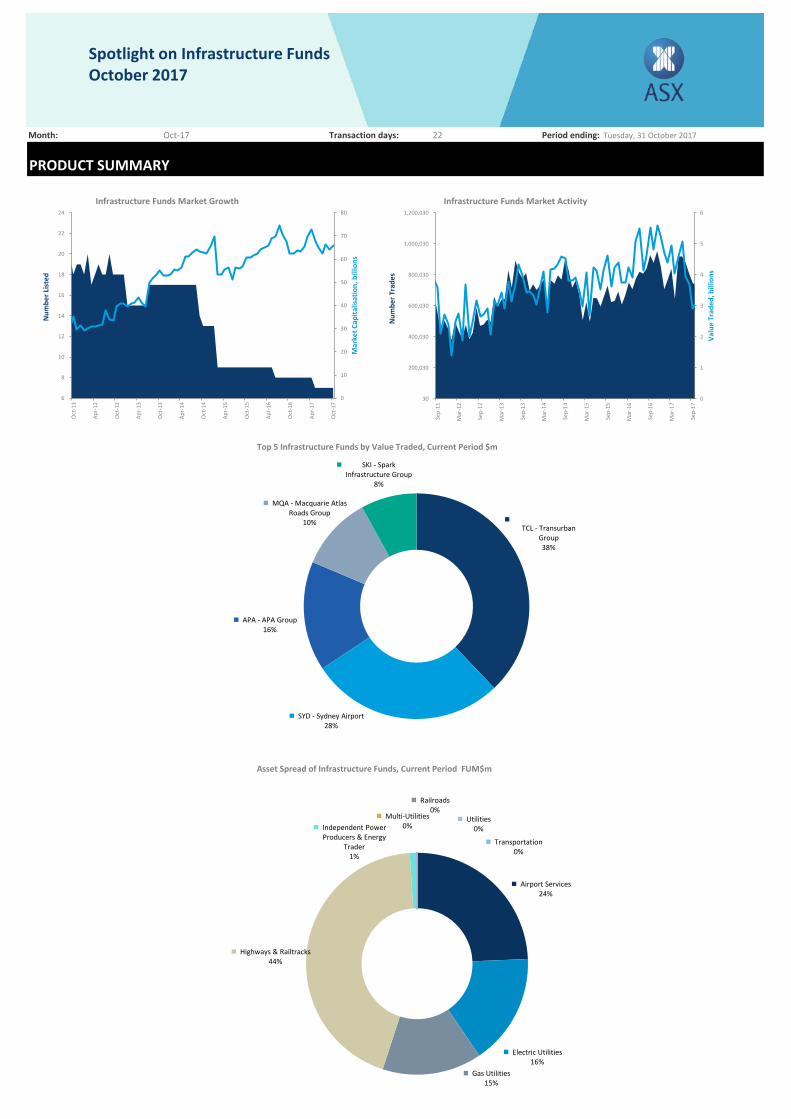
Infrastructure Funds Market Growth
0
1
2
3
4
5
6
30
200,030
400,030
600,030
800,030
1,000,030
1,200,030
Sep-
11
Mar
-12
Sep-
12
Mar
-13
Sep-
13
Mar
-14
Sep-
14
Mar
-15
Sep-
15
Mar
-16
Sep-
16
Mar
-17
Sep-
17
Valu
e Tr
aded
, bill
ions
Num
ber T
rade
s
Infrastructure Funds Market Activity
TCL - Transurban Group38%
SYD - Sydney Airport28%
APA - APA Group16%
MQA - Macquarie Atlas Roads Group
10%
SKI - Spark Infrastructure Group
8%
Top 5 Infrastructure Funds by Value Traded, Current Period $m
Airport Services24%
Electric Utilities16%
Gas Utilities15%
Highways & Railtracks44%
Independent Power Producers & Energy
Trader1%
Multi-Utilities0%
Railroads0%
Transportation0%
Utilities0%
Asset Spread of Infrastructure Funds, Current Period FUM$m
Spotlight on Infrastructure FundsOctober 2017
ASX Infrastructure Fund Profiles Activity Prices ReturnsASX Code
Type* Mkt Cap ($m)#
Mkt Cap Change ($m)
Transacted Value ($) Transacted Volume Number of Trades
Monthly Liquidity %
Prem/Disc % NTA Last Year High Year Low Historical Distribution Yield
1 Month Total Return
1 Year Total Return
3 Year Total Return (ann.)
5 Year Total Return (ann.)
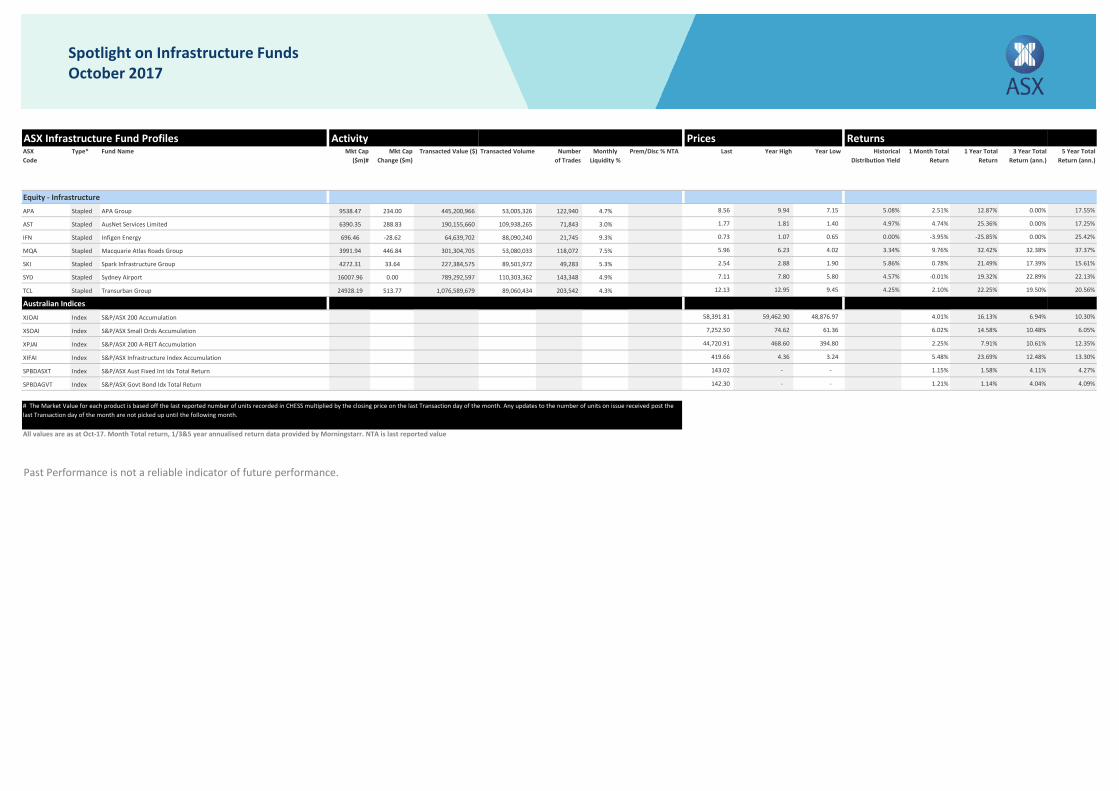
Equity - InfrastructureAPA Stapled APA Group 9538.47 234.00 445,200,966 53,005,326 122,940 4.7% 8.56 9.94 7.15 5.08% 2.51% 12.87% 0.00% 17.55%
AST Stapled AusNet Services Limited 6390.35 288.83 190,155,660 109,938,265 71,843 3.0% 1.77 1.81 1.40 4.97% 4.74% 25.36% 0.00% 17.25%
IFN Stapled Infigen Energy 696.46 -28.62 64,639,702 88,090,240 21,745 9.3% 0.73 1.07 0.65 0.00% -3.95% -25.85% 0.00% 25.42%
MQA Stapled Macquarie Atlas Roads Group 3991.94 446.84 301,304,705 53,080,033 118,072 7.5% 5.96 6.23 4.02 3.34% 9.76% 32.42% 32.38% 37.37%
SKI Stapled Spark Infrastructure Group 4272.31 33.64 227,384,575 89,501,972 49,283 5.3% 2.54 2.88 1.90 5.86% 0.78% 21.49% 17.39% 15.61%
SYD Stapled Sydney Airport 16007.96 0.00 789,292,597 110,303,362 143,348 4.9% 7.11 7.80 5.80 4.57% -0.01% 19.32% 22.89% 22.13%
TCL Stapled Transurban Group 24928.19 513.77 1,076,589,679 89,060,434 203,542 4.3% 12.13 12.95 9.45 4.25% 2.10% 22.25% 19.50% 20.56%
Australian Indices
XJOAI Index S&P/ASX 200 Accumulation 58,391.81 59,462.90 48,876.97 4.01% 16.13% 6.94% 10.30%
XSOAI Index S&P/ASX Small Ords Accumulation 7,252.50 74.62 61.36 6.02% 14.58% 10.48% 6.05%
XPJAI Index S&P/ASX 200 A-REIT Accumulation 44,720.91 468.60 394.80 2.25% 7.91% 10.61% 12.35%
XIFAI Index S&P/ASX Infrastructure Index Accumulation 419.66 4.36 3.24 5.48% 23.69% 12.48% 13.30%
SPBDASXT Index S&P/ASX Aust Fixed Int Idx Total Return 143.02 - - 1.15% 1.58% 4.11% 4.27%
SPBDAGVT Index S&P/ASX Govt Bond Idx Total Return 142.30 - - 1.21% 1.14% 4.04% 4.09%
All values are as at Oct-17. Month Total return, 1/3&5 year annualised return data provided by Morningstarr. NTA is last reported value
Past Performance is not a reliable indicator of future performance.
# The Market Value for each product is based off the last reported number of units recorded in CHESS multiplied by the closing price on the last Transaction day of the month. Any updates to the number of units on issue received post the last Transaction day of the month are not picked up until the following month.
Fund Name
Spotlight on Infrastructure FundsOctober 2017
Month: Oct-17 Transaction days: 22 Period ending:
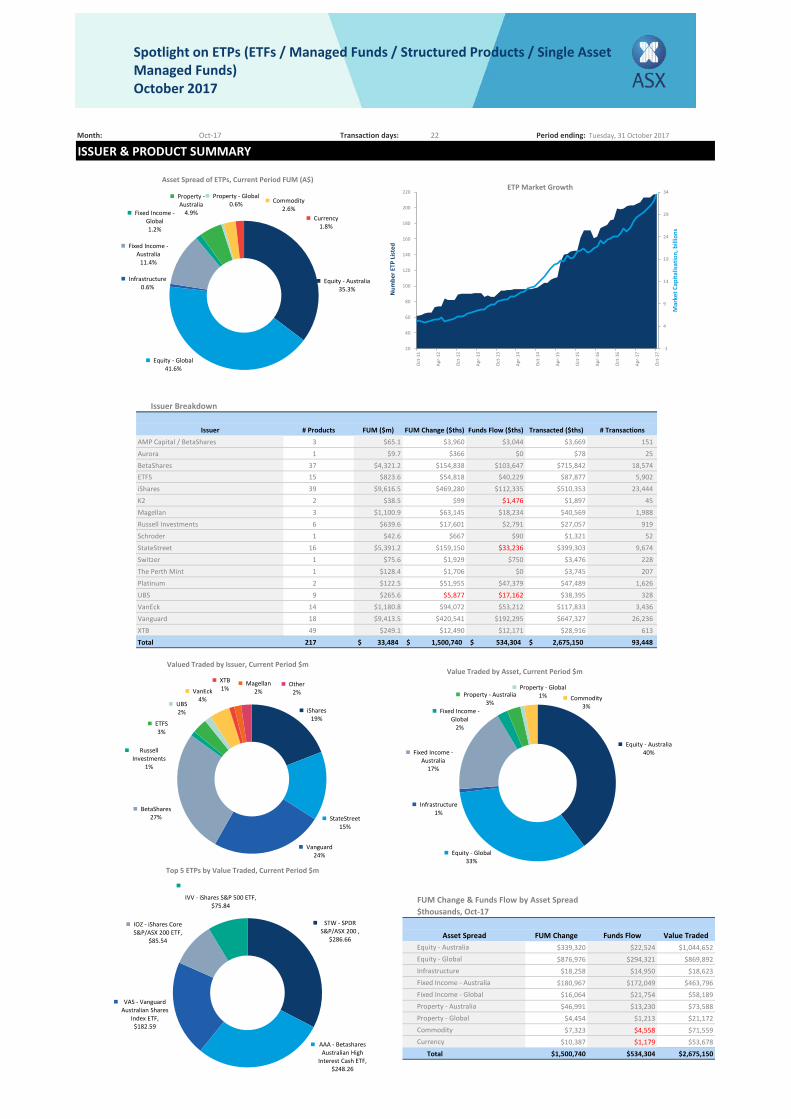
ISSUER & PRODUCT SUMMARY
Issuer Breakdown
AMP Capital / BetaShares 3 $65.1 $3,960 $3,044 $3,669 151 Aurora 1 $9.7 $366 $0 $78 25 BetaShares 37 $4,321.2 $154,838 $103,647 $715,842 18,574 ETFS 15 $823.6 $54,818 $40,229 $87,877 5,902 iShares 39 $9,616.5 $469,280 $112,335 $510,353 23,444 K2 2 $38.5 $99 $1,476 $1,897 45 Magellan 3 $1,100.9 $63,145 $18,234 $40,569 1,988 Russell Investments 6 $639.6 $17,601 $2,791 $27,057 919 Schroder 1 $42.6 $667 $90 $1,321 52 StateStreet 16 $5,391.2 $159,150 $33,236 $399,303 9,674 Switzer 1 $75.6 $1,929 $750 $3,476 228 The Perth Mint 1 $128.4 $1,706 $0 $3,745 207 Platinum 2 $122.5 $51,955 $47,379 $47,489 1,626 UBS 9 $265.6 $5,877 $17,162 $38,395 328 VanEck 14 $1,180.8 $94,072 $53,212 $117,833 3,436 Vanguard 18 $9,413.5 $420,541 $192,295 $647,327 26,236 XTB 49 $249.1 $12,490 $12,171 $28,916 613 Total 217 33,484$ 1,500,740$ 534,304$ 2,675,150$ 93,448
n/a
FUM Change & Funds Flow by Asset Spread$thousands, Oct-17
Equity - Australia $339,320 $22,524 $1,044,652Equity - Global $876,976 $294,321 $869,892Infrastructure $18,258 $14,950 $18,623Fixed Income - Australia $180,967 $172,049 $463,796Fixed Income - Global $16,064 $21,754 $58,189Property - Australia $46,991 $13,230 $73,588Property - Global $4,454 $1,213 $21,172Commodity $7,323 $4,558 $71,559Currency $10,387 $1,179 $53,678
Total $1,500,740 $534,304 $2,675,150
# Transactions
Tuesday, 31 October 2017
Asset Spread FUM Change Funds Flow
Transacted ($ths)
Value Traded
Issuer # Products FUM ($m) FUM Change ($ths) Funds Flow ($ths)
Equity - Australia35.3%
Equity - Global41.6%
Infrastructure0.6%
Fixed Income -Australia
11.4%
Fixed Income -Global1.2%
Property -Australia
4.9%
Property - Global0.6% Commodity
2.6%Currency
1.8%
Asset Spread of ETPs, Current Period FUM (A$)
-1
4
9
14
19
24
29
34
20
40
60
80
100
120
140
160
180
200
220
Oct
-11
Apr-
12
Oct
-12
Apr-
13
Oct
-13
Apr-
14
Oct
-14
Apr-
15
Oct
-15
Apr-
16
Oct
-16
Apr-
17
Oct
-17
Mar
ket C
apita
lisat
ion,
bill
ions
Num
ber E
TP L
iste
d
ETP Market Growth
iShares19%
StateStreet15%
Vanguard24%
BetaShares27%
Russell Investments
1%
ETFS3%
UBS2%
VanEck4%
XTB1%
Magellan2%
Other2%
Valued Traded by Issuer, Current Period $m
Equity - Australia40%
Equity - Global33%
Infrastructure1%
Fixed Income -Australia
17%
Fixed Income -Global
2%
Property - Australia3%
Property - Global1% Commodity
3%
Value Traded by Asset, Current Period $m
STW - SPDR S&P/ASX 200 ,
$286.66
AAA - Betashares Australian High
Interest Cash ETF, $248.26
VAS - Vanguard Australian Shares
Index ETF, $182.59
IOZ - iShares Core S&P/ASX 200 ETF,
$85.54
IVV - iShares S&P 500 ETF, $75.84
Top 5 ETPs by Value Traded, Current Period $m
Spotlight on ETPs (ETFs / Managed Funds / Structured Products / Single Asset Managed Funds)October 2017
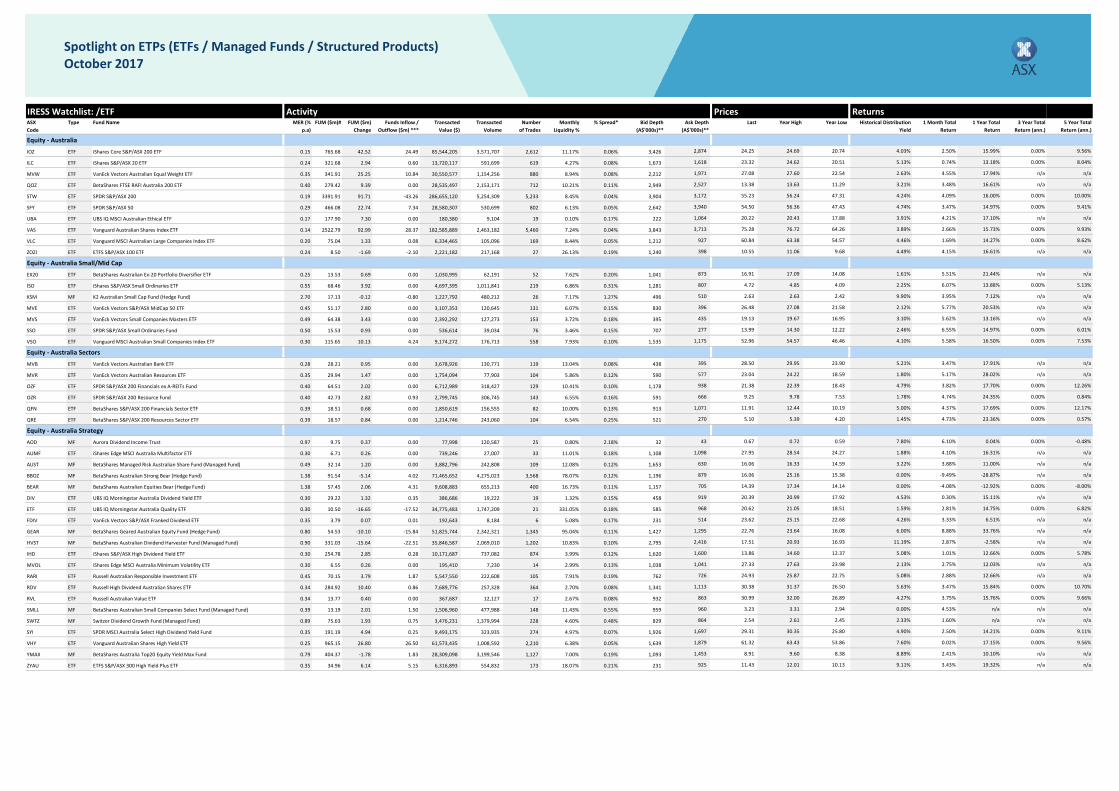
IRESS Watchlist: /ETF Activity Prices ReturnsASX Code
Type MER (% p.a)
FUM ($m)# FUM ($m) Change
Funds Inflow / Outflow ($m) ***
Transacted Value ($)
Transacted Volume
Number of Trades
Monthly Liquidity %
% Spread* Bid Depth (A$'000s)**
Ask Depth (A$'000s)**
Last Year High Year Low Historical Distribution Yield
1 Month Total Return
1 Year Total Return
3 Year Total Return (ann.)
5 Year Total Return (ann.)
Equity - Australia
IOZ ETF 0.15 765.68 42.52 24.49 85,544,205 3,571,707 2,612 11.17% 0.06% 3,426 2,874 24.25 24.69 20.74 4.03% 2.50% 15.99% 0.00% 9.56%
ILC ETF 0.24 321.68 2.94 0.60 13,720,117 591,699 619 4.27% 0.08% 1,673 1,618 23.32 24.62 20.51 5.13% 0.74% 13.18% 0.00% 8.04%
MVW ETF 0.35 341.91 25.25 10.84 30,550,577 1,154,256 880 8.94% 0.08% 2,212 1,971 27.08 27.60 22.54 2.63% 4.55% 17.94% n/a n/a
QOZ ETF 0.40 279.42 9.39 0.00 28,535,497 2,153,171 712 10.21% 0.11% 2,949 2,527 13.38 13.63 11.29 3.21% 3.48% 16.61% n/a n/a
STW ETF 0.19 3391.91 91.71 -43.26 286,655,120 5,254,309 5,233 8.45% 0.04% 3,904 3,172 55.23 56.24 47.31 4.24% 4.09% 16.00% 0.00% 10.00%
SFY ETF 0.29 466.08 22.74 7.34 28,580,307 530,699 802 6.13% 0.05% 2,642 3,940 54.50 56.36 47.43 4.74% 3.47% 14.97% 0.00% 9.41%
UBA ETF 0.17 177.90 7.30 0.00 180,380 9,104 19 0.10% 0.17% 222 1,064 20.22 20.43 17.88 3.91% 4.21% 17.10% n/a n/a
VAS ETF 0.14 2522.79 92.99 28.37 182,585,889 2,463,182 5,460 7.24% 0.04% 3,843 3,713 75.28 76.72 64.26 3.89% 2.66% 15.73% 0.00% 9.93%
VLC ETF 0.20 75.04 1.33 0.08 6,334,465 105,096 169 8.44% 0.05% 1,212 927 60.84 63.38 54.57 4.46% 1.69% 14.27% 0.00% 8.62%
ZOZI ETF 0.24 8.50 -1.69 -2.10 2,221,182 217,168 27 26.13% 0.19% 1,240 398 10.55 11.06 9.68 4.49% 4.15% 16.61% n/a n/a
Equity - Australia Small/Mid Cap
EX20 ETF 0.25 13.53 0.69 0.00 1,030,995 62,191 52 7.62% 0.20% 1,041 873 16.91 17.09 14.08 1.61% 5.51% 21.44% n/a n/a
ISO ETF 0.55 68.46 3.92 0.00 4,697,395 1,011,841 219 6.86% 0.31% 1,281 807 4.72 4.85 4.09 2.25% 6.07% 13.88% 0.00% 5.13%
KSM MF 2.70 17.13 -0.12 -0.80 1,227,792 480,212 26 7.17% 1.27% 496 510 2.63 2.63 2.42 9.90% 3.95% 7.12% n/a n/a
MVE ETF 0.45 51.17 2.80 0.00 3,107,353 120,645 131 6.07% 0.15% 830 396 26.48 27.08 21.58 2.12% 5.77% 20.53% n/a n/a
MVS ETF 0.49 64.38 3.43 0.00 2,392,292 127,273 153 3.72% 0.18% 395 435 19.13 19.67 16.95 3.10% 5.62% 13.16% n/a n/a
SSO ETF 0.50 15.53 0.93 0.00 536,614 39,034 76 3.46% 0.15% 707 277 13.99 14.30 12.22 2.46% 6.55% 14.97% 0.00% 6.01%
VSO ETF 0.30 115.65 10.13 4.24 9,174,272 176,713 558 7.93% 0.10% 1,535 1,175 52.96 54.57 46.46 4.10% 5.58% 16.50% 0.00% 7.53%
Equity - Australia Sectors
MVB ETF VanEck Vectors Australian Bank ETF 0.28 28.21 0.95 0.00 3,678,926 130,771 119 13.04% 0.08% 438 395 28.50 29.95 23.90 5.21% 3.47% 17.91% n/a n/a
MVR ETF VanEck Vectors Australian Resources ETF 0.35 29.94 1.47 0.00 1,754,094 77,903 104 5.86% 0.12% 590 577 23.04 24.22 18.59 1.80% 5.17% 28.02% n/a n/a
OZF ETF SPDR S&P/ASX 200 Financials ex A-REITs Fund 0.40 64.51 2.02 0.00 6,712,989 318,427 129 10.41% 0.10% 1,178 938 21.38 22.39 18.43 4.79% 3.82% 17.70% 0.00% 12.26%
OZR ETF SPDR S&P/ASX 200 Resource Fund 0.40 42.73 2.82 0.93 2,799,745 306,745 143 6.55% 0.16% 591 666 9.25 9.78 7.53 1.78% 4.74% 24.35% 0.00% 0.84%
QFN ETF BetaShares S&P/ASX 200 Financials Sector ETF 0.39 18.51 0.68 0.00 1,850,619 156,555 82 10.00% 0.13% 913 1,071 11.91 12.44 10.19 5.00% 4.37% 17.69% 0.00% 12.17%
QRE ETF BetaShares S&P/ASX 200 Resources Sector ETF 0.39 18.57 0.84 0.00 1,214,746 243,060 104 6.54% 0.25% 521 270 5.10 5.39 4.20 1.45% 4.73% 23.36% 0.00% 0.57%
Equity - Australia Strategy
AOD MF 0.97 9.75 0.37 0.00 77,998 120,587 25 0.80% 2.18% 32 43 0.67 0.72 0.59 7.80% 6.10% 0.04% 0.00% -0.48%
AUMF ETF 0.30 6.71 0.26 0.00 739,246 27,007 33 11.01% 0.18% 1,108 1,098 27.95 28.54 24.27 1.88% 4.10% 16.31% n/a n/a
AUST MF 0.49 32.14 1.20 0.00 3,882,796 242,808 109 12.08% 0.12% 1,653 630 16.06 16.33 14.59 3.22% 3.88% 11.00% n/a n/a
BBOZ MF 1.38 91.54 -5.14 4.02 71,465,652 4,275,023 3,568 78.07% 0.12% 1,196 879 16.06 25.16 15.38 0.00% -9.49% -28.87% n/a n/a
BEAR MF 1.38 57.45 2.06 4.31 9,608,883 655,213 400 16.73% 0.11% 1,157 705 14.39 17.34 14.14 0.00% -4.08% -12.92% 0.00% -8.00%
DIV ETF 0.30 29.22 1.32 0.35 386,686 19,222 19 1.32% 0.15% 458 919 20.39 20.99 17.92 4.53% 0.30% 15.11% n/a n/a
ETF ETF 0.30 10.50 -16.65 -17.52 34,775,483 1,747,209 21 331.05% 0.18% 585 968 20.62 21.05 18.51 1.59% 2.81% 14.75% 0.00% 6.82%
FDIV ETF 0.35 3.79 0.07 0.01 192,643 8,184 6 5.08% 0.17% 231 514 23.62 25.15 22.68 4.26% 3.33% 6.51% n/a n/a
GEAR MF 0.80 54.53 -10.10 -15.84 51,825,744 2,342,321 1,345 95.04% 0.11% 1,427 1,295 22.76 23.64 16.08 6.00% 8.88% 33.76% n/a n/a
HVST MF 0.90 331.03 -15.64 -22.51 35,846,587 2,069,010 1,202 10.83% 0.10% 2,795 2,416 17.51 20.93 16.93 11.19% 2.87% -2.58% n/a n/a
IHD ETF 0.30 254.78 2.85 0.28 10,171,687 737,082 874 3.99% 0.12% 1,620 1,600 13.86 14.60 12.37 5.08% 1.01% 12.66% 0.00% 5.78%
MVOL ETF 0.30 6.55 0.26 0.00 195,410 7,230 14 2.99% 0.13% 1,038 1,041 27.33 27.63 23.98 2.13% 2.75% 12.03% n/a n/a
RARI ETF 0.45 70.15 3.79 1.87 5,547,550 222,608 105 7.91% 0.19% 762 726 24.93 25.87 22.75 5.08% 2.88% 12.66% n/a n/a
RDV ETF 0.34 284.92 10.40 0.86 7,689,776 257,328 364 2.70% 0.08% 1,341 1,113 30.38 31.37 26.50 5.63% 3.47% 15.84% 0.00% 10.70%
RVL ETF 0.34 13.77 0.40 0.00 367,687 12,127 17 2.67% 0.08% 932 863 30.99 32.00 26.89 4.27% 3.75% 15.76% 0.00% 9.66%
SMLL MF 0.39 13.19 2.01 1.50 1,506,960 477,988 148 11.43% 0.55% 959 960 3.23 3.31 2.94 0.00% 4.53% n/a n/a n/a
SWTZ MF 0.89 75.63 1.93 0.75 3,476,231 1,379,994 228 4.60% 0.48% 829 864 2.54 2.61 2.45 2.33% 1.60% n/a n/a n/a
SYI ETF 0.35 191.19 4.94 0.25 9,493,175 323,935 274 4.97% 0.07% 1,926 1,697 29.31 30.35 25.80 4.90% 2.50% 14.21% 0.00% 9.11%
VHY ETF 0.25 965.15 26.80 26.50 61,573,435 1,008,592 2,210 6.38% 0.05% 1,639 1,879 61.32 63.43 53.86 7.60% 0.02% 17.15% 0.00% 9.56%
YMAX MF 0.79 404.37 -1.78 1.83 28,309,098 3,199,546 1,127 7.00% 0.19% 1,093 1,453 8.91 9.60 8.38 8.89% 2.41% 10.10% n/a n/a
ZYAU ETF 0.35 34.96 6.14 5.15 6,316,893 554,832 173 18.07% 0.21% 231 925 11.43 12.01 10.13 9.11% 3.43% 19.32% n/a n/a
Aurora Dividend Income Trust
BetaShares Australian Ex-20 Portfolio Diversifier ETF
Switzer Dividend Growth Fund (Managed Fund)
Vanguard MSCI Australian Small Companies Index ETF
iShares Edge MSCI Australia Multifactor ETF
SPDR MSCI Australia Select High Dividend Yield Fund
Russell High Dividend Australian Shares ETF
UBS IQ Morningstar Australia Quality ETF
BetaShares Australian Dividend Harvester Fund (Managed Fund)
ETFS S&P/ASX 300 High Yield Plus ETF
Russell Australian Responsible Investment ETF
BetaShares Managed Risk Australian Share Fund (Managed Fund)
BetaShares Geared Australian Equity Fund (Hedge Fund)
UBS IQ Morningstar Australia Dividend Yield ETF
iShares S&P/ASX High Dividend Yield ETF
iShares Edge MSCI Australia Minimum Volatility ETF
VanEck Vectors S&P/ASX Franked Dividend ETF
SPDR S&P/ASX 200
SPDR S&P/ASX Small Ordinaries Fund
Vanguard Australian Shares Index ETF
Vanguard MSCI Australian Large Companies Index ETF
SPDR S&P/ASX 50
VanEck Vectors Small Companies Masters ETF
UBS IQ MSCI Australian Ethical ETF
K2 Australian Small Cap Fund (Hedge Fund)
ETFS S&P/ASX 100 ETF
iShares S&P/ASX Small Ordinaries ETF
VanEck Vectors S&P/ASX MidCap 50 ETF
Fund Name
iShares S&P/ASX 20 ETF
BetaShares FTSE RAFI Australia 200 ETF
iShares Core S&P/ASX 200 ETF
VanEck Vectors Australian Equal Weight ETF
BetaShares Australian Strong Bear (Hedge Fund)
BetaShares Australia Top20 Equity Yield Max Fund
Russell Australian Value ETF
BetaShares Australian Equities Bear (Hedge Fund)
BetaShares Australian Small Companies Select Fund (Managed Fund)
Vanguard Australian Shares High Yield ETF
Spotlight on ETPs (ETFs / Managed Funds / Structured Products)October 2017
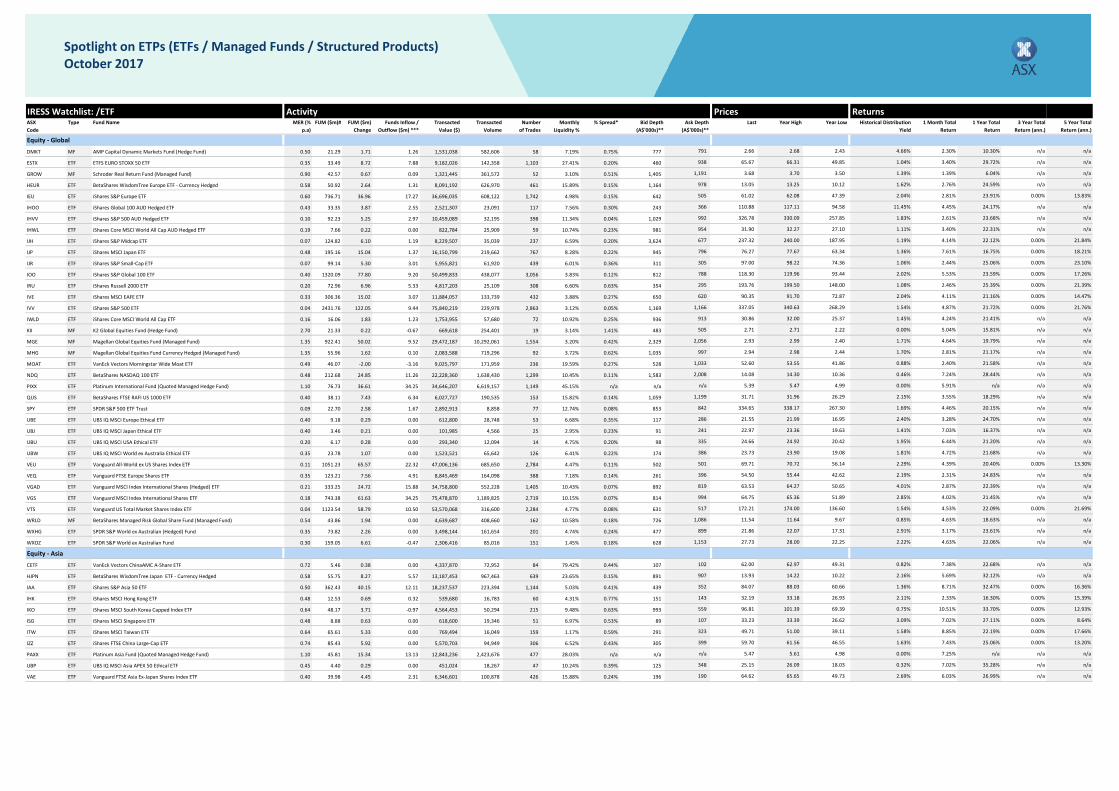
IRESS Watchlist: /ETF Activity Prices ReturnsASX Code
Type MER (% p.a)
FUM ($m)# FUM ($m) Change
Funds Inflow / Outflow ($m) ***
Transacted Value ($)
Transacted Volume
Number of Trades
Monthly Liquidity %
% Spread* Bid Depth (A$'000s)**
Ask Depth (A$'000s)**
Last Year High Year Low Historical Distribution Yield
1 Month Total Return
1 Year Total Return
3 Year Total Return (ann.)
5 Year Total Return (ann.)
Fund Name
Spotlight on ETPs (ETFs / Managed Funds / Structured Products)October 2017
Equity - Global
DMKT MF AMP Capital Dynamic Markets Fund (Hedge Fund) 0.50 21.29 1.71 1.26 1,531,038 582,606 58 7.19% 0.75% 777 791 2.66 2.68 2.43 4.66% 2.30% 10.30% n/a n/a
ESTX ETF ETFS EURO STOXX 50 ETF 0.35 33.49 8.72 7.88 9,182,026 142,358 1,103 27.41% 0.20% 460 938 65.67 66.31 49.85 1.04% 3.40% 29.72% n/a n/a
GROW MF Schroder Real Return Fund (Managed Fund) 0.90 42.57 0.67 0.09 1,321,445 361,572 52 3.10% 0.51% 1,405 1,191 3.68 3.70 3.50 1.39% 1.39% 6.04% n/a n/a
HEUR ETF BetaShares WisdomTree Europe ETF - Currency Hedged 0.58 50.92 2.64 1.31 8,091,192 626,970 461 15.89% 0.15% 1,164 978 13.05 13.25 10.12 1.62% 2.76% 24.59% n/a n/a
IEU ETF iShares S&P Europe ETF 0.60 736.71 36.96 17.27 36,696,035 608,122 1,742 4.98% 0.15% 642 505 61.02 62.08 47.39 2.04% 2.81% 23.91% 0.00% 13.83%
IHOO ETF iShares Global 100 AUD Hedged ETF 0.43 33.35 3.87 2.55 2,521,307 23,091 117 7.56% 0.30% 243 366 110.88 117.11 94.58 11.45% 4.45% 24.17% n/a n/a
IHVV ETF iShares S&P 500 AUD Hedged ETF 0.10 92.23 5.25 2.97 10,459,089 32,195 398 11.34% 0.04% 1,029 992 326.78 330.09 257.85 1.83% 2.61% 23.68% n/a n/a
IHWL ETF iShares Core MSCI World All Cap AUD Hedged ETF 0.19 7.66 0.22 0.00 822,784 25,909 59 10.74% 0.23% 981 954 31.90 32.27 27.10 1.11% 3.40% 22.31% n/a n/a
IJH ETF iShares S&P Midcap ETF 0.07 124.82 6.10 1.19 8,229,507 35,039 237 6.59% 0.20% 3,624 677 237.32 240.00 187.95 1.19% 4.14% 22.12% 0.00% 21.84%
IJP ETF iShares MSCI Japan ETF 0.48 195.16 15.04 1.37 16,150,799 219,662 767 8.28% 0.22% 945 796 76.27 77.67 63.34 1.36% 7.61% 16.75% 0.00% 18.21%
IJR ETF iShares S&P Small-Cap ETF 0.07 99.14 5.30 3.01 5,955,821 61,920 439 6.01% 0.36% 311 305 97.00 98.22 74.36 1.06% 2.44% 25.06% 0.00% 23.10%
IOO ETF iShares S&P Global 100 ETF 0.40 1320.09 77.80 9.20 50,499,833 438,077 3,056 3.83% 0.12% 812 788 118.30 119.96 93.44 2.02% 5.53% 23.59% 0.00% 17.26%
IRU ETF iShares Russell 2000 ETF 0.20 72.96 6.96 5.33 4,817,203 25,109 308 6.60% 0.63% 354 295 193.76 199.50 148.00 1.08% 2.46% 25.39% 0.00% 21.39%
IVE ETF iShares MSCI EAFE ETF 0.33 306.36 15.02 3.07 11,884,057 133,739 432 3.88% 0.27% 650 620 90.35 91.70 72.87 2.04% 4.11% 21.16% 0.00% 14.47%
IVV ETF iShares S&P 500 ETF 0.04 2431.76 122.05 9.44 75,840,219 229,978 2,863 3.12% 0.05% 1,169 1,166 337.05 340.63 268.29 1.54% 4.87% 21.72% 0.00% 21.76%
IWLD ETF iShares Core MSCI World All Cap ETF 0.16 16.06 1.83 1.23 1,753,955 57,680 72 10.92% 0.25% 936 913 30.86 32.00 25.37 1.45% 4.24% 21.41% n/a n/a
KII MF K2 Global Equities Fund (Hedge Fund) 2.70 21.33 0.22 -0.67 669,618 254,401 19 3.14% 1.41% 483 505 2.71 2.71 2.22 0.00% 5.04% 15.81% n/a n/a
MGE MF Magellan Global Equities Fund (Managed Fund) 1.35 922.41 50.02 9.52 29,472,187 10,292,061 1,554 3.20% 0.42% 2,329 2,056 2.93 2.99 2.40 1.71% 4.64% 19.79% n/a n/a
MHG MF Magellan Global Equities Fund Currency Hedged (Managed Fund) 1.35 55.96 1.62 0.10 2,083,588 719,296 92 3.72% 0.62% 1,035 997 2.94 2.98 2.44 1.70% 2.81% 21.17% n/a n/a
MOAT ETF VanEck Vectors Morningstar Wide Moat ETF 0.49 46.07 -2.00 -3.16 9,025,797 171,959 236 19.59% 0.27% 528 1,033 52.60 53.55 41.86 0.88% 2.40% 21.58% n/a n/a
NDQ ETF BetaShares NASDAQ 100 ETF 0.48 212.68 24.85 11.26 22,228,360 1,638,430 1,299 10.45% 0.11% 1,583 2,008 14.08 14.30 10.36 0.46% 7.24% 28.44% n/a n/a
PIXX ETF Platinum International Fund (Quoted Managed Hedge Fund) 1.10 76.73 36.61 34.25 34,646,207 6,619,157 1,149 45.15% n/a n/a n/a 5.39 5.47 4.99 0.00% 5.91% n/a n/a n/a
QUS ETF BetaShares FTSE RAFI US 1000 ETF 0.40 38.11 7.43 6.34 6,027,727 190,535 153 15.82% 0.14% 1,059 1,199 31.71 31.96 26.29 2.15% 3.55% 18.29% n/a n/a
SPY ETF SPDR S&P 500 ETF Trust 0.09 22.70 2.58 1.67 2,892,913 8,858 77 12.74% 0.08% 853 842 334.65 338.17 267.30 1.69% 4.46% 20.15% n/a n/a
UBE ETF UBS IQ MSCI Europe Ethical ETF 0.40 9.18 0.29 0.00 612,800 28,748 53 6.68% 0.35% 117 286 21.55 21.99 16.95 2.40% 3.28% 24.70% n/a n/a
UBJ ETF UBS IQ MSCI Japan Ethical ETF 0.40 3.46 0.21 0.00 101,985 4,566 25 2.95% 0.23% 91 241 22.97 23.36 19.63 1.41% 7.03% 16.37% n/a n/a
UBU ETF UBS IQ MSCI USA Ethical ETF 0.20 6.17 0.28 0.00 293,340 12,094 14 4.75% 0.20% 98 335 24.66 24.92 20.42 1.95% 6.44% 21.20% n/a n/a
UBW ETF UBS IQ MSCI World ex Australia Ethical ETF 0.35 23.78 1.07 0.00 1,523,521 65,642 126 6.41% 0.22% 174 386 23.73 23.90 19.08 1.81% 4.72% 21.68% n/a n/a
VEU ETF Vanguard All-World ex US Shares Index ETF 0.11 1051.23 65.57 22.32 47,006,136 685,650 2,784 4.47% 0.11% 502 501 69.71 70.72 56.14 2.29% 4.39% 20.40% 0.00% 13.30%
VEQ ETF Vanguard FTSE Europe Shares ETF 0.35 123.21 7.56 4.91 8,845,469 164,098 388 7.18% 0.14% 261 396 54.50 55.44 42.62 2.19% 2.31% 24.83% n/a n/a
VGAD ETF Vanguard MSCI Index International Shares (Hedged) ETF 0.21 333.25 24.72 15.88 34,758,800 552,228 1,405 10.43% 0.07% 892 819 63.53 64.27 50.65 4.01% 2.87% 22.39% n/a n/a
VGS ETF Vanguard MSCI Index International Shares ETF 0.18 743.38 61.63 34.25 75,478,870 1,189,825 2,719 10.15% 0.07% 814 994 64.75 65.36 51.89 2.85% 4.02% 21.45% n/a n/a
VTS ETF Vanguard US Total Market Shares Index ETF 0.04 1123.54 58.79 10.50 53,570,068 316,600 2,284 4.77% 0.08% 631 517 172.21 174.00 136.60 1.54% 4.53% 22.09% 0.00% 21.69%
WRLD MF BetaShares Managed Risk Global Share Fund (Managed Fund) 0.54 43.86 1.94 0.00 4,639,687 408,660 162 10.58% 0.18% 726 1,086 11.54 11.64 9.67 0.85% 4.63% 18.63% n/a n/a
WXHG ETF SPDR S&P World ex Australian (Hedged) Fund 0.35 73.82 2.26 0.00 3,498,144 161,654 201 4.74% 0.24% 477 899 21.86 22.07 17.31 2.91% 3.17% 23.61% n/a n/a
WXOZ ETF SPDR S&P World ex Australian Fund 0.30 159.05 6.61 -0.47 2,306,416 85,016 151 1.45% 0.18% 628 1,153 27.73 28.00 22.25 2.22% 4.63% 22.06% n/a n/a
Equity - Asia
CETF ETF VanEck Vectors ChinaAMC A-Share ETF 0.72 5.46 0.38 0.00 4,337,870 72,952 84 79.42% 0.44% 107 102 62.00 62.97 49.31 0.82% 7.38% 22.68% n/a n/a
HJPN ETF BetaShares WisdomTree Japan ETF - Currency Hedged 0.58 55.75 8.27 5.57 13,187,453 967,463 639 23.65% 0.15% 891 907 13.93 14.22 10.22 2.16% 5.69% 32.12% n/a n/a
IAA ETF iShares S&P Asia 50 ETF 0.50 362.43 40.15 12.11 18,237,537 223,394 1,144 5.03% 0.41% 439 352 84.07 88.03 60.66 1.36% 8.71% 32.47% 0.00% 16.36%
IHK ETF iShares MSCI Hong Kong ETF 0.48 12.53 0.69 0.32 539,680 16,783 60 4.31% 0.77% 151 143 32.19 33.18 26.93 2.11% 2.33% 16.30% 0.00% 15.39%
IKO ETF iShares MSCI South Korea Capped Index ETF 0.64 48.17 3.71 -0.97 4,564,453 50,294 215 9.48% 0.63% 993 559 96.81 101.39 69.39 0.75% 10.51% 33.70% 0.00% 12.93%
ISG ETF iShares MSCI Singapore ETF 0.48 8.88 0.63 0.00 618,600 19,346 51 6.97% 0.53% 89 107 33.23 33.39 26.62 3.09% 7.02% 27.11% 0.00% 8.64%
ITW ETF iShares MSCI Taiwan ETF 0.64 65.61 5.33 0.00 769,494 16,049 159 1.17% 0.59% 291 323 49.71 51.00 39.11 1.58% 8.85% 22.19% 0.00% 17.66%
IZZ ETF iShares FTSE China Large-Cap ETF 0.74 85.43 5.92 0.00 5,570,703 94,949 306 6.52% 0.43% 305 399 59.70 61.56 46.55 1.63% 7.43% 25.06% 0.00% 13.20%
PAXX ETF Platinum Asia Fund (Quoted Managed Hedge Fund) 1.10 45.81 15.34 13.13 12,843,236 2,423,676 477 28.03% n/a n/a n/a 5.47 5.61 4.98 0.00% 7.25% n/a n/a n/a
UBP ETF UBS IQ MSCI Asia APEX 50 Ethical ETF 0.45 4.40 0.29 0.00 451,024 18,267 47 10.24% 0.39% 125 348 25.15 26.09 18.03 0.32% 7.02% 35.28% n/a n/a
VAE ETF Vanguard FTSE Asia Ex-Japan Shares Index ETF 0.40 39.98 4.45 2.31 6,346,601 100,878 426 15.88% 0.24% 196 190 64.62 65.65 49.73 2.69% 6.03% 26.99% n/a n/a
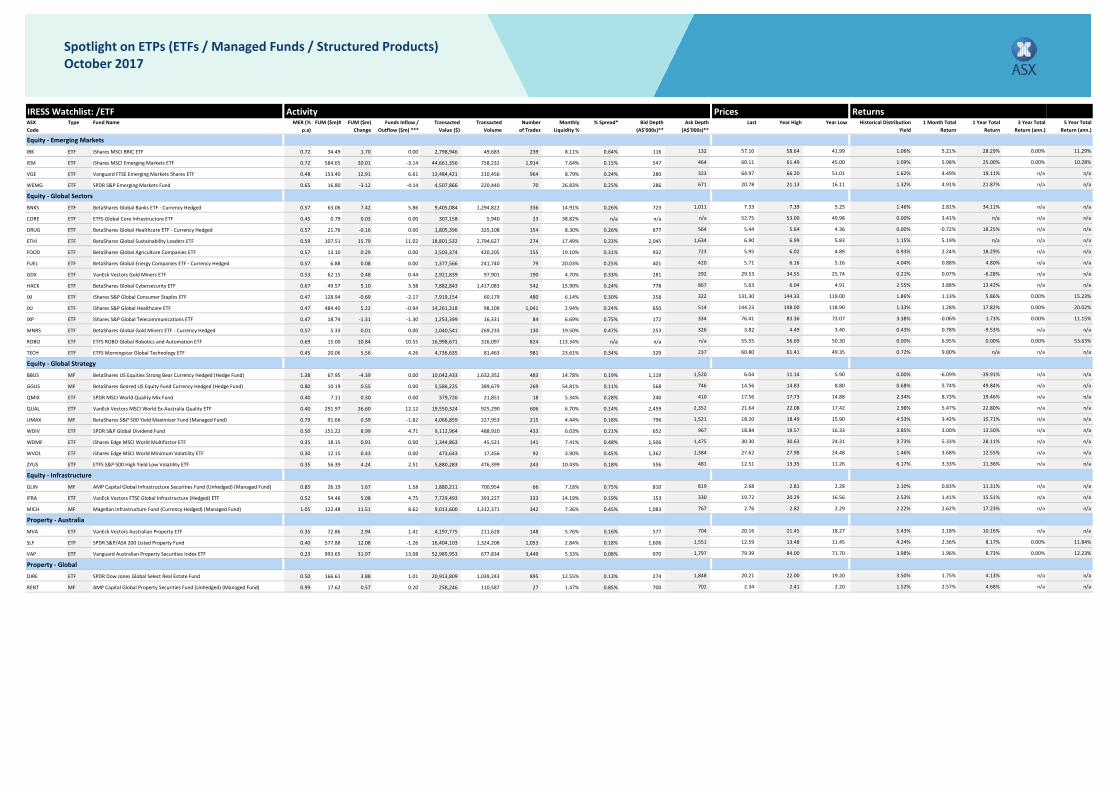
IRESS Watchlist: /ETF Activity Prices ReturnsASX Code
Type MER (% p.a)
FUM ($m)# FUM ($m) Change
Funds Inflow / Outflow ($m) ***
Transacted Value ($)
Transacted Volume
Number of Trades
Monthly Liquidity %
% Spread* Bid Depth (A$'000s)**
Ask Depth (A$'000s)**
Last Year High Year Low Historical Distribution Yield
1 Month Total Return
1 Year Total Return
3 Year Total Return (ann.)
5 Year Total Return (ann.)
Fund Name
Spotlight on ETPs (ETFs / Managed Funds / Structured Products)October 2017
Equity - Emerging Markets
IBK ETF iShares MSCI BRIC ETF 0.72 34.49 1.70 0.00 2,798,946 49,683 239 8.11% 0.64% 116 132 57.10 58.64 41.99 1.06% 5.21% 28.29% 0.00% 11.29%
IEM ETF iShares MSCI Emerging Markets ETF 0.72 584.65 30.01 -3.14 44,661,356 758,232 1,914 7.64% 0.15% 547 464 60.11 61.49 45.00 1.09% 5.98% 25.00% 0.00% 10.28%
VGE ETF Vanguard FTSE Emerging Markets Shares ETF 0.48 153.40 12.91 6.61 13,484,421 210,456 964 8.79% 0.24% 280 323 64.97 66.20 51.01 1.62% 4.49% 19.11% n/a n/a
WEMG ETF SPDR S&P Emerging Markets Fund 0.65 16.80 -3.12 -4.14 4,507,866 220,440 70 26.83% 0.25% 286 671 20.78 21.13 16.11 1.32% 4.91% 21.87% n/a n/a
Equity - Global Sectors
BNKS ETF BetaShares Global Banks ETF - Currency Hedged 0.57 63.06 7.42 5.86 9,405,084 1,294,822 336 14.91% 0.26% 723 1,011 7.33 7.39 5.25 1.46% 2.81% 34.11% n/a n/a
CORE ETF ETFS Global Core Infrastructure ETF 0.45 0.79 0.03 0.00 307,158 5,940 23 38.82% n/a n/a n/a 52.75 53.00 49.98 0.00% 3.41% n/a n/a n/a
DRUG ETF BetaShares Global Healthcare ETF - Currency Hedged 0.57 21.76 -0.16 0.00 1,805,396 325,108 154 8.30% 0.26% 677 564 5.44 5.64 4.36 0.00% -0.72% 18.25% n/a n/a
ETHI ETF BetaShares Global Sustainability Leaders ETF 0.59 107.51 15.79 11.02 18,801,532 2,794,627 274 17.49% 0.23% 2,045 1,634 6.90 6.99 5.83 1.15% 5.19% n/a n/a n/a
FOOD ETF BetaShares Global Agriculture Companies ETF 0.57 13.10 0.29 0.00 2,503,374 420,205 155 19.10% 0.31% 932 723 5.95 6.02 4.89 0.93% 2.24% 18.29% n/a n/a
FUEL ETF BetaShares Global Energy Companies ETF - Currency Hedged 0.57 6.88 0.08 0.00 1,377,566 241,740 79 20.03% 0.25% 401 420 5.71 6.16 5.16 4.04% 0.88% 4.80% n/a n/a
GDX ETF VanEck Vectors Gold Miners ETF 0.53 62.15 0.48 0.44 2,921,839 97,901 190 4.70% 0.33% 281 292 29.53 34.55 25.74 0.21% 0.07% -6.28% n/a n/a
HACK ETF BetaShares Global Cybersecurity ETF 0.67 49.57 5.10 3.38 7,882,843 1,417,083 542 15.90% 0.24% 778 867 5.63 6.04 4.91 2.55% 3.88% 13.42% n/a n/a
IXI ETF iShares S&P Global Consumer Staples ETF 0.47 128.94 -0.69 -2.17 7,919,154 60,179 480 6.14% 0.30% 258 322 131.30 144.33 119.00 1.86% 1.13% 5.86% 0.00% 15.23%
IXJ ETF iShares S&P Global Healthcare ETF 0.47 484.40 5.22 -0.94 14,261,318 98,109 1,041 2.94% 0.24% 650 514 144.23 148.00 118.90 1.33% 1.28% 17.82% 0.00% 20.02%
IXP ETF iShares S&P Global Telecommunications ETF 0.47 18.74 -1.31 -1.30 1,253,399 16,331 84 6.69% 0.75% 172 334 76.41 83.36 73.07 3.38% -0.06% 1.73% 0.00% 11.15%
MNRS ETF BetaShares Global Gold Miners ETF - Currency Hedged 0.57 5.33 0.01 0.00 1,040,541 269,233 130 19.50% 0.47% 253 326 3.82 4.49 3.40 0.43% 0.78% -9.53% n/a n/a
ROBO ETF ETFS ROBO Global Robotics and Automation ETF 0.69 15.00 10.84 10.55 16,998,671 316,097 824 113.34% n/a n/a n/a 55.55 56.69 50.30 0.00% 6.95% 0.00% 0.00% 53.63%
TECH ETF ETFS Morningstar Global Technology ETF 0.45 20.06 5.56 4.26 4,736,635 81,463 981 23.61% 0.34% 329 237 60.80 61.41 49.35 0.72% 9.00% n/a n/a n/a
Equity - Global Strategy
BBUS MF BetaShares US Equities Strong Bear Currency Hedged (Hedge Fund) 1.38 67.95 -4.39 0.00 10,042,433 1,632,352 483 14.78% 0.19% 1,119 1,520 6.04 11.14 5.90 0.00% -6.09% -39.91% n/a n/a
GGUS MF BetaShares Geared US Equity Fund Currency Hedged (Hedge Fund) 0.80 10.19 0.55 0.00 5,586,225 389,679 269 54.81% 0.11% 568 746 14.56 14.83 8.80 0.68% 5.74% 49.84% n/a n/a
QMIX ETF SPDR MSCI World Quality Mix Fund 0.40 7.11 0.30 0.00 379,726 21,851 18 5.34% 0.28% 240 410 17.56 17.73 14.88 2.34% 8.73% 19.46% n/a n/a
QUAL ETF VanEck Vectors MSCI World Ex-Australia Quality ETF 0.40 291.97 26.60 12.12 19,550,324 925,290 606 6.70% 0.14% 2,459 2,352 21.64 22.08 17.42 2.98% 5.47% 22.80% n/a n/a
UMAX MF BetaShares S&P 500 Yield Maximiser Fund (Managed Fund) 0.79 91.66 0.39 -1.82 4,066,859 227,953 215 4.44% 0.18% 796 1,521 18.20 18.49 15.90 4.53% 3.42% 15.71% n/a n/a
WDIV ETF SPDR S&P Global Dividend Fund 0.50 151.22 8.99 4.71 9,112,964 488,920 433 6.03% 0.21% 652 967 18.84 19.57 16.33 3.85% 3.00% 13.50% n/a n/a
WDMF ETF iShares Edge MSCI World Multifactor ETF 0.35 18.15 0.91 0.00 1,344,863 45,521 141 7.41% 0.48% 1,506 1,475 30.30 30.63 24.31 3.73% 5.33% 28.11% n/a n/a
WVOL ETF iShares Edge MSCI World Minimum Volatility ETF 0.30 12.15 0.43 0.00 473,643 17,456 92 3.90% 0.45% 1,362 1,384 27.62 27.98 24.48 1.46% 3.68% 12.55% n/a n/a
ZYUS ETF ETFS S&P 500 High Yield Low Volatility ETF 0.35 56.39 4.24 2.51 5,880,283 476,399 243 10.43% 0.18% 556 481 12.51 13.35 11.26 6.17% 3.33% 11.36% n/a n/a
Equity - Infrastructure
GLIN MF AMP Capital Global Infrastructure Securities Fund (Unhedged) (Managed Fund) 0.85 26.19 1.67 1.58 1,880,211 700,954 66 7.18% 0.75% 810 819 2.68 2.81 2.28 2.10% 0.83% 11.31% n/a n/a
IFRA ETF VanEck Vectors FTSE Global Infrastructure (Hedged) ETF 0.52 54.46 5.08 4.75 7,729,493 393,227 333 14.19% 0.19% 153 330 19.72 20.29 16.56 2.53% 1.41% 15.51% n/a n/a
MICH MF Magellan Infrastructure Fund (Currency Hedged) (Managed Fund) 1.05 122.48 11.51 8.62 9,013,600 3,312,371 342 7.36% 0.45% 1,083 767 2.76 2.82 2.29 2.22% 2.62% 17.23% n/a n/a
Property - Australia
MVA ETF VanEck Vectors Australian Property ETF 0.35 72.86 2.94 1.41 4,197,775 211,628 148 5.76% 0.16% 577 704 20.16 21.45 18.27 5.43% 2.18% 10.16% n/a n/a
SLF ETF SPDR S&P/ASX 200 Listed Property Fund 0.40 577.88 12.08 -1.26 16,404,103 1,324,208 1,053 2.84% 0.18% 1,606 1,551 12.59 13.48 11.45 4.24% 2.36% 8.17% 0.00% 11.84%
VAP ETF Vanguard Australian Property Securities Index ETF 0.23 993.65 31.97 13.08 52,985,953 677,834 3,449 5.33% 0.08% 970 1,797 79.39 84.00 71.70 3.98% 1.96% 8.73% 0.00% 12.23%
Property - Global
DJRE ETF SPDR Dow Jones Global Select Real Estate Fund 0.50 166.61 3.88 1.01 20,913,809 1,039,243 895 12.55% 0.13% 274 1,848 20.21 22.00 19.20 3.50% 1.75% 4.13% n/a n/a
RENT MF AMP Capital Global Property Securities Fund (Unhedged) (Managed Fund) 0.99 17.62 0.57 0.20 258,246 110,587 27 1.47% 0.85% 700 702 2.34 2.41 2.20 1.52% 2.57% 4.68% n/a n/a
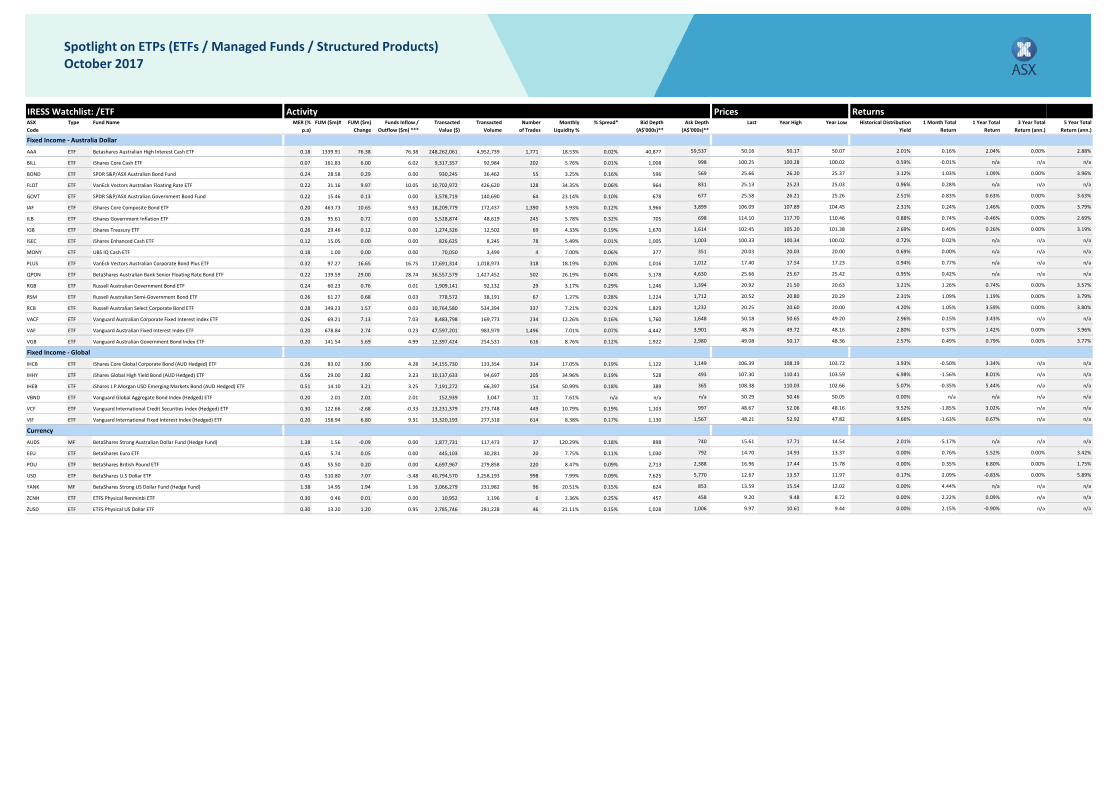
IRESS Watchlist: /ETF Activity Prices ReturnsASX Code
Type MER (% p.a)
FUM ($m)# FUM ($m) Change
Funds Inflow / Outflow ($m) ***
Transacted Value ($)
Transacted Volume
Number of Trades
Monthly Liquidity %
% Spread* Bid Depth (A$'000s)**
Ask Depth (A$'000s)**
Last Year High Year Low Historical Distribution Yield
1 Month Total Return
1 Year Total Return
3 Year Total Return (ann.)
5 Year Total Return (ann.)
Fund Name
Spotlight on ETPs (ETFs / Managed Funds / Structured Products)October 2017
Fixed Income - Australia Dollar
AAA ETF 0.18 1339.91 76.38 76.38 248,262,061 4,952,739 1,771 18.53% 0.02% 40,877 59,537 50.16 50.17 50.07 2.01% 0.16% 2.04% 0.00% 2.88%
BILL ETF 0.07 161.83 6.00 6.02 9,317,357 92,984 202 5.76% 0.01% 1,008 998 100.25 100.28 100.02 0.59% -0.01% n/a n/a n/a
BOND ETF 0.24 28.58 0.29 0.00 930,245 36,462 55 3.25% 0.16% 596 569 25.66 26.20 25.37 3.12% 1.03% 1.09% 0.00% 3.96%
FLOT ETF 0.22 31.16 9.97 10.05 10,702,972 426,620 128 34.35% 0.06% 964 831 25.13 25.23 25.03 0.96% 0.28% n/a n/a n/a
GOVT ETF 0.22 15.46 0.13 0.00 3,578,719 140,690 64 23.14% 0.10% 678 677 25.58 26.21 25.26 2.51% 0.83% 0.63% 0.00% 3.63%
IAF ETF 0.20 463.73 10.65 9.63 18,209,779 172,437 1,390 3.93% 0.12% 3,966 3,899 106.09 107.89 104.45 2.31% 0.24% 1.46% 0.00% 3.79%
ILB ETF 0.26 95.61 0.72 0.00 5,528,874 48,619 245 5.78% 0.32% 705 698 114.10 117.70 110.46 0.88% 0.74% -0.46% 0.00% 2.69%
IGB ETF 0.26 29.46 0.12 0.00 1,274,326 12,502 69 4.33% 0.19% 1,670 1,614 102.45 105.20 101.38 2.69% 0.40% 0.26% 0.00% 3.19%
ISEC ETF 0.12 15.05 0.00 0.00 826,625 8,245 78 5.49% 0.01% 1,005 1,003 100.33 100.34 100.02 0.72% 0.02% n/a n/a n/a
MONY ETF 0.18 1.00 0.00 0.00 70,050 3,499 4 7.00% 0.06% 377 351 20.03 20.03 20.00 0.69% 0.00% n/a n/a n/a
PLUS ETF 0.32 97.27 16.65 16.75 17,691,314 1,018,973 318 18.19% 0.20% 1,016 1,012 17.40 17.54 17.23 0.94% 0.77% n/a n/a n/a
QPON ETF 0.22 139.59 29.00 28.74 36,557,579 1,427,452 502 26.19% 0.04% 5,178 4,630 25.66 25.67 25.42 0.95% 0.42% n/a n/a n/a
RGB ETF 0.24 60.23 0.76 0.01 1,909,141 92,132 29 3.17% 0.29% 1,246 1,394 20.92 21.50 20.63 3.21% 1.26% 0.74% 0.00% 3.57%
RSM ETF 0.26 61.27 0.68 0.03 778,572 38,191 67 1.27% 0.28% 1,224 1,712 20.52 20.80 20.29 2.31% 1.09% 1.19% 0.00% 3.79%
RCB ETF 0.28 149.23 1.57 0.03 10,764,580 534,394 337 7.21% 0.22% 1,829 1,232 20.25 20.60 20.00 4.20% 1.05% 3.59% 0.00% 3.80%
VACF ETF 0.26 69.21 7.13 7.03 8,483,798 169,773 234 12.26% 0.16% 1,760 1,648 50.18 50.65 49.20 2.96% 0.15% 3.43% n/a n/a
VAF ETF 0.20 678.84 2.74 0.23 47,597,201 983,979 1,496 7.01% 0.07% 4,442 3,901 48.76 49.72 48.16 2.80% 0.37% 1.42% 0.00% 3.96%
VGB ETF 0.20 141.54 5.69 4.99 12,397,424 254,531 616 8.76% 0.12% 1,922 2,980 49.08 50.17 48.36 2.57% 0.49% 0.79% 0.00% 3.77%
Fixed Income - Global
IHCB ETF 0.26 83.02 3.90 4.28 14,155,730 133,354 314 17.05% 0.19% 1,122 1,149 106.39 108.19 103.72 3.93% -0.50% 3.34% n/a n/a
IHHY ETF 0.56 29.00 2.82 3.23 10,137,633 94,697 205 34.96% 0.19% 528 493 107.30 110.41 103.59 6.98% -1.56% 8.01% n/a n/a
IHEB ETF 0.51 14.10 3.21 3.25 7,191,272 66,397 154 50.99% 0.18% 389 365 108.38 110.03 102.66 5.07% -0.35% 5.44% n/a n/a
VBND ETF 0.20 2.01 2.01 2.01 152,939 3,047 11 7.61% n/a n/a n/a 50.29 50.46 50.05 0.00% n/a n/a n/a n/a
VCF ETF 0.30 122.66 -2.68 -0.33 13,231,379 273,748 449 10.79% 0.19% 1,103 997 48.67 52.06 48.16 9.52% -1.85% 3.02% n/a n/a
VIF ETF 0.20 158.94 6.80 9.31 13,320,193 277,318 614 8.38% 0.17% 1,130 1,567 48.21 52.92 47.82 9.66% -1.63% 0.67% n/a n/a
Currency
AUDS MF BetaShares Strong Australian Dollar Fund (Hedge Fund) 1.38 1.56 -0.09 0.00 1,877,731 117,473 37 120.29% 0.18% 898 740 15.61 17.71 14.54 2.01% -5.17% n/a n/a n/a
EEU ETF BetaShares Euro ETF 0.45 5.74 0.05 0.00 445,103 30,281 20 7.75% 0.11% 1,030 792 14.70 14.93 13.37 0.00% 0.76% 5.52% 0.00% 3.42%
POU ETF BetaShares British Pound ETF 0.45 55.50 0.20 0.00 4,697,967 279,858 220 8.47% 0.09% 2,713 2,388 16.96 17.44 15.78 0.00% 0.35% 6.80% 0.00% 1.75%
USD ETF BetaShares U.S Dollar ETF 0.45 510.80 7.07 -3.48 40,794,570 3,258,193 998 7.99% 0.09% 7,625 5,770 12.67 13.57 11.97 0.17% 2.09% -0.83% 0.00% 5.89%
YANK MF BetaShares Strong US Dollar Fund (Hedge Fund) 1.38 14.95 1.94 1.36 3,066,279 231,982 96 20.51% 0.15% 624 853 13.59 15.54 12.02 0.00% 4.44% n/a n/a n/a
ZCNH ETF ETFS Physical Renminbi ETF 0.30 0.46 0.01 0.00 10,952 1,196 6 2.36% 0.25% 457 458 9.20 9.48 8.72 0.00% 2.22% 0.09% n/a n/a
ZUSD ETF ETFS Physical US Dollar ETF 0.30 13.20 1.20 0.95 2,785,746 281,228 46 21.11% 0.15% 1,028 1,006 9.97 10.61 9.44 0.00% 2.15% -0.90% n/a n/a
iShares Treasury ETF
iShares Core Global Corporate Bond (AUD Hedged) ETF
Russell Australian Select Corporate Bond ETF
Russell Australian Semi-Government Bond ETF
iShares Core Composite Bond ETF
iShares Government Inflation ETF
Russell Australian Government Bond ETF
VanEck Vectors Australian Corporate Bond Plus ETF
iShares Global High Yield Bond (AUD Hedged) ETF
Vanguard International Credit Securities Index (Hedged) ETF
Vanguard International Fixed Interest Index (Hedged) ETF
Vanguard Australian Corporate Fixed Interest Index ETF
Vanguard Australian Government Bond Index ETF
Vanguard Australian Fixed Interest Index ETF
Vanguard Global Aggregate Bond Index (Hedged) ETF
iShares J.P.Morgan USD Emerging Markets Bond (AUD Hedged) ETF
Betashares Australian High Interest Cash ETF
SPDR S&P/ASX Australian Bond Fund
iShares Core Cash ETF
BetaShares Australian Bank Senior Floating Rate Bond ETF
UBS IQ Cash ETF
SPDR S&P/ASX Australian Government Bond Fund
iShares Enhanced Cash ETF
VanEck Vectors Australian Floating Rate ETF
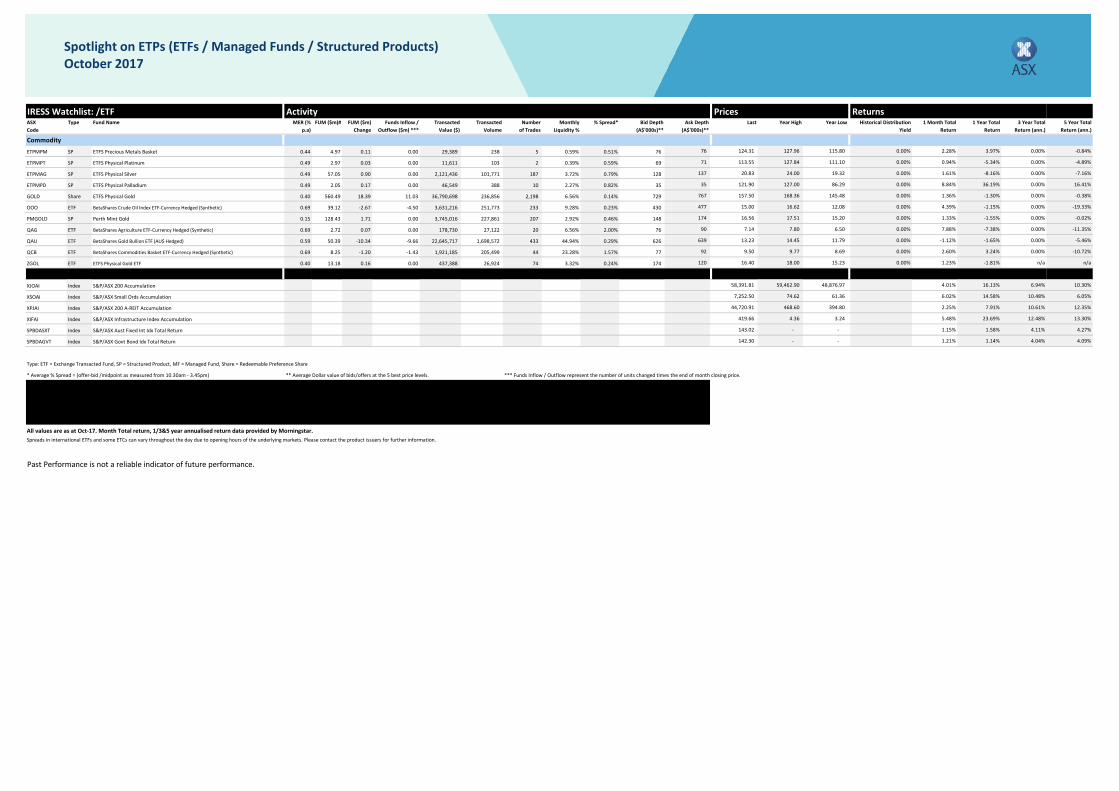
IRESS Watchlist: /ETF Activity Prices ReturnsASX Code
Type MER (% p.a)
FUM ($m)# FUM ($m) Change
Funds Inflow / Outflow ($m) ***
Transacted Value ($)
Transacted Volume
Number of Trades
Monthly Liquidity %
% Spread* Bid Depth (A$'000s)**
Ask Depth (A$'000s)**
Last Year High Year Low Historical Distribution Yield
1 Month Total Return
1 Year Total Return
3 Year Total Return (ann.)
5 Year Total Return (ann.)
Fund Name
Spotlight on ETPs (ETFs / Managed Funds / Structured Products)October 2017
Commodity
ETPMPM SP 0.44 4.97 0.11 0.00 29,389 238 5 0.59% 0.51% 76 76 124.31 127.96 115.80 0.00% 2.28% 3.97% 0.00% -0.84%
ETPMPT SP 0.49 2.97 0.03 0.00 11,611 103 2 0.39% 0.59% 69 71 113.55 127.84 111.10 0.00% 0.94% -5.34% 0.00% -4.89%
ETPMAG SP 0.49 57.05 0.90 0.00 2,121,436 101,771 187 3.72% 0.79% 128 137 20.83 24.00 19.32 0.00% 1.61% -8.16% 0.00% -7.16%
ETPMPD SP ETFS Physical Palladium 0.49 2.05 0.17 0.00 46,549 388 10 2.27% 0.82% 35 35 121.90 127.00 86.29 0.00% 8.84% 36.19% 0.00% 16.41%
GOLD Share ETFS Physical Gold 0.40 560.49 18.39 11.03 36,790,698 236,856 2,198 6.56% 0.14% 729 767 157.50 168.36 145.48 0.00% 1.36% -1.30% 0.00% -0.38%
OOO ETF 0.69 39.12 -2.67 -4.50 3,631,216 251,773 233 9.28% 0.23% 430 477 15.00 16.62 12.08 0.00% 4.39% -1.15% 0.00% -19.33%
PMGOLD SP Perth Mint Gold 0.15 128.43 1.71 0.00 3,745,016 227,861 207 2.92% 0.46% 148 174 16.56 17.51 15.20 0.00% 1.33% -1.55% 0.00% -0.02%
QAG ETF BetaShares Agriculture ETF-Currency Hedged (Synthetic) 0.69 2.72 0.07 0.00 178,730 27,122 20 6.56% 2.00% 76 90 7.14 7.80 6.50 0.00% 7.88% -7.38% 0.00% -11.35%
QAU ETF 0.59 50.39 -10.34 -9.66 22,645,717 1,698,572 433 44.94% 0.29% 626 639 13.23 14.45 11.79 0.00% -1.12% -1.65% 0.00% -5.46%
QCB ETF 0.69 8.25 -1.20 -1.43 1,921,185 205,499 44 23.28% 1.57% 77 92 9.50 9.77 8.69 0.00% 2.60% 3.24% 0.00% -10.72%
ZGOL ETF 0.40 13.18 0.16 0.00 437,388 26,924 74 3.32% 0.24% 174 120 16.40 18.00 15.23 0.00% 1.23% -1.81% n/a n/a
Australian Indices
XJOAI Index S&P/ASX 200 Accumulation 58,391.81 59,462.90 48,876.97 4.01% 16.13% 6.94% 10.30%
XSOAI Index S&P/ASX Small Ords Accumulation 7,252.50 74.62 61.36 6.02% 14.58% 10.48% 6.05%
XPJAI Index S&P/ASX 200 A-REIT Accumulation 44,720.91 468.60 394.80 2.25% 7.91% 10.61% 12.35%
XIFAI Index S&P/ASX Infrastructure Index Accumulation 419.66 4.36 3.24 5.48% 23.69% 12.48% 13.30%
SPBDASXT Index S&P/ASX Aust Fixed Int Idx Total Return 143.02 - - 1.15% 1.58% 4.11% 4.27%
SPBDAGVT Index S&P/ASX Govt Bond Idx Total Return 142.30 - - 1.21% 1.14% 4.04% 4.09%
* Average % Spread = (offer-bid /midpoint as measured from 10.30am - 3.45pm) ** Average Dollar value of bids/offers at the 5 best price levels. *** Funds Inflow / Outflow represent the number of units changed times the end of month closing price.
All values are as at Oct-17. Month Total return, 1/3&5 year annualised return data provided by Morningstar.
Past Performance is not a reliable indicator of future performance.
ETFS Physical Gold ETF
BetaShares Gold Bullion ETF (AU$ Hedged)
BetaShares Commodities Basket ETF-Currency Hedged (Synthetic)
Spreads in international ETFs and some ETCs can vary throughout the day due to opening hours of the underlying markets. Please contact the product issuers for further information.
Type: ETF = Exchange Transacted Fund, SP = Structured Product, MF = Managed Fund, Share = Redeemable Preference Share
# The FUM for each ETP is based off the last reported number of units recorded in CHESS multiplied by the closing price on the last Transaction day of the month.MER (management expense ratio figures have been extracted form the relevant PDS or as updated by the issuer of the product. Under the Corporations Regulations, managment costs do not include transactional or operational costs or certain other fees and costs which may also apply. Such costs may be significant. When considering a product or comparing between products you should refer to the relevant PDS(s) for more information on any additional costs associated with each product.
BetaShares Crude Oil Index ETF-Currency Hedged (Synthetic)
ETFS Physical Silver
ETFS Precious Metals Basket
ETFS Physical Platinum
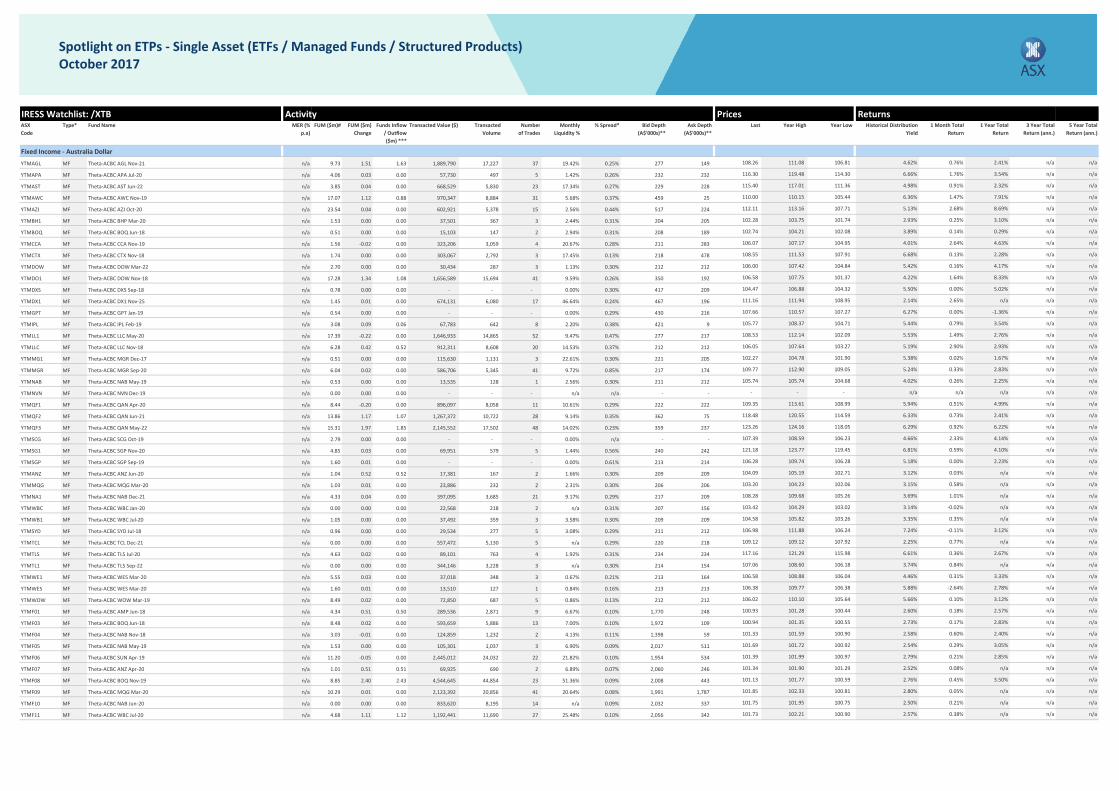
IRESS Watchlist: /XTB Activity Prices ReturnsASX Code
Type* MER (% p.a)
FUM ($m)# FUM ($m) Change
Funds Inflow / Outflow ($m) ***
Transacted Value ($) Transacted Volume
Number of Trades
Monthly Liquidity %
% Spread* Bid Depth (A$'000s)**
Ask Depth (A$'000s)**
Last Year High Year Low Historical Distribution Yield
1 Month Total Return
1 Year Total Return
3 Year Total Return (ann.)
5 Year Total Return (ann.)
Fixed Income - Australia Dollar
YTMAGL MF n/a 9.73 1.51 1.63 1,889,790 17,227 37 19.42% 0.25% 277 149 108.26 111.08 106.81 4.62% 0.76% 2.41% n/a n/a
YTMAPA MF n/a 4.06 0.03 0.00 57,730 497 5 1.42% 0.26% 232 232 116.30 119.48 114.30 6.66% 1.76% 3.54% n/a n/a
YTMAST MF n/a 3.85 0.04 0.00 668,529 5,830 23 17.34% 0.27% 229 228 115.40 117.01 111.36 4.98% 0.91% 2.32% n/a n/a
YTMAWC MF n/a 17.07 1.12 0.88 970,347 8,884 31 5.68% 0.37% 459 25 110.00 110.15 105.44 6.36% 1.47% 7.91% n/a n/a
YTMAZJ MF n/a 23.54 0.04 0.00 602,921 5,378 15 2.56% 0.44% 517 224 112.11 113.16 107.71 5.13% 2.68% 8.69% n/a n/a
YTMBH1 MF n/a 1.53 0.00 0.00 37,501 367 3 2.44% 0.31% 204 205 102.28 103.75 101.74 2.93% 0.25% 3.10% n/a n/a
YTMBOQ MF n/a 0.51 0.00 0.00 15,103 147 2 2.94% 0.31% 208 189 102.74 104.21 102.08 3.89% 0.14% 0.29% n/a n/a
YTMCCA MF n/a 1.56 -0.02 0.00 323,206 3,059 4 20.67% 0.28% 211 283 106.07 107.17 104.95 4.01% 2.64% 4.63% n/a n/a
YTMCTX MF n/a 1.74 0.00 0.00 303,067 2,792 3 17.45% 0.13% 218 478 108.55 111.53 107.91 6.68% 0.13% 2.28% n/a n/a
YTMDOW MF n/a 2.70 0.00 0.00 30,434 287 3 1.13% 0.30% 212 212 106.00 107.42 104.84 5.42% 0.16% 4.17% n/a n/a
YTMDO1 MF n/a 17.28 1.34 1.08 1,656,589 15,694 41 9.59% 0.26% 350 192 106.58 107.75 101.37 4.22% 1.64% 8.33% n/a n/a
YTMDXS MF n/a 0.78 0.00 0.00 - - - 0.00% 0.30% 417 209 104.47 106.88 104.32 5.50% 0.00% 5.02% n/a n/a
YTMDX1 MF n/a 1.45 0.01 0.00 674,131 6,080 17 46.64% 0.24% 467 196 111.16 111.94 108.95 2.14% 2.65% n/a n/a n/a
YTMGPT MF n/a 0.54 0.00 0.00 - - - 0.00% 0.29% 430 216 107.66 110.57 107.27 6.27% 0.00% -1.36% n/a n/a
YTMIPL MF n/a 3.08 0.09 0.06 67,783 642 8 2.20% 0.38% 421 9 105.77 108.37 104.71 5.44% 0.79% 3.54% n/a n/a
YTMLL1 MF n/a 17.39 -0.22 0.00 1,646,933 14,865 52 9.47% 0.47% 277 217 108.53 112.14 102.09 5.53% 1.49% 2.76% n/a n/a
YTMLLC MF n/a 6.28 0.42 0.52 912,311 8,608 20 14.53% 0.37% 212 212 106.05 107.64 103.27 5.19% 2.90% 2.93% n/a n/a
YTMMG1 MF n/a 0.51 0.00 0.00 115,630 1,131 3 22.61% 0.30% 221 205 102.27 104.78 101.90 5.38% 0.02% 1.67% n/a n/a
YTMMGR MF n/a 6.04 0.02 0.00 586,706 5,345 41 9.72% 0.85% 217 174 109.77 112.90 109.05 5.24% 0.33% 2.83% n/a n/a
YTMNAB MF n/a 0.53 0.00 0.00 13,535 128 1 2.56% 0.30% 211 212 105.74 105.74 104.68 4.02% 0.26% 2.25% n/a n/a
YTMNVN MF Theta-ACBC NVN Dec-19 n/a 0.00 0.00 0.00 - - - n/a n/a - - - - - n/a n/a n/a n/a n/a
YTMQF1 MF Theta-ACBC QAN Apr-20 n/a 8.44 -0.20 0.00 896,097 8,058 11 10.61% 0.29% 222 222 109.35 113.61 108.99 5.94% 0.51% 4.99% n/a n/a
YTMQF2 MF Theta-ACBC QAN Jun-21 n/a 13.86 1.17 1.07 1,267,372 10,722 28 9.14% 0.35% 362 75 118.48 120.55 114.59 6.33% 0.73% 2.41% n/a n/a
YTMQF3 MF Theta-ACBC QAN May-22 n/a 15.31 1.97 1.85 2,145,552 17,502 48 14.02% 0.23% 359 237 123.26 124.16 118.05 6.29% 0.92% 6.22% n/a n/a
YTMSCG MF Theta-ACBC SCG Oct-19 n/a 2.79 0.00 0.00 - - - 0.00% n/a - - 107.39 108.59 106.23 4.66% 2.33% 4.14% n/a n/a
YTMSG1 MF Theta-ACBC SGP Nov-20 n/a 4.85 0.03 0.00 69,951 579 5 1.44% 0.56% 240 242 121.18 123.77 119.45 6.81% 0.59% 4.10% n/a n/a
YTMSGP MF Theta-ACBC SGP Sep-19 n/a 1.60 0.01 0.00 - - - 0.00% 0.61% 213 214 106.28 109.74 106.28 5.18% 0.00% 2.23% n/a n/a
YTMANZ MF Theta-ACBC ANZ Jun-20 n/a 1.04 0.52 0.52 17,381 167 2 1.66% 0.30% 209 209 104.09 105.19 102.71 3.12% 0.03% n/a n/a n/a
YTMMQG MF Theta-ACBC MQG Mar-20 n/a 1.03 0.01 0.00 23,886 232 2 2.31% 0.30% 206 206 103.20 104.23 102.06 3.15% 0.58% n/a n/a n/a
YTMNA1 MF Theta-ACBC NAB Dec-21 n/a 4.33 0.04 0.00 397,095 3,685 21 9.17% 0.29% 217 209 108.28 109.68 105.26 3.69% 1.01% n/a n/a n/a
YTMWBC MF Theta-ACBC WBC Jan-20 n/a 0.00 0.00 0.00 22,568 218 2 n/a 0.31% 207 156 103.42 104.29 103.02 3.14% -0.02% n/a n/a n/a
YTMWB1 MF Theta-ACBC WBC Jul-20 n/a 1.05 0.00 0.00 37,492 359 3 3.58% 0.30% 209 209 104.58 105.82 103.26 3.35% 0.35% n/a n/a n/a
YTMSYD MF Theta-ACBC SYD Jul-18 n/a 0.96 0.00 0.00 29,534 277 5 3.08% 0.29% 211 212 106.98 111.88 106.24 7.24% -0.11% 3.12% n/a n/a
YTMTCL MF Theta-ACBC TCL Dec-21 n/a 0.00 0.00 0.00 557,472 5,130 5 n/a 0.29% 220 218 109.12 109.12 107.92 2.25% 0.77% n/a n/a n/a
YTMTLS MF Theta-ACBC TLS Jul-20 n/a 4.63 0.02 0.00 89,101 763 4 1.92% 0.31% 234 234 117.16 121.29 115.98 6.61% 0.36% 2.67% n/a n/a
YTMTL1 MF Theta-ACBC TLS Sep-22 n/a 0.00 0.00 0.00 344,146 3,228 3 n/a 0.30% 214 154 107.06 108.60 106.18 3.74% 0.84% n/a n/a n/a
YTMWE1 MF Theta-ACBC WES Mar-20 n/a 5.55 0.03 0.00 37,018 348 3 0.67% 0.21% 213 164 106.58 108.88 106.04 4.46% 0.31% 3.33% n/a n/a
YTMWES MF Theta-ACBC WES Mar-20 n/a 1.60 0.01 0.00 13,510 127 1 0.84% 0.16% 213 213 106.38 109.77 106.38 5.88% -2.64% 2.78% n/a n/a
YTMWOW MF Theta-ACBC WOW Mar-19 n/a 8.49 0.02 0.00 72,850 687 5 0.86% 0.13% 212 212 106.02 110.10 105.64 5.66% 0.10% 3.12% n/a n/a
YTMF01 MF Theta-ACBC AMP Jun-18 n/a 4.34 0.51 0.50 289,536 2,871 9 6.67% 0.10% 1,770 248 100.93 101.28 100.44 2.60% 0.18% 2.57% n/a n/a
YTMF03 MF Theta-ACBC BOQ Jun-18 n/a 8.48 0.02 0.00 593,659 5,886 13 7.00% 0.10% 1,972 109 100.94 101.35 100.55 2.73% 0.17% 2.83% n/a n/a
YTMF04 MF Theta-ACBC NAB Nov-18 n/a 3.03 -0.01 0.00 124,859 1,232 2 4.13% 0.11% 1,398 59 101.33 101.59 100.90 2.58% 0.60% 2.40% n/a n/a
YTMF05 MF Theta-ACBC NAB May-19 n/a 1.53 0.00 0.00 105,301 1,037 3 6.90% 0.09% 2,017 511 101.69 101.72 100.92 2.54% 0.29% 3.05% n/a n/a
YTMF06 MF Theta-ACBC SUN Apr-19 n/a 11.20 -0.05 0.00 2,445,012 24,032 22 21.82% 0.10% 1,954 534 101.39 101.99 100.97 2.79% 0.21% 2.85% n/a n/a
YTMF07 MF Theta-ACBC ANZ Apr-20 n/a 1.01 0.51 0.51 69,925 690 2 6.89% 0.07% 2,060 246 101.34 101.90 101.29 2.52% 0.08% n/a n/a n/a
YTMF08 MF Theta-ACBC BOQ Nov-19 n/a 8.85 2.40 2.43 4,544,645 44,854 23 51.36% 0.09% 2,008 443 101.13 101.77 100.59 2.76% 0.45% 3.50% n/a n/a
YTMF09 MF Theta-ACBC MQG Mar-20 n/a 10.29 0.01 0.00 2,123,392 20,856 41 20.64% 0.08% 1,991 1,787 101.85 102.33 100.81 2.80% 0.05% n/a n/a n/a
YTMF10 MF Theta-ACBC NAB Jun-20 n/a 0.00 0.00 0.00 833,620 8,195 14 n/a 0.09% 2,032 337 101.75 101.95 100.75 2.50% 0.21% n/a n/a n/a
YTMF11 MF Theta-ACBC WBC Jul-20 n/a 4.68 1.11 1.12 1,192,441 11,690 27 25.48% 0.10% 2,056 342 101.73 102.21 100.90 2.57% 0.38% n/a n/a n/a
Theta-ACBC LLC Nov-18
Theta-ACBC CTX Nov-18
Theta-ACBC DXS Sep-18
Theta-ACBC GPT Jan-19
Theta-ACBC IPL Feb-19
Theta-ACBC LLC May-20
Theta-ACBC DOW Mar-22
Theta-ACBC DOW Nov-18
Theta-ACBC MGR Dec-17
Theta-ACBC MGR Sep-20
Theta-ACBC NAB May-19
Theta-ACBC DX1 Nov-25
Theta-ACBC CCA Nov-19
Fund Name
Theta-ACBC APA Jul-20
Theta-ACBC AZJ Oct-20
Theta-ACBC BOQ Jun-18
Theta-ACBC AGL Nov-21
Theta-ACBC AWC Nov-19
Theta-ACBC AST Jun-22
Theta-ACBC BHP Mar-20
Spotlight on ETPs - Single Asset (ETFs / Managed Funds / Structured Products)October 2017
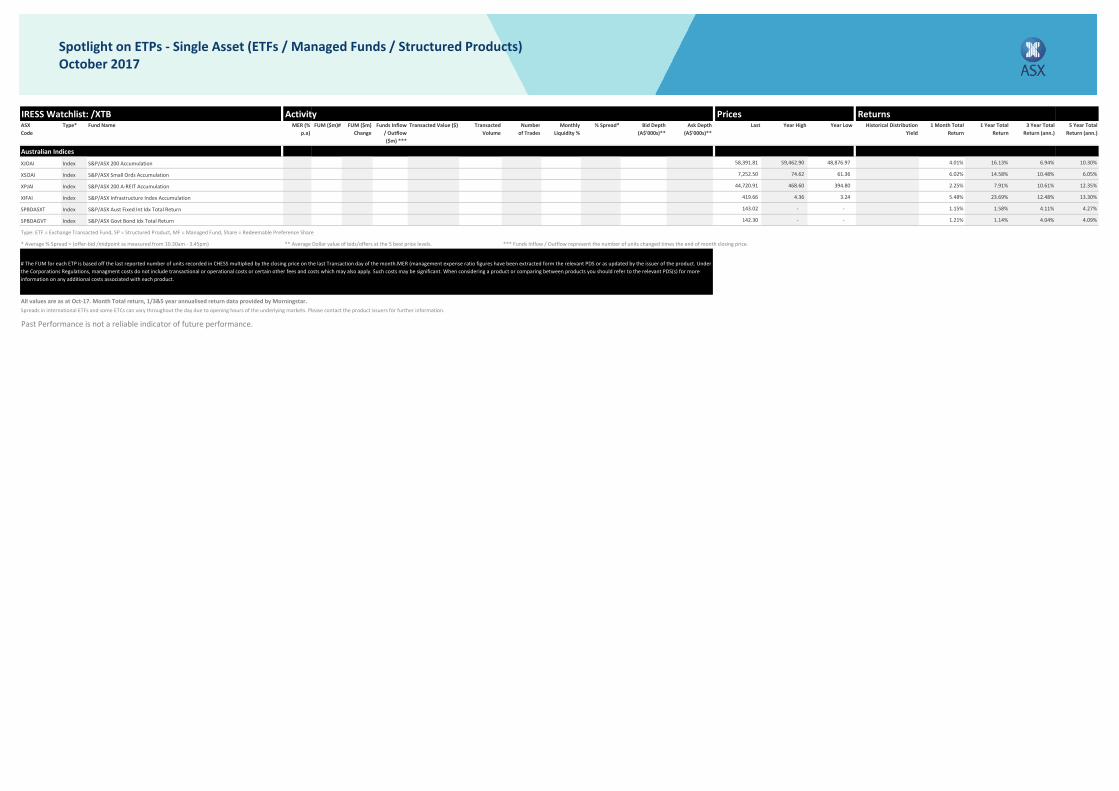
IRESS Watchlist: /XTB Activity Prices ReturnsASX Code
Type* MER (% p.a)
FUM ($m)# FUM ($m) Change
Funds Inflow / Outflow ($m) ***
Transacted Value ($) Transacted Volume
Number of Trades
Monthly Liquidity %
% Spread* Bid Depth (A$'000s)**
Ask Depth (A$'000s)**
Last Year High Year Low Historical Distribution Yield
1 Month Total Return
1 Year Total Return
3 Year Total Return (ann.)
5 Year Total Return (ann.)
Fund Name
Spotlight on ETPs - Single Asset (ETFs / Managed Funds / Structured Products)October 2017
Australian Indices
XJOAI Index S&P/ASX 200 Accumulation 58,391.81 59,462.90 48,876.97 4.01% 16.13% 6.94% 10.30%
XSOAI Index S&P/ASX Small Ords Accumulation 7,252.50 74.62 61.36 6.02% 14.58% 10.48% 6.05%
XPJAI Index S&P/ASX 200 A-REIT Accumulation 44,720.91 468.60 394.80 2.25% 7.91% 10.61% 12.35%
XIFAI Index S&P/ASX Infrastructure Index Accumulation 419.66 4.36 3.24 5.48% 23.69% 12.48% 13.30%
SPBDASXT Index S&P/ASX Aust Fixed Int Idx Total Return 143.02 - - 1.15% 1.58% 4.11% 4.27%
SPBDAGVT Index S&P/ASX Govt Bond Idx Total Return 142.30 - - 1.21% 1.14% 4.04% 4.09%
* Average % Spread = (offer-bid /midpoint as measured from 10.30am - 3.45pm) ** Average Dollar value of bids/offers at the 5 best price levels. *** Funds Inflow / Outflow represent the number of units changed times the end of month closing price.
All values are as at Oct-17. Month Total return, 1/3&5 year annualised return data provided by Morningstar.
Past Performance is not a reliable indicator of future performance.
Spreads in international ETFs and some ETCs can vary throughout the day due to opening hours of the underlying markets. Please contact the product issuers for further information.
Type: ETF = Exchange Transacted Fund, SP = Structured Product, MF = Managed Fund, Share = Redeemable Preference Share
# The FUM for each ETP is based off the last reported number of units recorded in CHESS multiplied by the closing price on the last Transaction day of the month.MER (management expense ratio figures have been extracted form the relevant PDS or as updated by the issuer of the product. Under the Corporations Regulations, managment costs do not include transactional or operational costs or certain other fees and costs which may also apply. Such costs may be significant. When considering a product or comparing between products you should refer to the relevant PDS(s) for more information on any additional costs associated with each product.
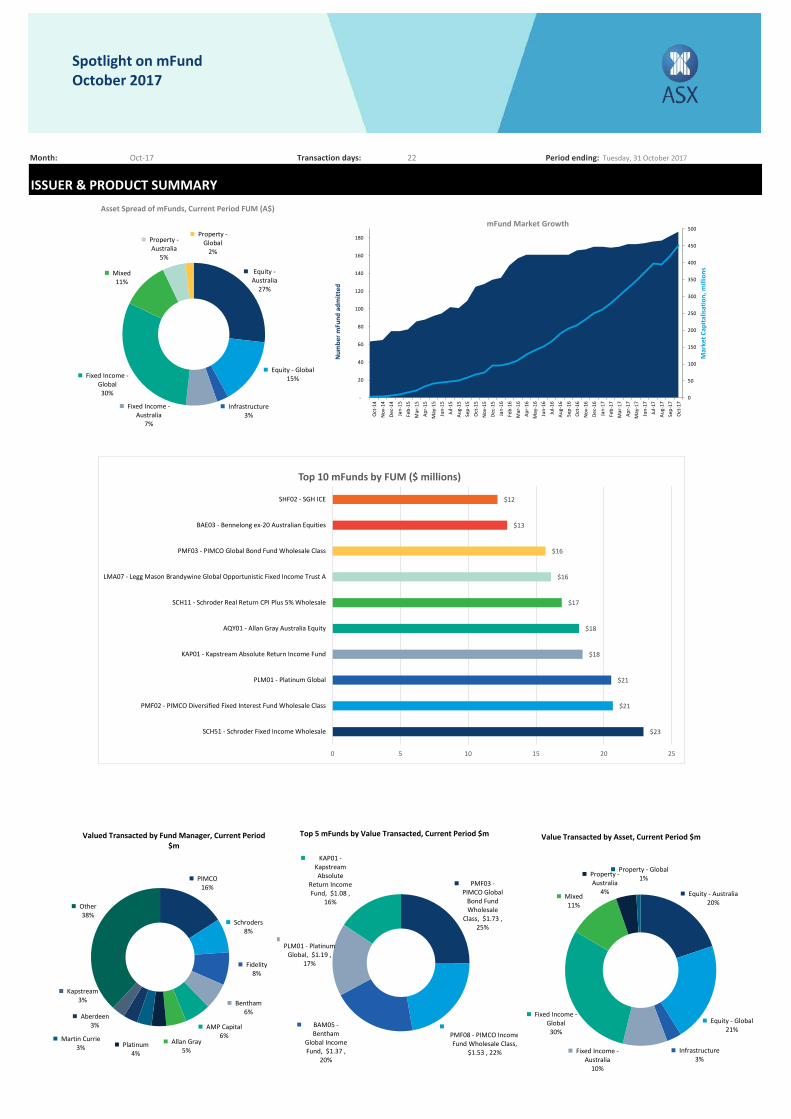
Month: Oct-17 Transaction days: 22 Period ending: Tuesday, 31 October 2017
ISSUER & PRODUCT SUMMARY
Equity -Australia
27%
Equity - Global15%
Infrastructure3%
Fixed Income -Australia
7%
Fixed Income -Global30%
Mixed11%
Property -Australia
5%
Property -Global
2%
Asset Spread of mFunds, Current Period FUM (A$)
0
50
100
150
200
250
300
350
400
450
500
-
20
40
60
80
100
120
140
160
180
Oct
-14
Nov
-14
Dec-
14Ja
n-15
Feb-
15M
ar-1
5Ap
r-15
May
-15
Jun-
15Ju
l-15
Aug-
15Se
p-15
Oct
-15
Nov
-15
Dec-
15Ja
n-16
Feb-
16M
ar-1
6Ap
r-16
May
-16
Jun-
16Ju
l-16
Aug-
16Se
p-16
Oct
-16
Nov
-16
Dec-
16Ja
n-17
Feb-
17M
ar-1
7Ap
r-17
May
-17
Jun-
17Ju
l-17
Aug-
17Se
p-17
Oct
-17
Mar
ket C
apita
lisat
ion,
mill
ions
Num
ber m
Fund
adm
itted
mFund Market Growth
Equity - Australia20%
Equity - Global21%
Infrastructure3%
Fixed Income -Australia
10%
Fixed Income -Global30%
Mixed11%
Property -Australia
4%
Property - Global1%
Value Transacted by Asset, Current Period $m
PMF03 -PIMCO Global
Bond Fund Wholesale
Class, $1.73 , 25%
PMF08 - PIMCO Income Fund Wholesale Class,
$1.53 , 22%
BAM05 -Bentham
Global Income Fund, $1.37 ,
20%
PLM01 - Platinum Global, $1.19 ,
17%
KAP01 -Kapstream Absolute
Return Income Fund, $1.08 ,
16%
Top 5 mFunds by Value Transacted, Current Period $m
PIMCO16%
Schroders8%
Fidelity8%
Bentham6%
AMP Capital6%
Allan Gray5%
Platinum4%
Martin Currie3%
Aberdeen3%
Kapstream3%
Other38%
Valued Transacted by Fund Manager, Current Period $m
$23
$21
$21
$18
$18
$17
$16
$16
$13
$12
SCH51 - Schroder Fixed Income Wholesale
PMF02 - PIMCO Diversified Fixed Interest Fund Wholesale Class
PLM01 - Platinum Global
KAP01 - Kapstream Absolute Return Income Fund
AQY01 - Allan Gray Australia Equity
SCH11 - Schroder Real Return CPI Plus 5% Wholesale
LMA07 - Legg Mason Brandywine Global Opportunistic Fixed Income Trust A
PMF03 - PIMCO Global Bond Fund Wholesale Class
BAE03 - Bennelong ex-20 Australian Equities
SHF02 - SGH ICE
0 5 10 15 20 25
Top 10 mFunds by FUM ($ millions)
Spotlight on mFundOctober 2017
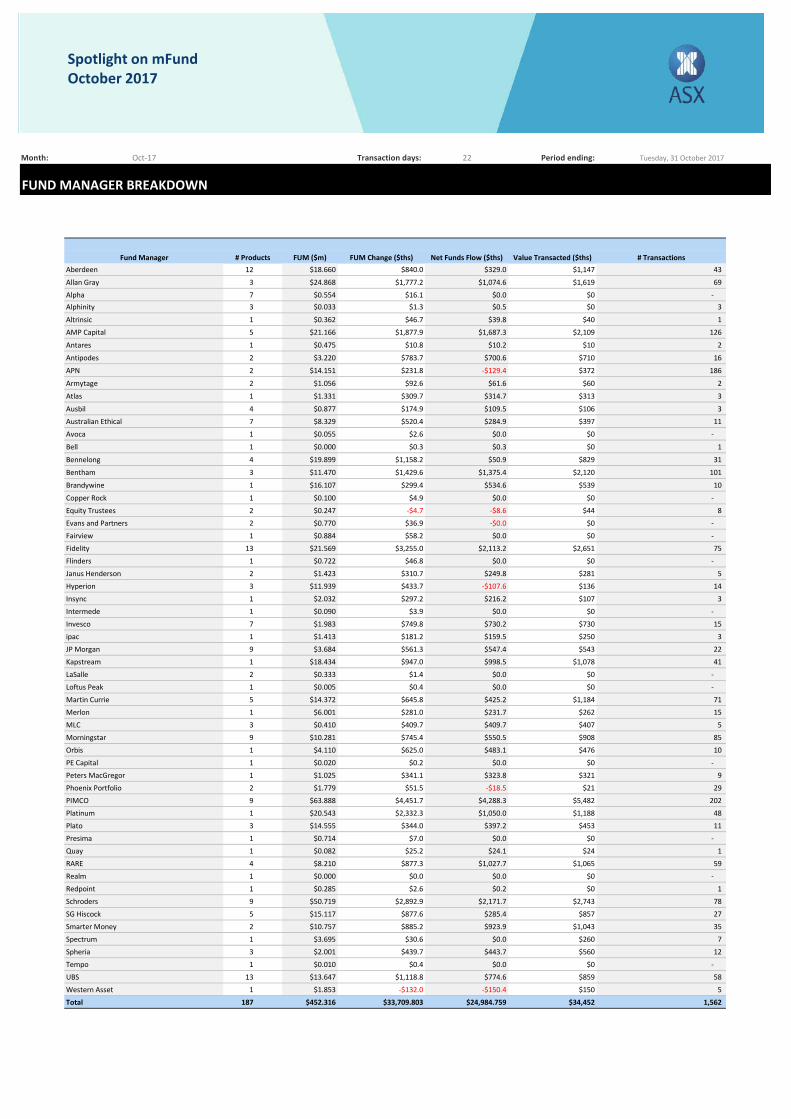
Month: Oct-17 Transaction days: 22 Period ending: Tuesday, 31 October 2017
FUND MANAGER BREAKDOWN
Aberdeen 12 $18.660 $840.0 $329.0 $1,147 43
Allan Gray 3 $24.868 $1,777.2 $1,074.6 $1,619 69 Alpha 7 $0.554 $16.1 $0.0 $0 - Alphinity 3 $0.033 $1.3 $0.5 $0 3
Altrinsic 1 $0.362 $46.7 $39.8 $40 1 AMP Capital 5 $21.166 $1,877.9 $1,687.3 $2,109 126
Antares 1 $0.475 $10.8 $10.2 $10 2
Antipodes 2 $3.220 $783.7 $700.6 $710 16
APN 2 $14.151 $231.8 -$129.4 $372 186
Armytage 2 $1.056 $92.6 $61.6 $60 2
Atlas 1 $1.331 $309.7 $314.7 $313 3
Ausbil 4 $0.877 $174.9 $109.5 $106 3 Australian Ethical 7 $8.329 $520.4 $284.9 $397 11 Avoca 1 $0.055 $2.6 $0.0 $0 -
Bell 1 $0.000 $0.3 $0.3 $0 1
Bennelong 4 $19.899 $1,158.2 $50.9 $829 31
Bentham 3 $11.470 $1,429.6 $1,375.4 $2,120 101
Brandywine 1 $16.107 $299.4 $534.6 $539 10
Copper Rock 1 $0.100 $4.9 $0.0 $0 -
Equity Trustees 2 $0.247 -$4.7 -$8.6 $44 8
Evans and Partners 2 $0.770 $36.9 -$0.0 $0 -
Fairview 1 $0.884 $58.2 $0.0 $0 -
Fidelity 13 $21.569 $3,255.0 $2,113.2 $2,651 75
Flinders 1 $0.722 $46.8 $0.0 $0 -
Janus Henderson 2 $1.423 $310.7 $249.8 $281 5
Hyperion 3 $11.939 $433.7 -$107.6 $136 14
Insync 1 $2.032 $297.2 $216.2 $107 3
Intermede 1 $0.090 $3.9 $0.0 $0 -
Invesco 7 $1.983 $749.8 $730.2 $730 15
ipac 1 $1.413 $181.2 $159.5 $250 3
JP Morgan 9 $3.684 $561.3 $547.4 $543 22
Kapstream 1 $18.434 $947.0 $998.5 $1,078 41
LaSalle 2 $0.333 $1.4 $0.0 $0 -
Loftus Peak 1 $0.005 $0.4 $0.0 $0 - Martin Currie 5 $14.372 $645.8 $425.2 $1,184 71
Merlon 1 $6.001 $281.0 $231.7 $262 15 MLC 3 $0.410 $409.7 $409.7 $407 5 Morningstar 9 $10.281 $745.4 $550.5 $908 85
Orbis 1 $4.110 $625.0 $483.1 $476 10
PE Capital 1 $0.020 $0.2 $0.0 $0 - Peters MacGregor 1 $1.025 $341.1 $323.8 $321 9
Phoenix Portfolio 2 $1.779 $51.5 -$18.5 $21 29 PIMCO 9 $63.888 $4,451.7 $4,288.3 $5,482 202 Platinum 1 $20.543 $2,332.3 $1,050.0 $1,188 48
Plato 3 $14.555 $344.0 $397.2 $453 11 Presima 1 $0.714 $7.0 $0.0 $0 - Quay 1 $0.082 $25.2 $24.1 $24 1 RARE 4 $8.210 $877.3 $1,027.7 $1,065 59 Realm 1 $0.000 $0.0 $0.0 $0 -
Redpoint 1 $0.285 $2.6 $0.2 $0 1 Schroders 9 $50.719 $2,892.9 $2,171.7 $2,743 78 SG Hiscock 5 $15.117 $877.6 $285.4 $857 27 Smarter Money 2 $10.757 $885.2 $923.9 $1,043 35
Spectrum 1 $3.695 $30.6 $0.0 $260 7 Spheria 3 $2.001 $439.7 $443.7 $560 12 Tempo 1 $0.010 $0.4 $0.0 $0 - UBS 13 $13.647 $1,118.8 $774.6 $859 58
Western Asset 1 $1.853 -$132.0 -$150.4 $150 5 Total 187 $452.316 $33,709.803 $24,984.759 $34,452 1,562
Fund Manager # Products FUM ($m) FUM Change ($ths) Net Funds Flow ($ths) Value Transacted ($ths) # Transactions
Spotlight on mFundOctober 2017
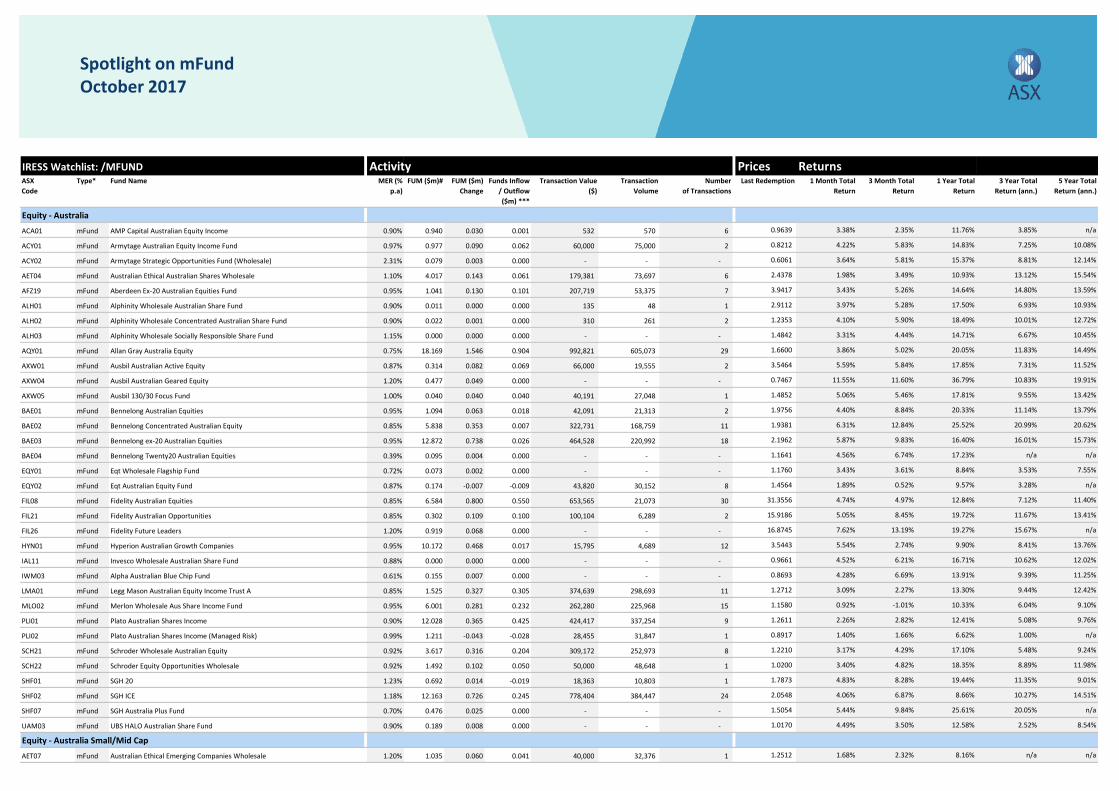
IRESS Watchlist: /MFUND Activity Prices ReturnsASX Code
Type* MER (% p.a)
FUM ($m)# FUM ($m) Change
Funds Inflow / Outflow ($m) ***
Transaction Value ($)
Transaction Volume
Number of Transactions
Last Redemption 1 Month Total Return
3 Month Total Return
1 Year Total Return
3 Year Total Return (ann.)
5 Year Total Return (ann.)
Equity - Australia
ACA01 mFund 0.90% 0.940 0.030 0.001 532 570 6 0.9639 3.38% 2.35% 11.76% 3.85% n/a
ACY01 mFund 0.97% 0.977 0.090 0.062 60,000 75,000 2 0.8212 4.22% 5.83% 14.83% 7.25% 10.08%
ACY02 mFund 2.31% 0.079 0.003 0.000 - - - 0.6061 3.64% 5.81% 15.37% 8.81% 12.14%
AET04 mFund 1.10% 4.017 0.143 0.061 179,381 73,697 6 2.4378 1.98% 3.49% 10.93% 13.12% 15.54%
AFZ19 mFund 0.95% 1.041 0.130 0.101 207,719 53,375 7 3.9417 3.43% 5.26% 14.64% 14.80% 13.59%
ALH01 mFund 0.90% 0.011 0.000 0.000 135 48 1 2.9112 3.97% 5.28% 17.50% 6.93% 10.93%
ALH02 mFund 0.90% 0.022 0.001 0.000 310 261 2 1.2353 4.10% 5.90% 18.49% 10.01% 12.72%
ALH03 mFund 1.15% 0.000 0.000 0.000 - - - 1.4842 3.31% 4.44% 14.71% 6.67% 10.45%
AQY01 mFund 0.75% 18.169 1.546 0.904 992,821 605,073 29 1.6600 3.86% 5.02% 20.05% 11.83% 14.49%
AXW01 mFund 0.87% 0.314 0.082 0.069 66,000 19,555 2 3.5464 5.59% 5.84% 17.85% 7.31% 11.52%
AXW04 mFund 1.20% 0.477 0.049 0.000 - - - 0.7467 11.55% 11.60% 36.79% 10.83% 19.91%
AXW05 mFund 1.00% 0.040 0.040 0.040 40,191 27,048 1 1.4852 5.06% 5.46% 17.81% 9.55% 13.42%
BAE01 mFund 0.95% 1.094 0.063 0.018 42,091 21,313 2 1.9756 4.40% 8.84% 20.33% 11.14% 13.79%
BAE02 mFund 0.85% 5.838 0.353 0.007 322,731 168,759 11 1.9381 6.31% 12.84% 25.52% 20.99% 20.62%
BAE03 mFund 0.95% 12.872 0.738 0.026 464,528 220,992 18 2.1962 5.87% 9.83% 16.40% 16.01% 15.73%
BAE04 mFund 0.39% 0.095 0.004 0.000 - - - 1.1641 4.56% 6.74% 17.23% n/a n/a
EQY01 mFund 0.72% 0.073 0.002 0.000 - - - 1.1760 3.43% 3.61% 8.84% 3.53% 7.55%
EQY02 mFund 0.87% 0.174 -0.007 -0.009 43,820 30,152 8 1.4564 1.89% 0.52% 9.57% 3.28% n/a
FIL08 mFund 0.85% 6.584 0.800 0.550 653,565 21,073 30 31.3556 4.74% 4.97% 12.84% 7.12% 11.40%
FIL21 mFund 0.85% 0.302 0.109 0.100 100,104 6,289 2 15.9186 5.05% 8.45% 19.72% 11.67% 13.41%
FIL26 mFund 1.20% 0.919 0.068 0.000 - - - 16.8745 7.62% 13.19% 19.27% 15.67% n/a
HYN01 mFund 0.95% 10.172 0.468 0.017 15,795 4,689 12 3.5443 5.54% 2.74% 9.90% 8.41% 13.76%
IAL11 mFund 0.88% 0.000 0.000 0.000 - - - 0.9661 4.52% 6.21% 16.71% 10.62% 12.02%
IWM03 mFund 0.61% 0.155 0.007 0.000 - - - 0.8693 4.28% 6.69% 13.91% 9.39% 11.25%
LMA01 mFund 0.85% 1.525 0.327 0.305 374,639 298,693 11 1.2712 3.09% 2.27% 13.30% 9.44% 12.42%
MLO02 mFund 0.95% 6.001 0.281 0.232 262,280 225,968 15 1.1580 0.92% -1.01% 10.33% 6.04% 9.10%
PLI01 mFund 0.90% 12.028 0.365 0.425 424,417 337,254 9 1.2611 2.26% 2.82% 12.41% 5.08% 9.76%
PLI02 mFund 0.99% 1.211 -0.043 -0.028 28,455 31,847 1 0.8917 1.40% 1.66% 6.62% 1.00% n/a
SCH21 mFund 0.92% 3.617 0.316 0.204 309,172 252,973 8 1.2210 3.17% 4.29% 17.10% 5.48% 9.24%
SCH22 mFund 0.92% 1.492 0.102 0.050 50,000 48,648 1 1.0200 3.40% 4.82% 18.35% 8.89% 11.98%
SHF01 mFund 1.23% 0.692 0.014 -0.019 18,363 10,803 1 1.7873 4.83% 8.28% 19.44% 11.35% 9.01%
SHF02 mFund 1.18% 12.163 0.726 0.245 778,404 384,447 24 2.0548 4.06% 6.87% 8.66% 10.27% 14.51%
SHF07 mFund 0.70% 0.476 0.025 0.000 - - - 1.5054 5.44% 9.84% 25.61% 20.05% n/a
UAM03 mFund 0.90% 0.189 0.008 0.000 - - - 1.0170 4.49% 3.50% 12.58% 2.52% 8.54%
Equity - Australia Small/Mid Cap
AET07 mFund 1.20% 1.035 0.060 0.041 40,000 32,376 1 1.2512 1.68% 2.32% 8.16% n/a n/a
UBS HALO Australian Share Fund
SGH 20
Fund Name
Armytage Australian Equity Income Fund
Armytage Strategic Opportunities Fund (Wholesale)
Eqt Wholesale Flagship Fund
Allan Gray Australia Equity
AMP Capital Australian Equity Income
Aberdeen Ex-20 Australian Equities Fund
Australian Ethical Australian Shares Wholesale
Bennelong Australian Equities
Bennelong Concentrated Australian Equity
Bennelong ex-20 Australian Equities
Ausbil Australian Active Equity
Alphinity Wholesale Socially Responsible Share Fund
SGH ICE
Legg Mason Australian Equity Income Trust A
Plato Australian Shares Income (Managed Risk)
Merlon Wholesale Aus Share Income Fund
Alphinity Wholesale Australian Share Fund
Ausbil 130/30 Focus Fund
Ausbil Australian Geared Equity
Alphinity Wholesale Concentrated Australian Share Fund
Eqt Australian Equity Fund
Bennelong Twenty20 Australian Equities
Invesco Wholesale Australian Share Fund
Hyperion Australian Growth Companies
Schroder Wholesale Australian Equity
Schroder Equity Opportunities Wholesale
Fidelity Australian Equities
Alpha Australian Blue Chip Fund
Fidelity Australian Opportunities
Fidelity Future Leaders
Plato Australian Shares Income
Australian Ethical Emerging Companies Wholesale
SGH Australia Plus Fund
Spotlight on mFundOctober 2017
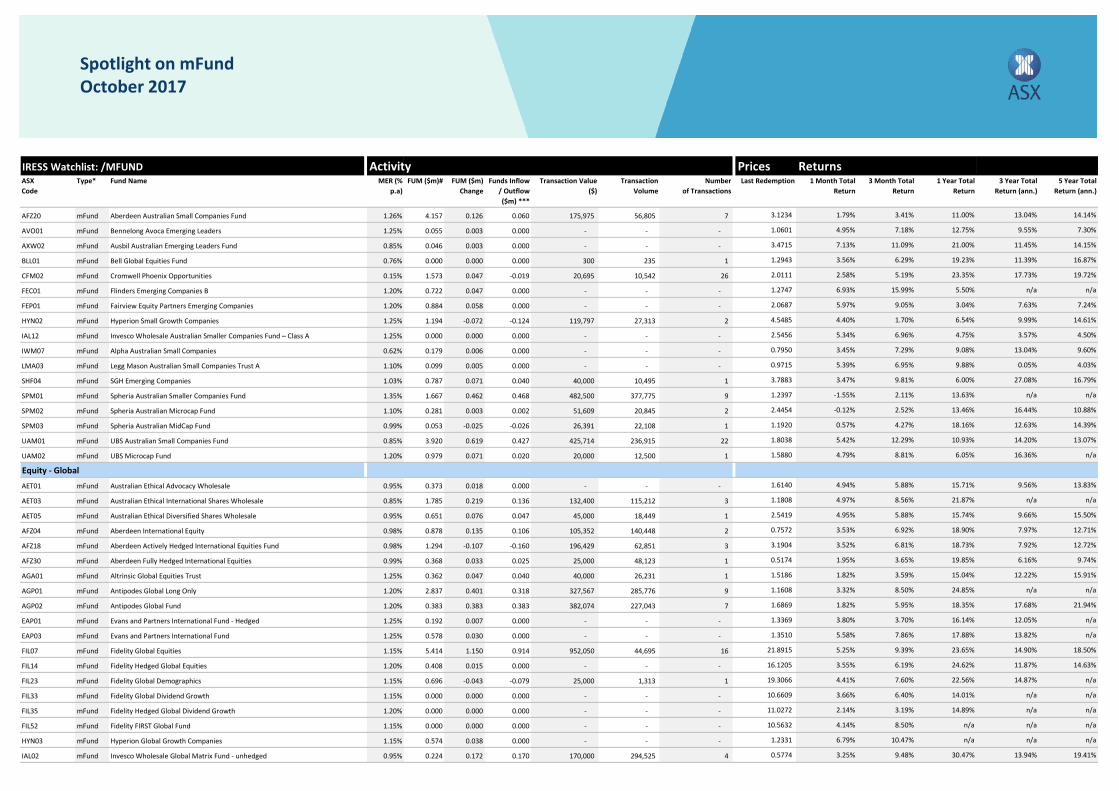
IRESS Watchlist: /MFUND Activity Prices ReturnsASX Code
Type* MER (% p.a)
FUM ($m)# FUM ($m) Change
Funds Inflow / Outflow ($m) ***
Transaction Value ($)
Transaction Volume
Number of Transactions
Last Redemption 1 Month Total Return
3 Month Total Return
1 Year Total Return
3 Year Total Return (ann.)
5 Year Total Return (ann.)
Fund Name
Spotlight on mFundOctober 2017
AFZ20 mFund Aberdeen Australian Small Companies Fund 1.26% 4.157 0.126 0.060 175,975 56,805 7 3.1234 1.79% 3.41% 11.00% 13.04% 14.14%
AVO01 mFund Bennelong Avoca Emerging Leaders 1.25% 0.055 0.003 0.000 - - - 1.0601 4.95% 7.18% 12.75% 9.55% 7.30%
AXW02 mFund Ausbil Australian Emerging Leaders Fund 0.85% 0.046 0.003 0.000 - - - 3.4715 7.13% 11.09% 21.00% 11.45% 14.15%
BLL01 mFund Bell Global Equities Fund 0.76% 0.000 0.000 0.000 300 235 1 1.2943 3.56% 6.29% 19.23% 11.39% 16.87%
CFM02 mFund Cromwell Phoenix Opportunities 0.15% 1.573 0.047 -0.019 20,695 10,542 26 2.0111 2.58% 5.19% 23.35% 17.73% 19.72%
FEC01 mFund Flinders Emerging Companies B 1.20% 0.722 0.047 0.000 - - - 1.2747 6.93% 15.99% 5.50% n/a n/a
FEP01 mFund Fairview Equity Partners Emerging Companies 1.20% 0.884 0.058 0.000 - - - 2.0687 5.97% 9.05% 3.04% 7.63% 7.24%
HYN02 mFund 1.25% 1.194 -0.072 -0.124 119,797 27,313 2 4.5485 4.40% 1.70% 6.54% 9.99% 14.61%
IAL12 mFund 1.25% 0.000 0.000 0.000 - - - 2.5456 5.34% 6.96% 4.75% 3.57% 4.50%
IWM07 mFund 0.62% 0.179 0.006 0.000 - - - 0.7950 3.45% 7.29% 9.08% 13.04% 9.60%
LMA03 mFund Legg Mason Australian Small Companies Trust A 1.10% 0.099 0.005 0.000 - - - 0.9715 5.39% 6.95% 9.88% 0.05% 4.03%
SHF04 mFund SGH Emerging Companies 1.03% 0.787 0.071 0.040 40,000 10,495 1 3.7883 3.47% 9.81% 6.00% 27.08% 16.79%
SPM01 mFund Spheria Australian Smaller Companies Fund 1.35% 1.667 0.462 0.468 482,500 377,775 9 1.2397 -1.55% 2.11% 13.63% n/a n/a
SPM02 mFund Spheria Australian Microcap Fund 1.10% 0.281 0.003 0.002 51,609 20,845 2 2.4454 -0.12% 2.52% 13.46% 16.44% 10.88%
SPM03 mFund Spheria Australian MidCap Fund 0.99% 0.053 -0.025 -0.026 26,391 22,108 1 1.1920 0.57% 4.27% 18.16% 12.63% 14.39%
UAM01 mFund UBS Australian Small Companies Fund 0.85% 3.920 0.619 0.427 425,714 236,915 22 1.8038 5.42% 12.29% 10.93% 14.20% 13.07%
UAM02 mFund UBS Microcap Fund 1.20% 0.979 0.071 0.020 20,000 12,500 1 1.5880 4.79% 8.81% 6.05% 16.36% n/a
Equity - Global
AET01 mFund Australian Ethical Advocacy Wholesale 0.95% 0.373 0.018 0.000 - - - 1.6140 4.94% 5.88% 15.71% 9.56% 13.83%
AET03 mFund Australian Ethical International Shares Wholesale 0.85% 1.785 0.219 0.136 132,400 115,212 3 1.1808 4.97% 8.56% 21.87% n/a n/a
AET05 mFund Australian Ethical Diversified Shares Wholesale 0.95% 0.651 0.076 0.047 45,000 18,449 1 2.5419 4.95% 5.88% 15.74% 9.66% 15.50%
AFZ04 mFund Aberdeen International Equity 0.98% 0.878 0.135 0.106 105,352 140,448 2 0.7572 3.53% 6.92% 18.90% 7.97% 12.71%
AFZ18 mFund Aberdeen Actively Hedged International Equities Fund 0.98% 1.294 -0.107 -0.160 196,429 62,851 3 3.1904 3.52% 6.81% 18.73% 7.92% 12.72%
AFZ30 mFund Aberdeen Fully Hedged International Equities 0.99% 0.368 0.033 0.025 25,000 48,123 1 0.5174 1.95% 3.65% 19.85% 6.16% 9.74%
AGA01 mFund Altrinsic Global Equities Trust 1.25% 0.362 0.047 0.040 40,000 26,231 1 1.5186 1.82% 3.59% 15.04% 12.22% 15.91%
AGP01 mFund Antipodes Global Long Only 1.20% 2.837 0.401 0.318 327,567 285,776 9 1.1608 3.32% 8.50% 24.85% n/a n/a
AGP02 mFund Antipodes Global Fund 1.20% 0.383 0.383 0.383 382,074 227,043 7 1.6869 1.82% 5.95% 18.35% 17.68% 21.94%
EAP01 mFund Evans and Partners International Fund - Hedged 1.25% 0.192 0.007 0.000 - - - 1.3369 3.80% 3.70% 16.14% 12.05% n/a
EAP03 mFund Evans and Partners International Fund 1.25% 0.578 0.030 0.000 - - - 1.3510 5.58% 7.86% 17.88% 13.82% n/a
FIL07 mFund Fidelity Global Equities 1.15% 5.414 1.150 0.914 952,050 44,695 16 21.8915 5.25% 9.39% 23.65% 14.90% 18.50%
FIL14 mFund Fidelity Hedged Global Equities 1.20% 0.408 0.015 0.000 - - - 16.1205 3.55% 6.19% 24.62% 11.87% 14.63%
FIL23 mFund Fidelity Global Demographics 1.15% 0.696 -0.043 -0.079 25,000 1,313 1 19.3066 4.41% 7.60% 22.56% 14.87% n/a
FIL33 mFund Fidelity Global Dividend Growth 1.15% 0.000 0.000 0.000 - - - 10.6609 3.66% 6.40% 14.01% n/a n/a
FIL35 mFund Fidelity Hedged Global Dividend Growth 1.20% 0.000 0.000 0.000 - - - 11.0272 2.14% 3.19% 14.89% n/a n/a
FIL52 mFund Fidelity FIRST Global Fund 1.15% 0.000 0.000 0.000 - - - 10.5632 4.14% 8.50% n/a n/a n/a
HYN03 mFund Hyperion Global Growth Companies 1.15% 0.574 0.038 0.000 - - - 1.2331 6.79% 10.47% n/a n/a n/a
IAL02 mFund Invesco Wholesale Global Matrix Fund - unhedged 0.95% 0.224 0.172 0.170 170,000 294,525 4 0.5774 3.25% 9.48% 30.47% 13.94% 19.41%
Alpha Australian Small Companies
Hyperion Small Growth Companies
Invesco Wholesale Australian Smaller Companies Fund – Class A
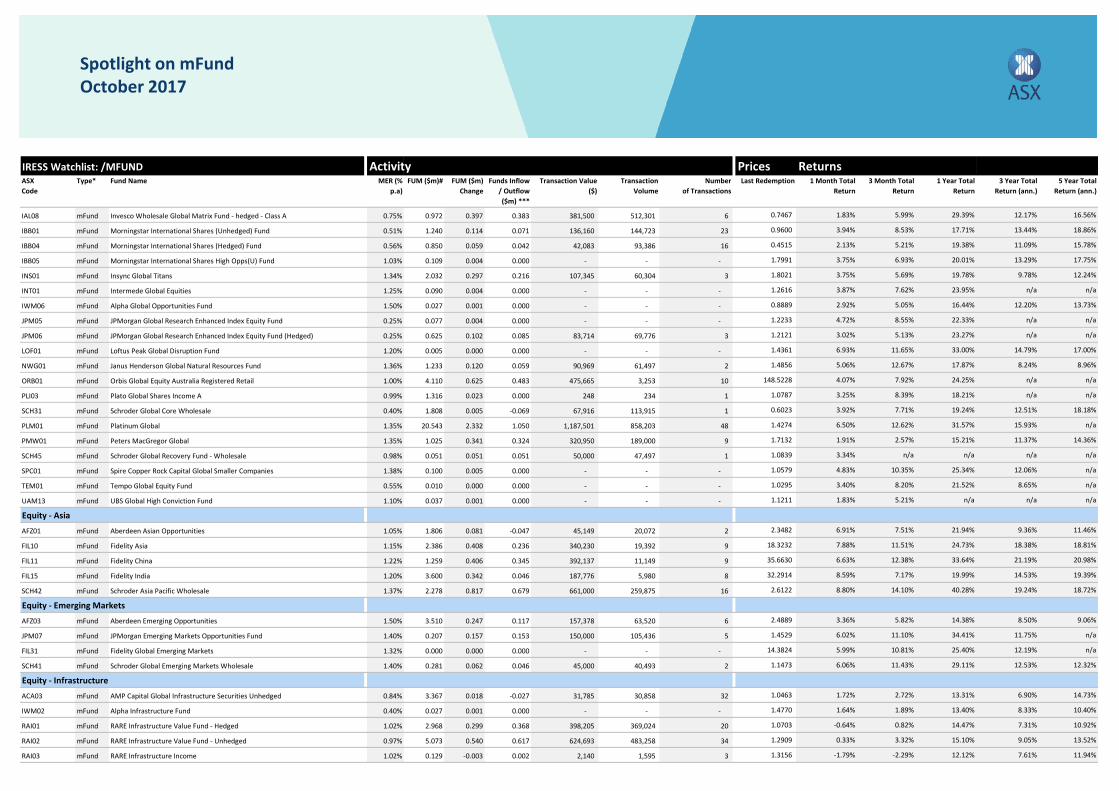
IRESS Watchlist: /MFUND Activity Prices ReturnsASX Code
Type* MER (% p.a)
FUM ($m)# FUM ($m) Change
Funds Inflow / Outflow ($m) ***
Transaction Value ($)
Transaction Volume
Number of Transactions
Last Redemption 1 Month Total Return
3 Month Total Return
1 Year Total Return
3 Year Total Return (ann.)
5 Year Total Return (ann.)
Fund Name
Spotlight on mFundOctober 2017
IAL08 mFund Invesco Wholesale Global Matrix Fund - hedged - Class A 0.75% 0.972 0.397 0.383 381,500 512,301 6 0.7467 1.83% 5.99% 29.39% 12.17% 16.56%
IBB01 mFund Morningstar International Shares (Unhedged) Fund 0.51% 1.240 0.114 0.071 136,160 144,723 23 0.9600 3.94% 8.53% 17.71% 13.44% 18.86%
IBB04 mFund Morningstar International Shares (Hedged) Fund 0.56% 0.850 0.059 0.042 42,083 93,386 16 0.4515 2.13% 5.21% 19.38% 11.09% 15.78%
IBB05 mFund Morningstar International Shares High Opps(U) Fund 1.03% 0.109 0.004 0.000 - - - 1.7991 3.75% 6.93% 20.01% 13.29% 17.75%
INS01 mFund Insync Global Titans 1.34% 2.032 0.297 0.216 107,345 60,304 3 1.8021 3.75% 5.69% 19.78% 9.78% 12.24%
INT01 mFund Intermede Global Equities 1.25% 0.090 0.004 0.000 - - - 1.2616 3.87% 7.62% 23.95% n/a n/a
IWM06 mFund Alpha Global Opportunities Fund 1.50% 0.027 0.001 0.000 - - - 0.8889 2.92% 5.05% 16.44% 12.20% 13.73%
JPM05 mFund JPMorgan Global Research Enhanced Index Equity Fund 0.25% 0.077 0.004 0.000 - - - 1.2233 4.72% 8.55% 22.33% n/a n/a
JPM06 mFund JPMorgan Global Research Enhanced Index Equity Fund (Hedged) 0.25% 0.625 0.102 0.085 83,714 69,776 3 1.2121 3.02% 5.13% 23.27% n/a n/a
LOF01 mFund Loftus Peak Global Disruption Fund 1.20% 0.005 0.000 0.000 - - - 1.4361 6.93% 11.65% 33.00% 14.79% 17.00%
NWG01 mFund Janus Henderson Global Natural Resources Fund 1.36% 1.233 0.120 0.059 90,969 61,497 2 1.4856 5.06% 12.67% 17.87% 8.24% 8.96%
ORB01 mFund Orbis Global Equity Australia Registered Retail 1.00% 4.110 0.625 0.483 475,665 3,253 10 148.5228 4.07% 7.92% 24.25% n/a n/a
PLI03 mFund Plato Global Shares Income A 0.99% 1.316 0.023 0.000 248 234 1 1.0787 3.25% 8.39% 18.21% n/a n/a
SCH31 mFund Schroder Global Core Wholesale 0.40% 1.808 0.005 -0.069 67,916 113,915 1 0.6023 3.92% 7.71% 19.24% 12.51% 18.18%
PLM01 mFund Platinum Global 1.35% 20.543 2.332 1.050 1,187,501 858,203 48 1.4274 6.50% 12.62% 31.57% 15.93% n/a
PMW01 mFund Peters MacGregor Global 1.35% 1.025 0.341 0.324 320,950 189,000 9 1.7132 1.91% 2.57% 15.21% 11.37% 14.36%
SCH45 mFund Schroder Global Recovery Fund - Wholesale 0.98% 0.051 0.051 0.051 50,000 47,497 1 1.0839 3.34% n/a n/a n/a n/a
SPC01 mFund Spire Copper Rock Capital Global Smaller Companies 1.38% 0.100 0.005 0.000 - - - 1.0579 4.83% 10.35% 25.34% 12.06% n/a
TEM01 mFund Tempo Global Equity Fund 0.55% 0.010 0.000 0.000 - - - 1.0295 3.40% 8.20% 21.52% 8.65% n/a
UAM13 mFund UBS Global High Conviction Fund 1.10% 0.037 0.001 0.000 - - - 1.1211 1.83% 5.21% n/a n/a n/a
Equity - Asia
AFZ01 mFund Aberdeen Asian Opportunities 1.05% 1.806 0.081 -0.047 45,149 20,072 2 2.3482 6.91% 7.51% 21.94% 9.36% 11.46%
FIL10 mFund Fidelity Asia 1.15% 2.386 0.408 0.236 340,230 19,392 9 18.3232 7.88% 11.51% 24.73% 18.38% 18.81%
FIL11 mFund Fidelity China 1.22% 1.259 0.406 0.345 392,137 11,149 9 35.6630 6.63% 12.38% 33.64% 21.19% 20.98%
FIL15 mFund Fidelity India 1.20% 3.600 0.342 0.046 187,776 5,980 8 32.2914 8.59% 7.17% 19.99% 14.53% 19.39%
SCH42 mFund Schroder Asia Pacific Wholesale 1.37% 2.278 0.817 0.679 661,000 259,875 16 2.6122 8.80% 14.10% 40.28% 19.24% 18.72%
Equity - Emerging Markets
AFZ03 mFund Aberdeen Emerging Opportunities 1.50% 3.510 0.247 0.117 157,378 63,520 6 2.4889 3.36% 5.82% 14.38% 8.50% 9.06%
JPM07 mFund JPMorgan Emerging Markets Opportunities Fund 1.40% 0.207 0.157 0.153 150,000 105,436 5 1.4529 6.02% 11.10% 34.41% 11.75% n/a
FIL31 mFund Fidelity Global Emerging Markets 1.32% 0.000 0.000 0.000 - - - 14.3824 5.99% 10.81% 25.40% 12.19% n/a
SCH41 mFund Schroder Global Emerging Markets Wholesale 1.40% 0.281 0.062 0.046 45,000 40,493 2 1.1473 6.06% 11.43% 29.11% 12.53% 12.32%
Equity - Infrastructure
ACA03 mFund AMP Capital Global Infrastructure Securities Unhedged 0.84% 3.367 0.018 -0.027 31,785 30,858 32 1.0463 1.72% 2.72% 13.31% 6.90% 14.73%
IWM02 mFund Alpha Infrastructure Fund 0.40% 0.027 0.001 0.000 - - - 1.4770 1.64% 1.89% 13.40% 8.33% 10.40%
RAI01 mFund RARE Infrastructure Value Fund - Hedged 1.02% 2.968 0.299 0.368 398,205 369,024 20 1.0703 -0.64% 0.82% 14.47% 7.31% 10.92%
RAI02 mFund RARE Infrastructure Value Fund - Unhedged 0.97% 5.073 0.540 0.617 624,693 483,258 34 1.2909 0.33% 3.32% 15.10% 9.05% 13.52%
RAI03 mFund RARE Infrastructure Income 1.02% 0.129 -0.003 0.002 2,140 1,595 3 1.3156 -1.79% -2.29% 12.12% 7.61% 11.94%
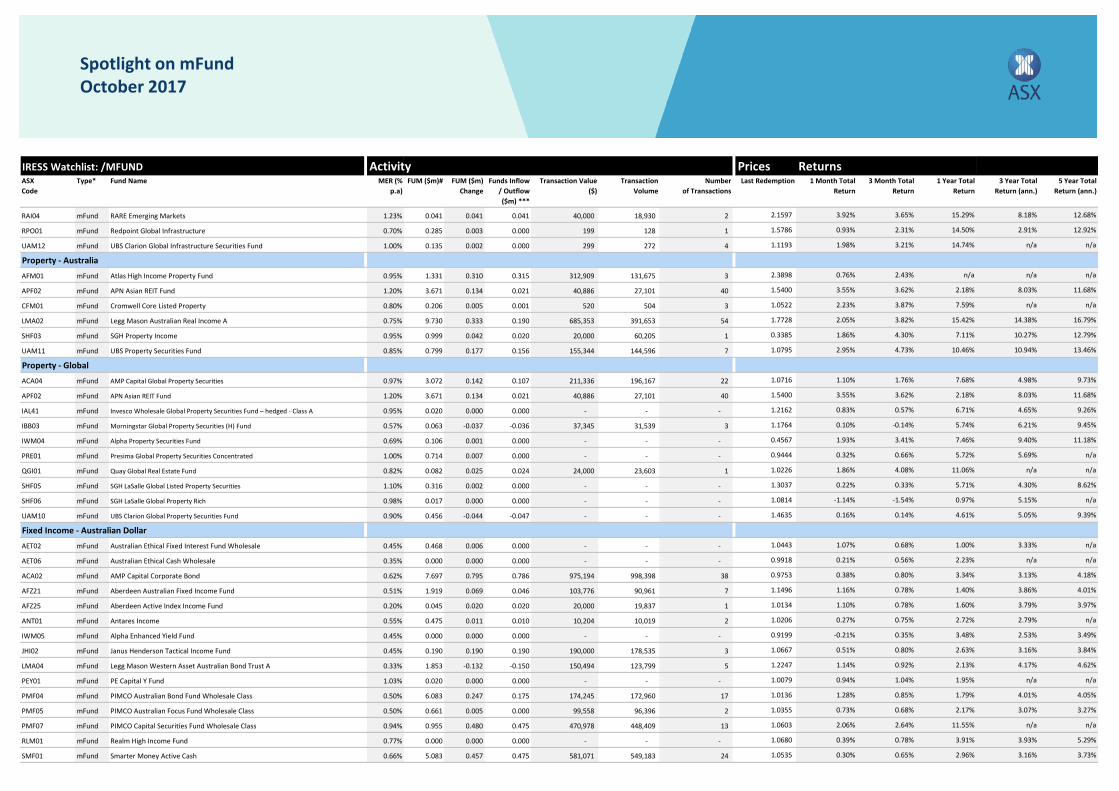
IRESS Watchlist: /MFUND Activity Prices ReturnsASX Code
Type* MER (% p.a)
FUM ($m)# FUM ($m) Change
Funds Inflow / Outflow ($m) ***
Transaction Value ($)
Transaction Volume
Number of Transactions
Last Redemption 1 Month Total Return
3 Month Total Return
1 Year Total Return
3 Year Total Return (ann.)
5 Year Total Return (ann.)
Fund Name
Spotlight on mFundOctober 2017
RAI04 mFund RARE Emerging Markets 1.23% 0.041 0.041 0.041 40,000 18,930 2 2.1597 3.92% 3.65% 15.29% 8.18% 12.68%
RPO01 mFund Redpoint Global Infrastructure 0.70% 0.285 0.003 0.000 199 128 1 1.5786 0.93% 2.31% 14.50% 2.91% 12.92%
UAM12 mFund UBS Clarion Global Infrastructure Securities Fund 1.00% 0.135 0.002 0.000 299 272 4 1.1193 1.98% 3.21% 14.74% n/a n/a
Property - Australia
AFM01 mFund 0.95% 1.331 0.310 0.315 312,909 131,675 3 2.3898 0.76% 2.43% n/a n/a n/a
APF02 mFund 1.20% 3.671 0.134 0.021 40,886 27,101 40 1.5400 3.55% 3.62% 2.18% 8.03% 11.68%
CFM01 mFund 0.80% 0.206 0.005 0.001 520 504 3 1.0522 2.23% 3.87% 7.59% n/a n/a
LMA02 mFund 0.75% 9.730 0.333 0.190 685,353 391,653 54 1.7728 2.05% 3.82% 15.42% 14.38% 16.79%
SHF03 mFund 0.95% 0.999 0.042 0.020 20,000 60,205 1 0.3385 1.86% 4.30% 7.11% 10.27% 12.79%
UAM11 mFund 0.85% 0.799 0.177 0.156 155,344 144,596 7 1.0795 2.95% 4.73% 10.46% 10.94% 13.46%
Property - Global
ACA04 mFund AMP Capital Global Property Securities 0.97% 3.072 0.142 0.107 211,336 196,167 22 1.0716 1.10% 1.76% 7.68% 4.98% 9.73%
APF02 mFund APN Asian REIT Fund 1.20% 3.671 0.134 0.021 40,886 27,101 40 1.5400 3.55% 3.62% 2.18% 8.03% 11.68%
IAL41 mFund Invesco Wholesale Global Property Securities Fund – hedged - Class A 0.95% 0.020 0.000 0.000 - - - 1.2162 0.83% 0.57% 6.71% 4.65% 9.26%
IBB03 mFund Morningstar Global Property Securities (H) Fund 0.57% 0.063 -0.037 -0.036 37,345 31,539 3 1.1764 0.10% -0.14% 5.74% 6.21% 9.45%
IWM04 mFund Alpha Property Securities Fund 0.69% 0.106 0.001 0.000 - - - 0.4567 1.93% 3.41% 7.46% 9.40% 11.18%
PRE01 mFund Presima Global Property Securities Concentrated 1.00% 0.714 0.007 0.000 - - - 0.9444 0.32% 0.66% 5.72% 5.69% n/a
QGI01 mFund Quay Global Real Estate Fund 0.82% 0.082 0.025 0.024 24,000 23,603 1 1.0226 1.86% 4.08% 11.06% n/a n/a
SHF05 mFund SGH LaSalle Global Listed Property Securities 1.10% 0.316 0.002 0.000 - - - 1.3037 0.22% 0.33% 5.71% 4.30% 8.62%
SHF06 mFund SGH LaSalle Global Property Rich 0.98% 0.017 0.000 0.000 - - - 1.0814 -1.14% -1.54% 0.97% 5.15% n/a
UAM10 mFund UBS Clarion Global Property Securities Fund 0.90% 0.456 -0.044 -0.047 - - - 1.4635 0.16% 0.14% 4.61% 5.05% 9.39%
Fixed Income - Australian Dollar
AET02 mFund Australian Ethical Fixed Interest Fund Wholesale 0.45% 0.468 0.006 0.000 - - - 1.0443 1.07% 0.68% 1.00% 3.33% n/a
AET06 mFund Australian Ethical Cash Wholesale 0.35% 0.000 0.000 0.000 - - - 0.9918 0.21% 0.56% 2.23% n/a n/a
ACA02 mFund AMP Capital Corporate Bond 0.62% 7.697 0.795 0.786 975,194 998,398 38 0.9753 0.38% 0.80% 3.34% 3.13% 4.18%
AFZ21 mFund Aberdeen Australian Fixed Income Fund 0.51% 1.919 0.069 0.046 103,776 90,961 7 1.1496 1.16% 0.78% 1.40% 3.86% 4.01%
AFZ25 mFund Aberdeen Active Index Income Fund 0.20% 0.045 0.020 0.020 20,000 19,837 1 1.0134 1.10% 0.78% 1.60% 3.79% 3.97%
ANT01 mFund Antares Income 0.55% 0.475 0.011 0.010 10,204 10,019 2 1.0206 0.27% 0.75% 2.72% 2.79% n/a
IWM05 mFund Alpha Enhanced Yield Fund 0.45% 0.000 0.000 0.000 - - - 0.9199 -0.21% 0.35% 3.48% 2.53% 3.49%
JHI02 mFund Janus Henderson Tactical Income Fund 0.45% 0.190 0.190 0.190 190,000 178,535 3 1.0667 0.51% 0.80% 2.63% 3.16% 3.84%
LMA04 mFund Legg Mason Western Asset Australian Bond Trust A 0.33% 1.853 -0.132 -0.150 150,494 123,799 5 1.2247 1.14% 0.92% 2.13% 4.17% 4.62%
PEY01 mFund PE Capital Y Fund 1.03% 0.020 0.000 0.000 - - - 1.0079 0.94% 1.04% 1.95% n/a n/a
PMF04 mFund PIMCO Australian Bond Fund Wholesale Class 0.50% 6.083 0.247 0.175 174,245 172,960 17 1.0136 1.28% 0.85% 1.79% 4.01% 4.05%
PMF05 mFund PIMCO Australian Focus Fund Wholesale Class 0.50% 0.661 0.005 0.000 99,558 96,396 2 1.0355 0.73% 0.68% 2.17% 3.07% 3.27%
PMF07 mFund PIMCO Capital Securities Fund Wholesale Class 0.94% 0.955 0.480 0.475 470,978 448,409 13 1.0603 2.06% 2.64% 11.55% n/a n/a
RLM01 mFund Realm High Income Fund 0.77% 0.000 0.000 0.000 - - - 1.0680 0.39% 0.78% 3.91% 3.93% 5.29%
SMF01 mFund Smarter Money Active Cash 0.66% 5.083 0.457 0.475 581,071 549,183 24 1.0535 0.30% 0.65% 2.96% 3.16% 3.73%
Cromwell Core Listed Property
SGH Property Income
UBS Property Securities Fund
Legg Mason Australian Real Income A
Atlas High Income Property Fund
APN Asian REIT Fund
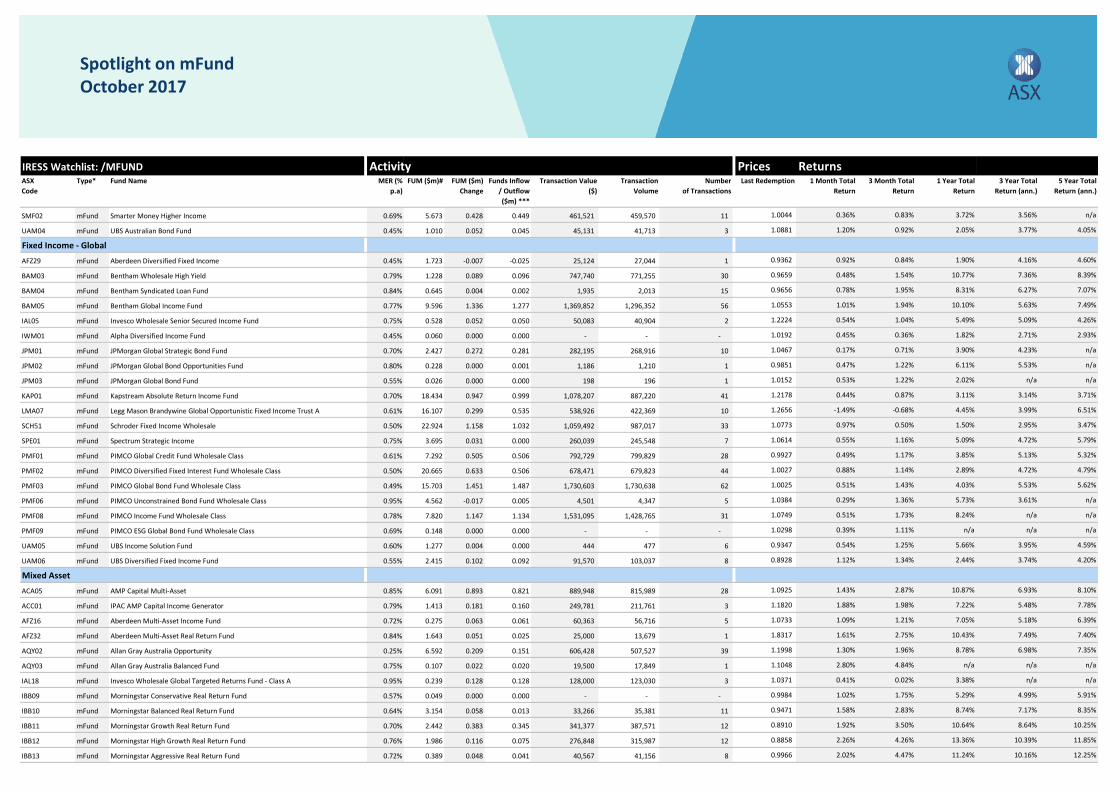
IRESS Watchlist: /MFUND Activity Prices ReturnsASX Code
Type* MER (% p.a)
FUM ($m)# FUM ($m) Change
Funds Inflow / Outflow ($m) ***
Transaction Value ($)
Transaction Volume
Number of Transactions
Last Redemption 1 Month Total Return
3 Month Total Return
1 Year Total Return
3 Year Total Return (ann.)
5 Year Total Return (ann.)
Fund Name
Spotlight on mFundOctober 2017
SMF02 mFund Smarter Money Higher Income 0.69% 5.673 0.428 0.449 461,521 459,570 11 1.0044 0.36% 0.83% 3.72% 3.56% n/a
UAM04 mFund UBS Australian Bond Fund 0.45% 1.010 0.052 0.045 45,131 41,713 3 1.0881 1.20% 0.92% 2.05% 3.77% 4.05%
Fixed Income - Global
AFZ29 mFund Aberdeen Diversified Fixed Income 0.45% 1.723 -0.007 -0.025 25,124 27,044 1 0.9362 0.92% 0.84% 1.90% 4.16% 4.60%
BAM03 mFund Bentham Wholesale High Yield 0.79% 1.228 0.089 0.096 747,740 771,255 30 0.9659 0.48% 1.54% 10.77% 7.36% 8.39%
BAM04 mFund Bentham Syndicated Loan Fund 0.84% 0.645 0.004 0.002 1,935 2,013 15 0.9656 0.78% 1.95% 8.31% 6.27% 7.07%
BAM05 mFund Bentham Global Income Fund 0.77% 9.596 1.336 1.277 1,369,852 1,296,352 56 1.0553 1.01% 1.94% 10.10% 5.63% 7.49%
IAL05 mFund Invesco Wholesale Senior Secured Income Fund 0.75% 0.528 0.052 0.050 50,083 40,904 2 1.2224 0.54% 1.04% 5.49% 5.09% 4.26%
IWM01 mFund Alpha Diversified Income Fund 0.45% 0.060 0.000 0.000 - - - 1.0192 0.45% 0.36% 1.82% 2.71% 2.93%
JPM01 mFund JPMorgan Global Strategic Bond Fund 0.70% 2.427 0.272 0.281 282,195 268,916 10 1.0467 0.17% 0.71% 3.90% 4.23% n/a
JPM02 mFund JPMorgan Global Bond Opportunities Fund 0.80% 0.228 0.000 0.001 1,186 1,210 1 0.9851 0.47% 1.22% 6.11% 5.53% n/a
JPM03 mFund JPMorgan Global Bond Fund 0.55% 0.026 0.000 0.000 198 196 1 1.0152 0.53% 1.22% 2.02% n/a n/a
KAP01 mFund Kapstream Absolute Return Income Fund 0.70% 18.434 0.947 0.999 1,078,207 887,220 41 1.2178 0.44% 0.87% 3.11% 3.14% 3.71%
LMA07 mFund Legg Mason Brandywine Global Opportunistic Fixed Income Trust A 0.61% 16.107 0.299 0.535 538,926 422,369 10 1.2656 -1.49% -0.68% 4.45% 3.99% 6.51%
SCH51 mFund Schroder Fixed Income Wholesale 0.50% 22.924 1.158 1.032 1,059,492 987,017 33 1.0773 0.97% 0.50% 1.50% 2.95% 3.47%
SPE01 mFund Spectrum Strategic Income 0.75% 3.695 0.031 0.000 260,039 245,548 7 1.0614 0.55% 1.16% 5.09% 4.72% 5.79%
PMF01 mFund PIMCO Global Credit Fund Wholesale Class 0.61% 7.292 0.505 0.506 792,729 799,829 28 0.9927 0.49% 1.17% 3.85% 5.13% 5.32%
PMF02 mFund PIMCO Diversified Fixed Interest Fund Wholesale Class 0.50% 20.665 0.633 0.506 678,471 679,823 44 1.0027 0.88% 1.14% 2.89% 4.72% 4.79%
PMF03 mFund PIMCO Global Bond Fund Wholesale Class 0.49% 15.703 1.451 1.487 1,730,603 1,730,638 62 1.0025 0.51% 1.43% 4.03% 5.53% 5.62%
PMF06 mFund PIMCO Unconstrained Bond Fund Wholesale Class 0.95% 4.562 -0.017 0.005 4,501 4,347 5 1.0384 0.29% 1.36% 5.73% 3.61% n/a
PMF08 mFund PIMCO Income Fund Wholesale Class 0.78% 7.820 1.147 1.134 1,531,095 1,428,765 31 1.0749 0.51% 1.73% 8.24% n/a n/a
PMF09 mFund PIMCO ESG Global Bond Fund Wholesale Class 0.69% 0.148 0.000 0.000 - - - 1.0298 0.39% 1.11% n/a n/a n/a
UAM05 mFund UBS Income Solution Fund 0.60% 1.277 0.004 0.000 444 477 6 0.9347 0.54% 1.25% 5.66% 3.95% 4.59%
UAM06 mFund UBS Diversified Fixed Income Fund 0.55% 2.415 0.102 0.092 91,570 103,037 8 0.8928 1.12% 1.34% 2.44% 3.74% 4.20%
Mixed Asset
ACA05 mFund 0.85% 6.091 0.893 0.821 889,948 815,989 28 1.0925 1.43% 2.87% 10.87% 6.93% 8.10%
ACC01 mFund 0.79% 1.413 0.181 0.160 249,781 211,761 3 1.1820 1.88% 1.98% 7.22% 5.48% 7.78%
AFZ16 mFund 0.72% 0.275 0.063 0.061 60,363 56,716 5 1.0733 1.09% 1.21% 7.05% 5.18% 6.39%
AFZ32 mFund 0.84% 1.643 0.051 0.025 25,000 13,679 1 1.8317 1.61% 2.75% 10.43% 7.49% 7.40%
AQY02 mFund 0.25% 6.592 0.209 0.151 606,428 507,527 39 1.1998 1.30% 1.96% 8.78% 6.98% 7.35%
AQY03 mFund 0.75% 0.107 0.022 0.020 19,500 17,849 1 1.1048 2.80% 4.84% n/a n/a n/a
IAL18 mFund 0.95% 0.239 0.128 0.128 128,000 123,030 3 1.0371 0.41% 0.02% 3.38% n/a n/a
IBB09 mFund 0.57% 0.049 0.000 0.000 - - - 0.9984 1.02% 1.75% 5.29% 4.99% 5.91%
IBB10 mFund 0.64% 3.154 0.058 0.013 33,266 35,381 11 0.9471 1.58% 2.83% 8.74% 7.17% 8.35%
IBB11 mFund 0.70% 2.442 0.383 0.345 341,377 387,571 12 0.8910 1.92% 3.50% 10.64% 8.64% 10.25%
IBB12 mFund 0.76% 1.986 0.116 0.075 276,848 315,987 12 0.8858 2.26% 4.26% 13.36% 10.39% 11.85%
IBB13 mFund 0.72% 0.389 0.048 0.041 40,567 41,156 8 0.9966 2.02% 4.47% 11.24% 10.16% 12.25%
Morningstar Balanced Real Return Fund
Allan Gray Australia Opportunity
Morningstar Aggressive Real Return Fund
Morningstar Conservative Real Return Fund
Morningstar High Growth Real Return Fund
Invesco Wholesale Global Targeted Returns Fund - Class A
Morningstar Growth Real Return Fund
Allan Gray Australia Balanced Fund
Aberdeen Multi-Asset Income Fund
Aberdeen Multi-Asset Real Return Fund
AMP Capital Multi-Asset
IPAC AMP Capital Income Generator
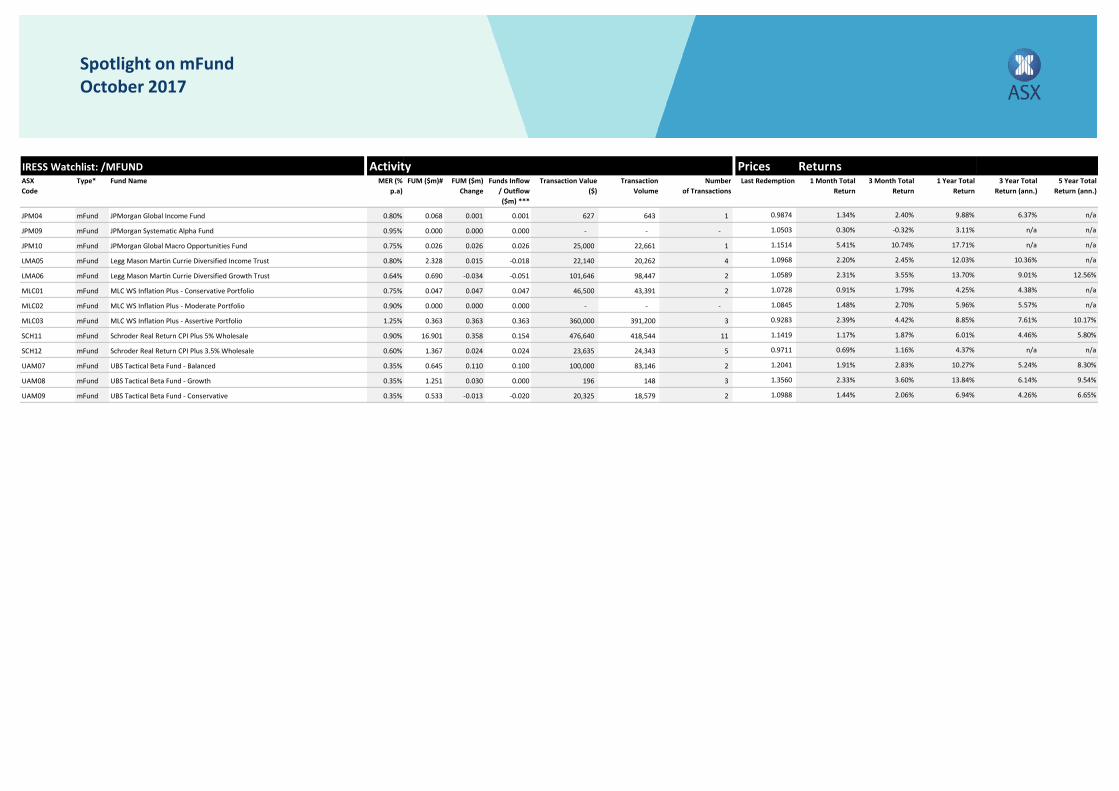
IRESS Watchlist: /MFUND Activity Prices ReturnsASX Code
Type* MER (% p.a)
FUM ($m)# FUM ($m) Change
Funds Inflow / Outflow ($m) ***
Transaction Value ($)
Transaction Volume
Number of Transactions
Last Redemption 1 Month Total Return
3 Month Total Return
1 Year Total Return
3 Year Total Return (ann.)
5 Year Total Return (ann.)
Fund Name
Spotlight on mFundOctober 2017
JPM04 mFund 0.80% 0.068 0.001 0.001 627 643 1 0.9874 1.34% 2.40% 9.88% 6.37% n/a
JPM09 mFund 0.95% 0.000 0.000 0.000 - - - 1.0503 0.30% -0.32% 3.11% n/a n/a
JPM10 mFund 0.75% 0.026 0.026 0.026 25,000 22,661 1 1.1514 5.41% 10.74% 17.71% n/a n/a
LMA05 mFund 0.80% 2.328 0.015 -0.018 22,140 20,262 4 1.0968 2.20% 2.45% 12.03% 10.36% n/a
LMA06 mFund 0.64% 0.690 -0.034 -0.051 101,646 98,447 2 1.0589 2.31% 3.55% 13.70% 9.01% 12.56%
MLC01 mFund 0.75% 0.047 0.047 0.047 46,500 43,391 2 1.0728 0.91% 1.79% 4.25% 4.38% n/a
MLC02 mFund 0.90% 0.000 0.000 0.000 - - - 1.0845 1.48% 2.70% 5.96% 5.57% n/a
MLC03 mFund 1.25% 0.363 0.363 0.363 360,000 391,200 3 0.9283 2.39% 4.42% 8.85% 7.61% 10.17%
SCH11 mFund 0.90% 16.901 0.358 0.154 476,640 418,544 11 1.1419 1.17% 1.87% 6.01% 4.46% 5.80%
SCH12 mFund 0.60% 1.367 0.024 0.024 23,635 24,343 5 0.9711 0.69% 1.16% 4.37% n/a n/a
UAM07 mFund 0.35% 0.645 0.110 0.100 100,000 83,146 2 1.2041 1.91% 2.83% 10.27% 5.24% 8.30%
UAM08 mFund 0.35% 1.251 0.030 0.000 196 148 3 1.3560 2.33% 3.60% 13.84% 6.14% 9.54%
UAM09 mFund 0.35% 0.533 -0.013 -0.020 20,325 18,579 2 1.0988 1.44% 2.06% 6.94% 4.26% 6.65%
Schroder Real Return CPI Plus 5% Wholesale
Legg Mason Martin Currie Diversified Growth Trust
JPMorgan Global Income Fund
JPMorgan Systematic Alpha Fund
JPMorgan Global Macro Opportunities Fund
MLC WS Inflation Plus - Conservative Portfolio
MLC WS Inflation Plus - Moderate Portfolio
MLC WS Inflation Plus - Assertive Portfolio
UBS Tactical Beta Fund - Conservative
UBS Tactical Beta Fund - Growth
UBS Tactical Beta Fund - Balanced
Schroder Real Return CPI Plus 3.5% Wholesale
Legg Mason Martin Currie Diversified Income Trust
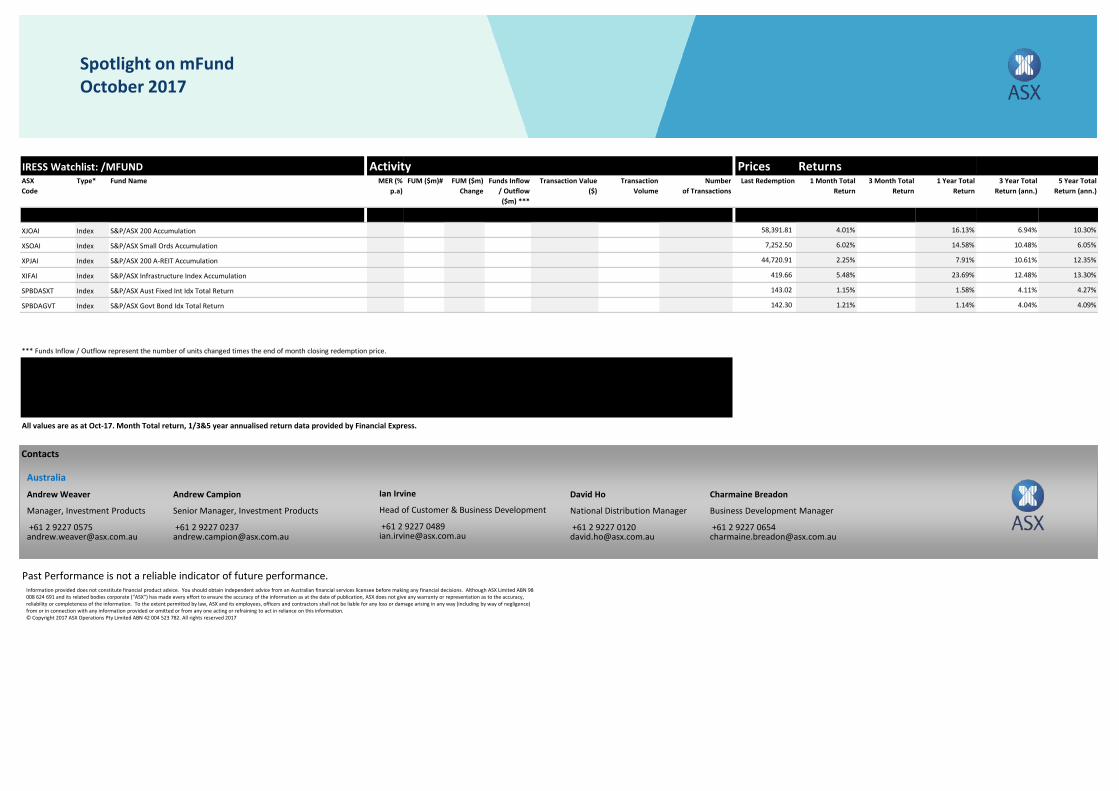
IRESS Watchlist: /MFUND Activity Prices ReturnsASX Code
Type* MER (% p.a)
FUM ($m)# FUM ($m) Change
Funds Inflow / Outflow ($m) ***
Transaction Value ($)
Transaction Volume
Number of Transactions
Last Redemption 1 Month Total Return
3 Month Total Return
1 Year Total Return
3 Year Total Return (ann.)
5 Year Total Return (ann.)
Fund Name
Spotlight on mFundOctober 2017
Australian Indices
XJOAI Index S&P/ASX 200 Accumulation 58,391.81 4.01% 16.13% 6.94% 10.30%
XSOAI Index S&P/ASX Small Ords Accumulation 7,252.50 6.02% 14.58% 10.48% 6.05%
XPJAI Index S&P/ASX 200 A-REIT Accumulation 44,720.91 2.25% 7.91% 10.61% 12.35%
XIFAI Index S&P/ASX Infrastructure Index Accumulation 419.66 5.48% 23.69% 12.48% 13.30%
SPBDASXT Index S&P/ASX Aust Fixed Int Idx Total Return 143.02 1.15% 1.58% 4.11% 4.27%
SPBDAGVT Index S&P/ASX Govt Bond Idx Total Return 142.30 1.21% 1.14% 4.04% 4.09%
*** Funds Inflow / Outflow represent the number of units changed times the end of month closing redemption price.
All values are as at Oct-17. Month Total return, 1/3&5 year annualised return data provided by Financial Express.
Past Performance is not a reliable indicator of future performance.
# The FUM for each mFund is based off the last reported number of units recorded in CHESS multiplied by the closing price on the last Transaction day of the month.MER (management expense ratio figures have been extracted form the relevant PDS or as updated by the issuer of the product. Under the Corporations Regulations, managment costs do not include transactional or operational costs or certain other fees and costs which may also apply. Such costs may be significant. When considering a product or comparing between products you should refer to the relevant PDS(s) for more information on any additional costs associated with each product.
Contacts
Ian Irvine
Head of Customer & Business Development
+61 2 9227 [email protected]
Andrew Weaver
Manager, Investment Products
+61 2 9227 [email protected]
Australia
David Ho
National Distribution Manager
+61 2 9227 [email protected]
Information provided does not constitute financial product advice. You should obtain independent advice from an Australian financial services licensee before making any financial decisions. Although ASX Limited ABN 98 008 624 691 and its related bodies corporate (“ASX”) has made every effort to ensure the accuracy of the information as at the date of publication, ASX does not give any warranty or representation as to the accuracy, reliability or completeness of the information. To the extent permitted by law, ASX and its employees, officers and contractors shall not be liable for any loss or damage arising in any way (including by way of negligence) from or in connection with any information provided or omitted or from any one acting or refraining to act in reliance on this information.© Copyright 2017 ASX Operations Pty Limited ABN 42 004 523 782. All rights reserved 2017
Andrew Campion
Senior Manager, Investment Products
+61 2 9227 [email protected]
Charmaine Breadon
Business Development Manager
+61 2 9227 [email protected]