Embed Size (px)
Citation preview
Incitec Pivot Limited ABN 42 004 080 264
Level 8, 28 Freshwater Place, Southbank, Victoria 3006, Australia
www.incitecpivot.com.au
ASX RELEASE
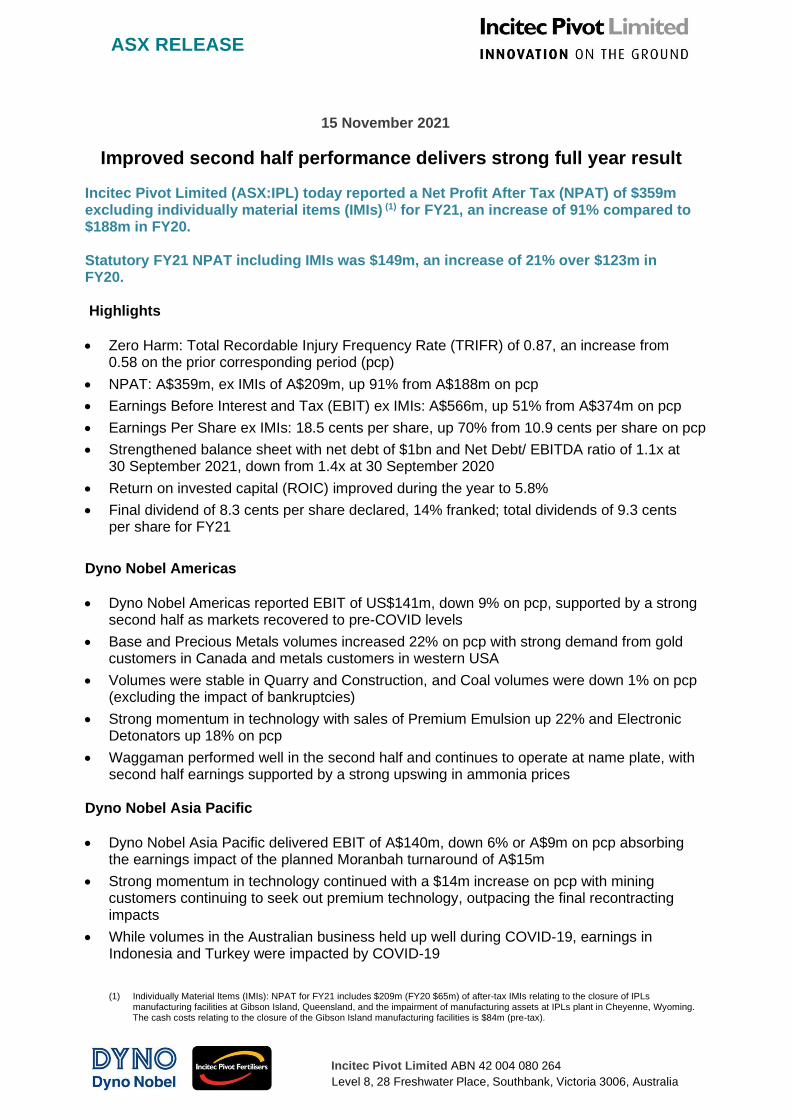
(1) Individually Material Items (IMIs): NPAT for FY21 includes $209m (FY20 $65m) of after-tax IMIs relating to the closure of IPLs manufacturing facilities at Gibson Island, Queensland, and the impairment of manufacturing assets at IPLs plant in Cheyenne, Wyoming. The cash costs relating to the closure of the Gibson Island manufacturing facilities is $84m (pre-tax).
15 November 2021
Improved second half performance delivers strong full year result
Incitec Pivot Limited (ASX:IPL) today reported a Net Profit After Tax (NPAT) of $359m excluding individually material items (IMIs) (1) for FY21, an increase of 91% compared to $188m in FY20. Statutory FY21 NPAT including IMIs was $149m, an increase of 21% over $123m in FY20. Highlights
• Zero Harm: Total Recordable Injury Frequency Rate (TRIFR) of 0.87, an increase from 0.58 on the prior corresponding period (pcp)
• NPAT: A$359m, ex IMIs of A$209m, up 91% from A$188m on pcp
• Earnings Before Interest and Tax (EBIT) ex IMIs: A$566m, up 51% from A$374m on pcp
• Earnings Per Share ex IMIs: 18.5 cents per share, up 70% from 10.9 cents per share on pcp
• Strengthened balance sheet with net debt of $1bn and Net Debt/ EBITDA ratio of 1.1x at 30 September 2021, down from 1.4x at 30 September 2020
• Return on invested capital (ROIC) improved during the year to 5.8%
• Final dividend of 8.3 cents per share declared, 14% franked; total dividends of 9.3 cents per share for FY21
Dyno Nobel Americas
• Dyno Nobel Americas reported EBIT of US$141m, down 9% on pcp, supported by a strong second half as markets recovered to pre-COVID levels
• Base and Precious Metals volumes increased 22% on pcp with strong demand from gold customers in Canada and metals customers in western USA
• Volumes were stable in Quarry and Construction, and Coal volumes were down 1% on pcp (excluding the impact of bankruptcies)
• Strong momentum in technology with sales of Premium Emulsion up 22% and Electronic Detonators up 18% on pcp
• Waggaman performed well in the second half and continues to operate at name plate, with second half earnings supported by a strong upswing in ammonia prices
Dyno Nobel Asia Pacific
• Dyno Nobel Asia Pacific delivered EBIT of A$140m, down 6% or A$9m on pcp absorbing the earnings impact of the planned Moranbah turnaround of A$15m
• Strong momentum in technology continued with a $14m increase on pcp with mining customers continuing to seek out premium technology, outpacing the final recontracting impacts
• While volumes in the Australian business held up well during COVID-19, earnings in Indonesia and Turkey were impacted by COVID-19

Incitec Pivot Limited ABN 42 004 080 264
Level 8, 28 Freshwater Place, Southbank, Victoria 3006, Australia
www.incitecpivot.com.au
ASX RELEASE
(2) This proprietary technology is held by DetNet South Africa (Proprietary) Limited, in which IPL holds a 50% interest.
Fertilisers Asia Pacific
• Fertilisers EBIT increased to A$268m, up 924% on pcp, with the benefit of the commodity price upswing in the second half of FY21
• Phosphate Hill manufacturing reliability and performance was strong at 958k mt of ammonium phosphates
• Due to not being able to secure affordable gas from 2023, the decision was made to cease manufacturing at Gibson Island at the end of 2022, and increase fertiliser import capacity to continue to support domestic customers
• The business continues to progress its soil health strategy, highlighted by the introduction of Precision Ag and an increase in Nutrient Advantage earnings
Incitec Pivot Limited Managing Director and CEO, Jeanne Johns commented on the Company’s performance: “The strong full year result reflects the strength of the second half, with strong pull through
from technology in explosives and a recovery in our end markets as well as our Fertilisers
business capturing the upswing in commodities prices.”
“Throughout the last 12 months our number one priority has been the safety of our people as we continued to face the challenges of COVID-19. Our strict protocols and resilient supply chains have enabled us to continue to safely operate and provide our resources and agricultural customers with the high-quality products, solutions and support they need for their businesses.
“Premium technology continues to increase productivity and safety and reduce environmental
footprint for our customers, which is underpinning strong demand. Our technology vision is
coming to life with our product development work now being commercialised. Our wireless
electronic detonator CyberDet ITM (2) has been successfully trialled at a number of customer
sites across Australia with further trials planned, and commercial supply arrangements
expected to commence in 2022.
“Our Fertilisers business has a high quality stable distribution business with good growth
potential as it evolves into a soil health company. During FY21, Precision Agriculture and
Nutrient Advantage increased their range of soil tests to meet a sophisticated agricultural
sector.
“Reluctantly, we announced last week the cessation of traditional manufacturing at our Gibson
Island after our current natural gas contract runs out at the end of 2022, after being unable to
secure an affordable long-term gas supply. Importantly, we have positioned Gibson Island for
a potential transition and commercial opportunity in green ammonia.
“We also saw a significant improvement in our manufacturing performance in the second half,
with our Waggaman plant performing well following the delayed restart in June. We expect the
benefits of our manufacturing reliability to come through following completion of the current
turnaround cycle in FY22.
“In addition to our longstanding commitment to sustainability, there was a step change in our
work on climate change during the year. We increased our commitment to decarbonisation
including setting out a potential Net Zero pathway by 2050 or earlier if practicable. We are

Incitec Pivot Limited ABN 42 004 080 264
Level 8, 28 Freshwater Place, Southbank, Victoria 3006, Australia
www.incitecpivot.com.au
ASX RELEASE
embedding climate change into our strategy to make sure we leverage commercial
opportunities as well as manage risks effectively.
“Our pathway to Net Zero requires investigation of new and emerging technologies and key to
this is leveraging our world leading ammonia manufacturing expertise. We have recently
formed two significant partnerships – with Fortescue Future Industries at Gibson island, and
two of Singapore’s leading companies Keppel Infrastructure and Temasek at Newcastle and
Gladstone. Both partnerships are investigating the commercial feasibility of manufacturing
green ammonia from renewable hydrogen.
“Looking ahead, as we enter FY22 we are well positioned to benefit from the continued execution of our strategy, as we invest in and grow our two strong base businesses in explosives and fertilisers and capture the strength in commodity pricing.”
* * *
IPL will host an investor webcast at 10.00am (AEDT) on 15 November 2021. The link to register for the investor webcast is: https://edge.media-server.com/mmc/p/j4h3gguz
For more information:
Investors Media
Geoff McMurray
General Manager Investor Relations
Tel: +61 3 8695 4553
Mobile: +61 418 312 773
.au
Matthew Flugge
Group Vice President Corporate Affairs
Tel: +61 3 8695 4617
Mobile: +61 409 705 176
This document has been authorised for release by Richa Puri, Company Secretary.

PROFIT REPORT 2021

Incitec Pivot Limited
ABN 42 004 080 264
Level 8, 28 Freshwater Place
Southbank, Victoria, Australia, 3006
Telephone: +61 3 8695 4400
Facsimile: +61 3 8695 4419
www.incitecpivot.com.au
2
Incitec Pivot Limited Profit Report 2021

Group Summary
Financial Performance
Income Statement
Balance Sheet
Cash Flow
Dyno Nobel Americas
Dyno Nobel Asia Pacific
Fertilisers Asia Pacific
Outlook and Sensitivities
Sustainability
Managing Climate Change
Definitions and Notes
Appendix
4
4
6
7
9
10
12
13
14
15
16
17
17
CONTENTS
3
Incitec Pivot Limited Profit Report 2021

PROFIT REPORTIncitec Pivot Limited (IPL) reported Net Profit After Tax (NPAT) excluding individually material items of $359m, an increase of 91% compared to $188m in the previous corresponding period (pcp). EBIT for the period (excluding individually material items) was $566m (pcp: $375m) with higher commodity prices, partially offset by a strengthening Australian dollar, having a net favourable earnings impact on EBIT of $350m.
Return on invested capital (ROIC) improved during the year to 5.8%, an improvement of 61% from the prior year. Free cashflow (1) for the year was $267m, an increase of $68m on FY20 free cashflow.
NPAT including IMIs was $149m for the 2021 financial year, an increase of 21% over the pcp.
GROUP SUMMARYYear ended 30 September
IPL GROUPFY21 A$m
FY20 A$m
Change A$m
Reported Revenue and Earnings
Revenue 4,348.5 3,942.2 406.3
EBITDA ex IMIs 934.9 730.5 204.4
EBIT ex IMIs 566.4 374.5 191.9
NPAT ex IMIs 358.6 188.2 170.4
IMIs after tax (209.5) (64.8) (144.7)
Group NPAT 149.1 123.4 25.7
Shareholder Returns
Cents Per Share
Earnings per share ex IMIs 18.5 10.9
Total Dividend 9.3 –
Credit Metrics 30-Sep-21 30-Sep-20
Net debt (2) (1,004.2) (1,028.7)
Net debt / EBITDA (ex IMIs) (3) 1.1x 1.4X
Interest Cover (4) 9.7x 6.1x
Net Profit After Tax (NPAT) excluding Individually Material Items (ex IMIs)
IPL reported NPAT ex IMIs of $359m, an increase of 91% compared to $188m in the pcp.
Individually Material Items (IMIs)
NPAT for FY21 includes $209m (FY20: $65m) of after-tax IMIs relating to the closure of IPLs manufacturing facilities at Gibson Island, Queensland, and the non-cash impairment of manufacturing assets at IPLs plant in Cheyenne, Wyoming. The cash costs of these items (pre-tax) are $84m.
Shareholder Returns and Dividends
Earnings per share (EPS) ex IMIs of 18.5 cents per share increased by 7.6 cents per share compared to FY20 EPS of 10.9 cents.
A final dividend of 8.3 cents per share 14% franked has been declared, representing a 50 percent payout ratio of NPAT ex IMIs.
Net Debt
Net debt decreased by $25m to $1,004m at 30 September 2021 (pcp: $1,029m) and Net Debt/EBITDA ex IMIs decreased to 1.1x (pcp: 1.4x). The Group’s investment grade credit ratings were maintained:
» S&P: BBB (stable outlook)
» Moody’s: Baa2 (stable outlook)
Zero Harm
IPL’s Company values are at the core of how it operates, with the health, safety and wellbeing of its people being the most important of its values. IPL’s Total Recordable Injury Frequency Rate (5) (TRIFR) for the rolling twelve-month period ended 30 September 2021 was 0.87, which is above IPLs target of 0.70, and an increase from 0.58 at 30 September 2020. The Company maintained its strong environmental safety record with zero Significant Environmental Incidents (6) during the year (pcp: 1). There were 38 Process Safety Incidents (7) recorded in FY21 (pcp:24). IPL recorded a small increase in Potential High Severity Incidents (8) with 36 (pcp: 34). IPL has refreshed its safety programs to drive improvement in FY22.
FINANCIAL PERFORMANCEYear ended 30 September
INCOME STATEMENTFY21 A$m
FY20 A$m
Change %
Revenue
Business Revenue
DNA 1,588.7 1,506.5 5%
DNAP 937.8 999.2 (6%)
Fertilisers APAC 1,894.6 1,502.0 26%
Eliminations (72.6) (65.5) (11%)
Group Revenue 4,348.5 3,942.2 10%
EBIT
Business EBIT ex IMIs
DNA 189.9 230.8 (18%)
DNAP 140.2 149.3 (6%)
Fertilisers APAC 268.4 26.2 924%
Eliminations (1.8) (0.1) nm*
Corporate (30.3) (31.7) 4%
Group EBIT ex IMIs 566.4 374.5 51%
EBIT margin 13.0% 9.5%
NPAT
Underlying interest expense (9) (107.4) (130.0) 17%
Non-cash unwinding liabilities (5.4) (5.7) 5%
Net borrowing costs (112.8) (135.7) 17%
Tax expense ex IMIs (95.0) (50.6) (88%)
NPAT excluding IMIs 358.6 188.2 91%
IMIs after tax (209.5) (64.8) (223%)
Group NPAT 149.1 123.4 21%
Financial Key Performance Indicators
ROIC 5.8% 3.6% 61%
Free Cashflow (1) 267 199 34%
* not meaningful
4
Incitec Pivot Limited Profit Report 2021
Note: Numbers in this report are subject to rounding. Definitions and Notes appear on page 17 of this report. All figures are in A$ and metric tonnes (mt) except where noted.

FY21 Business Review
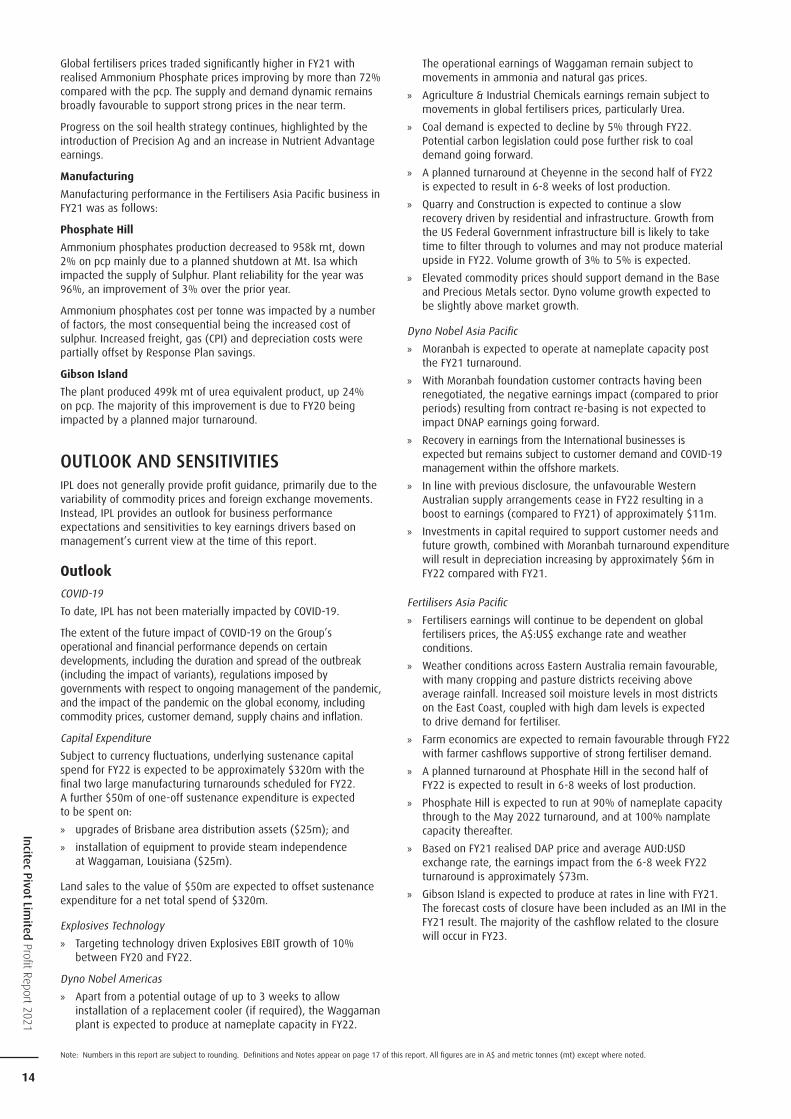
The Group reported FY21 Earnings Before Interest and Tax (EBIT) of $566m, an increase of $191m compared to pcp. Major movements for the year were as follows:
Manufacturing Performance: The $47m net decrease was primarily incurred due to unplanned outages in North America. FY21 production rates in Australia were largely in line with nameplate.
Hurricanes: Production at the Waggaman, LA, plant was impacted by two separate hurricanes. In order to protect staff and equipment, in anticipation of Hurricane Ida, the Waggaman plant was proactively brought down and secured. Despite Hurricane Ida being the second-most damaging and intense hurricane on record to make landfall in the U.S. State of Louisiana, the site suffered only minor physical damage. Once power was restored to the Waggaman site, the plant was quickly brought back to full production.
Manufacturing Plant Turnarounds: FY21 was a heavy period for turnarounds, with the impact of COVID-19 causing some activity to be deferred from FY20 into FY21. The 4 turnarounds undertaken during the year had a negative impact on earnings of $122m. The planned turnarounds were undertaken at Mt. Isa, Qld, St. Helens, OR, Waggaman, LA and Moranbah, Qld.
Americas Explosives: $20m net increase (excluding Response Plan benefits and the negative impact from manufacturing). Customer growth (principally in metals), COVID-19 demand recovery and increased earnings from technology was partially offset by a $7m earnings decline from soft US thermal coal demand.
Asia Pacific Explosives: $3m net decrease (excluding Response Plan savings and the impact of the Moranbah turnaround). Increased earnings from technology and premium product sales were offset by the impacts of contract re-basing (now complete), loss of a metals customer and lower international earnings (largely COVID-19 related).
Asia Pacific Fertilisers: $8m net decrease (excluding Response Plan savings and negative impacts related to planned turnarounds and a non-repeat insurance recovery received in FY20). A 2.7% increase in total fertiliser volumes sold was offset by costs related to an increased investment in distribution assets ($5m) and higher depreciation charges ($10m) as a result of the FY20 turnaround at Gibson Island.
Commodity Prices & Foreign Exchange: $350m net increase. The favourable impact of $446m from higher commodity prices was partially offset by a $96m negative impact from a higher average A$:US$ exchange rate.
Response Plan: $40m net benefit from sustainable cost savings (pcp: $20m). The full Response Plan target of $60m has been delivered 12 months early and is now complete.
375
(47)(32)
(122) (7)
20
(3) (8)
446
(96)
40 566
EBIT A$m
0
100
200
300
400
500
600
700Manufacturing Customer Facing Business Non-Controllables Other
CommoditiesFertilisersDNAPDNANon Repeat Ins.Recov. (FY20)
TurnaroundsHurricanesManufacturingPerformance
FY20Actual EBIT
FX ResponsePlan
FY21Actual EBIT
Increase Decrease Total
5
Incitec Pivot Limited Profit Report 2021
Note: Numbers in this report are subject to rounding. Definitions and Notes appear on page 17 of this report. All figures are in A$ and metric tonnes (mt) except where noted.

INCOME STATEMENT
RevenueGroup revenue of $4,349m for the year increased by $406m or 10% as compared to pcp.
EBITEBIT of $566m increased by $191m, or 51%, as compared to pcp. Major movements in EBIT are set out below:
MOVEMENT IN EBIT ITEMS A$m Business AmountManufacturing Outages
Planned Outages – Turnarounds DNA, DNAP & Fertilisers (122)
US Hurricanes DNA (32)
Manufacturing Performance DNA & Fertilisers (47)
Non-repeat Insurance Recovery Fertilisers (7)
Sub-total (208)
Customer & Markets
Contract Re-basing & W.A. supply DNAP (15)
Customer & Technology Growth DNA & DNAP 30
Markets (including COVID-19) DNA, DNAP & Fertilisers 9
Sub-total 24
Non-Controllables
Commodity Prices DNA & Fertilisers 446
Foreign Exchange – Transactional Fertilisers (75)
Foreign Exchange – Translational DNA (21)
Sub-total 350
Other
Response Plan DNA, DNAP & Fertilisers 40
Depreciation Fertilisers (10)
Distribution asset investment – Temporary Fertilisers (5)
Sub-total 25
Total movements in EBIT 191
InterestUnderlying interest expense (9) of $107m decreased $23m, or 17%, compared to pcp. The decrease was mainly due to lower debt following the $646m equity raising in 2020 having a favourable impact of $20m. This was partially offset by a $14m increase relating to the buyback of long-term bonds. A favourable movement in the A$:US$ exchange rate and lower interest rates compared to pcp benefited interest expense by approximately $8m and $9m respectively. Interest expense also includes Lease interest, Amortisation of line fees and Provision discount unwind expense.
TaxThe Group’s effective tax rate on operating profit of 21% is unchanged from the 21% reported in the pcp. Tax expense (excluding IMIs) of $95m was $44m higher than the pcp, consistent with higher earnings.
Individually Material ItemsNPAT includes the following items, classified as IMIs:
IMIsGross A$m
Tax A$m
Net A$m
Non-cash impairment of Cheyenne manufacturing assets 107.4 (28.0) 79.4
Gibson Island gas manufacturing plant closure
– Cash cost of closure 83.5 (25.1) 58.4
– Non-cash impairment of assets 102.5 (30.8) 71.7
Total 293.4 (83.9) 209.5
Year ended 30 September
INCOME STATEMENTFY21 A$m
FY20 A$m
Change %
Revenue
Business Revenue
DNA 1,588.7 1,506.5 5%
DNAP 937.8 999.2 (6%)
Fertilisers APAC 1,894.6 1,502.0 26%
Eliminations (72.6) (65.5) (11%)
Group Revenue 4,348.5 3,942.2 10%
EBIT
Business EBIT ex IMIs
DNA 189.9 230.8 (18%)
DNAP 140.2 149.3 (6%)
Fertilisers APAC 268.4 26.2 924%
Eliminations (1.8) (0.1) nm*
Corporate (30.3) (31.7) 4%
Group EBIT ex IMIs 566.4 374.5 51%
EBIT margin 13.0% 9.5%
NPAT
Underlying interest expense (9) (107.4) (130.0) 17%
Non-cash unwinding liabilities (5.4) (5.7) 5%
Net borrowing costs (112.8) (135.7) 17%
Tax expense ex IMIs (95.0) (50.6) (88%)
NPAT excluding IMIs 358.6 188.2 91%
IMIs after tax (209.5) (64.8) (223%)
Group NPAT 149.1 123.4 21%
Cheyenne ImpairmentThe further structural decline in thermal coal markets has been identified as an indicator of impairment that impacts DNA’s Cheyenne manufacturing plant, and specifically the nitric acid production utilisation rates. The future reconfiguration of the plant to reduce Nitric acid production capacity in line with lower market volumes, resulted in an impairment of $107.4m.
Gibson Island manufacturing plant closureDespite extensive efforts, IPL had been unable to secure an economically viable long-term gas supply for its Gibson Island plant beyond its current contract. As a result, IPL decided to cease manufacturing operations at the site at the end of the current gas supply arrangements, which expire in December 2022. The majority of the cash costs associated with the closure ($58m after tax) are expected to be incurred in FY23. IPL’s Brisbane fertiliser distribution capability will continue beyond the closure of the manufacturing operations.
NPATNPAT of $149m (including IMIs) increased by $26m, or 21%, compared to the pcp.
6
Incitec Pivot Limited Profit Report 2021
Note: Numbers in this report are subject to rounding. Definitions and Notes appear on page 17 of this report. All figures are in A$ and metric tonnes (mt) except where noted.

BALANCE SHEETMajor movements in the Group’s Balance Sheet during the year include:
Assets
» Trade Working Capital (TWC): Net increase of $106m. The movement was mainly due to the lower utilisation of trade working capital financing facilities of $80m and increases in the Australian dollar equivalent of US dollar denominated inventory. Underlying trade working capital (excluding the impact of financing facilities) as a percentage of sales decreased by 2% compared with the pcp, reflecting strong cash flow focus.
» Net Property, Plant & Equipment (PP&E): Decrease of $143m. Mainly driven by the depreciation charge for the year of $303m and impairment of assets of $213m. This is partially offset by accrual spend on sustenance and turnaround capital expenditure of $318m and minor growth capital expenditure of $52m.
» Intangible Assets: Decrease of $19m. Mainly driven by the amortisation charge for the year of $23m and the impact of foreign currency translation of non-A$ denominated assets of $8m. These movements were partially offset by additions (including goodwill) of $12m.
Liabilities
» Environmental & restructure liabilities: Increase of $81m. Largely due to Gibson Island manufacturing closure provisions.
» Net Other assets/(liabilities): Decrease of $257m. Mainly due to market value movements and maturities of derivative hedging instruments (excluding debt hedges) of $293m, partially offset by an increase in capital accruals of $21m.
» Net Debt: Decrease of $25m. Mainly due to strong cash generation driven by rising commodity prices offset by a reduction in the use of trade working capital financing facilities (-$80m), payments related to sustenance capital expenditure (-$304m) and a $274m decrease in balance sheet derivatives. Further details of movements in Net Debt are provided in the Cashflow section of this report.
Year ended 30 September
BALANCE SHEET A$m
30 Sep 2021
30 Sep 2020
Change A$m
Assets
TWC – Fertilisers APAC (120.6) (151.1) 30.5
TWC – Explosives 241.3 165.9 75.4
Group TWC 120.7 14.8 105.9
Net PP&E 3,928.9 4,071.7 (142.8)
Lease assets 214.5 221.1 (6.6)
Intangible assets 3,000.9 3,019.7 (18.8)
Total Assets 7,265.0 7,327.3 (62.3)
Liabilities
Environmental & restructure liabilities (242.7) (161.7) (81.0)
Tax liabilities (415.0) (437.0) 22.0
Lease liabilities (242.5) (247.7) 5.2
Net other asset/(liabilities) 8.0 (248.9) 256.9
Net debt (1,004.2) (1,028.7) 24.5
Total Liabilities (1,896.4) (2,124.0) 227.6
Net Assets 5,368.6 5,203.3 165.3
Equity 5,368.6 5,203.3 165.3
Key Performance Indicators
Net Tangible Assets per Share 1.22 1.12
Fertilisers APAC – Ave TWC % Rev (10) 15.3% 19.1%
Explosives – Ave TWC % Rev (10) 16.9% 17.2%
Group – Average TWC % Rev (10) 16.2% 18.1%
Credit Metrics
Net debt (1,004.2) (1,028.7)
Net debt / EBITDA (ex IMIs) 1.1x 1.4x
Interest Cover 9.7x 6.1x
NET DEBT A$m
Maturity Month/Year
Facility Amount
Drawn Amount
Undrawn Amount
Syndicated Term Loan 04/24 768.6 – 768.6
EMTN / Regulation S notes 02/26 100.2 100.2 –
Medium Term Notes 03/26 431.3 431.3 –
EMTN / Regulation S Notes 08/27 425.8 425.8 –
US Private Placement Notes 10/28 348.2 348.2 –
US Private Placement Notes 10/30 348.2 348.2 –
Total Debt 2,422.3 1,653.7 768.6
Fair value and other adjustments (4.4)
Loans to JVs, associates/other short term facilities 19.5
Cash and cash equivalents (651.8)
Fair value of hedges (12.8)
Net debt 1,004.2
Net debt/EBITDA 1.1x
The fair value of Net debt hedges at 30 September 2021 was an asset of $13m, a decrease of $274m compared to the balance at 30 September 2020 of $287m. The decrease was mainly due to the unwind of derivatives that hedged the foreign exchange rate exposure of the Group’s USD borrowings.
7
Incitec Pivot Limited Profit Report 2021
Note: Numbers in this report are subject to rounding. Definitions and Notes appear on page 17 of this report. All figures are in A$ and metric tonnes (mt) except where noted.

FINANCIAL INDEBTEDNESS
30 Sep 2021 A$m
30 Sep 2020 A$m
Change A$m
Net debt (excluding hedges) 1,017 1,316 (299)
Lease liabilities 243 248 (5)
Trade working capital financing facilities 332 412 (80)
Total Financial Indebtedness 1,592 1,976 (384)
Financial indebtedness reduced by $384m through the year. Net debt (excluding hedges) reduced by $299m mainly due to strong operating cashflows ($730m - excluding $80m of trade working capital facilities reduction) offset by sustenance capital expenditure ($304m) and growth capital expenditure ($51m). Reliance on trade working capital financing facilities has been reduced by over $300m since March 2020 to a sustainable level of $332m at year end.
Credit Metrics
Net Debt/EBITDA: The ratio of 1.1x improved by 0.3x compared with the pcp. The improvement is primarily a result of higher earnings in FY21 with EBITDA (ex IMIs) improving 28% over the pcp.
Interest Cover: Improved to 9.7x (pcp: 6.1x).
Credit Ratings: Investment Grade credit ratings remained unchanged:
» S&P: BBB (stable outlook)
» Moody’s: Baa2 (stable outlook)
Debt Facilities
IPL has sufficient liquidity and headroom with $769m of available undrawn committed debt facilities at 30 September 2021.
The average tenor of the Group’s debt facilities at 30 September 2021 is 5.1 years (September 2020: 5.1 years). No committed debt facilities are due to mature until April 2024.
In March 2021, IPL cancelled its US domiciled Syndicated Term facility (US$500m) and its Australian domiciled Syndicated Term facility (A$122m and US$109m). Both facilities were due to mature in October 2021. These cancelled facilities were replaced by a Syndicated Term facility domiciled in Australia and consisting of two tranches: Tranche A has a limit of A$490m and Tranche B has a limit of US$200m. The facility matures in April 2024.
In November 2020, following invitations to the holders of the Group’s outstanding notes under the EMTN and AMTN programmes to tender their notes, IPL repurchased US$94m of its US$400m Reg-S bond and A$19m of its A$450m AMTN bond.
Trade Working Capital Facilities
IPL uses TWC facilities to effectively manage the Group’s cash flows, which are impacted by seasonality, demand and supply variability.
The Group has a non-recourse receivable purchasing agreement to sell certain domestic and international receivables to an unrelated entity in exchange for cash. As at 30 September 2021, receivables totalling $124m (30 September 2020: $116m) had been sold under the receivable purchasing agreement.
IPL also offers suppliers the opportunity to use supply chain financing. The Group evaluates supplier arrangements against several indicators to assess whether to classify outstanding amounts as payables or borrowings. The balance of the supply chain finance program, classified as payables, at 30 September 2021 was $208m (30 September 2020: $296m).
Capital Allocation
IPL’s capital allocation process is centralised and overseen by the Group’s Corporate Finance function. Capital is invested on a prioritised basis and all submissions are assessed against risk factors including HSE, sustainability, operational, financial and other strategic risks. Capital is broadly categorised into major growth capital, minor growth capital and sustenance capital.
There were no major growth capital spend items in FY21. Minor growth spend of $51m in FY21 included plant efficiency projects and other projects supporting volume growth and technology investments.
Sustenance capital spend in FY21 of $304m was $86m higher than pcp, largely due to the heavy turnaround program in FY21 plus the additional costs previously disclosed related to the post turnaround issues at Waggaman, LA. Turnaround spend across the Group for FY21 was $150m. The remaining sustenance spend was made up of various sustenance projects with the vast majority of project values being less than $5m each.
The table below includes a summary of cash spend per business on growth and sustenance capital:
Year ended 30 September
IPL GROUPFY21 A$m
FY20 A$m
Change A$m
Capital Expenditure
DNA 24.6 18.6 6.0
DNAP 18.6 34.7 (16.1)
Fertilisers 8.0 6.9 1.1
Minor growth capital 51.2 60.2 (9.0)
DNA 165.5 50.8 114.7
DNAP 75.8 25.5 50.3
Fertilisers 62.5 141.9 (79.4)
Sustenance 303.8 218.2 85.6
Total 355.0 278.4 76.6
8
Incitec Pivot Limited Profit Report 2021
Note: Numbers in this report are subject to rounding. Definitions and Notes appear on page 17 of this report. All figures are in A$ and metric tonnes (mt) except where noted.

CASH FLOW
Year ended 30 September
CASH FLOWFY21 A$m
FY20 A$m
Change A$m
Operating Cash Flow
EBITDA ex IMIs 934.9 730.5 204.4
Net Interest paid (108.7) (135.5) 26.8
Net income tax paid (33.1) (13.7) (19.4)
TWC movement (excl FX movements) (126.1) (8.4) (117.7)
Profit from JVs and associates (41.9) (32.3) (9.6)
Dividends received from JVs 44.6 30.9 13.7
Environmental and site clean-up (4.8) (8.0) 3.2
Restructuring costs (19.1) (8.0) (11.1)
Other Non-TWC 4.4 (10.4) 14.8
Operating Cash Flow 650.2 545.1 105.1
Investing Cash Flow
Minor growth capital (51.2) (60.2) 9.0
Sustenance (303.8) (218.2) (85.6)
Payments – Central Petroleum Joint operation
(4.4) (9.8) 5.4
Proceeds from asset sales 5.7 7.4 (1.7)
Repayments from JV 19.9 – 19.9
Acquisition of subsidiaries & non-controlling interests
(8.5) (23.4) 14.9
Payments for settlement of derivatives (0.1) (75.2) 75.1
Investing Cash Flow (342.4) (379.4) 37.0
Financing Cash Flow
Dividends paid to members of IPL (19.4) (30.7) 11.3
Lease liability payments (41.4) (41.9) 0.5
Purchase of IPL shares for employees (1.0) (1.3) 0.3
Proceeds on issue of shares – 645.5 (645.5)
Realised market value gain on derivatives
8.5 10.3 (1.8)
Non-cash loss on translation of US$ Net Debt (225.9) (78.2) (147.7)
Non-cash movement in Net Debt (4.1) (6.7) 2.6
Financing Cash Flow (283.3) 497.0 (780.3)
Change to Net debt 24.5 662.7 (638.2)
Opening balance Net debt (1,028.7) (1,691.4) 662.7
Closing balance Net debt (1,004.2) (1,028.7) 24.5
Operating Cash Flow
Operating cash flows of $650m increased by $105m compared to the pcp. Significant movements included:
EBITDA: Increased by $204m driven by favourable realised commodity price movements ($446m) partially offset by unfavourable movements in the A$:US$ exchange rate ($96m). Reduced manufacturing volumes resulting from planned turnarounds ($122m), extreme weather events ($32m) and unplanned plant outages ($47m) negatively impacted earnings. Downstream business earnings (excluding manufacturing, Response Plan savings and non-controllables) remained relatively flat compared with the pcp. The Response Plan delivered an additional $40m of sustainable cost savings, $10m ahead of the FY21 target.
Net Interest Paid: Decreased by $27m, principally as a result of lower average drawn debt levels following the Group’s $646m equity raising in 2020, favourable foreign exchange movements and lower interest rates. This was partially offset by one-off interest payments relating to bond repurchases.
TWC Movement: $118m increase compared to the pcp largely as a result of lower usage of trade working capital financing facilities (down $80m on pcp).
Dividends received from JV’s: Increased by $14m as a result of timing of payments and increased profits from JVs.
Restructuring costs: Increased $11m due to payments against the Group’s Response Plan provisions raised in the FY20 financial year.
Other Non-TWC: Improved $15m compared to the pcp largely as a result of timing of payments and accruals.
Investing Cash Flow
Net investing cash outflows of $342m decreased $37m as compared to the pcp. Significant movements included:
Capital spend: Higher sustenance spend reflecting the heavy turnaround program in FY21 plus the additional costs previously disclosed related to the post turnaround issues at Waggaman, LA.
Loan repayment from JV: Cash inflow of $20m reflects the repayment of a loan provided to Queensland Nitrates Pty Ltd.
Financing Cash Flow
Net financing cash outflow of $283m was $780m unfavourable compared with the pcp. Significant movements included:
Proceeds on issue of shares: The $646m unfavourable movement reflects the FY20 equity issue. No new equity was issued in FY21.
Foreign Exchange on Net Debt: The year on year movement of $148m mainly reflects the net impact of the unwind of Net Debt hedges. The unwinding of the hedges was undertaken to simplify the balance sheet and align reported Net Debt with the Group’s cash position.
9
Incitec Pivot Limited Profit Report 2021
Note: Numbers in this report are subject to rounding. Definitions and Notes appear on page 17 of this report. All figures are in A$ and metric tonnes (mt) except where noted.

Year ended 30 September
Dyno Nobel AmericasFY21
US$mFY20
US$mChange
%
Explosives 883.3 768.4 15
Waggaman 175.9 124.5 41
Ag & IC 133.5 126.0 6
Total Revenue 1,192.7 1,018.9 17
Explosives 126.7 121.1 5
Waggaman 3.6 32.4 (89)
Ag & IC 10.9 1.3 738
EBIT 141.2 154.8 (9)
EBIT margin
Explosives 14.3% 15.8%
Waggaman 2.0% 26.0%
Ag & IC 8.2% 1.0%
A$m
Revenue 1,588.7 1,506.5 5
EBIT 189.9 230.8 (18)
Notes
Average realised A$/US$ exchange rate 0.74 0.67
Urea (FOB NOLA) Index Price (US$/mt) 364 247
Dyno Nobel Americas FY21 earnings of US$141m decreased US$14m or 9% compared to the pcp. Outlined below are the major earnings movements during the year for each business.
Explosives
Business PerformanceExplosives earnings for FY21 of US$127m was US$6m higher than the pcp. principally due to the following:
EBIT Margins: The pass through of higher US gas prices on sales of bulk ammonium nitrate has a negative impact on explosives EBIT margins. After adjusting for the impact of manufacturing outages and gas pass throughs, EBIT margins were 16%.
Customer Growth: $11m growth in volumes, primarily driven by customer growth in Canada (Gold) and metals mining in western USA. Chile continues to see incremental volume increases through successful trials of premium products. Quarry & Construction volumes in the second half recovered from a slow first half to leave the full year just 1% down on the pcp.
COVID-19 Recoveries: US$10m from increased international and domestic sales of initiating systems as a result of general recoveries from the COVID-19 lows of FY20.
Coal Volumes: US$7m decline (unchanged from the first half). As forecast at the half year, coal volumes in the second half improved and were 2% above the pcp. This was a significant improvement on the first half where the business was impacted by bankruptcies in this sector.
Response Plan: US$4m benefit from sustainable operational productivity measures, including cost efficiency gains.
Manufacturing: The negative earnings impact of US$12m reflects the previously announced outages at the Cheyenne, WY. and Louisiana, MO plants. These plants recovered well and performed to plan in the second half.
Market SummaryQuarry & Construction
43% of Explosives revenue was generated from the Quarry & Construction sector in FY21 (43% pcp). After a slow, weather impacted first half, where volumes were down 5% on the pcp., volumes recovered through the second half to finish down just 1% on a full year basis.
Base & Precious Metals
39% of Explosives revenue was generated from the Base & Precious Metals sector in FY21 (35% pcp). Volumes grew by 22% during the year with revenues growing 27% compared to the pcp. The primary drivers of these increases were gold volumes in Canada and sales into the metals markets in western regions of the US. Product trials in Chile continue to be successful with volumes increasing over the pcp.
Coal
18% of Explosives revenue was generated from the Coal sector in FY21 (22% pcp). Volumes were down 12% versus the pcp. with customer closures in the Illinois coal basin adversely impacting DNA volumes compared to the overall market, which was flat year on year. Excluding the impact of the bankruptcies, DNA volumes into the coal sector were down 1% on the pcp.
COVIDRecovery
155
EBIT US$m
(21)
(77)
70
(12)(7)
10
114
(11)
20 141
FY20EBIT
Hurricanes Manufacturing/Turnarounds
Commodities Manufacturing/Turnarounds
Coal CustomerGrowth
ResponsePlan
Manufacturing/Turnarounds
Commodities FY21EBIT
0
20
40
60
80
100
120
140
160
180
Increase Decrease Total
Waggaman Explosives AG & IC
DYNO NOBEL AMERICAS
10
Incitec Pivot Limited Profit Report 2021
Note: Numbers in this report are subject to rounding. Definitions and Notes appear on page 17 of this report. All figures are in A$ and metric tonnes (mt) except where noted.

Agriculture & Industrial Chemicals (Ag & IC)Year ended 30 September
AG & ICFY21
US$mFY20
US$mChange
%
US$m
Total Revenue 133.5 126.0 6
EBIT 10.9 1.3 738
EBIT margin 8.2% 1.0%
Business PerformanceAg & IC FY21 earnings of US$11m was US$10m more than the pcp., due to the following:
Manufacturing/Turnaround: Earnings were negatively impacted by US$11m in FY21 because of the planned outage at the St. Helens, OR plant (US$5m), minor production issues (US$2m) and additional depreciation (US$3m).
Commodity Prices: Favourable Urea and UAN pricing improved earnings by US$20m versus the pcp.
Waggaman OperationsYear ended 30 September
WAGGAMAN FY21 FY20Change
%
Thousand metric tonne
Ammonia manufactured at Waggaman 437.2 729.0 (40)
Ammonia sold 563.5 730.0 (23)
US$m
External Revenue 175.9 124.5 41
Internal Revenue 39.0 40.0 (3)
Total Revenue 214.9 164.5 31
EBIT 3.6 32.4 (89)
EBIT margin 2.0% 26.0%
Notes
Ammonia Realised Price (US$/mt) (11) 381 225
Realised Gas Cost (US$/mmbtu) (delivered)
3.33 2.15
Ammonia Tampa Index Price (US$/mt) (11) 401 237
Index Gas Cost (US$/mmbtu) (12) 3.05 2.03
Gas efficiency (mmbtu/mt) 40 35
Business PerformanceWaggaman earnings of US$4m, decreased US$29m compared to the pcp due to the following:
Turnaround – Planned: As previously disclosed, the FY21 turnaround negatively impacted earnings by US$58m.
Adverse Weather: As previously announced, the Waggaman site was proactively shut ahead of Hurricane Ida in order to protect site personnel and the plant. Despite the intensity of the storm, the site only suffered minor physical damage. Once power was restored, the plant was brought back to full production as per plan. The negative earnings impact of this outage, and a minor hurricane related outage from earlier in the year, was US$21m.
Manufacturing Reliability: In total, the Waggaman plant produced 437k metric tonnes of Ammonia which was 40% lower than the pcp. Sales of Ammonia reduced by 23% compared to the pcp, with shortfalls in produced ammonia being replaced by third party supplies. Gas efficiency was adversely impacted by the plant outages, with gas usage per metric tonne of ammonia produced averaging 40 mmbtu/mt (35 pcp).
Pre-turnaround, the plant had interruptions to production that resulted in 4 weeks of total downtime, the most consequential of which was caused by the failure of the regional power grid in the New Orleans area from Hurricane Zeta.
As previously disclosed, the plant went through its first major turnaround during FY21. The plant entered the planned turnaround with several known maintenance issues, all of which were addressed as part of the turnaround activities. During the discovery phase and subsequent re-start process, a number of unexpected issues emerged including issues with the ammonia cooler, dry gas seals and the induced draft fan. These issues caused a further 6.5-week delay to full production.
While the ammonia cooler (heat exchanger) was repaired during the turnaround, the initial fabrication issues prevented a permanent repair, requiring a replacement of the cooler in the next 6-18 months. An outage of up to 3 weeks is expected during FY22 or FY23 to allow installation. To date, the cooler has performed well with no signs of accelerated deterioration.
The plant operated at nameplate production until it was deliberately brought down to protect the site personnel and the plant ahead of Hurricane Ida. Once power was restored to the site, the plant was re-started and brought back to full production as per plan. The disclosed estimate of a 4 week outage from Hurricane Ida was shortened by 4 days due to a flawless re-start.
Post turnaround, and post the outage for Hurricane Ida, the plant has been operating reliably and in line with nameplate capacity. Gas efficiency has improved to efficiency levels previously achieved.
Excluding the impact of the planned turnaround and adverse weather events, the additional outages referenced above had a negative earnings impact of US$19m.
Ammonia Price: A strong upswing in ammonia prices in the second half favourably impacted full year earnings by US$70m.
Discount to Tampa Ammonia price: The average discount to the Tampa benchmark, allowing for the one-month lag embedded in sales contracts, was approximately 5% in FY21. The FY21 average discount has been impacted by timing differences in the lost production and the rapid increase of the ammonia price, particularly in the second half of the financial year. “through the cycle” pricing for internal sales to the DNA Explosives business impacts the calculated average discount to the benchmark, particularly when ammonia prices are elevated.
Approximately 20% of nameplate production is sold to the DNA Explosives business at prices that are not linked to movements in the Tampa benchmark. The remaining sales are priced at the Tampa benchmark price, less a discount that ranges between 6% and 8%, with the higher end of the range applying to prices above US$500/t.
Other Manufacturing
Manufacturing performance in the Explosives and Ag & IC businesses during FY21 was as follows:
Cheyenne, Wyoming: Cheyenne ammonia operations were impacted by an unplanned outage caused by a bearing failure on the reciprocal compressor. As a result, ammonia production was down 5% compared to pcp. Nitric Acid production increased by 4% compared to pcp.
Louisiana, Missouri: Louisiana operations were impacted by an unplanned outage caused by blade failure on the axial compressor. As a result, Nitric Acid production decreased by 14% compared with pcp.
St Helens, Oregon: Urea and ammonia production from the St Helens plant decreased 19% and 16% respectively, compared to the pcp., mainly due to the planned turnaround.
11
Incitec Pivot Limited Profit Report 2021
Note: Numbers in this report are subject to rounding. Definitions and Notes appear on page 17 of this report. All figures are in A$ and metric tonnes (mt) except where noted.

Year ended 30 September
DYNO NOBEL ASIA PACIFIC FY21 FY20Change
%
Thousand metric tonne
Ammonium Nitrate – manufactured at Moranbah 346.5 371.3 (7)
Ammonium Nitrate sold 683.7 762.6 (10)
A$m
Australian Coal 471.6 472.4 (0)
Base & Precious Metals 377.3 415.5 (9)
International 88.9 111.3 (20)
Total Revenue 937.8 999.2 (6)
EBIT 140.2 149.3 (6)
EBIT margin 15.0% 14.9%
Business PerformanceDyno Nobel Asia Pacific FY21 earnings of $140m, decreased $9m compared to the pcp. due to the following:
Technology: $14m increase on the pcp, in line with guidance provided in FY20, technology growth has more than offset recontracting impacts.
Contract Renewals: $12m net decrease, driven by the loss of a metals customer and lower ammonium nitrate pricing on contract renewals in Australia, offset in part by new metals business.
Turnaround: As per previous guidance, the impact of the Moranbah turnaround was $15m.
Response Plan: $9m increase, driven by sustainable cost savings, mainly across the Commercial business and the Moranbah plant.
W.A. Contracts: $3m decrease, final impact from contracts lost in FY18 in Western Australia, in line with previous guidance.
International: $2m net decrease. The Indonesian business was impacted by lower demand which was mainly a result of COVID-19. The Turkish business was impacted by a slowdown in construction activity and a weaker Turkish Lira.
Market SummaryAustralian Metallurgical Coal
50% of Dyno Nobel Asia Pacific revenue for the year was generated from the Australian Metallurgical Coal sector, most of which was from supply to mines in the Bowen Basin.
Volumes from the Metallurgical Coal sector were flat year on year as miners successfully diversified their customer base (primarily to India) in response to bans imposed by China on imports of Australian coal from November 2020.
Base & Precious Metals
40% of Dyno Nobel Asia Pacific revenue was generated from the Base & Precious Metals sector, which comprises iron ore mines in Western Australia and hard rock and underground mines throughout Australia.
Volumes from the sector decreased 13% compared to pcp, mainly due to the previously disclosed loss of a metals customer.
International
10% of Dyno Nobel Asia Pacific revenue was generated internationally in Indonesia, Turkey and Papua New Guinea.
Volumes decreased by 30% compared to the pcp. Volumes in the Indonesian business were significantly impacted due to mining activity being disrupted by COVID-19. Volumes in the Turkish business (Nitromak) have been impacted by reduced construction.
ManufacturingAllowing for the impact of the planned turnaround, Moranbah performed well producing 347k mt of ammonium nitrate during the year. Although the plant was in the last phase of its operating cycle, the plant produced at nameplate (excluding the outage for the turnaround).
149
(3)
(12)
14
(15)
(2)
9 140
FY20Actual EBIT
W.A. Contracts(Previously Disclosed)
ContractRenewals
Technology Turnaround International ResponsePlan
FY21Actual EBIT
120
125
130
135
140
145
150
Increase Decrease Total
EBIT A$m
DYNO NOBEL ASIA PACIFIC
12
Incitec Pivot Limited Profit Report 2021
Note: Numbers in this report are subject to rounding. Definitions and Notes appear on page 17 of this report. All figures are in A$ and metric tonnes (mt) except where noted.

26
74
(5)
3
(7)
(7)
21
(10)
312
(75)
268
0
25
50
400
FY19 Qld Rail Outage – Insurance
Recovery in FY20
Volumes & Margins
ResponsePlan
PDC Upgrades
TurnaroundsManufacturing Reliability
ResponsePlan
Depreciation Commodities ForeignExchange
FY21Actual EBIT
FY20Actual EBIT
Increase Decrease Total
Manufacturing Non-Controllables
EBIT A$m
Distribution
Year ended 30 September
FERTILISERS ASIA PACIFIC FY21 FY20Change
%
Thousand metric tonne
Phosphate Hill production (ammonium phosphates) 958.4 979.3 (2)
Gibson Island production (urea equivalent) 498.5 400.5 24
A$m
Manufacturing 836.4 554.4 53
Distribution 1,058.2 947.6 11
Fertilisers APAC Revenue 1,894.6 1,502.0 26
Manufacturing 208.8 (28.4) nm*
Distribution 59.6 54.6 9
Fertilisers APAC EBIT 268.4 26.2 924
EBIT margin 14.2% 1.7%
EBIT margin
Manufacturing 25.0% (5.2%)
Distribution 5.6% 5.7%
Notes
Fertilisers APAC
Realised A$/US$ Exchange Rate 0.76 0.68
Total Fertilisers APAC volumes sold (k mt) 3,220.1 3,135.9
Domestic Fertilisers APAC volumes sold (k mt)
2,234.7 2,212.2
Phosphate Hill
Realised AP Price (US$/mt) 524 304
Phosphate Hill production sold (k mt) 949 982.7
Realised AP Freight Margin (US$/mt) 4.8 4.3
Realised Cost per Tonne of AP (A$/mt) 468 438
Realised Cost per Tonne of AP (A$/mt)** 484 454
Gibson Island
Realised Urea Price (US$/mt) 373 242
Gibson Island production sold subject to urea price movement (k mt)
364 280
* Not meaningful** Weighted average of AP including port costs
Business PerformanceFertilisers Asia Pacific earnings of $268m was $242m higher than the pcp. Major movements for the year were due to the following:
Volumes and Margins: Increased distribution volumes more than offset a slight decline in EBIT margins for a net improvement of $7m for the year.
PDC Upgrades: Upgrades to primary distribution centres, primarily at Gibson Island, resulted in increased costs ($5m) being incurred for the sourcing of alternative storage facilities and associated logistics costs.
Manufacturing Reliability: $3m net increase at last years pricing, largely due to higher production volume at Phosphate Hill (excluding planned Ammonia shutdown).
Planned Plant Shutdowns: $7m decrease. A planned shutdown of Ammonia production at Phosphate Hill (aligned with Mt. Isa’s Sulphuric Acid plant shut, which coincided with Glencore’s copper smelter shut) negatively impacted earnings by $13m compared to the pcp. This was partially offset (+$5m) by higher production of Urea at the Gibson Island plant compared to FY20 which was impacted by a turnaround in that period.
1H19 Queensland Rail Outage – Insurance recovery: The FY20 result included a non-recurring insurance receipt of $7m in relation to losses incurred from the 2019 Queensland rail outage.
Depreciation: The FY20 turnaround at Gibson Island and the FY21 turnaround at Mt. Isa resulted in higher depreciation charges of approximately $10m.
Response Plan: Savings of $25m predominantly from sustainable reductions in operational expenses at Phosphate Hill and Gibson Island.
Foreign Exchange and Commodity Prices: $237m net increase, due to higher global fertiliser prices improving the result by $312m (after allowing for a negative $5m impact from tiered gas pricing at Gibson Island), partially offset by unfavourable movements in the A$:US$ exchange rate impacting the result by $75m.
Market SummaryTotal Fertilisers Asia Pacific sales volumes of 3,220k metric tonnes was 3% higher than FY20 sales of 3,136k metric tonnes. Agronomic conditions have been generally favourable with La Nina rain events increasing soil moisture and water storage levels, producing the highest sales volume since 2005.
The favourable water levels supported good sales of liquid fertilisers which were up 30% year on year.
FERTILISERS ASIA PACIFIC
13
Incitec Pivot Limited Profit Report 2021
Note: Numbers in this report are subject to rounding. Definitions and Notes appear on page 17 of this report. All figures are in A$ and metric tonnes (mt) except where noted.
Global fertilisers prices traded significantly higher in FY21 with realised Ammonium Phosphate prices improving by more than 72% compared with the pcp. The supply and demand dynamic remains broadly favourable to support strong prices in the near term.
Progress on the soil health strategy continues, highlighted by the introduction of Precision Ag and an increase in Nutrient Advantage earnings.
Manufacturing
Manufacturing performance in the Fertilisers Asia Pacific business in FY21 was as follows:
Phosphate Hill
Ammonium phosphates production decreased to 958k mt, down 2% on pcp mainly due to a planned shutdown at Mt. Isa which impacted the supply of Sulphur. Plant reliability for the year was 96%, an improvement of 3% over the prior year.
Ammonium phosphates cost per tonne was impacted by a number of factors, the most consequential being the increased cost of sulphur. Increased freight, gas (CPI) and depreciation costs were partially offset by Response Plan savings.
Gibson Island
The plant produced 499k mt of urea equivalent product, up 24% on pcp. The majority of this improvement is due to FY20 being impacted by a planned major turnaround.
OUTLOOK AND SENSITIVITIESIPL does not generally provide profit guidance, primarily due to the variability of commodity prices and foreign exchange movements. Instead, IPL provides an outlook for business performance expectations and sensitivities to key earnings drivers based on management’s current view at the time of this report.
Outlook
COVID-19
To date, IPL has not been materially impacted by COVID-19.
The extent of the future impact of COVID-19 on the Group’s operational and financial performance depends on certain developments, including the duration and spread of the outbreak (including the impact of variants), regulations imposed by governments with respect to ongoing management of the pandemic, and the impact of the pandemic on the global economy, including commodity prices, customer demand, supply chains and inflation.
Capital Expenditure
Subject to currency fluctuations, underlying sustenance capital spend for FY22 is expected to be approximately $320m with the final two large manufacturing turnarounds scheduled for FY22. A further $50m of one-off sustenance expenditure is expected to be spent on:
» upgrades of Brisbane area distribution assets ($25m); and
» installation of equipment to provide steam independence at Waggaman, Louisiana ($25m).
Land sales to the value of $50m are expected to offset sustenance expenditure for a net total spend of $320m.
Explosives Technology
» Targeting technology driven Explosives EBIT growth of 10% between FY20 and FY22.
Dyno Nobel Americas
» Apart from a potential outage of up to 3 weeks to allow installation of a replacement cooler (if required), the Waggaman plant is expected to produce at nameplate capacity in FY22.
The operational earnings of Waggaman remain subject to movements in ammonia and natural gas prices.
» Agriculture & Industrial Chemicals earnings remain subject to movements in global fertilisers prices, particularly Urea.
» Coal demand is expected to decline by 5% through FY22. Potential carbon legislation could pose further risk to coal demand going forward.
» A planned turnaround at Cheyenne in the second half of FY22 is expected to result in 6-8 weeks of lost production.
» Quarry and Construction is expected to continue a slow recovery driven by residential and infrastructure. Growth from the US Federal Government infrastructure bill is likely to take time to filter through to volumes and may not produce material upside in FY22. Volume growth of 3% to 5% is expected.
» Elevated commodity prices should support demand in the Base and Precious Metals sector. Dyno volume growth expected to be slightly above market growth.
Dyno Nobel Asia Pacific
» Moranbah is expected to operate at nameplate capacity post the FY21 turnaround.
» With Moranbah foundation customer contracts having been renegotiated, the negative earnings impact (compared to prior periods) resulting from contract re-basing is not expected to impact DNAP earnings going forward.
» Recovery in earnings from the International businesses is expected but remains subject to customer demand and COVID-19 management within the offshore markets.
» In line with previous disclosure, the unfavourable Western Australian supply arrangements cease in FY22 resulting in a boost to earnings (compared to FY21) of approximately $11m.
» Investments in capital required to support customer needs and future growth, combined with Moranbah turnaround expenditure will result in depreciation increasing by approximately $6m in FY22 compared with FY21.
Fertilisers Asia Pacific
» Fertilisers earnings will continue to be dependent on global fertilisers prices, the A$:US$ exchange rate and weather conditions.
» Weather conditions across Eastern Australia remain favourable, with many cropping and pasture districts receiving above average rainfall. Increased soil moisture levels in most districts on the East Coast, coupled with high dam levels is expected to drive demand for fertiliser.
» Farm economics are expected to remain favourable through FY22 with farmer cashflows supportive of strong fertiliser demand.
» A planned turnaround at Phosphate Hill in the second half of FY22 is expected to result in 6-8 weeks of lost production.
» Phosphate Hill is expected to run at 90% of nameplate capacity through to the May 2022 turnaround, and at 100% namplate capacity thereafter.
» Based on FY21 realised DAP price and average AUD:USD exchange rate, the earnings impact from the 6-8 week FY22 turnaround is approximately $73m.
» Gibson Island is expected to produce at rates in line with FY21. The forecast costs of closure have been included as an IMI in the FY21 result. The majority of the cashflow related to the closure will occur in FY23.
14
Incitec Pivot Limited Profit Report 2021
Note: Numbers in this report are subject to rounding. Definitions and Notes appear on page 17 of this report. All figures are in A$ and metric tonnes (mt) except where noted.

Group
Corporate: Corporate costs are expected to be approximately $37m in FY22, which includes investments in Energy Transition ($2m), International business development ($3m) and HR Organisational Development and Diversity.
Borrowing Costs: Net borrowing costs for FY22 are expected to be approximately $104m, due to the impact of lower average borrowings.
Taxation: IPL’s effective tax rate for FY22 is expected to be between 23% and 25%.
Hedging Program: 67% of estimated FY22 US$ linked fertilisers sales are hedged at a rate of $0.77 with full participation down to $0.725. The remaining 33% is unhedged.
Sensitivities
The table provides sensitivities to key earnings drivers excluding the impact of hedging and should be read in conjunction with the footnotes found on page 17 of this report.
Commodity Proxy Index EBIT Sensitivities
Americas
Ammonia (13) CFR Tampa + / - US$10/mt = +/-U$6.6m
Natural Gas (14) Henry Hub + / - US$0.10/mmbtu = -/+ US$2.2m
Urea (15) FOB NOLA + / - US$10/mt = +/-U$1.8m
FX EBIT Translation (16) + / - A$/US$0.01 = -/+ A$3.5m
Asia Pacific
AP (17) FOB China/Saudi + / - US$10/mt = +/-A$11.5m
Urea (18) FOB Middle East + / - US$10/mt = +/-A$3.6m
FX EBIT Transactional (17,18) + / - A$/US$0.01 = -/+A$10.3m
Note: Proxy Index prices are available on Bloomberg.
SUSTAINABILITYIPL’s commitment to operating sustainably is driven by the Company’s values which are core to the way it does business. IPL’s strategy is to deliver sustainable growth and shareholder returns while proactively managing those issues most material to the long-term sustainability of its business, the broader environment and the communities in which IPL operates.
Issues considered material to the sustainability of the Company are included in its 2021 Annual Report, 2021 Corporate Governance Statement, the IPL Climate Change Report (2021), and in the online 2021 Sustainability Report which will be released in March 2022.
This year will mark the 11th year in which the Company has produced a stand-alone, GRI-aligned Sustainability Report and the first year in which it has released a stand-alone TCFD-aligned Climate Change Report. These comprehensive reports demonstrate IPL’s commitment to transparency and to effectively and efficiently informing and meeting the needs of its diverse stakeholder group.
In FY21, the Sustainability Steering Committee was formed. Chaired by IPL’s MD & CEO, the committee provides executive oversight of the sustainability strategy and direction on the management of Environmental, Social and Governance issues material to the long-term sustainability of the IPL Group.
IPL secured a sustainability-linked Syndicated 3-year Term facility in FY21. The facility demonstrates IPL’s commitment to sustainable outcomes by tying its cost of finance to achieving set KPIs with respect to greenhouse gas reductions, municipal water use reductions and increases in soils and plant testing rates, which help achieve more sustainable fertiliser application practices.
Sustainability Performance BenchmarkingIPL has been a member of the Dow Jones Sustainability Index (DJSI) since 2010. Selection for the index is made after a review of IPL’s sustainability reporting as well as a comprehensive Corporate Sustainability Assessment questionnaire via a strategic partnership between S&P Dow Jones Indices and RobecoSAM. IPL’s performance is benchmarked against peers in the global Chemicals sector. 2021 DJSI scores were released on 12 November 2021, which was too late for inclusion in this report.
EcoVadis Member since 2015
EcoVadis is assessed biennially.
In 2021, the FTSE Group confirmed that IPL has been independently assessed according to the FTSE4Good criteria and has satisfied the requirements to remain a constituent of the FTSE4Good Index Series for the eighth year running. Companies in the FTSE4Good Index Series have met stringent environmental,
social and governance criteria.
Bloomberg GEI Member since 2019
CDP Climate Change Reporter since 2009:
IPL has been a voluntary CDP (formerly Carbon Disclosure Project) reporter since 2009. Our most
recent CDP Climate Change report can be downloaded from our website.
CDP Water Security Reporter since 2014:
IPL has been a voluntary CDP water reporter since its introduction in 2014 and uses the WRI Aqueduct
Water Tool to assess and report on water risks. Our most recent CDP Water Security report
can be downloaded from our website.
15
Incitec Pivot Limited Profit Report 2021
Note: Numbers in this report are subject to rounding. Definitions and Notes appear on page 17 of this report. All figures are in A$ and metric tonnes (mt) except where noted.

S&P Global DJSI Corporate Sustainability AssessmentCalendar Year 2021 2020 2019 2018 2017 2016
DJSI Dimension
Economic 81 78 72 71 73 74
Environmental 69 71 73 64 61 60Social 65 58 60 57 68 65Total for IPL 72 69 69 65 68 67
Chemicals sector average 30 36 47 44 53 56
The Company is also a member of the FTSE4Good Index and ECPI Indices, completes the CDP Climate Change and Water Security reports each year, and is rated by CAER, EcoVadis, MSCI, Sustainalytics, Vigeo EIRIS and CGI Glass Lewis.
Zero Harm (Safety and Environment)IPL’s Zero Harm company value is prioritised above all others. To reflect this, the Zero Harm ambition is one of IPL’s six Strategic Drivers, upon which the success of the Company is built. The Zero Harm ambition is supported by an integrated Health, Safety and Environment (HSE) management system that provides the foundation for effective identification and management of HSE risks.
During 2021, IPL refreshed its approach to deliver its Zero Harm ambition. The refreshed strategy created a stronger connection to the Zero Harm Strategic Driver and integrated all HSEC elements under one framework. IPL’s strategic themes of Simplify, Get the Fundamentals Right, Lead and Engage and Strengthen our Learning Culture, provide a common language and basic principles which will guide IPL’s effort, reflect the voice of internal customers and improve performance.
The following Zero Harm targets remain a focus for the Group:
» TRIFR of 0.7, a 20% reduction from FY21 actual;
» Year-on-year reduction in Tier 1 and Tier 2 Process Safety Incidents;
» Year-on-year reduction in Potential High Severity Incidents; and
» Zero Significant Environmental Incidents.
The Group’s FY21 performance against key HSE metrics is included in the table below:
ZERO HARM FY21 FY20
Key Metrics
TRIFR 0.87 0.58
Potential High Severity Incidents 36 34
Process Safety Incidents 38 24
Significant Environmental Incidents 0 1
Gender Diversity
The Company remains committed to expanding the diversity of its workforce and has a stretch target to increase gender diversity by 10% year-on-year. IPL is in the process of redefining a new medium term diversity target.
IPL’s representation of women across the organisation at 30 September is reflected in the table below:
GENDER DIVERSITY FY21 FY20 FY19 FY18
% % % %
Board (19 ) 43 50 50 43
Executive Team (19) 38 20 30 22
Senior Management 21 20 22 17
Professional/Management 19 20 19 19
Global Workforce 18 18 17 16
During FY21, the Company was again selected for inclusion in the Bloomberg Gender-Equality Index (GEI).
The GEI standardised reporting framework offers public companies the opportunity to disclose information on how they promote gender equality. Reporting companies that score above a globally established threshold, based on the extent of disclosures and the achievement of best-in-class statistics and policies, are included in the GEI.
MANAGING CLIMATE CHANGEIPL’s Climate Change Policy outlines its commitment to managing the impacts of climate change and describes how the management of the risks, opportunities and impacts associated with climate change is integrated into its six strategic drivers, on which the success of the Company is built.
The IPL Climate Change Report (2021) makes disclosures which align with the recommendations of the Taskforce on Climate-related Financial Disclosures (TCFD)
Governance and StrategyIn FY21 the Decarbonisation and Energy Transition (DET) Steering Committee was formed with the aims of evaluating new market opportunities relating to key decarbonisation mega-trends and achieving Net Zero emissions as soon as practicable.
The committee is chaired by IPL’s MD&CEO and provides executive oversight of strategy development, and the evaluation and prioritisation of opportunities relating to decarbonisation and energy transition that are consistent with IPL’s core skills and capabilities. More detail on IPL’s governance and strategic management of climate change-related issues is in Section 1 of the IPL Climate Change Report (2021).
Pathway to Net ZeroDuring 2021 IPL focused on mapping its pathway to net zero and working with partners and research bodies to develop the breakthroughs required. The Company’s GHG emissions profile is dominated by the use of natural gas to make hydrogen for ammonia manufacture with a smaller percentage of emissions arising from nitric acid manufacture as nitrous oxide (N2O). A third source, emissions from electricity use, make up less than 12 percent of IPL’s total Scope 1 and 2 emissions. Creating a pathway to net zero for the majority of our emissions currently requires the investigation of new and emerging technologies.
During 2021, key technologies for net zero were identified and an expert third party was engaged to identify the time horizons by which each of these is expected to be economically feasible. IPL’s emissions profile, reduction targets, key technologies and potential Net Zero Pathway, as well as additional information on technology readiness levels, are provided in Section 2 of the IPL Climate Change Report 2021.
IPL’s risk management processes include a requirement for high consequence and strategically important risks to be regularly reviewed, assessed and managed. Climate change-related financial risks are included amongst this select group of risks.
In FY21, an expert third party was engaged to update IPL’s existing 2- and 4-degree future climate-related scenarios and to construct two additional scenarios: a 1.5 degree and an ‘Inevitable Policy Response’ scenario. This scenario describes the physical and transitional (market based) impacts associated with delayed action on climate change that is followed by a rapid and steep decarbonisation process and is developed to enable organisations to assess their resilience to a situation where policy makers and settings react dramatically to climate change.
An assessment of the risks and opportunities against these new and updated scenarios was conducted with workshops across the global business. For more detailed information regarding the assessment process, the scenarios, risk governance structures and management strategies, see section 4 of the IPL Climate Change Report (2021).
16
Incitec Pivot Limited Profit Report 2021
Note: Numbers in this report are subject to rounding. Definitions and Notes appear on page 17 of this report. All figures are in A$ and metric tonnes (mt) except where noted.

DEFINITIONS AND NOTES(1) Free cashflow = operating cashflows less investing cashflows
(excluding investing cashflows from derivatives) less lease liability principal payments.
(2) Net Debt comprises the net of interest-bearing liabilities, cash and cash equivalents, and the fair value of derivative instruments economically hedging the Group’s interest bearing liabilities and excludes lease liabilities.
(3) Net debt/EBITDA ratio (for debt covenant purposes). EBITDA is calculated using 12 month rolling EBITDA ex IMIs, minus lease depreciation. Net Debt is translated at the 12 month average AUD:USD FX rate.
(4) Interest Cover = 12 month rolling EBITDA (minus lease depreciation) ex IMIs/net interest expense before accounting adjustments.
(5) TRIFR is calculated as the number of recordable incidents per 200,000 hours worked and includes contractors. TRIFR results are subject to finalisation of the classification of any pending incidents. Prior year end number was restated due to finalisation of classification of incidents pending at the time of previous publication date.
(6) Significant Environmental Incidents as assessed against IPL’s internal risk matrix with actual consequences of 5 or higher on a 6-level scale.
(7) Tier 1 and Tier 2 Process Safety Incidents as defined by the Center for Chemical Process Safety.
(8) Potential High Severity Incidents (excluding near misses and hazards) with potential safety consequences of 5 or higher on a 6-level scale.
(9) Underlying interest expense represents total borrowing costs less non-cash interest unwind, representing the discount unwind on the Group’s long-term liabilities.
(10) Average TWC as % of revenue = 13-month average trade working capital excluding financing facilities/12 months rolling revenue.
(11) Waggaman’s ammonia sales prices are based on a combination of index Ammonia Tampa prices and 1-month lagged index Ammonia Tampa prices. The index price shown in the table represents the average index price for the financial year adjusted for the one-month lag. In prior reports, this table showed the index price without the one-month lag.
(12) Average closing price of Nymex Henry Hub 1-month futures.
(13) Based on 800k mt Waggaman plant nameplate production less internal sales volumes of 143k mt.
(14) Based on 800k mt Waggaman plant nameplate production less internal sales volumes of 143k mt.and gas efficiency of 33.6 mmbtu/tonne of ammonia.
(15) Based on St Helens plant capacity of 175k mt of urea equivalent product.
(16) Based on actual FY19 Dyno Nobel Americas EBIT (excluding Non-Recurring Items) of US$200m and an average foreign exchange rate of A$/U$ 0.75.
(17) Based on Phosphate Hill plant nameplate production of 1 million tonnes less an allowance for 7 weeks lost production resulting from the planned turnaround; average market forecast price DAP price of US$524; and an average foreign exchange rate of A$/U$ 0.75.
(18) Based on actual FY21 Gibson Island production sold subject to urea price movement of 364k mt; average realised FY21 urea price of US$373; an average foreign exchange rate of A$/U$ 0.75; and tiered pricing on Gibson Island gas contracts.
(19) The Board and Executive Team each includes the Managing Director & CEO.
APPENDIX
17
Incitec Pivot Limited Profit Report 2021
Note: Numbers in this report are subject to rounding. Definitions and Notes appear on page 17 of this report. All figures are in A$ and metric tonnes (mt) except where noted.

ABN: 42 004 080 264
Level 8, 28 Freshwater Place, Southbank Victoria 3006, Australia
This publication is printed on ecoStar+, a carbon neutral environmentally responsible paper,
manufactured from 100% post-consumer waste, chlorine free environment using the ISO14001
environmental management system.
The fibre source is certified by the Forestry Stewardship Council.

INCITEC PIVOT LIMITED September September March September September March September September March September September MarchFINANCIAL PERFORMANCE 2021 2021 2021 2020 2020 2020 2019 2019 2019 2018 2018 2018
FY HY HY FY HY HY FY HY HY FY HY HY
VOLUMES SOLD ('000 tonnes)
FERTILISERS ASIA PACIFICDistribution - Domestic Ag 1,820.4 1,124.1 696.3 1,844.4 1,099.5 744.9 1,596.6 1,036.4 560.2 1,707.0 1,058.5 648.5 - Industrial and Trading 230.8 121.2 109.6 217.1 111.3 105.8 239.7 144.0 95.7 191.5 104.9 86.6
Manufacturing - Phosphate Hill 949.0 536.1 412.9 982.7 534.2 448.5 667.4 357.6 309.8 860.7 418.6 442.1 - Gibson Island 196.5 109.8 86.7 192.4 110.8 81.6 166.7 114.7 52.0 222.6 123.8 98.8 - Geelong 357.6 162.9 194.7 332.6 166.6 166.0 315.8 162.7 153.1 417.5 178.5 239.0
Intercompany Eliminations (334.2) (90.9) (243.3) (433.3) (148.4) (284.9) (233.8) (83.8) (150.0) (386.9) (66.5) (320.4) 3,220.1 1,963.2 1,256.9 3,135.9 1,874.0 1,261.9 2,752.4 1,731.6 1,020.8 3,012.4 1,817.8 1,194.6
Quantum (third party sales) 326.2 247.0 79.2 439.6 363.6 76.0 625.6 360.2 265.4 1,315.0 759.0 556.0
AU$ mill AU$ mill AU$ mill AU$ mill AU$ mill AU$ mill AU$ mill AU$ mill AU$ mill AU$ mill AU$ mill AU$ mill
BUSINESS SEG SALESManufacturing 836.4 593.6 242.8 554.4 341.3 213.1 510.5 306.5 204.0 590.1 370.0 220.1 Distribution 1,058.2 672.7 385.5 947.6 544.2 403.4 908.9 559.9 349.0 881.6 544.6 337.0 Total Fertilisers 1,894.6 1,266.3 628.3 1,502.0 885.5 616.5 1,419.4 866.4 553.0 1,471.7 914.6 557.1 DNAP 937.8 482.0 455.8 999.2 507.3 491.9 990.7 520.2 470.5 978.6 499.5 479.1 Elimination (25.8) (16.6) (9.2) (18.5) (11.4) (7.1) (13.4) (10.4) (3.0) (12.1) (5.4) (6.7) Total Asia Pacific 2,806.6 1,731.7 1,074.9 2,482.7 1,381.4 1,101.3 2,396.7 1,376.2 1,020.5 2,438.2 1,408.7 1,029.5
Americas - DNA 1,588.7 917.6 671.1 1,506.5 737.7 768.8 1,569.0 824.1 744.9 1,462.3 784.5 677.8 Group Eliminations (46.8) (24.9) (21.9) (47.0) (24.8) (22.2) (47.5) (24.4) (23.1) (44.2) (20.1) (24.1) Total Sales - IPL Group 4,348.5 2,624.4 1,724.1 3,942.2 2,094.3 1,847.9 3,918.2 2,175.9 1,742.3 3,856.3 2,173.1 1,683.2
GEOGRAPHIC SEG SALESAustralia 2,739.7 1,696.7 1,043.0 2,399.0 1,342.5 1,056.5 2,304.8 1,329.1 975.7 2,322.0 1,353.9 968.1 North Americas 1,564.0 904.6 659.4 1,487.3 731.2 756.1 1,538.2 807.9 730.3 1,438.7 770.8 667.9 Turkey 38.9 20.0 18.9 50.5 23.9 26.6 50.3 26.8 23.5 66.5 31.7 34.8 Other 5.9 3.1 2.8 5.4 (3.3) 8.7 24.9 12.1 12.8 29.1 16.7 12.4 Total - IPL Group 4,348.5 2,624.4 1,724.1 3,942.2 2,094.3 1,847.9 3,918.2 2,175.9 1,742.3 3,856.3 2,173.1 1,683.2
BUSINESS SEG EBITDA (excluding IMIs)Manufacturing 303.8 255.6 48.2 57.7 46.6 11.1 (46.6) (33.4) (13.2) 128.9 88.7 40.2 Distribution 78.3 50.8 27.5 71.3 43.1 28.2 47.0 29.3 17.7 53.3 33.6 19.7 Total Fertilisers 382.1 306.4 75.7 129.0 89.7 39.3 0.4 (4.1) 4.5 182.2 122.3 59.9 DNAP 219.5 109.4 110.1 230.7 119.4 111.3 255.4 140.0 115.4 288.8 145.8 143.0 Total Asia Pacific 601.6 415.8 185.8 359.7 209.1 150.6 255.8 135.9 119.9 471.0 268.1 202.9
Americas - DNA 359.9 250.9 109.0 396.3 196.6 199.7 376.6 220.0 156.6 410.3 215.9 194.4 Group Elimination (2.1) (1.6) (0.5) (0.3) 1.0 (1.3) (1.7) (0.5) (1.2) (0.6) (0.7) 0.1 Corporate (24.5) (15.9) (8.6) (25.2) (13.7) (11.5) (25.4) (14.3) (11.1) (29.7) (16.3) (13.4) Total EBITDA (excluding IMIs) - IPL Group 934.9 649.2 285.7 730.5 393.0 337.5 605.3 341.1 264.2 851.0 467.0 384.0
BUSINESS SEG Depreciation and AmortisationManufacturing (95.0) (48.8) (46.2) (86.1) (44.9) (41.2) (73.0) (39.1) (33.9) (70.5) (37.4) (33.1) Distribution (18.7) (9.4) (9.3) (16.7) (8.7) (8.0) (7.1) (4.0) (3.1) (7.1) (3.6) (3.5) Total Fertilisers (113.7) (58.2) (55.5) (102.8) (53.6) (49.2) (80.1) (43.1) (37.0) (77.6) (41.0) (36.6) DNAP (79.3) (39.4) (39.9) (81.4) (41.2) (40.2) (76.2) (37.4) (38.8) (83.4) (40.5) (42.9) Total Asia Pacific (193.0) (97.6) (95.4) (184.2) (94.8) (89.4) (156.3) (80.5) (75.8) (161.0) (81.5) (79.5)
Americas - DNA (170.0) (92.4) (77.6) (165.5) (79.2) (86.3) (142.6) (73.9) (68.7) (131.7) (68.2) (63.5) Corporate / Elimination (5.5) (3.0) (2.5) (6.3) (3.7) (2.6) (2.7) (1.7) (1.0) (1.6) (0.9) (0.7) Total Depreciation and Amortisation - IPL Group (368.5) (193.0) (175.5) (356.0) (177.7) (178.3) (301.6) (156.1) (145.5) (294.3) (150.6) (143.7)
BUSINESS SEG EBIT (excluding IMIs)Manufacturing 208.8 206.8 2.0 (28.4) 1.7 (30.1) (119.6) (72.5) (47.1) 58.4 51.3 7.1 Distribution 59.6 41.4 18.2 54.6 34.4 20.2 39.9 25.3 14.6 46.2 30.0 16.2 Total Fertilisers 268.4 248.2 20.2 26.2 36.1 (9.9) (79.7) (47.2) (32.5) 104.6 81.3 23.3 DNAP 140.2 70.0 70.2 149.3 78.2 71.1 179.2 102.6 76.6 205.4 105.3 100.1 Total Asia Pacific 408.6 318.2 90.4 175.5 114.3 61.2 99.5 55.4 44.1 310.0 186.6 123.4
Americas - DNA 189.9 158.5 31.4 230.8 117.4 113.4 234.0 146.1 87.9 278.6 147.7 130.9 Group Elimination (1.8) (1.3) (0.5) (0.1) 1.2 (1.3) (1.7) (0.5) (1.2) (0.6) (0.7) 0.1 Corporate (30.3) (19.2) (11.1) (31.7) (17.6) (14.1) (28.1) (16.0) (12.1) (31.3) (17.2) (14.1) Total EBIT (excluding IMIs) - IPL Group 566.4 456.2 110.2 374.5 215.3 159.2 303.7 185.0 118.7 556.7 316.4 240.3
GEOGRAPHIC SEG NON-CURRENT ASSETS OTHER THAN FINANCIAL INSTRUMENTS AND DEFERRED TAX ASSETS
Australia 3,435.3 3,435.3 3,504.3 3,549.2 3,549.2 3,589.3 3,412.8 3,412.8 3,350.9 3,310.6 3,310.6 3,278.3 North Americas 3,962.1 3,962.1 3,852.6 4,022.8 4,022.8 4,672.3 4,254.4 4,254.4 4,004.8 3,959.6 3,959.6 3,744.0 Turkey 2.4 2.4 2.2 2.0 2.0 2.7 1.6 1.6 1.5 1.3 1.3 1.5 Other 125.8 125.8 122.5 117.5 117.5 142.8 127.4 127.4 180.1 164.4 164.4 153.2 Total - IPL Group 7,525.6 7,525.6 7,481.6 7,691.5 7,691.5 8,407.1 7,796.2 7,796.2 7,537.3 7,435.9 7,435.9 7,177.0
FINANCIAL PERFORMANCEEBIT 566.4 456.2 110.2 374.5 215.3 159.2 303.7 185.0 118.7 556.7 316.4 240.3 Net Interest (112.8) (49.3) (63.5) (135.7) (60.4) (75.3) (144.1) (76.5) (67.6) (128.0) (68.3) (59.7) Operating Profit Before Tax and Minorities 453.6 406.9 46.7 238.8 154.9 83.9 159.6 108.5 51.1 428.7 248.1 180.6 Income Tax (Expense)/ Benefit (95.0) (84.7) (10.3) (50.6) (31.3) (19.3) (7.5) 2.0 (9.5) (78.4) (47.0) (31.4) NPAT pre Individually Material Items 358.6 322.2 36.4 188.2 123.6 64.6 152.1 110.5 41.6 350.3 201.1 149.2 Individually Material Items Before Tax (293.4) (293.4) - (87.9) (87.9) - - - - (236.0) - (236.0) Tax Expense - Individually Material Items 83.9 83.9 - 23.1 23.1 - - - - 96.5 - 96.5 NPAT & Individually Material Items 149.1 112.7 36.4 123.4 58.8 64.6 152.1 110.5 41.6 210.8 201.1 9.7 NPAT attributable to shareholders of IPL 149.1 112.7 36.4 123.4 58.8 64.6 152.4 110.5 41.9 207.9 200.3 7.6 NPAT attributable to minority interest - - - - - - (0.3) - (0.3) 2.9 0.8 2.1
US$ mill US$ mill US$ mill US$ mill US$ mill US$ mill US$ mill US$ mill US$ mill US$ mill US$ mill US$ mill
Americas - DNA US$ EBITDA (excluding IMIs)Explosives 204.2 121.7 82.5 195.4 101.8 93.6 197.6 111.8 85.8 192.3 107.5 84.8 Waggaman 41.4 45.2 (3.8) 61.1 28.9 32.2 47.5 23.8 23.7 103.8 42.3 61.5 Ag & IC 23.3 20.2 3.1 10.4 3.5 6.9 10.8 8.5 2.3 15.6 10.9 4.7 Other - - - - - - 8.0 8.0 - - - - Total US$ EBITDA (excluding IMIs) - Americas - DNA 268.9 187.1 81.8 267.0 134.3 132.7 263.9 152.1 111.8 311.7 160.7 151.0
Americas - DNA US$ Depreciation & AmortisationExplosives (77.5) (38.8) (38.7) (74.3) (36.3) (38.0) (61.5) (31.1) (30.4) (62.1) (31.3) (30.8) Waggaman (37.8) (23.4) (14.4) (28.7) (14.4) (14.3) (28.3) (14.6) (13.7) (27.6) (14.1) (13.5) Ag & IC (12.4) (6.8) (5.6) (9.1) (3.6) (5.5) (10.6) (5.6) (5.0) (10.4) (5.4) (5.0) Total US$ Depreciation and Amortisation - Americas - DNA (127.7) (69.0) (58.7) (112.2) (54.4) (57.8) (100.4) (51.3) (49.1) (100.1) (50.8) (49.3)
Americas - DNA US$ EBIT (excluding IMIs)Explosives 126.7 82.9 43.8 121.1 65.5 55.6 136.1 80.7 55.4 130.2 76.2 54.0 Waggaman 3.6 21.8 (18.2) 32.4 14.5 17.9 19.2 9.2 10.0 76.2 28.2 48.0 Ag & IC 10.9 13.4 (2.5) 1.3 (0.1) 1.4 0.2 2.9 (2.7) 5.2 5.5 (0.3) Other - - - - - - 8.0 8.0 - - - - Total US$ EBIT (excluding IMIs) - Americas - DNA 141.2 118.1 23.1 154.8 79.9 74.9 163.5 100.8 62.7 211.6 109.9 101.7

INCITEC PIVOT LIMITED September September March September September March September September March September September MarchFINANCIAL POSITION 2021 2021 2021 2020 2020 2020 2019 2019 2019 2018 2018 2018
FY HY HY FY HY HY FY HY HY FY HY HYAU$ mill AU$ mill AU$ mill AU$ mill AU$ mill AU$ mill AU$ mill AU$ mill AU$ mill AU$ mill AU$ mill AU$ mill
Cash 651.8 651.8 124.0 554.6 554.6 210.9 576.4 576.4 258.1 588.5 588.5 188.1
Inventories 577.7 577.7 660.7 474.4 474.4 633.5 600.9 600.9 701.3 494.9 494.9 577.3Trade Debtors 470.8 470.8 387.0 338.9 338.9 520.0 286.2 286.2 342.5 289.2 289.2 306.9Trade Creditors (927.8) (927.8) (727.3) (798.5) (798.5) (953.2) (883.0) (883.0) (781.0) (835.9) (835.9) (628.4)Trade Working Capital 120.7 120.7 320.4 14.8 14.8 200.3 4.1 4.1 262.8 (51.8) (51.8) 255.8
Property, Plant & Equipment 3,928.9 3,928.9 3,996.3 4,071.7 4,071.7 4,379.0 4,190.0 4,190.0 4,068.0 4,004.3 4,004.3 3,878.9 Lease right-of-use assets 214.5 214.5 214.9 221.1 221.1 209.4 - - - - - - Net Property, Plant & Equipment 4,143.4 4,143.4 4,211.2 4,292.8 4,292.8 4,588.4 4,190.0 4,190.0 4,068.0 4,004.3 4,004.3 3,878.9
Intangibles 3,000.9 3,000.9 2,909.3 3,019.7 3,019.7 3,370.5 3,179.5 3,179.5 3,073.0 3,046.6 3,046.6 2,950.8
Lease liabilities (242.5) (242.5) (241.9) (247.7) (247.7) (236.0) - - - - - - Net Other Liabilities (636.9) (636.9) (567.8) (560.6) (560.6) (709.2) (605.8) (605.8) (604.4) (468.6) (468.6) (358.0)Net Interest Bearing LiabilitiesCurrent (18.8) (18.8) (20.5) (21.2) (21.2) (24.7) (1,213.4) (1,213.4) (1,151.1) (212.9) (212.9) (697.3)Non-Current (1,650.0) (1,650.0) (1,579.6) (1,849.1) (1,849.1) (2,567.8) (1,443.0) (1,443.0) (1,343.5) (2,161.9) (2,161.9) (1,567.4)
Net Assets 5,368.6 5,368.6 5,155.1 5,203.3 5,203.3 4,832.4 4,687.8 4,687.8 4,562.9 4,744.2 4,744.2 4,650.9
Total Equity 5,368.6 5,368.6 5,155.1 5,203.3 5,203.3 4,832.4 4,687.8 4,687.8 4,562.9 4,744.2 4,744.2 4,650.9Capital Expenditure (Accruals Basis) Total Capital Expenditure 394.2 208.2 186.0 304.5 145.0 159.5 380.8 206.3 174.5 296.9 162.0 134.9
Depreciation and amortisation 368.5 193.0 175.5 356.0 177.7 178.3 301.6 156.1 145.5 294.3 150.6 143.7
RatiosEPS, cents pre individually material items 18.5 16.6 1.9 10.9 6.9 4.0 9.5 6.9 2.6 20.9 12.1 8.8EPS, cents post individually material items 7.7 5.8 1.9 7.1 3.1 4.0 9.5 6.9 2.6 12.5 12.0 0.5DPS, cents 9.3 8.3 1.0 - - - 4.7 3.4 1.3 10.7 6.2 4.5Franking, % 24% 14% 100% - - - 22% 30% 0% 12% 20% 0%Interest Cover (times) 9.7 9.7 6.0 6.1 6.1 5.0 4.6 4.6 5.8 7.3 7.3 7.5

INCITEC PIVOT LIMITED September September March September September March September September March September September MarchCASH FLOWS 2021 2021 2021 2020 2020 2020 2019 2019 2019 2018 2018 2018
FY HY HY FY HY HY FY HY HY FY HY HYAU$ mill AU$ mill AU$ mill AU$ mill AU$ mill AU$ mill AU$ mill AU$ mill AU$ mill AU$ mill AU$ mill AU$ millInflows/ Inflows/ Inflows/ Inflows/ Inflows/ Inflows/ Inflows/ Inflows/ Inflows/ Inflows/ Inflows/ Inflows/
(Outflows) (Outflows) (Outflows) (Outflows) (Outflows) (Outflows) (Outflows) (Outflows) (Outflows) (Outflows) (Outflows) (Outflows)
Net operating cash flowsGroup EBITDA ex IMIs 934.9 649.2 285.7 730.5 393.0 337.5 605.3 341.1 264.2 851.0 467.0 384.0Net interest paid (108.7) (46.3) (62.4) (135.5) (58.7) (76.8) (131.1) (68.0) (63.1) (116.4) (62.0) (54.4)Net income tax paid (33.1) (18.2) (14.9) (13.7) (2.0) (11.7) (20.8) (6.4) (14.4) (11.5) (6.4) (5.1)TWC movement (excluding FX impact) (126.1) 196.9 (323.0) (8.4) 169.3 (177.7) (12.2) 301.0 (313.2) 6.6 320.6 (314.0)Profit from joint ventures and associates (41.9) (26.9) (15.0) (32.3) (18.1) (14.2) (44.9) (27.5) (17.4) (44.7) (29.8) (14.9)Dividends received from joint ventures and associates 44.6 16.9 27.7 30.9 15.1 15.8 27.5 14.0 13.5 29.9 16.7 13.2Environmental and site clean up (4.8) (2.5) (2.3) (8.0) (3.1) (4.9) (8.8) (4.6) (4.2) (7.2) (3.2) (4.0)Other non-TWC (14.7) (15.8) 1.1 (18.4) (102.4) 84.0 (0.2) (100.0) 99.8 (45.0) 98.2 (143.2)Operating cash flows 650.2 753.3 (103.1) 545.1 393.1 152.0 414.8 449.6 (34.8) 662.7 801.1 (138.4)
Net investing cash flowsGrowth - Other (51.2) (34.1) (17.1) (60.2) (24.7) (35.5) (55.2) (32.0) (23.2) (64.6) (27.8) (36.8)Sustenance and lease buy-outs (303.8) (162.8) (141.0) (218.2) (99.6) (118.6) (292.9) (144.3) (148.6) (260.7) (159.5) (101.2)Proceeds from asset sales 5.7 3.2 2.5 7.4 5.5 1.9 10.8 7.4 3.4 6.2 2.8 3.4Other 6.9 12.3 (5.4) (108.4) (39.4) (69.0) (4.3) 1.2 (5.5) (4.9) (21.3) 16.4Investing cash flows (342.4) (181.4) (161.0) (379.4) (158.2) (221.2) (341.6) (167.7) (173.9) (324.0) (205.8) (118.2)
Net financing cash flowsDividends paid to members of Incitec Pivot Limited (19.4) (19.4) - (30.7) - (30.7) (121.7) (20.9) (100.8) (157.4) (74.7) (82.7)Dividends paid to non-controlling interest holder - - - - - - (5.9) - (5.9) (2.4) - (2.4)Payment for buy-back of shares - - - - - - (89.7) - (89.7) (210.3) (114.9) (95.4)Proceeds on issue of shares - - - 645.5 645.5 - - - - - - -Purchase of IPL shares for employees (1.0) - (1.0) (1.3) - (1.3) (0.6) - (0.6) (5.1) - (5.1)Lease liability payments (41.4) (21.5) (19.9) (41.9) (21.7) (20.2) - - - - - -
Non-cash movements in Net Debt and realised market value movements on derivatives (221.5) (202.0) (19.5) (74.6) (11.2) (63.4) (175.1) (32.5) (142.6) (43.2) (32.6) (10.6) Financing cash flows (283.3) (242.9) (40.4) 497.0 612.6 (115.6) (393.0) (53.4) (339.6) (418.4) (222.2) (196.2)
(Increase)/decrease in net debt 24.5 329.0 (304.5) 662.7 847.5 (184.8) (319.8) 228.5 (548.3) (79.7) 373.1 (452.8)