Embed Size (px)
Citation preview

Asymmetric Conditional Volatility on the Romanian Stock Market
MSc Student: STANCIU FLORIN AURELIAN
ACADEMY OF ECONOMIC STUDIESDOCTORAL SCHOOL OF FINANCE AND BANKING
Coordinator: Professor MOISĂ ALTĂR
-- DISSERTATION PAPER -- Bucharest, July 2008

Dissertation Paper “Asymmetric Conditional Volatility on the Romanian Stock Market”Stanciu Florin - DOFIN 2008
Paper Purpose and Motivations
One major characteristic of financial time series is that volatility is changing over time.
The ability to forecast financial market volatility is important for portfolio selection and asset management as well as for the pricing of primary and derivative assets.
While most researchers agree that volatility is predictable in many asset markets, they differ on how this volatility predictability should be modeled.
In recent years the evidence for predictability has led to a variety of approaches, among which very interesting are the asymmetric volatility models.
One of the established stylized facts of financial markets is that, generally, volatility after negative shocks is higher than volatility after positive shocks.

Dissertation Paper “Asymmetric Conditional Volatility on the Romanian Stock Market”Stanciu Florin - DOFIN 2008
Paper Purpose and Motivations
The aim of this paper is to test the hypothesis under which the conditional variance of the Bucharest Stock Exchange’s most comprising index, the BET-C, is an asymmetric function of past innovations.
Furthermore, if such asymmetries exist in individual stocks returns it is natural to expect that in a cross sectional analysis the size of the asymmetry will be positively related to the degree of financial leverage (i.e, the higher the leverage the more asymmetric the response of volatility to innovations)
If the leverage effect cannot explain the asymmetry at the level of individual stocks, than leverage cannot explain the asymmetry in the index, because the leverage level of the index is an aggregate of the leverage levels of individual firms
Dissertation Paper “Asymmetric Conditional Volatility on the Romanian Stock Market”Stanciu Florin - DOFIN 2008
Brief Literature Review
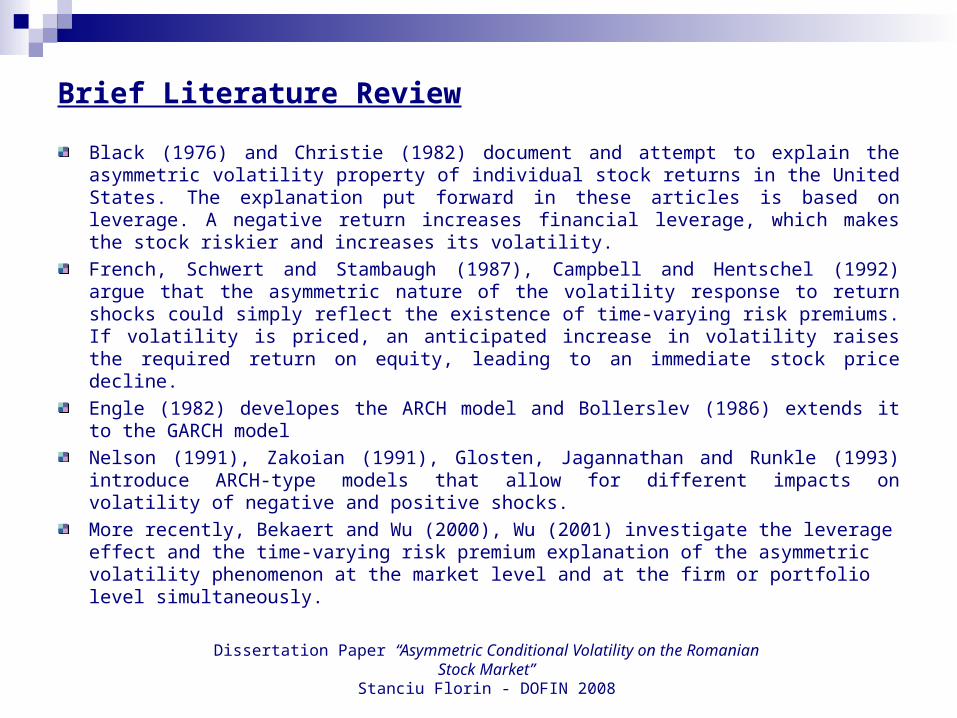
Black (1976) and Christie (1982) document and attempt to explain the asymmetric volatility property of individual stock returns in the United States. The explanation put forward in these articles is based on leverage. A negative return increases financial leverage, which makes the stock riskier and increases its volatility.
French, Schwert and Stambaugh (1987), Campbell and Hentschel (1992) argue that the asymmetric nature of the volatility response to return shocks could simply reflect the existence of time-varying risk premiums. If volatility is priced, an anticipated increase in volatility raises the required return on equity, leading to an immediate stock price decline.
Engle (1982) developes the ARCH model and Bollerslev (1986) extends it to the GARCH model
Nelson (1991), Zakoian (1991), Glosten, Jagannathan and Runkle (1993) introduce ARCH-type models that allow for different impacts on volatility of negative and positive shocks.
More recently, Bekaert and Wu (2000), Wu (2001) investigate the leverage effect and the time-varying risk premium explanation of the asymmetric volatility phenomenon at the market level and at the firm or portfolio level simultaneously.
Dissertation Paper “Asymmetric Conditional Volatility on the Romanian Stock Market”Stanciu Florin - DOFIN 2008
Conceptual Framework
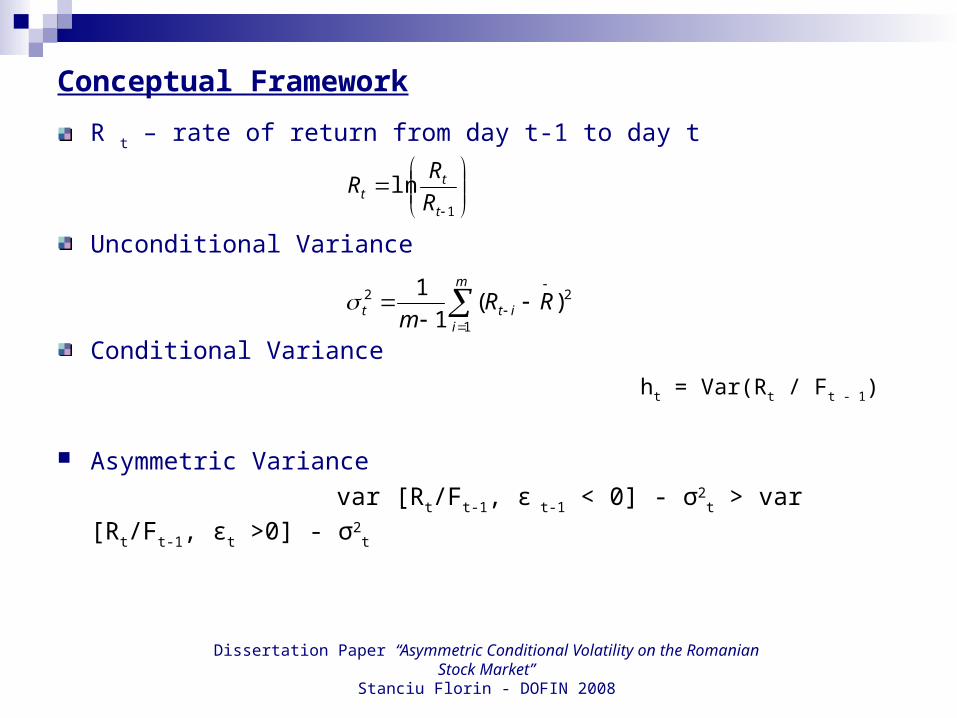
R t – rate of return from day t-1 to day t
Unconditional Variance
Conditional Variance
ht = Var(Rt / Ft - 1)
Asymmetric Variance
var [Rt/Ft-1, ε t-1 < 0] - σ2t > var [Rt/Ft-1, εt >0] - σ2
t
1
lnt
tt R
RR
2
1
2 )(1
1
RR
m
m
iitt
Dissertation Paper “Asymmetric Conditional Volatility on the Romanian Stock Market”Stanciu Florin - DOFIN 2008
The Data
Daily observations on the Bucharest Exchange Trading-Composite Index (BET-C) close levels for the whole period since its launch date (April 16, 1998 – June 1, 2008 – 2533 observations) and for the period starting November 1, 2004 through June 1, 2008 – 895 observations.
Daily observations on the closing prices for 12 individual companies listed on the BSE (11 of them are comprised in the BET-C) and their biannual financial statement data for the period June 1, 2004 – June 1, 2008.
The data have been obtained from the Bucharest Stock Exchange website
Daily returns for the index and individual stocks were calculated as the percent logarithmic difference in the daily closing price, i.e., Rt = 100*(ln Pt - ln Pt-1). The series of continuously compounded index returns obtained this way is stationary for both data samples, as we can see from the ADF test statistics.
Dissertation Paper “Asymmetric Conditional Volatility on the Romanian Stock Market”Stanciu Florin - DOFIN 2008
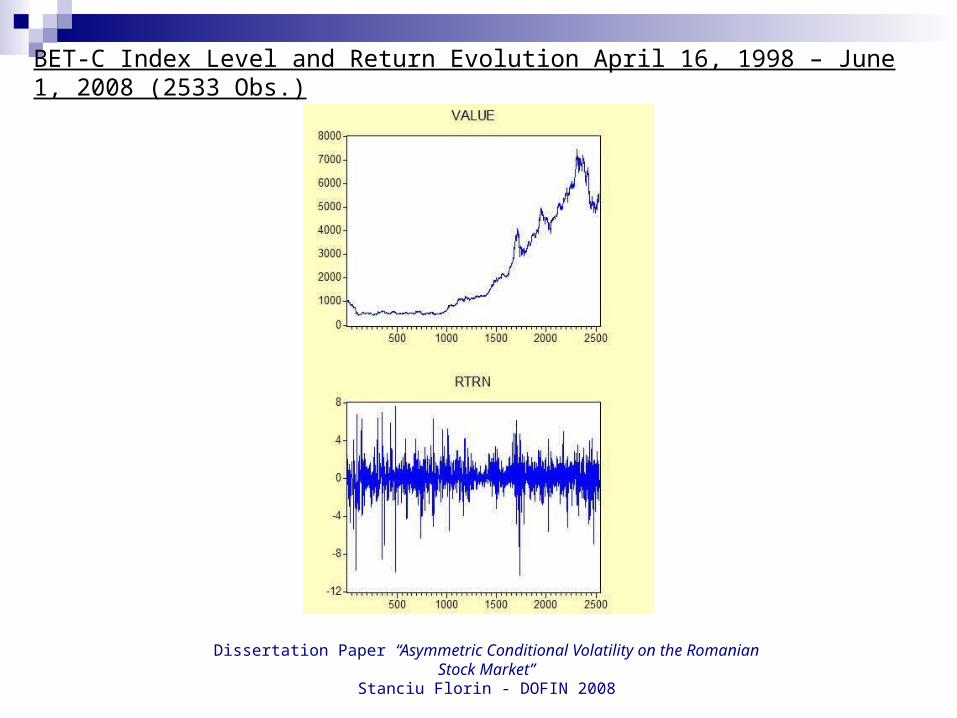
BET-C Index Level and Return Evolution April 16, 1998 – June 1, 2008 (2533 Obs.)
Dissertation Paper “Asymmetric Conditional Volatility on the Romanian Stock Market”Stanciu Florin - DOFIN 2008
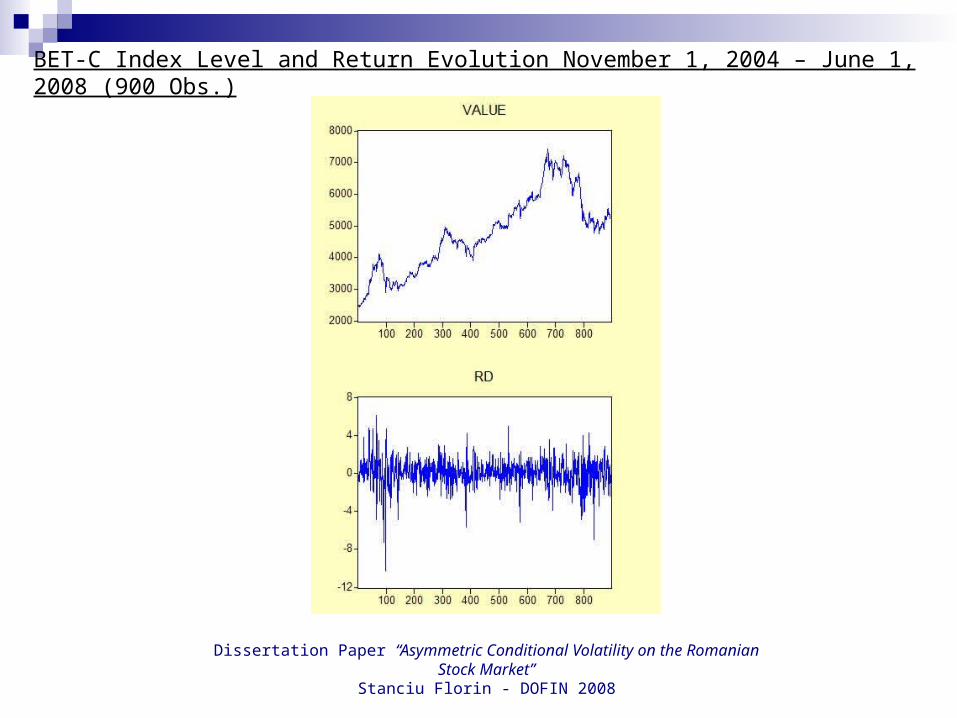
BET-C Index Level and Return Evolution November 1, 2004 – June 1, 2008 (900 Obs.)
Dissertation Paper “Asymmetric Conditional Volatility on the Romanian Stock Market”Stanciu Florin - DOFIN 2008
Remarks
During the period from 1998 to 2004, the index had very low fluctuations for most of this period, staying mainly in the range of 500 points, then rose slowly towards its launch level of 1000 points.
Nevertheless, the standard deviation of the return series was 1.54, higher even than the standard deviation of the return series sample between 2004-2008 (which is 1.48), period in which the index level fluctuated between a minimum of 2.400 points and a maximum of 7.400 points.
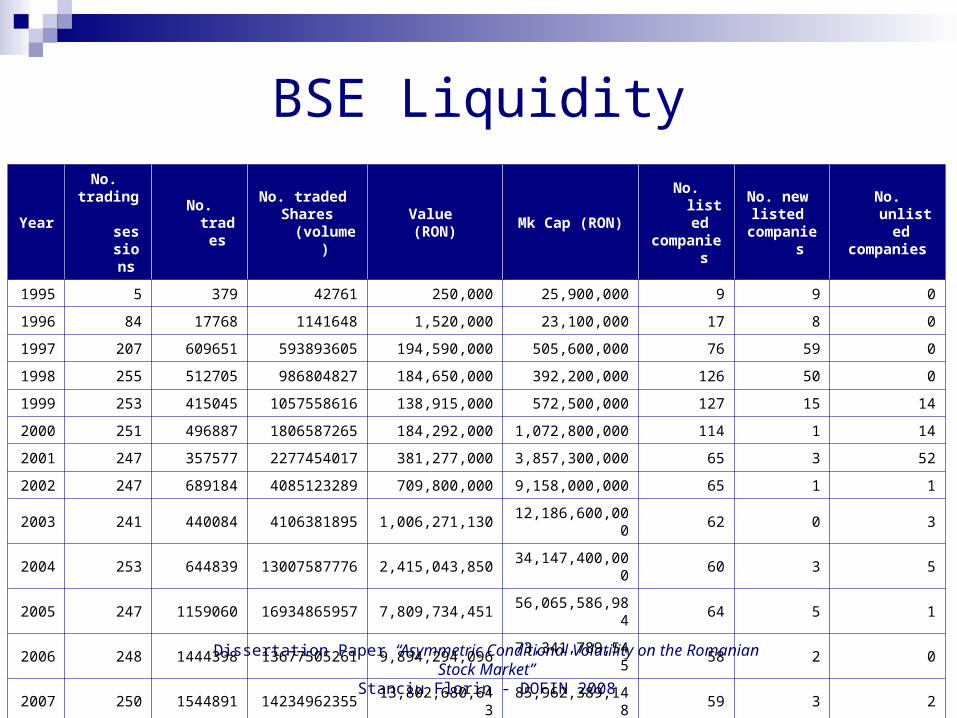
The Romanian stock market was highly undeveloped during its beginning 6 years, as we can also see from the next table.
Dissertation Paper “Asymmetric Conditional Volatility on the Romanian Stock Market”Stanciu Florin - DOFIN 2008
BSE Liquidity
YearNo.
trading sessions
No. trades No. traded Shares (volume)
Value (RON) Mk Cap (RON) No. listed
companies
No. new listed
companies
No. unlisted companies
1995 5 379 42761 250,000 25,900,000 9 9 0
1996 84 17768 1141648 1,520,000 23,100,000 17 8 0
1997 207 609651 593893605 194,590,000 505,600,000 76 59 0
1998 255 512705 986804827 184,650,000 392,200,000 126 50 0
1999 253 415045 1057558616 138,915,000 572,500,000 127 15 14
2000 251 496887 1806587265 184,292,000 1,072,800,000 114 1 14
2001 247 357577 2277454017 381,277,000 3,857,300,000 65 3 52
2002 247 689184 4085123289 709,800,000 9,158,000,000 65 1 1
2003 241 440084 4106381895 1,006,271,130 12,186,600,000 62 0 3
2004 253 644839 13007587776 2,415,043,850 34,147,400,000 60 3 5
2005 247 1159060 16934865957 7,809,734,451 56,065,586,984 64 5 1
2006 248 1444398 13677505261 9,894,294,096 73,341,789,545 58 2 0
2007 250 1544891 14234962355 13,802,680,643 85,962,389,148 59 3 2
2008 129 709717 6318039682 4,467,558,001 107,362,498,765 66 8 1

Dissertation Paper “Asymmetric Conditional Volatility on the Romanian Stock Market”Stanciu Florin - DOFIN 2008
The Methodology GARCH (p ,q) :
Exponential GARCH (p ,q ,r):
Threshold ARCH (p, q, r) :
,where the variable S-t−1 is a dummy variable equal to one if εt−i < 0, and equal to zero otherwise
St. Dev. GARCH (p,q,r) :
, where for i=1,….,r, ; γi =0 for all i>r and
q
iiti
p
iitit hh
11
2
r
k kt
ktk
q
j
p
i it
it
i
jtjt hhhh
11 1
)log()log(
2
111
2it
r
iiti
q
iiti
p
iitit Shh
jt
q
jjitiit
p
iit hh
11
)(
1i pr

Dissertation Paper “Asymmetric Conditional Volatility on the Romanian Stock Market”Stanciu Florin - DOFIN 2008
The Methodology
Partially Non-Parametric ARCH: We divide the range of { ε t } into m intervals with break points τ i. Let m- be the number of
intervals in the range where εt -1 is negative. Also, let m+ be the number of intervals in the
range where εt -1 is positive, so that m = m+ + m-. We denote these boundaries by the
numbers { τ-m,………, τ-1, τ0, τ1,……………. τm}. For convenience and the ability to test symmetry, we
select τ0 = 0.
Pit =1, if εt > τi
= 0, otherwise, and
Nit =1, if εt < τi
= 0 otherwise,
then a piecewise linear specification of the heteroskedasticity function is :
m
i
m
iititiitititt NPhh
0 011111 )()(
Dissertation Paper “Asymmetric Conditional Volatility on the Romanian Stock Market”Stanciu Florin - DOFIN 2008
Data preliminary statistics
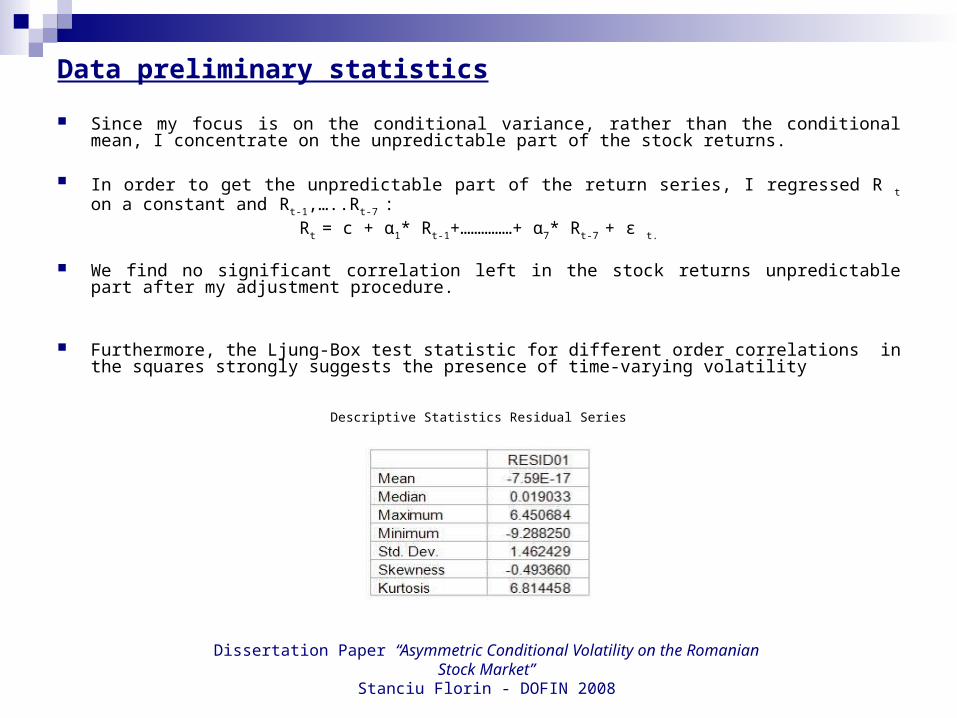
Since my focus is on the conditional variance, rather than the conditional mean, I concentrate on the unpredictable part of the stock returns.
In order to get the unpredictable part of the return series, I regressed R t on a constant and Rt-1,…..Rt-7 :
Rt = c + α1* Rt-1+……………+ α7* Rt-7 + ε t.
We find no significant correlation left in the stock returns unpredictable part after my adjustment procedure.
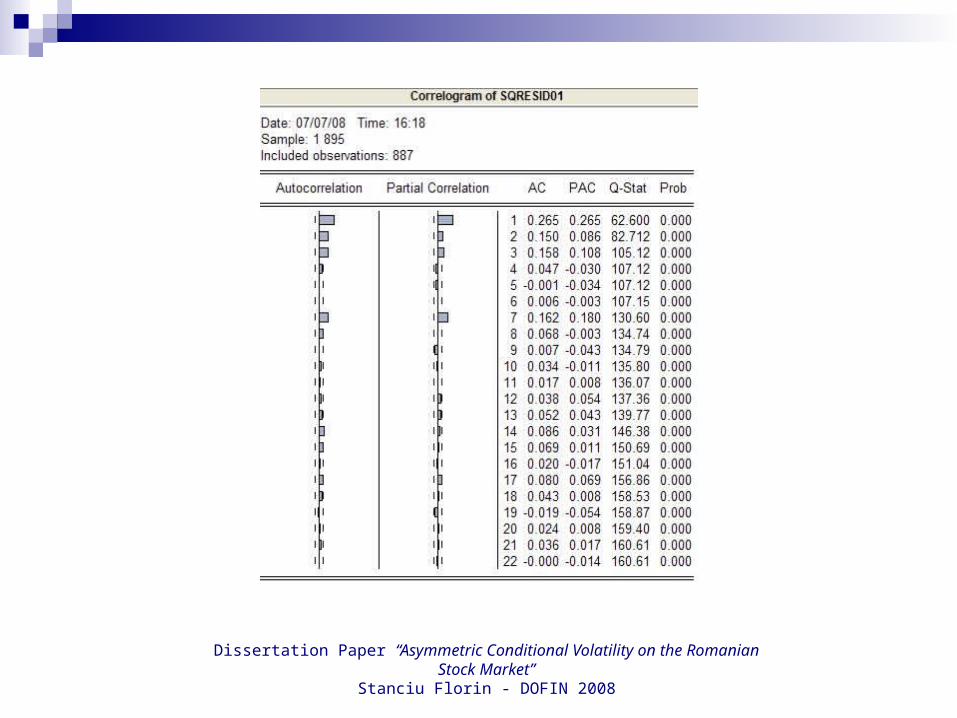
Furthermore, the Ljung-Box test statistic for different order correlations in the squares strongly suggests the presence of time-varying volatility
Descriptive Statistics Residual Series

Dissertation Paper “Asymmetric Conditional Volatility on the Romanian Stock Market”Stanciu Florin - DOFIN 2008
Data preliminary statistics
Dissertation Paper “Asymmetric Conditional Volatility on the Romanian Stock Market”Stanciu Florin - DOFIN 2008
Dissertation Paper “Asymmetric Conditional Volatility on the Romanian Stock Market”Stanciu Florin - DOFIN 2008
Empirical Results – Model Estimation
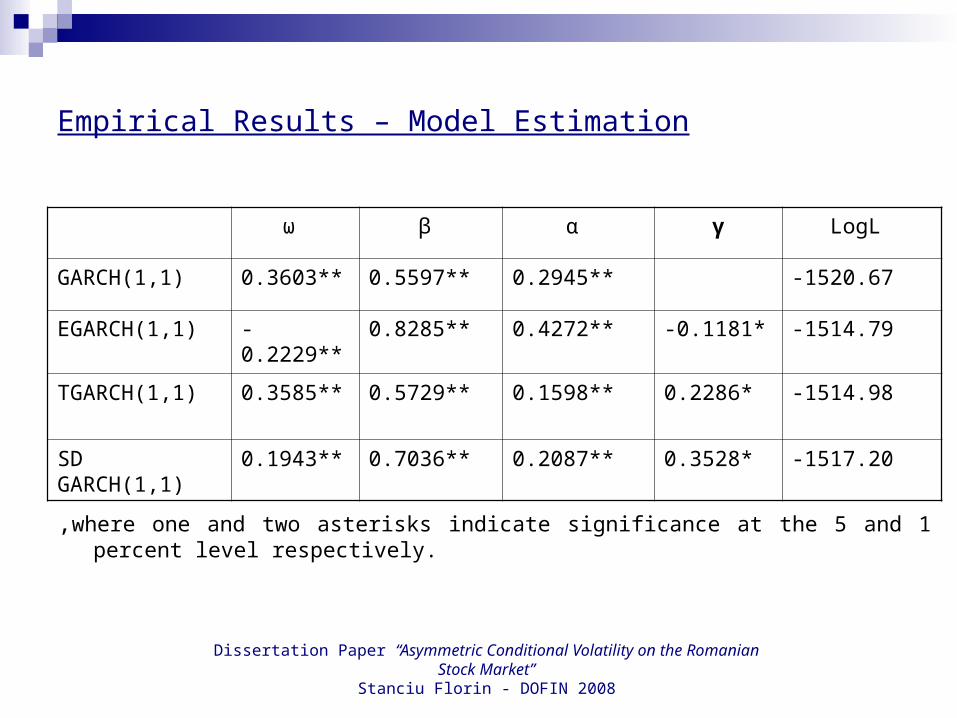
ω β α γ LogL
GARCH(1,1) 0.3603** 0.5597** 0.2945** -1520.67
EGARCH(1,1) -0.2229** 0.8285** 0.4272** -0.1181* -1514.79
TGARCH(1,1) 0.3585** 0.5729** 0.1598** 0.2286* -1514.98
SD GARCH(1,1) 0.1943** 0.7036** 0.2087** 0.3528* -1517.20
,where one and two asterisks indicate significance at the 5 and 1 percent level respectively.
Dissertation Paper “Asymmetric Conditional Volatility on the Romanian Stock Market”Stanciu Florin - DOFIN 2008
Remarks The estimation results indicate that the parameters corresponding to the εt-1/ term in the EGARCH,
the parameter corresponding to the St-1- εt-1
2 term in the TARCH and the parameter corresponding to εt-1
term in the SDGARCH are all significant and of right signs, using both standard and robust standard errors. All these results are consistent with the hypothesis that negative return shocks cause higher volatility than positive return shocks.
The standard GARCH(1, 1) has a lower log-likelihood than both of these leverage or asymmetric models. On average, a negative shock raises the next period’s conditional volatility more than two times than a
positive shock of equal magnitude. All the previous estimation is based on robust standard errors from the maximum likelihood estimation,
employing the procedures described in Bollerslev and Wooldridge (1992) The level of significance I obtain for the coefficients of the model terms governing asymmetry is highly
significant with asymptotic standard errors (1% level of significance), and significant with robust standard errors (5% level of significance).
Robust t-ratios are designed to be insensitive to departures from normality, especially extreme observations. The effects of significant spikes in volatility on asymptotic t-ratios and robust t-ratios are dramatically different (McAleer and Ng (2002)). Each spike in volatility increases the asymptotic t-ratios but decreases the robust t-ratios, with the magnitudes of the shifts being far greater for the asymptotic t-ratios.
The conclusion I draw is that there is asymmetric volatility in the daily BET-C return series for the last 4 years, with the note that it is probably partly determined by the presence of extreme observations. The kurtosis of the unpredictable stock returns series is quite high at 6.81 and that is strong evidence that the extremes are more substantial than would be expected from a normal random variable.
1th

Dissertation Paper “Asymmetric Conditional Volatility on the Romanian Stock Market”Stanciu Florin - DOFIN 2008
Empirical Results – Model Estimation
Dissertation Paper “Asymmetric Conditional Volatility on the Romanian Stock Market”Stanciu Florin - DOFIN 2008
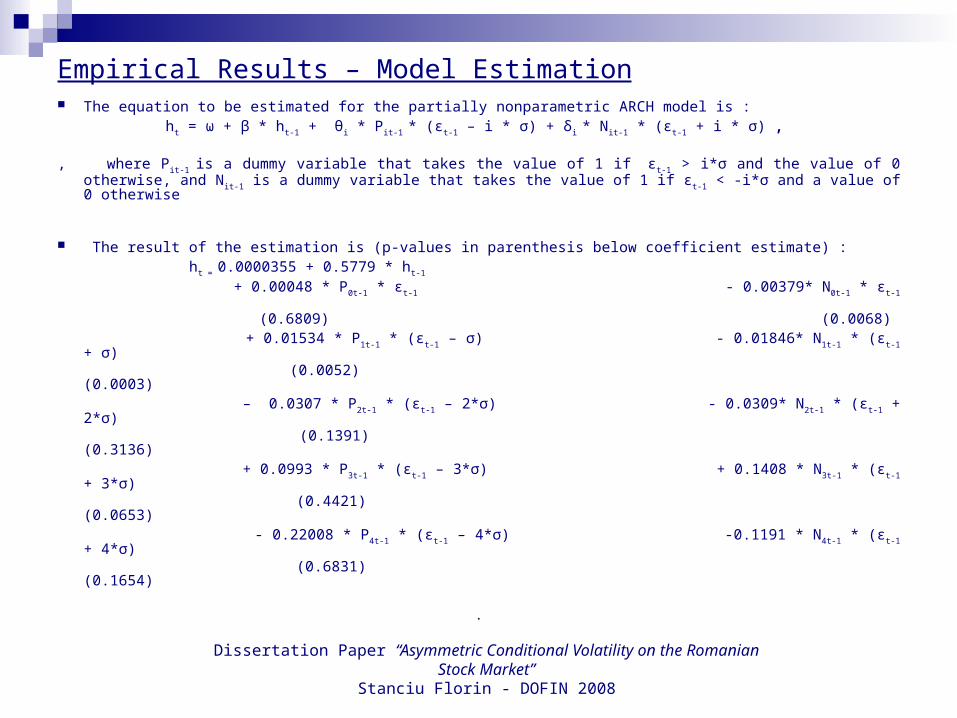
Empirical Results – Model Estimation The equation to be estimated for the partially nonparametric ARCH model is :
ht = ω + β * ht-1 + θi * Pit-1 * (εt-1 – i * σ) + δi * Nit-1 * (εt-1 + i * σ) ,
, where Pit-1 is a dummy variable that takes the value of 1 if εt-1 > i*σ and the value of 0 otherwise, and Nit-1 is a dummy variable that takes the value of 1 if ε t-1 < -i*σ and a value of 0 otherwise
The result of the estimation is (p-values in parenthesis below coefficient estimate) : ht = 0.0000355 + 0.5779 * ht-1 + 0.00048 * P0t-1 * εt-1 - 0.00379* N0t-1 * εt-1 (0.6809) (0.0068) + 0.01534 * P1t-1 * (εt-1 – σ) - 0.01846* N1t-1 * (εt-1 + σ) (0.0052) (0.0003) – 0.0307 * P2t-1 * (εt-1 – 2*σ) - 0.0309* N2t-1 * (εt-1 + 2*σ) (0.1391) (0.3136) + 0.0993 * P3t-1 * (εt-1 – 3*σ) + 0.1408 * N3t-1 * (εt-1 + 3*σ) (0.4421) (0.0653) - 0.22008 * P4t-1 * (εt-1 – 4*σ) -0.1191 * N4t-1 * (εt-1 + 4*σ) (0.6831) (0.1654)
.
Dissertation Paper “Asymmetric Conditional Volatility on the Romanian Stock Market”Stanciu Florin - DOFIN 2008
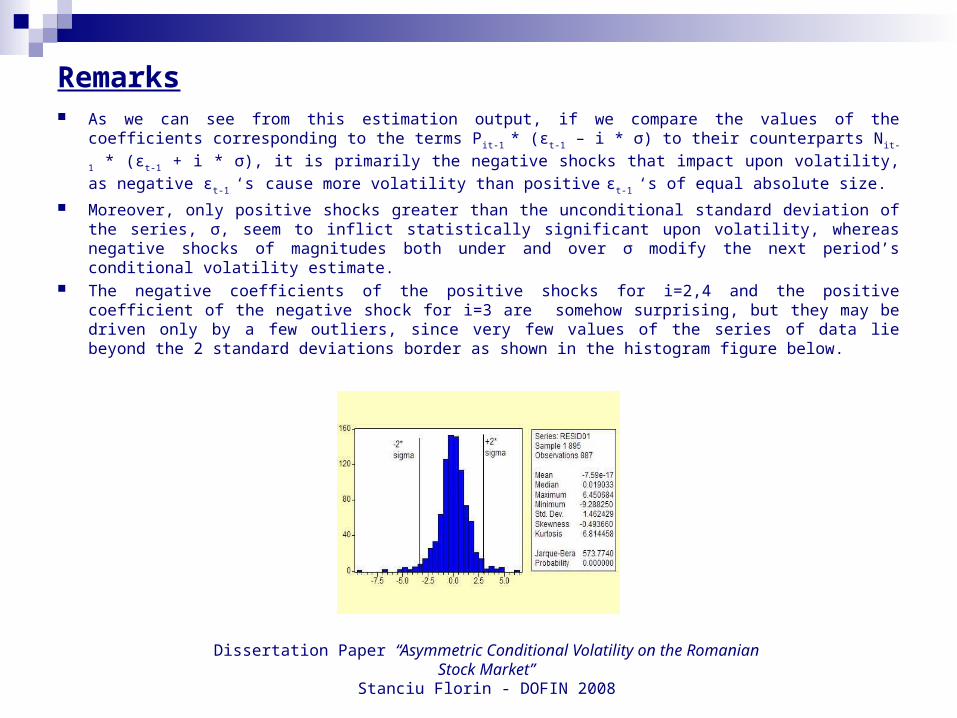
Remarks As we can see from this estimation output, if we compare the values of the coefficients
corresponding to the terms Pit-1 * (εt-1 – i * σ) to their counterparts Nit-1 * (εt-1 + i * σ), it is primarily
the negative shocks that impact upon volatility, as negative ε t-1 ‘s cause more volatility than
positive εt-1 ‘s of equal absolute size.
Moreover, only positive shocks greater than the unconditional standard deviation of the series, σ, seem to inflict statistically significant upon volatility, whereas negative shocks of magnitudes both under and over σ modify the next period’s conditional volatility estimate.
The negative coefficients of the positive shocks for i=2,4 and the positive coefficient of the negative shock for i=3 are somehow surprising, but they may be driven only by a few outliers, since very few values of the series of data lie beyond the 2 standard deviations border as shown in the histogram figure below.
Dissertation Paper “Asymmetric Conditional Volatility on the Romanian Stock Market”Stanciu Florin - DOFIN 2008
Empirical Results – Model Estimation
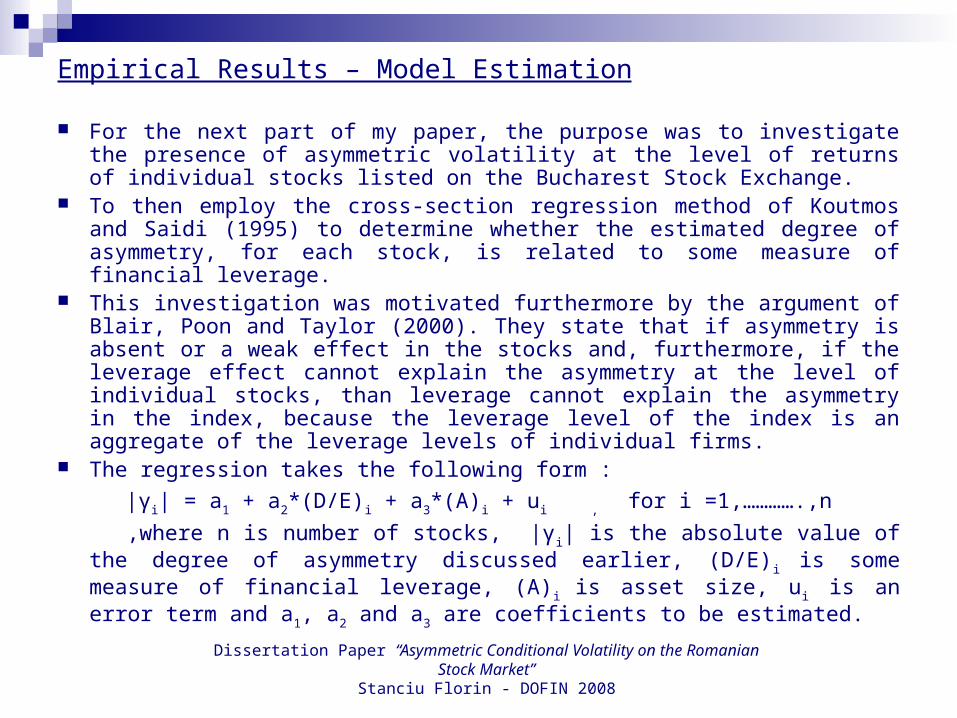
For the next part of my paper, the purpose was to investigate the presence of asymmetric volatility at the level of returns of individual stocks listed on the Bucharest Stock Exchange.
To then employ the cross-section regression method of Koutmos and Saidi (1995) to determine whether the estimated degree of asymmetry, for each stock, is related to some measure of financial leverage.
This investigation was motivated furthermore by the argument of Blair, Poon and Taylor (2000). They state that if asymmetry is absent or a weak effect in the stocks and, furthermore, if the leverage effect cannot explain the asymmetry at the level of individual stocks, than leverage cannot explain the asymmetry in the index, because the leverage level of the index is an aggregate of the leverage levels of individual firms.
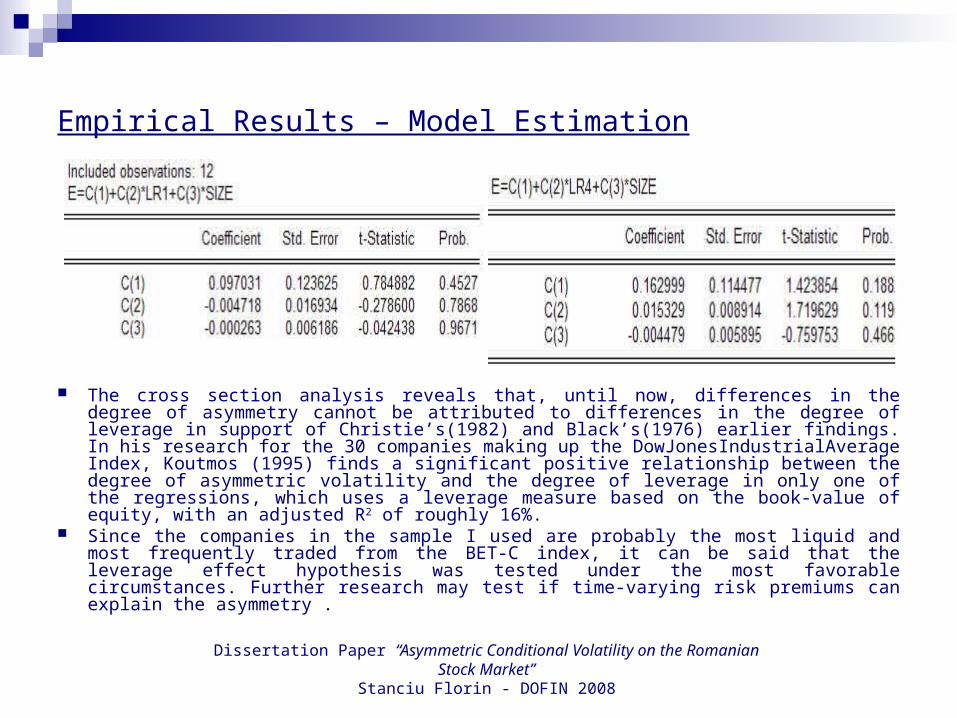
The regression takes the following form :
|γi| = a1 + a2*(D/E)i + a3*(A)i + ui , for i =1,………….,n
,where n is number of stocks, |γi| is the absolute value of the degree of asymmetry discussed earlier, (D/E)i is some measure of financial leverage, (A)i is asset size, ui is an error term and a1, a2 and a3 are coefficients to be estimated.
Dissertation Paper “Asymmetric Conditional Volatility on the Romanian Stock Market”Stanciu Florin - DOFIN 2008
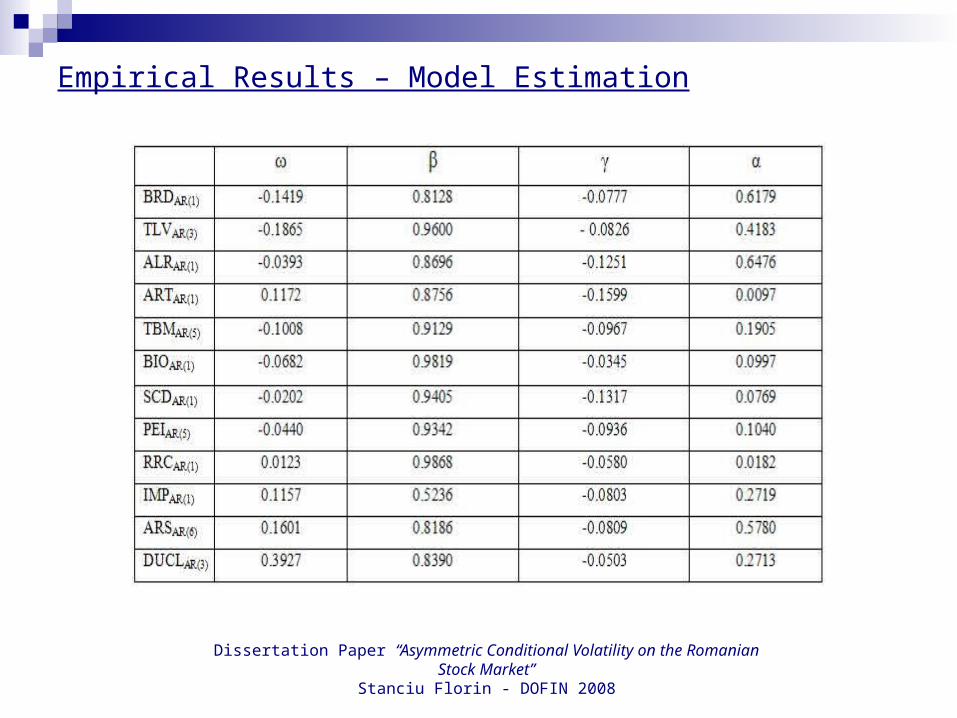
Empirical Results – Model Estimation
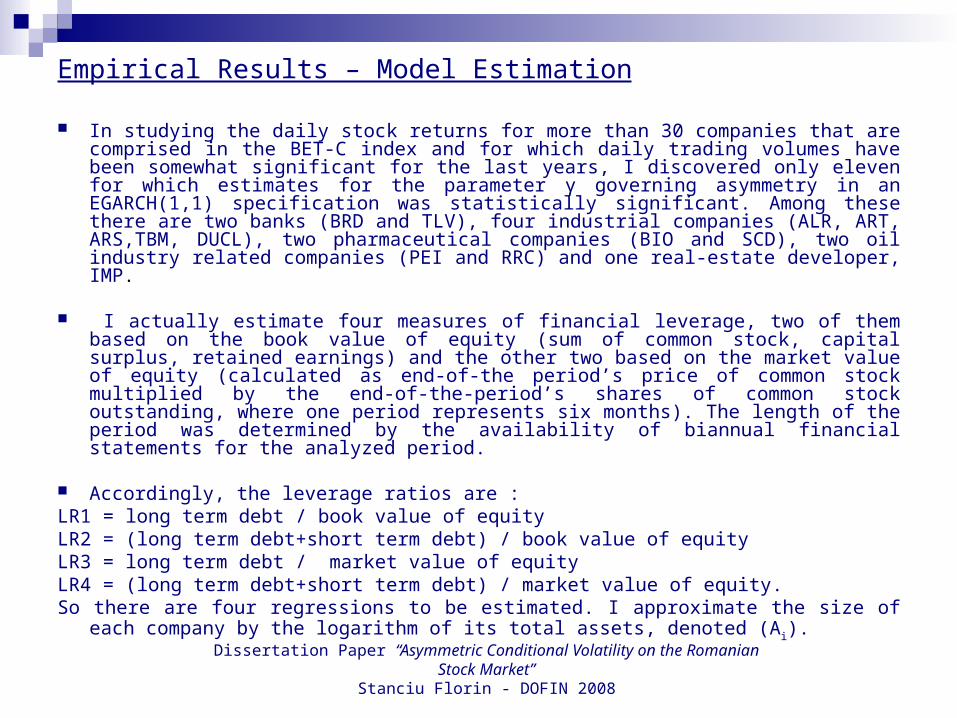
In studying the daily stock returns for more than 30 companies that are comprised in the BET-C index and for which daily trading volumes have been somewhat significant for the last years, I discovered only eleven for which estimates for the parameter γ governing asymmetry in an EGARCH(1,1) specification was statistically significant. Among these there are two banks (BRD and TLV), four industrial companies (ALR, ART, ARS,TBM, DUCL), two pharmaceutical companies (BIO and SCD), two oil industry related companies (PEI and RRC) and one real-estate developer, IMP.
I actually estimate four measures of financial leverage, two of them based on the book value of equity (sum of common stock, capital surplus, retained earnings) and the other two based on the market value of equity (calculated as end-of-the period’s price of common stock multiplied by the end-of-the-period’s shares of common stock outstanding, where one period represents six months). The length of the period was determined by the availability of biannual financial statements for the analyzed period.
Accordingly, the leverage ratios are :LR1 = long term debt / book value of equityLR2 = (long term debt+short term debt) / book value of equityLR3 = long term debt / market value of equityLR4 = (long term debt+short term debt) / market value of equity.So there are four regressions to be estimated. I approximate the size of each company by
the logarithm of its total assets, denoted (Ai).
Dissertation Paper “Asymmetric Conditional Volatility on the Romanian Stock Market”Stanciu Florin - DOFIN 2008
Empirical Results – Model Estimation
Dissertation Paper “Asymmetric Conditional Volatility on the Romanian Stock Market”Stanciu Florin - DOFIN 2008
Empirical Results – Model Estimation
The cross section analysis reveals that, until now, differences in the degree of asymmetry cannot be attributed to differences in the degree of leverage in support of Christie’s(1982) and Black’s(1976) earlier findings. In his research for the 30 companies making up the DowJonesIndustrialAverage Index, Koutmos (1995) finds a significant positive relationship between the degree of asymmetric volatility and the degree of leverage in only one of the regressions, which uses a leverage measure based on the book-value of equity, with an adjusted R2 of roughly 16%.
Since the companies in the sample I used are probably the most liquid and most frequently traded from the BET-C index, it can be said that the leverage effect hypothesis was tested under the most favorable circumstances. Further research may test if time-varying risk premiums can explain the asymmetry .
Dissertation Paper “Asymmetric Conditional Volatility on the Romanian Stock Market”Stanciu Florin - DOFIN 2008
Concluding Remarks
In studying the evolution of the most comprising index on the Romanian Stock Market, the BET-C Index, I find proof of asymmetric response of the conditional variance of the index to negative and positive shocks, for the latter part of its history, November 1, 2004 through June 1, 2008 .
I attribute this finding to significant changes in terms of stock market development from the preavious period of April 16, 1998 (index launch date) through to December 2003, as testing for asymmetric volatility for the whole historical period of the BET-C index proves unsatisfactory in terms of detecting asymmetry.
In part, the asymmetry is determined by significant spikes in volatility as shown by McAleer and Ng. The nonparametric approach which allows the data series to unveil the news impact curve directly also shows that it is primarily negative shocks that raise the next period’s conditional variance.
In the last part of my paper I test if variations in the degree of financial leverage among a sample of twelve individual stocks from the BET-C index that exhibit asymmetric volatility can explain the variations in the degree of asymmetry. I find no proof of such a dependency so future research should concentrate on the time-varying risk premium theory.
Dissertation Paper “Asymmetric Conditional Volatility on the Romanian Stock Market”Stanciu Florin - DOFIN 2008
References Bekaert Geert and C.R. Harvey (1997), “Emerging Equity Market Volatility”, Journal of
Financial Economics, 29-77 Bekaert G. and Guojun W., (2000), “Asymmetric Volatility and Risk in Equity Markets”
, The Review of Financial Studies, vol 13, no. 1, 1-42 Bollerslev T. (1987), “A Conditionally Heteroskedastic Time Series Model for
Speculative Prices and Rates of Return”, The Review of Economics and Statistics, Vol. 69, No. 3, pp. 542-547
Campbell J.Y. and L. Hentschel (1991), “No News is Good News : An Asymmetric Model of Changing Volatility in Stock Returns “, NBER Working Paper no. 3742
Chiang C.T. and Doong S., (2001) , “Empirical Analysis of Stock Returns and Volatility: Evidence from Seven Asian Stock Markets Based on TAR-GARCH Model”, Review of Quantitative Finance and Accounting, 17, 301–318
Christie A.A.(1982), “The Stochastic Behaviour of Common Stock Variances – Value, Leverage and Interest Rate Effects”, Journal of Financial Economics, 10, 407-432
Engle R.., and V.K. Ng. (1993), “Measuring and Testing the Impact of News on Volatility” , The Journal of Finance, Vol. 48, No. 5, pp. 1749-1778
Engle R. (2004), “Risk and Volatility : Econometric Models and Financial Practice”, The American Economic Review, vol. 94, no. 3, 405-420
Dissertation Paper “Asymmetric Conditional Volatility on the Romanian Stock Market”Stanciu Florin - DOFIN 2008
References
French K., Schwert G. and Stambaugh R. (1987) , “Expected Stock returns and Volatility”, Journal of Financial Economics, 19, 3-29
Glosten L., Jagannathan R. and Runkle D. (1993) , “On the Relation between the Expected Value and the Volatility of the Nominal Excess Return on Stocks” , Journal of Finance, Vol. 48, No. 5, pp. 1779-1801.
Guoujun W. (2001), “The Determinants of Asymmetric Volatility” , The Review of Financial Studies, Vol. 14, No. 3, pp. 837-859
Koutmos G. (1998) , “Asymmetries in the Conditional Mean and the Conditional Variance: Evidence From Nine Stock Markets” , Journal of Economics and Business , 50, 277–290
Nelson B. Daniel (1991), “Conditional Heteroskedasticity in Asset Returns: A New Approach”, Econometrica, Vol. 59, No. 2, (Mar., 1991), pp. 347-370
Pindyck S.R. (1984), “Risk, Inflation, and the Stock Market” , The American Economic Review, Vol. 74, No. 3, pp. 335-351
Rabemananjara R. and Zakoian J. M. (1993), “Threshold Arch Models and Asymmetries in Volatility”, Journal of Applied Econometrics, Vol. 8, No. 1, (Jan. - Mar., 1993), pp. 31-49.