Embed Size (px)
Citation preview

Wefer, G., Berger, W.H., and Richter, C. (Eds.)Proceedings of the Ocean Drilling Program, Scientific Results Volume 175
9. DATA REPORT: SEDIMENTATION RATES FROM MILANKOVITCH PERIODICITY
IN LOG AND GRA BULK DENSITY RECORDS
OFF SOUTHWEST AFRICA, SITES 1081, 1082, AND 10841
T.J. Gorgas,2 J.D. Kronen Jr.,2 and R.H. Wilkens3
ABSTRACT
Sedimentation rates (SR) off the southwest African coast were calcu-lated by performing spectral analyses on borehole and gamma-rayattenuation (GRA) wet bulk density records. Our SR profiles, calculatedfor selected Sites 1081, 1082, and 1084, Ocean Drilling Program Leg175, were consistent with those obtained from biostratigraphic analysesin both depth and time domain. However, our calculations revealedgreater details in SR variations than those obtained from biostratigra-phy because of a much higher sampling rate of GRA bulk density andwell-log measurements. We generated high-resolution SR profiles by ap-plying a fast Fourier transform on the autocorrelation function, whichwas moved over the wet bulk density records. Our method relies on thecorrect identification of spectral peaks that coincide with Milankovitchcycles. The detection of main orbital periods, namely precession (19 to23 k.y.), obliquity (41 k.y.), and eccentricity (100 k.y.), allows the con-version of cycles per meter into SR values (meters per million years). In-version and integration of these SR values yielded high-resolution SRprofiles in the time domain.
We calculated a maximal age of ~9.0 Ma for sediments on the WalvisRidge (Site 1081), and 5.6 and 4.6 Ma in the Walvis Basin (Sites 1082and 1084, respectively). Sedimentation cycles in the Milankovitchwaveband characterized our power spectra at all sites. Waxing and wan-
1Gorgas, T.J., Kronen, J.D., and Wilkens, R.H., 2001. Data report: Sedimentation rates from Milankovitch periodicity in log and GRA bulk density records off southwest Africa, Sites 1081, 1082, and 1084. In Wefer, G., Berger, W.H., and Richter, C. (Eds.), Proc. ODP, Sci. Results, 175, 1–23 [Online]. Available from World Wide Web: <http://www-odp.tamu.edu/publications/175_SR/VOLUME/CHAPTERS/SR175_09.PDF> [Cited YYYY-MM-DD]2Department of Geology and Geophysics, SOEST, University of Hawaii, 1680 East-West Road, Honolulu HI 96822, USA. Correspondence author: [email protected] of Naval Research Code 322-GG, 800 North Quincy Street, Arlington VA 22217-5660, USA.
Initial receipt: 2 February 2000Acceptance: 14 September 2000Web publication: 10 April 2001Ms 175SR-208

T.J. GORGAS ET AL.DATA REPORT: SEDIMENTATION RATES FROM MILANKOVITCH PERIODICITY 2
ing of the cycle amplitudes were interpreted as variations in orbitalforcing that has influenced heterogeneously local changes in biopro-ductivity and upwelling vigor across the study area. Time segments ofhigh deposition before 1.2 Ma correlated strongly with a contempor-aneous presence of all three Milankovitch cycles, whereas low SR valueswere noticed when not all of the main cycles coexisted. However, after1.2 Ma, the correspondence between spectral and deposition patternswas less consistent than before.
We tested our methodology on synthetic density compaction curvesthat were perturbed with known frequencies. This enabled us to investi-gate the influence of variable Fourier and autocorrelation windows,smooth factors, noise contamination, and aliasing effects on our re-sults. These models were aimed to optimize our technique in resolvingthe correct depositional rates at our selected sites by quantifyingMilankovitch cyclicity in wet bulk density records.
INTRODUCTION
Orbital climate forcing has long been accepted as one main factor inmodifying physical properties of marine sediments and oxygen isotopeprofiles in a cyclic pattern (Shackleton, 1987; Jansen et al., 1991; Berger,Kroenke, Mayer, et al., 1993; de Boer and Smith, 1994; Cooper, 1995;Kronen and Wilkens, pers. comm., 2000). The study of cyclic variabilityin marine sediments has enhanced our knowledge of glacio-eustaticand tectonic processes over time (Diester-Haass et al., 1992; Wright andMiller, 1993; Clark et al., 1999; Krijgsman et al., 1999).
We investigated the nature of Milankovitch cyclicity in the form ofdensity variations in hemipelagic sediments off the southwest Africancoast to obtain a detailed sedimentation rate (SR) history for our studyarea. We aim to contribute knowledge about the evolution of the Ben-guela Current upwelling system (BCUS), a coastal upwelling center thatis comparable to other large upwelling systems in the world (Berger etal., 1999). We analyzed wireline and gamma-ray attenuation (GRA)bulk density (Boyce, 1976; Gerland and Villanger, 1995), which, in gen-eral, provide high-resolution records over long intervals that are quicklyobtained and cost effective. For this study we focused on log and GRAbulk density from Ocean Drilling Program (ODP) Sites 1081, 1082, and1084 (Fig. F1) drilled during Leg 175. The increased sampling rate of logand GRA bulk density at these sites yielded SR histories of greater detailthan those obtained from biostratigraphy.
Hemipelagic clays and oozes at Sites 1081, 1082, and 1084 are com-posed of a varying abundance of diatoms, foraminifers, radiolarians,and nannofossils (Wefer, Berger, Richter, et al., 1998). Our data analyseson these sediment records revealed a cyclic variability in density, whichwe attributed to orbital forcing in accord with the Milankovitch peri-ods. Variations in density generally observed in geophysical logs arecaused by changes in the microstructure of the sediment, which influ-ence physical properties such as porosity, grain size distribution, andtype of grain contacts of the sediment (Kronen and Wilkens, pers.comm., 2000). At our study sites the abundance of large foraminifersrelative to fine-grained nannofossil ooze (Fig. F2) is linked to biopro-ductivity and dissolution (Mayer, 1979; Berger and Mayer, 1987; Mey-ers, 1992) and to diagenetic processes (Wilkens and Handyside, 1985).We suspect that a variable abundance of calcareous foraminifers atthese sites (Fig. F2) strongly influences the local variability in density.
0°E 10° 20°
30°
20° S
-5000
-500
0
-5000
-5000
-5000
-5000
-5000
-5000
-5000
-400
0
-4000
-4000
-400
0
-4000-3
000
-300
0-3000
-3000
-2000
-2000
-1000
1081
1082
1084
Walv
is Rid
ge
Walvis Basin
-200
0
Africa
F1. Locations of Sites 1081, 1082, and 1084, p. 11.
200 µm
1081A
1082A
A
B
200 µm
F2. SEM microstructure images, p. 12.

T.J. GORGAS ET AL.DATA REPORT: SEDIMENTATION RATES FROM MILANKOVITCH PERIODICITY 3
Therefore, we suspect that rhythmic variations in our sediment depositsalong the BCUS are linked to the presence of these calcareous microfos-sils, which maintain intratest porosity to great depths.
METHODS
Log density was acquired during Leg 175 with the Schlumbergerlithodensity tool (HLDT) at depth intervals of ~0.15 m (Wefer, Berger,Richter, et al., 1998). GRA bulk density was scanned on board on un-split cores every 0.02 to 0.04 m to calculate wet bulk density by measur-ing the amount of gamma-ray attenuation within the formation(Boyce, 1976; Gerland and Villinger, 1995). Density contrasts of asmuch as 0.8 g/cm3 within thin dolomite horizons at Sites 1081 (Fig.F3A), 1082, and 1084 introduced broadband frequency noise into thepower spectra. This noise is similar in character to the Fourier transformof a delta function, showing equal amplitudes throughout the entirefrequency spectrum (Smith, 1997). By analyzing cyclic perturbations insynthetic density curves, we found that noise induced by strong densitycontrasts did not inhibit the correct detection of spectral peaks. A re-moval of these maximum peaks was disregarded because it would haveartificially introduced interruptions in the continuous sediment profile.Subsequent interpolation between all data points and resampling of theentire profile yielded a data point spacing of 0.1524 m for log density(Fig. F3A) and 0.0400 m for the GRA bulk density profiles in the depthdomain. A smooth factor, similar to a moving average function, was ap-plied to this resampled density profile (Fig. F3A), which enhanced orreduced certain frequency components. Ideally, the choice of thesmooth factor preserved the contemporaneous coexistence of all mainorbital periods. We then subtracted the interpolated, smoothed datafrom the nonsmoothed interpolated profile. We obtained an interpo-lated residual density record (Fig. F3B), on which we performed ourspectral analyses (Fig. F4). Our spectral analysis method consisted of ap-plying a fast Fourier transform (FFT) on the autocorrelation function(Pisias et al., 1973). In this study, we calculated the autocorrelationfunction over a data window of ~40 m in length (256 points for logdensity and 1024 points for GRA bulk density records) and applied theFFT (usually 1024 points for log density and 2048 points for GRA bulkdensity profiles) at the midpoint of this window. Autocorrelation andFFT windows were sufficiently long enough to resolve all main orbitalcycles in the frequency domain. The autocorrelation window waspassed over the density profile, with a step size of 1.125 m. As a result,each step overlapped the subsequent one to generate a high-resolutionprofile of evolutionary power spectra over depth.
We extracted SR values (in meters per millions of years) from log andGRA bulk density records by dividing the number of cycles per millionyears of the individual orbital periods (e.g., obliquity at 41 k.y. occurs~24 times in 1 m.y.) by their corresponding frequencies (cycles permeter) in our spectra (Fig. F4). We used biostratigraphy as a guide(Berger, Kroenke, Mayer, et al., 1993; Wefer, Berger, Richter, et al., 1998)to provide a working limit or range of SR values, and to facilitate in theidentification of orbital parameter frequencies (Kronen and Wilkens,pers. comm., 2000). Calculated SR values were inverted to million yearsper meter and integrated over depth to generate a high-resolution SRprofile as a function of time. We then performed spectral analyses onlog and GRA residual bulk density profiles in the time domain to delin-
Smoothed data
Log density
0.15
0.10
0.05
0.00
-0.05
-0.10
450400350300250200150100
Depth (mbsf)
Log density
2.4
2.2
2.0
1.8
1.6
1.4
Site 1081A
B
Den
sity
(g/
cm3 )
Data with dolomite horizons
Res
idua
l den
sity
(g/
cm3 )
F3. Log density data, Hole 1081A, p. 13.
Site 1081
Site 1082
Site 1084
A
B
C
Nor
mal
ized
am
plitu
de
400
k.y.
41 k
.y.
23 k
.y.
100
k.y.
19 k
.y.
1.21.00.80.60.40.20.0
Cycles/m
1.0
0.8
0.6
0.4
0.2
0.0
1.0
0.8
0.6
0.4
0.2
0.0
400
k.y.
41 k
.y.
23 k
.y.
100
k.y.
19 k
.y.
400
k.y.
41 k
.y.
23 k
.y.
100
k.y.
19 k
.y.
1.0
0.8
0.6
0.4
0.2
0.0
Nor
mal
ized
am
plitu
deN
orm
aliz
ed a
mpl
itude
F4. Power spectra of log density in the depth domain, p. 14.
T.J. GORGAS ET AL.DATA REPORT: SEDIMENTATION RATES FROM MILANKOVITCH PERIODICITY 4
eate the individual orbital cycles. Similar to our data preparation in thedepth domain, we resampled the data in the time domain to an equalspacing of 2.0 k.y. The autocorrelation window, which was at least 400k.y. long to capture both short and long cycles, was passed over the re-sidual density records with a step size of 6 k.y.
For some depth intervals, biostratigraphic SR and calculated valuesmatched very closely so that spectral peaks aligned well with most ofthe Milankovitch periods (Fig. F4A, F4B). In cases when spectral peaksmatched only with one of the Milankovitch cycles in the depth domain(Fig. F4C), we checked whether a different smooth function would en-hance other frequencies, or whether only one frequency componentwas dominant. If a change in the smooth factor did not alter our result,autocorrelation windows were expanded in the depth and time domainto capture more cycles per meter and cycles per million years. In a laststep, SR values were fine-tuned in the depth domain, which in returnimproved the alignment of power spectra with Milankovitch cycles inthe time domain. This iterative process optimized the detection of ex-cursions in calculated SR values that often differed from rates estab-lished through biostratigraphy. We wanted to ensure the validity of ourtechnique, by applying spectral analyses on synthetic density compac-tion curves that were perturbed with known frequencies. These modelstudies provided an opportunity to test how the accuracy of our resultswas affected by variation of the individual analysis parameters, and willbe discussed below.
RESULTS
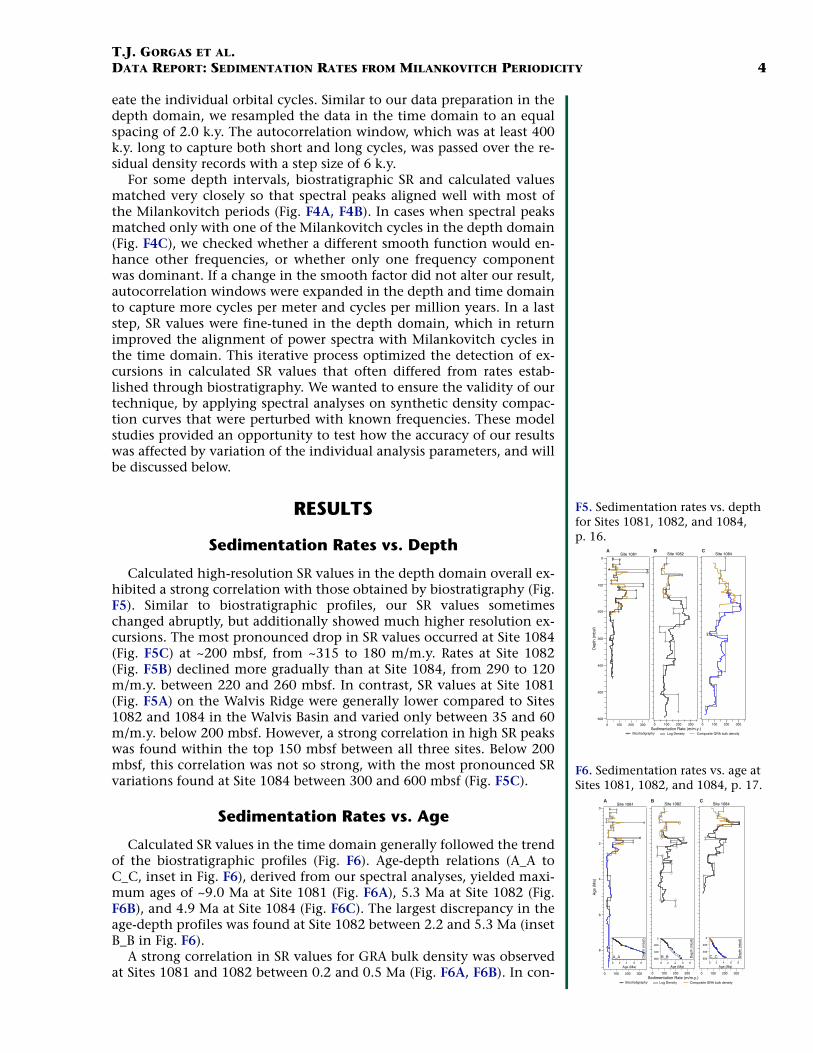
Sedimentation Rates vs. Depth
Calculated high-resolution SR values in the depth domain overall ex-hibited a strong correlation with those obtained by biostratigraphy (Fig.F5). Similar to biostratigraphic profiles, our SR values sometimeschanged abruptly, but additionally showed much higher resolution ex-cursions. The most pronounced drop in SR values occurred at Site 1084(Fig. F5C) at ~200 mbsf, from ~315 to 180 m/m.y. Rates at Site 1082(Fig. F5B) declined more gradually than at Site 1084, from 290 to 120m/m.y. between 220 and 260 mbsf. In contrast, SR values at Site 1081(Fig. F5A) on the Walvis Ridge were generally lower compared to Sites1082 and 1084 in the Walvis Basin and varied only between 35 and 60m/m.y. below 200 mbsf. However, a strong correlation in high SR peakswas found within the top 150 mbsf between all three sites. Below 200mbsf, this correlation was not so strong, with the most pronounced SRvariations found at Site 1084 between 300 and 600 mbsf (Fig. F5C).
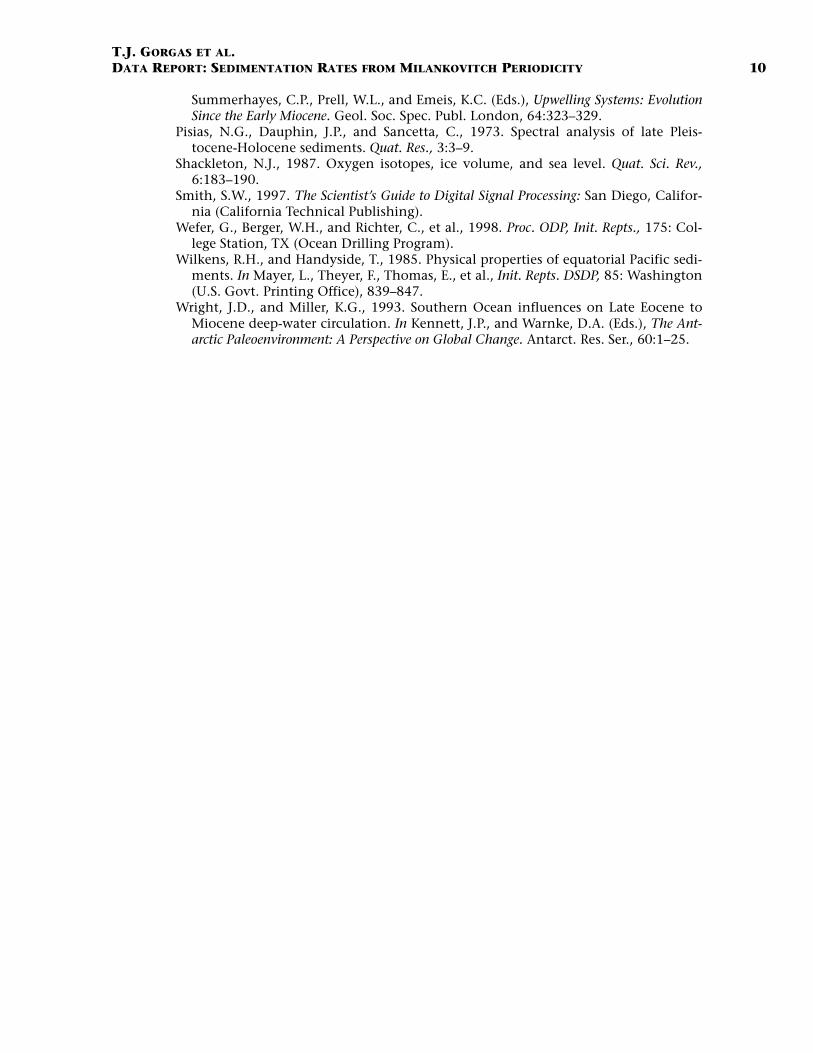
Sedimentation Rates vs. Age
Calculated SR values in the time domain generally followed the trendof the biostratigraphic profiles (Fig. F6). Age-depth relations (A_A toC_C, inset in Fig. F6), derived from our spectral analyses, yielded maxi-mum ages of ~9.0 Ma at Site 1081 (Fig. F6A), 5.3 Ma at Site 1082 (Fig.F6B), and 4.9 Ma at Site 1084 (Fig. F6C). The largest discrepancy in theage-depth profiles was found at Site 1082 between 2.2 and 5.3 Ma (insetB_B in Fig. F6).
A strong correlation in SR values for GRA bulk density was observedat Sites 1081 and 1082 between 0.2 and 0.5 Ma (Fig. F6A, F6B). In con-
Site 1082 Site 1084A B C
Sedimentation Rate (m/m.y.)
Dep
th (
mbs
f)
Site 1081
Biostratigraphy Log Density Composite GRA bulk density
600
500
400
300
200
100
0
3002001000 30020010003002001000
F5. Sedimentation rates vs. depth for Sites 1081, 1082, and 1084, p. 16.
3002001000 3002001000
Site 1081
Age
(M
a)
Site 1082 Site 1084A B C
600
400
200
0
Dep
th (
mbs
f)
86420
Age (Ma)
3002001000
600
400
200
0
Dep
th (
mbs
f)
86420
Age (Ma)
Sedimentation Rate (m/m.y.)
Dep
th (
mbs
f)
86420
Age (Ma)
8
6
4
2
0
A_A B_B C_C
Biostratigraphy Log Density Composite GRA bulk density
F6. Sedimentation rates vs. age at Sites 1081, 1082, and 1084, p. 17.

T.J. GORGAS ET AL.DATA REPORT: SEDIMENTATION RATES FROM MILANKOVITCH PERIODICITY 5
trast, computed data at Site 1084 showed a negative correlation for thistime period with the other sites (Fig. F6C). Very pronounced pulses ofhigh deposition rates (150 m/m.y. and greater) were found at all threesites between ~0.7 and 1.05 Ma. The highest variability in SR values(100 to 290 m/m.y.) and the broadest peak (~290 m/m.y.) was observedat Site 1084 (Fig. F6C). A rapid decline in deposition at all sites wasfound roughly between 1.1 and 1.7 Ma. A rapid increase in depositionaround 1.7 Ma and pulses of high SR values until 2.6 Ma characterizeddeposition at all three sites, with the broadest peak identified at Site1084 (Fig. F6C).
Before 2.7 Ma, a strong correlation between maximal and minimalSR values among the three sites could not be clearly defined. At Site1082 (Fig. F6B), a pulse of high SR was found between 2.9 and 3.1 Ma,whereas at Site 1084 (Fig. F6C) an interval of high SR values existed be-tween 3.1 and 3.8 Ma. Log density data obtained at Site 1081 did notcorrespond to this trend (Fig. F6A). In contrast, Site 1081 revealed rela-tively high SR values between 4.1 and 5.0 Ma, which was paralleled by ashort burst of high deposition rate at Site 1082 only between 4.6 and4.8 Ma (Fig. F6B). Data obtained at Site 1084 (Fig. F6C) suggested theopposite trend, with low SR values within this particular time period.
Power Spectra in the Time Domain
Evolutionary power spectra as a function of age were generated byapplying our spectral analysis technique on residual GRA bulk and logdensity records in the time domain. Our results showed a strong pres-ence of Milankovitch periodicity (Figs. F7, F8). During some intervals,all three Milankovitch cycles appeared contemporaneously in the spec-tral waveband, whereas other time periods were predominated only byone or two of the main cycles. Thus, the key observation in our spectralprofiles was the waxing and waning of various cycles over time, shiftingeither abruptly or gradually from one frequency into another.
Strong eccentricity was recognized for the past 1.5 m.y., whereas fre-quencies in the obliquity and precession waveband appeared to be lesspronounced (Fig. F7). Around 1.6 Ma, the dominance of eccentricitywaned (Figs. F7A, F8C) and amplitudes of the obliquity cycles becamemore amplified. All three cycles coexisted in the waveband between 2.0and 2.6 Ma, whereas before 2.6 Ma mainly eccentricity governed thespectral energy. Practically no obliquity and precession were observedbetween 3.5 and 4.0 Ma, with slight variations in their times of occur-rence among the individual sites (Fig. F8). All three cycles showedstrong spectral amplitudes at Site 1081 between 4.2 and 4.8 Ma (Fig.F8A). Before 4.8 Ma, spectral energy records at Site 1081 suggested apronounced wax-and-wane pattern only between eccentricity andobliquity, but not a strong presence of precessional cycles.
DISCUSSION
Intervals of high SR values along the southwest African coast corre-lated with intervals of high bioproductivity for the past 1.2 m.y. (Lin etal., 1999). We attributed this and other periods of high SR values to vig-orous coastal upwelling in concert with glaciation periods in the North-ern and Southern Hemispheres (Keigwin, 1987; Meyers, 1992; Barker,Camerlenghi, Acton., et al., 1999).
Site 1081
3.0
2.5
2.0
1.5
1.0
0.5
Age
(M
a)
6040200Cycles/m.y.
Ecc
entr
icity
Obl
iqui
ty
Pre
cess
ion
I
Pre
cess
ion
II
Site 1082
6040200
Site 1084A B
6040200
C
Ecc
entr
icity
Obl
iqui
ty
Pre
cess
ion
I
Pre
cess
ion
II
Ecc
entr
icity
Obl
iqui
ty
Pre
cess
ion
I
Pre
cess
ion
II
F7. Spectral power in the time do-main, Sites 1081, 1082, and 1084, p. 18.
Site 1081
Age
(M
a)
Site 1082 Site 1084A B C
Ecc
entr
icity
Obl
iqui
ty
Pre
cess
ion
I
Pre
cess
ion
II
8
6
4
2
6040200
Ecc
entr
icity
Obl
iqui
ty
Pre
cess
ion
I
Pre
cess
ion
II
6040200
Ecc
entr
icity
Obl
iqui
ty
Pre
cess
ion
I
Pre
cess
ion
II
6040200Cycles/m.y.
F8. Spectral energy detected in log density profiles over time, Sites 1081, 1082, and 1084, p. 19.

T.J. GORGAS ET AL.DATA REPORT: SEDIMENTATION RATES FROM MILANKOVITCH PERIODICITY 6
Modeling
We tested our methodology by designing synthetic density curves us-ing a spectral analysis of both the depth and time domains. These artifi-cial density curves represent an accumulative summation over time of athree-component sediment composite (calcareous, siliceous, and clay),which experiences compaction. We tested different SR scenarios overdepth, including a constant accumulation rate (Fig. F9A, F9D), a veryrapid increase in accumulation (Fig. F9B, F9E), and a smooth increasein rates (Fig. F9C, F9F). Experimental studies on various deep-sea ma-rine sediments provided regression equations for our synthetic compac-tion curves (Hamilton, 1976). Moreover, we perturbed our syntheticdensity curves in the depth domain with five sinusoidal cycles, equiva-lent to 100, 41, 23, 19, and 10 k.y. (Fig. F9). One goal of our modelingwas to reproduce these five frequencies in the time domain, utilizingspectral analysis.
At first, we kept accumulation rates of all three components constant(Fig. F9A, F9D) and varied only the smooth factor, but not the autocor-relation and FFT window length (Fig. F10A). High smooth factors re-sulted in a better detection of low frequencies. Consequently, weattempted to choose a smooth factor for the real wet bulk density data,which prevented the suppression of one Milankovitch component overthe others. Next, we only changed autocorrelation window lengths,which showed that lower frequencies were enhanced by longer win-dows (Fig. F10B). In contrast, higher frequencies were not resolved asclearly as with shorter windows. In addition, they were significantlysmeared and displaced over a certain frequency band, erroneously sug-gesting cycles that were not part of the original waveband. This distor-tion of the original input frequencies could possibly explain spectralsignals in our geologic records that deviated from the expected Milan-kovitch periodicity (Figs. F7, F8). We point out that this smearing of fre-quencies reflected a numerical effect, not one from orbital forcing.Frequencies were even more distorted when we introduced broadbandfrequency noise by incorporating strong high-density contrasts into thesynthetic residual density curve (Fig. F10C).
A major goal of our modeling was to quantify the accuracy of ouranalysis technique. Therefore, we tested the behavior of evolutionaryspectra in the depth (Fig. F11) and time domain (Fig. F12) for constantand varying accumulation rates (Fig. F9). Moreover, these model studiesshed light on possible aliasing effects caused by undersampling ofeither synthetic or real-data records. Evolutionary spectra in the depthdomain exhibited a gradual increase in spectral frequencies for constantaccumulation rate values (Fig. F11A). This reflected an apparent in-crease in cycles per meter (cycles/m) caused by compaction. A doublingin accumulation of the calcareous component over a short depth inter-val caused significant deflections of the spectra (Fig. F11B). The deflec-tions were smoother in the case of a gradual accumulation rate increase(Fig. F11C). This test provided means to identify significant and subtlechanges in SR values over depth in our geologic records (Fig. F5).
Compaction, which apparently increased frequencies in the depthdomain (Fig. F11A), was eliminated in the age domain for constant andvarying SR values as long as their original input rates were reproducedcorrectly. In the case of constant deposition, evolutionary spectra in theage domain exhibited an almost constant frequency value (measured incycles per million years) over the entire time range (Fig. F12A). How-ever, the 10-k.y. cycle showed a relatively strong deflection from a
B
200
160
120
80250200150100500
Depth (mbsf)
200
160
120
80
200
160
120
80
Sed
imen
tatio
n ra
te (
m/m
.y.)
1.70
1.60
1.50
1.40
1.30
1.70
1.60
1.50
1.40
1.30
250200150100500Depth (mbsf)
1.70
1.60
1.50
1.40
1.30
Den
sity
(g/
cm3 )
A D
C
E
F
constant accumulation
stepsize increase in accumulation
smooth increase in accumulation
F9. Synthetic sedimentation rates of sediment composites, p. 20.
-2
-1
0
1
Nor
mal
ized
am
plitu
de
100 k.y.
41 k.y. 23/19 k.y.
10 k.y.
512-point window with
smooth factor 1001
512-point window with smooth factor 101
512-point window withsmooth factor 11
-2
-1
0
1
1.00.80.60.40.20.0
Cycles/m
256-point window
41 k.y.
23 k.y.
100 k.y.
19 k.y.
10 k.y.
512-point window
1024-point window
1.0
0.5
0.0
Synthetic spectra influenced by:
No delta spike Delta spike
2.01.51.00.50.0Cycles/m
41 k.y. 23 k.y.19 k.y.
100 k.y.
A
B
C
Nor
mal
ized
am
plitu
deN
orm
aliz
ed a
mpl
itude
F10. Parameters that influenced results from spectral analyses, p. 21.
Cycles/m
Constant accumulation
230 mbsf
Syn
thet
ic e
volu
tiona
ry p
ower
spe
ctra
(dep
th d
omai
n)
1.00.90.80.70.60.50.40.30.20.10.0
Gradual increase of accumulation
230 mbsf
45 mbsf
135 mbsf
185 mbsf 10 k
.y.
19 k
.y.
41 k
.y.
23 k
.y.
100
k.y.
Stepsize increase of accumulation
230 mbsf
45 mbsf
10 k
.y.
19 k
.y.
41 k
.y.
23 k
.y.
100
k.y.
10 k
.y.
19 k
.y.
41 k
.y.
23 k
.y.
100
k.y.
A
B
C
45 mbsf
F11. Evolutionary spectra with depth, p. 22.
100
k.y.
1101009080706050403020100Cycles/m.y.
1.4 Ma
0.2 Ma
Constant accumulation
1.4 Ma
0.2 Ma
A
BVariable accumulation
10 k
.y.
19 k
.y.
41 k
.y.
23 k
.y.
100
k.y.
Syn
thet
ic e
volu
tiona
ry p
ower
spe
ctra
(age
dom
ain)
10 k
.y.
19 k
.y.
41 k
.y.
23 k
.y.
100
k.y.
F12. Evolutionary spectra from synthetic density profiles, p. 23.

T.J. GORGAS ET AL.DATA REPORT: SEDIMENTATION RATES FROM MILANKOVITCH PERIODICITY 7
straight spectral path (Fig. F12A), which we attributed to aliasing ef-fects. In general, the difference between input and output frequenciesfor constant SR values ranged within an acceptable 1%–3%.
In contrast, drastic changes in SR values caused significant deflec-tions in some of the evolutionary spectra from their expected path (Fig.F12B). Consequently, ages obtained from inversion and integration ofcalculated SR values were off by 10% and more, depending on the fre-quency component. A drastic shift in SR values affected the individualfrequency components not only differently, but also inconsistently(Fig. F12B). Eccentricity (100 k.y.) and the 23-k.y. precessional cyclewere deflected less than obliquity (41 k.y.) and the 19-k.y. precessionalcycle, whereas the 10-k.y. cycle almost disappeared when accumulationrates changed from low to high values. Below this transition interval,most of the 10-k.y. spectral energy was folded into the lower frequencyrange because of the strong aliasing, superimposing the other input fre-quencies (Fig. F12B). We interpreted the observed spectral deflections asthe combined effect of aliasing of the various cycles, and of variable au-tocorrelation window lengths and smooth factors. Therefore, resultsfrom our model studies served as an important guide on how to inter-pret deflections of spectra in the depth domain in order to calculate SRvalues correctly. Modeling, thus, also improved the delineation of theindividual cycles in the age domain.
SUMMARY
GRA bulk and log density data obtained at Sites 1081, 1082, and1084 allowed the calculation of high-resolution SR in the depth andtime domain. Our profiles generally agreed with those from biostrati-graphic analyses. We believe that the upwelling history of the BCUS canbe explained in part by orbital forcing by influencing indirectly thecomplex ocean and atmospheric circulation patterns along the south-west African coast over time (Diester-Haass et al., 1992). Accordingly,upwelling vigor varied spatially and temporally, causing a heteroge-neous distribution of bioproductivity. This controlled the variability ofthe SR history along the BCUS, which was further modified by coastalrunoff during glacial and interglacial periods (Meyers, 1992).
Results from modeling cyclic variations in simplified synthetic den-sity compaction curves reminded us that caution is required when in-terpreting periodicity in real geologic records. Our analyses of wet bulkdensity from log and GRA bulk density records obtained at Sites 1081,1082, and 1084 (Figs. F7, F8) certainly exhibited some of the phenom-ena demonstrated with our synthetic density models (Figs. F9, F10,F11, F12). Our theoretical results corresponded with similar studies(Herbert, 1994), suggesting that rapid fluctuations in accumulationrates along the southwest African coast may have caused irregularitiesin evolutionary power spectra. These, in return, must have affected theaccuracy of our method to deduce a high-resolution SR history fromspectral analyses. Synthetic accumulation rate profiles, perturbed by aknown cyclicity, revealed irregular deviations in power spectra as the re-sult of aliasing (not enough cycles were resolved at a given samplingrate), effects of certain autocorrelation and FFT window lengths, andthe choice of smooth factors. The presence of very strong density gradi-ents in our geologic records (delta spikes) introduced broadband noiseinto the spectral profiles and thus complicated a clear separation of theindividual cycles.

T.J. GORGAS ET AL.DATA REPORT: SEDIMENTATION RATES FROM MILANKOVITCH PERIODICITY 8
In summary, we feel comfortable about our interpretation of wetbulk density data obtained at Sites 1081, 1082, and 1084 because of areasonable agreement with biostratigraphic analyses (Figs. F5, F6). Con-clusions about the upwelling history of the BCUS drawn from previousstudies (e.g., Diester-Haass et al., 1999) and about cyclicity from thisand other locations (e.g., Meyers, 1992; Clark et al., 1999) confirm thereliability of our results.
ACKNOWLEDGMENTS
We thank the captain and the crew of the JOIDES Resolution, both co-chief scientists, W.H. Berger and G. Wefer, ODP Staff Scientist C. Rich-ter, and the entire Shipboard Scientific Party of Leg 175 for their greatassistance at sea. This research was supported by a postcruise JOI/USSSPgrant. Helpful suggestions were made by Dr. Mike Garcia, Denise J.Hills, Stephen J. Leslie, and Tara M. Hicks. Reviews by Lona Dearmontand Jens Grützner greatly enhanced both editorial style and scientificcontent.

T.J. GORGAS ET AL.DATA REPORT: SEDIMENTATION RATES FROM MILANKOVITCH PERIODICITY 9
REFERENCES
Barker, P.F., Camerlenghi, A., Acton, G.D., et al., 1999. Proc. ODP, Init. Repts., 178[Online]. Available from World Wide Web: <http://www-odp.tamu.edu/publica-tions/178_IR/178TOC.HTM>. [Cited 2000-02-02]
Berger, W.H., Kroenke, L.W., Mayer, L.A., et al., 1993. Proc. ODP, Sci. Results, 130: Col-lege Station, TX (Ocean Drilling Program).
Berger, W.H., and Mayer, L.A., 1987. Cenozoic paleoceanography 1986: an introduc-tion. Paleoceanography, 2:613–624.
Berger, W.H., Wefer, G., Richter, C., 1999. Benguela current and Angola-Benguelaupwelling systems: preliminary results from Leg 175. JOIDES J., 24:7–9.
Boyce, R.E., 1976. Definitions and laboratory techniques of compressional soundvelocity parameters and wet-water content, wet-bulk density, and porosity parame-ters by gravimetric and gamma-ray attenuation techniques. In Schlanger, S.O.,Jackson, E.D., et al., Init. Repts. DSDP, 33: Washington (U.S. Govt. Printing Office),931–958.
Clark, P.U., Alley, R.B., and Pollard, D., 1999. Northern hemisphere ice-sheet influ-ences on global climate change. Science, 286:1104–1111.
Cooper, P., 1995. Milankovitch cycles from Fourier analysis of logs from Site 865 and866. In Winterer, E.L., Sager, W.W., Firth, J.V., and Sinton, J.M. (Eds.), Proc. ODP, Sci.Results, 143: College Station, TX (Ocean Drilling Program), 317–327.
de Boer, P.L., and Smith, D.G., 1994. Orbital forcing and cyclic sequences. Spec. Publ.Int. Assoc. Sedimentol., 19:1–14.
Diester-Haass, L., Bickert, T., Vidal, L., and Wefer, G., 1999. Late Miocene changes inpaleoproductivity an carbonate dissolution in the Benguela Current upwelling sys-tem: local or global control? Eos, 80:F588.
Diester-Haass, L., Meyers, P.A., and Rothe, P., 1992. The Benguela Current and associ-ated upwelling on the southwest African margin: a synthesis of the Neogene-Qua-ternary sedimentary record at DSDP Sites 362 and 352. In Summerhayes, C.P., Prell,W.L., and Emeis, K.C. (Eds.), Upwelling Systems: Evolution Since the Early Miocene.Geol. Soc. Spec. Publ. London, 64:331–342.
Gerland, S., and Villinger, H., 1995. Nondestructive density determination on marinesediment cores from gamma-ray attenuation measurements. Geo-Mar. Lett.,15:111–118.
Hamilton, E.L., 1976. Variations of density and porosity with depth in deep-sea sedi-ments. J. Sediment. Petrol., 46:280–300.
Herbert, T.D., 1994. Reading orbital signals distorted by sedimentation: models andexamples. In de Boer, P.L., and Smith, D.G. (Eds.), Orbital Forcing and CyclicSequences. Spec. Publ. Int. Assoc. Sedimentol., 19:483–507.
Jansen, E., Mayer, L., and Shipboard Scientific Party, 1991. GRAPE density recordsand density cyclicity. In Kroenke, L.W., Berger, W.H., Janecek, T.R., et al., Proc. ODP,Init. Repts., 130: College Station, TX (Ocean Drilling Program), 553–556.
Keigwin, L.D., 1987. Pliocene stable-isotope record of Deep Sea Drilling Project Site606: sequential events of 18O enrichment beginning at 3.1 Ma. In Ruddiman, W.F.,Kidd, R.B., Thomas, E., et al., Init. Repts. DSDP, 94 (Pt. 2): Washington (U.S. Govt.Printing Office), 911–920.
Krijgsman, W., Hilgen, F.J., Raffi, I., and Sierro, F.J., 1999. Chronology, causes andprogression of the Messinian salinity crisis. Nature, 400:652–655.
Lin, H.-L., Lin, C.-Y., and Meyers, P.A., 1999. Late Quaternary changes in marine pro-ductivity along the Southwest Africa margin. Eos, 80:F568.
Mayer, L.A., 1979. Deep sea carbonates: acoustic, physical, and stratigraphic proper-ties. J. of Sediment. Petrol., 49:819–836.
Meyers, P.A., 1992. Organic matter variations in sediments from DSDP sites 362 and532: evidence of upwelling changes in the Benguela Current upwelling system. In
T.J. GORGAS ET AL.DATA REPORT: SEDIMENTATION RATES FROM MILANKOVITCH PERIODICITY 10
Summerhayes, C.P., Prell, W.L., and Emeis, K.C. (Eds.), Upwelling Systems: EvolutionSince the Early Miocene. Geol. Soc. Spec. Publ. London, 64:323–329.
Pisias, N.G., Dauphin, J.P., and Sancetta, C., 1973. Spectral analysis of late Pleis-tocene-Holocene sediments. Quat. Res., 3:3–9.
Shackleton, N.J., 1987. Oxygen isotopes, ice volume, and sea level. Quat. Sci. Rev.,6:183–190.
Smith, S.W., 1997. The Scientist’s Guide to Digital Signal Processing: San Diego, Califor-nia (California Technical Publishing).
Wefer, G., Berger, W.H., and Richter, C., et al., 1998. Proc. ODP, Init. Repts., 175: Col-lege Station, TX (Ocean Drilling Program).
Wilkens, R.H., and Handyside, T., 1985. Physical properties of equatorial Pacific sedi-ments. In Mayer, L., Theyer, F., Thomas, E., et al., Init. Repts. DSDP, 85: Washington(U.S. Govt. Printing Office), 839–847.
Wright, J.D., and Miller, K.G., 1993. Southern Ocean influences on Late Eocene toMiocene deep-water circulation. In Kennett, J.P., and Warnke, D.A. (Eds.), The Ant-arctic Paleoenvironment: A Perspective on Global Change. Antarct. Res. Ser., 60:1–25.

T.J. GORGAS ET AL.DATA REPORT: SEDIMENTATION RATES FROM MILANKOVITCH PERIODICITY 11
Figure F1. Locations of Sites 1081, 1082, and 1084 off southwest Africa. Bathymetry is in meters below sealevel.
0°E 10° 20°
30°
20° S
-5000
-500
0
-5000
-5000
-5000
-5000
-5000
-5000
-5000
-400
0
-4000
-4000
-400
0
-4000
-300
0
-300
0
-3000
-3000
-2000
-2000
-1000
1081
1082
1084
Walv
is Rid
ge
Walvis Basin
-200
0
Africa

T.J. GORGAS ET AL.DATA REPORT: SEDIMENTATION RATES FROM MILANKOVITCH PERIODICITY 12
Figure F2. SEM microstructure images. A. Hole 1081A at 320 mbsf and 5.8 Ma. A fine-grained clay matrixand a low abundance of calcareous material resulted in darker color and lower reflectance values. B. Hole1082A at 596 mbsf and 5.6 Ma. A fine-grained matrix of calcareous ooze caused lighter color and higherreflectance values. Note the large foraminifers (calcareous microfossils), which retain intratest porosity togreat depths.
200 µm
1081A
1082A
A
B
200 µm

T.J. GORGAS ET AL.DATA REPORT: SEDIMENTATION RATES FROM MILANKOVITCH PERIODICITY 13
Figure F3. Log density data at Hole 1081A. (A) Original data contain strong density contrasts due to thepresence of dolomite horizons (stippled line). Data in (A) are interpolated (solid gray line) and smoothed(black line). Subtraction of the smoothed data profile from the interpolated data yields (B) an interpolatedresidual density profile on which spectral analyses were performed.
Smoothed data
Log density
0.15
0.10
0.05
0.00
-0.05
-0.10
450400350300250200150100
Depth (mbsf)
Log density
2.4
2.2
2.0
1.8
1.6
1.4
Site 1081A
B
Den
sity
(g/
cm3 )
Data with dolomite horizons
Res
idua
l den
sity
(g/
cm3 )

T.J. GORGAS ET AL.DATA REPORT: SEDIMENTATION RATES FROM MILANKOVITCH PERIODICITY 14
Figure F4. Power spectra of log density in the depth domain. A. Site 1081, 259 mbsf, with a calculated sed-imentation rate of 51 m/m.y. and an age of ~4.4 Ma. The autocorrelation window (ACW) length is 512points, and a fast Fourier transform (FFT) window length is 1024 points. B. Site 1082, 375 mbsf, with a cal-culated SR value of 164 m/m.y. and an age of ~3.1 Ma, using the same ACW and FFT lengths. C. Site 1084,467 mbsf, with a calculated SR of 59 m/m.y. and an age of ~3.0 Ma, using the same ACW and FFT lengths.Note the different alignment of spectral peaks with the main orbital periods, induced by ACW and FFT win-dow lengths, smooth factors, and problems with aliasing. (Figure shown on next page.)

T.J. GORGAS ET AL.DATA REPORT: SEDIMENTATION RATES FROM MILANKOVITCH PERIODICITY 15
Figure F4 (continued).
Site 1081
Site 1082
Site 1084
A
B
C
Nor
mal
ized
am
plitu
de
400
k.y.
41 k
.y.
23 k
.y.
100
k.y.
19 k
.y.
1.21.00.80.60.40.20.0
Cycles/m
1.0
0.8
0.6
0.4
0.2
0.0
1.0
0.8
0.6
0.4
0.2
0.0
400
k.y.
41 k
.y.
23 k
.y.
100
k.y.
19 k
.y.
400
k.y.
41 k
.y.
23 k
.y.
100
k.y.
19 k
.y.
1.0
0.8
0.6
0.4
0.2
0.0
Nor
mal
ized
am
plitu
deN
orm
aliz
ed a
mpl
itude

T.J. GORGAS ET AL.DATA REPORT: SEDIMENTATION RATES FROM MILANKOVITCH PERIODICITY 16
Figure F5. Sedimentation rates (SR) vs. depth for Sites (A) 1081, (B) 1082, and (C) 1084, which correspondwell to those from biostratigraphy. The maximum values are from the Walvis Basin at Site 1084 between100 and 200 mbsf. Differences between SR values suggested by biostratigraphy and our calculated rates areattributed to the significant difference in resolution between log and GRA bulk density records comparedto biostratigraphic profiles.
Site 1082 Site 1084A B C
Sedimentation Rate (m/m.y.)
Dep
th (
mbs
f)
Site 1081
Biostratigraphy Log Density Composite GRA bulk density
600
500
400
300
200
100
0
3002001000 30020010003002001000

T.J. GORGAS ET AL.DATA REPORT: SEDIMENTATION RATES FROM MILANKOVITCH PERIODICITY 17
Figure F6. Sedimentation rates (SR) vs. age. A. Site 1081 shows maximal peaks between 0.8 and 1.0 Ma andbetween 1.85 and 2.2 Ma. B. Site 1082 exhibits similar trends for the same time period but additionallyreveals high SR values between 3.2 and 3.8 Ma and at ~5.2 Ma. C. At Site 1084 maxima occur between 0.7Ma and 1.0 Ma and between 2.0 and 2.8 Ma. A correspondence in values between Sites 1084 and 1082 isobserved between 3.2 and 3.8 Ma. Age-depth plots for (A_A) Site 1081, (B_B) Site 1082, and (C_C) Site 1084,inserted into their corresponding SR-age plots, show good agreement between biostratigraphy and GRAbulk and log density data, except at Site 1082 before 2.4 Ma (see inset B_B).
3002001000 3002001000
Site 1081
Age
(M
a)
Site 1082 Site 1084A B C
600
400
200
0
Dep
th (
mbs
f)
86420
Age (Ma)
3002001000
600
400
200
0
Dep
th (
mbs
f)
86420
Age (Ma)
Sedimentation Rate (m/m.y.)
Dep
th (
mbs
f)
86420
Age (Ma)
8
6
4
2
0
A_A B_B C_C
Biostratigraphy Log Density Composite GRA bulk density

T.J. GORGAS ET AL.DATA REPORT: SEDIMENTATION RATES FROM MILANKOVITCH PERIODICITY 18
Figure F7. Spectral power in the time domain calculated from GRA bulk density records exhibit a presenceof main Milankovitch cycles, namely eccentricity (10 cycles/m.y.), obliquity (24 cycles/m.y.), and preces-sion (42 and 53 cycles/m.y.). A. At Site 1081 precession and obliquity are visible between 0.7 and 2.8 Ma,paralleled by eccentricity only for the past 1.5 m.y. B, C. Sites 1082 and 1084, where spectra were obtainedfor the past 1.3 m.y. only, suggest a dominance of eccentricity for this time interval. Intermittent frequen-cies may be explained with aliasing effects for intervals of high sedimentation rates and strong density con-trasts (delta spikes), which causes individual cycles to smear out.
Site 1081
3.0
2.5
2.0
1.5
1.0
0.5
Age
(M
a)
6040200Cycles/m.y.
Ecc
entr
icity
Obl
iqui
ty
Pre
cess
ion
I
Pre
cess
ion
II
Site 1082
6040200
Site 1084A B
6040200
C
Ecc
entr
icity
Obl
iqui
ty
Pre
cess
ion
I
Pre
cess
ion
II
Ecc
entr
icity
Obl
iqui
ty
Pre
cess
ion
I
Pre
cess
ion
II

T.J. GORGAS ET AL.DATA REPORT: SEDIMENTATION RATES FROM MILANKOVITCH PERIODICITY 19
Figure F8. Spectral energy detected in log density profiles over time show cyclic patterns that match thethree Milankovitch cycles at (A) Site 1081 between 6.0 and 4.3 Ma. Similar rhythmic patterns were observedbetween 3.0 and 2.2 Ma at the same site and at (B) Site 1082. At (C) Site 1084, spectral power is mainlycharacterized by obliquity and precession between 1.0 and 2.4 Ma, whereas eccentricity dominates there-after. Periodicity before 6.0 Ma was only available from records at Site 1081 and shows a complex wax-and-wane pattern between eccentricity and obliquity, but no indication of precession. Intermittent frequenciesare explained with noise effects induced by very strong density variations.
Site 1081
Age
(M
a)
Site 1082 Site 1084A B C
Ecc
entr
icity
Obl
iqui
ty
Pre
cess
ion
I
Pre
cess
ion
II
8
6
4
2
6040200
Ecc
entr
icity
Obl
iqui
ty
Pre
cess
ion
I
Pre
cess
ion
II
6040200
Ecc
entr
icity
Obl
iqui
ty
Pre
cess
ion
I
Pre
cess
ion
II
6040200Cycles/m.y.

T.J. G
OR
GA
S ET A
L.D
AT
A R
EP
OR
T: SE
DIM
EN
TA
TIO
N R
AT
ES FR
OM
MIL
AN
KO
VIT
CH
PE
RIO
DIC
ITY
20
Figure r a (A) constant, (B) step size,and (C
20
16
12
8
20
16
12
8
20
16
12
8
Sed
imen
tatio
n ra
te (
m/m
.y.)
250
F9. Synthetic sedimentation rates of three-component sediment composites (calcareous, siliceous, and clay) fo) gradual increase of accumulation, with (D, E, F) corresponding synthetic density profiles.
B
0
0
0
0250200150100500
Depth (mbsf)
0
0
0
0
0
0
0
0
1.70
1.60
1.50
1.40
1.30
1.70
1.60
1.50
1.40
1.30
200150100500Depth (mbsf)
1.70
1.60
1.50
1.40
1.30
Den
sity
(g/
cm3 )
A D
C
E
F
constant accumulation
stepsize increase in accumulation
smooth increase in accumulation

T.J. GORGAS ET AL.DATA REPORT: SEDIMENTATION RATES FROM MILANKOVITCH PERIODICITY 21
Figure F10. Various parameters that influenced results from spectral analyses include (A) smooth factor,(B) autocorrelation window length, and (C) noise introduced by delta spikes.
-2
-1
0
1
Nor
mal
ized
am
plitu
de
100 k.y.
41 k.y. 23/19 k.y.
10 k.y.
512-point window with
smooth factor 1001
512-point window with smooth factor 101
512-point window withsmooth factor 11
-2
-1
0
1
1.00.80.60.40.20.0
Cycles/m
256-point window
41 k.y.
23 k.y.
100 k.y.
19 k.y.
10 k.y.
512-point window
1024-point window
1.0
0.5
0.0
Synthetic spectra influenced by:
No delta spike Delta spike
2.01.51.00.50.0Cycles/m
41 k.y. 23 k.y.19 k.y.
100 k.y.
A
B
C
Nor
mal
ized
am
plitu
deN
orm
aliz
ed a
mpl
itude

T.J. GORGAS ET AL.DATA REPORT: SEDIMENTATION RATES FROM MILANKOVITCH PERIODICITY 22
Figure F11. A. Evolutionary spectra obtained from synthetic density profiles show a gradual increase in fre-quency (measured in cycles per meter) with depth for constant accumulation rates (ARs). B. In contrast,spectra exhibit strong deflections from this pattern when ARs change rapidly. C. Similar but smoother ef-fects on the profiles are observed for the gradual AR changes.
Cycles/m
Constant accumulation
230 mbsf
Syn
thet
ic e
volu
tiona
ry p
ower
spe
ctra
(dep
th d
omai
n)
1.00.90.80.70.60.50.40.30.20.10.0
Gradual increase of accumulation
230 mbsf
45 mbsf
135 mbsf
185 mbsf 10 k
.y.
19 k
.y.
41 k
.y.
23 k
.y.
100
k.y.
Stepsize increase of accumulation
230 mbsf
45 mbsf
10 k
.y.
19 k
.y.
41 k
.y.
23 k
.y.
100
k.y.
10 k
.y.
19 k
.y.
41 k
.y.
23 k
.y.
100
k.y.
A
B
C
45 mbsf

T.J. GORGAS ET AL.DATA REPORT: SEDIMENTATION RATES FROM MILANKOVITCH PERIODICITY 23
Figure F12. A. Evolutionary spectra obtained from synthetic density profiles reproduce input frequencieswell over time (measured in cycles per million years) for constant accumulation rates (ARs). A slight de-crease in frequency is noted for the 10-k.y. cycle, probably because of the aliasing effects. B. In contrast,spectra exhibit noticeable deviations from this pattern when ARs change rapidly.
100
k.y.
1101009080706050403020100Cycles/m.y.
1.4 Ma
0.2 Ma
Constant accumulation
1.4 Ma
0.2 Ma
A
BVariable accumulation
10 k
.y.
19 k
.y.
41 k
.y.
23 k
.y.
100
k.y.
Syn
thet
ic e
volu
tiona
ry p
ower
spe
ctra
(age
dom
ain)
10 k
.y.
19 k
.y.
41 k
.y.
23 k
.y.
100
k.y.