Embed Size (px)
Citation preview
ATL
AS-
CO
NF-
2013
-051
17/0
5/20
13
ATLAS NOTEATLAS-CONF-2013-051
May 17, 2013
Search for anomalous production of events with same-sign dileptons and bjets in 14.3 fb−1 of pp collisions at
√s= 8 TeV with the ATLAS detector
The ATLAS Collaboration
Abstract
A search is presented for exotic processes that result in final states containing jets includ-ing at least oneb jet, sizable missing transverse momentum, and a pair of leptons with thesame electric charge. There are several models that predictan enhanced rate of productionof such events beyond the expectations of the Standard Model(SM); the ones consideredin this note are pair production of chiralb′ quarks, pair production of vector-like quarks,enhanced four top quark production and production of two positively-charged top quarks.Using a sample of 14.3 fb−1 of pp collisions at
√s = 8 TeV recorded by the ATLAS de-
tector at the Large Hadron Collider, with selection criteria optimised for each signal, nosignificant excess of events over the background expectation is observed. This observationis interpreted as constraining the signal hypotheses, and it is found at 95% confidence levelthat: the mass of theb′, assuming 100% branching fraction toWt, must be> 0.72 TeV; themass of a vector-likeB (T) quark, assuming branching ratios toW, Z, andH decay modesconsistent with theB or T being a singlet, must be> 0.59 (0.54) TeV; the four top productioncross section must be< 85 fb in the SM and< 59 fb for production via a contact interaction;the mass of an sgluon must be> 0.80 TeV; in the context of models with two universalextra dimensions the inverse size of the extra dimensions must be> 0.90 TeV; and the crosssection for production of two positively-charged top quarks must be< 210 fb.
c© Copyright 2013 CERN for the benefit of the ATLAS Collaboration.Reproduction of this article or parts of it is allowed as specified in the CC-BY-3.0 license.
1 Introduction
The Standard Model (SM) has been repeatedly confirmed experimentally; nonetheless there appears tobe a need for physics beyond the SM at about the weak scale, with additional features that explain thepresence of dark matter in the universe, and provide a mechanism to naturally stabilize the Higgs bosonmass at its observed value of≈ 125 GeV [1,2]. This note reports on a search for new physics resulting inisolated high-pT lepton pairs with the same electric charge andb jets. This is a promising search channelsince the SM yields of such events are small, and several types of new physics may contribute.
Among the models that predict enhanced same-sign lepton production are those that postulate theexistence of a fourth generation of chiral quarks, the existence of vector-like quarks, an enhancement ofthe four top quark production cross section, or production of two positively-charged top quarks. We usea common data sample to search for each of these signatures, and optimise the event selection criteriafor each signal model.
A fourth generation of SM quarks includes a charge−1/3 quark, called theb′. Under the assumptionthat theb′ decays predominantly toWt, b′ pair production results in fourW bosons in the final state. Iftwo of theW bosons with the same electric charge decay leptonically, there will be a same-sign leptonpair in the final state. The existence of additional quark generations greatly enhances the Higgs bosonproduction cross section, so if the new boson observed at theLHC is a manifestation of a minimal Higgssector, additional quark generations are ruled out. However, a more complex Higgs sector, as in Two-Higgs-Doublet models [3], allows a fourth generation.
Several extensions to the SM that regulate the Higgs boson mass in a natural way require the ex-istence of vector-like quarks (VLQ) [4–22], where “vector-like” means that the left- and right-handedcomponents transform identically under the SU(2)L weak isospin gauge symmetry. Since quarks withthis structure do not require a Yukawa coupling to the Higgs field to attain mass, their existence would notenhance the Higgs boson production cross section, and thus the motivation persists for a direct search.There are several possible varieties of VLQ; those having the same electric charge as the SMb and tquarks are calledB andT. VLQ may exist as either isospin singlets, doublets, or triplets. Argumentsbased on naturalness suggest that VLQ may not interact strongly with light SM quarks [23,24]. Thus it isassumed for this analysis that VLQ decay predominantly to third-generation SM quarks. Both charged-and neutral-current decays may occur, providing many pathsfor same-sign lepton production for eventswith VLQ. For example, the decaysB→Wt, T → Zt, andT → Ht can all lead to same-sign lepton pairs(depending on the decays of theW, Z, andH bosons) in association withb jets and missing transversemomentum (Emiss
T ) when VLQ are pair-produced. The branching fractions to each allowed final state aremodel-dependent; as a reference we will use the branching ratios naturally occurring in models wheretheB andT exist as singlets or doublets [25]. These branching fractions vary with the mass of the VLQ,and values for masses near the limit of our sensitivity are given in Table 1. Since the pair production ofheavy quarks is mediated by the strong interaction, the cross section is identical forb′ and vector-likequarks of a given mass. The NNLO cross sections fromhathor [26] are used in this note.
Same-sign lepton pairs may also arise from the non-resonantproduction of four top quarks (tttt). TheSM rate for this production is small (≈ 1 fb [27, 28]), but there are several new physics models that canenhance the rate. These can generically be described in terms of a four-fermion contact interaction withcoupling strengthC/Λ2, whereC is the coupling constant andΛ is the scale of the new physics [29]:
L = LSM +C
Λ2
(
tRγµtR)
(
tRγµtR)
. (1)
Two specific models are also considered. The first is sgluon pair production, where sgluons are color-adjoint scalars that appear in several extensions to the SM [30–35]. If the sgluon mass is above thetop quark pair production threshold, the dominant decay is to tt, resulting in four top quarks in thefinal state (tttt). The cross-sections considered in this paper are rescaledto NLO [36]. The second
1

Table 1: VLQ branching fractions (in percent) for masses near the limit of our sensitivity, assuming thesinglet and doublet models of [25].
B TMass (model) Wt Zb Hb Wb Zt Ht0.50 TeV (singlet) 42 31 27 50 17 330.50 TeV (doublet) 100 0 0 0 34 660.55 TeV (singlet) 43 30 27 49 18 320.55 TeV (doublet) 100 0 0 0 37 630.60 TeV (singlet) 44 29 26 49 19 310.60 TeV (doublet) 100 0 0 0 38 620.65 TeV (singlet) 45 29 26 49 20 300.65 TeV (doublet) 100 0 0 0 40 60
model is one with two universal extra dimensions under the real projective plane geometry (2UED/RPP)[37]. The compactification of the extra dimensions leads to discretisation of the momenta along theirdirections, which is quantified here as a Kaluza-Klein mass (mKK ≡ 1
R4, whereR4 is related to the size
of the first extra dimension1). This model predicts the pair production of Kaluza-Klein excitations of thephoton with mass
√2mKK, each of them decaying tott, with a branching fraction assumed to be 100%.
Cosmological observations constrainmKK to lie approximately between 600 GeV and 1000 GeV [38].The search for four top quark production reported here is an extension of an analysis done with the 2011ATLAS data set, which placed the first constraints on four topquark production [39].
Production of two positively-charged top quarks viauu→ tt can also result in an excess of same-sign lepton pairs. This process may be mediated via s- or t-channel exchange of a heavy particle [40,41].If the mass of the mediating particle is much greater than theelectroweak symmetry breaking scale,an effective four-fermion contact interaction can describe the process, with separate operators for thedifferent initial-state chiralities, as defined in Eq. 9.1 of [42].
Previous searches at ATLAS [39], using 4.7 fb−1 of data at√
s = 7 TeV, and CMS [43], using19.7 fb−1 at
√s = 8 TeV, did not observe a significant excess of same-sign dilepton production. The
ATLAS result ruled out ab′ quark with mass less than 0.67 TeV, and set an upper limit on the four topquark production cross section of 0.06 pb, both at 95% C.L. The CMS result was not interpreted in thecontext of the models considered here. The results reportedin this note extend the previous ATLASsearch by using a larger data sample that was recorded at
√s= 8 TeV.
2 Data and Monte Carlo Simulation
The data used were recorded by the ATLAS detector [44] at the LHC ppcollider operating at√
s= 8 TeVbetween April and October 2012, and correspond to an integrated luminosity of 14.3 fb−1. The ATLASdetector consists of an inner tracking system surrounded bya superconducting solenoid that provides a2 T magnetic field, electromagnetic (EM) and hadronic calorimeters, and a muon spectrometer. The innerdetector provides tracking information from pixel and silicon microstrip detectors within pseudorapidity2
1In the model tested here, both extra dimensions have the samesize, i.e.R4 = R5.2ATLAS uses a right-handed coordinate system with its originat the nominal interaction point (IP) in the centre of the
detector and thez axis coinciding with the axis of the beam pipe. Thex axis points from the IP to the centre of the LHC ring,and they axis points upward. Cylindrical coordinates (r,φ) are used in the transverse plane,φ being the azimuthal angle aroundthe beam pipe. The pseudorapidity is defined in terms of the polar angleθ asη = ln tan(θ2). For the purpose of the fiducialselection, this is calculated relative to the geometric centre of the detector; otherwise, it is relative to the reconstructed primary
2

|η| < 2.5, and from a transition radiation tracker that covers|η| < 2.0. The EM sampling calorimeter useslead and liquid argon (LAr), and is divided into a barrel region that covers|η| < 1.475 and end-capregions that cover 1.375< |η| < 3.2. The hadronic calorimeter consists of either LAr or scintillating tileas the active medium, and steel, copper, or tungsten as the absorber, and covers|η| < 4.9. The muonspectrometer covers|η| < 2.7, and uses multiple layers of high-precision tracking chambers to measurethe deflection of muons tracks as they traverse a toroidal field of 0.5 (1.0) T in the central (end-cap)regions of ATLAS.
Signal and some background sources were modelled using Monte Carlo (MC) simulations. The re-maining background sources are determined from the data, asdescribed in Section 4. Pair productionof b′ events was modelled with thepythia [45] generator (v6.425), forb′ masses ranging from 400 to1000 GeV. VLQ production was modelled using theprotos [25] v2.2 generator, withpythia used tomodel extra gluon emission and hadronization. Production of two positively-charged top quarks wasalso modelled usingprotos [42] andpythia, with three different chirality configurations of the contactinteraction operator. Production of four top quarks was modelled under four scenarios:i) standard modelproduction,ii ) production arising from a contact interaction,iii ) production as a result of sgluon pair pro-duction, andiv) production arising from the presence of two universal extra dimensions. The sgluon casewas generated withpythia v8.17; the other three models were generated withmadgraph [46] v5.1 fol-lowed bypythia v6.4. Backgrounds fromtt+W/Z/W+W− andW±W± j j production were modelled withmadgraph followed bypythia v6.4, whileWZandZZplus jet production was modelled usingsherpa [47]v1.4.0. A variable number of additionalpp interactions were overlaid on simulated events to model theeffect of multiple collisions during a single bunch crossing, and also the effect of the detector responseto collisions from bunch crossings before or after the one containing the hard interaction. Events werethen weighted to reproduce the distribution of the number ofcollisions per bunch crossing observed indata. The detector response was modelled using either ageant4 [48, 49] simulation or a faster simula-tion that combinedgeant simulation of the inner tracker and of muons with a fast simulation of showerdevelopment in the calorimeter. Some samples were generated both withgeant4 and the fast simulation,to allow direct comparison between the two, and agreement was found within the systematic uncertaintyassigned to the efficiency estimate. In all cases the simulated events were reconstructed using the samealgorithms that were applied to the collision data.
3 Event selection
The final state considered in this search requires the presence of exactly two leptons3 in the event, bothwith the same electric charge. In addition, two or more jets are required, at least one of which is consistentwith being ab jet, and sizableEmiss
T . The criteria used for each of these objects are given below.Each event is required to have at least one reconstructed vertex, which must be formed from at least
five tracks. If there are multiple vertices reconstructed, the vertex with the largest sum of the squaredtransverse momenta of its associated tracks is taken as the primary vertex. In addition, events are requiredto pass either an electron trigger (where the triggers chosen require either an isolated electron withpT > 24 GeV or an electron withpT > 60 GeV with no isolation requirement) or a muon trigger (wherethe triggers chosen require either an isolated muon withpT > 24 GeV or a muon withpT > 36 GeVwith no isolation requirement). Jets are reconstructed using an anti-kt algorithm [50–52] with distanceparameter 0.4. If one or more jets are within∆R ≡
√
∆η2 + ∆φ2 = 0.2 of an electron, the jet closestto the electron is discarded (i.e. the calorimeter cluster is treated as an electron rather than a jet). Tosuppress jets that do not originate from the primary event vertex, the jet vertex fraction (JVF) is defined
vertex of each event.3Only electrons and muons are considered in the search. Tau leptons are not explicitly reconstructed, but electrons and
muons from tau decay may enter the selected samples.
3

by considering all tracks within the jet, and finding the fraction of the summedpT of these tracks thatcomes from tracks that originate from the primary vertex. Jets are required to have JVF> 0.5, pT > 25GeV (after energy calibration [53]) and|η| < 2.5.
A multivariate algorithm [54] is used to test the consistency of each jet with arising from ab quark,based on the properties of the tracks associated with the jet. A requirement is placed on the output of thediscriminant such that≈ 70% ofb-quark jets and≈ 1% of light quark or gluon jets are expected to pass.All jets that meet this criterion are called ‘b-tagged’ jets.
Electrons [55] are identified by requiring a track to match anelectromagnetic calorimeter cluster,subject to several criteria on the shape of the shower and theconsistency between the shower and track.The selection requirements are varied with theη andpT of the electron candidate to optimise the signalefficiency and background rejection. The track is required to beconsistent within 2 mm inz with thereconstructed primary vertex of the event. A hit in the innermost layer of the inner detector is required,for active modules, to reject photon conversions. Electronclusters are required to haveET > 25 GeVand|η| < 2.47, with the region 1.37< |η| < 1.52 excluded. The candidate is required to be isolated fromadditional calorimeter energy within a cone of∆R = 0.2 and from additional tracks within a cone of∆R = 0.4, with the amount of additional energy or trackpT allowed chosen such that the efficiency forelectrons fromZ boson decay to satisfy each isolation requirement is 90% in MC simulated samples. Inaddition, electrons are required to be separated from any jet by at least∆R= 0.4.
Muons [56–58] are identified from hits in the muon system matched to a central track, where thetrack must be within 2 mm inz of the primary vertex. Requirements are placed on the numberof hits invarious layers of the muon system, and on the maximum number of layers where hits are missing. Muonpairs that are consistent with the passage of a cosmic ray arediscarded. To suppress muons arising fromheavy quark decays, the muon candidates are required to be isolated from other central track activitywithin a cone with radius that decreases with increasing muon pT [59]: ∆R = 0.4/(pT/10 GeV). ThesummedpT of all tracks (other than the muon track) in that cone is required to be less than 5% of themuonpT. Muons are also required to be separated from any jet by∆R = 0.4, and to havepT > 25 GeVand|η| < 2.5. Events with a muon within∆R= 0.2 of any electron are rejected.
The missing transverse momentum is calculated as the opposite of the vectorET sum from allcalorimeter cells, corrected for the energy carried away byidentified muons. Energy scale correctionsapplied to electrons and jets are also propagated toEmiss
T . Events are required to haveEmissT > 40 GeV.
Events are also required to be from a run where the detector performance is known to be good.Depending on the flavour of the leptons the event is identifiedas anee, eµ, or µµ candidate. If the same-sign leptons are of the same flavour, their invariant massmℓℓ is required to be> 15 GeV and to satisfy|mℓℓ−mZ| > 10 GeV. This rejects events from a resonance where the chargeof one lepton is misidentified.Finally, the scalar sum of all jet and leptonpT’s (HT), is required to be> 550 GeV. These basic selectioncriteria are applied to all searches; some of them are tightened when optimising the selection for eachsignal model (see Section 6). The distributions of the most relevant kinematic variables for backgroundand for two signals are shown for theeµ channel in Fig. 1, and for theeeandµµ channel in the appendix(Figs. 11-12).
4 Background Estimation
Backgrounds arise from two distinct sources: SM processes that result in the same final-state objectsas the signal, and instrumental backgrounds where objects are misidentified or misreconstructed suchthat they appear to have the same final state. The former category includesWZ and ZZ productionin association with a heavy flavour jet,W±W± j j production,tt+W production,tt+Z production, andtt+W+W− production. All of these processes have small cross sections, and the expected yields fromthem are computed using simulation.
4
jetsN2 4 6 8 10 12 14 16 18 20
Eve
nts
-110
1
10
210Q Mis-id
Fakes
+Z/W(W)tt
WZ/ZZ
±W±W
32.1)×4-tops Contact (
49.9)×b’->Wt 800GeV (
=8 TeVs channel, µeATLAS Preliminary -1Ldt = 14.3 fb∫
b-jetsN0 2 4 6 8 10
Eve
nts
-110
1
10
210 Q Mis-id
Fakes
+Z/W(W)tt
WZ/ZZ
±W±W
32.1)×4-tops Contact (
49.9)×b’->Wt 800GeV (
=8 TeVs channel, µeATLAS Preliminary -1Ldt = 14.3 fb∫
[GeV]TH500 1000 1500 2000 2500 3000 3500
Eve
nts
/ 100
GeV
-110
1
10
210Q Mis-id
Fakes
+Z/W(W)tt
WZ/ZZ
±W±W
32.1)×4-tops Contact (
49.9)×b’->Wt 800GeV (
=8 TeVs channel, µeATLAS Preliminary -1Ldt = 14.3 fb∫
[GeV]missTE
0 100 200 300 400 500 600 700 800 900 1000
Eve
nts
/ 40
GeV
-110
1
10
210Q Mis-id
Fakes
+Z/W(W)tt
WZ/ZZ
±W±W
32.1)×4-tops Contact (
49.9)×b’->Wt 800GeV (
=8 TeVs channel, µeATLAS Preliminary -1Ldt = 14.3 fb∫
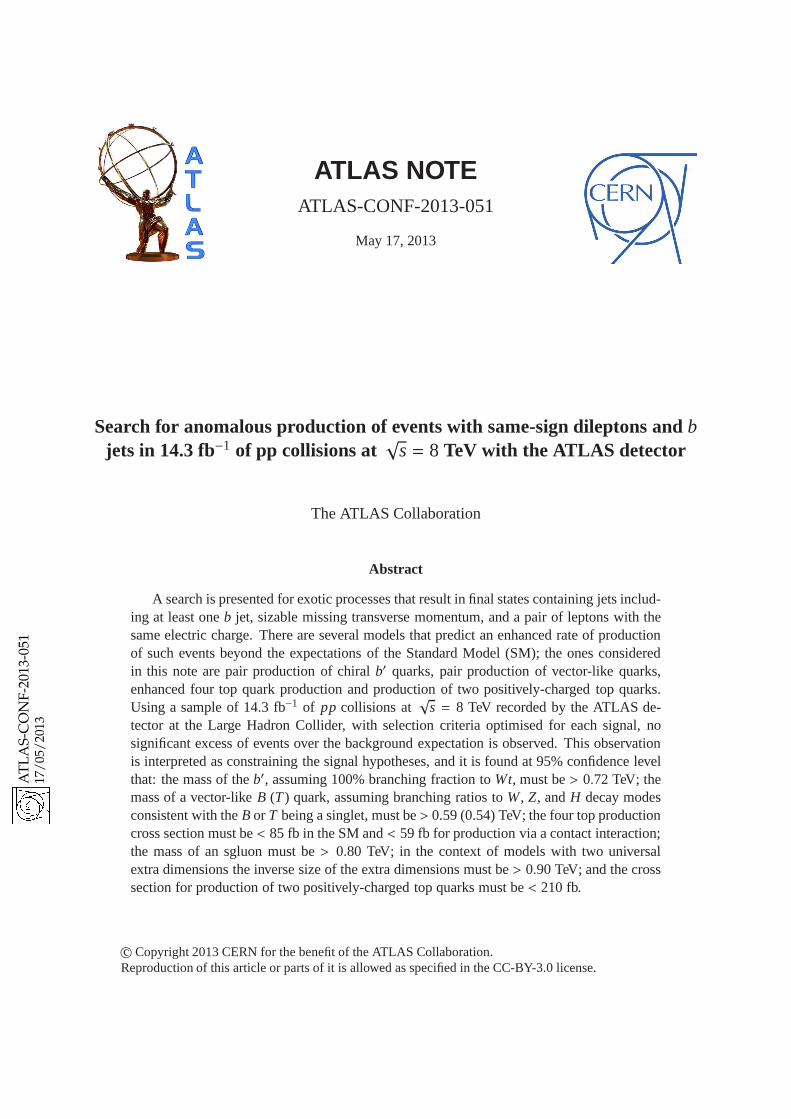
Figure 1: Distributions of discriminant variables in theeµ channel, after the standard object selection andwith the requirement thatEmiss
T > 40 GeV. The cross section for each signal model is scaled up sothat thesignal integrals are all equal to the background integral. The assumed strength of the contact interactionis C/Λ2 = −4π TeV−2. The background histograms are stacked to show the total expected background,while each signal histogram is independent of the others. The uncertainties on the background shownhere consist of the production cross section uncertainty for the backgrounds modelled with Monte Carlosimulation, and a 30% uncertainty for instrumental backgrounds (see Section 5).
Instrumental backgrounds can be further separated into twocategories:i) events that contain twoleptons of opposite charge, where one of the charges is mismeasured andii ) events where one or morejets are misidentified as leptons. To estimate the number of events with misidentified leptons, we begin byrelaxing the lepton identification criteria to form aloosesample. Only events with exactly two leptonsare retained in the loose sample. Single lepton events were used to measure the probabilitiesr and ffor real and fake leptons selected using the loose criteria to also satisfy the standard (ortight) criteria.For electrons,r was measured using events withEmiss
T > 150 GeV, andf was measured using eventswith Emiss
T < 20 GeV andEmissT + mT(W) < 60 GeV. For muons,r was measured using events with
mT(W) > 100 GeV, andf was measured using events where the impact parameter of the muon withrespect to the primary vertex was more than five standard deviations from zero. These probabilitiesare parameterised with respect to properties of the leptons(e.g. η and pT) and of the event (e.g.Emiss
Tand number ofb-tagged jets). The estimated number of events with one or more misidentified leptonsentering the selected sample is then:
5

Nttfake = Ntt
rf + Nttfr + Ntt
ff (2)
= r1 f2Nllrf + f1r2Nll
fr + f1 f2Nllff
= αr1 f2[
( f1 − 1)(1− r2)Ntt + (1− f1)r2Ntl + f1(1− r2)Nlt − f1r2Nll]
+α f1r2
[
(r1 − 1)(1− f2)Ntt + (1− r1) f2Ntl + r1(1− f2)Nlt − r1 f2Nll]
+α f1 f1[
(1− r1)(1− r2)Ntt + (r1 − 1)r2Ntl + r1(r2 − 1)Nlt + r1r2Nll]
where
α =1
(r1 − f1)(r2 − f2).
In this expression, the subscripts refer to thepT rank of the lepton. TheNxx are the number of events fromthe loose sample with leptons either passing the tight criteria (t in superscript) or passing the loose criteriabut not the tight criteria (l in superscript). Care must be taken in applying the procedure to muons, sincethe difference between the tight and loose criteria for muons is onlyin the isolation requirement, and thetriggers used for low-pT muons also require isolation, meaning thatf for these muons is substantiallyhigher than for muons from an unbiased trigger4 . This is addressed by requiring low-pT muons in theloose sample to satisfy isolation criteria similar to thoseapplied in the trigger, and to apply differentvalues ofr and f for low-pT of muons that require this isolation. A further complication may arise dueto the low statistics in the loose sample, which can lead to a measured value ofNtt
fake that is negative orvery close to zero. In the case of negative valuesNtt
fake is set to zero when computing limits, and the 68%C.L. upper bound onNtt
fake is taken as the statistical uncertainty.Charge misidentification is negligible for muons due to the long lever arm to the muon system and
the fact that the charge is measured in both the inner detector and the muon spectrometer. For electrons,the rate of charge misidentification is calculated from a sample of Z → eeevents, selected without anyrequirement placed on the charge of the two electron tracks.It is assumed that the rate at which thecharge of an electron is misidentified varies withη but is uncorrelated between the two electrons in eachevent. Further assuming that the sample consists entirely of opposite-sign electron pairs, the number ofmeasured same-sign events where one electron is in theith bin of η and the other in thejth bin is expectedto be
Ni jss≈ Ni j (εi + ε j)
whereNi j is the total number of events in thei- j η bin, andε is the rate of charge mismeasurement.The value ofε in eachη bin is then extracted by minimizing the Poisson likelihood for the observednumber of same-sign pairs in eachη bin to be consistent with the above expectation. One limitationof this estimate is that electrons fromZ decay only rarely have largepT, rendering the uncertainty onthe charge misidentification rate for such electrons large.To reduce this uncertainty, the rate of chargemisidentification is measured usingtt MC simulated events as a function of the electronpT. This rate ismatched to the rate observed in data for thepT range covered by theZ events, and the rate for electronswith larger pT is scaled according to the MC prediction. Closure tests using the Z peak have beenperformed in data and MC simulation and show good agreement (details are provided in Fig. 19).
To determine the number of events expected from charge mismeasurement in the signal region, asample is selected using the same criteria as for the analysis selection, except that an opposite-sign rather
4Electrons in principle have a similar problem, asr and f for electrons withpT < 60 GeV are calculated with respect to atrigger that requires isolation. However, the fact that theloose selection relaxes other selection criteria in addition to isolationlessens the importance of this bias.
6

|η|
0 0.5 1 1.5 2 2.5
mis
-id∈
-410
-310
-210
-110
1
[15,100] GeV∈ T
p
[100,200] GeV∈ T
p
[200,1000] GeV∈ T
p
ATLAS Preliminary
-1Ldt =14.3 fb∫ = 8 TeVs
(a)
|η|
0 0.5 1 1.5 2 2.5
Fak
e ov
erla
p re
mov
al fa
ctor
0
0.2
0.4
0.6
0.8
1
1.2
1.4
1.6
< 50 GeVT
p
[ 50,100] GeV∈ T
p
> 100 GeVT
p
ATLAS Preliminary
-1Ldt =14.3 fb∫ = 8 TeVs
(b)
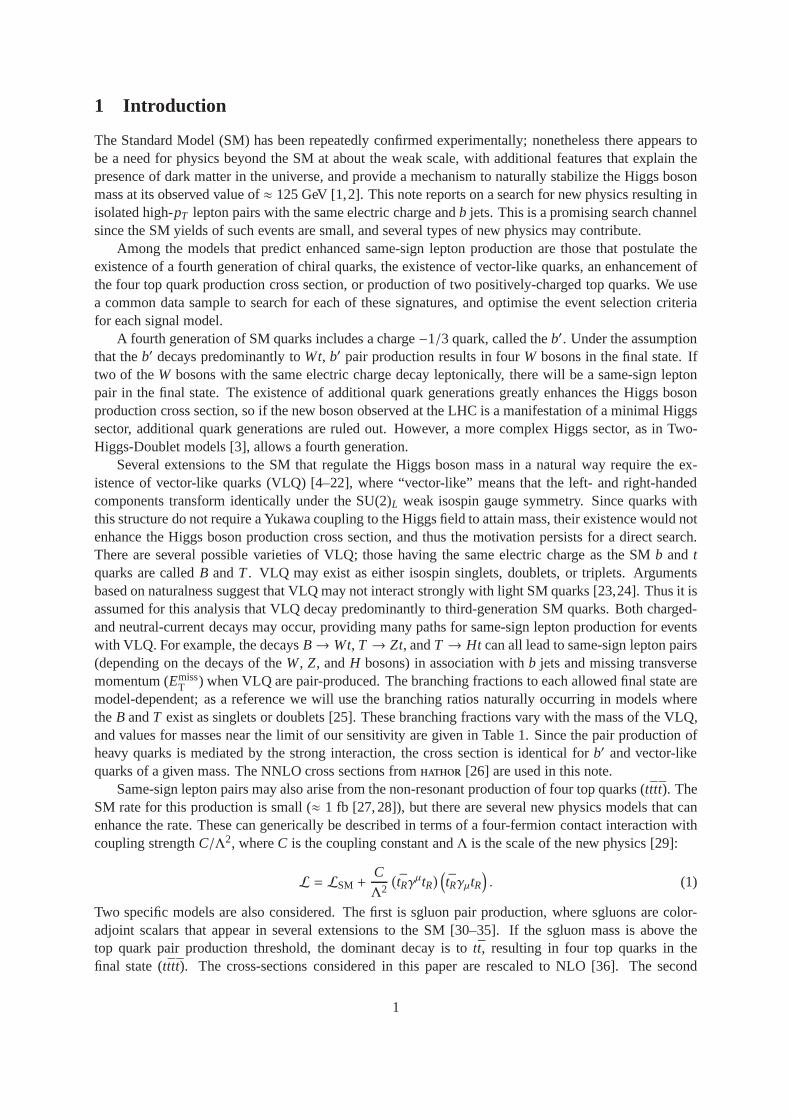
Figure 2: (a) Charge misidentification rate measured in datausing the likelihood method onZ events, asa function of|η| (black points). Applying thepT -dependent correction factor determined with simulatedtt events results in the final charge misidentification rates for higher-pT electrons (red squares and bluetriangles). (b) Correction factor applied to the charge mismeasurement rates to account for the overlapbetween the estimation of backgrounds from charge mismeasurement and fake electrons.
than same-signeeor eµ pair is required. The measuredε values are then applied to each electron in thissample to determine the expected number of mismeasured same-sign events in the analysis sample. Onesource of charge mismeasurement is from “trident” electrons, where the electron emits a hard photon thatsubsequently produces an electron-positron pair, resulting in three tracks relatively close to each other.If the wrong track is matched to the EM cluster, the charge maybe incorrect. However, such electronswill also appear to be isolated far less frequently than electrons that do not emit hard radiation will be,and therefore this source of events is also partially captured by the fake electron estimate. To correct forthe overlap between the charge mismeasurement and fake electron estimates, the charge mismeasurementrate is recalculated with the estimated fake electron contribution removed from the tight selection sample.The ratio of the initial and recalculated rates is taken as anη- and pT-dependent correction factor to beapplied to the charge mismeasurement rates. The measured charge mismeasurement rate and the overlapcorrection factor are shown in Fig. 2.
The background estimates are validated using samples selected with criteria similar to our standardselection, but where the expected yield from signal events is small. One such control region (called theEmiss
T control region) is defined by dropping the requirement onEmissT and requiring 100< HT < 400 GeV.
A second region (theHT control region) is defined by dropping the requirement onHT and requiringEmiss
T < 40 GeV. A third region (the “zero-b-tag” control region) is defined by requiring all of our stan-dard kinematic criteria but requiring that there be nob-tagged jets. The predicted and observed yields intheEmiss
T control region are given in Table 2; similar agreement between the data yield and backgroundexpectation is observed in the other two control regions (details are in the appendix in Tables 15 and 16).Comparisons of kinematic distributions between the data and background model for theEmiss
T controlregion are included in the appendix (Figs. 13-15).
5 Systematic Uncertainties
The expected signal and background yields are subject to several systematic uncertainties. For the yieldsderived from simulation, the largest source of uncertaintyis that on the calculated cross section. For thett+W/Z backgrounds, this is based on variations in the parton distribution functions (PDF) and renormal-ization and factorization scales [60], resulting in a 30% uncertainty. For other backgrounds, varying the
7

Table 2: Observed and expected number of events with statistical (first) and systematic (second) uncer-tainties for theEmiss
T control region selection. For the Monte Carlo simulation, the systematic uncertain-ties include only the production cross section uncertainty.
ChannelSamples ee eµ µµ
Charge misidentification 25.7± 0.7± 6.6 30.2± 0.6± 7.9 —Fakes 38.7± 3.7± 11.6 73.1± 5.3± 21.9 33.4± 8.5± 10.0Diboson•WZ/ZZ+jets 3.9± 0.7± 1.3 10.9± 1.2± 3.7 5.1± 0.8± 1.7•W±W±+2 jets 0.4± 0.2± 0.2 1.2± 0.3± 0.6 0.8± 0.2± 0.4tt +W/Z• ttW(+jet) 1.7± 0.1± 0.5 6.6± 0.2± 2.0 4.3± 0.2± 1.3• ttZ(+jet) 0.5± 0.1± 0.1 1.5± 0.1± 0.5 0.8± 0.1± 0.2• ttW+W− 0.014± 0.002 0.050± 0.004 0.029± 0.003Total expected background 71± 5± 13 124± 8± 24 44± 11± 10Observed 64 97 38Signal contamination• b′ →Wt (800 GeV) < 0.003 0.009± 0.006 0.002± 0.001• 4 tops contact (C/Λ2 = −4π TeV−2) 0.009± 0.005 0.06± 0.02 0.02± 0.01
renormalization and factorization scales results in uncertainties of 34% forWZandZZ production, 25%for W±W± j j production, and+38%/-26% for ttW+W− production. The effect of uncertain modeling ofinitial- and final-state gluon radiation (ISR/FSR) is estimated by varying the parton shower parameters inpythia. The uncertainty on the integrated luminosity is 3.6% [61, 62]. The largest uncertainties specificto ATLAS arise from the jet energy scale [53], theb-tagging efficiency [54], and the lepton identificationefficiency [55–58].
Systematic uncertainties on the backgrounds estimated from data are evaluated separately. Six effectsare considered when assigning the systematic uncertainty on the predicted yield of events from electroncharge mismeasurement:i) the statistical uncertainty on the probability for an electron to have its chargedmismeasured,ii ) the statistical uncertainty on thepT-dependent correction factor,iii ) the difference inrate obtained when applying the measurement method to simulatedZ boson events and the true rateobserved in simulatedtt events,iv) the difference in thepT-dependent scale factor when measured usingdifferenttt simulated samples,v) the variation in the result observed when the width of theZ peak regionis varied, andvi) the statistical uncertainty on the correction for the overlap in the measurement of chargemisidentification and fake electron background estimates.The level of agreement between the observedand predicted yields in the control regions is taken as an estimate of the systematic uncertainty in thefake lepton prediction, resulting in a 30% uncertainty.
The sources of systematic uncertainties that contribute more than 1% uncertainty on the expectedsignal or background yield for theb′/VLQ selection are summarised in Table 3. These uncertainties havesimilar impact on the expected yields for the other signal models.
6 Selection optimisation
For each signal model, the event selection was optimised using a grid search of requirements onHT,Emiss
T , the number of jets, and the number ofb-tagged jets. The set of criteria that provided the bestexpected sensitivity to new physics (including the effect of systematic uncertainties) was chosen. While
8
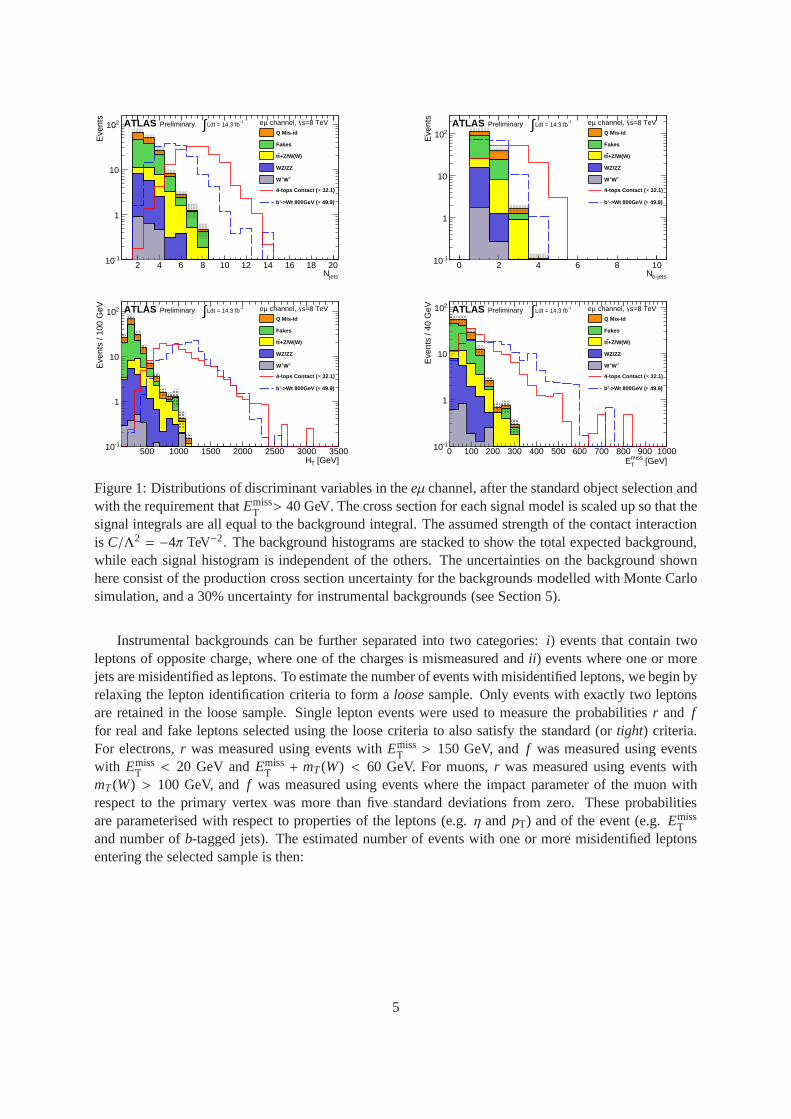
Table 3: Leading sources of systematic uncertainty on the signal and background estimates for theb′/VLQ selection, and their relative impact on the total background estimate. Ab′ mass of 650 GeVis assumed.
Uncertainty in %650 GeVb′ Background
Source ee eµ µµ ee eµ µµ
Cross section – – – 14.4 25.4 32.9Fakes – – – 9.7 1.4 10.1Charge misidentification – – – 7.2 7.1 –Jet energy scale 4.6 2.5 0.2 3.5 10.2 4.4ISR/FSR 6.0 6.0 6.0 2.6 4.5 4.0b-tagging efficiency 4.6 3.1 3.0 2.1 4.4 4.0Lepton ID efficiency 5.3 4.9 8.2 2.2 3.6 5.4Jet energy resolution 0.8 0.9 0.3 0.9 2.7 2.0Luminosity 3.6 3.6 3.6 1.6 2.7 3.6Lepton energy scale 0.8 0.4 0.0 1.4 0.9 0.1JVF selection efficiency 2.5 2.9 2.6 1.1 1.5 1.4
no improvement in the expectedb′ mass limit is observed when requiring more than two jets, thelimitdoes improve when stricter criteria are placed onHT, and requiringHT > 650 GeV provides the opti-mal selection for theb′ search. For the VLQ search, a similar procedure was followed, and the sameconclusion was reached. Therefore theb′ and VLQ selections are the same.
For the four top signal, which has fourb jets per event, it was found that increasing theHT re-quirement to 650 GeV along with requiring at least twob-tagged jets provided the best sensitivity. Forproduction of two positively-charged top quarks, which hasless jet activity and therefore a softerHT
distribution that the other signals, it was not found to be beneficial to tighten theHT requirement beyondthat of the base selection. However, since thepp initial state of the LHC makes theuu → tt processmuch more common than the ¯uu → tt process, both leptons are required to be positively chargedforthis search. A summary of the optimised selection for each channel is given in Table 4. The expectedbackgrounds after the optimised selection in each search are listed in Tables 5-7.
The efficiencies of the event selection for the different signals are summarised in Tables 8-11. Theseefficiencies include the branching fractions to two leptons of same sign, the acceptance and the selectionefficiencies.
7 Results
The observed yields for each signal selection are given in Tables 5-7. Also, the number of observed eventsis compared to the expected background at each step of the selection in Table 12, with good agreementbeing observed. The distributions of various kinematic variables observed in data are compared to thebackground estimates for theb′/VLQ selection in Fig. 3. TheCLs method [63, 64] is used to assess theconsistency between the observed yields and each potentialnew physics signal, where the log-likelihoodratio LLR is used as the test statistic. For each model,LLR is defined as
LLR= −2 logLs+b
Lb(3)
whereLs+b (Lb) is the Poisson likelihood to observe the data under the signal-plus-background (back-ground-only) hypothesis. Pseudo-experiments are generated under each hypothesis, taking into account
9

Table 4: Summary of the selection for the various signals. For all signals, the number of jets is requiredto be at least two andEmiss
T is required to be> 40 GeV.
Variable b′ and VLQ tt ttttHT > 650 GeV > 550 GeV > 650 GeVNb− jets ≥ 1 ≥ 1 ≥ 2Charge ±± ++ ±±
Table 5: Observed and expected number of events with statistical (first) and systematic (second) uncer-tainties for theb′/VLQ signal selection.
Backgrounds ChannelSamples ee eµ µµ
Charge misidentification 0.6± 0.1± 0.2 0.9± 0.1± 0.3 —Fakes 0.8± 0.4± 0.3 0.2± 0.4± 0.1 < 1.1Diboson•WZ/ZZ+jets 0.3± 0.2± 0.1 0.3± 0.1+0.4
−0.2 0.4± 0.2± 0.1•W±W±+2 jets 0.17± 0.09± 0.05 0.3± 0.2± 0.1 0.2± 0.1± 0.1tt +W/Z• ttW(+jet(s)) 0.6± 0.2± 0.3 1.9± 0.2± 0.6 1.3± 0.2± 0.4• ttZ(+jet(s)) 0.18± 0.03± 0.06 0.66± 0.05± 0.22 0.31± 0.04± 0.10• ttW+W− 0.024± 0.003+0.010
−0.007 0.072± 0.005+0.028−0.020 0.055± 0.004+0.022
−0.016Total expected background 2.7± 0.5± 0.4 4.4± 0.5+0.9
−0.7 2.3± 1.2± 0.5Observed 3 10 2
Table 6: Observed and expected number of events with statistical (first) and systematic (second) uncer-tainties for the positively-charged top pair signal selection.
ChannelSamples ee eµ µµ
Charge misidentification 0.6± 0.1± 0.2 0.5± 0.1± 0.2 —Fakes 0.6± 0.4± 0.2 1.0± 0.4± 0.3 0.7± 0.7± 0.2Diboson•WZ/ZZ+jets 0.2± 0.1± 0.1 0.5± 0.3± 0.2 0.6± 0.3± 0.2•W±W±+2 jets 0.16± 0.08± 0.04 0.3± 0.2± 0.1 0.2± 0.1± 0.1tt +W/Z• ttW(+jet(s)) 0.7± 0.1± 0.2 2.2± 0.1± 0.7 1.5± 0.1± 0.5• ttZ(+jet(s)) 0.18± 0.03± 0.06 0.59± 0.05± 0.19 0.26± 0.03± 0.09• ttW+W− 0.013± 0.002± 0.005 0.053± 0.004± 0.021 0.032± 0.003± 0.013Total 2.5± 0.4± 0.4 5.1± 0.5± 0.9 3.3± 0.8± 0.7Observed 3 8 1
10

Table 7: Observed and expected number of events with statistical (first) and systematic (second) uncer-tainties for the four top quarks signal selection.
ChannelSamples ee eµ µµ
Charge misidentification 0.16± 0.04± 0.05 0.41± 0.07± 0.12 —Fakes 0.18± 0.17± 0.05 0.07± 0.28± 0.02 < 1.14Diboson•WZ/ZZ+jets < 0.1 0.01± 0.09± 0.01 < 0.11•W±W±+2 jets < 0.03 0.18± 0.16± 0.07 < 0.03tt +W/Z• ttW(+jet(s)) 0.31± 0.04± 0.12 0.93± 0.06± 0.35 0.65± 0.06± 0.25• ttZ(+jet(s)) 0.09± 0.02± 0.04 0.34± 0.04± 0.14 0.14± 0.02± 0.06• ttW+W− 0.012± 0.002± 0.005 0.039± 0.003± 0.016 0.024± 0.003± 0.01Total 0.8± 0.2± 0.1 2.0± 0.4± 0.4 0.8± 1.2± 0.3Observed 1 6 1
Table 8: Event selection efficiencies (in percent), relative to the inclusive cross section for theb′ →Wt and b′ → Wq (∼ 1/3 for eachq = u, c, t) signals, for several generated mass points. They arecomputed with respect to the generated events passing the lepton filter, and where theW is free to decayhadronically or leptonically.
Process Channelee eµ µµ
b′(400 GeV)→Wt 0.11± 0.01 0.39± 0.02 0.25± 0.02b′(600 GeV)→Wt 0.30± 0.02 0.82± 0.03 0.53± 0.02b′(800 GeV)→Wt 0.37± 0.02 1.02± 0.03 0.64± 0.02b′(1000 GeV)→Wt 0.35± 0.02 1.11± 0.03 0.63± 0.02b′(400 GeV)→Wq 0.024± 0.004 0.082± 0.007 0.060± 0.006b′(600 GeV)→Wq 0.09± 0.01 0.25± 0.01 0.14± 0.01b′(800 GeV)→Wq 0.13± 0.01 0.32± 0.01 0.19± 0.01b′(1000 GeV)→Wq 0.10± 0.01 0.32± 0.02 0.20± 0.01
Table 9: Event selection efficiencies (in percent), relative to the inclusive cross section for the vector-likeT (B) signal for several generatedT (B) mass points. Efficiencies are computed assuming the branchingratios from the singlet model.
Process Channelee eµ µµ
TT (350 GeV) 0.013± 0.002 0.038± 0.003 0.024± 0.003TT (550 GeV) 0.055± 0.004 0.136± 0.006 0.082± 0.005TT (750 GeV) 0.065± 0.005 0.176± 0.008 0.080± 0.005TT (850 GeV) 0.065± 0.005 0.171± 0.007 0.093± 0.005BB (350 GeV) 0.011± 0.002 0.043± 0.004 0.024± 0.003BB (550 GeV) 0.068± 0.005 0.218± 0.008 0.129± 0.006BB (750 GeV) 0.098± 0.006 0.269± 0.009 0.185± 0.008BB (850 GeV) 0.128± 0.006 0.344± 0.010 0.191± 0.008
11
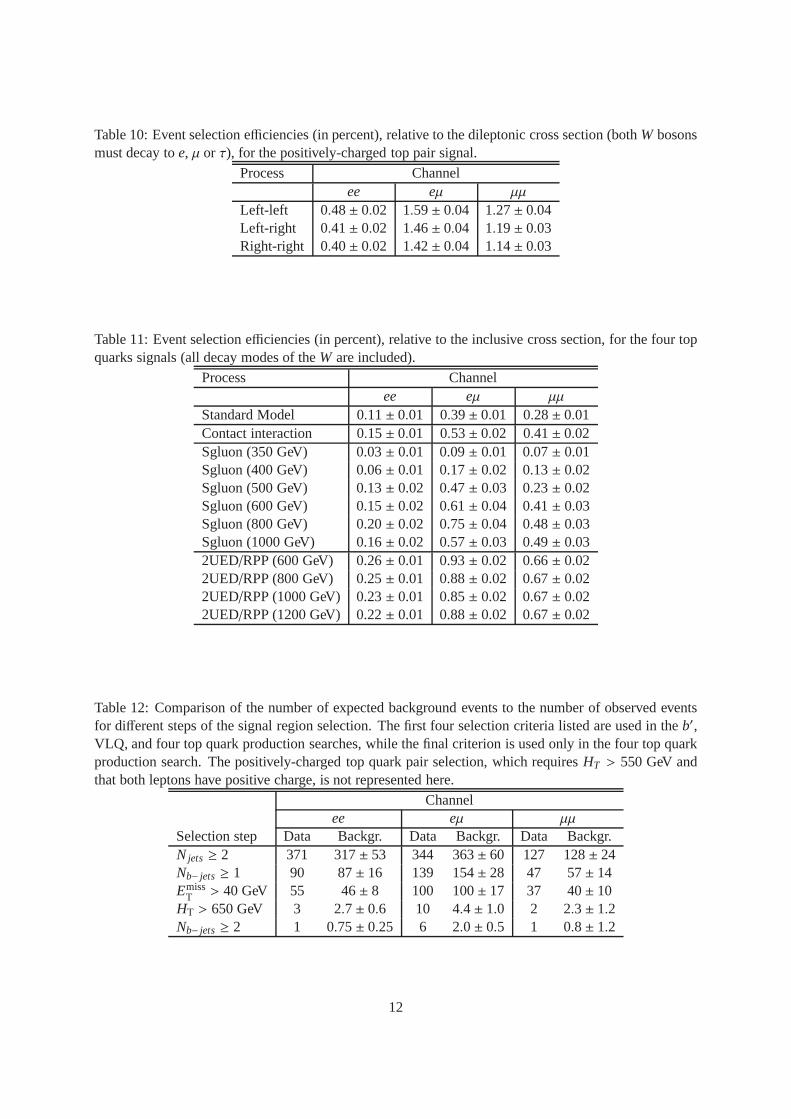
Table 10: Event selection efficiencies (in percent), relative to the dileptonic cross section (bothW bosonsmust decay toe, µ or τ), for the positively-charged top pair signal.
Process Channelee eµ µµ
Left-left 0.48± 0.02 1.59± 0.04 1.27± 0.04Left-right 0.41± 0.02 1.46± 0.04 1.19± 0.03Right-right 0.40± 0.02 1.42± 0.04 1.14± 0.03
Table 11: Event selection efficiencies (in percent), relative to the inclusive cross section, for the four topquarks signals (all decay modes of theW are included).
Process Channelee eµ µµ
Standard Model 0.11± 0.01 0.39± 0.01 0.28± 0.01Contact interaction 0.15± 0.01 0.53± 0.02 0.41± 0.02Sgluon (350 GeV) 0.03± 0.01 0.09± 0.01 0.07± 0.01Sgluon (400 GeV) 0.06± 0.01 0.17± 0.02 0.13± 0.02Sgluon (500 GeV) 0.13± 0.02 0.47± 0.03 0.23± 0.02Sgluon (600 GeV) 0.15± 0.02 0.61± 0.04 0.41± 0.03Sgluon (800 GeV) 0.20± 0.02 0.75± 0.04 0.48± 0.03Sgluon (1000 GeV) 0.16± 0.02 0.57± 0.03 0.49± 0.032UED/RPP (600 GeV) 0.26± 0.01 0.93± 0.02 0.66± 0.022UED/RPP (800 GeV) 0.25± 0.01 0.88± 0.02 0.67± 0.022UED/RPP (1000 GeV) 0.23± 0.01 0.85± 0.02 0.67± 0.022UED/RPP (1200 GeV) 0.22± 0.01 0.88± 0.02 0.67± 0.02
Table 12: Comparison of the number of expected background events to the number of observed eventsfor different steps of the signal region selection. The first four selection criteria listed are used in theb′,VLQ, and four top quark production searches, while the final criterion is used only in the four top quarkproduction search. The positively-charged top quark pair selection, which requiresHT > 550 GeV andthat both leptons have positive charge, is not represented here.
Channelee eµ µµ
Selection step Data Backgr. Data Backgr. Data Backgr.N jets ≥ 2 371 317± 53 344 363± 60 127 128± 24Nb− jets ≥ 1 90 87± 16 139 154± 28 47 57± 14Emiss
T > 40 GeV 55 46± 8 100 100± 17 37 40± 10HT > 650 GeV 3 2.7± 0.6 10 4.4± 1.0 2 2.3± 1.2Nb− jets ≥ 2 1 0.75± 0.25 6 2.0± 0.5 1 0.8± 1.2
12

statistical fluctuations of the total predictions according to Poisson statistics, as well as Gaussian fluctu-ations in the signal and background expectations describing the effect of systematic uncertainties. Signalcross sections for whichCLs = CLs+b/CLb < 0.05 are deemed excluded at the 95% C.L.
For each signal selection, the yield in theee and µµ channels is consistent with the backgroundexpectation. There is an excess of events in theeµ channel, with the excess being most significant for thefour top quark production selection (see Table 7). The probability of observing six or more events, giventhe expected background and the statistical and systematicuncertainties on that expectation, is 3.9%.Since this probability is not small enough to support any claim of new physics, we interpret the dataas constraining each of the new physics models, and report the 95% C.L. limits (upper limits for crosssections, or lower limits for masses) relevant for each model.
For theb′ and VLQ selection, 15 events are observed with 9.26± 0.78 expected from background.This observation places 95% C.L. upper limits on theb′ pair production cross section, as shown inFig. 4. Comparison with the calculated cross section implies that the mass of theb′ must be> 0.72 TeV,assuming 100% branching fraction toWt. The corresponding expected lower limit in the absence of asignal contribution is 0.77 TeV, and the observed result is consistent with this expectation at about the onestandard deviation level. If light quark decays are also considered, the limits become weaker due to thelower efficiency for events with one or zerob jets to satisfy our selection criteria. A two-dimensional scanof excludedb′ masses as a function of branching fraction toWt is shown in Fig. 5. The full branchingratio plane is not excluded for any mass point, since as the BR(b′ → Wt) goes to zero, no same-signdileptons and b-jets are produced.
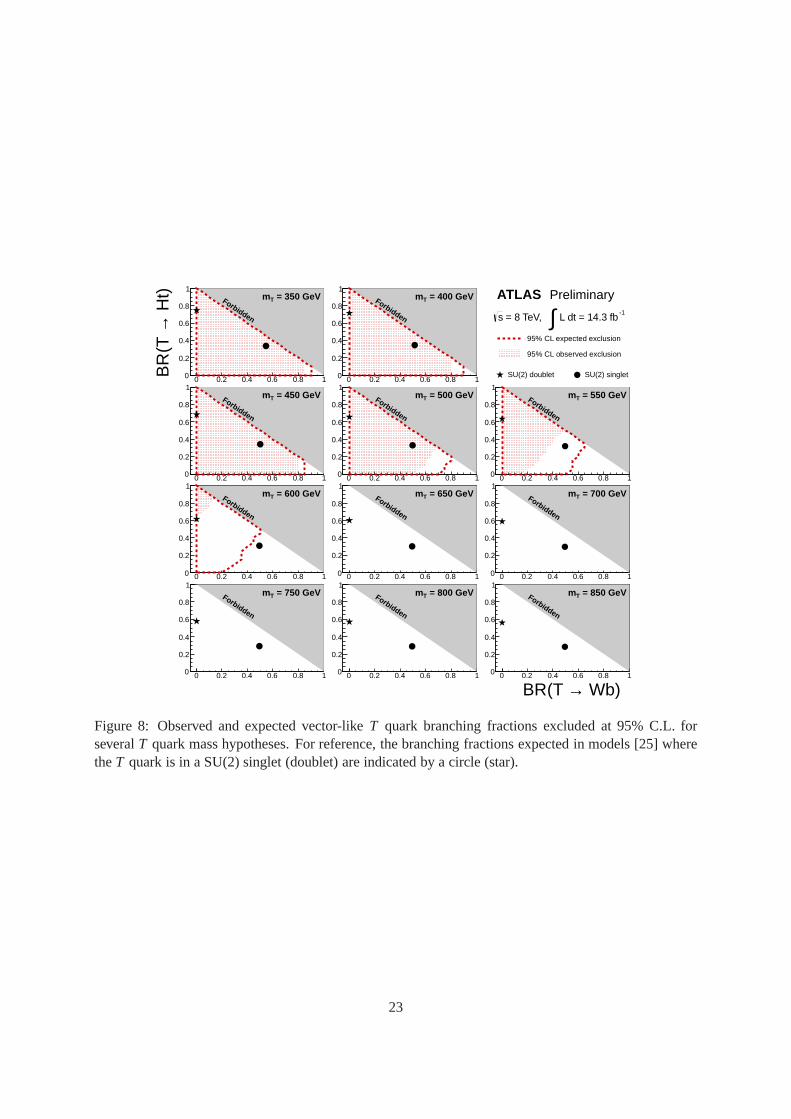
Limits on the VLQ pair-production cross section, assuming the branching fractions toW, Z, andH modes prescribed by the singlet model, are shown in Fig. 6. Comparison with the calculated crosssection results in lower limits on theB mass of 0.59 TeV and on theT mass of 0.54 TeV at 95% C.L. Theexpected limits in the absence of a signal contribution are 0.63 TeV for theB mass and 0.59 TeV for theT mass. If the three branching fractions are allowed to vary independently, the data can be interpretedas excluding at 95% C.L. some of the possible sets of branching ratios for a givenB or T mass. Theseexclusions are shown in Figs. 7 and 8.
For the positively-charged top quark pair selection, 12 events are observed with 10.9± 1.6 expectedfrom background. This implies upper limits on the production cross section of 0.19 pb for left-leftchirality, 0.20 pb for left-right chirality, and 0.21 pb forright-right chirality, as shown in Table 13. Thecorresponding expected limits in the absence of a signal contribution are 0.19+0.09
−0.05 pb, 0.21+0.09−0.06 pb, and
0.22+0.10−0.07 pb, respectively. For each chirality, the upper limit onC as a function ofΛ is shown in Figure 9.For the four top selection, 8 events are observed with 3.6 ± 1.3 expected from background. This
translates to an upper limit on the cross section of 85 fb assuming SM kinematics, or to a limit of 59fb for production with a new-physics contact interaction. Both of these results are consistent with theexpected limits within one standard deviation, as shown in Table 14. In the context of specific newphysics models, we find that the lower limit on the sgluon massis 0.80 TeV, assuming that the gluons arepair-produced and always decay tott (for an expected limit of 0.83 TeV); the lower-limit on the Kaluza-Klein mass is 0.90 TeV (for an expected limit of 0.92 TeV); and, in the contact interaction model, theupper limit onC depends on the value ofΛ, as shown in Fig. 10.
8 Conclusion
A search for new physics has been performed using events withtwo leptons of the same electric charge,at least one identifiedb jet, sizable missing transverse momentum, and largeHT. Several new physicseffects could enhance the yield of such events over the small SM expectation. The search has been donein the context of several new physics models, with event selection criteria optimised for each scenario.No significant excess of events over background is observed for any of the selections, resulting in the 95%
13

[GeV]TH0 200 400 600 800 1000120014001600180020002200
Eve
nts
/ 100
GeV
0
0.5
1
1.5
2
2.5b’->Wt 800GeV
b’->Wt 650GeV
Data
Q Mis-id
Fakes
+Z/W(W)tt
WZ/ZZ
±W±W
=8 TeVsee channel, ATLAS Preliminary -1Ldt = 14.3 fb∫
[GeV]missTE
0 100 200 300 400 500 600 700 800
Eve
nts
/ 40
GeV
0
0.5
1
1.5
2
2.5
3
3.5 b’->Wt 800GeV
b’->Wt 650GeV
Data
Q Mis-id
Fakes
+Z/W(W)tt
WZ/ZZ
±W±W
=8 TeVsee channel, ATLAS Preliminary -1Ldt = 14.3 fb∫
[GeV]TH0 200 400 600 800 1000120014001600180020002200
Eve
nts
/ 100
GeV
0
1
2
3
4
5
6
7 b’->Wt 800GeV
b’->Wt 650GeV
Data
Q Mis-id
Fakes
+Z/W(W)tt
WZ/ZZ
±W±W
=8 TeVs channel, µeATLAS Preliminary -1Ldt = 14.3 fb∫
[GeV]missTE
0 100 200 300 400 500 600 700 800
Eve
nts
/ 40
GeV
0
0.5
1
1.5
2
2.5
3
3.5 b’->Wt 800GeV
b’->Wt 650GeV
Data
Q Mis-id
Fakes
+Z/W(W)tt
WZ/ZZ
±W±W
=8 TeVs channel, µeATLAS Preliminary -1Ldt = 14.3 fb∫
[GeV]TH0 200 400 600 800 1000120014001600180020002200
Eve
nts
/ 100
GeV
0
0.5
1
1.5
2
2.5
3 b’->Wt 800GeV
b’->Wt 650GeV
Data
Fakes
+Z/W(W)tt
WZ/ZZ
±W±W
=8 TeVs channel, µµATLAS Preliminary -1Ldt = 14.3 fb∫
[GeV]missTE
0 100 200 300 400 500 600 700 800
Eve
nts
/ 40
GeV
0
0.5
1
1.5
2
2.5
3
b’->Wt 800GeV
b’->Wt 650GeV
Data
Fakes
+Z/W(W)tt
WZ/ZZ
±W±W
=8 TeVs channel, µµATLAS Preliminary -1Ldt = 14.3 fb∫
Figure 3: Distribution of kinematic variables for the data (points) and for the estimated background(histograms), after applying theb′/VLQ signal selection. The shaded areas correspond to the total uncer-tainties on the background, where statistical uncertainties are dominant. For the Monte Carlo simulatedsamples, systematic uncertainties include only the production cross section uncertainties.
Table 13: Expected and observed limits on the positively-charged top quark pair production signal.
95% C.L. upper limitσ(pp→ tt) [pb] |C|/Λ2 [TeV−2]
Chirality configuration Expected 1σ range Observed ObservedLeft-left 0.14-0.28 0.19 0.092Left-right 0.15-0.30 0.20 0.271Right-right 0.15-0.32 0.21 0.099
14

[TeV]b’m
0.4 0.5 0.6 0.7 0.8 0.9 1
Wt)
[pb]
→ B
R(b
’× σ
-310
-210
-110
1
Exp
ecte
dO
bser
ved
Expected limit at 95% CL
Observed limit
σ 1 ±Expected limit
σ 2 ±Expected limit
Theory approx. NNLO
= 8 TeVs, -1
Ldt = 14.3 fb∫ATLAS Preliminary
Figure 4: Expected and observed upper limits on the pair production cross section ofb′ → Wt, as afunction of theb′ mass.
Table 14: Expected and observed limits on two four top quarkssignals.
95% C.L. upper limitσ(pp→ tttt) [fb] |C|/Λ2 [TeV−2]
Model Expected 1σ range Observed ObservedStandard Model 43-89 85 —Contact interaction 29-61 59 15
15

Wt)→BF(b’
0 0.2 0.4 0.6 0.8 1
[TeV
]b’
m
0.4
0.5
0.6
0.7
0.8
0.9
1
95% CL observed exclusion
95% CL expected exclusion
= 8 TeVs, -1
L dt = 14.3 fb∫ATLAS Preliminary
Figure 5: Expected and observed upper limit contours on the pair production cross section ofb′ → Wq,as a function of theb′ mass and the branching ratio toWt, calculated from theb′ → Wqsample. TheMC simulated signal samples used in this plot are statistically independent of those used to produce the1D limits (Fig. 4), leading to a slight difference in the mass limit for BR(b′ →Wt) = 100%.
16

C.L. limits mb′ > 0.72 TeV (assuming 100% branching fraction toWt), mB > 0.59 TeV,mT > 0.54 TeV(assuming branching fractions to theW, Z, and H decay modes arising from a singlet model), crosssection for production of two positively-charged top quarks < 0.21 pb, SM four top production crosssection< 85 fb, sgluon mass> 0.80 TeV and Kaluza-Klein mass (in the context of models with twouniversal extra dimensions)> 0.90 TeV.
References
[1] ATLAS Collaboration,Observation of a new particle in the search for the Standard Model Higgsboson with the ATLAS detector at the LHC, Phys.Lett.B716 (2012) 1–29,arXiv:1207.7214[hep-ex].
[2] CMS Collaboration,Observation of a new boson at a mass of 125 GeV with the CMS experimentat the LHC, Physics Letters B716 (2012) 30 – 61.
[3] S. Bar-Shalom, M. Geller, S. Nandi, and A. Soni,Two Higgs doublets, a 4th generation and a 125GeV Higgs, arXiv:1208.3195 [hep-ph].
[4] B. A. Dobrescu and C. T. Hill,Electroweak symmetry breaking via top condensation seesaw,Phys.Rev.Lett.81 (1998) 2634–2637,arXiv:hep-ph/9712319 [hep-ph].
[5] R. S. Chivukula, B. A. Dobrescu, H. Georgi, and C. T. Hill,Top quark seesaw theory ofelectroweak symmetry breaking, Phys.Rev.D59 (1999) 075003,arXiv:hep-ph/9809470[hep-ph].
[6] H.-J. He, C. T. Hill, and T. M. Tait,Top quark seesaw, vacuum structure and electroweak precisionconstraints, Phys.Rev.D65 (2002) 055006,arXiv:hep-ph/0108041 [hep-ph].
[7] C. T. Hill and E. H. Simmons,Strong dynamics and electroweak symmetry breaking, Phys.Rept.381 (2003) 235–402,arXiv:hep-ph/0203079 [hep-ph].
[8] R. Contino, L. Da Rold, and A. Pomarol,Light custodians in natural composite Higgs models,Phys.Rev.D75 (2007) 055014,arXiv:hep-ph/0612048 [hep-ph].
[9] C. Anastasiou, E. Furlan, and J. Santiago,Realistic Composite Higgs Models, Phys.Rev.D79(2009) 075003,arXiv:0901.2117 [hep-ph].
[10] K. Kong, M. McCaskey, and G. W. Wilson,Multi-lepton signals from the top-prime quark at theLHC, JHEP1204 (2012) 079,arXiv:1112.3041 [hep-ph].
[11] A. Carmona, M. Chala, and J. Santiago,New Higgs Production Mechanism in Composite HiggsModels, JHEP1207 (2012) 049,arXiv:1205.2378 [hep-ph].
[12] M. Gillioz, R. Grober, C. Grojean, M. Muhlleitner, and E. Salvioni,Higgs Low-Energy Theorem(and its corrections) in Composite Models, JHEP1210 (2012) 004,arXiv:1206.7120[hep-ph].
[13] A. Davidson and K. C. Wali,Family mass hierarchy from universal seesaw mechanism, Phys. Rev.Lett. 60 (1988) 1813–1816.
[14] K. S. Babu and R. N. Mohapatra,Solution to the strongCPproblem without an axion, Phys. Rev.D 41 (1990) 1286–1291.
17

[15] B. Grinstein, M. Redi, and G. Villadoro,Low Scale Flavor Gauge Symmetries, JHEP1011 (2010)067,arXiv:1009.2049 [hep-ph].
[16] D. Guadagnoli, R. N. Mohapatra, and I. Sung,Gauged Flavor Group with Left-Right Symmetry,JHEP1104 (2011) 093,arXiv:1103.4170 [hep-ph].
[17] N. Arkani-Hamed, A. Cohen, E. Katz, and A. Nelson,The Littlest Higgs, JHEP0207 (2002) 034,arXiv:hep-ph/0206021 [hep-ph].
[18] T. Han, H. E. Logan, B. McElrath, and L.-T. Wang,Phenomenology of the little Higgs model,Phys.Rev.D67 (2003) 095004,arXiv:hep-ph/0301040 [hep-ph].
[19] M. Perelstein, M. E. Peskin, and A. Pierce,Top quarks and electroweak symmetry breaking inlittle Higgs models, Phys.Rev.D69 (2004) 075002,arXiv:hep-ph/0310039 [hep-ph].
[20] M. Schmaltz and D. Tucker-Smith,Little Higgs review, Ann.Rev.Nucl.Part.Sci.55 (2005)229–270,arXiv:hep-ph/0502182 [hep-ph].
[21] M. S. Carena, J. Hubisz, M. Perelstein, and P. Verdier,Collider signature of T-quarks, Phys.Rev.D75 (2007) 091701,arXiv:hep-ph/0610156 [hep-ph].
[22] S. Matsumoto, T. Moroi, and K. Tobe,Testing the Littlest Higgs Model with T-parity at the LargeHadron Collider, Phys.Rev.D78 (2008) 055018,arXiv:0806.3837 [hep-ph].
[23] J. Aguilar-Saavedra,Effects of mixing with quark singlets, Phys.Rev.D67 (2003) 035003,arXiv:hep-ph/0210112 [hep-ph].
[24] Y. Okada and L. Panizza,LHC signatures of vector-like quarks, arXiv:1207.5607 [hep-ph].
[25] J. Aguilar-Saavedra,Identifying top partners at LHC, JHEP0911 (2009) 030,arXiv:0907.3155[hep-ph].
[26] M. Aliev, H. Lacker, U. Langenfeld, S. Moch, P. Uwer, et al., HATHOR: HAdronic Top and Heavyquarks crOss section calculatoR, arXiv:1007.1327 [hep-ph].
[27] V. Barger, A. L. Stange, and R. J. N. Phillips,Four-heavy-quark hadroproduction, Phys. Rev. D44(1991) 1987–1996.
[28] V. Barger, W.-Y. Keung, and B. Yencho,Triple-Top Signal of New Physics at the LHC, Phys.Lett.B687 (2010) 70–74,arXiv:1001.0221 [hep-ph].
[29] C. Degrande, J.-M. Gerard, C. Grojean, F. Maltoni, and G. Servant,Non-resonant New Physics inTop Pair Production at Hadron Colliders, JHEP1103 (2011) 125,arXiv:1010.6304 [hep-ph].
[30] T. Plehn and T. M. Tait,Seeking Sgluons, J.Phys.G36 (2009) 075001,arXiv:0810.3919[hep-ph].
[31] S. Choi, M. Drees, J. Kalinowski, J. Kim, E. Popenda, et al., Color-Octet Scalars of N=2Supersymmetry at the LHC, Phys.Lett.B672 (2009) 246–252,arXiv:0812.3586 [hep-ph].
[32] C. Kilic, T. Okui, and R. Sundrum,Vectorlike Confinement at the LHC, JHEP1002 (2010) 018,arXiv:0906.0577 [hep-ph].
[33] C. Kilic, T. Okui, and R. Sundrum,Colored Resonances at the Tevatron: Phenomenology andDiscovery Potential in Multijets, JHEP0807 (2008) 038,arXiv:0802.2568 [hep-ph].
18

[34] G. Burdman, B. A. Dobrescu, and E. Ponton,Resonances from two universal extra dimensions,Phys.Rev.D74 (2006) 075008,arXiv:hep-ph/0601186 [hep-ph].
[35] S. Calvet, B. Fuks, P. Gris, and L. Valery,Searching for sgluons in multitop events at acenter-of-mass energy of 8 TeV, JHEP1304 (2013) 043,arXiv:1212.3360 [hep-ph].
[36] D. Goncalves-Netto, D. Lopez-Val, K. Mawatari, T. Plehn, and I. Wigmore,Sgluon PairProduction to Next-to-Leading Order, Phys.Rev.D85 (2012) 114024,arXiv:1203.6358[hep-ph].
[37] G. Cacciapaglia, A. Deandrea, and J. Llodra-Perez,A Dark Matter candidate from LorentzInvariance in6D, JHEP1003 (2010) 083. [arXiv:0907.4993v1 [hep-ph]].
[38] A. Arbey, G. Cacciapaglia, A. Deandrea, and B. Kubik,Dark Matter in a twisted bottle, JHEP1301 (2013) 147. [arXiv:1210.0384v1 [hep-ph]].
[39] ATLAS Collaboration,Search for exotic same-sign dilepton signatures (b’ quark,T5/3 and fourtop quarks production) in 4.7fb−1 of pp collisions at
√s= 7 TeV with the ATLAS detector,
ATLAS-CONF-2012-130 (2012) .
[40] J. Aguilar-Saavedra and M. Perez-Victoria,No like-sign tops at Tevatron: Constraints on extendedmodels and implications for the t tbar asymmetry, Phys.Lett.B701 (2011) 93–100,arXiv:1104.1385 [hep-ph].
[41] E. L. Berger, Q.-H. Cao, C.-R. Chen, C. S. Li, and H. Zhang, Top Quark Forward-BackwardAsymmetry and Same-Sign Top Quark Pairs, Phys.Rev.Lett.106 (2011) 201801,arXiv:1101.5625 [hep-ph].
[42] ATLAS Collaboration,Search for same-sign top-quark production and fourth-generationdown-type quarks in pp collisions at
√s= 7 TeV with the ATLAS detector, JHEP1204 (2012)
069,arXiv:1202.5520 [hep-ex].
[43] CMS Collaboration,Search for T5/3 top partners in same-sign dilepton final state,CMS-PAS-B2G-12-012 (2013) .
[44] ATLAS Collaboration,The ATLAS Experiment at the CERN Large Hadron Collider, JINST3(2008) S08003.
[45] T. Sjostrand and S. Mrenna and P.Z. Skands,PYTHIA 6.4 Physics and Manual, JHEP05 (2006)026,hep-ph/0603175.
[46] J. Alwall, M. Herquet, F. Maltoni, O. Mattelaer, and T. Stelzer,MadGraph 5 : Going Beyond,JHEP1106 (2011) 128,arXiv:1106.0522 [hep-ph].
[47] T. Gleisberg et al.,Event generation with SHERPA 1.1, JHEP0902 (2009) 007.
[48] S. Agostinelli et al.,Geant4 A Simulation Toolkit, Nucl. Instr. and Meth.A506 (2003) 250.
[49] ATLAS Collaboration,The ATLAS Simulation Infrastructure, Eur. Phys. J.C70 (2010) 823–874,arXiv:1005.4568 [physics.ins-det].
[50] M. Cacciari, G. P. Salam, and G. Soyez,The Anti-k(t) jet clustering algorithm, JHEP0804 (2008)063,arXiv:0802.1189 [hep-ph].
19

[51] M. Cacciari and G. P. Salam,Dispelling the N3 myth for the kt jet-finder, Physics Letters B641(2006) 57 – 61.
[52] M. Cacciari, G. P. Salam, and G. Soyez,FastJet User Manual, Eur.Phys.J.C72 (2012) 1896,arXiv:1111.6097 [hep-ph].
[53] ATLAS Collaboration, G. Aad et al.,Jet energy measurement with the ATLAS detector inproton-proton collisions at
√s= 7 TeV, Eur.Phys.J.C73 (2013) 2304,arXiv:1112.6426
[hep-ex].
[54] ATLAS Collaboration,Commissioning of the ATLAS high-performance b-tagging algorithms inthe 7 TeV collision data, ATLAS-CONF-2011-102, ATLAS-COM-CONF-2011-110.
[55] ATLAS Collaboration,Electron performance measurements with the ATLAS detectorusing the2010 LHC proton-proton collision data, Eur. Phys. J.C72 (2012) 1909,arXiv:1110.3174[hep-ex].
[56] ATLAS Collaboration,Muon reconstruction efficiency in reprocessed 2010 LHC proton-protoncollision data recorded with the ATLAS detector, ATLAS-CONF-2011-063 (2011) .https://cdsweb.cern.ch/record/1345743.
[57] ATLAS Collaboration,A measurement of the muon reconstruction efficiency in 2010 ATLAS datausing jpsi decays, ATLAS-CONF-2012-125.https://cds.cern.ch/record/1474642.
[58] ATLAS Collaboration,Muon Momentum Resolution in First Pass Reconstruction of ppCollisionData Recorded by ATLAS in 2010, ATLAS-CONF-2011-046.https://cdsweb.cern.ch/record/1338575.
[59] K. Rehermann and B. Tweedie,Efficient Identification of Boosted Semileptonic Top Quarks at theLHC, JHEP1103 (2011) 059,arXiv:1007.2221 [hep-ph].
[60] J. M. Campbell and R. K. Ellis,ttW+− production and decay at NLO, JHEP1207 (2012) 052,arXiv:1204.5678 [hep-ph].
[61] ATLAS Collaboration,Luminosity Determination in pp Collisions at√
s= 7 TeVUsing theATLAS Detector at the LHC, Eur. Phys. J.C71 (2011) 1630,arXiv:1101.2185 [hep-ex].
[62] ATLAS Collaboration,Luminosity Determination in pp Collisions at√
s= 7 TeVusing the ATLASDetector in 2011, ATLAS-CONF-2011-116 (2011) . https://cdsweb.cern.ch/record/1376384.
[63] T. Junk,Confidence level computation for combining searches with small statistics,Nucl.Instrum.Meth.A434 (1999) 435–443,arXiv:hep-ex/9902006 [hep-ex].
[64] A. L. Read,Presentation of search results: the CL s technique, Journal of Physics G: Nuclear andParticle Physics2810 (2002) 2693.http://stacks.iop.org/0954-3899/28/i=10/a=313.
20

[TeV]Bm
0.3 0.4 0.5 0.6 0.7 0.8 0.9
[fb]
BB
σ
210
310
410
Exp
ecte
d
Obs
erve
d
Obs. 95% CL upper limitExp. 95% CL upper limit
uncertaintyσExp. 1 uncertaintyσExp. 2
Heavy Quark Pair Production
Obs. 95% CL upper limitExp. 95% CL upper limit
uncertaintyσExp. 1 uncertaintyσExp. 2
Heavy Quark Pair Production
ATLAS Preliminary-1 = 14.3 fbdt L
∫ = 8 TeVs,
(a)
[TeV]Tm
0.3 0.4 0.5 0.6 0.7 0.8 0.9
[fb]
TT
σ
210
310
410
Exp
ecte
d
Obs
erve
d
Obs. 95% CL upper limitExp. 95% CL upper limit
uncertaintyσExp. 1 uncertaintyσExp. 2
Heavy Quark Pair Production
Obs. 95% CL upper limitExp. 95% CL upper limit
uncertaintyσExp. 1 uncertaintyσExp. 2
Heavy Quark Pair Production
ATLAS Preliminary-1 = 14.3 fbdt L
∫ = 8 TeVs,
(b)
Figure 6: Observed limits on the mass of (a) vector-likeB and (b) vector-likeT quarks. These lim-its assume pair production, with branching ratios given by model where theB andT quarks exist assinglets [25].
21

0 0.2 0.4 0.6 0.8 10
0.2
0.4
0.6
0.8
1Forbidden
= 750 GeVBm
0 0.2 0.4 0.6 0.8 10
0.2
0.4
0.6
0.8
1Forbidden
= 800 GeVBm
0 0.2 0.4 0.6 0.8 10
0.2
0.4
0.6
0.8
1Forbidden
= 850 GeVBm
0 0.2 0.4 0.6 0.8 10
0.2
0.4
0.6
0.8
1
Forbidden
= 600 GeVBm
0 0.2 0.4 0.6 0.8 10
0.2
0.4
0.6
0.8
1
Forbidden
= 650 GeVBm
0 0.2 0.4 0.6 0.8 10
0.2
0.4
0.6
0.8
1
Forbidden
= 700 GeVBm
0 0.2 0.4 0.6 0.8 10
0.2
0.4
0.6
0.8
1
Forbidden
= 450 GeVBm
0 0.2 0.4 0.6 0.8 10
0.2
0.4
0.6
0.8
1
Forbidden
= 500 GeVBm
0 0.2 0.4 0.6 0.8 10
0.2
0.4
0.6
0.8
1
Forbidden
= 550 GeVBm
0 0.2 0.4 0.6 0.8 10
0.2
0.4
0.6
0.8
1Forbidden
= 350 GeVBm
0 0.2 0.4 0.6 0.8 10
0.2
0.4
0.6
0.8
1Forbidden
= 400 GeVBm ATLAS Preliminary
= 8 TeV, s -1
L dt = 14.3 fb∫
SU(2) singletSU(2) doublet
95% CL expected exclusion
95% CL observed exclusion
Wt)→BR(B
Hb)
→B
R(B
Figure 7: Observed and expected vector-likeB quark branching fractions excluded at 95% C.L. forseveralB quark mass hypotheses. For reference, the branching fractions expected in models [25] wheretheB quark is in a SU(2) singlet (doublet) are indicated by a circle (star).
22
0 0.2 0.4 0.6 0.8 10
0.2
0.4
0.6
0.8
1Forbidden
= 750 GeVTm
0 0.2 0.4 0.6 0.8 10
0.2
0.4
0.6
0.8
1Forbidden
= 800 GeVTm
0 0.2 0.4 0.6 0.8 10
0.2
0.4
0.6
0.8
1Forbidden
= 850 GeVTm
0 0.2 0.4 0.6 0.8 10
0.2
0.4
0.6
0.8
1
Forbidden
= 600 GeVTm
0 0.2 0.4 0.6 0.8 10
0.2
0.4
0.6
0.8
1
Forbidden
= 650 GeVTm
0 0.2 0.4 0.6 0.8 10
0.2
0.4
0.6
0.8
1
Forbidden
= 700 GeVTm
0 0.2 0.4 0.6 0.8 10
0.2
0.4
0.6
0.8
1
Forbidden
= 450 GeVTm
0 0.2 0.4 0.6 0.8 10
0.2
0.4
0.6
0.8
1
Forbidden
= 500 GeVTm
0 0.2 0.4 0.6 0.8 10
0.2
0.4
0.6
0.8
1
Forbidden
= 550 GeVTm
0 0.2 0.4 0.6 0.8 10
0.2
0.4
0.6
0.8
1Forbidden
= 350 GeVTm
0 0.2 0.4 0.6 0.8 10
0.2
0.4
0.6
0.8
1Forbidden
= 400 GeVTm ATLAS Preliminary
= 8 TeV, s -1
L dt = 14.3 fb∫
SU(2) singletSU(2) doublet
95% CL expected exclusion
95% CL observed exclusion
Wb)→BR(T
Ht)
→B
R(T
Figure 8: Observed and expected vector-likeT quark branching fractions excluded at 95% C.L. forseveralT quark mass hypotheses. For reference, the branching fractions expected in models [25] wheretheT quark is in a SU(2) singlet (doublet) are indicated by a circle (star).
23

[TeV]Λ
2 3 4 5 6 7 8 9 10
|LL
|C
0
2
4
6
8
10
12
Excluded region at 95% CL
Observed limit at 95% CLExpected limit at 95% CL
σ 1±Expected limit
σ 2±Expected limit
ATLAS Preliminary
-1Ldt =14.3 fb∫
= 8 TeVs
(a)
[TeV]Λ
2 3 4 5 6 7 8 9 10
|R
R|C
0
2
4
6
8
10
12
Excluded region at 95% CL
Observed limit at 95% CL
Expected limit at 95% CL
σ 1±Expected limit
σ 2±Expected limit
ATLAS Preliminary
-1Ldt =14.3 fb∫
= 8 TeVs
(b)
[TeV]Λ
2 3 4 5 6 7 8 9 10
|LR
|C
0
2
4
6
8
10
12
Excluded region at 95% CL
Observed limit at 95% CL
Expected limit at 95% CL
σ 1±Expected limit
σ 2±Expected limit
ATLAS Preliminary
-1Ldt =14.3 fb∫ = 8 TeVs
(c)
Figure 9: Observed limits on positively-charged top quark pair production in the plane of the couplingconstantC as a function of the new physics energy scaleΛ (as defined in Eq. 9.1 of [42]) for (a) left-left,(b) right-right, and (c) left-right chiralities. The hashed region is excluded at 95% C.L..
24

Sgluon mass [TeV]0.3 0.4 0.5 0.6 0.7 0.8 0.9 1
) [p
b]ttt
BR
(t× σ
-210
-110
1
10
ATLAS Preliminary
= 8 TeVs -1
Ldt = 14.3 fb∫
Expected limit at 95 % CL
σ 1±Expected limit
σ 2±Expected limit
Theory (NLO)
Observed limit at 95 % CL
(a)
[TeV]KKm0.6 0.7 0.8 0.9 1 1.1 1.2
BR
[pb]
× σ-310
-210
-110
1
Expected limit at 95% CL
σ 1 ±Expected limit
σ 2 ±Expected limit
Theory approx. LO
Observed limit at 95% CL
ATLAS Preliminary
= 8 TeVs, -1
Ldt = 14.3 fb∫
(b)
[TeV]Λ2 2.2 2.4 2.6 2.8 3 3.2 3.4
|C|
30
40
50
60
70
80
90
100
Excluded region at 95% CL
Observed limit at 95% CL
Expected limit at 95% CL
σ 1±Expected limit
σ 2±Expected limit
ATLAS Preliminary
-1Ldt =14.3 fb∫ = 8 TeVs
(c)
Figure 10: Observed limits on the four top quarks events production interpreted in the context of (a)sgluon pair production, (b) the 2UED/RPP model, and (c) the four-fermion contact interaction of Eq. 1(in (c) the hashed region is excluded at 95% C.L.).
25
A Additional plots and tables
jetsN2 4 6 8 10 12 14 16 18 20
Eve
nts
-110
1
10
Q Mis-id
Fakes
+Z/W(W)tt
WZ/ZZ
±W±W
65.3)×4-tops Contact (
75.4)×b’->Wt 800GeV (
=8 TeVsee channel, ATLAS Preliminary -1Ldt = 14.3 fb∫
b-jetsN0 2 4 6 8 10
Eve
nts
-110
1
10
210Q Mis-id
Fakes
+Z/W(W)tt
WZ/ZZ
±W±W
65.3)×4-tops Contact (
75.4)×b’->Wt 800GeV (
=8 TeVsee channel, ATLAS Preliminary -1Ldt = 14.3 fb∫
[GeV]TH500 1000 1500 2000 2500 3000 3500
Eve
nts
/ 100
GeV
-110
1
10
Q Mis-id
Fakes
+Z/W(W)tt
WZ/ZZ
±W±W
65.3)×4-tops Contact (
75.4)×b’->Wt 800GeV (
=8 TeVsee channel, ATLAS Preliminary -1Ldt = 14.3 fb∫
[GeV]missTE
0 100 200 300 400 500 600 700 800 900 1000
Eve
nts
/ 40
GeV
-110
1
10
210
Q Mis-id
Fakes
+Z/W(W)tt
WZ/ZZ
±W±W
65.3)×4-tops Contact (
75.4)×b’->Wt 800GeV (
=8 TeVsee channel, ATLAS Preliminary -1Ldt = 14.3 fb∫
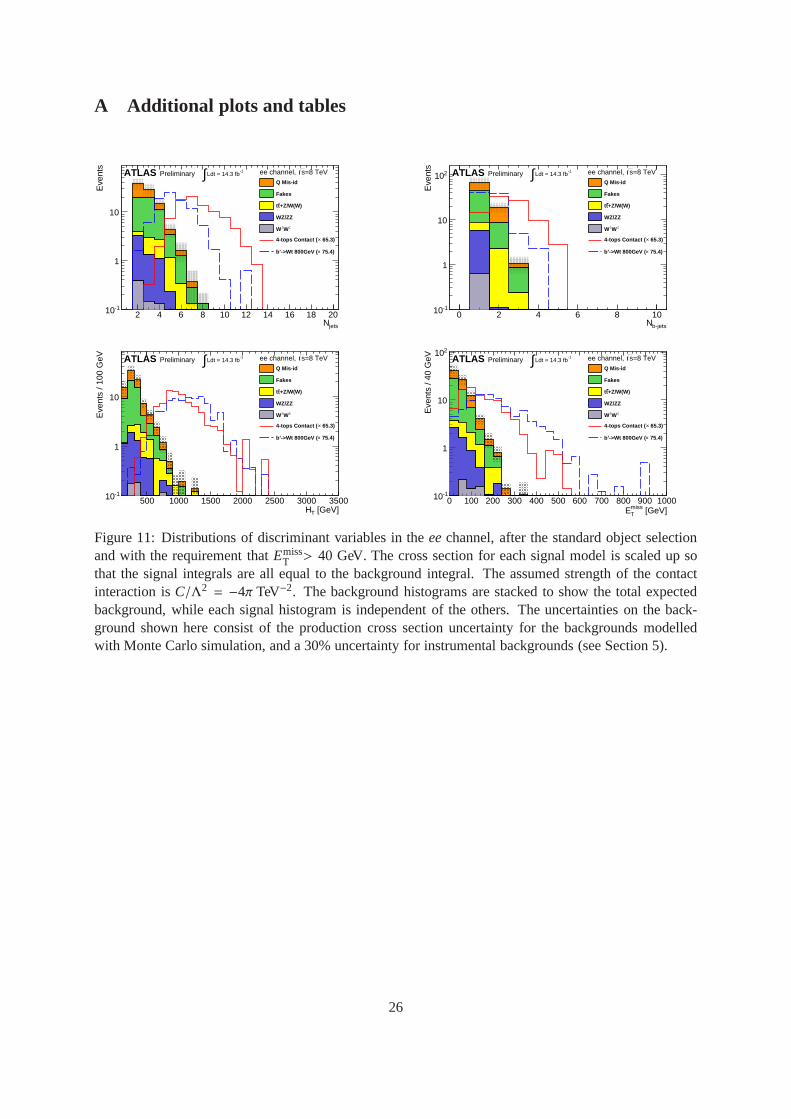
Figure 11: Distributions of discriminant variables in theeechannel, after the standard object selectionand with the requirement thatEmiss
T > 40 GeV. The cross section for each signal model is scaled up sothat the signal integrals are all equal to the background integral. The assumed strength of the contactinteraction isC/Λ2 = −4π TeV−2. The background histograms are stacked to show the total expectedbackground, while each signal histogram is independent of the others. The uncertainties on the back-ground shown here consist of the production cross section uncertainty for the backgrounds modelledwith Monte Carlo simulation, and a 30% uncertainty for instrumental backgrounds (see Section 5).
26

Table 15: Observed and expected number of events with statistical (first) and systematic (second) uncer-tainties for theHT control region selection. For the Monte Carlo samples, the systematic uncertaintiesinclude only the production cross section uncertainty.
ChannelSamples ee eµ µµ
Charge misidentification 13.3± 0.5± 3.5 9.3± 0.4± 2.5 —Fakes 24.3± 3.3± 7.3 34.0± 3.9± 10.2 11.7± 6.9± 3.5Diboson•WZ/ZZ+jets 2.6± 0.6± 0.9 7.1± 1.0± 2.4 2.4± 0.6± 0.8•W±W±+2 jets 0.09± 0.06± 0.05 0.7± 0.2± 0.4 0.4± 0.1± 0.2tt +W/Z• ttW(+jet) 0.6± 0.1± 0.2 2.5± 0.1± 0.8 1.6± 0.1± 0.5• ttZ(+jet) 0.38± 0.04± 0.11 1.0± 0.1± 0.3 0.5± 0.1± 0.2• ttW+W− 0.007± 0.001 0.034± 0.003 0.021± 0.003Total 41± 5± 8 55± 6± 11 17± 9± 4Observed 35 39 10Signal contamination• b′ →Wt (800 GeV) 0.03± 0.01 0.13± 0.02 0.09± 0.02• 4 tops contact (C/Λ2 = −4π TeV−2) 0.10± 0.03 0.34± 0.05 0.41± 0.05
Table 16: Observed and expected number of events with statistical (first) and systematic (second) un-certainties for the zero-b-tag control region selection. For the Monte Carlo samples,the systematicuncertainties include only the production cross section uncertainty.
ChannelSamples ee eµ µµ
Charge misidentification 99.1± 1.6± 26.3 12.0± 0.4± 3.2 —Fakes 80.2± 8.0± 24.1 80.7± 6.1± 24.2 21.3± 4.0± 6.4Diboson•WZ/ZZ+jets 40.5± 2.1± 13.8 89.9± 3.0± 30.5 36.7± 2.0± 12.5•W±W±+2 jets 6.0± 0.5± 3.0 22.0± 1.0± 11.0 12.0± 0.8± 6.0tt +W/Z• ttW(+jet) 0.9± 0.1± 0.3 2.9± 0.1± 0.9 2.0± 0.1± 0.6• ttZ(+jet) 0.29± 0.04± 0.09 0.99± 0.07± 0.30 0.50± 0.06± 0.15• ttW+W− 0.021± 0.003 0.053± 0.004 0.039± 0.004Total 227± 12± 38 208± 11± 41 73± 8± 15Observed 281 205 80Signal contamination• b′ →Wt (800 GeV) 0.25± 0.04 0.53± 0.06 0.49± 0.05• 4 tops contact (C/Λ2 = −4π TeV−2) 0.06± 0.02 0.17± 0.04 0.12± 0.03
27

jetsN2 4 6 8 10 12 14 16 18 20
Eve
nts
-110
1
10
Fakes
+Z/W(W)tt
WZ/ZZ
±W±W
14.8)×4-tops Contact (
26.9)×b’->Wt 800GeV (
=8 TeVs channel, µµATLAS Preliminary -1Ldt = 14.3 fb∫
b-jetsN0 2 4 6 8 10
Eve
nts
-110
1
10
210
Fakes
+Z/W(W)tt
WZ/ZZ
±W±W
14.8)×4-tops Contact (
26.9)×b’->Wt 800GeV (
=8 TeVs channel, µµATLAS Preliminary -1Ldt = 14.3 fb∫
[GeV]TH500 1000 1500 2000 2500 3000 3500
Eve
nts
/ 100
GeV
-110
1
10
Fakes
+Z/W(W)tt
WZ/ZZ
±W±W
14.8)×4-tops Contact (
26.9)×b’->Wt 800GeV (
=8 TeVs channel, µµATLAS Preliminary -1Ldt = 14.3 fb∫
[GeV]missTE
0 100 200 300 400 500 600 700 800 900 1000
Eve
nts
/ 40
GeV
-110
1
10
Fakes
+Z/W(W)tt
WZ/ZZ
±W±W
14.8)×4-tops Contact (
26.9)×b’->Wt 800GeV (
=8 TeVs channel, µµATLAS Preliminary -1Ldt = 14.3 fb∫
Figure 12: Distributions of discriminant variables in theµµ channel, after the standard object selectionand with the requirement thatEmiss
T > 40 GeV. The cross section for each signal model is scaled upso that the signal integrals are all equal to the total background integral. The assumed strength of thecontact interaction isC/Λ2 = −4π TeV−2. The background histograms are stacked to show the totalexpected background, while each signal histogram is independent of the others. The uncertainties on thebackground shown here consist of the production cross section uncertainty for the backgrounds modelledwith Monte Carlo simulation, and a 30% uncertainty for instrumental backgrounds (see Section 5).
28

0 2 4 6 8 10 12 14
Ent
ries
0
10
20
30
40
50
Data
Q Mis-id
Fakes
+Z/W(W)tt
WZ/ZZ
±W±W
=8 TeVsee channel, ATLASPreliminary
-1Ldt = 14.3 fb∫
jetsN0 2 4 6 8 10 12 14
Sig
nific
ance
-3
0
3
Ent
ries
0
10
20
30
40
50
60
70
Data
Q Mis-id
Fakes
+Z/W(W)tt
WZ/ZZ
±W±W
=8 TeVsee channel, ATLASPreliminary
-1Ldt = 14.3 fb∫
b-jetsN0 1 2 3 4 5 6 7
Sig
nific
ance
-3
0
3
Ent
ries
0
5
10
15
20
25
30
35
40
Data
Q Mis-id
Fakes
+Z/W(W)tt
WZ/ZZ
±W±W
=8 TeVsee channel, ATLASPreliminary
-1Ldt = 14.3 fb∫
[GeV]TH0 200 400 600 800 1000 1200 1400 1600 1800 2000
Sig
nific
ance
-3
0
3
Ent
ries
0
5
10
15
20
25
30
35
40
45
Data
Q Mis-id
Fakes
+Z/W(W)tt
WZ/ZZ
±W±W
=8 TeVsee channel, ATLASPreliminary
-1Ldt = 14.3 fb∫
[GeV]missTE
0 100 200 300 400 500 600 700 800
Sig
nific
ance
-3
0
3
Ent
ries
0
10
20
30
40
50
Data
Q Mis-id
Fakes
+Z/W(W)tt
WZ/ZZ
±W±W
=8 TeVsee channel, ATLASPreliminary
-1Ldt = 14.3 fb∫
[GeV]T
Leading lepton p0 100 200 300 400 500
Sig
nific
ance
-3
0
3
Ent
ries
0
2
4
6
8
10
12
14
16
18
20
22
24
Data
Q Mis-id
Fakes
+Z/W(W)tt
WZ/ZZ
±W±W
=8 TeVsee channel, ATLASPreliminary
-1Ldt = 14.3 fb∫
ηLeading lepton -2 -1 0 1 2 3 4
Sig
nific
ance
-3
0
3
Ent
ries
0
10
20
30
40
50
Data
Q Mis-id
Fakes
+Z/W(W)tt
WZ/ZZ
±W±W
=8 TeVsee channel, ATLASPreliminary
-1Ldt = 14.3 fb∫
[GeV]T
Sub-leading lepton p0 50 100 150 200 250 300
Sig
nific
ance
-3
0
3
Ent
ries
0
2
4
6
8
10
12
14
16
18
20
22
Data
Q Mis-id
Fakes
+Z/W(W)tt
WZ/ZZ
±W±W
=8 TeVsee channel, ATLASPreliminary
-1Ldt = 14.3 fb∫
ηSub-leading lepton -2 -1 0 1 2 3 4
Sig
nific
ance
-3
0
3
Figure 13: Distributions of some kinematic variables in theeechannel, after theEmissT control region
selection, for both the background estimation and the data.The bottom plots show the significance ofthe measured number of events in the data over the estimated number of events from the backgrounds.
29

Ent
ries
0
10
20
30
40
50
60
70
Data
Q Mis-id
Fakes
+Z/W(W)tt
WZ/ZZ
±W±W
=8 TeVs channel, µeATLASPreliminary
-1Ldt = 14.3 fb∫
jetsN0 2 4 6 8 10 12 14
Sig
nific
ance
-3
0
3
Ent
ries
0
20
40
60
80
100
120
Data
Q Mis-id
Fakes
+Z/W(W)tt
WZ/ZZ
±W±W
=8 TeVs channel, µeATLASPreliminary
-1Ldt = 14.3 fb∫
b-jetsN0 1 2 3 4 5 6 7
Sig
nific
ance
-3
0
3
Ent
ries
0
10
20
30
40
50
60
70
80
Data
Q Mis-id
Fakes
+Z/W(W)tt
WZ/ZZ
±W±W
=8 TeVs channel, µeATLASPreliminary
-1Ldt = 14.3 fb∫
[GeV]TH0 200 400 600 800 1000 1200 1400 1600 1800 2000
Sig
nific
ance
-3
0
3
Ent
ries
0
10
20
30
40
50
60
Data
Q Mis-id
Fakes
+Z/W(W)tt
WZ/ZZ
±W±W
=8 TeVs channel, µeATLASPreliminary
-1Ldt = 14.3 fb∫
[GeV]missTE
0 100 200 300 400 500 600 700 800
Sig
nific
ance
-3
0
3
0 100 200 300 400 500
Ent
ries
0
10
20
30
40
50
60
70
80
90
Data
Q Mis-id
Fakes
+Z/W(W)tt
WZ/ZZ
±W±W
=8 TeVs channel, µeATLASPreliminary
-1Ldt = 14.3 fb∫
[GeV]T
Leading lepton p0 100 200 300 400 500
Sig
nific
ance
-3
0
3
Ent
ries
0
5
10
15
20
25
30
35
40
Data
Q Mis-id
Fakes
+Z/W(W)tt
WZ/ZZ
±W±W
=8 TeVs channel, µeATLASPreliminary
-1Ldt = 14.3 fb∫
ηLeading lepton -2 -1 0 1 2 3 4
Sig
nific
ance
-3
0
3
Ent
ries
0
20
40
60
80
100
Data
Q Mis-id
Fakes
+Z/W(W)tt
WZ/ZZ
±W±W
=8 TeVs channel, µeATLASPreliminary
-1Ldt = 14.3 fb∫
[GeV]T
Sub-leading lepton p0 50 100 150 200 250 300
Sig
nific
ance
-3
0
3
Ent
ries
0
5
10
15
20
25
30
35
40
Data
Q Mis-id
Fakes
+Z/W(W)tt
WZ/ZZ
±W±W
=8 TeVs channel, µeATLASPreliminary
-1Ldt = 14.3 fb∫
ηSub-leading lepton -2 -1 0 1 2 3 4
Sig
nific
ance
-3
0
3
Figure 14: Distributions of some kinematic variables in theeµ channel, after theEmissT control region
selection, for both the background estimation and the data.The bottom plots show the significance ofthe measured number of events in the data over the estimated number of events from the backgrounds.
30

Ent
ries
0
5
10
15
20
25
30
35
Data
Fakes
+Z/W(W)tt
WZ/ZZ
±W±W
=8 TeVs channel, µµATLASPreliminary
-1Ldt = 14.3 fb∫
jetsN0 2 4 6 8 10 12 14
Sig
nific
ance
-3
0
3
Ent
ries
0
10
20
30
40
50
Data
Fakes
+Z/W(W)tt
WZ/ZZ
±W±W
=8 TeVs channel, µµATLASPreliminary
-1Ldt = 14.3 fb∫
b-jetsN0 1 2 3 4 5 6 7
Sig
nific
ance
-3
0
3
Ent
ries
0
5
10
15
20
25
30
35
40
Data
Fakes
+Z/W(W)tt
WZ/ZZ
±W±W
=8 TeVs channel, µµATLASPreliminary
-1Ldt = 14.3 fb∫
[GeV]TH0 200 400 600 800 1000 1200 1400 1600 1800 2000
Sig
nific
ance
-3
0
3
Ent
ries
0
5
10
15
20
Data
Fakes
+Z/W(W)tt
WZ/ZZ
±W±W
=8 TeVs channel, µµATLASPreliminary
-1Ldt = 14.3 fb∫
[GeV]missTE
0 100 200 300 400 500 600 700 800
Sig
nific
ance
-3
0
3
0 100 200 300 400 500
Ent
ries
0
5
10
15
20
25
Data
Fakes
+Z/W(W)tt
WZ/ZZ
±W±W
=8 TeVs channel, µµATLASPreliminary
-1Ldt = 14.3 fb∫
[GeV]T
Leading lepton p0 100 200 300 400 500
Sig
nific
ance
-3
0
3
Ent
ries
0
2
4
6
8
10
12
14
Data
Fakes
+Z/W(W)tt
WZ/ZZ
±W±W
=8 TeVs channel, µµATLASPreliminary
-1Ldt = 14.3 fb∫
ηLeading lepton -2 -1 0 1 2 3 4
Sig
nific
ance
-3
0
3
Ent
ries
0
5
10
15
20
25
30
35
40
45
Data
Fakes
+Z/W(W)tt
WZ/ZZ
±W±W
=8 TeVs channel, µµATLASPreliminary
-1Ldt = 14.3 fb∫
[GeV]T
Sub-leading lepton p0 50 100 150 200 250 300
Sig
nific
ance
-3
0
3
Ent
ries
0
2
4
6
8
10
12
14
16
18
20
Data
Fakes
+Z/W(W)tt
WZ/ZZ
±W±W
=8 TeVs channel, µµATLASPreliminary
-1Ldt = 14.3 fb∫
ηSub-leading lepton -2 -1 0 1 2 3 4
Sig
nific
ance
-3
0
3
Figure 15: Distributions of some kinematic variables in theµµ channel, after theEmissT control region
selection, for both the background estimation and the data.The bottom plots show the significance ofthe measured number of events in the data over the estimated number of events from the backgrounds.
31
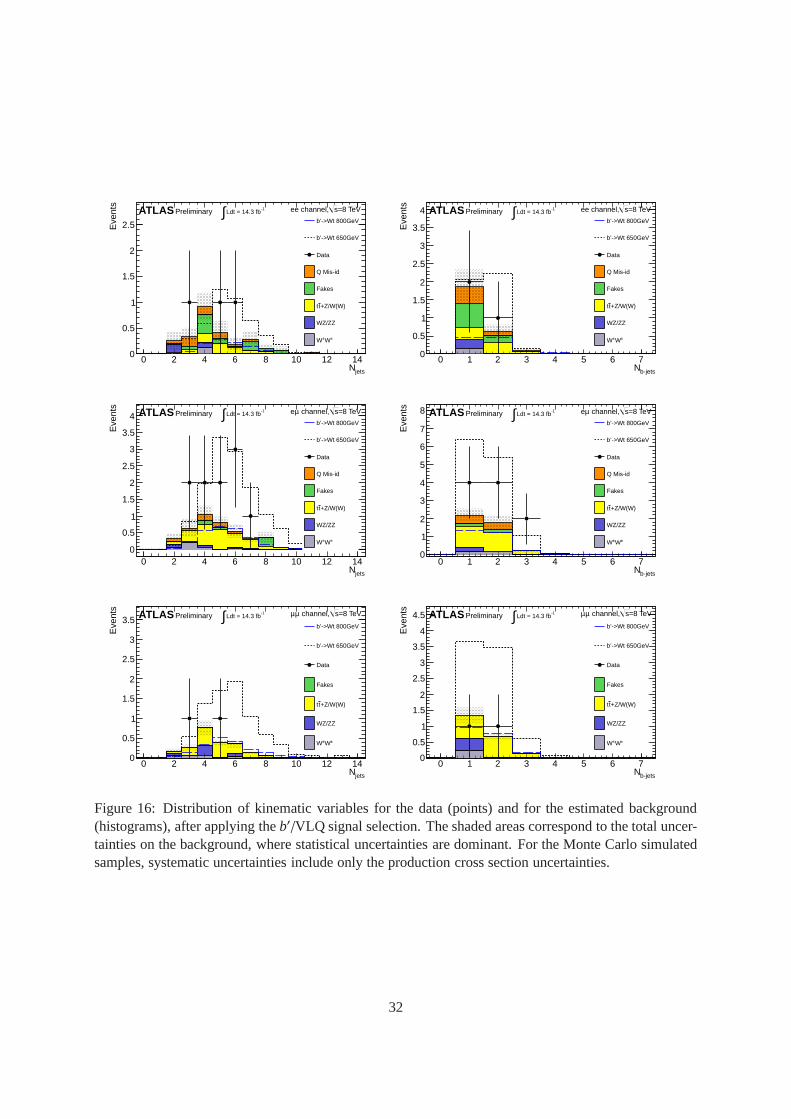
jetsN0 2 4 6 8 10 12 14
Eve
nts
0
0.5
1
1.5
2
2.5 b’->Wt 800GeV
b’->Wt 650GeV
Data
Q Mis-id
Fakes
+Z/W(W)tt
WZ/ZZ
±W±W
=8 TeVsee channel, ATLAS Preliminary -1Ldt = 14.3 fb∫
b-jetsN0 1 2 3 4 5 6 7
Eve
nts
0
0.5
1
1.5
2
2.5
3
3.5
4b’->Wt 800GeV
b’->Wt 650GeV
Data
Q Mis-id
Fakes
+Z/W(W)tt
WZ/ZZ
±W±W
=8 TeVsee channel, ATLAS Preliminary -1Ldt = 14.3 fb∫
jetsN0 2 4 6 8 10 12 14
Eve
nts
0
0.5
1
1.5
2
2.5
3
3.5
4b’->Wt 800GeV
b’->Wt 650GeV
Data
Q Mis-id
Fakes
+Z/W(W)tt
WZ/ZZ
±W±W
=8 TeVs channel, µeATLAS Preliminary -1Ldt = 14.3 fb∫
b-jetsN0 1 2 3 4 5 6 7
Eve
nts
0
1
2
3
4
5
6
7
8b’->Wt 800GeV
b’->Wt 650GeV
Data
Q Mis-id
Fakes
+Z/W(W)tt
WZ/ZZ
±W±W
=8 TeVs channel, µeATLAS Preliminary -1Ldt = 14.3 fb∫
jetsN0 2 4 6 8 10 12 14
Eve
nts
0
0.5
1
1.5
2
2.5
3
3.5b’->Wt 800GeV
b’->Wt 650GeV
Data
Fakes
+Z/W(W)tt
WZ/ZZ
±W±W
=8 TeVs channel, µµATLAS Preliminary -1Ldt = 14.3 fb∫
b-jetsN0 1 2 3 4 5 6 7
Eve
nts
0
0.5
1
1.5
2
2.5
3
3.5
4
4.5b’->Wt 800GeV
b’->Wt 650GeV
Data
Fakes
+Z/W(W)tt
WZ/ZZ
±W±W
=8 TeVs channel, µµATLAS Preliminary -1Ldt = 14.3 fb∫
Figure 16: Distribution of kinematic variables for the data(points) and for the estimated background(histograms), after applying theb′/VLQ signal selection. The shaded areas correspond to the total uncer-tainties on the background, where statistical uncertainties are dominant. For the Monte Carlo simulatedsamples, systematic uncertainties include only the production cross section uncertainties.
32

[GeV]T
Leading lepton p0 100 200 300 400 500 600
Eve
nts
/ 40
GeV
0
0.5
1
1.5
2
2.5b’->Wt 800GeV
b’->Wt 650GeV
Data
Q Mis-id
Fakes
+Z/W(W)tt
WZ/ZZ
±W±W
=8 TeVsee channel, ATLAS Preliminary -1Ldt = 14.3 fb∫
[GeV]T
Sub-leading lepton p0 50 100 150 200 250 300
Eve
nts
/ 40
GeV
0
0.5
1
1.5
2
2.5
3
3.5 b’->Wt 800GeV
b’->Wt 650GeV
Data
Q Mis-id
Fakes
+Z/W(W)tt
WZ/ZZ
±W±W
=8 TeVsee channel, ATLAS Preliminary -1Ldt = 14.3 fb∫
[GeV]T
Leading lepton p0 100 200 300 400 500 600
Eve
nts
/ 40
GeV
0
1
2
3
4
5b’->Wt 800GeV
b’->Wt 650GeV
Data
Q Mis-id
Fakes
+Z/W(W)tt
WZ/ZZ
±W±W
=8 TeVs channel, µeATLAS Preliminary -1Ldt = 14.3 fb∫
[GeV]T
Sub-leading lepton p0 50 100 150 200 250 300
Eve
nts
/ 40
GeV
0
1
2
3
4
5
6b’->Wt 800GeV
b’->Wt 650GeV
Data
Q Mis-id
Fakes
+Z/W(W)tt
WZ/ZZ
±W±W
=8 TeVs channel, µeATLAS Preliminary -1Ldt = 14.3 fb∫
[GeV]T
Leading lepton p0 100 200 300 400 500 600
Eve
nts
/ 40
GeV
0
0.5
1
1.5
2
2.5
3
3.5 b’->Wt 800GeV
b’->Wt 650GeV
Data
Fakes
+Z/W(W)tt
WZ/ZZ
±W±W
=8 TeVs channel, µµATLAS Preliminary -1Ldt = 14.3 fb∫
[GeV]T
Sub-leading lepton p0 50 100 150 200 250 300
Eve
nts
/ 40
GeV
0
0.5
1
1.5
2
2.5
3
3.5
4b’->Wt 800GeV
b’->Wt 650GeV
Data
Fakes
+Z/W(W)tt
WZ/ZZ
±W±W
=8 TeVs channel, µµATLAS Preliminary -1Ldt = 14.3 fb∫
Figure 17: Distribution of kinematic variables for the data(points) and for the estimated background(histograms), after applying theb′/VLQ signal selection. The shaded areas correspond to the total uncer-tainties on the background, where statistical uncertainties are dominant. For the Monte Carlo simulatedsamples, systematic uncertainties include only the production cross section uncertainties.
33

|η|
0 0.5 1 1.5 2 2.5
|)η(|∈)/
T|,pη(|∈
2
4
6
8
10
12
14 [15,100] GeV∈ T
p
[100,200] GeV∈ T
p
[200,1000] GeV∈ T
p
ATLAS Preliminary
Simulation Z+jets
= 8 TeVs
(a)
|η|
0 0.5 1 1.5 2 2.5
)T
|,pη(|α
2
4
6
8
10
12 [15,100] GeV∈
Tp
[100,200] GeV∈ T
p
[200,1000] GeV∈ T
p
ATLAS Preliminary
tSimulation t
= 8 TeVs
(b)
Figure 18: The charge misidentification rates shown in Fig. 2(a) have been computed using the likelihoodmethod after correction. They are defined asǫ(|η|, pT ) = ǫ(|η|) × α(|η|, pT ) whereǫ(|η|) corresponds tothe misidentification rates measured in data onZ events using the likelihood without correction, andα(|η|, pT) is thepT dependent correction factor extracted from att sample. The reason for which the ratesǫ(|η|) need to be corrected is that they are applied to events mostly coming fromtt: the misidentificationrates also depend on the electronpT , but thepT spectrum of the electrons coming from aZ decay is notthe same as the one in thett. The left plot (a) shows the distribution of the ratioǫ(|η|, pT )/ǫ(|η|) for Z MCevents computed by truth-matching as a function of|η| and for differentpT bins. It shows that the averagerateǫ(|η|) is largely dominated by the first bin inpT . The right plot (b) shows thepT dependent correctionfactorα(|η|, pT ) = ǫ(|η|, pT )/ǫ(|η|, pT < 100GeV) extracted fromtt events computed by truth-matching,as a function of|η| and for differentpT bins. By definition, the correction factor is 1 in the firstpT bin.
34
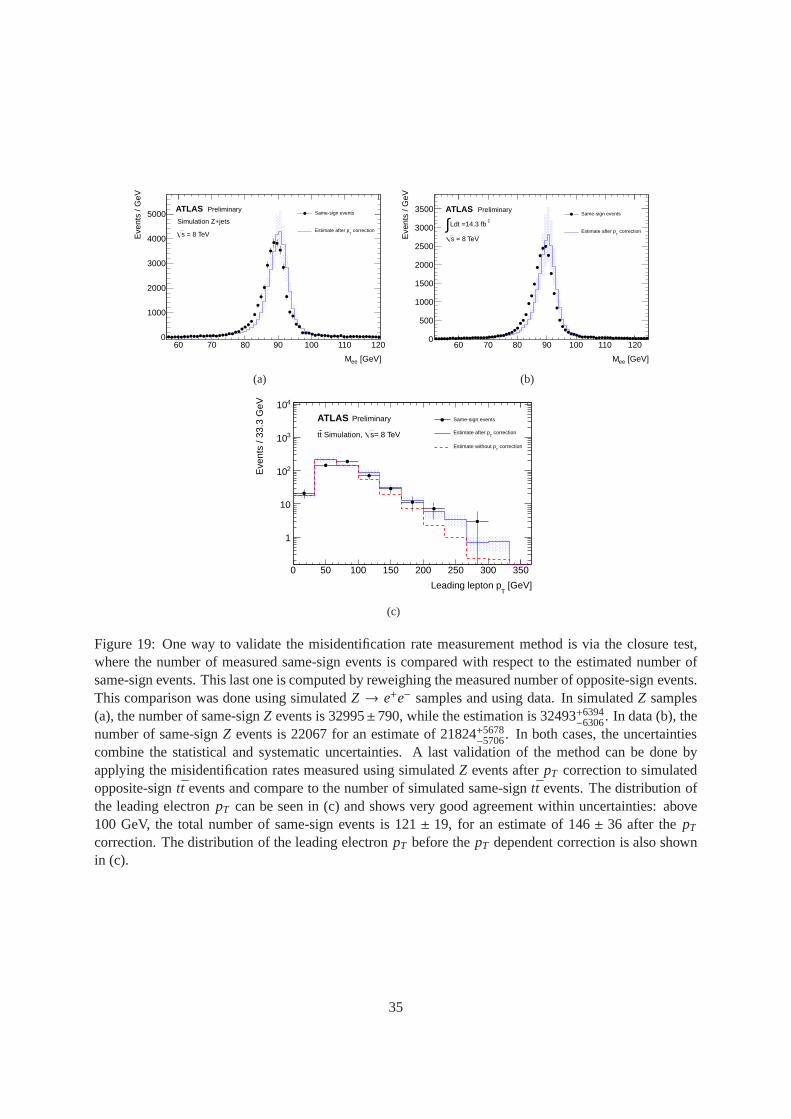
[GeV]eeM
60 70 80 90 100 110 120
Eve
nts
/ GeV
0
1000
2000
3000
4000
5000 Same-sign events
correctionT
Estimate after p
ATLAS Preliminary
Simulation Z+jets
= 8 TeVs
(a)
[GeV]eeM
60 70 80 90 100 110 120
Eve
nts
/ GeV
0
500
1000
1500
2000
2500
3000
3500Same-sign events
correctionT
Estimate after p
ATLAS Preliminary
-1Ldt =14.3 fb∫
= 8 TeVs
(b)
[GeV]T
Leading lepton p
0 50 100 150 200 250 300 350
Eve
nts
/ 33.
3 G
eV
1
10
210
310
410Same-sign events
correctionT
Estimate after p
correctionT
Estimate without p
= 8 TeVs Simulation, tt
ATLAS Preliminary
(c)
Figure 19: One way to validate the misidentification rate measurement method is via the closure test,where the number of measured same-sign events is compared with respect to the estimated number ofsame-sign events. This last one is computed by reweighing the measured number of opposite-sign events.This comparison was done using simulatedZ → e+e− samples and using data. In simulatedZ samples(a), the number of same-signZ events is 32995±790, while the estimation is 32493+6394
−6306. In data (b), thenumber of same-signZ events is 22067 for an estimate of 21824+5678
−5706. In both cases, the uncertaintiescombine the statistical and systematic uncertainties. A last validation of the method can be done byapplying the misidentification rates measured using simulatedZ events afterpT correction to simulatedopposite-signtt events and compare to the number of simulated same-signtt events. The distribution ofthe leading electronpT can be seen in (c) and shows very good agreement within uncertainties: above100 GeV, the total number of same-sign events is 121± 19, for an estimate of 146± 36 after thepT
correction. The distribution of the leading electronpT before thepT dependent correction is also shownin (c).
35

0 0.5 1 1.5 2 2.5
mis
-id∈
-410
-310
-210
-110
1
LikelihoodTruth-matching
ATLAS Preliminary
Simulation Z+jets
= 8 TeVs
|η|0 0.5 1 1.5 2 2.5
Lik
elih
ood/
Tru
th-m
atc
hing
0.6
0.8
1
1.2
1.4
1.6
Figure 20: The likelihood method used to compute the misidentification rates as a function of|η| canbe validated using simulatedZ → e+e− samples. The validation is done by comparing the rates ex-tracted with the likelihood method with respect to the ratescomputed using the truth-matching method.As shown in the bottom plot, the likelihood measured rates are compatible with the true rates withinuncertainties.
[GeV]TCut on H
350 400 450 500 550 600 650 700 750 800
Exp
ecte
d 95
% C
.L. u
pper
lim
it [p
b]
0.04
0.05
0.06
0.07
0.08
0.09
0.1
0.11
0.12
= 8 TeVsSimulation,
ATLAS Preliminary 1≥ b-jets
2, N≥ jetsN 2≥
b-jets 2, N≥ jetsN
1≥ b-jets
3, N≥ jetsN 2≥
b-jets 3, N≥ jetsN
3≥ b-jets
3, N≥ jetsN 1≥
b-jets 4, N≥ jetsN
2≥ b-jets
4, N≥ jetsN 3≥
b-jets 4, N≥ jetsN
Figure 21: Expected 95% C.L. upper limit on the four tops contact interaction production cross sectionas a function of the cut onHT, and parametrized with the requirement on the number of jets(differentcolors), and on the number ofb-jets (different markers). The final event selection is chosen so that itcanprovide the minimum value on the cross-section. Following the information provided by this plot, thebest choice for the final selection isHT ≥ 650 GeV, Njets ≥ 2 and Nb−jets ≥ 2.
36

[TeV]b'm
0.4 0.5 0.6 0.7 0.8 0.9 1
BR
× [p
b]
σ
-310
-210
-110
1
xxxxxxxxxxxxxxxxxxxxxxxxxxxxxxxxxxxx
xxxxxxxxxxxxxxxxxxxxxxxxxxxxxxxxxxxx
xxxxxxxxxxxxxxxxxxxxxxxxxxxxxxxxxxxx
xxxxxxxxxxxxxxxxxxxxxxxxxxxxxxxxxxxx
xxxxxxxxxxxxxxxxxxxxxxxxxxxxxxxxxxxx
xxxxxxxxxxxxxxxxxxxxxxxxxxxxxxxxxxxx
xxxxxxxxxxxxxxxxxxxxxxxxxxxxxxxxxxxx
xxxxxxxxxxxxxxxxxxxxxxxxxxxxxxxxxxxx
xxxxxxxxxxxxxxxxxxxxxxxxxxxxxxxxxxxx
xxxxxxxxxxxxxxxxxxxxxxxxxxxxxxxxxxxx
xxxxxxxxxxxxxxxxxxxxxxxxxxxxxxxxxxxx
xxxxxxxxxxxxxxxxxxxxxxxxxxxxxxxxxxxx
xxxxxxxxxxxxxxxxxxxxxxxxxxxxxxxxxxxx
xxxxxxxxxxxxxxxxxxxxxxxxxxxxxxxxxxxx
xxxxxxxxxxxxxxxxxxxxxxxxxxxxxxxxxxxx
xxxxxxxxxxxxxxxxxxxxxxxxxxxxxxxxxxxx
xxxxxxxxxxxxxxxxxxxxxxxxxxxxxxxxxxxx
xxxxxxxxxxxxxxxxxxxxxxxxxxxxxxxxxxxx
xxxxxxxxxxxxxxxxxxxxxxxxxxxxxxxxxxxx
xxxxxxxxxxxxxxxxxxxxxxxxxxxxxxxxxxxx
xxxxxxxxxxxxxxxxxxxxxxxxxxxxxxxxxxxx
xxxxxxxxxxxxxxxxxxxxxxxxxxxxxxxxxxxx
xxxxxxxxxxxxxxxxxxxxxxxxxxxxxxxxxxxx
xxxxxxxxxxxxxxxxxxxxxxxxxxxxxxxxxxxx
xxxxxxxxxxxxxxxxxxxxxxxxxxxxxxxxxxxx
xxxxxxxxxxxxxxxxxxxxxxxxxxxxxxxxxxxx
xxxxxxxxxxxxxxxxxxxxxxxxxxxxxxxxxxxx
xxxxxxxxxxxxxxxxxxxxxxxxxxxxxxxxxxxx
xxxxxxxxxxxxxxxxxxxxxxxxxxxxxxxxxxxx
xxxxxxxxxxxxxxxxxxxxxxxxxxxxxxxxxxxx
xxxxxxxxxxxxxxxxxxxxxxxxxxxxxxxxxxxx
xxxxxxxxxxxxxxxxxxxxxxxxxxxxxxxxxxxx
xxxxxxxxxxxxxxxxxxxxxxxxxxxxxxxxxxxx
xxxxxxxxxxxxxxxxxxxxxxxxxxxxxxxxxxxx
xxxxxxxxxxxxxxxxxxxxxxxxxxxxxxxxxxxx
xxxxxxxxxxxxxxxxxxxxxxxxxxxxxxxxxxxx
xxxxxxxxxxxxxxxxxxxxxxxxxxxxxxxxxxxx
xxxxxxxxxxxxxxxxxxxxxxxxxxxxxxxxxxxx
xxxxxxxxxxxxxxxxxxxxxxxxxxxxxxxxxxxx
xxxxxxxxxxxxxxxxxxxxxxxxxxxxxxxxxxxx
xxxxxxxxxxxxxxxxxxxxxxxxxxxxxxxxxxxx
xxxxxxxxxxxxxxxxxxxxxxxxxxxxxxxxxxxx
xxxxxxxxxxxxxxxxxxxxxxxxxxxxxxxxxxxx
xxxxxxxxxxxxxxxxxxxxxxxxxxxxxxxxxxxx
xxxxxxxxxxxxxxxxxxxxxxxxxxxxxxxxxxxx
xxxxxxxxxxxxxxxxxxxxxxxxxxxxxxxxxxxx
xxxxxxxxxxxxxxxxxxxxxxxxxxxxxxxxxxxx
xxxxxxxxxxxxxxxxxxxxxxxxxxxxxxxxxxxx
xxxxxxxxxxxxxxxxxxxxxxxxxxxxxxxxxxxx
xxxxxxxxxxxxxxxxxxxxxxxxxxxxxxxxxxxx
xxxxxxxxxxxxxxxxxxxxxxxxxxxxxxxxxxxx
xxxxxxxxxxxxxxxxxxxxxxxxxxxxxxxxxxxx
xxxxxxxxxxxxxxxxxxxxxxxxxxxxxxxxxxxx
xxxxxxxxxxxxxxxxxxxxxxxxxxxxxxxxxxxx
xxxxxxxxxxxxxxxxxxxxxxxxxxxxxxxxxxxx
xxxxxxxxxxxxxxxxxxxxxxxxxxxxxxxxxxxx
xxxxxxxxxxxxxxxxxxxxxxxxxxxxxxxxxxxx
xxxxxxxxxxxxxxxxxxxxxxxxxxxxxxxxxxxx
xxxxxxxxxxxxxxxxxxxxxxxxxxxxxxxxxxxx
Exp
ecte
d
Expected limit at 95% CL
σ 1 ±Expected limit
σ 2 ±Expected limit
Theory approx. NNLO
xxx
xxx
xxx
xxx
xxx
xxx
= 8 TeVs, -1
Ldt = 14.3 fb∫ATLAS Preliminary
Figure 22: Expected limit on theb′ pair-production cross section as a function of theb′ mass assumingstatistical uncertainties only.
[TeV]Bm
0.3 0.4 0.5 0.6 0.7 0.8 0.9
[fb]
BB
σ
210
310
410
Exp
ecte
d
Exp. 95% CL upper limit uncertaintyσExp. 1 uncertaintyσExp. 2
Heavy Quark Pair Production
ATLAS Preliminary-1 = 14.3 fbdt L
∫ = 8 TeVs,
[TeV]Tm
0.3 0.4 0.5 0.6 0.7 0.8 0.9
[fb]
TT
σ
210
310
410E
xpec
ted
Exp. 95% CL upper limit uncertaintyσExp. 1 uncertaintyσExp. 2
Heavy Quark Pair Production
ATLAS Preliminary-1 = 14.3 fbdt L
∫ = 8 TeVs,
Figure 23: Expected limits on the production cross section of a vector like quark pair, as a function of thequark mass, with statistical uncertainties only for bottomlike quarks (left) and top like quarks (right).
37

[TeV]KKm0.6 0.7 0.8 0.9 1 1.1 1.2
BR
[pb]
× σ
-310
-210
-110
1
Expected limit at 95% CL
σ 1 ±Expected limit
σ 2 ±Expected limit
Theory approx. LO
ATLAS Preliminary
= 8 TeVs, -1
Ldt = 14.3 fb∫
Figure 24: Expected limits on the production cross section of four top quarks events from the 2UED/RPPmodel, with only statistical uncertainties considered.
Sgluon mass [TeV]0.3 0.4 0.5 0.6 0.7 0.8 0.9 1
) [p
b]ttt
BR
(t× σ
-210
-110
1
10
ATLAS Preliminary
= 8 TeVs -1
Ldt = 14.3 fb∫
Expected limit at 95 % CL
σ 1±Expected limit
σ 2±Expected limit
Theory (NLO)
Figure 25: Expected limit on the sgluon pair-production cross section as a function of the sgluon massassuming statistical uncertainties only.
38


![ATLAS NOTE - CERN Document Server · ATLAS NOTE ATLAS-CONF-2016-032 June 16, 2016 ... (2UED/RPP) [34] is also considered. In this model, the compactification of the extra dimensions](https://img.pdfslide.net/doc/110x75/5d4455eb88c9932a398d988e/atlas-note-cern-document-server-atlas-note-atlas-conf-2016-032-june-16-2016.jpg)