Embed Size (px)
Citation preview

INTERNATIONAL JOURNAL OF CLIMATOLOGYInt. J. Climatol. 29: 2091–2105 (2009)Published online 19 January 2009 in Wiley InterScience(www.interscience.wiley.com) DOI: 10.1002/joc.1823
Atmospheric centres of action associated with the AtlanticITCZ position
Paula Souza* and Iracema Fonseca Albuquerque CavalcantiCenter for Weather Forecast and Climate Studies/National Institute for Space Research (CPTEC/INPE), Rod. Presidente Dutra Km 40,
Cachoeira Paulista, S.P., Brazil
ABSTRACT: Relationships between Atlantic extra-tropical features and Intertropical Convergence Zone (ITCZ) positionclose to Northeast Brazil are discussed, on the basis of atmosphere and ocean patterns in DJF and April. Compositesfor three situations were analysed. In the first composite, years with extreme positive North Atlantic Oscillation Index(NAOI) in DJF and the ITCZ displaced southward in April were selected. The other two composites were related onlyto anomalous ITCZ positions – either south or north of the equator – in April. The physical mechanism for the relationbetween the NAOI and the ITCZ is the influence of the southern North Atlantic Oscillation (NAO) centre on the NorthAtlantic subtropical high, the sea surface temperature (SST) and the intensity of the trade winds; however, this situationoccurred in only a few years. Analysis of the other situations indicated the influence of a dominant mode of variabilityover the North and South Atlantic Oceans that affects the ITCZ position. Over the North Atlantic, this mode was related toa shifting of the NAO pattern, which modified the position of the North Atlantic subtropical high. Over the South Atlantic,this mode indicated an extra-tropical centre of action associated with displacement of the South Atlantic subtropical high.A proposed index for monitoring ITCZ position, named the North Atlantic Index (NAI), was calculated from sea levelpressure (SLP) anomalies in the two centres of action of the North Atlantic in DJF, which are related to the shifting ofthe NAO. Although the NAO index is related to atmospheric/oceanic features associated with ITCZ displacement, the newindex presented higher and more organized correlations with atmospheric and oceanic conditions linked to ITCZ behaviourand can be useful even when the NAO is not extreme. Copyright 2009 Royal Meteorological Society
KEY WORDS ITCZ; North Atlantic Oscillation; Atlantic subtropical highs; Atlantic SST gradient; North Atlantic index
Received 17 March 2008; Accepted 1 November 2008
1. Introduction
The Northeast Brazil region exhibits a large spatial andtemporal precipitation variability that is related to theinfluences of several systems over different spatial scales.The most persistent feature related to the rainy sea-son in this region mainly in the northern sector, is theIntertropical Convergence Zone (ITCZ) (e.g. Hastenrathand Heller, 1977; Moura and Shukla, 1981; Hastenrathand Greischar, 1993). Located in the upper branch of theHadley Cell, the ITCZ is characterized by low surfacepressure (the equatorial trough), maximum sea surfacetemperature (SST), confluence of northern and southerntrade winds, maximum convergence and maximum con-vective cloud cover. These features occur close to theequatorial oceanic zone but do not need to be in thesame position (Hastenrath and Heller, 1977; Hastenrathand Lamb, 1977).
Although the ITCZ is situated in the Northern Hemi-sphere most of the year, it is displaced to its southernmostposition in March and April (Hastenrath and Lamb, 1977;
* Correspondence to: Paula Souza, Center for Weather Forecast andClimate Studies/National Institute for Space Research (CPTEC/INPE),Rod. Presidente Dutra Km 40, Cachoeira Paulista, S.P., Brazil.E-mail: [email protected]
Nobre and Shukla, 1996). This behaviour has an impor-tant role in the rainy season of northern Northeast Brazil(Hastenrath and Lamb, 1977; Moura and Shukla, 1981).During this season (austral autumn), anomalous wet yearsin Northeast Brazil are related to maintenance of theITCZ southward of its normal position. On the otherhand, dry years are related to the ITCZ being found north-ward of its normal position. Uvo (1998) showed that indry years, the ITCZ moves northward in February or atthe beginning of March, while in wet years the ITCZremains in the southernmost position up to May.
An anomalous position of the ITCZ during the rainyseason of Northeast Brazil is mainly linked to the inter-annual variability of tropical Atlantic SST, since theconvection tends to occur over warm surface waters.The inter-annual variability of the north–south dipole,characterized by SST anomalies with opposite sign inthe tropical North and South Atlantic, is related to theinternal asymmetric mode around the equator (Hastenrathand Heller, 1977; Moura and Shukla, 1981; Servainand Legler, 1986). The meridional SST inter-hemisphericgradient affects the north–south ITCZ displacement (e.g.Hastenrath and Greischar, 1993; Nobre and Shukla,1996). This gradient can occur associated with SSTanomalies in the tropical North Atlantic or tropical South
Copyright 2009 Royal Meteorological Society

2092 P. SOUZA AND I.F.A. CAVALCANTI
Atlantic, or in both the oceans. Some studies indicatethat SST anomalies in the North and South Atlantic maynot occur at the same time (Houghton and Tourre, 1992;Enfield and Mayer, 1997), but the main cloudiness bandand precipitation associated with the ITCZ is located overthe region towards which the thermal gradient is directed.
The relationship between tropical Atlantic Ocean vari-ability and atmospheric variability has been addressed inseveral studies. Relationships between tropical AtlanticSST and trade wind variability were discussed by Nobreand Shukla (1996) and Enfield and Mayer (1997). Neg-ative (positive) SST anomalies in the tropical Atlanticwere associated with strong (weak) trade winds. In theextratropics, the North Atlantic Oscillation (NAO) hasa role in North Atlantic SST variability, as discussedby Robertson et al. (2000); Sutton et al. (2000); Georgeand Saunders (2001). One of the suggested mechanismsfor NAO forcing of SST anomalies is the exchanges ofheat flux between atmosphere and ocean, forced by windflow anomalies associated with the NAO. This oscil-lation is characterized by two centres of action withopposite phases, one in the Arctic region (Iceland) andthe other over the central North Atlantic (Azores, nearthe Iberian Peninsula) (Rogers, 1984). It is more orga-nized in the North Hemisphere (NH) winter, although itoccurs in other seasons, and it is observed at all atmo-sphere levels. The NAO variability is analysed throughan index [North Atlantic Oscillation Index (NAOI)] cal-culated from the difference between the normalized sealevel pressure (SLP) anomalies of Iceland and Azores.When the NAOI is positive, the North Atlantic subtrop-ical high and the Iceland low are more intense thannormal, generating strong westerly winds near the sur-face and also at high levels in middle latitudes of theAtlantic and Europe (Hurrell, 1995).
The dynamical processes linking precipitation, AtlanticSST and the NAO have been investigated in only afew studies. George and Saunders (2001) showed thatprecipitation over the northern Caribbean was affectedby the NAO. Relationships between precipitation inNortheast Brazil and the NAO were first investigated byNamias (1972), who noticed that in wet years the windfield was characterized by a positive NAO phase pattern,with a strong cyclonic activity close to Greenland.
Besides the North Atlantic influence on the ITCZ posi-tion, the variability of southeasterly trade winds associ-ated with the variability of the South Atlantic subtropicalhigh has an important role in the tropical South AtlanticSST anomalies. Nobre and Shukla (1996), analysing windstress and SST over the tropical Atlantic, found empiricalorthogonal function (EOF) patterns which were consis-tent with a weak North Atlantic subtropical high and asimultaneous strong South Atlantic subtropical high andvice versa.
The objective of this study is to identify centres ofaction mainly in extra-tropical regions of the northernand southern Atlantic Ocean in DJF and their relations toITCZ position and intensity during the northern NortheastBrazil rainy season. Data and methods of analysis are
described in Section 2. The main atmospheric and oceanfeatures associated with the ITCZ position are presentedin Section 3. Based on the results, an index associatedwith the ITCZ position is proposed in Section 4, wherethe relationship between the NAO index and atmosphericand ocean anomalies is compared to the proposed index.A summary and conclusions are given in Section 5.
2. Data and methods
Outgoing longwave radiation (OLR) measured fromsatellites provided by the National Oceanic and Atmo-spheric Administration (NOAA), (Liebmann and Smith,1996), National Centers for Environmental Prediction(NCEP)/National Center for Atmospheric Research(NCAR) reanalysis (Kalnay et al., 1996) and SST data(Smith and Reynolds, 2003) were analysed for the1979–2004 period. In addition, the NAO index wasobtained from http://polarmet.mps.ohio-state.edu/NAO/.
In the literature, the ITCZ position has been deter-mined using cloud reflectance (Waliser and Gautier,1993) and wind confluence and convergence (Hasten-rath, 2002). Monthly ITCZ position, published in Cli-manalise (www.cptec.inpe.nr/clima/) has been identifiedusing minimum OLR values obtained from NCEP datasets and thermal infrared brightness temperature obtainedfrom Geostationary Operational Environmental Satellites(GOES) satellites. In the present study, the minimumOLR and trade wind confluence (where the meridionalwind at 925 hPa is zero) were analysed over the trop-ical Atlantic, between 7°N and 7 °S, and 35 °W–25 °W,as well as anomalous OLR. The ITCZ reaches its south-ernmost position in April, in the middle of the north-ern Northeast Brazil rainy season (March–April–May);therefore this was the month selected to perform the anal-ysis. Anomalous OLR in April of each year was alsoanalysed to confirm the results obtained in the previousITCZ position identification in order to select years inwhich the ITCZ was organized south of equator or whenit was displaced northward.
The DJF seasonal NAO index was analysed to selectyears in which the anomalies were above 0.8 standarddeviations in the positive phase. A further selection wasbased on simultaneous ITCZ and NAO index behaviour.Cases of ITCZ, south of the equator in April and positiveNAOI in DJF were grouped to analyse the commonfeatures in atmospheric and oceanic variables and theassociated mechanisms related to both systems. Theselected years were 1984, 1989 and 1995. Since therewere only a few cases, a new methodology was applied,based only on ITCZ position and intensity in April.Table I indicates years with an intense ITCZ, south ofthe equator or displaced northward in April, and also theNAOI in DJF. The table also displays a new index NorthAtlantic index (NAI) discussed in Section 4. Atmosphericfeatures and SST behaviour were analysed in compositesbased on the two methods.
EOF analysis was also applied to the normalized SLPanomaly in DJF to analyse the main modes of variability
Copyright 2009 Royal Meteorological Society Int. J. Climatol. 29: 2091–2105 (2009)DOI: 10.1002/joc

ATMOSPHERIC CENTRES OF ACTION AND ITCZ 2093
Table I. Phases of North Atlantic Oscillation index (NAOI),North Atlantic index (NAI) and occurrences of case 1, case 2
and case 3.
Year NAOI NAI Case 1 Case 2 Case 3
1980 0 − ×1981 + − ×1982 − +1983 + − ×1984 + + × ×1985 − − ×1986 − + ×1987 − − ×1988 − + ×1989 + 0 × ×1990 + + ×1991 + + ×1992 + − ×1993 + −1994 + + ×1995 + + × ×1996 − + ×1997 − +1998 − − ×1999 + +2000 + −2001 − +2002 − − ×2003 − 0
in North and South Atlantic regions and to discussfeatures identified in the composite analysis. A new indexbased on relationships between atmospheric features andITCZ position was generated and applied to analyse theITCZ behaviour.
3. ITCZ position and associated tropical andextra-tropical features
3.1. Relation between ITCZ and NAO (composite forcase 1)
A three-year average of atmospheric and oceanic con-ditions, when there were extreme NAO positive indicesin DJF and the ITCZ was displaced southward in April,is analysed in Figures 1 and 2. SLP anomalies in DJFindicate the low–high pair, typical of the positive phaseof the NAO (Figure 1(a)). This pattern shows extremelystrong anomalies in the North Atlantic subtropical highand in the Iceland low (Figure 1(b)). At the same timeit is possible to identify, in the SLP field, the SouthAtlantic subtropical high and a low-pressure centre to thesouth. Both centres present lower than normal pressure inthe composite anomaly field, characterizing a less-intenseSouth Atlantic subtropical high (Figure 1(a)). Featuresof the NAO are also seen in the geopotential heightanomaly composite at 500 hPa, while over the centralSouth Atlantic, a low-frequency wavetrain in subtropicallatitudes may be connected with the pressure lowering ofthe subtropical high. (Figure 1(c)).
The SLP field in April indicates a displacementof the North Atlantic subtropical high southwestwardand the South Atlantic subtropical high southeastward(Figure 1(e)). The SLP anomaly also indicates the dis-placement of both subtropical highs, southward. Thestrong anomalous positive geopotential at 500 hPa overthe South Atlantic, in April, seems to be linked to theanomalous high pressure associated with the southeast-ern displacement of the subtropical high (Figure 1(d),(f)). Consistent with the pressure fields, the wind flowat 925 hPa shows a confluence of the trade winds closeto the equator in DJF (Figure 2(a)). The behaviour ofthe subtropical highs in April is consistent with thewind confluence, southward of the region found in DJF(Figure 2(b)). SST anomalies are also consistent withthe wind flow (Figure 2(c), (d)). Warmer than nor-mal waters in the tropical South Atlantic Ocean andweak negative anomalies in the North Atlantic Oceanare observed in DJF. In April, there is an intensifica-tion of positive SST anomalies in the tropical SouthAtlantic and negative SST anomalies in the tropical NorthAtlantic (Figure 2(d)). The SST dipole and strong gradi-ent generate conditions favourable to the developmentof intense ITCZ convection south of equator in April(Figure 2(f)).
The relation between subtropical highs, SST and tradewind confluence associated with rainfall in NortheastBrazil during the rainy season was discussed in previ-ous studies by Hastenrath and Heller (1977); Hasten-rath (1978); Nobre and Shukla (1996). In the presentanalysis, it is shown that the intensity and position ofAtlantic subtropical highs are influenced by the NAOpattern over the North Atlantic and by geopotentialanomalies at middle levels over the extra-tropical SouthAtlantic, affecting the ITCZ position. Other extra-tropicalfeatures were identified, such as the SST anomaliesof opposite sign to those at tropical region. Warmerthan normal waters are seen close to eastern NorthAmerica coast, in April, associated with the southwarddisplacement of the North Atlantic subtropical high.Colder than normal waters occur in the subtropicalSouth Atlantic, associated with the southward displace-ment of the South Atlantic subtropical high (Figures 1(d),2(d)).
Although the selected years were taken only whenthe NAO was intense, the results show that featuresover the South Atlantic Ocean contributed also to theoccurrence of a southward-displaced intense ITCZ. Thestrong North Atlantic subtropical high and weak SouthAtlantic subtropical high, in DJF, forced the beginningof the SST gradient formation, which was strength-ened in April with the southward displacement of bothsubtropical highs. Since the composite included only3 years, another method, explained in Section 2 wasapplied in order to explore the relation of the sub-tropical highs, the NAO and other extra-tropical fea-tures to the behaviour of the ITCZ, with more casesconsidered.
Copyright 2009 Royal Meteorological Society Int. J. Climatol. 29: 2091–2105 (2009)DOI: 10.1002/joc

2094 P. SOUZA AND I.F.A. CAVALCANTI
(a) (b) (c)
(d) (f)(e)
Figure 1. Composites of case 1 (DJF fields in the upper panels and April fields in the bottom panels). DJF: (a) SLP anomaly; (b) SLP field;(c) geopotential anomaly at 500 hPa. April: (d) SLP anomaly; (e) SLP field; (f) Geopotential anomaly at 500 hPa. Shading indicates 95%
significance.
3.2. Composites based on anomalous ITCZ
3.2.1. ITCZ south of equator (case 2)
In this section, the main features identified in the DJFand April composites, when the ITCZ was organizedsouth of equator in April, are discussed. The selectedyears are shown in Table I. In DJF, near-normal OLRoccurred in the tropical region, although the first signs offavourable SST anomalies occurred in the Atlantic Ocean(Figure 3(a), (c)). ITCZ development, south of equator inApril is represented by an organized west–east negativeOLR anomaly band over the tropical Atlantic, especiallyintense near Northeast Brazil (Figure 3(b)). Positive OLR
anomaly to the north and to the south of the negativeOLR band might show a compensating subsidence, whichinhibits convection on both sides of the ITCZ. An SSTgradient favourable for ITCZ development, south ofequator is established in April (Figure 3(d)). The positiveSST anomalies extend into the whole tropical SouthAtlantic and intensify, mainly close to the southwesternAfrica coast. In the North Atlantic, there are negativeanomalies in the tropical sector, mainly near the westernAfrica coast. At the same time, positive anomaliesoccur in the western North Atlantic Ocean, similar tothe case analysed in Section 3.1. Another commonfeature is colder than normal waters in the subtropical
Copyright 2009 Royal Meteorological Society Int. J. Climatol. 29: 2091–2105 (2009)DOI: 10.1002/joc

ATMOSPHERIC CENTRES OF ACTION AND ITCZ 2095
(a) (b)
(c) (d)
(e) (f)
Figure 2. Composites of case 1 (DJF fields in the left panels and April fields in the right panels). (a) Wind field at 925 hPa in DJF; (b) windfield at 925 hPa in April; (c) SST anomaly in DJF; (d) SST anomaly in April; (e) OLR anomaly in DJF; (f) OLR anomaly in April. Shading
indicates 95% significance.
South Atlantic. This latter feature was found also byFolland et al. (2001) in correlation analyses between SSTanomalies and Northeast Brazil precipitation.
Extra-tropical features, such as a southwest–northeastSLP dipole over the North Atlantic in DJF, are identifiedin the case 2 composite (Figure 4(a)). This pattern seemsto be related to a displacement of the NAO pattern, since
the same configuration is also identified in geopotentialat 500 hPa (Figure 4(b)). The southern centre is locatedat the position of the southern centre identified in thefirst mode of SLP variability in the EOF analysis ofthe North and South Atlantic region (Figure 5), whilethe northern centre is located to the southeast of thenorthern centre of this first mode of variability, which
Copyright 2009 Royal Meteorological Society Int. J. Climatol. 29: 2091–2105 (2009)DOI: 10.1002/joc

2096 P. SOUZA AND I.F.A. CAVALCANTI
(a) (b)
(c) (d)
Figure 3. Composites of case 2 (DJF fields in the left panels and April fields in the right panels. (a) OLR anomaly in DJF; (b) OLR anomaly inApril; (c) SST anomaly in DJF; (d) SST anomaly in April. Shading indicates 95% significance.
is also the northern NAO centre (Figure 1). This EOFexplains 22% of the total SLP variance. Therefore, thecase 2 composite pattern may represent a displacementof the northern NAO centre southeastward and thesouthern NAO centre southwestward. These changesimply stronger northeast trade winds displaced southwardin DJF and April (Figure 4(c), (f)). The associated low-level anticyclonic circulation can be responsible foradvection of warm water northward near the easternNorth America coast, as shown in Figure 3(c), (d). Thedominance of negative SLP and geopotential anomalies inmiddle latitudes of the North Atlantic region and positiveanomalies over Greenland and tropical areas in April,implies another shifting of NAO centres. The resultingpattern is consistent with the position of the northerlytrade winds and the anticyclonic circulation, related to thedisplacement southward of the North Atlantic subtropicalhigh in Figure 4(f).
The South Atlantic extra-tropical centre in the firstEOF mode of Figure 5 is also identified in the compositesof case 2 (Figure 4). The centre to the south of Africa ofthis dominant mode is identified in SLP and geopotential
in Figure 4(a), (b), (d), (e) representing the southeastwarddisplacement of the South Atlantic subtropical high.This displacement allows heating of the tropical SouthAtlantic, and cooling of the subtropical South Atlantic,as seen in Figure 3(c), (d). The persistent trough andridge at 500 hPa, over the extra-tropical South Atlanticseems to be related to a blocking configuration overthe southwestern South Atlantic that may be responsiblefor the subtropical high persistence southeast of itsnormal position (Figure 4(e)). The occurrence of the SSTgradient and the displacement southward of the NorthAtlantic and South Atlantic subtropical highs, whichimplies a southward displacement of the wind confluence,established the ITCZ south of equator.
3.2.2. ITCZ displaced northward (case 3)
The main features in DJF and April of years when theITCZ was located northward of the April climatologicalposition is presented in Figures 6 and 7. In this case,weak OLR anomalies occur in DJF in the equatorialregion, but in April, strong positive anomalies extend intoa large area south of equator, while negative anomalies
Copyright 2009 Royal Meteorological Society Int. J. Climatol. 29: 2091–2105 (2009)DOI: 10.1002/joc
ATMOSPHERIC CENTRES OF ACTION AND ITCZ 2097
(a) (b) (c)
(d) (e) (f)
Figure 4. Composites of case 2 (DJF fields in the upper panels and April fields in the bottom panels). DJF: (a) SLP anomaly; (b) geopotentialanomaly at 500 hPa; (c) wind field at 925 hPa. April: (d) SLP anomaly; (e) Geopotential anomaly at 500 hPa; (f) wind field at 925 hPa. Shading
indicates 95% significance.
are concentrated in a narrow band north of equator closeto South America (Figure 6(a), (b)). The warming of thetropical North Atlantic and cooling of the tropical SouthAtlantic starts in DJF, with strong intensification in April,leading to the favourable tropical dipole pattern, whichinduces the ITCZ displacement northward (Figure 6(c),(d)). SST anomalies in the subtropical North and SouthAtlantic also have sign opposite to the tropical dipole, asin cases 1 and 2.
DJF SLP and geopotential anomaly composites displaythe same configuration identified in case 2, but withopposite signs over the North and South Atlantic, mainlyin the centres of action exhibited in the dominant mode
of variability (Figures 7 and 5). The pattern can also berelated to the shifting of the NAO and is consistent witha displacement of the North Atlantic subtropical highnortheastward, which is also seen in the wind field at lowlevels, in DJF (Figure 7(c)). In April, there are positiveSLP anomalies in the North Atlantic, but they are locatednorth of 30°N, leaving the tropical North Atlantic withlower than normal SLP (Figure 7(d)) and the trade windsdisplaced northward (Figure 7(f)).
The same centre of action to the south of Africa iden-tified in the first EOF mode is also seen in the extra-tropical South Atlantic, in DJF and April (Figure 7(a),(b), (d), (e)), with opposite sign to that observed in
Copyright 2009 Royal Meteorological Society Int. J. Climatol. 29: 2091–2105 (2009)DOI: 10.1002/joc

2098 P. SOUZA AND I.F.A. CAVALCANTI
Figure 5. First EOF of SLP anomaly in DJF.
case 2. A possible influence of the Antarctic Oscillation(AAO) (Gong and Wang, 1999) was investigated, but theAAO index did not show any relation to ITCZ displace-ment. Rather than being related to the annular mode, thisconfiguration shows the atmospheric mode of variabil-ity obtained in the first SLP EOF analysis (Figure 5).As opposed to case 2, the pattern is associated with adisplacement of the South Atlantic subtropical high equa-torward, which is consistent with strong southeasterlytrade winds and the ITCZ displaced northward.
4. North Atlantic index
Results in Section 3.1 suggested a relation betweenthe NAO and the position of the Atlantic ITCZ, andthe mechanism for this relation was the influence ofthe southern centre upon the North Atlantic subtropicalhigh. However, results in Section 3.2 suggested that theposition of the ITCZ is related to the shifting of NAOcentres rather than to the NAO phases, and this shiftingaffects the subtropical high displacement southwestwardor northeastward. The results showed the existence ofa North Atlantic mode that acts in conjunction withvariability over South Atlantic. In years when the NAOwas very strong in DJF, the extension of the NorthAtlantic subtropical high affected also the tropical regionand the ITCZ position in April (case 1). When theNAO centres were displaced from their normal positionsin DJF, the North Atlantic subtropical region presented
higher or lower pressure than normal and the ITCZ wasdisplaced southward (case 2) or northward (case 3) inApril.
Situations corresponding to case 1, when positiveNAOI was very strong and the ITCZ was displacedsouthward, were rare (only three in 25 years). Therelationships found between the displacement of NAOcentres and ITCZ position suggested the generation ofanother index based on the SLP dipole obtained over theNorth Atlantic in cases 2 and 3. This index was calculatedas the normalized SLP anomaly difference at two points,P1: 35°N–40 °W and P2: 50°N–10 °W in DJF and namedthe NAI. Time series of this index in Figure 8, andTable I reveal that positive values occur in the majorityof years selected in case 2 (6 years), when the ITCZ wassouth of equator. Negative values occur in years selectedin case 3, when the ITCZ was situated north of equator(6 years). On the other hand, positive values of NAOIoccurred in 4 years in case 2 and negative values wereregistered in 2 years in case 3.
A discussion of the physical mechanisms associatedwith the relations between the NAI in DJF and the ITCZposition in April is given based on case 2, with the ITCZsouth of equator. In this case, positive SST anomalieswere found in the tropical South Atlantic Ocean andnegative SST anomalies occurred in the tropical NorthAtlantic Ocean. The SST anomaly field in the tropicalNorth Atlantic in April is related to the displacement ofthe North Atlantic subtropical high southward. This dis-placement occurs from December to March as can beseen in Figure 9. Maximum positive pressure anomaliesoccur around 30°N in January in central North Atlantic.In March, high positive pressure anomalies extend southof 10°N at 30 °W and reach the equator at 50 °W, whilein eastern North Atlantic (10 °W) negative anomalies areobserved from February to April, indicating the displace-ment of the subtropical high southwestward (Figure 9(a),(b), (c)). A consistent displacement of negative SSTanomalies is also seen from December, reaching lowerlatitudes in March and April (Figure 9(d), (e)). In theSouthern Hemisphere, low-pressure anomalies are dis-placed from subtropical latitudes (January) to tropicallatitudes (April), at 30 °W and 10 °W (Figure 9(b), (c)),consistent with the South Atlantic subtropical high dis-placement southward, as discussed previously. At 30 °W,there is intensification of positive SST anomalies in thetropical South Atlantic from December to February, andat 10 °W the intensification extends to April, when theanomalies are displaced towards the equator (Figure 9(e),(f)).
The displacement of the North Atlantic subtropicalhigh southward is likely related to the air–sea interactionthrough sensible and latent heating flux associated withadvection of cold air southward by the anticycloniccirculation of the positive centre of action seen inFigure 4(a). Cold air advection southward results ina positive anomaly in heat flux (from the ocean tothe atmosphere), seen in Figure 9(h), thus, cooling theocean. The atmospheric response to this cooling in
Copyright 2009 Royal Meteorological Society Int. J. Climatol. 29: 2091–2105 (2009)DOI: 10.1002/joc

ATMOSPHERIC CENTRES OF ACTION AND ITCZ 2099
(c) (d)
(a) (b)
Figure 6. Composites of case 3 (DJF fields in the left panels and April fields in the right panels) (a) OLR anomaly in DJF; (b) OLR anomalyin April; (c) SST anomaly in DJF; (d) SST anomaly in April. Shading indicates 95% significance.
tropical latitudes is an increased SLP. The North Atlanticsubtropical high is then, displaced southward, from DJFto March. These results are consistent with relationshipsof anomalous latent and sensible heating fluxes to theatmospheric circulation around the southern centre ofthe NAO, discussed by Cayan (1992). The sea–airinteraction feedbacks in the North Atlantic are alsodiscussed by Czaja and Frankignoul (1999), with the SSTresponse to atmospheric forcing, through turbulent heatexchange, having lags of 1–3 months during winter.
In the South Atlantic Ocean region, the low-pressureanomalies from January to April reduce the wind stress,allowing the advection of warmer air southward andinducing a flux from the atmosphere to the ocean, heatingthe ocean. Negative heat flux anomalies are seen in thetropical South Atlantic, with maximum fluxes in Marchand April (Figure 9(h), (i)). In addition to this heating,the weakening of trade winds from February to Aprilalso contributes to the heating of the South Atlantic nearAfrica.
Correlations of NAI and NAOI with OLR, SST andSLP are shown in Figure 10. Both correlations showconnections with the ITCZ position, but the NAI presents
higher correlations than the NAOI. ITCZ convection,south of equator occurs when the NAI is positive(negative OLR correlation). Favourable conditions forITCZ development, south of the equator are seen incorrelations of positive NAI with SST anomalies. PositiveSLP correlations close to northern South America coastand negative correlations of SLP over the tropical SouthAtlantic are consistent with ITCZ development, southof the equator. Another interesting finding is the highpositive correlation of the NAI with SLP over the extra-tropical South Atlantic, at the centre identified in thefirst EOF mode in Figure 5 and in composite analysis,indicating the coupled mode of variability between Northand South Atlantic regions.
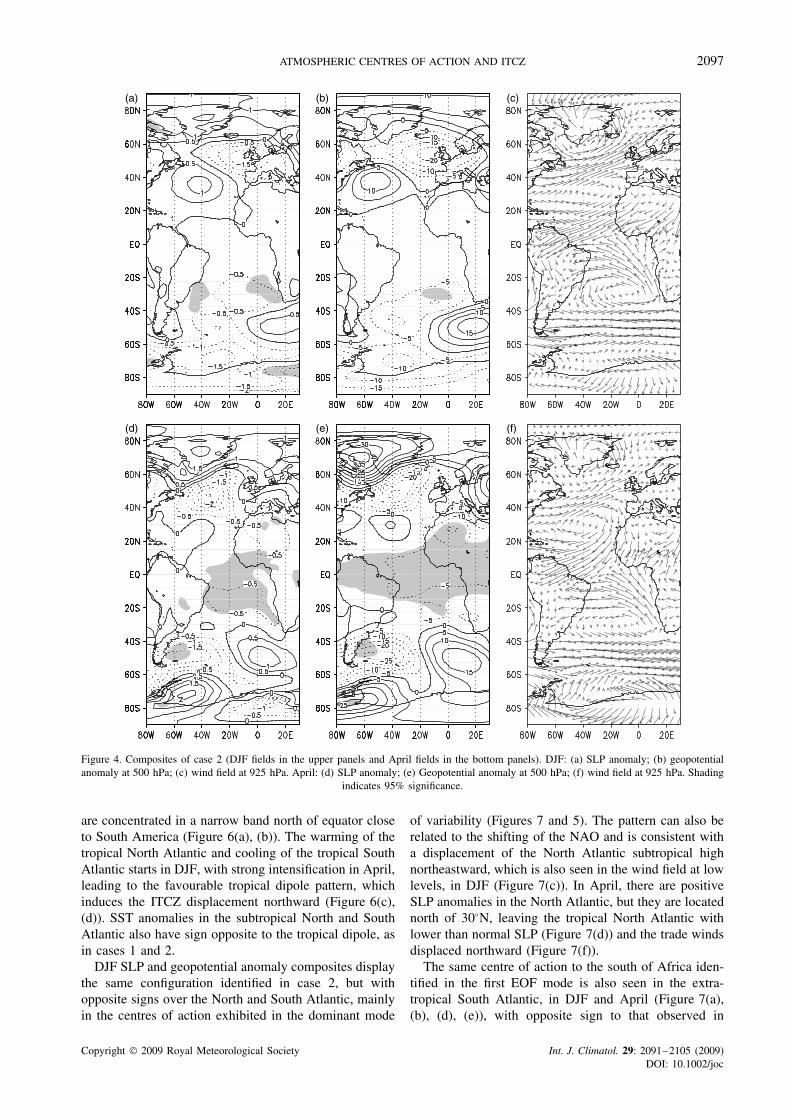
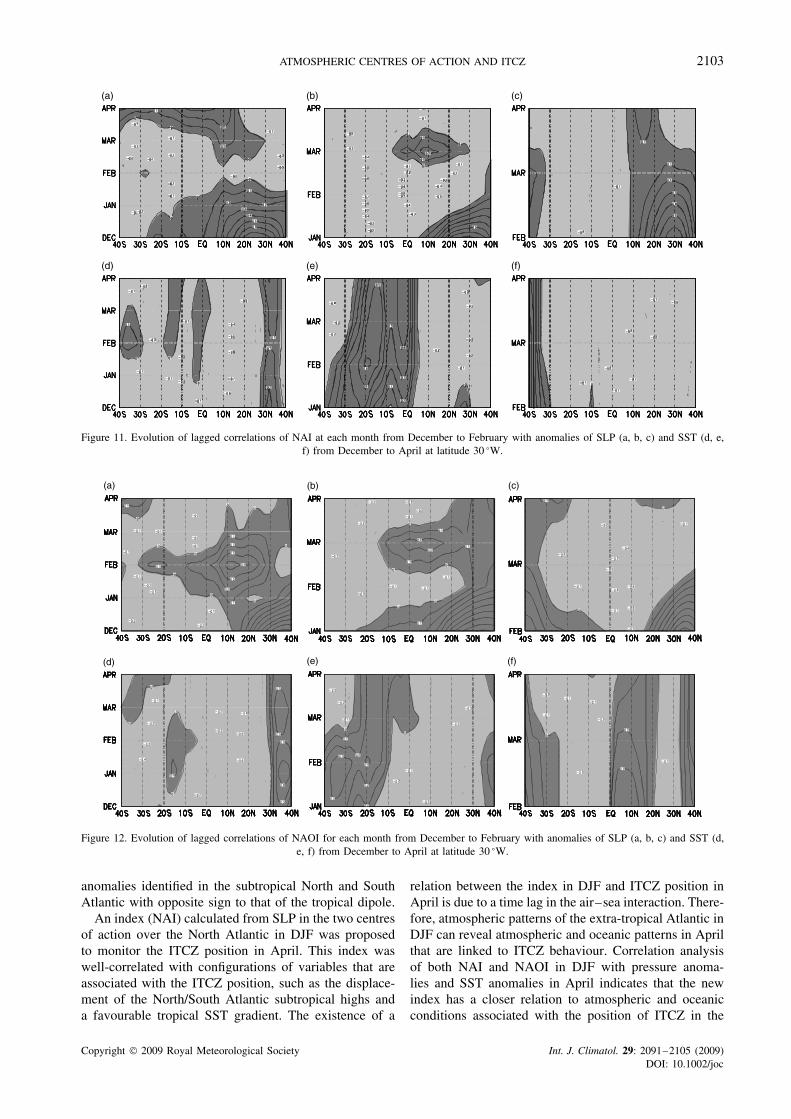
Lagged correlations of NAI and NAOI with SLPin each month from December to February and withSST from December to April are shown in Figures 11and 12. In February, the correlations do not showphysical meaning, but in December and January theyare coherent with the displacement of the North Atlanticsubtropical high towards the equator and cold waters inthe tropical North Atlantic. However, over South Atlanticthe negative correlations are lower in NAOI than in
Copyright 2009 Royal Meteorological Society Int. J. Climatol. 29: 2091–2105 (2009)DOI: 10.1002/joc

2100 P. SOUZA AND I.F.A. CAVALCANTI
(a) (b) (c)
(d) (e) (f)
Figure 7. Composites of case 3 (DJF fields in the upper panels and April fields in the bottom panels). DJF: (a) SLP anomaly; (b) geopotentialanomaly at 500 hPa; (c) wind field at 925 hPa. April: (d) SLP anomaly; (e) geopotential anomaly at 500 hPa, (f) wind field at 925 hPa. Shading
indicates 95% significance.
NAI. This is reflected in correlations with SST, whichshow higher positive anomalies in the tropical SouthAtlantic Ocean near the equator in NAI than in NAOI.As discussed in Section 3, a combination of both Northand South Atlantic are associated with the ITCZ position,and although the NAO is related to features of the NorthAtlantic, the NAI shows a relationship with the SouthAtlantic region also.
The simultaneous correlations between the NAI inApril and fields in April (Figure 13(a), (b), (c)) donot show favourable conditions for ITCZ displacement.Although positive SST anomalies occur close to theBrazilian coast, this situation is different from case 2,when the ITCZ is south of the equator (Figure 3). In that
case, the highest anomalies are found close to Africa. TheSST dipole configuration in the analyses of Nobre andShukla (1996) also showed the highest SST anomaliesclose to Africa. The simultaneous correlations betweenthe NAOI in April and fields in April (Figure 13(d),(e), (f)) show atmospheric and oceanic conditions asso-ciated with the ITCZ position displaced southward (highpressure and cold SST in the North Atlantic, and low-pressure and warm SST in the South Atlantic). How-ever, the higher correlations between the NAI index inthe pre-rainy season of Northeast Brazil (DJF) and theexistence of favourable/unfavourable conditions for ITCZdisplacement southward as compared to the simultaneous
Copyright 2009 Royal Meteorological Society Int. J. Climatol. 29: 2091–2105 (2009)DOI: 10.1002/joc

ATMOSPHERIC CENTRES OF ACTION AND ITCZ 2101
Figure 8. Time series of North Atlantic index NAI (open circle) and North Atlantic Oscillation Index, NAOI (closed circle) in DJF.
Figure 9. Evolution of anomalies of SLP (a, b, c), SST (d, e, f) and heat flux (g, h, i) from December to May at latitudes of 50 °W (left), 30 °W(centre) and 10 °W (right).
Copyright 2009 Royal Meteorological Society Int. J. Climatol. 29: 2091–2105 (2009)DOI: 10.1002/joc

2102 P. SOUZA AND I.F.A. CAVALCANTI
Figure 10. Correlations of indices in DJF with fields in April. NAI: (a) OLR anomaly; (b) SST anomaly; (c) SLP anomaly. NAOI: (d) OLRanomaly; (e) SST anomaly; (f) SLP anomaly.
correlations in April, corroborate the usefulness of thisindex in DJF. Therefore, it is suggested that this newindex can be used to monitor the position of the ITCZ inApril.
5. Summary and conclusions
The anomalous ITCZ, south of the equator in Apriland an extreme positive NAOI in the previous DJFoccur in a few years during the period of 1979–2004.The physical mechanisms for these occurrences wererelated to the anomalous high intensity of the NorthAtlantic subtropical high in DJF, confluence of tradewinds in southernmost positions and SST cooling in thetropical North Atlantic. At the same time, the SouthAtlantic subtropical high was displaced southeastwardof its mean position, contributing to the confluence ofwinds south of equator and allowing the warming of thetropical South Atlantic Ocean. The resulting SST gra-dient was favourable to ITCZ development southward.While cases of simultaneous positive NAO phase in DJFand ITCZ occurrence, south of equator in April were
rare, another analysis, selecting years when the ITCZwas situated in an anomalous position in April showedthe influence of other centres of action. Consistent withresults from previous studies, the condition for the ITCZposition being north or south of equator in April, wasrelated to the displacement of the North Atlantic subtrop-ical high southwestward and the displacement of SouthAtlantic subtropical high southeastward. These displace-ments were associated with extra-tropical features relatedto a mode of atmospheric variability in the North andSouth Atlantic region, which presents centres that actsimultaneously to affect the behaviour of the subtropicalhighs.
The North Atlantic centres are likely related to shiftingof NAO centres. The displacement of NAO centresforced the North Atlantic subtropical high southwestwardor northeastward, affecting the trade winds and NorthAtlantic SST. At the same time, the extra-tropical SouthAtlantic centre of variability was associated with SouthAtlantic subtropical high displacements, affecting also thetrade winds and South Atlantic SST. The displacementof the subtropical highs related to the extra-tropicalatmospheric variability was also responsible for the SST
Copyright 2009 Royal Meteorological Society Int. J. Climatol. 29: 2091–2105 (2009)DOI: 10.1002/joc
ATMOSPHERIC CENTRES OF ACTION AND ITCZ 2103
Figure 11. Evolution of lagged correlations of NAI at each month from December to February with anomalies of SLP (a, b, c) and SST (d, e,f) from December to April at latitude 30 °W.
Figure 12. Evolution of lagged correlations of NAOI for each month from December to February with anomalies of SLP (a, b, c) and SST (d,e, f) from December to April at latitude 30 °W.
anomalies identified in the subtropical North and SouthAtlantic with opposite sign to that of the tropical dipole.
An index (NAI) calculated from SLP in the two centresof action over the North Atlantic in DJF was proposedto monitor the ITCZ position in April. This index waswell-correlated with configurations of variables that areassociated with the ITCZ position, such as the displace-ment of the North/South Atlantic subtropical highs anda favourable tropical SST gradient. The existence of a
relation between the index in DJF and ITCZ position inApril is due to a time lag in the air–sea interaction. There-fore, atmospheric patterns of the extra-tropical Atlantic inDJF can reveal atmospheric and oceanic patterns in Aprilthat are linked to ITCZ behaviour. Correlation analysisof both NAI and NAOI in DJF with pressure anoma-lies and SST anomalies in April indicates that the newindex has a closer relation to atmospheric and oceanicconditions associated with the position of ITCZ in the
Copyright 2009 Royal Meteorological Society Int. J. Climatol. 29: 2091–2105 (2009)DOI: 10.1002/joc

2104 P. SOUZA AND I.F.A. CAVALCANTI
Figure 13. Correlations of indices in April with fields in April. NAI: (a) OLR anomaly; (b) SST anomaly; (c) SLP anomaly. NAOI: (d) OLRanomaly, (e) SST anomaly, (f) SLP anomaly.
middle of autumn. Additional analysis with both indicescorroborates the importance of both North Atlantic andSouth Atlantic conditions to the ITCZ position. Furtheranalysis will include the investigation of the usefulnessof this index as an additional tool to rainfall predictionover northern Northeast Brazil.
Acknowledgements
To CNPq for the research support and to the anonymousreviewers for the useful suggestions.
References
Cayan DR. 1992. Latent and sensible heat flux anomalies overthe Northern Oceans: The connection to monthly atmosphericcirculation. Journal of Climate 5: 354–369.
Czaja A, Frankignoul C. 1999. Influence of the North Atlantic SSTon the atmospheric circulation. Geophysical Research Letters 26:2969–2972.
Enfield DB, Mayer DA. 1997. Tropical Atlantic sea surfacetemperature variability and its relation to El Nino-SouthernOscillation. Journal of Geophysical Research 102: 929–945.
Folland CK, Colman AW, Rowell DP, Davey MK. 2001. Predictabilityof northeast Brazil rainfall and real-time forecast skill, 1987–1998.Journal of Climate 14: 1937–1958.
George SE, Saunders MA. 2001. North Atlantic Oscillation impact ontropical North Atlantic winter atmospheric variability. GeophysicalResearch Letters 28: 1015–1018.
Gong D, Wang S. 1999. Definition of antarctic oscillation index.Geophysical Research Letters 26: 459–462.
Hastenrath S. 1978. On modes of tropical circulation and climateanomalies. Journal of the Atmospheric Sciences 35: 2222–2231.
Hastenrath S. 2002. The intertropical convergence zone of the easternPacific revisited. International Journal of Climatology 22: 347–356.
Hastenrath S, Greischar L. 1993. Circulation Mechanisms related toNortheast Brazil rainfall anomalies. Journal of Geophysical Research98: 5093–5102.
Hastenrath S, Heller L. 1977. Dynamics of climatic hazards innortheast Brazil. Quarterly Journal of the Royal MeteorologicalSociety 103: 77–92.
Hastenrath S, Lamb P. 1977. Some aspects of circulation and climateover eastern equatorial Atlantic. Monthly Weather Review 105:1019–1023.
Houghton RW, Tourre YM. 1992. Characteristics of low frequency sea-surface temperature fluctuations in the Tropical Atlantic. Journal ofClimate 5: 765–771.
Hurrell JW. 1995. Decadal trends in the NAO: Regional temperaturesand precipitation. Science 269: 676–679.
Kalnay E, Kanamitsu M, Kistler R, Collins W, Deaven D, Gandin L,Iredell M, Saha S, White G, Woollen J, Zhu J, Chelliah M,Ebisuzaki W, Higgins W, Janowiak J, Mo K, Ropelewski C,Wang J, Leetmaa A, Reynolds R, Jenne R, Joseph D. 1996. TheNCEP/NCAR 40-year reanalysis project. Bulletin of the AmericanMeteorological Society 77: 437–471.
Copyright 2009 Royal Meteorological Society Int. J. Climatol. 29: 2091–2105 (2009)DOI: 10.1002/joc

ATMOSPHERIC CENTRES OF ACTION AND ITCZ 2105
Liebmann B, Smith CA. 1996. Description of a complete (interpolated)outgoing longwave radiation dataset. Bulletin of the AmericanMeteorological Society 77: 1275–1277.
Moura AD, Shukla J. 1981. On the dynamics of droughts in northeastBrazil: Observations, theory and numerical experiments with ageneral circulation model. Journal of the Atmospheric Sciences 38:2653–2675.
Namias J. 1972. Influence of northern hemisphere general circulationon drought in Northeast Brazil. Tellus 24: 336–343.
Nobre P, Shukla J. 1996. Variations of sea surface temperature, windstress and rainfall over the tropical Atlantic and South America.Journal of Climate 10: 2464–2479.
Robertson AW, Mechoso CR, Kim YJ. 2000. The influence of Atlanticsea surface temperature on the North Atlantic Oscillation. Journalof Climate 13: 122–138.
Rogers JC. 1984. The association between the North AtlanticOscillation and the Southern Oscillation in the Northern Hemisphere.Monthly Weather Review 112: 1999–2015.
Servain J, Legler DM. 1986. Empirical orthogonal function analysesof tropical Atlantic sea surface temperature and wind stress:1964–1979. Journal of Geophysical Research 91: 14181–14191.
Smith TM, Reynolds RW. 2003. Extended Reconstruction of GlobalSea Surface Temperatures Based on COADS Data (1854–1997).Journal of Climate 16: 1495–1510.
Sutton RT, Jewson SP, Rowell DP. 2000. The elements of climatevariability in the tropical Atlantic region. Journal of Climate 13:3261–3284.
Uvo CB. 1998. Influence of sea surface temperature on rainfall andrunoff in Northeastern South America: analysis and modeling, PhDThesis, report 1021, Departament of water Resources Engineering,Lund Institute of Technology, Lund University: Lund, Sweden.
Waliser D, Gautier C. 1993. A Satellite-derived climatology of theITCZ. Journal of Climate 6: 2162–2174.
Copyright 2009 Royal Meteorological Society Int. J. Climatol. 29: 2091–2105 (2009)DOI: 10.1002/joc