Embed Size (px)
Citation preview

1
Atomic Absorption

Introduc Aanalysis wAgency (as lead anthe exactimportancharacterhas high selectivitanalyzing
Inflame, fuof atoms exhibit liatoms lacabsorptio
Figure 1
Determin
ction Atomic spectwhich is imp(EPA) has send arsenic. t concentratint analyses inrization of prsensitivity, o
ty due to theg for multipln atomic speurnace, or pla
are measureine absorptiock the many on spectrum
: Atomic ab
Atomication of C
troscopy (absportant for aet maximumThe EPA crions of toxic nclude metalroteins in biooften exhibit presence ofle elements sectroscopy, aasma (a gas ed by absorpon and emissrotational anfor sodium i
bsorption “l
AbsorptiCalcium, M
sorption anda variety of re
m allowable literia often rmetals safe
l impurities iochemistry, ting detectiof extremely nsimultaneoua substance ihot enough t
ption or emission spectra nd vibrationin the visible
line” spectr
on SpectroMagnesium
d emission) ieasons. For imits for cerreflect the defor human cin pharmaceand mineral
on limits at thnarrow spect
usly and can is vaporized to contain iossion of specbecause elec
nal states of me region.
a for sodium
oscopy form & Iron i
is used to perexample, th
rtain heavy metection limiconsumptioneutical and inl content of fhe parts per tral lines. Theasily be autand decomp
ons and free cific wavelenctronic transmolecules. F
m in the visi
r the in Multivit
rform trace ehe Environmmetals in drinits of analytin is unknownndustrial profoods. Atomtrillion levelhe techniquetomated. posed into gaelectrons).
ngths of radiitions are quFigure 1 sho
ible region
tamins
elemental mental Protec
nking water cal methodsn. Other oducts, metalmic spectroscl (ppt), and he is capable
aseous atomConcentratioiation. Atomuantized andows the atom
2
ction such
s as
l copy high of
s in a ons
ms d mic

3
An instrument schematic for an atomic absorption spectrometer is shown in Figure 2 and the distinct differences from a UV-Vis spectrometer for molecular absorption in solution should be noted. The first difference is the light source. A “line” source must be used so that the narrow absorption band of the analyte is able to attenuate a measurable amount of the incident light. In addition, the bandwidth from the light source must be less than the bandwidth of the analyte so Beer’s Law is followed. Most typical monochromators are not capable generating bandwidths less than 0.01 nm, which is larger than the typical bandwidth of the analyte in the flame (~0.002 nm). Therefore, the light source commonly used is a hollow cathode lamp (HCL) which emits extremely narrow spectral lines of the metal cathode. The HCL is a tube filled with an inert gas such as Ne or Ar at pressure of 1-5 torr. Inside the tube, a high voltage (500 V) is applied between the anode and the cathode and the inert gas is ionized. The cations (Ne+ or Ar+) strike the metal cathode (negative electrode) with enough energy to eject metal atoms into the gas phase in a process called sputtering. The gaseous metal atoms are excited by collisions with high energy electrons and subsequently emit photons. The bandwidths of the HCL are less than those of the analyte in the flame because the lamp is at a much lower temperature. In this experiment, a hollow cathode lamp with a multi-element metal cathode will be used as the light source.
The presence of the flame is the second major difference. It is used to vaporize the analyte and produce free atoms. The sample is an aqueous solution which is nebulized (sprayed into fine droplets called an aerosol) into the flame. As the aerosol enters the flame the liquid is rapidly evaporated resulting in a dispersion of solid particles in the gaseous flame. Further heating of the solid leads to vaporization and the formation of individual gaseous molecules, atoms, ions, and excited-state species. In the flame, all of these species are present and relative concentrations depend on temperature and the kinetics of processes that interconvert them. This process is summarized in Figure 3. Atomic absorption relies upon the absorption of photons by the ground state (“unexcited”) atoms present in the flame. Atomic emission spectroscopy utilizes the emission of light by excited state species and does not require a light source. The temperature of a typical flame, furnace, or plasma causes relatively few excited state species exist. On this basis, we might anticipate that atomic absorbance would exhibit higher sensitivities than atomic emission. In actual practice, the sensitivities of the two techniques are comparable. Even though there are significantly fewer excited state species, atomic emission has the advantage of detecting an increase in light signal on a low background. This allows for lower detection limits when compared with absorbance which is measuring a small decrease in light intensity on a high background. These techniques are often complementary in that one will exhibit higher sensitivities for one group of elements and the other for another set of elements. Both atomic absorbance and emission spectroscopy are the ideal choice for trace metal determination. Several excellent textbook treatments1,2 and reviews 3,4 of these techniques have been published.

Figure 2
Figure 3
2: Instrument
3: Processes
t schematic o
occurring du
of an atomic
uring atomiz
c absorption
zation.2
spectrometeer.1
4

5
In this experiment, you will use an atomic absorption spectroscopy to analyze for the calcium, magnesium, and iron content of multivitamins. These elements are vital nutrients for humans and the daily recommended allowances are 1000, 400, and 18 mg/day for calcium, magnesium, and iron, respectively. You will utilize a standard addition method to correct for various spectral and chemical interferences that may be present in the complex matrix of a multivitamin. You will also explore one example of a matrix interference in atomic absorption spectroscopy (the phosphate interference with calcium) and learn a method to alleviate it.

6
Experimental: Reagents: Calcium carbonate (CaCO3, 100.08 g/mol) Magnesium oxide (MgO, 40.30 g/mol) Ferrous sulfate (FeSO4-7H2O, 278.02 g/mol) Concentrated nitric acid (HNO3, 16 M) Potassium phosphate, dibasic (K2HPO4, 174.17 g/mol) Lanthanum nitrate, hexahydrate (La(NO3)3·6H2O, 433.32 g/mol) Multivitamins Part I: Analysis of Calcium, Magnesium, and Iron in a Food Sample Preparation of Nitric Acid Solution for Dilutions: 1. Prepare a stock solution of 1 or 2M nitric acid in the hood. Use this solution to prepare 1 L of 0.10 M solution of nitric acid. Remember the rule “add acid to water, add water to base.” Be sure to place a few hundred mL of distilled water in the flask before adding the concentrated acid. If the acid were added first the solution could sputter out of the container when water is added. Preparation of Standards:
2. Obtain one of each of the three multivitamins available (or you may bring your own multivitamin if you desire), along with relevant nutritional information. Using the nutritional information provided, determine the concentration of each element in mg/L is present after dissolving the sample in 100 mL. Determine the range of concentrations for each element that is appropriate for standards. Remember that the standards should encompass a range from about 2- to 5-fold lower and 2- to 5-fold higher in concentration than the sample. Also, you should
Safety and Waste Disposal:
Wear gloves and eye protection. Concentrated nitric acid is corrosive and will cause damage to eyes and skin. Heavy metals such as lanthanum are toxic.
Clean Up
Dispose of all solutions containing lanthanum in the heavy metal waste container. Adjust the pH of solutions containing calcium to the range 5-8 with sodium bicarbonate and pour down the drain.

7
consider that the sample may be too concentrated (beyond the linear range of the instrument) and need to be diluted. In addition, some of the salts used to make the standards have limited solubility in aqueous solution. The best range to use is one that starts at the lower linear limit of the instrument. For our Perkin Elmer AAnalyst 200, the lower linear limits are 5.0, 0.5, and 6.0 mg/L for calcium, magnesium, and iron, respectively. Make a solution for each element that can be used to make a 100-mL multi-element standard that contains each of the elements at the highest concentration. This solution is then diluted to make the standards at lower concentrations. Note: this method requires more preparation in planning the proper concentration of each standard, but will save time in dilutions and uses many fewer volumetric flasks. 3. If your sample is solid, place several grams of the material into a mortar and pestle and grind it into a fine powder. Dissolve the sample completely in an Erlenmeyer flask or beaker before transferring it to a volumetric flask. Prepare a set of standards that encompasses the concentration range of the elements in the multivitamin samples by diluting the higher concentration standards with 0.10 M nitric acid.
Preparation of Multivitamin Sample: 4. Grind each of the multivitamins with a mortar and pestle and transfer to a 125 mL Erlenmeyer flask. Perform the following step in the hood: Dissolve (digest) the sample in 20 mL of concentrated (1M or 2M) HNO3. Heat the sample to ensure complete digestion. All solutions containing concentrated acid should be handled in the hood. Once dissolved, allow the solution to cool for about 15 min. 5. Filter the solution using a vacuum apparatus and rinse the filter with 0.10 M HNO3. Dilute the filtrate to 100 mL with distilled water. Dilute this sample as needed to put the concentration of the elements to be measured within the concentration range of the standards – DO NOT aspirate the initial 100 mL multivitamin solution! Filter the Centrum Chewable sample last, as it takes longer than the other samples. 6. Analyze these samples, standards and multivitamin unknowns, using the procedure described below. Note that the instrument can only analyze for one element at a time, so you’ll repeat the procedure three times to analyze for all three, calcium, magnesium and iron. Part II: Standard Addition for the Analysis of Calcium in One Multivitamin Preparation of standards: The method of standard addition will be used to overcome the problem of matrix interferences. Therefore, a series of standards should be prepared containing an aliquot of one of the multivitamins plus increasing amounts of the analyte calcium.

8
1. Prepare a calcium standard in 0.1 M nitric acid with the same (or very close to the same) concentration as the estimated amount of calcium in the unknown. This will be used to prepare standards for the standard addition calibration. 2. Obtain six- 25 mL volumetric flasks. To each flask add 10 mL of the unknown. Then add the following to each flask: Flask 1: Dilute to the mark with 0.1 M HNO3. Flask 2: 1 mL of calcium standard from step 1 and dilute to the mark with 0.1 M HNO3. Flask 3: 2 mL of calcium standard from step 1 and dilute to the mark with 0.1 M HNO3. Flask 4: 3 mL of calcium standard from step 1 and dilute to the mark with 0.1 M HNO3. Flask 5: 4 mL of calcium standard from step 1 and dilute to the mark with 0.1 M HNO3. Flask 6: 5 mL of calcium standard from step 1 and dilute to the mark with 0.1 M HNO3. 3. Follow the instructions provided to measure the atomic absorbance signal for each solution in triplicate. Record the average and standard deviation. Part III: Study of Phosphate Interference and Effect of Adding Lanthanum Prepare aliquots of the following pairs of solutions in labeled flasks using dibasic potassium phosphate (K2HPO4) and lanthanum nitrate hexahydrate. Do not prepare more than 50 mL of each solution containing lanthanum. Pair 1: 0.10 M HNO3 (blank) 50.0 ppm calcium in 0.10 M HNO3 Pair 2: 1000 ppm phosphate in 0.10 M HNO3 (blank) 50.0 ppm calcium and 1000 ppm phosphate in 0.10 M HNO3 Pair 3: 1000 ppm phosphate and 5000 ppm lanthanum in 0.10 M HNO3 (blank) 50.0 ppm calcium, 1000 ppm phosphate, 5000 ppm lanthanum in 0.10 M HNO3
Analysis of Samples with the AA: Note: Samples that appear cloudy indicating the presence of particulates should be filtered before analysis. Particles will clog the tubing!

9
1. Turn on main power switch located on the front panel below the hollow cathode lamps. (Open the door to the front panel.) Allow time for the operating system to start up.
2. Use the stylus to choose the Lamp tab located on the bottom of the touch screen. 3. Select the Signal field. Choose Background Corrected AA. 4. Select the Element field. Choose Ca.
Note: This automatically sets the wavelength to 422.67 nm and the slit(mm) to 2.7/0.6. 5. Select Setup Instrument. This will automatically adjust the HCL and monochromator
(detector) for maximum sensitivity. 6. Use the stylus to choose the Flame tab located on the bottom of the touch screen. 7. Check that the oxidant is set to Air and the gas flow rates are 10.0 L/min and 2.7 L/min
for the oxidant and acetylene respectively. 8. Select the red X above the word Interlocks. 9. Open the gas valves to both the air and acetylene cylinders to the right of the instrument. 10. Choose Update in the Interlocks menu. Both acetylene and air should pressure should be
sufficient, signified by a green check mark. Once this is so, choose OK. 11. It is now time to turn the burner on. Before doing so, please note the large red button in
the upper left corner of the instrument. Should it be necessary, pushing this button will immediately turn off the flame.
12. To turn on the flame, use the stylus and select the left side of the On/Off switch. The flame burns at ~2300 oC. Those would be some toasty marshmallows!
13. Choose Auto Zero Graph. This will automatically zero the instrument by means of background subtraction. Why is it important to turn the flame on before doing this?
14. Use the stylus to choose the Analyze tab located on the bottom of the touch screen. At this time the instrument is not connected to a printer, so it is crucial that you manually record all data collected in your laboratory notebook!
15. Place the sampler tube connected to the nebulizer in a blank solution of 0.1M HNO3. Wait 5 seconds and select Analyze Blank. Record the data from the blank.
16. Continue to analyze the standard solutions similarly by letting each aspirate for 5 seconds before analysis. For standards, analyze by selecting Analyze Sample.
17. For all other samples that were prepared, analyze them using the Analyze Sample button. Be sure to label them appropriately in your lab notebook, so you can work with the data later during Data Analysis. After you have analyzed your last sample, wash the nebulizer with 0.1% SDS solution for 3 minutes.
18. When finished with an element, return to step 2 and select the next element but skip steps 6 through 12. When finished with the last sample analysis, use the stylus to choose the Flame tab located on the bottom of the touch screen.
19. Turn the flame off with the On/Off switch. 20. Close both gas cylinders. Be sure they are completely closed. 21. Choose Bleed Gases.
10
22. Turn the instrument off with the main power switch located on the front under the HCLs.
References:
1. Harris, D., Quantitative Analysis, 7th Ed., 2007, W. H. Freeman, New York.
2. Skoog D. A. , Holler F. J. , Nieman T. A., Principles of Instrumental Analysis, 5th Ed., Brooks/Cole Publishing, 1998.
3. E.E. Picket and S.R. Koirtyohann, Anal. Chem. , 41, 28A, 1969.
4. R. Browner and A. Boorn, Anal. Chem. 56, 875 A, 1984.
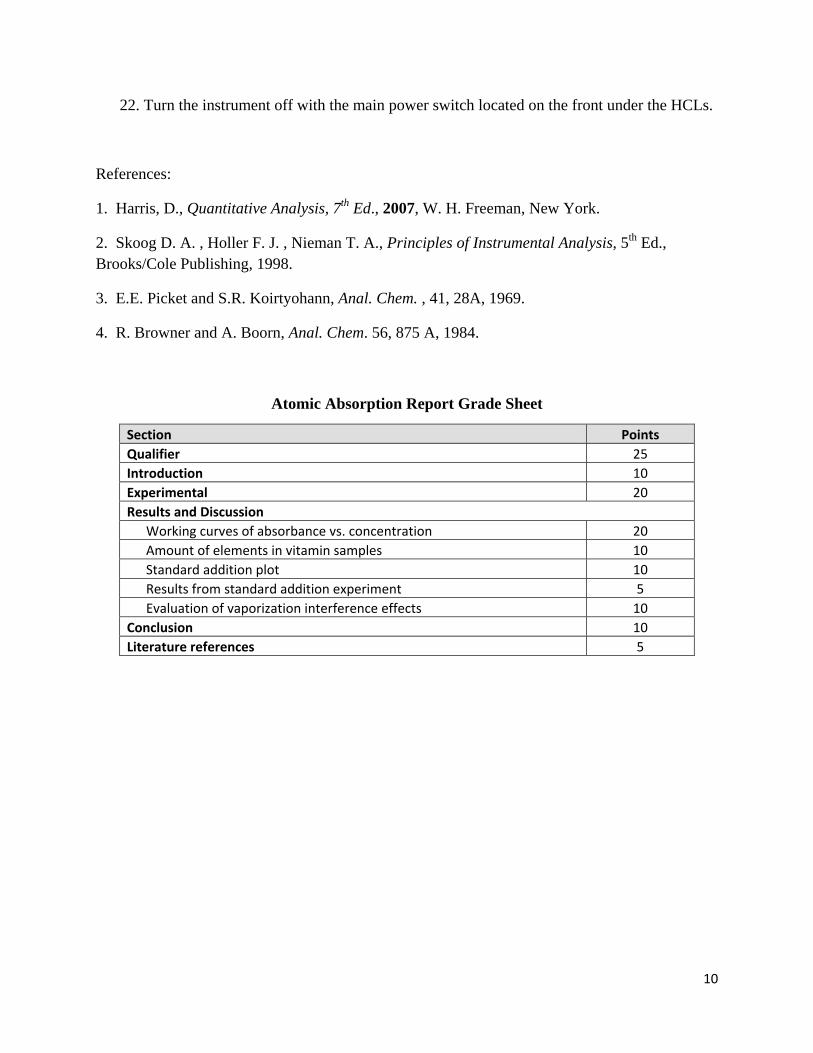
Atomic Absorption Report Grade Sheet
Section PointsQualifier 25 Introduction 10 Experimental 20 Results and Discussion
Working curves of absorbance vs. concentration 20 Amount of elements in vitamin samples 10 Standard addition plot 10 Results from standard addition experiment 5 Evaluation of vaporization interference effects 10
Conclusion 10 Literature references 5