Embed Size (px)
Citation preview

Waters Symposium: Atomic Emission Spectroscopy
JChemEd.chem.wisc.edu • Vol. 77 No. 5 May 2000 • Journal of Chemical Education 577
Atomic Emission Spectroscopy—It Lasts and Lasts and LastsGary M. HieftjeDepartment of Chemistry, Indiana University, Bloomington, IN 47405; [email protected]
Elemental analysis is one of the most common proce-dures used to characterize a sample. It is useful in most areasof human endeavor and is commonly applied to samples ofimportance in toxicology, geology, forensic science, prospecting,health, nanotechnology, materials science, industrial processcontrol, semiconductor processing, automobile manufacturing,and others. Because of this importance and range of applica-tion, a broad suite of methods for elemental analysis has beendevised. These methods range from long-established proceduressuch as those based on precipitation and titration to moremodern ones that rely as much on physical principles as onchemistry.
BackgroundProminent among the physical-based techniques are the
methods known collectively as atomic spectroscopy. In thisgroup of methods, the sample or specimen of interest isdecomposed as quantitatively and reproducibly as possibleinto its constituent atoms. Those atoms, in the gas phase,then undergo valence-electronic transitions free from theeffects of chemical bonding. As a result, the transitions arehighly selective, characterized by narrow spectral lines, andare indicative of the element or elements being determined.Moreover, the strength of each transition is proportional tothe number of atoms that are present and, indirectly, to theelemental concentration in the original sample. The field ofatomic spectrometry includes the procedures of atomicemission spectroscopy (AES), atomic absorption spectroscopy(AAS), atomic fluorescence spectroscopy (AFS), and, whenatomic ions are generated and can be measured, atomic massspectrometry (AMS). To be sure, additional atomic methodshave been devised but these are in less common use. In thislatter set are found techniques such as coherent forwardscattering spectrometry, opto-galvanic effect spectroscopy, andthermal-lens spectrometry.
Atomic emission spectroscopy is perhaps unique in thislisting. It was among the first techniques ever used for quali-tative and quantitative elemental analysis, yet it remains oneof the most widely used today. Of course, the instrumentation,sample-handling approaches, and methodology of AES haveevolved over time. Still, it is one of the most resilient of ana-lytical methods.
The reasons for this resiliency can perhaps be understoodby revisiting the seven stages of an analytical method set downby Velmer Fassel (1). Fassel’s listing, adapted from ref 1, isreproduced below.
Seven Stages of an Analytical Method
1. Conception of idea2. Design and construction of first operating apparatus3. Successful demonstration of idea; first publication4. Improvement of instrumentation; figures of merit5. Maturity; general acceptance; automation6. Improved understanding of fundamental principles7. Old age and senescence
According to Fassel, the natural evolution of any analyticalmethod progresses from its conception through instrumentdesign and testing to maturity, general acceptance, and auto-mation. After this period of considerable success, the methodis characterized more fully in a fundamental sense, after whichit reaches its period of old age and senescence.
I disagree with portions of this analysis. To me, it seemsinappropriate that a method would be characterized funda-mentally only after it reaches success and that the fundamentalunderstanding would yield little practical benefit. Accord-ingly, I would modify Fassel’s seven stages as follows:
Seven Stages of an Analytical Method (Modified)
1. Conception of idea2. Successful demonstration and publication of idea3. Improvement of instrumentation; figures of merit4. Maturity; general acceptance; automation5. Improved understanding of fundamental principles; introduction of new instrumentation6. Iteration of steps 3–57. Old age and senescence
Here the first two stages are much the same as thosein Fassel’s original listing. After a new idea is conceived, itobviously must be demonstrated in order to be successful.However, once the successful demonstration has been published,it seems likely that the instrumentation will be improved andfigures of merit (detection limits, precision, accuracy, inter-ferences, etc.) compiled to underscore its capability. Once thislevel of performance has been accepted widely, additionalfunds will no doubt be invested to make the method easierto use; automation will follow, and the technique will reachwhat might be considered to be a mature stage.
At the same time this technique is maturing, it seemsinevitable that scientists will begin characterizing it on a morefundamental level, if that fundamental underpinning did notexist previously. Ideally, the deeper level of fundamental un-derstanding that results from these studies will lead to animprovement of instrumentation, better figures of merit, stillmore widespread acceptance, and an even fuller understanding.These three steps—improvement of instrumentation and fig-ures of merit, broader acceptance, and deeper understanding—will then continue to cycle until the point at which eitherno further improvement in the method is possible or com-petitive techniques prove to be superior. Only when theselimits have been reached will the method enter its period ofold age and senescence.
If the modified sequence can be accepted, it should beapparent why AES has long remained a widely used, ex-tremely powerful technique. Instrumentation for AES hascontinued to improve, the understanding of emission sourcesand emission instrumentation has progressively evolved, andfigures of merit have gotten steadily better. Indeed, as will beargued later in this discussion, AES appears likely to remaincompetitive for a long time to come.

Waters Symposium: Atomic Emission Spectroscopy
578 Journal of Chemical Education • Vol. 77 No. 5 May 2000 • JChemEd.chem.wisc.edu
In this overview, the evolution of AES will be traced fromits earliest roots to some of the most recent exciting develop-ments, with a view toward identifying some of the develop-ments that made AES attractive in the face of increasinglystiff competition. Greatest emphasis will be placed on instru-mental developments, although a number of fundamentalstudies of particular significance will be mentioned. Greatestweight will be placed on the development of atomization/excitation sources for AES, because they have changed mostgreatly over the years. However, some developments in systemsfor the detection of the emitted radiation will also be included.
Because this overview is meant to provide perspectiveand not to be exhaustive in its coverage, the original litera-ture will not usually be cited. For more detail, especially abouthistorical developments, the interested reader should consultany of the several excellent texts that are available (2–8).
Atomic Emission Sources
A listing of noteworthy atomic emission sources is com-piled below.
Noteworthy Atomic Emission Sources
Chemical flamedc, ac arcHigh-voltage sparkICPGlow discharge (dc, RF)dc plasmaMIP, MPTFAPESOther “tandem sources”
Of course, in an overview of reasonable length, it isimpossible to discuss the impact of each of these sources indetail. Rather, a selective approach will be used, principalemphasis being placed on the AES sources that have had thegreatest practical impact both historically and at the presenttime. Accordingly, the sources that will be emphasized includethe chemical flame, the high-voltage spark, and the microwave-induced plasma (MIP). Although the inductively coupledplasma (ICP) is clearly a source of both historical and currentimportance, it is described in considerable detail in one ofthe accompanying papers in this symposium and will thereforenot be stressed here.
The Chemical FlameFlame emission spectrometry (FES) is one of the most
familiar atomic methods and is probably the oldest for deter-mining chemical elements by means of their characteristicspectra. The field can be traced (see Fig. 1) at least back toThomas Melville (5), who in 1752 observed that sea salt andother chemical substances added to an alcohol flame causeda discernible difference in the color of the flame.
Later, in 1826, the Scotsman W. H. Fox Talbot employeda simple spectroscope to observe flames that had been dopedwith a range of different salts. In an 1834 paper he defined moreexactly the potential power of flame emission spectrometry.Yet it was Robert Wilhelm Bunsen and Gustav Kirchhoff whoin 1859 and 1860 set the method on a sounder theoretical andexperimental foundation. Bunsen’s flame, invented only a fewyears earlier, provided a wonderfully transparent medium
against which elemental emission lines could be observedmore clearly. At the same time, Kirchhoff recognized that theabsorption lines described earlier by Fraunhofer coincidedexactly with the emission lines from salts introduced into theflame. Together, Bunsen and Kirchhoff set the stage formodern FES by recognizing that spectral lines emitted bymetals occur at wavelengths that are independent of theelements (anions) to which the metals are bound.
Yet the technique did not enjoy immediate widespreadfavor because of the difficulty of introducing samples orsample solutions into the chemical flame. Then, in 1879, L. P.Gouy showed that it was possible to employ a pneumaticnebulizer for introducing sample solutions into flames. A trulymodern setup was finally assembled in 1929 by Lundegårdh,who coupled a premixed air–acetylene flame, a pneumaticnebulizer for sample introduction, and a spray chamber forconditioning the nebulized solution. Photographic detectionwas employed. An examination of Lundegårdh’s experimentalsystem (5) reveals a similarity to even the most recent systems.In a completely automated fashion, his apparatus changedsamples, controlled the photographic exposure, developed thephotographic film, and produced a microphotometer readingof the recorded spectral lines.
With this innovation, FES became more widely used.Still, most instruments had to be specially and locally con-structed, limiting the popularity of the method.
In 1949, all this changed through the efforts of Paul T.Gilbert of the Beckman Company, who fashioned a flameemission attachment for the popular Beckman DU spectro-photometer. Gilbert’s emission source consisted of a total-consumption turbulent burner that produced an extremelyunstable and noisy (in terms of both signal fluctuation andacoustic output) flame. In the Gilbert total-consumptionburner, the fuel (either hydrogen or acetylene) and oxidant(usually oxygen) issued from concentric orifices in a highlyturbulent stream. This turbulence mixed the gases so theycould be readily and safely combusted without danger of ex-plosion or flashback. Into this turbulent mixture an aerosolof the sample solution of interest was then sprayed directly.The whole arrangement sounded like a small rocket motorin operation and yielded such a coarse spray that many drop-lets survived intact during their passage through the flame.
Figure 1. Milestones in flame emission spectrometry. The grayscalebar at the top indicates qualitatively how the field developed overtime. A darker shade indicates a higher level of activity in the area.
Milestones in Flame Emission Spectrometry
■ 1860:
■ 1876:
■ 1928:
■ 1937:
■ 1949:
■ 1949:
■ 1955:
■ 1960s:
■ 1966:
■ 1970:
Bunsen & Kirchhoff; FES with prism spectroscope
L. G. Gouy; use of pneumatic nebulizer
H. Lundegårdh; spray chamber, premixed air–C2H2 flame
Schuhknecht; Na and K detection by filter photometer
P. T. Gilbert; total consumption nebulizer-burner
P. T. Gilbert; introduction of Beckman flame photometer (PMT)
Attack of the atomic absorbers
Elucidation of matrix interferences in FAAS and FAES
M. Amos & J. B. Willis; introduction of N2O–C2H2 flame
Attack of the ICP; relegation to clinical workhorse position
19501850 Present1960

Waters Symposium: Atomic Emission Spectroscopy
JChemEd.chem.wisc.edu • Vol. 77 No. 5 May 2000 • Journal of Chemical Education 579
Nevertheless, the Gilbert system was used for quite a numberof years, especially for qualitative and semiquantitative flame-based analyses.
In many ways, the popularity of Gilbert’s invention hin-dered the long-term development of FES. The coarse aerosolit produced made it impossible for large particles of samplematerial to be completely atomized in the flame. As a result,the degree of atomization, and therefore the signal from agiven element, depended strongly on the other constituentsin a sample. The method therefore became cursed with thereputation for exhibiting serious and difficult-to-avoid matrixinterferences.
These difficulties were exacerbated when Alan Walshintroduced atomic absorption as an analytical method in1955. Walsh, and most who followed him, also employed achemical flame, but as a light-absorbing medium. However,the flame he used was much more like the one originally usedby Lundegårdh. The gases were premixed and an aerosol spraychamber was used to eliminate many of the largest dropletsin the pneumatically generated spray. As a result, much finerdroplets were introduced into a flame that was highly stable.The result was a steadier signal and fewer matrix interfer-ences. Regrettably, many workers at that time attributed thelower level of interferences to the use of atomic absorptionrather than to the use of a different setup for producing theflame and introducing the aerosol. The use of FES began todecline accordingly.
It was about this same time when additional fundamentalwork on FES began to be published and widely recognized.To be sure, the basic underpinnings of spectral-line generationhad been laid years before. However, investigations aimedspecifically at elucidating the origin of matrix interferencesin FES were undertaken by C. Th. J. Alkemade in the Neth-erlands and by others (3, 9). For example, Alkemade showedthrough a series of brilliant experiments (9) that a mutualinterference exists among the alkali metals because they arepartially ionized at flame temperatures. If, say, sodium is beingdetermined, a fraction of the sodium will ionize in the flame.Because it is the free, neutral atoms that are ordinarily observedin emission, any factor that affects the fraction of atoms andions will similarly alter the measured signal. If, for example,potassium is added to the sodium-containing flame, a fractionof the potassium also ionizes. The free electrons liberated bythe potassium ionization then serve to shift the equilibriumbetween sodium atoms and ions back toward the formationof free atoms. The sodium signal rises accordingly. Alkemadethen showed that the interference could be overcome quitesimply, just by adding an excess of potassium to the samplesolution; not only was the influence of other alkali metals(including potassium) thereby avoided, but also the sodiumsignal (and that of all other alkali metals) was increased.
Other experiments during that time and later were aimedat determining the rates and mechanisms of atom formationin a chemical flame. Unfortunately, these experiments werehandicapped because conventional nebulizers employed inflame spectrometry produced a broad range of droplet sizes,making it extremely difficult to follow the events that occurto a single droplet. These complications were avoided whenit was shown possible to introduce a single droplet or a streamof droplets of known size along a reproducible trajectory intoa chemical flame (10–19). Because each aerosol droplet follows
exactly the same path in the flame as all others, and becauseof the reproducibility of the original droplet size, the progressof each droplet or of multiple droplets in the stream couldbe followed simply by examining progressively later timesin the flame. By means of both physical and spectroscopicmeasurements, it then became possible to measure the rateof droplet desolvation and, later, of particle vaporization. De-termining the dependence of those rates on the properties ofthe droplet, the solvent, the solute, and the flame then madeit possible to deduce the mechanism of droplet desolvationand particle vaporization.
While these fundamental developments were taking place,new instrumentation was being invented that would improveboth flame emission and atomic absorption spectrometry.Perhaps the most important of these innovations was theintroduction by Max Amos and John Willis in 1966 of thenitrous oxide–acetylene flame. Unlike the air–acetylene mixtureused earlier, the nitrous oxide–supported flame produced atemperature high enough to volatilize even solutes thatcontained refractory elements such as zirconium, hafnium,or aluminum. Moreover, although its spectral backgroundwas a bit more troublesome than had been experienced withthe air–acetylene flame, the N2O–acetylene mixture couldbe supported safely on a burner only slightly different fromthe ones then in common use.
Because of these newly recognized capabilities, mostmanufacturers of atomic absorption instrumentation incor-porated the ability to perform flame-emission measurementsinto their systems. FES became a workhorse in clinical analyses,especially for the determination of alkali and alkaline-earthmetals. It is still widely used for this purpose, although itsbroader application has been limited since the 1970s by thewidespread acceptance of the inductively coupled plasma asan even more powerful emission source.
The history of FES, it can be seen, nicely follows themodified sequence of evolutionary stages of an analyticalmethod outlined earlier. After its original conception andexperimental demonstration, the method was improved andits figures of merit were delineated. It was automated andbecame widely accepted, and its fundamental principles werebetter understood. This improved understanding led to furtherdevelopments in instrumentation and the cycle repeated itself.Even the introduction of atomic absorption as a popularmethod was not enough to quell the further development ofFES. Only when a decidedly more capable source (the ICP)came along was FES relegated to a secondary position.
The High-Voltage SparkFigure 2 chronicles the development of high-voltage
spark emission spectrometry. As in flame-emission spectrometry,electrical sparks were known long before they were appliedto elemental analysis. However, as early as 1873–1874, J. N.Locklear realized that a high-voltage spark exhibits a complexspatial structure. More importantly, Locklear observed thatthe spatial structure of atomic emission within the spark wasa function of the concentration of the emitting element.Along with his colleague Roberts, he also determined thatimproved quantitation was possible by comparing the spatialstructure of the spectral lines of a target element with thoseof another element in the sample. This approach is, of course,quite similar to the modern method of internal standardization.

Waters Symposium: Atomic Emission Spectroscopy
580 Journal of Chemical Education • Vol. 77 No. 5 May 2000 • JChemEd.chem.wisc.edu
In 1884, another advance in quantitation was establishedby Hartley at the University of Dublin. He employed acondensed spark to directly excite the spectra of elementsin solution. The target of these efforts was to improve theaccuracy and precision of quantitative analysis.
Traditionally, high-voltage sparks were notoriously un-stable. Accordingly, the introduction of true internal stan-dardization by W. Gerlach and E. Schweitzer in 1925 madequantitative determinations far more tractable. Shortly there-after, quantitation was greatly simplified by Scheibe andNeuhausser through their introduction of the rotating logsector. Because the blackening of a photographic emulsionis logarithmically related to emission intensity, the rotatingsector made the length of an image on a photographic filmor plate proportional to intensity and therefore to concen-tration.
George Harrison of MIT had an enormous impact onmany aspects of spectrochemical analysis. His publication in1939 of a comprehensive set of wavelength tables greatlyaided the identification of spectral lines (20). Shortly there-after, spark emission spectrometry became widely adopted inthe metals industry because of its high speed, modest levelof matrix interferences (for samples of relatively constantmatrix), and large number of practitioners. Still, users of thehigh-voltage spark yearned for something considerably morecontrollable and precise.
Although fundamental studies had begun long before(21), in the 1950s and 1960s a deeper understanding wassought of events that occur in the high-voltage spark. Earlywork by Bardøcz led J. P. Walters and H. V. Malmstadt atthe University of Illinois to devise a rotating-mirror spec-trograph that enabled the events occurring in the spark to beresolved temporally and spatially. The evolution of processesthat occur in the discharge was found to be extremely com-plex but controllable, depending upon the circuitry used todrive the spark. The original thyratron-triggered high-volt-age spark of Walters and Malmstadt gradually evolved inWalters’s lab at the University of Wisconsin into a control-lable-waveform high-voltage spark source (22). The deviceenabled the timing of the spark to be precisely controlled andits waveform to be carefully tailored and extraordinarily re-producible. Either a bidirectional or unipolar pulsating dis-charge could be achieved, the latter being more desirable.With this greater understanding and improved instrumenta-tion came an unprecedented degree of control over the sam-pling and excitation processes that occurred in the spark. Laterexcitation sources built around the concepts that sprang fromthe Walters group remain the most stable and controllableof all high-voltage spark systems.
The same pattern emerges in the development of thehigh-voltage spark as we saw in flame-emission spectrometry.This pattern, once again apparent in the modified evolutionarysequence, reveals that a technique progresses from the initialphases of study to widespread acceptance. A deeper under-standing of the fundamental principles and the developmentof improved instrumentation then naturally arise from thishigh level of interest. The improved instrumentation leadsto better figures of merit, even broader acceptance, and a cyclethat continues to produce improved systems. Even today, thehigh-voltage spark source is the most widely used tool in themetals industry for rapid, nearly real-time analyses. Only in
the area of solution samples has another source, the induc-tively coupled plasma, proven superior.
The Inductively Coupled PlasmaBecause the evolution and eventual success of the ICP
is documented elsewhere in this symposium, coverage willbe restricted here. However, it is useful to display a numberof milestones in ICP emission spectrometry just as were givenfor flame-emission and spark-emission spectrometry. Thesemilestones are compiled in Figure 3.
Like the flame and high-voltage spark, the ICP had itsroots in fields well removed from analytical chemistry oratomic spectrometry. Also like the other systems, the ICP under-went several cycles of improved fundamental understandingand better instrumentation, although in the case of the ICP,most of the innovations came in the sample-introduction endof the instrument. Even today, work continues in understand-ing the nature and origin of interelement interferences thatafflict ICP emission spectrometry. It is to be hoped that, witha clearer elucidation of those interference effects, they canbe brought under control or eliminated entirely.
The Microwave-Induced PlasmaIn contrast to the other sources already discussed, the
microwave-induced plasma (MIP) is a relatively recent in-
Figure 3. Milestones in ICP emission spectrometry. The grayscalebar at the top indicates qualitatively how the field developed overtime. A darker shade indicates a higher level of activity in the area.
Milestones in ICP Emission Spectrometry
■ 1942: ■ 1961:
■ 1964:■ 1965:
■ 1969:■ 1974:
■ 1975:■ 1975–85:
■ 1980:■ 1980s:
■ 1990s:
G. I. Babat; atmospheric-pressure induction plasma T. B. Reed; flowing atmospheric-pressure ICP
S. Greenfield; toroidal analytical ICPR. H. Wendt & V. A. Fassel; reduced-power analytical ICP
G. W. Dickinson & V. A. Fassel: ICP detection limitsFirst commercial ICP–AES instruments
J. Robin & C. Trassy; first use of end-on observationExplosive growth in utilization, instrument development
First publication of ICPMS; challengeCharacterization of spectral, matrix interferences
Settling in; routine usage
19741942 Present1980
Figure 2. Milestones in spark emission spectrometry. The grayscalebar at the top indicates qualitatively how the field developed overtime. A darker shade indicates a higher level of activity in the area.
■ 1873–4: J. N. Lockyer; Spatial resolution of spark emission
■ 1884: W. N. Hartley; Condensed-spark excitation of solutions
■ 1925: W. Gerlach & E. Schweitzer; line pairs for internal standard
■ 1928: G. Scheibe & A. Neuhausser; rotating log sector for quant.
■ 1939: G. R. Harrison; publication of MIT Wavelength Tables
■ 1940–55: Rapid expansion and widespread use in metals industry
■ 1964–80: J. P. Walters, et al.; development of stabilized spark
■ 1980–present: Automation
19401850 Present1950
Milestones in Spark Emission Spectrometry

Waters Symposium: Atomic Emission Spectroscopy
JChemEd.chem.wisc.edu • Vol. 77 No. 5 May 2000 • Journal of Chemical Education 581
vention. In fact, technology for the routine production ofmicrowave power did not become practicable until the surgeof interest in radar instrumentation during World War II.Since that time, specially designed electronic devices such asmagnetrons, Gunn diodes, and Klystron tubes have made thegeneration of microwaves relatively straightforward. Of thesedevices, the most common for use in sustaining an MIP isthe magnetron tube.
The most common frequency at which an MIP is sus-tained is 2.45 GHz. This is the same frequency employed inmicrowave ovens, so components for an MIP system havebecome relatively inexpensive. In addition, an MIP is usuallyoperated at power levels considerably below those used in ICPspectroscopy, commonly between 50 and 250 W. Again, amagnetron tube useful for a microwave oven performs well.
However, sustaining an MIP is not as easy as operating akitchen oven. Microwaves lie at frequencies high enough thatthey can be viewed alternatively as an electrical signal or as alow-frequency light wave. Accordingly, they can be carried al-ternatively down a coaxial cable or along a resonant structuretermed a waveguide. In addition, microwaves can be coupledinto a gaseous discharge by a number of approaches. Earlydesigns employed a simple antenna system that focused themicrowave energy into a closed discharge cell, an arrangementthat proved acceptable but relatively inefficient. Later, reso-nant cavities based on either quarter-wave (for example theEvenson system) or 3/4-wave (such as the Broida device) de-signs were introduced. However, these arrangements workedbest when the gaseous discharge was at reduced pressure, typi-cally only a few torr. It also was extremely difficult to sustaina helium plasma in such a resonant cavity.
An important innovation in microwave cavity designoccurred with the introduction of the TM010 cavity byC. I. M. Beenakker in 1976 (23). Unlike the Evenson andBroida designs, which operate on a standing electric field,the Beenakker cavity employed a standing magnetic wave.As a result, the dimensions of the cavity in the direction per-pendicular to the magnetic field (the electric-field direction)could be adjusted at will. Accordingly, if the electric-fielddimension were made extremely small, the electric field wasconcentrated in an extremely small region exactly in the centerof the cavity. Indeed, the field became great enough in thatsmall zone to sustain atmospheric-pressure plasmas in virtu-ally any gas, including helium. With modification, this basicBeenakker design has formed the basis of the most successfulcommercial MIP system, offered by Hewlett-Packard formultielement detection of a gas chromatographic effluent.
Another innovation in MIP technology occurred withthe introduction of the surfatron by Michel Moisan et al. (24).Unlike the Evenson, Broida, and Beenakker devices, thesurfatron did not sustain a plasma within a resonant cavity.Rather, it consisted of a wave-shaping structure that launchedthe microwave field out of the end of a resonant unit. Thefield traveled along the inner edge of a dielectric material, inmost cases a quartz tube that was passed through the resonantand wave-shaping structures. Consequently, the surfatrondischarge formed at the interface between the quartz dielectricand the plasma support gas. The discharge was thereforenaturally annular in shape, on the inner surface of the quartzdischarge tube. Samples could be introduced into the centerof the tube without greatly affecting the efficiency with which
microwave energy was coupled into the discharge. The dischargethus became far less sensitive to the presence of sample materialand much more tolerant to molecular gases introduced intothe discharge. It was possible to sustain a surfatron discharge ina variety of gases, including helium at atmospheric pressure.Although no commercial atomic spectrometric instrumen-tation based on the surfatron has yet been introduced, thesurfatron has become widely studied and used effectively,especially for gas chromatographic detection.
The most recent addition to the arsenal of support struc-tures for the MIP is the so-called microwave plasma torch(MPT), introduced by Jin et al. (25). Like the surfatron, theMPT consists of a resonant structure and a wave-launchingassembly. However, in the case of the MPT, waves arelaunched directly into the atmospheric pressure region abovethe torch. As a consequence, the gaseous discharge that formsin that region serves as its own energy-carrying medium. Theresult is an annular (hollow) plasma that extends into the openatmosphere. In appearance, the plasma produced by the MPTresembles a miniature inductively coupled plasma. Like theICP and the plasma formed from a surfatron, the MPTdischarge is sustained by power coupled into its periphery.As a consequence, molecular gases or even aerosols can beintroduced directly into the center of the discharge withoutseriously affecting the coupling process. Matrix interferencesare accordingly reduced and it becomes easier to apply theMPT to a range of sample types. Moreover, because of theflamelike structure of the MPT discharge, it can be examinedin either an end-on or side-on mode and also can be coupledrelatively easily to a mass spectrometer if that mode of measure-ment is desired. Importantly, the MPT is a recent enoughinnovation that it is still undergoing modification in labora-tories throughout the world. However, it is also availablecommercially in a package intended for the detection ofmetals and nonmetals in gaseous samples.
From this brief overview, MIPs appear still to be in theirearliest growth phases, according to the modified “SevenStages” outlined earlier. The techniques have been conceivedand developed, but are still at a relatively early stage in thatdevelopment. Instrumentation, particularly plasma supportstructures, is still being devised and tested, and figures of meritare still in the process of being improved. The technique hasnot yet reached its mature stage and has become widelyaccepted only as a detector for gas chromatography. If thepattern observed earlier in the evolution of chemical flames,high-voltage sparks, and the inductively coupled plasma appliesalso to the MIP, that discharge is likely to enjoy continuedgrowth in the future.
Systems for Measuring Atomic Emission Spectra
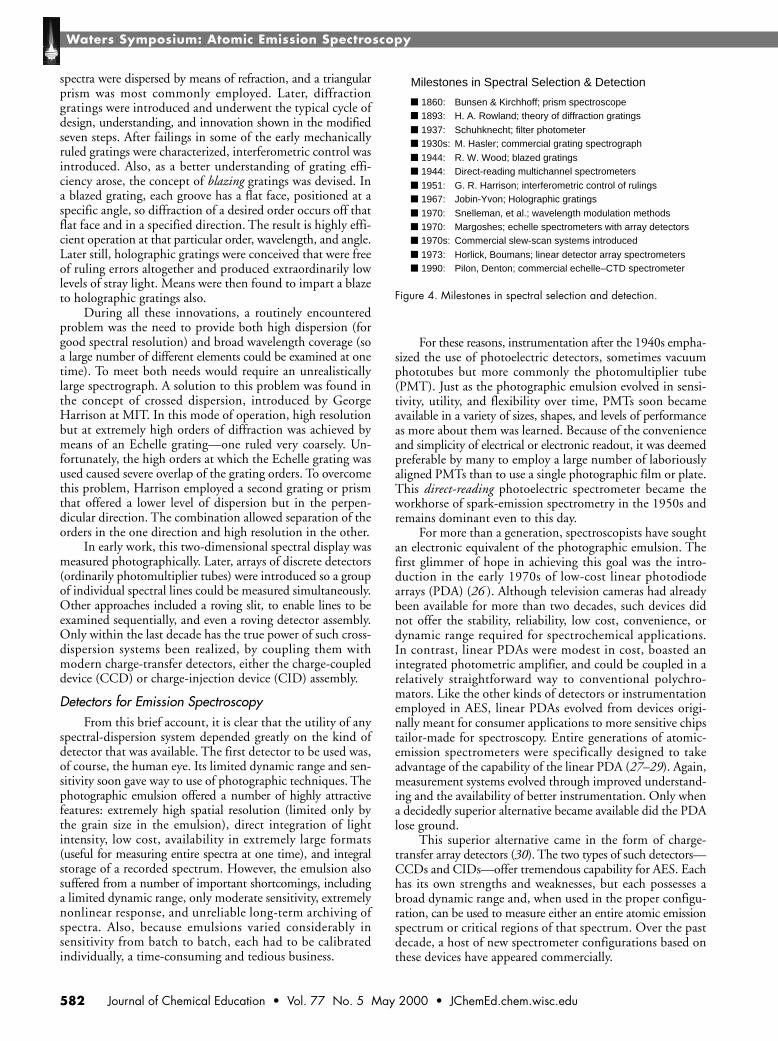
Although greatest emphasis in this overview has inten-tionally been placed on an examination of atomic emissionsources, a great deal could also be written about the evolutionof systems to decode and detect atomic emission spectra.Milestones in this field are cited in Figure 4.
Dispersion SystemsLike instrumentation for atomic emission sources, in-
strumentation for the dispersion and detection of atomic spec-tra began to be introduced more than a century ago. Initially,
Waters Symposium: Atomic Emission Spectroscopy
582 Journal of Chemical Education • Vol. 77 No. 5 May 2000 • JChemEd.chem.wisc.edu
spectra were dispersed by means of refraction, and a triangularprism was most commonly employed. Later, diffractiongratings were introduced and underwent the typical cycle ofdesign, understanding, and innovation shown in the modifiedseven steps. After failings in some of the early mechanicallyruled gratings were characterized, interferometric control wasintroduced. Also, as a better understanding of grating effi-ciency arose, the concept of blazing gratings was devised. Ina blazed grating, each groove has a flat face, positioned at aspecific angle, so diffraction of a desired order occurs off thatflat face and in a specified direction. The result is highly effi-cient operation at that particular order, wavelength, and angle.Later still, holographic gratings were conceived that were freeof ruling errors altogether and produced extraordinarily lowlevels of stray light. Means were then found to impart a blazeto holographic gratings also.
During all these innovations, a routinely encounteredproblem was the need to provide both high dispersion (forgood spectral resolution) and broad wavelength coverage (soa large number of different elements could be examined at onetime). To meet both needs would require an unrealisticallylarge spectrograph. A solution to this problem was found inthe concept of crossed dispersion, introduced by GeorgeHarrison at MIT. In this mode of operation, high resolutionbut at extremely high orders of diffraction was achieved bymeans of an Echelle grating—one ruled very coarsely. Un-fortunately, the high orders at which the Echelle grating wasused caused severe overlap of the grating orders. To overcomethis problem, Harrison employed a second grating or prismthat offered a lower level of dispersion but in the perpen-dicular direction. The combination allowed separation of theorders in the one direction and high resolution in the other.
In early work, this two-dimensional spectral display wasmeasured photographically. Later, arrays of discrete detectors(ordinarily photomultiplier tubes) were introduced so a groupof individual spectral lines could be measured simultaneously.Other approaches included a roving slit, to enable lines to beexamined sequentially, and even a roving detector assembly.Only within the last decade has the true power of such cross-dispersion systems been realized, by coupling them withmodern charge-transfer detectors, either the charge-coupleddevice (CCD) or charge-injection device (CID) assembly.
Detectors for Emission SpectroscopyFrom this brief account, it is clear that the utility of any
spectral-dispersion system depended greatly on the kind ofdetector that was available. The first detector to be used was,of course, the human eye. Its limited dynamic range and sen-sitivity soon gave way to use of photographic techniques. Thephotographic emulsion offered a number of highly attractivefeatures: extremely high spatial resolution (limited only bythe grain size in the emulsion), direct integration of lightintensity, low cost, availability in extremely large formats(useful for measuring entire spectra at one time), and integralstorage of a recorded spectrum. However, the emulsion alsosuffered from a number of important shortcomings, includinga limited dynamic range, only moderate sensitivity, extremelynonlinear response, and unreliable long-term archiving ofspectra. Also, because emulsions varied considerably insensitivity from batch to batch, each had to be calibratedindividually, a time-consuming and tedious business.
For these reasons, instrumentation after the 1940s empha-sized the use of photoelectric detectors, sometimes vacuumphototubes but more commonly the photomultiplier tube(PMT). Just as the photographic emulsion evolved in sensi-tivity, utility, and flexibility over time, PMTs soon becameavailable in a variety of sizes, shapes, and levels of performanceas more about them was learned. Because of the convenienceand simplicity of electrical or electronic readout, it was deemedpreferable by many to employ a large number of laboriouslyaligned PMTs than to use a single photographic film or plate.This direct-reading photoelectric spectrometer became theworkhorse of spark-emission spectrometry in the 1950s andremains dominant even to this day.
For more than a generation, spectroscopists have soughtan electronic equivalent of the photographic emulsion. Thefirst glimmer of hope in achieving this goal was the intro-duction in the early 1970s of low-cost linear photodiodearrays (PDA) (26 ). Although television cameras had alreadybeen available for more than two decades, such devices didnot offer the stability, reliability, low cost, convenience, ordynamic range required for spectrochemical applications.In contrast, linear PDAs were modest in cost, boasted anintegrated photometric amplifier, and could be coupled in arelatively straightforward way to conventional polychro-mators. Like the other kinds of detectors or instrumentationemployed in AES, linear PDAs evolved from devices origi-nally meant for consumer applications to more sensitive chipstailor-made for spectroscopy. Entire generations of atomic-emission spectrometers were specifically designed to takeadvantage of the capability of the linear PDA (27–29). Again,measurement systems evolved through improved understand-ing and the availability of better instrumentation. Only whena decidedly superior alternative became available did the PDAlose ground.
This superior alternative came in the form of charge-transfer array detectors (30). The two types of such detectors—CCDs and CIDs—offer tremendous capability for AES. Eachhas its own strengths and weaknesses, but each possesses abroad dynamic range and, when used in the proper configu-ration, can be used to measure either an entire atomic emissionspectrum or critical regions of that spectrum. Over the pastdecade, a host of new spectrometer configurations based onthese devices have appeared commercially.
Figure 4. Milestones in spectral selection and detection.
Milestones in Spectral Selection & Detection
■ 1860:■ 1893:
■ 1937:■ 1930s:
■ 1944:■ 1944:
■ 1951:■ 1967:
■ 1970:■ 1970:■ 1970s:
■ 1973:■ 1990:
Bunsen & Kirchhoff; prism spectroscopeH. A. Rowland; theory of diffraction gratings
Schuhknecht; filter photometerM. Hasler; commercial grating spectrograph
R. W. Wood; blazed gratingsDirect-reading multichannel spectrometers
G. R. Harrison; interferometric control of rulingsJobin-Yvon; Holographic gratings
Snelleman, et al.; wavelength modulation methodsMargoshes; echelle spectrometers with array detectorsCommercial slew-scan systems introduced
Horlick, Boumans; linear detector array spectrometersPilon, Denton; commercial echelle–CTD spectrometer

Waters Symposium: Atomic Emission Spectroscopy
JChemEd.chem.wisc.edu • Vol. 77 No. 5 May 2000 • Journal of Chemical Education 583
Recently, however, the success achieved with two-dimen-sional CCD and CID chips has spawned another cycle inthinking. Recognizing the stability and utility of earlier systemsbased on linear PDA systems, instrument manufacturers havebegun considering the use of linear CCD or CID chips insteadof the more costly two-dimensional arrays. Not long ago, twomanufacturers announced spectrometric systems similar inconcept to earlier designs that employed groups of single-channel detectors made from individual exit slits and photo-multiplier tubes. However, for each of these single-channelassemblies the new designs have substituted a linear CCDarray, available now at extremely low cost because of theiruse in consumer products. With a large group of such arraysit therefore becomes possible to cover the entire spectral rangeof interest in atomic spectrometry. Also, because each arraypossesses a large number of detector elements (pixels), it canbe positioned with much less care than would be necessarywith a narrow exit slit; calibration can occur after assemblyunder software control simply by noting the pixels on whichparticular spectral lines fall.
As in the case of sources and dispersion devices, it seemsthe cycle of detector development follows the typical pattern:conception, implementation, cyclic development, and com-petition.
Conclusion
From the foregoing account, it is apparent that atomicemission spectrometry has had a long and illustrious periodof contribution to science and technology. Its components—sources, dispersion systems, and detectors—have undergonecontinuous revision, development, and characterization whileat the same time new and competitive devices were being in-troduced. Each one of the components was then evaluatedin the face of this competition; some continued to improveand succeed, whereas others became less important. With thisrepeating cycle of renewal, introduction, innovation, andcompetition, it is perhaps not surprising that AES began as apowerful means of elemental analysis and continues to this dayto be the most widely used. Atomic emission spectrometry—it lasts and lasts and lasts.
Acknowledgments
Supported in part by the U.S. Department of Energythrough grant DE-FG02-98ER14890 and by ICI Technology.
Literature Cited
1. Fassel, V. A. Fresenius’ Z. Anal. Chem. 1986, 324, 511.2. Ahrens, L. H.; Taylor, S. R. Spectrochemical Analysis; Addison-
Wesley: Reading, MA, 1961.
3. Alkemade, C. T. J.; Herrmann, R. Fundamentals of AnalyticalFlame Spectroscopy; Wiley: New York, 1979.
4. Grove, E. L. Analytical Emission Spectroscopy, Part I; Dekker:New York, 1971.
5. Laitinen, H. A.; Ewing, G. W. A History of Analytical Chemis-try; Maple: York, PA, 1977.
6. Moore, F. J. A History of Chemistry; McGraw-Hill: New York,1939.
7. Schrenk, W. G. Analytical Atomic Spectroscopy; Plenum: NewYork, 1975.
8. Slavin, M. Emission Spectrochemical Analysis; Wiley-Interscience: New York, 1971.
9. Alkemade, C. T. J. A Contribution to the Development and Un-derstanding of Flame Photometry; Ph.D. Dissertation, Univer-sity of Utrecht, Utrecht, The Netherlands, 1954.
10. Hieftje, G. M.; Malmstadt, H. V. Anal. Chem. 1968, 40,1860–1867.
11. Bastiaans, G. J.; Hieftje, G. M. Anal. Chem. 1974, 46, 901–910.
12. Bleasdell, B. D.; Wittig, E. P.; Hieftje, G. M. Spectrochim. Acta1981, 36B, 205–213.
13. Boss, C. B.; Hieftje, G. M. Anal. Chem. 1979, 51, 1897–1905.14. Boss, C. B.; Hieftje, G. M. Anal. Chem. 1979, 51, 895–901.15. Childers, A. G.; Hieftje, G. M. Appl. Spectrosc. 1986, 40,
939–944.16. Childers, A. G.; Hieftje, G. M. Anal. Chem. 1993, 65,
2753–2760.17. Childers, A. G.; Hieftje, G. M. Anal. Chem. 1993, 65,
2761–2765.18. Clampitt, N. C.; Hieftje, G. M. Anal. Chem. 1972, 44,
1211–1219.19. Pak, Y.; Hieftje, G. M. Spectrochim. Acta 1985, 40B, 209–216.20. Harrison, G. R. MIT Wavelength Tables; M.I.T. Press: Cam-
bridge MA, 1969.21. Kaiser, H.; Wallraff, A. Ann. Phys. 1939, 34, 297.22. Coleman, D. M.; Walters, J. P. Spectrochim. Acta, Part B 1976,
31, 547–587.23. Beenakker, C. I. M. Spectrochim. Acta, Part B 1976, 31, 485.24. Moisan, M.; Beaudry, C.; Leprince, P. IEEE Trans. Plasma Sci.
1975, PS-3, 55.25. Jin, Q.; Zhu, C.; Borer, M. W.; Hieftje, G. M. Spectrochim.
Acta 1991, 46B, 417–430.26. Multichannel Image Detectors; Talmi, Y., Ed.; American Chemi-
cal Society: Washington DC, 1979.27. Multichannel Image Detectors, Vol. 2; Talmi, Y., Ed.; Ameri-
can Chemical Society: Washington DC, 1983.28. Brushwyler, K. R.; Furuta, N.; Hieftje, G. M. Talanta 1990,
37, 23–32.29. Brushwyler, K. R.; Furuta, N.; Hieftje, G. M. Spectrochim. Acta
1991, 46B, 85–98.30. Charge-Transfer Devices in Spectroscopy; Sweedler, J. V.; Ratzlaff,
K. L.; Denton, M. B., Eds.; VCH: New York, 1994.