Embed Size (px)
Citation preview
474 VOLUME 17J O U R N A L O F A T M O S P H E R I C A N D O C E A N I C T E C H N O L O G Y
q 2000 American Meteorological Society
Quality Assurance Procedures in the Oklahoma Mesonetwork
MARK A. SHAFER, CHRISTOPHER A. FIEBRICH, AND DEREK S. ARNDT
Oklahoma Climatological Survey, Norman, Oklahoma
SHERMAN E. FREDRICKSON*
National Severe Storms Laboratory, Norman, Oklahoma
TIMOTHY W. HUGHES
Environmental Verification and Analysis Center, Norman, Oklahoma
(Manuscript received 6 April 1999, in final form 14 June 1999)
ABSTRACT
High quality data sources are critical to scientists, engineers, and decision makers alike. The models thatscientists develop and test with quality-assured data eventually become used by a wider community, from policymakers’ long-term strategies based upon weather and climate predictions to emergency managers’ decisions todeploy response crews. The process of developing high quality data in one network, the Oklahoma Mesonetwork(Mesonet) is detailed in this manuscript.
The Oklahoma Mesonet quality-assurance procedures consist of four principal components: an instrumentlaboratory, field visits, automated computer routines, and manual inspection. The instrument laboratory ensuresthat all sensors that are deployed in the network measure up to high standards established by the MesonetSteering Committee. Routine and emergency field visits provide a manual inspection of the performance of thesensors and replacement as necessary. Automated computer routines monitor data each day, set data flags asappropriate, and alert personnel of potential errors in the data. Manual inspection provides human judgment tothe process, catching subtle errors that automated techniques may miss.
The quality-assurance (QA) process is tied together through efficient communication links. A QA managerserves as the conduit through whom all questions concerning data quality flow. The QA manager receives dailyreports from the automated system, issues trouble tickets to guide the technicians in the field, and issues summaryreports to the broader community of data users. Technicians and other Mesonet staff remain in contact throughcellular communications, pagers, and the World Wide Web. Together, these means of communication provide aseamless system: from identifying suspicious data, to field investigations, to feedback on action taken by thetechnician.
1. Introduction
The Oklahoma Mesonetwork (Mesonet), developedthrough a partnership between the University ofOklahoma and Oklahoma State University, is a per-manent mesoscale weather observation network. Carewas taken along every step of the process to ensure thatthe Oklahoma Mesonet would provide research-qualitydata. The procedures documented in this manuscript aredesigned to ensure this quality, from the earliest plan-
* Additional affiliation: Oklahoma Climatological Survey, MesonetProject, Norman, Oklahoma.
Corresponding author address: Mark A. Shafer, Oklahoma Cli-matological Survey, 100 E. Boyd St., Suite 1210, Norman, OK 73019.E-mail: [email protected]
ning stages of the network through operational datamonitoring and long-term analyses. This manuscript de-tails quality assurance (QA) procedures developedthrough the course of building the Mesonet and em-ployed operationally in May 1999.
The Oklahoma Mesonet operates 115 stations on acontinuous basis (Fig. 1). Thirteen atmospheric and sub-surface variables (hereafter, parameters) are recordedevery 5 min at each site, producing 288 observationsof each parameter per station per day (Elliott et al. 1994;Brock et al. 1995). Several other parameters are ob-served every 15 or 30 min. From its commissioning inMarch 1994 through May 1999, the Oklahoma Mesonethas successfully collected and archived 99.9% of over75 million possible observations. Because of this con-tinuous observation cycle, a need existed to ensure thequality of data coming from over 2500 instruments. Acomprehensive QA system was developed to comple-

APRIL 2000 475S H A F E R E T A L .
FIG. 1. Map of Mesonet site locations. Land ownership for each of the sites is according to the symbols defined in the legend. There are42 sites located in the ARS Micronet in southwest Oklahoma.
ment the network’s efficient collection and transmissionof environmental observations. The system utilizesfeedback from an instrumentation laboratory, field com-parisons, automated tests, and visual analyses to rec-ognize and catalog suspect and/or erroneous observa-tions. Efficient communication between all componentsin the QA system is essential to quickly replace ques-tionable instruments.
2. Network design considerations
The Mesonet Steering Committee established 11 sub-committees, each drawing upon the experience of ex-perts within their respective fields. Seven of these sub-committees (see appendix) offered recommendationspertaining to the quality of data recorded within thenetwork. The subcommittees represented three focus ar-eas. The Site Standards and Site Selection committeesdeveloped a consistent set of criteria for site selectionand provided guidance in locating sites. The ParameterSelection and Sensor Specification committees evalu-ated many diverse requests for instrumentation to beinstalled on the Mesonet towers and developed rec-ommendations for instrument purchases. The StationMaintenance, Quality Assurance, and Data Managementcommittees developed guidelines to maintain the qualityof and access to data once the network was established.
The Site Standards Committee recommended thatsites should be located in rural areas, representative ofas large an area as possible, and flat, with all obstaclesbeing at a distance of more than 300 m away from thewind sensors (Shafer et al. 1993). These guidelines were
followed closely; however, in a few cases, some guide-lines could not be met. These cases resulted from 1) thenature of the terrain; 2) a lack of suitable sites offered;3) the a priori decision to locate on particular parcelsof land, such as existing agricultural research stations.Site photographs and documentation are available on-line at http://okmesonet.ocs.ou.edu/ so data users can‘‘visit’’ a site.
The Site Standards Committee also provided guid-ance for site layout and parameter selection. Wind speedand direction are measured at a height of 10 m to matchWorld Meteorological Organization (WMO) standards,and temperature and relative humidity are measured at1.5 m for consistency with existing National Oceanicand Atmospheric Administration cooperative observa-tions and airport stations. The characteristics of Mesonetsites are also generally consistent with standards rec-ommended by the American Association of State Cli-matologists (AASC) for automated weather station net-works. The layout for all Mesonet sites is depicted inFig. 2. The tower stands nearly in the center of a 10 m3 10 m enclosure. It is surrounded by a cattle-panelfence, 1.3 m high, to secure the area from animals andnearby human activity.
One difference between Mesonet and AASC rec-ommendations is in the height of the wind monitor. Mey-er and Hubbard (1992) note that the AASC’s recom-mended height of 3 m for wind measurements is a com-promise between the expense of installing 10-m towersand problems with exposure affecting wind measure-ments at lower heights. Because the Site StandardsCommittee recommended installation of 10-m towers

476 VOLUME 17J O U R N A L O F A T M O S P H E R I C A N D O C E A N I C T E C H N O L O G Y
FIG. 2. Schematic of Mesonet instruments site layout. The perspec-tive is a side view of the station looking northward.
for wind measurements, the AASC’s concerns for ex-posure are mitigated. A second difference concerns theheight at which the rain gauge is mounted. The AASCrecommends a height of 1.0 m to reduce splash effects,while the WMO recommends a height of 0.3 m to reducewind effects. The AASC’s concerns of splash effectswere resolved by modifications to the rain gauge madeby Mesonet staff (discussed in section 4b). Installationof wind screens around the rain gauges to reduce tur-bulence in the vicinity of the gauge orifice addressesthe WMO concerns.
In addition to general guidelines for the network, theSite Selection Committee recommended that severalsites be provided to allow comparison with other in-struments and other networks. Two of the original 108sites, representing different climate regimes, were in-stalled within 100 m of Automated Surface ObservingSystem sites (located at Hobart and McAlester). Thesecollocated sites provide an opportunity to compare ob-servations from two networks in different climatic zones(Crawford et al. 1995). Eleven additional sites were lo-cated within 2 km of a National Weather Service Co-operative Observer Site.
An intercomparison site in Norman, located 100 mfrom an operational Mesonet site, allows in-field com-parison of data from different instruments. Higher qual-ity instruments, whose cost prohibits their deploymentthroughout the network, may be temporarily deployedat the intercomparison site as part of various research
projects. The intercomparison site also allows evalua-tion of proposed instrument changes, the addition of newinstruments, and changes in network configuration,without affecting data collected from operational sites.
The Sensor Specification Committee developed per-formance specifications for each instrument individu-ally, designing the specifications to meet criteria for bothresearch and operational purposes. The make and modelof each instrument were selected separately for eachparameter, allowing uniformity among those sensors de-ployed in the field. By equipping operational sites withsimilar sensors, the potential of measurement bias, whencomparing measurements between sites, is reduced. Thisstrategy also allows technicians to draw from a commonstock of spare sensors when sensor replacement is re-quired. By using similar instruments at all field sites, auser does not need to be concerned by different instru-ment error characteristics when comparing data betweensites.
The remaining committees provided guidance relatingto collection and archival of data. In particular, the Qual-ity Assurance Committee recommended the followingsteps to develop a quality data stream:
R laboratory calibrations to test sensors at delivery andat routine intervals thereafter;
R field intercomparisons, both during technician visitsand through site intercomparisons;
R real-time, automated data-monitoring software;R documentation of sites and processes;R independent review; andR publication of data quality assessment
While not all recommendations have been fully imple-mented, the following sections document steps takentoward meeting these recommendations.
3. Overview of Mesonet QA processes
The need for thorough and efficient data archival andretrieval, combined with the need to optimize daily per-formance of the network, dictated a dual purpose forthe Oklahoma Mesonet’s QA system:
1) augment data archives with a trustworthy assessmentof the confidence in each datum, and
2) assess the ongoing performance of the network tokeep current and future data quality at the highestlevel that is operationally possible.
Fortunately, the techniques that apply to these goalsoverlap, and the same QA tools can be used to assessboth past and present data quality. The real-time natureof the Oklahoma Mesonet requires more than post factoanalysis of data collected during field projects (e.g., seeWade 1987). The techniques must apply to ongoing datacollection to identify problems before they become se-rious.
The Oklahoma Mesonet’s QA system compiles in-formation from four distinct analysis classes: laboratory

APRIL 2000 477S H A F E R E T A L .
TABLE 1. Timescales of quality-assurance procedures used by theOklahoma Mesonet.
Timeinterval Analysis technique
SecondsMinutes
Data checked at the dataloggerCollection of missing observationsFirst-pass automated QA; primarily range test
HoursDays
General visual inspection via Web and kiosksAutomated QA with daily reportsTrouble tickets issued and technicians respond
WeeksMonths
QA manager’s visual inspection (aggregate data)QA manager’s reportRoutine site visits
Year Sensor calibrationSensor rotationInstrument design modifications
TABLE 2. Mesonet QA flags with brief descriptions. These flags are available with all archived Mesonet datasets.
QA flag value QA status Brief description
01234
GoodSuspectWarningFailureNot installed yet
Datum has passed all QA tests.There is concern about accuracy of datum.Datum is very questionable but information can be extracted.Datum is unusable.Station awaiting installation of sensor.
5689
Likely goodKnown goodNever installedMissing data
Reduce automated QA flag by one level.Set automated QA flag to 0.This station is not intended to measure this parameter.Datum is missing for this station and parameter.
calibration and testing, on-site intercomparison, auto-mated routines, and manual inspection. Each producesvaluable information about the network’s performance.The results from any one component are shared through-out the system to establish an accurate assessment ofdata quality.
Because of the volume of QA information and theneed for coordinated QA decision making, a QA man-ager is employed to act as a ‘‘traffic cop’’ for instrumentand data-quality issues. The QA manager maintainscommunication among all facets of the QA system, is-sues calls-to-action regarding problem sensors, tracksand archives specific instrument/data problems, andguides further development of the QA system.
These quality-assurance procedures integrate into aseamless system that incorporates both time and systemcomponents. Table 1 depicts the quality-assurance pro-cess on timescales that range from when the data arerecorded to a long-term investigation of data quality.Quality-assurance procedures begin at the site. Labo-ratory-verified calibrations and sensor rotations ensurethat quality instruments are deployed. Codes may alsobe transmitted from a site to indicate potential data-logger problems or the presence of a technician at a site.
Computers at the base station in Norman monitorsystem operations and verify that all possible data havebeen collected. If data are missing, the computers au-tomatically and repeatedly attempt to contact the stationuntil data are retrieved. As data are collected, they are
sent to an archiving computer that verifies that obser-vations are within acceptable bounds. The archivingcomputer rechecks that there are no gaps in the datarecords.
Throughout the day, data users, Mesonet staff, andthe QA manager monitor the data to make sure they arecollected and that system performance is acceptable.Obvious erroneous values reported by a sensor may benoted in ‘‘snapshot’’ images of data from the networkor in time series graphs of reported data from a singlestation.
Each night, automated QA procedures check the datafor more subtle errors and produce a report for the QAmanager, which is waiting in the manager’s e-mail ‘‘inbasket’’ the next morning. The QA manager scans thereport, makes determinations of potential problems, andissues trouble tickets as necessary. Trouble tickets maybe issued at any time, but the majority of trouble ticketsresult from the morning QA reports and from monthlyassessments of network performance.
Every month, visual inspection of the data archivesyields clues to more subtle effects, such as sensor biasand drift. At the end of the month, these analyses areassembled into the QA manager’s report, which oftenspur more requests for technicians to investigate sensorsat certain sites. Several times every year, techniciansvisit each Mesonet site, perform in situ analyses andintercomparisons, and repair or replace defective sen-sors.
Testing and deploying quality instruments are crucialparts of ensuring quality data. The efforts of techniciansand instrument specialists in the Mesonet’s calibrationlaboratory provide a long-term foundation for networkperformance. Ongoing calibration of all sensors andfield rotation represents one portion of instrument qual-ity. A second part is an examination of instrument per-formance and a comparison of data from similar in-struments. Recommendations for instrument designchanges, which may result from these efforts, feed backinto the system to enhance the long-term quality of datafrom the Oklahoma Mesonet.
Data are never altered. Instead, all archived Mesonetdata are coupled with QA ‘‘flags’’ [‘‘good,’’ ‘‘suspect,’’‘‘warning,’’ or ‘‘failure’’ (QA flags 0, 1, 2, and 3, re-spectively; see Table 2)] that indicate the level of con-
478 VOLUME 17J O U R N A L O F A T M O S P H E R I C A N D O C E A N I C T E C H N O L O G Y
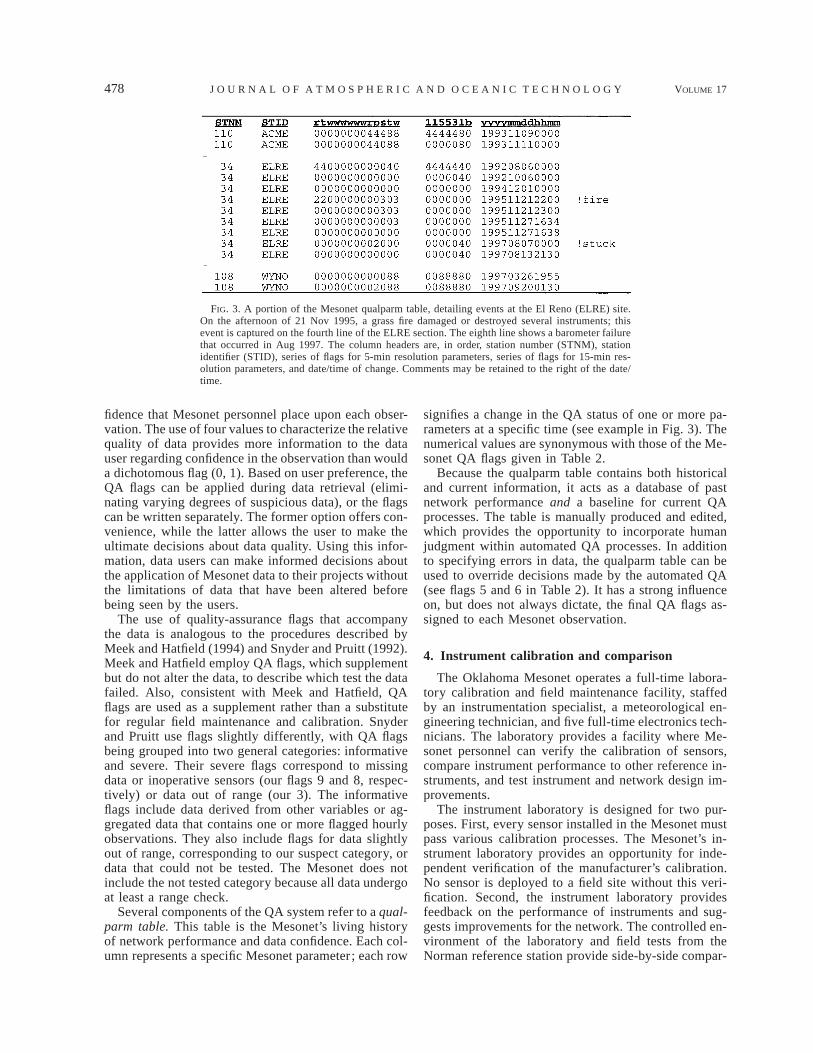
FIG. 3. A portion of the Mesonet qualparm table, detailing events at the El Reno (ELRE) site.On the afternoon of 21 Nov 1995, a grass fire damaged or destroyed several instruments; thisevent is captured on the fourth line of the ELRE section. The eighth line shows a barometer failurethat occurred in Aug 1997. The column headers are, in order, station number (STNM), stationidentifier (STID), series of flags for 5-min resolution parameters, series of flags for 15-min res-olution parameters, and date/time of change. Comments may be retained to the right of the date/time.
fidence that Mesonet personnel place upon each obser-vation. The use of four values to characterize the relativequality of data provides more information to the datauser regarding confidence in the observation than woulda dichotomous flag (0, 1). Based on user preference, theQA flags can be applied during data retrieval (elimi-nating varying degrees of suspicious data), or the flagscan be written separately. The former option offers con-venience, while the latter allows the user to make theultimate decisions about data quality. Using this infor-mation, data users can make informed decisions aboutthe application of Mesonet data to their projects withoutthe limitations of data that have been altered beforebeing seen by the users.
The use of quality-assurance flags that accompanythe data is analogous to the procedures described byMeek and Hatfield (1994) and Snyder and Pruitt (1992).Meek and Hatfield employ QA flags, which supplementbut do not alter the data, to describe which test the datafailed. Also, consistent with Meek and Hatfield, QAflags are used as a supplement rather than a substitutefor regular field maintenance and calibration. Snyderand Pruitt use flags slightly differently, with QA flagsbeing grouped into two general categories: informativeand severe. Their severe flags correspond to missingdata or inoperative sensors (our flags 9 and 8, respec-tively) or data out of range (our 3). The informativeflags include data derived from other variables or ag-gregated data that contains one or more flagged hourlyobservations. They also include flags for data slightlyout of range, corresponding to our suspect category, ordata that could not be tested. The Mesonet does notinclude the not tested category because all data undergoat least a range check.
Several components of the QA system refer to a qual-parm table. This table is the Mesonet’s living historyof network performance and data confidence. Each col-umn represents a specific Mesonet parameter; each row
signifies a change in the QA status of one or more pa-rameters at a specific time (see example in Fig. 3). Thenumerical values are synonymous with those of the Me-sonet QA flags given in Table 2.
Because the qualparm table contains both historicaland current information, it acts as a database of pastnetwork performance and a baseline for current QAprocesses. The table is manually produced and edited,which provides the opportunity to incorporate humanjudgment within automated QA processes. In additionto specifying errors in data, the qualparm table can beused to override decisions made by the automated QA(see flags 5 and 6 in Table 2). It has a strong influenceon, but does not always dictate, the final QA flags as-signed to each Mesonet observation.
4. Instrument calibration and comparison
The Oklahoma Mesonet operates a full-time labora-tory calibration and field maintenance facility, staffedby an instrumentation specialist, a meteorological en-gineering technician, and five full-time electronics tech-nicians. The laboratory provides a facility where Me-sonet personnel can verify the calibration of sensors,compare instrument performance to other reference in-struments, and test instrument and network design im-provements.
The instrument laboratory is designed for two pur-poses. First, every sensor installed in the Mesonet mustpass various calibration processes. The Mesonet’s in-strument laboratory provides an opportunity for inde-pendent verification of the manufacturer’s calibration.No sensor is deployed to a field site without this veri-fication. Second, the instrument laboratory providesfeedback on the performance of instruments and sug-gests improvements for the network. The controlled en-vironment of the laboratory and field tests from theNorman reference station provide side-by-side compar-

APRIL 2000 479S H A F E R E T A L .
isons of reference and operational instrumentation.Technicians also test the effects of solar radiation, wind,temperature, and other atmospheric conditions on in-struments, with the goal of improving instrument design.
a. Instrument calibration
Each Mesonet sensor undergoes a verification of itscalibration coefficients at several points along its op-erational life cycle. The cycle consists of 1) a prede-ployment laboratory check of the sensor calibration(‘‘pre-cal’’), 2) an on-site instrument intercomparisonwhen the sensor is installed, 3) periodic on-site inter-comparisons during normal operation, and 4) a postfieldlaboratory check of the sensor calibration (‘‘post-cal’’).Sensors may be removed from the field because eithera problem is detected or a sensor approaches a rec-ommended ‘‘site-residence time.’’
Tests in the laboratory utilize high quality referenceinstruments (Richardson 1995). These are used to verifythat all sensors are within established specific inaccu-racy limits for each instrument deployed in the Mesonet(Brock et al. 1995). The pre-cal verifies that each newsensor performs within these limits before it is deployedto a field site. Calibration coefficients, which are de-termined in the laboratory for rain gauges, pyranome-ters, and soil moisture sensors, are applied to these dataas they are retrieved from the Mesonet archives. Be-cause the coefficients are not programmed into the dataloggers, the data logger code does not need to be revisedwith new coefficients when a sensor is replaced. In ad-dition, this technique permits the adjustment of post-processed data on a case-by-case basis, such as may berequired to correct errors in calibration coefficients oradjust for sensor drift, without altering data stored inthe archives.
Sensors remain in the field until problems are en-countered, design upgrades are needed, or the sensorapproaches its recommended site-residence time. De-sign modifications are needed, for example, if a designflaw is discovered, or if a manufacturer recommends anupgrade to its instruments. The sensor’s residence timeis the period beyond which a sensor typically begins toshow symptoms of excessive drift. The limit is estab-lished based upon network experience with that type ofinstrument and manufacturer recommendations. Uponreaching the limit, the sensor is ‘‘rotated’’ back to thecalibration laboratory for recertification and recalibra-tion as opportunity and spare units become available.
Before any adjustments are made to a sensor on itsreturn to the laboratory, the post-cal check attempts todetermine how well that sensor was performing at thetime of its removal from a site. The sensor is thencleaned and any repairs and modifications are made. Atthis point, a series of pre-cal tests and adjustments areemployed until the sensor’s performance falls withinestablished inaccuracy limits. Results of pre-cal checks,instrument upgrades, and post-cal checks are recorded
in a database for use by technicians and by the QAmanager if questions arise about a specific sensor’s per-formance. Ultimately, the sensor is reinstalled at a Me-sonet site at the next opportunity and the residence timestarts again.
b. Instrument design tests
The knowledge gained from the calibration laboratoryand from tests using the reference station is used toshape instrument research and design upgrades to im-prove performance. Aside from direct instrument eval-uations, field studies, such as examining heat flux, havealso contributed new insights into the performance ofthe Mesonet. The following descriptions show how lab-oratory research on instrument and system designs havecontributed to an improvement in instrument perfor-mance, and thus, to the quality of data recorded fromthe Mesonet.
1) RAIN GAUGE RETROFIT
An early ‘‘problem instrument’’ was the rain gauge(MetOne 099M tipping bucket with 0.25-mm resolu-tion). By early 1994, serious shortcomings in the raingauge’s performance became evident, necessitatingmodifications to the gauge design. Technicians diag-nosed significant splash effects and recommended sev-eral alterations, including replacing the perforated platescreen inside the catch funnel with a wire mesh screenand increasing the height of the catch funnel sides by7.6 cm. These alteration criteria were shared with themanufacturer and modifications were made to the gaugedesign.
Experience in the field showed additional problemswith the tipping bucket and its bearings. Heating andcooling appeared to crack the bearings, dislocatingbuckets on some gauges. In addition, separation of themercury in the tip switches caused problems of eitherapparent under tipping or double tipping. Techniciansrecommended redesigning the bearings, resolderingweak bucket seams, drilling ‘‘weep holes’’ on the un-derside of the bucket dividers, reshaping the bucket piv-ot, and changing from mercury switches to magneticreed switches. These modifications were performed byMesonet staff in the calibration laboratory. Many ofthese modifications were also adopted by the manufac-turer.
2) RADIATION SHIELD DESIGN STUDIES
Richardson et al. (1999) studied the limitations ofnaturally ventilated solar radiation temperature shields.They showed that the characteristics of the temperaturesensor were important in determining radiation heatingeffects (e.g., heating from solar radiation). Gill nonas-pirated, multiplate radiation temperature shields (Gill1979) are designed to protect air temperature sensors

480 VOLUME 17J O U R N A L O F A T M O S P H E R I C A N D O C E A N I C T E C H N O L O G Y
from solar radiation, but this may not be an optimaldesign for all temperature sensors. If the temperaturesensor is highly reflective and has a small diameter, thena radiation shield that maximizes flow past the sensoris preferable. Such findings result in improved mea-surements when new instruments are chosen for systemupgrades.
3) TEMPERATURE AND RELATIVE HUMIDITY
SENSING PROBLEM
The Mesonet routinely measures temperature at 1.5m using a Campbell/Vaisala HMP35C temperature andrelative humidity sensor and at 9 m using a Thermo-metrics Thermistor (TMM). For a study of heat flux,Brotzge and Crawford (2000) installed a TMM sensorat 1.5 m to minimize the influence of sensor character-istics on measurements between the two levels. Duringthis study, the data from the TMM at 1.5 m was alsocompared with data from the existing HMP35C (Fred-rickson et al. 1998). Temperature differences that rangedfrom 0.58 to nearly 2.08C were discovered at eight ofthe nine test sites.
These temperature differences were consistent withthose that would be expected from errors in sensor cal-ibration. However, precalibration records, on-site inter-comparisons, and other QA efforts indicated that allsensors were performing within expectations. Becausethe TMM sensors had recently been calibrated and in-stalled, the HMP35C sensors from several sites werereturned to the laboratory for additional calibrationchecks. These units again indicated no significant cal-ibration problems. Reference sensors and calibrationrecords were also reviewed to eliminate these as possiblesources of errors.
Because no errors could be found in the instrumen-tation or calibration records, technicians then conductedtests on the datalogger program code. They discoveredthat the errors in the HMP35C sensors resulted frommeasuring relative humidity before measuring temper-ature, for this particular combination of probe and loggercode. Residual voltage from the relative humidity sensorcircuit superimposed an extraneous signal upon the volt-age from the temperature sensor. When temperature wassampled before relative humidity, no such effects wereobserved. The problem was not discovered earlier in thecalibration process because the laboratory calibrationprogram sampled temperature first, whereas all field andcomparison test kits sampled humidity first. Thus, a mi-nor modification to the datalogger’s program codesolved a problem that appeared to be attributable tosensor calibration errors.
5. Site visits: Intercomparison and maintenance
Field tests are performed by Mesonet technicians,each of whom is responsible for specific Mesonet sites.Each site is visited at least three times annually for
general maintenance and on-site sensor intercompari-sons. Although this maintenance interval is less thanmost automated weather station networks (Meyer andHubbard 1992), daily monitoring of data from the net-work makes this routine maintenance interval adequateto maintain the quality of the sensors at the field sites.Because of this daily monitoring, problems are detectedquickly, and technicians may be dispatched for addi-tional site visits as necessary.
General maintenance consists of evaluating the over-all integrity of the site (e.g., structures, guy wires, ad-verse weathering) and trimming vegetation. Stanhill(1992) demonstrated the importance of frequently clean-ing the outer hemisphere of the pyranometer. Extendedperiods between cleaning can result in as much as an8.5% reduction in net solar radiation due to the depo-sition of dust and particles on the dome. Because ofconcerns about site security and integrity, only Mesonettechnicians are allowed within the site enclosure. Morefrequent maintenance of general site characteristics,such as trimming grass and cleaning the pyranometerdome raised concerns that inexperienced local personnelmay disrupt soil temperature plots, accidentally loosenor cut wires, or dent the pyranometer dome during clean-ing. In addition, with more than half the sites locatedon privately owned land, weekly visits to sites couldstrain relations with the site owners. Consequently, de-tection of underreporting pyranometers between tech-nician site visits is left up to the Mesonet QA manager.
On-site sensor intercomparisons use a set of referenceinstruments identical to those at the site. These are typ-ically performed for air temperature, relative humidity,barometric pressure, and solar radiation. The referenceinstruments are frequently recalibrated in the laboratory.The intercomparisons are performed using software thatrecords data from both the operational and referenceinstruments in 1-min intervals. The technician subjec-tively selects a quiescent 5-min interval for calculationof average sample error (Fig. 4). This minimizes thepotential for meteorological transients to cause the tech-nician to misdiagnose instrument performance, whichcould be more likely if only a single pair of observationswere used. By using on-site intercomparisons each timea technician visits a site, the need for duplicate humiditysensors as recommended by Allen (1996) is mitigated.
The technician physically checks other sensors forobvious problems, either visually or audibly (e.g., lis-tening for noisy bearings in the wind monitor). To testthe rain gauge, the technician drips a known quantityof water from a specially designed reservoir into thegauge at a known constant rate. The gauge’s responseis compared to its calibration data from the laboratoryrecords. The technician then partially disassembles thegauge, visually inspects, cleans, and reassembles it, andrepeats the calibration test.
These on-site intercomparisons are not used to correctdata. Instead, they provide performance checkpointsduring the sensor’s operational life cycle. As a result of

APRIL 2000 481S H A F E R E T A L .
FIG. 4. Display from on-site intercomparison software. Bottom panel: A time series of relativehumidity observations from the operational instrument (dotted line) and the reference instrument(solid line). Top panel: The absolute error between the two sets of observations. Acceptable errorbounds are indicated by the horizontal dotted lines. As a result of errors exceeding allowable bounds,the technician replaced the sensor.
these visits, technicians may detect sensor problems thatare difficult to ascertain by other components of the QAsystem. On the other hand, a site visit may reveal thata perceived QA problem is attributable to a real localeffect.
During the time that a technician is present at a site,a special data flag is activated in the site datalogger.The flag is reported with the regular observations andis archived for future reference. Should questions ariseconcerning any aspect of data quality, it is possible tocheck the archives of QA flags to see if the presence ofa technician could be a proximate cause of the suspi-cious data.
6. Automated quality assurance
During each overnight period, a series of automatedQA techniques are applied to the previous day’s data.Each observation is checked for validity by five separatetest routines: range, step, persistence, spatial, and like-instrument comparison. The first three of these tests aresimilar to those described by Meek and Hatfield’s (1994)bounded values, rate-of-change, and continual no-ob-served-change tests. Results from each test are thenpassed to a decision-making algorithm that incorporatesthe results from all tests into a single QA flag, similar
to the Complex Quality Control method described byGandin (1988). The resultant flag is then compared withthe corresponding flag from the qualparm table (see sec-tion 3). The larger of these two values is retained andwritten to the daily QA files.
a. Automated QA routines
The range test is based upon a combination of per-formance specifications for each sensor and the annualclimate extremes across Oklahoma. Each parameter haspredetermined limits (Table 3). Any observation thatoccurs outside of the maximum or minimum allowablevalue is flagged as a ‘‘failure.’’ The range test is di-chotomous and is the only test capable of indicating afailure by itself.
The step test compares the change between successiveobservations. If the difference exceeds an allowed value,distinct for each parameter, the observation is flaggedas a ‘‘warning.’’ If either one of the data points used inthe comparison are missing, the test indicates a nullresult for those pairs; other tests determine which datapoint is missing. The step test has proven useful fordetecting erroneous readings due to loose wires or da-talogger problems.
The persistence test checks an entire day’s data from

482 VOLUME 17J O U R N A L O F A T M O S P H E R I C A N D O C E A N I C T E C H N O L O G Y
TABLE 3. List of Mesonet parameters and threshold values for the various QA tests. A value of 2999 indicates a parameter is not checkedby that test. Thresholds for wind speed and soil temperatures for the like-instrument comparison test have not been determined; these testsare not operational.
Parameter UnitsRange
Min/Max StepPersistence
deltaSpatialstd dev
Like-Instrumentthreshold
Companionparameter
Relative humidity1.5-m air temperature10-m wind speed10-m wind vector10-m wind direction
%8Cm s21
m s21
deg
0/103230/50
0/600/600/360
20104040
360
0.10.10.00.00.0
20.03.05.05.0
45.0
299910
299929992999
TA9MWS2MWSPD
Direction std devSpeed std devMaximum wind speedRainfallPressure
degm s21
m s21
mmmb
0/1800/200/1000/508
800/1050
9010802510
0.10.10.1
29990.1
60.05.0
10.050.0
1.5
29992999299929992999
Solar radiation9-m air temperature2-m wind speed10-cm soil temp, sod10-cm soil temp, bare
W m22
8Cm s21
8C8C
21/1500230/50
0/60230/50230/50
8001040
33
0.10.10.10.00.0
400.03.05.05.05.0
29992999299929992999
TB10
5-cm soil temp, sod5-cm soil temp, bare30-cm soil temp, sodLeaf wetnessBattery voltage
8C8C8C%V
230/55230/55230/50
0/10010/16
552
503
0.00.00.0
29990.0
5.05.05.0
29991.0
29992999299929992999
TS10TB10
a single station, one parameter at a time. The mean andstandard deviation for that parameter are calculated. Ifthe standard deviation is below an acceptable minimum,the corresponding data values are flagged as either ‘‘sus-pect’’ or warning, depending upon the departure of thestandard deviation from the minimum threshold. Thepersistence test, because it uses aggregate statistics, can-not discern which observations within the time periodare responsible for the offense. Consequently, all datavalues for that particular site and parameter receive thesame suspect or warning flag.
The persistence routine also uses a ‘‘delta test’’ tocheck the largest difference between any pair of obser-vations within a selected time range, usually 24 h. Ifthe difference is less than a minimum acceptable change,all data values for that parameter for the station underconsideration are flagged as suspect or warning, de-pending upon the departure of the delta from the thresh-old.
The more serious of the two flags from the persistencetests is retained and reported as the resultant flag by thepersistence routine. The persistence test is useful fordetermining damaged instruments or those ‘‘stuck’’ ata particular reading (e.g., due to icing conditions orfaulty communications between an instrument and thedatalogger).
The spatial test utilizes a one-pass Barnes objectiveanalysis routine (Barnes 1964) to estimate a value foreach observation. The test is designed to detect grosserrors in individual observations; more subtle errors areidentified through manual inspection. Thus a one-passBarnes analysis provides reasonable estimates withoutplacing too many demands upon computing resources.
Observations are weighted according to their distancefrom the station being evaluated:
w(r )zO i iZ 5 ,e
w(r )O i
where Ze is the estimated value of a parameter at aparticular station, zi is each observation, and w is theweight applied to the observed value, based on the dis-tance between the observation and the point being es-timated (ri). The weight decreases exponentially withdistance from the station:
w(ri) 5 .22r /ki oe
The weight function ko is determined by the Barnesroutine, based upon the mean station spacing within thenetwork. The radius of influence is approximately 100km for the Oklahoma Mesonet.
All stations within the radius of influence, except thestation being evaluated and those stations identified asfailures from the range test or as warnings or failuresin the qualparm table, are used to calculate an estimatedvalue. The mean, median, and standard deviation of theobservations within the radius of influence are also cal-culated. In the central part of the Mesonet, 20–25 sta-tions are typically used to determine the estimates. Thedifference between the observed and estimated value iscompared to the standard deviation:
z 2 ze oD 5 .s
Any observation whose difference exceeds twice thestandard deviation (D . 2) is flagged as suspect; any

APRIL 2000 483S H A F E R E T A L .
difference that exceeds three times the standard devia-tion is flagged as warning. If fewer than six observationswere used to determine the estimated value, no flag isset. Thus, stations in the Oklahoma panhandle are notincluded in the spatial analysis.
Standard deviations are used rather than absolutethresholds to allow increased variability during situa-tions of large contrasts across the network (K. Brewster1995, personal communication). This technique toler-ates larger departures from estimated values for stationsalong a frontal boundary than for those stations in anearly uniform air mass. To avoid flagging stations whenthe calculated standard deviation is small, a predeter-mined threshold for the standard deviation is used (Table3). For example, if the standard deviation of air tem-perature for a subset of sites is 0.58C, stations departingby more than 1.08C from the estimated value would beflagged; however, a minimum standard deviation of3.08C ensures that only stations differing by more than6.08C are flagged. If a standard deviation of 5.08C isnoted across a frontal boundary, stations would have todepart from their estimated values by more than 10.08Cbefore being flagged. Although this procedure reducesthe number of false alarms, small errors are difficult todetect under such circumstances.
The like-instrument test compares pairs of similar pa-rameters, for example air temperature at 1.5 and 9.0 m.Any differences exceeding a specified threshold areflagged as suspect; differences more than twice thethreshold are flagged as warnings. If one parameter inthe like-instrument pair is bad, the like-instrument testcannot discern which observation is the culprit; bothobservations receive the flag. The final determinationas to which one is bad is made in the decision-makingalgorithm. The like-instrument test also is used to iden-tify good data, which are flagged by other routines, suchas instances of localized temperature inversions. Thresh-olds were determined via a climatological study of tem-perature inversions across Oklahoma (Fiebrich andCrawford 1998).
The determinations of each of these routines are sentto a decision-making algorithm. The algorithm first flagsall missing observations as ‘‘missing data’’ in the finalQA archive. The algorithm also notes those stations atwhich certain sensors are not installed and marks thoseobservations with a flag of ‘‘never installed’’ in the QAarchive.
Corrections are made to flags from the step test bycombining them with the results from the spatial test.The step test sets a flag if the data series marks an abruptchange. It cannot discern whether this change is towardor away from ‘‘background’’ values. By combining theresults with the spatial test, the step away from back-ground can be increased in severity, while the one re-turning toward background can be decreased. The stepand spatial tests combined yield a failure if an obser-vation is flagged by both tests, or a suspect flag if it is
flagged only by the step test. If the datum is flaggedonly by the spatial test, the spatial test flag is retained.
Flags from the like-instrument test are compared withthe corresponding spatial test to determine which ob-servation of the pair is questionable. If an observationis flagged by both the like-instrument and spatial tests,the final determination will be either a warning, if bothroutines indicate the observation is suspect, or a failureif one of the two routines indicates a more serious error.If an observation, flagged by the like-instrument test,exhibits spatial consistency with neighboring sites, it isconsidered good.
The like-instrument test is also used to compensatefor shortcomings in the spatial test. Observations thatpass the like-instrument test exhibit a consistency be-tween the two parameters checked. If one of these ob-servations is flagged by the spatial test, the cause maybe attributable to a real, but localized, effect, such as atemperature inversion. To compensate for such effects,the spatial flag is downgraded to the next lower levelin such instances.
After these adjustments have been made, the resultsfrom individual tests are added together and then com-pared to the qualparm table value. If the qualparm valueis five or six, the corresponding QA flag is either down-graded by one level or reset to zero (flags 5 and 6,respectively). For all other qualparm values, the greaterof the QA flag or qualparm is retained in the QA archive.
b. Using automated QA summary reports
Along with individual flags, the automated QA pro-duces a summary report each morning (Fig. 5) that de-tails data irregularities from the previous day. The reportis automatically e-mailed to the QA manager, who scansit for potential new instrument problems and checkssuspicious data to determine whether further action iswarranted. An entry is included in a list of ‘‘flag counts’’if more than 10% of a parameter’s observations from astation for that day are indicated as suspect, or if oneor more observations are listed as a warning or failure.The 10% suspect threshold prevents the QA managerfrom unnecessarily examining spurious data, allowingconcentration on more serious problems.
The summary report also includes a listing of stationparameters, which have the highest average departurefrom their estimated values. The ratios of the differencebetween the observed and estimated values to the stan-dard deviation (D, from the spatial test) are averagedover the entire 24-h period. To make these results easierto interpret, the resulting number is scaled to 100, form-ing an Aggregate Score Index (ASI). An ASI score of100 means that the average reading departs from itsestimated value by twice the standard deviation of thesample. This value can be used to detect a parameterthat does not immediately violate Mesonet’s automatedQA standards but may be developing a bias that meritsattention. ASI scores above 50 generally warrant close

484 VOLUME 17J O U R N A L O F A T M O S P H E R I C A N D O C E A N I C T E C H N O L O G Y
FIG. 5. An excerpt from the automated QA summary report for 21Sep 1997. The letters in parentheses represent the current sensor statusin the qualparm table (S, suspect; W, warning; F, failure), if not‘‘good’’ (—). Pressure observations from HUGO and WYNO and5-cm soil temperature at GOOD appear as new problems. Daily ag-gregates of departures from estimated values are listed in the ASI.
attention; those over 100 are usually associated withmore serious problems that will likely appear in the flagcounts in the top portion of the summary report. Thetop 10 ASIs are listed in the report in descending order.
The high degree of variability in rainfall patterns pos-es a special problem for automated quality-assurancetechniques. Because localized events may be detectedby a single gauge, or areas of enhanced precipitationmay fall between gauges, the Mesonet’s automated qual-ity assurance is not permitted to apply flags to rainfall.Instead, the 24-h accumulated precipitation value iscompared to an estimated value for the site, using thesame techniques as previously described. If a site reportsless than 25% of the estimated value, provided that theestimate is at least 12.7 mm (0.5 in.), a report is includedin the daily e-mail to the QA manager. Also, if theestimated value for the site is near zero, but the gaugeindicates the occurrence of at least two bucket tips, areport is included to the QA manager. In the first in-stance, a low rainfall report may indicate a clogged raingauge. In the second instance, water may accumulateand drip slowly through the obstruction over subsequentdays, indicating a problem that is otherwise difficult todetect. When rainfall totals appear in the QA report, theQA manager compares them to WSR-88D reflectivityand precipitation estimates to make a subjective decisionas to whether the rain gauge needs to be investigatedby a technician. Suspect rainfall amounts are listed fora one-month period, making it easier to identify patternsof under- or overreporting rain gauges.
The automated QA is reapplied each day to each of
the preceding seven days of data in order to incorporatedata that may have been collected after the regular re-porting time and to include the QA manager’s revisionsto the qualparm table. The automated QA procedure isalso repeated on a monthly, three-monthly, and annualbasis. This delay allows sufficient time to secure missingdata and for additional revisions of qualparm values.For example, a problem detected via a QA analysismethod will have the appropriate flag(s) updated in thequalparm table. By reapplying the automated QA aftera one-month lag, these updated qualparm values yieldmore accurate QA flags, which become the permanentQA files.
7. Manual inspection
Subtle problems, such as instrument drift, are some-times not recognizable through automated analysis.They may be obscured by a small bias in the obser-vations. A thorough visual analysis of Mesonet data viaa well-trained meteorologist normally helps identifythese subtle problems. In addition, some mesoscale(e.g., drylines entering the network) or localized phe-nomena (e.g, thunderstorms, heatbursts) may be erro-neously flagged by the automated analysis. Thus, man-ual inspection can also ensure that good data are notimproperly flagged.
a. Real-time data monitoring
A number of techniques are used to monitor the qual-ity of the data as they are collected. These include data-collection software, kiosk displays of color-filled con-tours of various parameters, meteograms, and Web pag-es.
Data-collection software keeps track of each obser-vation from a station. If a station fails to respond to arequest for data, the system queues a request for latercollection, a process that is known as ‘‘hole collection.’’Although this process does not ensure the quality of theactual observations, it does a remarkably effective jobat ensuring a complete dataset. The Mesonet maintainsan archival rate of 99.9%. Thus, a researcher can beconfident that requested data will have been collectedand archived.
The QA manager may also monitor incoming Me-sonet data during the day. A suite of real-time Webproducts is typically used to view current data. Theseinclude maps of raw Mesonet parameters, maps of de-rived parameters, 24-h meteogram time-series plots ofvarious Mesonet parameters, and maps of 3-h trends forseveral parameters. The QA manager may also use real-time kiosks and, of course, raw data files available upondata ingest. Using various Web pages, Mesonet opera-tors also monitor the data as they arrive and report sus-picious events to the QA manager.

APRIL 2000 485S H A F E R E T A L .
FIG. 6. Average dew point temperature at 1200 UTC for Aug 1997. The anomaly in southeastOklahoma is caused by microscale effects. The anomaly in west-central Oklahoma prompted theQA manager to issue a trouble ticket.
b. Long-term analysis
Aside from inspection of raw data and various time-series plots, manual inspection also involves contouredmaps that represent long-term (several weeks to severalmonths) averages of selected parameters. Contours aredetermined by simple objective analysis techniques(typically a Barnes analysis), then interpreted throughthe eyes of the QA manager.
Subtle problems with parameters such as air temper-ature, dewpoint temperature, and wind speed can bestbe identified by an analysis of the average conditionsat a specific time of day during the period of interest(Fig. 6). Other parameters, such as rainfall and solarradiation, lend themselves well to an analysis of cu-mulative totals during the period of interest. In eithercase, subtle problems typically appear as data irregu-larities that cannot be explained by the QA manager’smeteorological knowledge and experience with localanomalies.
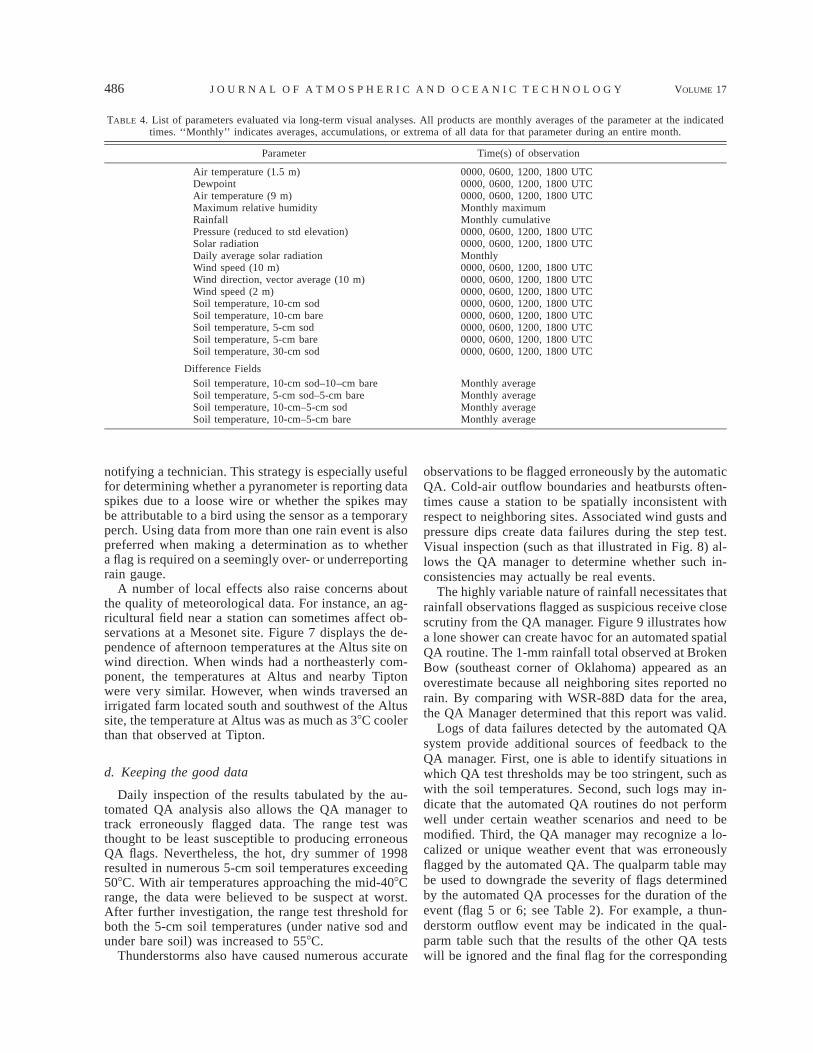
At a single Mesonet site where similar parameters aremeasured by several instruments (e.g., wind speed attwo levels, or soil temperatures at a number of depths),comparison between instruments can help identify prob-lem sensors. For instance, an objectively analyzed plotof the average difference between two sensors, in as-sociation with other maps, can be used to help pinpointa sensor problem. This method is particularly usefulwith soil temperature probes because a traditional spatialanalysis of soil temperature is limited by the localizednature of soil conditions. A full list of parameters thatare evaluated via these visual inspections is given inTable 4.
Allen (1996) recommends several long-term tests todetect problems with data. Some of these tests, such as
the maximum relative humidity and examination of spa-tial consistency of wind speeds, are used routinely inthe QA manager’s monthly analyses. Several other tech-niques, such as comparing actual to estimated solar ra-diation, are presently under development for inclusionin both automated QA routines and incorporation inmonthly analyses. Other longer-term analyses, such as‘‘double mass analysis’’ techniques, are only now be-coming possible as the Mesonet has a long enough his-torical record for these techniques to be successful.
c. Case-by-case investigation
Not all suspect observations lend themselves to aquick conclusion as to whether or not the data shouldbe flagged. Site-specific characteristics are often dis-covered where the automated QA and manual inspec-tion indicate potential concern with the data. The QAmanager thoroughly investigates these potential prob-lems before sending a technician for a field compari-son.
The QA manager’s investigation includes creatingtime-series graphs depicting data from the site and pa-rameter in question, along with data from neighboringsites. In some cases, when a parameter is highly variableacross an area (e.g., soil temperature at 5 cm), the au-tomated spatial test may not properly discern whichamong several sites has the suspect data. In these sit-uations, flags may be erroneously placed on the wrongstation. These techniques enable the QA manager tocorrectly identify questionable sensors.
The QA manager keeps a daily log of less seriousproblems so those sites that produce short-lived suspi-cious data can be monitored for several days before
486 VOLUME 17J O U R N A L O F A T M O S P H E R I C A N D O C E A N I C T E C H N O L O G Y
TABLE 4. List of parameters evaluated via long-term visual analyses. All products are monthly averages of the parameter at the indicatedtimes. ‘‘Monthly’’ indicates averages, accumulations, or extrema of all data for that parameter during an entire month.
Parameter Time(s) of observation
Air temperature (1.5 m)DewpointAir temperature (9 m)Maximum relative humidityRainfall
0000, 0600, 1200, 1800 UTC0000, 0600, 1200, 1800 UTC0000, 0600, 1200, 1800 UTCMonthly maximumMonthly cumulative
Pressure (reduced to std elevation)Solar radiationDaily average solar radiationWind speed (10 m)Wind direction, vector average (10 m)
0000, 0600, 1200, 1800 UTC0000, 0600, 1200, 1800 UTCMonthly0000, 0600, 1200, 1800 UTC0000, 0600, 1200, 1800 UTC
Wind speed (2 m)Soil temperature, 10-cm sodSoil temperature, 10-cm bare
0000, 0600, 1200, 1800 UTC0000, 0600, 1200, 1800 UTC0000, 0600, 1200, 1800 UTC
Soil temperature, 5-cm sodSoil temperature, 5-cm bareSoil temperature, 30-cm sod
0000, 0600, 1200, 1800 UTC0000, 0600, 1200, 1800 UTC0000, 0600, 1200, 1800 UTC
Difference FieldsSoil temperature, 10-cm sod–10–cm bareSoil temperature, 5-cm sod–5-cm bareSoil temperature, 10-cm–5-cm sodSoil temperature, 10-cm–5-cm bare
Monthly averageMonthly averageMonthly averageMonthly average
notifying a technician. This strategy is especially usefulfor determining whether a pyranometer is reporting dataspikes due to a loose wire or whether the spikes maybe attributable to a bird using the sensor as a temporaryperch. Using data from more than one rain event is alsopreferred when making a determination as to whethera flag is required on a seemingly over- or underreportingrain gauge.
A number of local effects also raise concerns aboutthe quality of meteorological data. For instance, an ag-ricultural field near a station can sometimes affect ob-servations at a Mesonet site. Figure 7 displays the de-pendence of afternoon temperatures at the Altus site onwind direction. When winds had a northeasterly com-ponent, the temperatures at Altus and nearby Tiptonwere very similar. However, when winds traversed anirrigated farm located south and southwest of the Altussite, the temperature at Altus was as much as 38C coolerthan that observed at Tipton.
d. Keeping the good data
Daily inspection of the results tabulated by the au-tomated QA analysis also allows the QA manager totrack erroneously flagged data. The range test wasthought to be least susceptible to producing erroneousQA flags. Nevertheless, the hot, dry summer of 1998resulted in numerous 5-cm soil temperatures exceeding508C. With air temperatures approaching the mid-408Crange, the data were believed to be suspect at worst.After further investigation, the range test threshold forboth the 5-cm soil temperatures (under native sod andunder bare soil) was increased to 558C.
Thunderstorms also have caused numerous accurate
observations to be flagged erroneously by the automaticQA. Cold-air outflow boundaries and heatbursts often-times cause a station to be spatially inconsistent withrespect to neighboring sites. Associated wind gusts andpressure dips create data failures during the step test.Visual inspection (such as that illustrated in Fig. 8) al-lows the QA manager to determine whether such in-consistencies may actually be real events.
The highly variable nature of rainfall necessitates thatrainfall observations flagged as suspicious receive closescrutiny from the QA manager. Figure 9 illustrates howa lone shower can create havoc for an automated spatialQA routine. The 1-mm rainfall total observed at BrokenBow (southeast corner of Oklahoma) appeared as anoverestimate because all neighboring sites reported norain. By comparing with WSR-88D data for the area,the QA Manager determined that this report was valid.
Logs of data failures detected by the automated QAsystem provide additional sources of feedback to theQA manager. First, one is able to identify situations inwhich QA test thresholds may be too stringent, such aswith the soil temperatures. Second, such logs may in-dicate that the automated QA routines do not performwell under certain weather scenarios and need to bemodified. Third, the QA manager may recognize a lo-calized or unique weather event that was erroneouslyflagged by the automated QA. The qualparm table maybe used to downgrade the severity of flags determinedby the automated QA processes for the duration of theevent (flag 5 or 6; see Table 2). For example, a thun-derstorm outflow event may be indicated in the qual-parm table such that the results of the other QA testswill be ignored and the final flag for the corresponding

APRIL 2000 487S H A F E R E T A L .
FIG. 7. Dependency of air temperature on wind direction for the Altus and Tipton Mesonet sites during 6–9 Aug 1998.
data will be reset to zero. The ability to downgrade QAflags was not yet operational at the time of this writing.
8. Communication within the QA system
Evolution of the Mesonet QA system includes a re-finement of communication between all components ofthe QA system (Arndt et al. 1998). More efficient com-munication yields more accurate data flagging and aquicker response by Mesonet personnel to developingor existing data quality problems.
The QA manager is responsible for coordinating in-coming QA information from a variety of sources (e.g.,automated reports, visual inspection, technician input,data user reports), for determining the reality of an ap-parent problem, and for issuing a call-to-action in theform of a trouble ticket. Use of the Internet, cellulartelephones, and paging technology speeds the responsetime to developing problems.
To keep Mesonet personnel informed about recent andcurrent QA-related events, the QA manager prepares amonthly report, which summarizes instrument transac-tions and documents a subjective assessment of the net-work’s performance (Fig. 10). The report provides asynopsis of QA concerns and actions during the pre-vious month, and notes the overall status of data qualityfrom the Mesonet. Significant observations of meteo-
rological events are included in the discussion. The re-port is sent to interested parties via e-mail and a papercopy is retained for future reference.
a. The trouble ticket
The trouble ticket is the fundamental method used toreport and record sensor problems, and to ensure andlog their resolution. When a data problem is identifiedand determined to be legitimate, a trouble ticket is is-sued. The outgoing ticket contains information (station,parameter, description of problem, date/time of problemonset, urgency), which assists the Mesonet technicianwith assessment of the problem. The technician worksthe trouble ticket into the maintenance agenda based onthe problem’s urgency, solvability, and the availabilityof replacement sensors.
Using information from the trouble ticket and on-siteanalysis, the technician takes action to resolve the prob-lem. The sensor may be serviced or replaced, or thetechnician may discover that the data problem is notattributable to the sensor. The trouble ticket carries thetechnician’s in-field observations and decisions (methodof fix, fix date/time, instrument transaction) to the QAmanager. If necessary, the QA manager updates meta-data files (containing information regarding instrumenttransactions and location ledgers) and the qualparm ta-

488 VOLUME 17J O U R N A L O F A T M O S P H E R I C A N D O C E A N I C T E C H N O L O G Y
FIG. 8. Pressure spike and corresponding wind gust at the Seiling Mesonet site on 4 Jun 1998.
ble. The trouble ticket is archived (electronically and toa paper file) because it contains valuable historical in-formation (metadata) about a data problem from a spe-cific sensor.
b. Internet communication in the QA system
When the QA manager enters the problem descriptionfor a trouble ticket, there is an option to send an elec-tronic form of the trouble ticket via e-mail to the ap-propriate personnel. An electronic trouble ticket servestwo purposes: 1) it alerts technicians who are basedaway from the central facility and 2) maintenance ac-tions can begin before a paper ticket reaches the tech-nician.
Three World Wide Web (WWW) templates are avail-able to Mesonet personnel. The first allows a Mesonetemployee to report apparent problems to the QA man-ager and the technician with maintenance responsibili-ties at the affected station. Each category listed on atrouble ticket is duplicated on the WWW page (Fig.11a). When the completed template is submitted, ane-mail message is sent to the QA manager, giving noticeof the potential problem. The QA manager then decideswhether to issue a formal trouble ticket.
Another template is used by technicians to report in-formation stemming from the resolution of a trouble
ticket (Fig. 11b). Through this template, a technicianmay relay the results of a station visit to the QA man-ager, allowing the QA manager to adjust qualparm set-tings to appropriate values long before the paper troubleticket is processed.
A third template involves sensors that require instru-ment-specific calibration coefficients (rain gauges andpyranometers; not shown). When these instruments arerelocated, calibration tables must be updated quickly sothe proper coefficients can be immediately applied tothe outgoing data. The WWW interface produces a for-matted e-mail message, which details the instrumentchange.
An instrument ‘‘residence-time’’ database is anothertool available via the WWW to assist Mesonet personnel(Fig. 12). A plot shows the time, in months, that eachsensor of a given type has been on location. The QAManager often considers residence time when makingdecisions regarding questionable sensors and symptomsof instrument ‘‘drift.’’ In addition, Mesonet techniciansuse these maps to plan site visitation itineraries, whichimproves the rotation schedule of Mesonet sensors.
Similarly, a list of unresolved trouble tickets is keptonline for review by Mesonet personnel. This file helpstechnicians integrate lower-priority trouble tickets(which do not require an urgent trip) into their visitationschedules.

APRIL 2000 489S H A F E R E T A L .
c. The use of cellular and paging technology
Oftentimes, new concerns about data quality arisewhile Mesonet technicians are away from the centralfacility or are otherwise unable to access an Internetconnection. The use of cellular and alphanumeric pagingtechnology maintains a reliable line of communicationwith these technicians. Frequently, a Mesonet operatorwill submit one of the WWW templates for a technicianbased on details given in a cellular phone conversation.Alphanumeric pagers are also used to send urgent mes-sages to Mesonet personnel.
Each morning, an operator dispatches a brief reportto the technicians via an alphanumeric pager. This reportcontains information about the status of observed prob-lems with data from particular stations and includes doc-umentation of any major power failures or communi-cation breakdowns within the network during the pre-vious 24 h. Technicians and the QA manager also pe-riodically receive observations of severe wind speeds,which may cause damage at a Mesonet site, via theiralphanumeric pagers.
9. Five years of quality-assurance experiences
As with any operational network, some factors causefrequent problems within the system. Lightning, spiders,insects, grass fires, gophers, and vandalism are severalexamples of the nemeses with which Mesonet personnelmust contend. Experience over five years has shownthat remote weather stations provide ideal habitats fora number of insects and animals. Spiders like to nest inthe rain gauge funnels and insects find that pressuretubes provide nice housing. Burrowing animals chewthrough cables connected to the soil temperature probes,and, on occasion, have even been found to remove theprobes themselves. Sadly, humans also have plagued afew of our sites, with vandalism and theft of equipment.Some of the notable events causing problems with theMesonet include
R a horse using a temperature sensor radiation shield asa scratching post;
R tumbleweeds accumulating within the Mesonet enclo-sure, insulating soil temperatures;
R grass fires melting instruments and housings (but pro-viding interesting data during the event);
R airborne sand and dust during a drought clogging raingauges; and
R cattle getting inside the Mesonet enclosure, disturbingsoil probes and knocking over a solar radiation tripod.
Quality assurance also has identified subtle effectsthat result from changes in the environment, and not afault with the instruments. Soil temperature biases inmonthly analyses have led technicians to discover prob-lems with erosion and sterilant leaching from the baresoil plots. Technicians now routinely check the depthof the soil temperature sensors when they visit a site.
Another example of how the QA process feeds backinto network design occurred in March 1995 when sixMesonet stations in southwest Oklahoma simultaneous-ly reported barometric pressures that the QA managersuspected were too low. This anomaly was detected viavisual inspection of a plot containing a 7-day averageof sea level pressure at 1800 UTC. The simultaneousbut slight underreporting by Mesonet barometers inclose proximity to each other revealed an unexpecteddesign condition. Rain had frozen over the barometerport, sealing it from the outside atmosphere. As the aircooled inside the sealed box, the pressure decreased.Project staff decided that because this event representeda rare occurrence, a technical solution could introducemore serious problems; thus no alterations were madeto the station design. This decision was, in part, basedupon an earlier experience, in which a porous filter hadbeen added to the barometer ports to prevent debris andinsects from nesting in the tubes. The filters tended toabsorb water and temporarily clog the tubes. Shortlyafter their addition to the network, the filters had to beremoved.
Results from QA processes, combined with humanexperience and meteorological knowledge, can lead tothe discovery of previously unknown microscale phe-nomena. One example is the relatively frequent indi-cation of data problems, as detected by the automatedspatial analysis routine, at the Medicine Park station insouthwest Oklahoma during overnight periods. The sta-tion is located within an isolated mountain range, bor-dered by flat grasslands. Quite often, this station, be-cause of its elevation, extends through the base of astrong temperature inversion, which otherwise goes un-observed at nearby Mesonet sites. During these events,the higher temperatures and lower moisture values atthe Medicine Park site appear to be anomalous but infact they are real. A consistency between temperaturedata from 1.5 and 9.0 m, as indicated by the like-in-strument comparison test, is an effective method of iden-tifying such ‘‘inversion pokers.’’
Anomalies in wind direction at sites along the Ar-kansas River in eastern Oklahoma (Sallisaw and Web-bers Falls; Fig. 1) caught the attention of Mesonet staff.When winds were light across the region, these sitesdeveloped an east wind anomaly. Initially, Mesonet staffsuspected a problem with the alignment of the windsensors, but upon closer investigation, they discoveredthat the anomaly was real. A similar, but weaker, anom-aly was discovered along the Red River in southeastOklahoma.
The Ouachita Mountains in southeast Oklahoma havea pronounced effect on mesoscale weather patterns; theyare large enough to sustain a mountain/valley circula-tion, as detected by the Mesonet site at Wister. Boundarylayer flow during the afternoon is uniform with sur-rounding sites, but in the absence of large-scale forcing,the wind at night becomes light northerly. Obstacle flow

490 VOLUME 17J O U R N A L O F A T M O S P H E R I C A N D O C E A N I C T E C H N O L O G Y
FIG. 9. A comparison of Mesonet rainfall reports with WSR-88D data for 14 Jul 1998. (a) Rainfall totals(in mm) for southeast Oklahoma for a 24-h period ending at 0000 UTC 15 Jul 1998. (b) WSR-88D basereflectivity from KSRX (Fort Smith, AR) on 14 Jul 1998 at 0044 UTC. The QA manager used the WSR-88D image to confirm that the report of precipitation at Broken Bow was accurate.
also can be seen in the neighboring counties of Leflore,Pushmataha, and McCurtain.
During 1998, Mesonet personnel discovered thatheatbursts are a relatively common event. Heatburstsoften affect only one or two stations, and appear as
anomalously warm and dry conditions at night. Duringthe 5-year period of 1994–98, more than 50 of these‘‘rare’’ events were detected within Oklahoma (e.g., seeMacKeen et al. 1998). Heatbursts invariably appear asdata problems in the automated QA, but human judg-

APRIL 2000 491S H A F E R E T A L .
FIG. 10. An excerpt from the QA manager’s monthly report for Feb 1998. The QA manager includes a brief synopsis of the performanceof the network followed by the status of trouble tickets, sorted by parameter.
ment is able to override these indications and preservea record of these events for future study.
10. Conclusions
The Oklahoma Mesonet’s QA system represents acompilation of processes that range from simple testingto sophisticated analysis. Automated processes prompthuman attention, while human experience shapes thedesign and interpretation of the automated processes.The system utilizes multiple techniques of data and in-strument analysis. When applied individually, thesecomponents have unique strengths and weaknesses.When a concerted effort is made to compile their resultsand integrate that information via efficient communi-cation, a comprehensive QA system emerges that ac-curately assesses the quality of both past and presentdata from the Oklahoma Mesonet.
Constant improvement of the QA system is necessaryto better realize its goals of high quality data in bothreal time and in its archives. Because the Mesonet usesa complex QA scheme of instrument calibration, fieldcomparisons, automated routines, and manual inspec-tion, it is possible to use feedback from one component
of the system to improve another component. For ex-ample, knowledge gained from postcalibration of sen-sors helps to optimize the desired residence time ofcertain instruments so that data quality is maximizedand unnecessary sensor rotation is minimized. Postcal-ibration of sensors has proven to be beneficial whendetermining preinstallation calibration strategies. On-site instrument intercomparisons help validate or refutethe QA manager’s visual interpretations. This feedback,in turn, is important to the continual refinement of theautomated QA routines.
It is important that the QA system be scrutinized asrigorously as the data to ensure continual improvementsin the data quality of the archives and to achieve theoptimum quality of real-time data. Thoughtful adjust-ments and additions to the QA system are sought toimprove the accuracy and response time of the QA sys-tem. Ideally, improvements in the QA system shouldtake advantage of the latest available technology andtechniques in data analysis. However, it should be re-membered that the purpose of these QA flags is to pro-vide guidance to those who use data from the OklahomaMesonet. Because no data are altered, the user can makethe final judgment as to the quality of the data.

492 VOLUME 17J O U R N A L O F A T M O S P H E R I C A N D O C E A N I C T E C H N O L O G Y
FIG. 11. WWW pages used to streamline the communication of trouble tickets and instrument decisions: (a) trouble ticket submissionpage and (b) trouble ticket resolution submission page.
FIG. 12. Residence time (in months) of Mesonet barometers. The values in the Texas panhandlerepresent two three-station clusters that are too closely spaced to be displayed at their propergeographic location.

APRIL 2000 493S H A F E R E T A L .
The role of the experienced human is essential to theQA process. Many actions and decisions rely upon theknowledge and experience of the technicians, laboratorypersonnel, the QA manager, and external users. Humanexperience is critical when assessing the reality of aquestionable event. Human interaction with the MesonetQA system has resulted in the discovery of many subtle,but real, meteorological events, and has provided a ca-pability to distinguish these phenomena from data prob-lems.
Acknowledgments. The number of authors on this pa-per is an indication of the complexity of the QA process.Many people have contributed to producing quality datafrom the Oklahoma Mesonet. In particular, we wouldlike to acknowledge Dr. Fred Brock, architect of theMesonet QA procedures; Dale Morris, Putnam Reiter,Jared Bostic, and the Mesonet operators; our laboratoryand field technicians—Ken Meyers, Gary Reimer, BillWyatt, David Grimsley, James Kilby, and Leslie Cain—and last but not least, our former QA managers: DavidShellberg, Curtis Marshall, Jeff Basara, and JerryBrotzge. We also appreciate the guidance provided bythe Mesonet Steering Committee: Ken Crawford, RonElliott, Steve Stadler, Howard Johnson, Mike Eilts, AlSutherland, and former members Chuck Doswell, Ger-ritt Cuperus, and Jim Duthie. The Oklahoma Mesonetwas financed by funds from the Exxon Oil OverchargeSettlement Fund as administered by the Oklahoma De-partment of Commerce. We gratefully acknowledge theState of Oklahoma’s continuing financial contributionto annual operational costs of the Mesonet.
APPENDIX
Data Quality Subcommittees Established by theMesonet Steering Committee
a. Site Standards
Recommend technical standards by which potentialsites are evaluated.
Membership:
Claude Duchon (Chair), University of Oklahoma,Norman
Ron Hanson, USGS, Oklahoma CityJohn F. Stone, Oklahoma State University, StillwaterSteve Stadler, Oklahoma State University, Stillwater
b. Site Selection
Recommend appropriate specific sites and alternativesites, based on recommendations from the Site Stan-dards Committee.
Membership:
Carroll Scoggins (Chair), Army Corps of Engineers,Tulsa
Les Showell, National Severe Storms Laboratory,Norman
John Lambert, National Weather Service, NormanJohn Damicone, Oklahoma State University, Still-
waterRon Elliott, Oklahoma State University, Stillwater
c. Parameter Selection
Recommend a prioritized list of parameters to be mea-sured at each site consistent with overall project goalsand resources.
Membership:
Ron Elliott (Chair), Oklahoma State University, Still-water
Ron Alberty, WSR-88D Operational Support Facility,Norman
Dennis McCarthy, National Weather Service ForecastOffice, Norman
Kathy Peter, USGS, Oklahoma City
d. Sensor Specification
Using input from the Parameter Selection Subcom-mittee, recommend the standards for sensor accuracyand reliability.
Membership:
Marv Stone (Chair), Oklahoma State University,Stillwater
Sam Harp, Oklahoma State University, StillwaterKen Brown, National Weather Service Forecast Of-
fice, NormanFred Brock, University of Oklahoma, Norman
e. Station Maintenance
Recommend the standards and strategy for meetingstation maintenance requirements.
Membership:
Sam Harp (Chair), Oklahoma State University, Still-water
Jerry Hunt, National Weather Service Forecast Office,Norman
Sherman Fredrickson, National Severe Storms Lab-oratory, Norman
f. Quality Assurance
Recommend the activities necessary to maintain dataquality.
Membership:
Fred Brock (Chair), University of Oklahoma, NormanBill Bumgarner, WSR-88D Operational Support Fa-
cility, Norman

494 VOLUME 17J O U R N A L O F A T M O S P H E R I C A N D O C E A N I C T E C H N O L O G Y
Sherman Fredrickson, National Severe Storms Lab-oratory, Norman
Claude Duchon, University of Oklahoma, Norman
g. Data Management
Develop and recommend data manipulation strategiesto ensure quality data are available on demand in anefficient manner and format.
Membership:
Howard Johnson (Chair), Oklahoma ClimatologicalSurvey, Norman
W. S. Fargo, Oklahoma State University, StillwaterSteve Stadler, Oklahoma State University, StillwaterWes Roberts, University of Oklahoma, Norman
REFERENCES
Allen, R. G., 1996: Assessing integrity of weather data for referenceevapotranspiration estimation. J. Irrig. Drain. Eng., 122 (2), 97–106.
Arndt, D. S., M. A. Shafer, S. E. Fredrickson, and J. P. Bostic, 1998:Quality assurance at the Oklahoma Mesonet: A systems view-point. Preprints, 10th Symp. on Meteorological Observations andInstrumentation, Phoenix, AZ, Amer. Meteor. Soc., 349–354.
Barnes, S. L., 1964: A technique for maximizing details in numericalweather map analysis. J. Appl. Meteor., 3, 396–409.
Brock, F. V., K. C. Crawford, R. L. Elliott, G. W. Cuperus, S. J.Stadler, H. L. Johnson, and M. D. Eilts, 1995: The OklahomaMesonet, a technical overview. J. Atmos. Oceanic Technol., 12,5–19.
Brotzge, J. A., and K. C. Crawford, 2000: Estimating sensible heatfluxes from the Oklahoma Mesonet. J. Appl. Meteor., 39, 102–116.
Crawford, K. C., D. S. Arndt, D. J. Shellberg, and B. M. Brus, 1995:A comparison of differences in meteorological measurementsmade by the Oklahoma Mesonetwork at two co-located ASOSsites. Preprints, 11th Int. Conf. on Interactive Information andProcessing Systems for Meteorology, Oceanography, and Hy-drology, Dallas, TX, Amer. Meteor. Soc., 299–303.
Elliott, R. L., F. V. Brock, M. L. Stone, and S. L. Harp, 1994: Con-
figuration decisions for an automated weather station network.Appl. Eng. Agric., 10 (1), 45–51.
Fiebrich, C. A., and K. C. Crawford 1998: An investigation of sig-nificant low-level temperature inversions as measured by theOklahoma Mesonet. Preprints, 10th Symp. on MeteorologicalObservations and Instrumentation, Phoenix, AZ, Amer. Meteor.Soc., 337–342.
Fredrickson, S. E., J. A. Brotzge, D. Grimsley, and F. V. Brock, 1998:An unusual Oklahoma Mesonet temperature sensor problem(nearly) slips by in-situ, real-time, short-term and long-term QAefforts . . . and why this could happen to you. Preprints, 10thSymp. on Meteorological Observations and Instrumentation,Phoenix, AZ, Amer. Meteor. Soc., 343–348.
Gandin, L. S., 1988: Complex quality control of meteorological ob-servations. Mon. Wea. Rev., 116, 1137–1156.
Gill, G. C., 1979: Development of a small radiation shield for airtemperature measurements on drifting buoys. NOAA Data BuoyOffice Contract 01-7-038-827(11). [Available from NOAA DataBuoy Office, Bay St. Louis, MS 39520.]
MacKeen, P., D. L. Andra, and D. A. Morris, 1998: The 22–23 May1996 heatburst: A severe wind event. Preprints, 19th Conf. onSevere Local Storms, Minneapolis, MN, Amer. Meteor. Soc.,510–513.
Meek, D. W., and J. L. Hatfield, 1994: Data quality checking forsingle station meteorological databases. Agric. Forest Meteor.,69, 85–109.
Meyer, S. J., and K. G. Hubbard, 1992: Nonfederal automated weatherstations and networks in the United States and Canada: A pre-liminary survey. Bull. Amer. Meteor. Soc., 73, 449–457.
Richardson, S. J., 1995: Automated temperature and relative humiditycalibrations for the Oklahoma Mesonetwork. J. Atmos. OceanicTechnol., 12, 951–959., F. V. Brock, S. R. Semmer, and C. Jirak, 1999: Minimizingerrors associated with multiplate radiation shields. J. Atmos.Oceanic Technol., 16, 1862–1872.
Shafer, M. A., T. Hughes, and J. D. Carlson, 1993: The OklahomaMesonet: Site selection and layout. Preprints, Eighth Symp. onMeteorological Observations and Instrumentation, Anaheim,CA, Amer. Meteor. Soc., 231–236.
Snyder, R. L., and W. O. Pruitt, 1992: Evapotranspiration data man-agement in California. Irrigation and Drainage, Saving a Threat-ened Resource—In Search of Solutions, T. E. Engman, Ed.,American Society of Civil Engineers, 128–133.
Stanhill, G., 1992: Accuracy of global radiation measurements atunattended, automatic weather stations. Agric. Forest Meteor.,61, 151–156.
Wade, C. G., 1987: A quality control program for surface mesome-teorological data. J. Atmos. Oceanic Technol., 4, 435–453.