Embed Size (px)
Citation preview

Blacktown City
Crime Prevention Plan
2017-2021
Attachment 1 - CL370037

Blacktown City Crime Prevention Plan 2017 2
Blacktown City Crime Prevention Plan 2017 3
Table of Contents
Mayoral foreword ................................................................................................................................... 5
Introduction ............................................................................................................................................ 7
Action plan ............................................................................................................................................. 9
Focused strategy ............................................................................................................................... 10
Collaborative action ......................................................................................................................... 10
Integrated response .......................................................................................................................... 11
Monitoring and evaluation ............................................................................................................... 11
Priority crime categories ....................................................................................................................... 12
Priority area 1: Domestic violence ................................................................................................. 13
Priority area 2: Fraud ..................................................................................................................... 17
Priority area 3: Opportunistic crime .............................................................................................. 19
Demographic and data analysis ........................................................................................................... 25
Our City ............................................................................................................................................. 26
Our approach to crime prevention .................................................................................................. 27
Developing our Crime Prevention Plan ............................................................................................. 28
Crime profile ..................................................................................................................................... 29
Crime data analysis ........................................................................................................................... 29
Twenty five techniques of situational crime prevention .................................................................. 30
Using crime statistics ....................................................................................................................... 32
Crime data ............................................................................................................................................. 33
References ............................................................................................................................................ 47

Blacktown City Crime Prevention Plan 2017 4
Blacktown City Crime Prevention Plan 2017 5
Mayoral foreword
Community safety is everyone’s business. Our
Crime Prevention Plan 2017-2021 provides a
strategy to prevent or reduce crime throughout
the City through a range of collaborative,
community-based approaches. These include:
awareness raising, advocacy, policy
development, service development and
community development.
The Plan targets key crime categories identified
by our 3 NSW Police Area Commands -
Blacktown, Quakers Hill and Mount Druitt. The
categories centre on assault, robbery, break
and enter, motor vehicle theft, steal and
malicious damage to property.
The Plan includes an analysis of each category,
relevant statistics, comments from the 3 Police
Area Commands and an action plan.
We developed the Plan in partnership with the
Police Area Commands, and with the active
involvement of local organisations and
Government agencies. We wish to
acknowledge the oversight of the Community
Safety Advisory Committee in its development.
This Blacktown City Crime Prevention Plan is
an important part of our City’s commitment to
becoming a safer community.

Blacktown City Crime Prevention Plan 2017 6
Blacktown City Crime Prevention Plan 2017 7
Introduction
Community safety is not only about reducing
and preventing injury and crime; it is about
building a strong, cohesive, vibrant and
participatory community that works together to
address factors impacting physical, social and
environmental well-being.
The extent to which people feel safe, whether
as a perception or a reality, will be critical to
the way they feel and interact in their
community.
A safe community is therefore a liveable
community, where people can go about their
daily activities in an environment without fear
or risk of harm. It is a place in which it is
attractive to live, work and visit.
This Crime Prevention Plan sets out how
Blacktown City is creating a respectful, healthy
and safe city – a City of Excellence. It outlines
a framework for a safe community in which all
sectors of the community work together in a
coordinated and collaborative way. This
includes forming partnerships to promote
safety, manage risk, increase overall safety
and reduce the fear of harm.
This Plan is supported by the Community
Safety Advisory Committee; a coalition of
community, business, government and non-
government leaders. They combine their
resources and interests to address local
concerns about injuries, crashes, anti-social
behaviour and crime in a co-ordinated and
sustainable manner.

Blacktown City Crime Prevention Plan 2017 8
Blacktown City Crime Prevention Plan 2017 9
Blacktown City
Crime Prevention Plan
2017-2021
Action plan
Blacktown City Crime Prevention Plan 2017 10
This action plan describes the crime
intervention strategies we, and our
collaborative agencies, will be involved in
during the current term of Council. It
recognises the need for interventions
addressing both the perception and the reality
of crime.
The actions ensure a broad approach to both
preventing and addressing crime, and are not
restrictive in scope. We will, with our
community partners, undertake activities not
listed in this Plan as the need and opportunity
arise. Some actions contained in this Plan will
have, at best, an attributive impact on crime.
Local government can provide a lead role in
ensuring coordinated situational crime
prevention strategies in response to certain
crime categories. To be effective these
strategies need to be:
• focused on an identified crime category
• collaborative and conducted in partnership
with other agencies
• integrated into a broad community safety
strategy
• monitored and evaluated.
Focused strategy
We have included a limited number of
intervention strategies. They apply to our local
crime rates and are able to be implemented by
local government.
For each strategy, we identify:
• the target crime category
• what the project will actually do
• the project crime reduction objective
• the rationale
• performance measures and timeframes
• the project partners.
Collaborative action
Our collaborative approach to community
safety is a central objective of the Community
Safety Advisory Committee which was formed
in late 1994. The Committee comprises
residents and representatives of government
and non-government organisations. The role of
the Committee is to facilitate community
collaboration and to advise Council on a broad
range of factors to improve the physical, social
and environmental well-being of people within
Blacktown City.
The Committee recognises that both the
perception and reality of safety - physically,
socially and environmentally - is critical to the
way people engage with their community.
Residents have an expectation of being able to
live in their community without fear or risk of
harm.
The aim of the Committee is not only about
reducing and preventing injury and crime, it is
also about building a strong, cohesive, vibrant,
participatory community – a City of Excellence.
This has entailed coordinating overlapping
government programs and developing existing
multi-agency strategies as steps toward
achieving Pan-Pacific International Safe
Community accreditation.
Committee members include residents and
key agencies with an interest in issues
affecting community safety:
• Blacktown City Council
• NSW Police Force
• NSW Family and Community Services
• NSW Health (Diabetes Taskforce)
• NSW Family and Community Services -
Housing
• NSW State Emergency Services
• NSW Fire and Rescue
• Blacktown/Mount Druitt Hospitals
• Outer West Domestic Violence Network
• GEO Group/Parklea Correctional Centre
• Australian Drug Foundation
• Sex Workers Outreach Project
• Community Resource Network
• Women’s Activities & Self Help House
• SydWest Multicultural Services
• Rotary Club of Blacktown City
• Blacktown Family Relationship Centre
• St Vincent de Paul Society
• Communities 4 Children
• Mission Australia
• local residents
• local community health centres.
Our Safer Communities Coordinator serves as
the executive officer of the Committee.
Blacktown City Crime Prevention Plan 2017 11
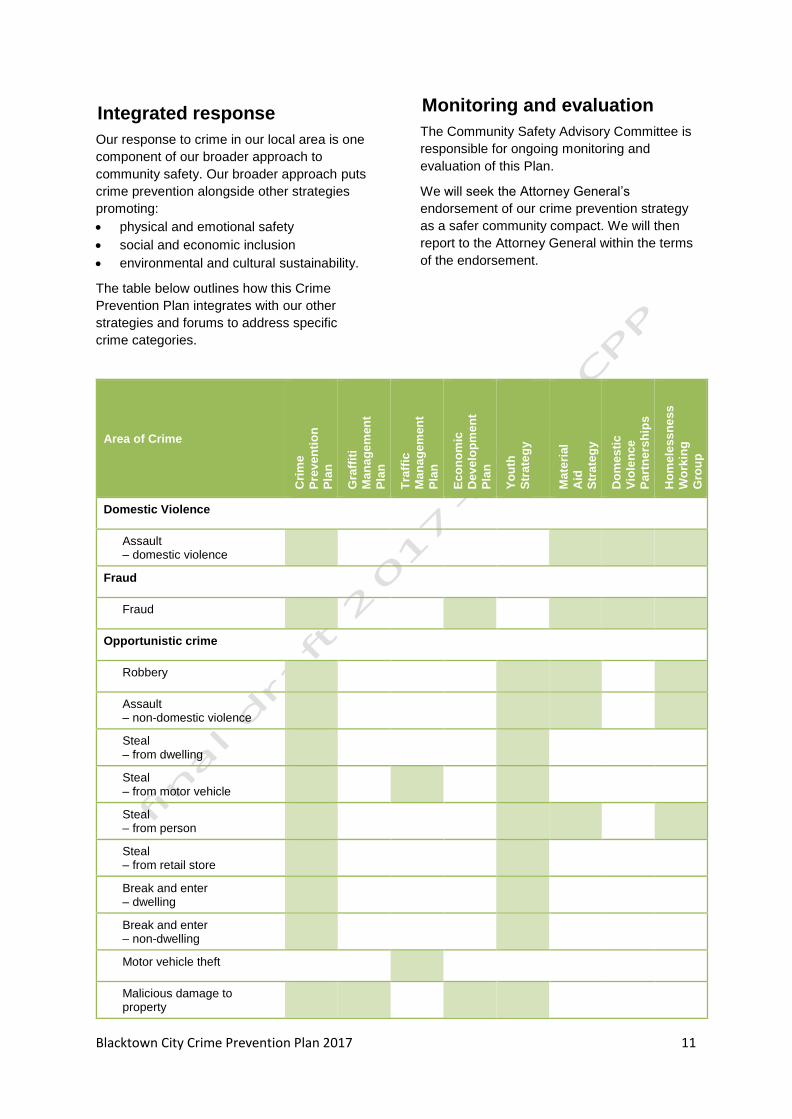
Integrated response
Our response to crime in our local area is one
component of our broader approach to
community safety. Our broader approach puts
crime prevention alongside other strategies
promoting:
• physical and emotional safety
• social and economic inclusion
• environmental and cultural sustainability.
The table below outlines how this Crime
Prevention Plan integrates with our other
strategies and forums to address specific
crime categories.
Monitoring and evaluation
The Community Safety Advisory Committee is
responsible for ongoing monitoring and
evaluation of this Plan.
We will seek the Attorney General’s
endorsement of our crime prevention strategy
as a safer community compact. We will then
report to the Attorney General within the terms
of the endorsement.
Area of Crime
Cri
me
Pre
ve
nti
on
Pla
n
Gra
ffit
i
Ma
na
ge
men
t
Pla
n
Tra
ffic
Ma
na
ge
men
t
Pla
n
Ec
on
om
ic
Dev
elo
pm
en
t
Pla
n
Yo
uth
Str
ate
gy
Ma
teri
al
Aid
Str
ate
gy
Do
me
sti
c
Vio
len
ce
Pa
rtn
ers
hip
s
Ho
me
less
ne
ss
Wo
rkin
g
Gro
up
Domestic Violence
Assault – domestic violence
Fraud
Fraud
Opportunistic crime
Robbery
Assault – non-domestic violence
Steal – from dwelling
Steal – from motor vehicle
Steal – from person
Steal – from retail store
Break and enter – dwelling
Break and enter – non-dwelling
Motor vehicle theft
Malicious damage to property

Blacktown City Crime Prevention Plan 2017 12
Priority crime categories
The priority crime categories in this Plan were
identified through statistical analysis of crime
data, consultations with our 3 Police Area
Commands, and discussions with a range of
stakeholders.
Priority crime categories meet the following
criteria:
• the category of offence was identified by
Police Area Commands as of current
operational interest
• recorded incidents demonstrated an
increasing or stable trend over a 5-year
period
• the category ranked within the top 2
quartiles of Local Government Areas in
NSW in the past 5 years.
Crime group Offence 5 year
trend
Priority area 1
Domestic violence
Domestic violence related offences account for up to 40% of Police call-outs across the City. Not all call-outs result in a recorded offence. Where offences are recorded, they may fall into a number of categories and include where identifiable: alcohol related domestic violence assault, and malicious damage as a result of domestic violence.
Assault – domestic violence Up
Breach Apprehended Violence Order
Up
Break and enter – dwelling Down
Harassment, threatening behaviour and private nuisance
Stable
Malicious damage to property Down
Priority area 2
Fraud
Identity theft through mail box theft, fraud, cyber-fraud and skimming is becoming more prevalent, especially in new release areas.
Reporting of these offences through financial and other institutions can result in under-reported local incidents.
This Plan prioritises emerging trends in fraud, cyber fraud and mailbox theft.
Fraud Stable
Priority area 3
Opportunistic crime
Consultations identified a concern on a range of crimes committed by youth offenders. These crimes, often involving theft or malicious damage, are opportunistic in nature. These offences are particularly appropriate for a response utilising situational crime prevention.
This Plan prioritises opportunistic crime, especially crime and anti-social behavior associated with youth.
Robbery Down
Steal – from dwelling Stable
Steal – from motor vehicle Stable
Steal – from person Down
Steal – from retail store Down
Break and enter – non-dwelling Down
Motor vehicle theft Stable
Malicious damage to property Down

Blacktown City Crime Prevention Plan 2017 13
Priority area 1: Domestic violence
Family and domestic violence is often referred
to as a scourge on society. This use of medical
terminology to describe events, more often
discussed from a legal and policing viewpoint,
highlights the extraordinary complexity of this
issue for any community.
Family and domestic violence is a complex
issue in Blacktown City. We have the highest
number of incidents of domestic violence
related assault of any local government area in
NSW – 2,083 in the year to March 2017.
Our Mayor and General Manager have been
very public in their leadership of campaigns to
address this crime category.The current rate of
this offence, by any measure, is unacceptable.
Compounding the situation, as Kishor and
other health professionals note, is that family
and domestic violence is ‘not a scourge like
most other scourges; its harmful effects do not
disappear with the generation that was directly
involved. The scourge will be resurrected in
every successive generation, unless we treat it
as a public health emergency and make
concerted efforts to eliminate it.’ (Kishor, 2005,
p 78).
We are therefore dealing with a complex,
generational social issue requiring a broad,
multi-faceted response comprised of, but not
limited to:
• policing interventions to address crime
• legislative interventions to strengthen
judicial processes
• health interventions to address immediate
and ongoing physical and mental harm
• human services initiatives to create
frontline support services
• community initiatives to create cultural
change.
Awareness raising
Local and statewide awareness raising
campaigns, have resulted in an increased
reporting of incidents of family and domestic
violence. There is, however, no evidence that
public messaging and anti-violence campaigns
have impacted the community to achieve a
broader cultural shift. Media campaigns have
tended to focus on and stigmatise offenders
rather than the issue. Similarly, targeted
campaigns against litterers (‘Don’t be a
tosser’) and ‘hoon’ drivers (little finger) have
also reported little measurable effect.
In comparison, the highly successful, culture
changing campaigns tackling smoking and
seat belt usehighlighted the benefits and
addressed the issue rather than stigmatising
the offender.
Our approach
We have been proactive in addressing family and domestic violence on a number of fronts, including:
• actively promoting, forming and joining
local coalitions of agencies to address
various aspects of family and domestic
violence
• funding domestic violence services and
programs
• holding vigils for victims of fatal domestic
violence assaults
• supporting early intervention programs in
local schools
• branding a garbage truck and our vehicle
fleet with white ribbon messaging
• achieving White Ribbon Australia
Workplace Accreditation
• organising an anti-domestic violence
contingent in our annual Blacktown
Festival
• lobbying for increased and continuing
funding for local services
• installation of anti-domestic violence street
banners on major thoroughfares.
Our aim
Our aim, with family and domestic violence, is to continue to work toward:
• effective change within the culture of our
community to no longer tolerate or accept
family violence in any form
• campaigning and messaging that
promotes openness and reporting without
stigmatising those who may need
assistance.
Blacktown City Crime Prevention Plan 2017 14
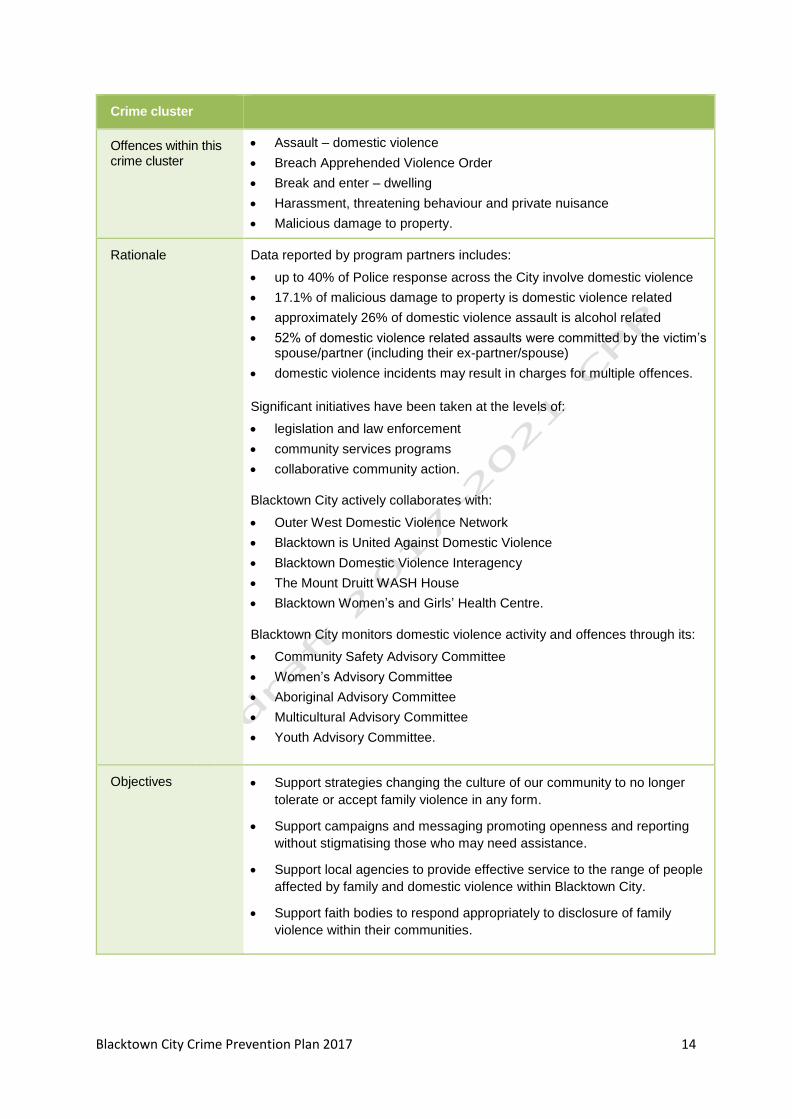
Crime cluster
Offences within this crime cluster
• Assault – domestic violence
• Breach Apprehended Violence Order
• Break and enter – dwelling
• Harassment, threatening behaviour and private nuisance
• Malicious damage to property.
Rationale Data reported by program partners includes:
• up to 40% of Police response across the City involve domestic violence
• 17.1% of malicious damage to property is domestic violence related
• approximately 26% of domestic violence assault is alcohol related
• 52% of domestic violence related assaults were committed by the victim’s spouse/partner (including their ex-partner/spouse)
• domestic violence incidents may result in charges for multiple offences.
Significant initiatives have been taken at the levels of:
• legislation and law enforcement
• community services programs
• collaborative community action.
Blacktown City actively collaborates with:
• Outer West Domestic Violence Network
• Blacktown is United Against Domestic Violence
• Blacktown Domestic Violence Interagency
• The Mount Druitt WASH House
• Blacktown Women’s and Girls’ Health Centre.
Blacktown City monitors domestic violence activity and offences through its:
• Community Safety Advisory Committee
• Women’s Advisory Committee
• Aboriginal Advisory Committee
• Multicultural Advisory Committee
• Youth Advisory Committee.
Objectives • Support strategies changing the culture of our community to no longer
tolerate or accept family violence in any form.
• Support campaigns and messaging promoting openness and reporting
without stigmatising those who may need assistance.
• Support local agencies to provide effective service to the range of people
affected by family and domestic violence within Blacktown City.
• Support faith bodies to respond appropriately to disclosure of family
violence within their communities.

Blacktown City Crime Prevention Plan 2017 15
Target crime Project description Project objective Outcome, measures and timeframe
Collaboration
Assault – domestic violence related (incorporating alcohol related domestic violence assault and malicious damage to property).
Distribute coasters and posters in local licensed establishments during the 16 Days of Activism Against Domestic Violence to educate on the link between alcohol and domestic violence.
To reduce the incidence of domestic violence related assault, alcohol related domestic violence and malicious damage to property as a result of domestic violence.
• Increased awareness of the
link between alcohol and
domestic violence.
Measure: survey.
Timeframe: before and after
campaign.
• Men joining domestic violence
behaviour change programs.
Measure: participation rates.
Timeframe: before and after
campaign.
• Educate licensed liquor outlets
on the effects and number of
incidents of alcohol related
domestic violence assaults.
Measure: survey.
Timeframe: before and after
campaign.
• Blacktown City Council
• Outer West Domestic
Violence Network
• Domestic Violence Service
Management - Refuge,
Outreach, Action, Response
(ROAR)
• NSW Family and Community
Services Family Violence
Team
• Relationships Australia NSW
• Local licensed establishments
• Community Safety Advisory
Committee.
Assault – domestic violence Conduct and support a range of awareness raising activities during the 16 Days of Activism Against Domestic Violence, including:
• Sea of hands
• Street banners
• Family fun day
• Workplace breakfasts
• White Ribbon breakfast.
To reduce the incidence of domestic violence related assault as a result of increased reporting.
• Increased awareness of the
incidence of family and
domestic violence.
Measure: Survey.
Timeframe: before and after
campaign.
• Increased reporting of
incidents of family and
domestic violence.
Measure: Domestic violence
legal action rates.
Timeframe: Quarterly.
• Blacktown City Council
• Outer West Domestic
Violence Network
• Blacktown Women’s & Girls
Health Centre
• NSW Police Area Commands
• Blacktown Workers Club
• faith communities
• Community Safety Advisory
Committee.
Blacktown City Crime Prevention Plan 2017 16
Target crime Project description Project objective Outcome, measures and timeframe
Collaboration
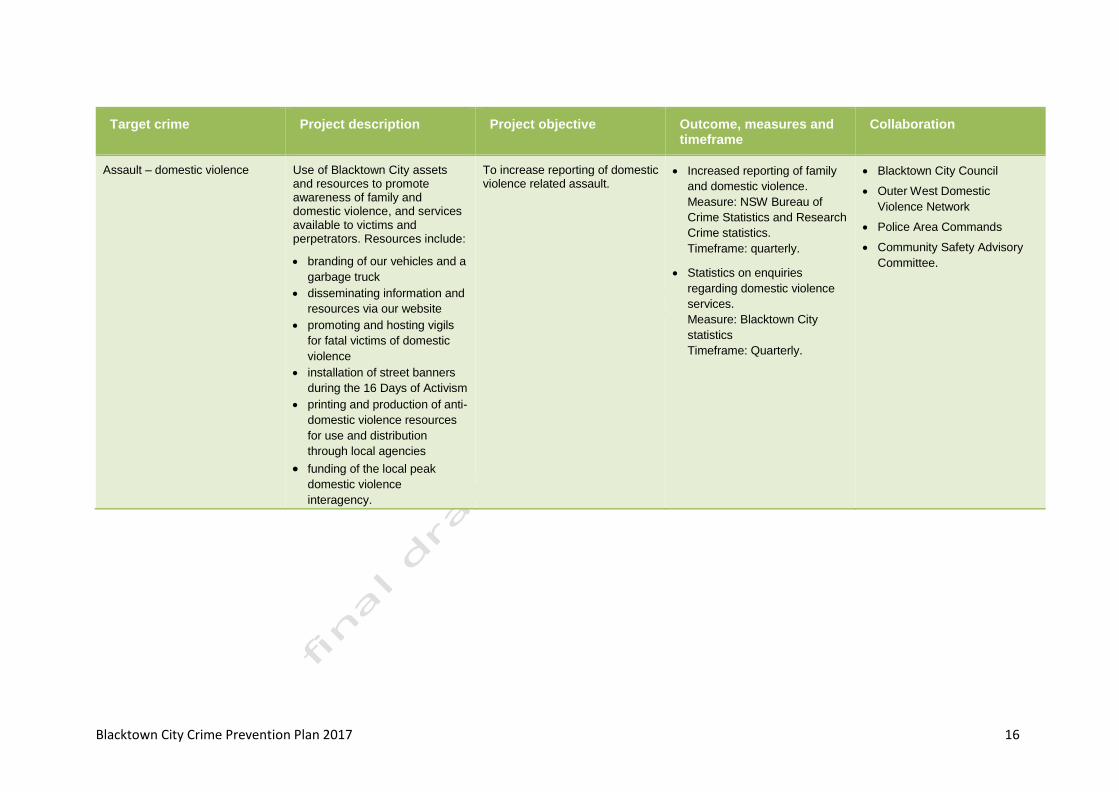
Assault – domestic violence Use of Blacktown City assets and resources to promote awareness of family and domestic violence, and services available to victims and perpetrators. Resources include:
• branding of our vehicles and a
garbage truck
• disseminating information and
resources via our website
• promoting and hosting vigils
for fatal victims of domestic
violence
• installation of street banners
during the 16 Days of Activism
• printing and production of anti-
domestic violence resources
for use and distribution
through local agencies
• funding of the local peak
domestic violence
interagency.
To increase reporting of domestic violence related assault.
• Increased reporting of family
and domestic violence.
Measure: NSW Bureau of
Crime Statistics and Research
Crime statistics.
Timeframe: quarterly.
• Statistics on enquiries
regarding domestic violence
services.
Measure: Blacktown City
statistics
Timeframe: Quarterly.
• Blacktown City Council
• Outer West Domestic
Violence Network
• Police Area Commands
• Community Safety Advisory
Committee.
Blacktown City Crime Prevention Plan 2017 17
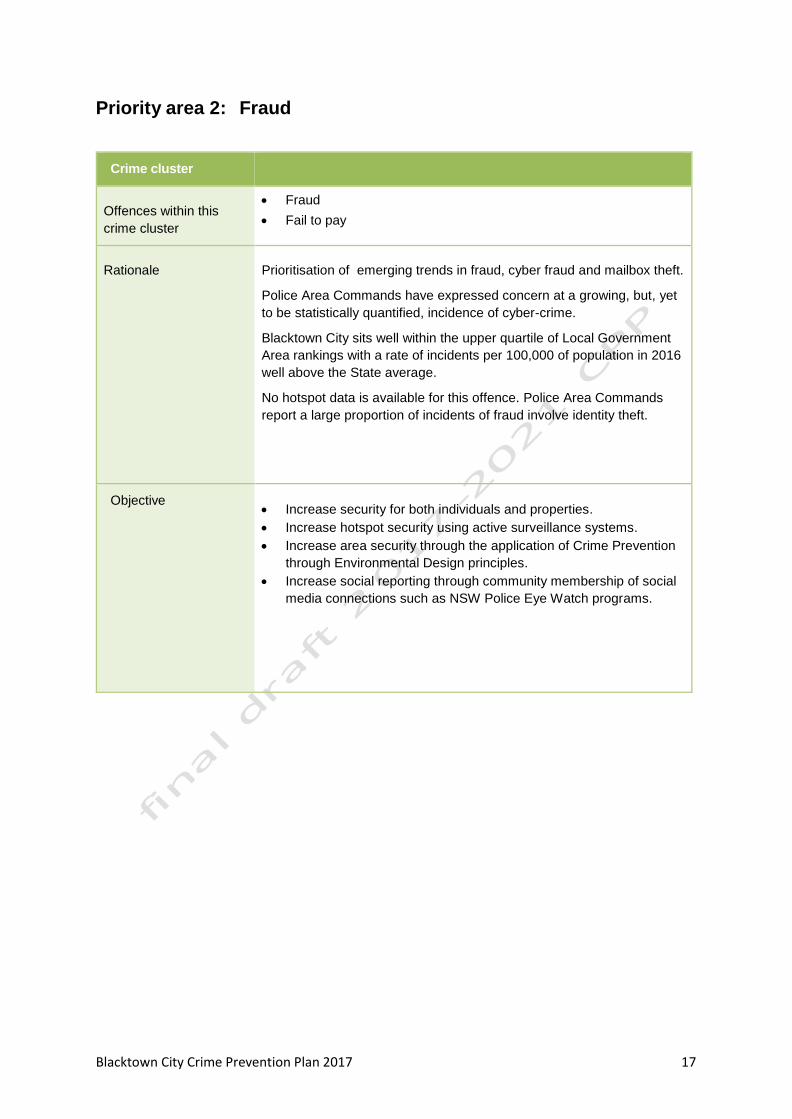
Priority area 2: Fraud
Crime cluster
Offences within this
crime cluster
• Fraud
• Fail to pay
Rationale Prioritisation of emerging trends in fraud, cyber fraud and mailbox theft.
Police Area Commands have expressed concern at a growing, but, yet
to be statistically quantified, incidence of cyber-crime.
Blacktown City sits well within the upper quartile of Local Government
Area rankings with a rate of incidents per 100,000 of population in 2016
well above the State average.
No hotspot data is available for this offence. Police Area Commands
report a large proportion of incidents of fraud involve identity theft.
Objective • Increase security for both individuals and properties.
• Increase hotspot security using active surveillance systems.
• Increase area security through the application of Crime Prevention
through Environmental Design principles.
• Increase social reporting through community membership of social
media connections such as NSW Police Eye Watch programs.

Blacktown City Crime Prevention Plan 2017 18
Target crime Project description Project objective Outcome measures and timeframe
Collaboration
Fraud Cyber-crime awareness sessions for the elderly.
To reduce the incidence of cyber fraud within vulnerable communities.
• Increased awareness of
actions to reduce vulnerability
to cyber-crime among the
target group.
Measure: Survey.
Timeframe: before and after
campaign.
• Decreased occurrences of
cyber fraud among the target
group.
Measure: NSW Bureau of
Crime Statistics and Research
crime statistics.
Timeframe: Quarterly.
• Blacktown City Council
• NSW Department of Fair
Trading
• Police Area Commands
• Community Safety Advisory
Committee.
Fraud Mailbox security information for developers and residents.
To reduce the incidence of theft from mail box.
• Increased awareness of
actions to reduce vulnerability
to mail box theft among the
target group.
Measure: Survey.
Timeframe: before and after
campaign.
• Take up of mail box design
recommendations by
developers.
Measure: Blacktown City
statistics
Timeframe: Quarterly.
• Blacktown City Council
• Police Area Commands
• local service clubs
• Community Safety Advisory
Committee.
Blacktown City Crime Prevention Plan 2017 19
Priority area 3: Opportunistic crime
Research by the Australian Institute of
Criminology suggests that opportunistic
offences are significantly underreported (120,
p 78).
A high proportion of opportunistic offenders
are typically young males, with the average
age of onset being 12–14 years.
Effective strategies identify young people who
are at risk of engaging in opportunistic crime
and provide them with programs that address
multiple risk factors such as poor social skills
and association with offending peer groups.
Potential strategies include youth groups and
mentoring programs (National Audit Office
2007).
Importantly, local government can provide a
lead role in ensuring coordinated situational
crime prevention strategies in response to
opportunistic crime.
Theft involving motor vehicles
Stealing from motor vehicles encompasses:
• theft of items left in cars, for example
GPS, iPods, laptops, money and
sunglasses; interior car parts such as
radios or batteries
• external car parts such as wheels,
registration plates and hubcaps (ABS
2011; Varshney & Fitzgerald 2008).
The most common location for stealing from
motor vehicle offences are:
• residential locations, primarily of an
evening where vehicles are not parked in
garages
• parking facilities, primarily in car parks
where vehicles are likely to be left for set
periods. For example, commuter or
university car parks, are more likely to be
targeted than short-term parking facilities.
(NSW Bureau of Crime Statistics and
Research 2012; Varshney & Fitzgerald
2008; Armitage 2011b)
Interventions supported by evidence of
effectiveness and suitability for implementation
by local government are:
• access control measures
• surveillance (CCTV, lighting, signage)
• the application of Crime Prevention
through Environmental Design principles.
Steal from person
Stealing from person encompasses a range of
activities, such as bag snatching and
pickpocketing, and may be perpetrated using
different techniques.
The costs of theft from person offences are
considerable. Besides the obvious impact of
the offence on the victim who has to replace
their property (usually at their own expense),
some research suggests that thieves use
stolen personal items (e.g. credit cards, driver
licences) to perpetrate identity theft (Johnson
et al. 2010). As such, theft from person
offences may facilitate more serious crime.
Licensed establishments and busy locations
attract higher rates of theft from person
offences due to the ability of offenders to blend
into a crowd, and the availability of products
that are especially attractive to thieves are
CRAVED—concealable, removable, available,
valuable, enjoyable and disposable (Clarke
2002a).
Interventions supported by evidence of
effectiveness and suitability for implementation
by local government are:
• awareness campaigns
• CCTV.
The suitability of CCTV as a strategy for local
government will depend on the location being
targeted.
Blacktown City Crime Prevention Plan 2017 20
Residential burglary
Residential burglary is usually ‘unplanned and
speculative in nature’ (Grabosky 1995, p 3). As
such, successful prevention strategies are
often targeted at reducing opportunity risk
factors.
There are a number of situational risk factors
that contribute to residential burglary including:
• regular periods during the day when
buildings are unoccupied
• the presence of concealment for offenders
(e.g. overgrown shrubbery and trees)
• unsecured entry points to dwelling
• the absence of a garage or properties with
an open carport
• proximity to pawnshops
• proximity to public transport (Armitage
2011b; Moreto 2010).
There is a range of practical strategies that
may be implemented by the home or property
owner to reduce the risk of residential burglary,
such as:
• increasing the natural surveillance
opportunities of the property
• securing implements that may be used to
aid an offender’s entry into the property
• making the property appear occupied,
particularly when the homeowner is away
• restricting access by making sure access
points such as window and doors are
locked and secure
• installing additional measures such as
sensor lights and alarm systems
• burglary victims upgrading their security
immediately after the event to deter repeat
victimisation (Grabosky 1995).
The NSW Department of Justice (2014)
identifies interventions supported by evidence
of effectiveness and suitability for
implementation by local government involve:
• access control measures
• awareness raising campaigns
• property marking
• strategies involving some form of Crime
Prevention through Environmental Design
• community patrols
• diversionary activities providing some form
of alternative activity after school or during
school holidays for youths at risk of
becoming involved in property crime.
Malicious damage
Malicious damage is the intentional
‘destruction or defacement of public,
commercial and private property’, including
vandalism and graffiti.
Apart from considerable monetary costs,
graffiti and vandalism can undermine a
community’s feeling of safety, reducing the
quality of life of residents (Department for
Transport 2003; Morgan & Louis 2009).
Other evidence suggests that malicious
damage offences may encourage further
criminal acts through the process sometimes
referred to as the ‘broken windows’ effect
(LaGrange 1999).
The understanding of the nature and extent of
malicious damage offences is limited because
the overwhelming majority of incidents are not
witnessed. However, research has identified a
number of common characteristics:
• the majority of malicious damage incidents
occur between 3 pm and midnight with a
peak between 6 pm and 9 pm
• most offences occur between Friday and
Sunday
• alcohol is an important contributing factor
to many malicious damage offences
• young people are generally the main
perpetrators of graffiti as well as other
forms of malicious damage.
Situational crime prevention strategies aim to
change the environment in which crime
occurs. Strategies to reduce opportunities for
offending have included:
• elements of Crime Prevention through
Environmental Design
• community patrols
• rapid removal of graffiti.
Blacktown City Crime Prevention Plan 2017 21
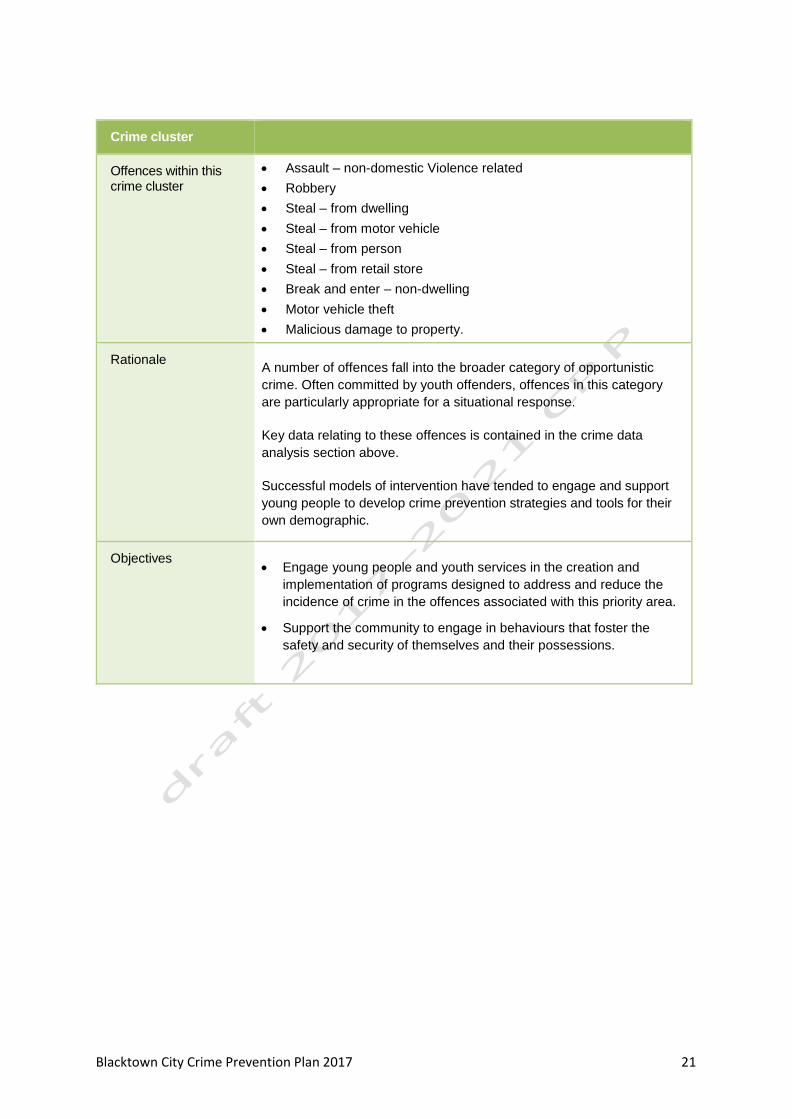
Crime cluster
Offences within this crime cluster
• Assault – non-domestic Violence related
• Robbery
• Steal – from dwelling
• Steal – from motor vehicle
• Steal – from person
• Steal – from retail store
• Break and enter – non-dwelling
• Motor vehicle theft
• Malicious damage to property.
Rationale
A number of offences fall into the broader category of opportunistic
crime. Often committed by youth offenders, offences in this category
are particularly appropriate for a situational response.
Key data relating to these offences is contained in the crime data
analysis section above.
Successful models of intervention have tended to engage and support
young people to develop crime prevention strategies and tools for their
own demographic.
Objectives
• Engage young people and youth services in the creation and
implementation of programs designed to address and reduce the
incidence of crime in the offences associated with this priority area.
• Support the community to engage in behaviours that foster the
safety and security of themselves and their possessions.
Blacktown City Crime Prevention Plan 2017 22
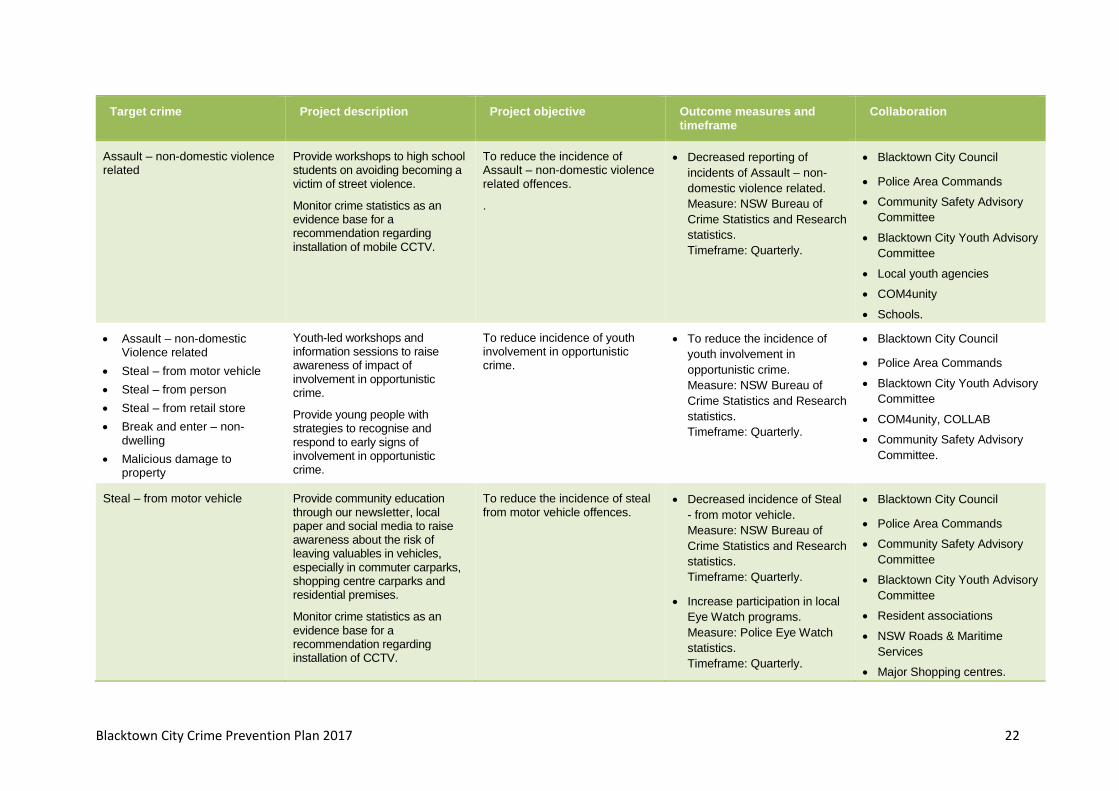
Target crime Project description Project objective Outcome measures and timeframe
Collaboration
Assault – non-domestic violence related
Provide workshops to high school students on avoiding becoming a victim of street violence.
Monitor crime statistics as an evidence base for a recommendation regarding installation of mobile CCTV.
To reduce the incidence of Assault – non-domestic violence related offences.
.
• Decreased reporting of
incidents of Assault – non-
domestic violence related.
Measure: NSW Bureau of
Crime Statistics and Research
statistics.
Timeframe: Quarterly.
• Blacktown City Council
• Police Area Commands
• Community Safety Advisory
Committee
• Blacktown City Youth Advisory
Committee
• Local youth agencies
• COM4unity
• Schools.
• Assault – non-domestic Violence related
• Steal – from motor vehicle
• Steal – from person
• Steal – from retail store
• Break and enter – non-dwelling
• Malicious damage to property
Youth-led workshops and information sessions to raise awareness of impact of involvement in opportunistic crime.
Provide young people with strategies to recognise and respond to early signs of involvement in opportunistic crime.
To reduce incidence of youth involvement in opportunistic crime.
• To reduce the incidence of
youth involvement in
opportunistic crime.
Measure: NSW Bureau of
Crime Statistics and Research
statistics.
Timeframe: Quarterly.
• Blacktown City Council
• Police Area Commands
• Blacktown City Youth Advisory
Committee
• COM4unity, COLLAB
• Community Safety Advisory
Committee.
Steal – from motor vehicle
Provide community education through our newsletter, local paper and social media to raise awareness about the risk of leaving valuables in vehicles, especially in commuter carparks, shopping centre carparks and residential premises.
Monitor crime statistics as an evidence base for a recommendation regarding installation of CCTV.
To reduce the incidence of steal from motor vehicle offences.
• Decreased incidence of Steal
- from motor vehicle.
Measure: NSW Bureau of
Crime Statistics and Research
statistics.
Timeframe: Quarterly.
• Increase participation in local
Eye Watch programs.
Measure: Police Eye Watch
statistics.
Timeframe: Quarterly.
• Blacktown City Council
• Police Area Commands
• Community Safety Advisory
Committee
• Blacktown City Youth Advisory
Committee
• Resident associations
• NSW Roads & Maritime
Services
• Major Shopping centres.
Blacktown City Crime Prevention Plan 2017 23
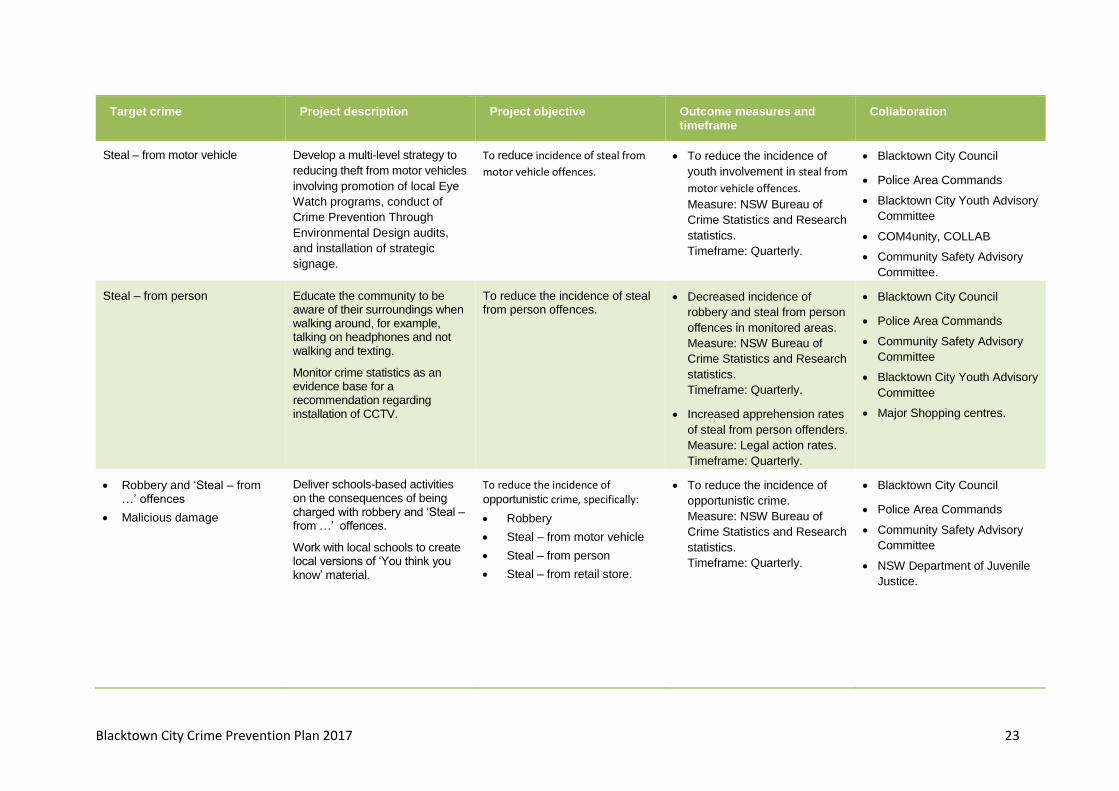
Target crime Project description Project objective Outcome measures and timeframe
Collaboration
Steal – from motor vehicle Develop a multi-level strategy to
reducing theft from motor vehicles
involving promotion of local Eye
Watch programs, conduct of
Crime Prevention Through
Environmental Design audits,
and installation of strategic
signage.
To reduce incidence of steal from
motor vehicle offences.
• To reduce the incidence of
youth involvement in steal from
motor vehicle offences.
Measure: NSW Bureau of
Crime Statistics and Research
statistics.
Timeframe: Quarterly.
• Blacktown City Council
• Police Area Commands
• Blacktown City Youth Advisory
Committee
• COM4unity, COLLAB
• Community Safety Advisory
Committee.
Steal – from person
Educate the community to be aware of their surroundings when walking around, for example, talking on headphones and not walking and texting.
Monitor crime statistics as an evidence base for a recommendation regarding installation of CCTV.
To reduce the incidence of steal from person offences.
• Decreased incidence of
robbery and steal from person
offences in monitored areas.
Measure: NSW Bureau of
Crime Statistics and Research
statistics.
Timeframe: Quarterly.
• Increased apprehension rates
of steal from person offenders.
Measure: Legal action rates.
Timeframe: Quarterly.
• Blacktown City Council
• Police Area Commands
• Community Safety Advisory
Committee
• Blacktown City Youth Advisory
Committee
• Major Shopping centres.
• Robbery and ‘Steal – from …’ offences
• Malicious damage
Deliver schools-based activities on the consequences of being charged with robbery and ‘Steal – from …’ offences.
Work with local schools to create local versions of ‘You think you know’ material.
To reduce the incidence of opportunistic crime, specifically:
• Robbery
• Steal – from motor vehicle
• Steal – from person
• Steal – from retail store.
• To reduce the incidence of
opportunistic crime.
Measure: NSW Bureau of
Crime Statistics and Research
statistics.
Timeframe: Quarterly.
• Blacktown City Council
• Police Area Commands
• Community Safety Advisory
Committee
• NSW Department of Juvenile
Justice.
Blacktown City Crime Prevention Plan 2017 24
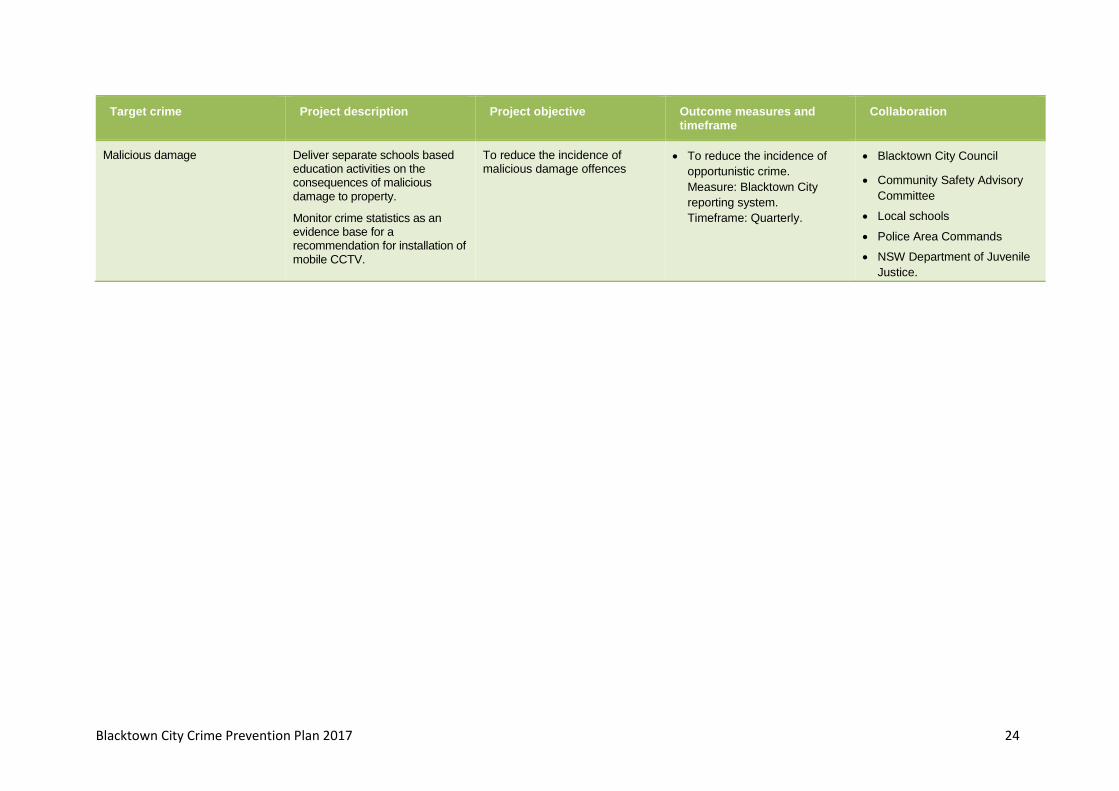
Target crime Project description Project objective Outcome measures and timeframe
Collaboration
Malicious damage Deliver separate schools based education activities on the consequences of malicious damage to property.
Monitor crime statistics as an evidence base for a recommendation for installation of mobile CCTV.
To reduce the incidence of malicious damage offences
• To reduce the incidence of
opportunistic crime.
Measure: Blacktown City
reporting system.
Timeframe: Quarterly.
• Blacktown City Council
• Community Safety Advisory
Committee
• Local schools
• Police Area Commands
• NSW Department of Juvenile
Justice.
Blacktown City Crime Prevention Plan 2017 25
Blacktown City
Crime Prevention Plan
2017-2021
Demographic and data analysis
Blacktown City Crime Prevention Plan 2017 26
Our City
Our long and rich history
We acknowledge the Darug people as the first
people of the Blacktown region. The Darug
people have lived in this region for thousands
of years. This was a living country intertwined
and connected with the many clan groups of
the Darug. The traditional name for the place
is Boongarrunbee or Bungarribee.
Europeans came to Blacktown in 1791 and
settled in Prospect Hill. After the Second World
War, the City’s population of 18,000 began to
grow. Housing was developed in Blacktown
and along the railway line. In the 1960s and
1970s there was large-scale housing
development in the suburb of Blacktown and to
the north of Mount Druitt.
Regional context
Blacktown City is an emerging Regional City
located about 35 kilometres west of the
Sydney Central Business District. Our City is
at the heart of western Sydney and is well
serviced by employment lands, public
transport and road access. It is supported by
core health, education, recreation, cultural and
leisure infrastructure.
We are home to 15.7% of greater western
Sydney’s population.
A growing city
Blacktown is the second largest Local
Government Area in NSW with an estimated
350,000 residents and a projected population
of 522,000 by 2036. Current growth will
continue, especially in the North West Growth
Centre.
Blacktown City extends about 247 square
kilometres It includes 48 existing and 9 new
(soon to be named) suburbs.
We welcome people of all backgrounds into
our vibrant and expanding neighbourhoods.
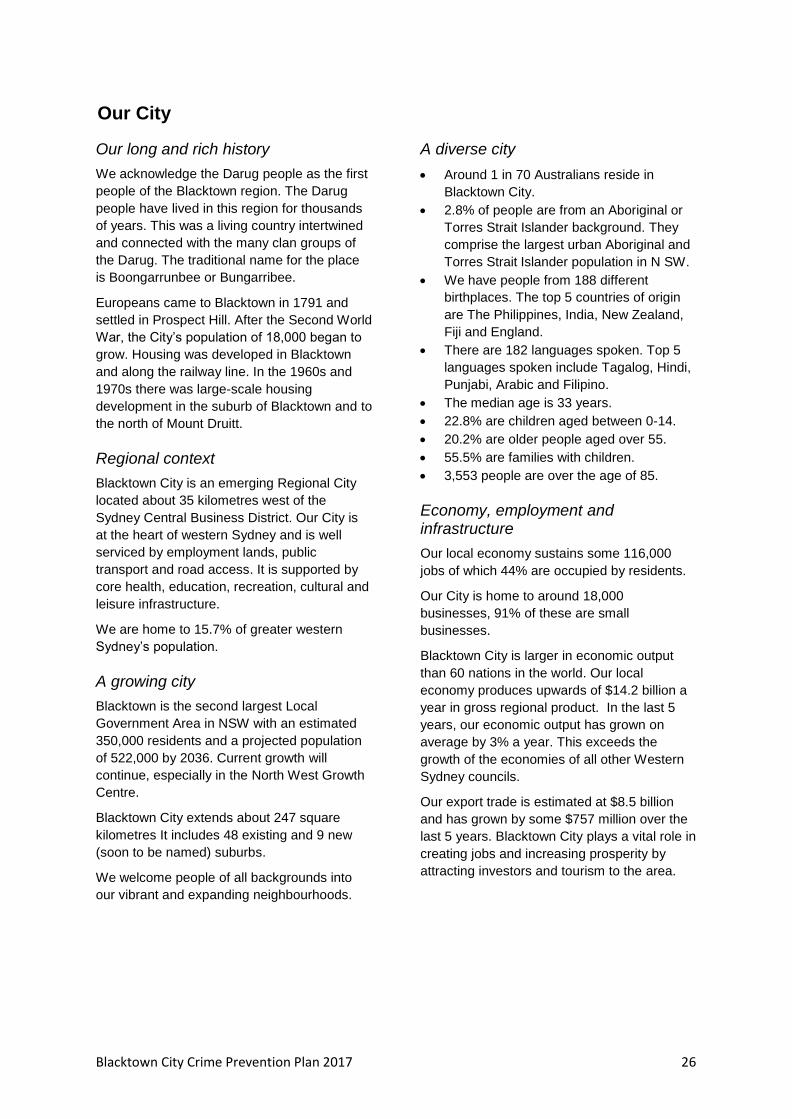
A diverse city
• Around 1 in 70 Australians reside in
Blacktown City.
• 2.8% of people are from an Aboriginal or
Torres Strait Islander background. They
comprise the largest urban Aboriginal and
Torres Strait Islander population in N SW.
• We have people from 188 different
birthplaces. The top 5 countries of origin
are The Philippines, India, New Zealand,
Fiji and England.
• There are 182 languages spoken. Top 5
languages spoken include Tagalog, Hindi,
Punjabi, Arabic and Filipino.
• The median age is 33 years.
• 22.8% are children aged between 0-14.
• 20.2% are older people aged over 55.
• 55.5% are families with children.
• 3,553 people are over the age of 85.
Economy, employment and infrastructure
Our local economy sustains some 116,000
jobs of which 44% are occupied by residents.
Our City is home to around 18,000
businesses, 91% of these are small
businesses.
Blacktown City is larger in economic output
than 60 nations in the world. Our local
economy produces upwards of $14.2 billion a
year in gross regional product. In the last 5
years, our economic output has grown on
average by 3% a year. This exceeds the
growth of the economies of all other Western
Sydney councils.
Our export trade is estimated at $8.5 billion
and has grown by some $757 million over the
last 5 years. Blacktown City plays a vital role in
creating jobs and increasing prosperity by
attracting investors and tourism to the area.

Blacktown City Crime Prevention Plan 2017 27
In 2016, 55% of people aged over 15 years
had completed Year 12 schooling (or
equivalent). There were, however, 33,916
people in low income households living in
Blacktown City. Low income households are
defined as households falling into the bottom
25% of incomes across Australia. We work
with developers to cater for the growing
demand for affordable housing.
Planning for future growth
The Greater Sydney Commission was
established in January 2016 to prepare district
plans. We are working with the Commission,
through the district planning process, to ensure
the district plans will connect local planning
with longer-term regional planning for Greater
Sydney.
Our environment
We are committed to the conservation,
restoration and enhancement of our
environment.
In keeping with ecologically sustainable
development principles, we work to balance
social, economic and environmental values
and imperatives.
We actively work with the local community to
address key environmental challenges
including climate change, waste education and
protecting our natural bushland areas, local
biodiversity and the health of our waterways.
Our approach to crime prevention
Our approach to crime prevention strategy has
been developed in partnership and through
consultation with a broad range of
stakeholders, including:
• our 3 NSW Police Area Commands
• Community Safety Precinct Committees
• Our Community Safety Advisory
Committee.
We have relied on research produced by the
Australian Institute of Criminology, in particular
Research and Public Policy Series Report 120
‘Effective crime prevention interventions for
implementation by local government’. We have
also referenced the NSW Department of
Attorney General and Justice’s Crime
Prevention Division guidelines for developing a
Crime Prevention Strategy as a Safer
Community Compact. This framework is
evidence based and uses best practice
recommended by the NSW Department of
Attorney General and Justice Crime
Prevention Division.
Research by the Australian Institute of
Criminology has established crime occurs
where the opportunity to commit it is high and
the risk of being caught is low. Our Crime
Prevention Plan therefore develops a
situational crime prevention strategy based on
a researched understanding of crime trends.
The Plan proposes a range of situational crime
prevention initiatives involving awareness
raising, advocacy, policy development, service
development and community action.
Our Crime Prevention Plan is one component
of a broader Safe City Strategy addressing the
physical, social and environment well-being of
residents, workers and visitors within
Blacktown City.
Blacktown City Crime Prevention Plan 2017 28
Developing our Crime Prevention Plan
Our Community Safety Advisory Committee
has overseen the development of this Plan
and will be responsible for its ongoing
monitoring and evaluation.
Broad consultation has occurred through:
• focus groups with our 3 NSW Police Area
Commands
• interviews with our staff
• interrogation of our hotlines and reporting
systems
• input from representatives through our
Community Safety Advisory Committee
• community surveys informing the
production of the Blacktown City Social
Profile 2016
• community feedback gathered during our
Mayor’s monthly open community forums.
These consultations confirmed a proportion of
offences go unreported and unrecorded. Crime
data therefore does not reflect the full extent of
crime, as it only reflects offences reported to or
detected by Police.
Community engagement revealed primary
concerns of our residents related to safety
including:
• domestic and family violence
• reported increase in drug and alcohol use
• anti-social behaviour
• graffiti (Social Profile 2016, 16).
Residents reported feeling less safe in their
community due to:
• adequate lighting
• rubbish in streets
• poorly maintained areas (Social Profile
2016, p 16).
Perceptions of safety may be shaped by a
person’s personal experience of crime and by
the number and type of problems reported in
their neighbourhood. Importantly, these
perceptions can also be shaped by individual
characteristics such as age, sex, ethnicity,
education, health and economic status.
The built environment, and the design and
maintenance of neighbourhoods also impact
on perceptions of safety. They are key factors
in improving feelings of safety within
communities (Social Profile 2016, p 53).
In 2015, we surveyed residents on their
perception of being safe walking down their
street. This was the first time this question was
included in a survey of residents and it
provides a baseline for comparison for future
surveys. Nearly half of those surveyed said
they always felt safe walking down their street.
It is possible to compare our findings with
results from a similar question in the ABS 2010
General Social Survey, which specified after
dark. This survey estimated the number of
Blacktown City adults (per 100) who felt very
safe or safe while walking alone in their local
area after dark was lower (46.2) than for
Sydney Statistical Division (47.8), NSW (49.0)
and Australia as a whole (47.0) (Social Profile
2016, p 53).
Our survey reported an equal divide between
those who saw the City as a safe place to live
and those who had concerns about perceived
high crime levels, personal and community
safety (Social Profile, 2016, p 61). Concern
was expressed about antisocial behaviour in
neighbourhoods, shopping centres, parks and
transport interchanges. Some causes were
drinking alcohol, drug-taking, abusive
language and swearing. Concern was also
expressed about personal safety at transport
interchanges, railway stations and walking
after dark. Vandalism and graffiti made some
areas look run-down and led to people feeling
unsafe (Social Profile 2016, p 58-61).
The data analysis contained in the following
Crime Profile demonstrates how perception of
crime does not reflect actual crime rates in the
City. The reality is that crime trends in most
crime categories have reduced or stabilised
over the decade.
Blacktown City Crime Prevention Plan 2017 29
Crime profile
This crime profile has been developed using
data from the NSW Bureau of Crime Statistics
and Research (BOCSAR). This data formed
the basis of consultation with the range of
stakeholders listed above.
For each major crime category, our Crime
Data Analysis sources:
• number of recorded incidents of crime
over the 5 years to March 2017
• a 5-year crime trend graph
• 5-year data on our Local Government
Area ranking
• rate of occurrence of the crime per
100,000 of population in 2016. A
comparison is provided between
Blacktown and the NSW average.
Crime data analysis
Statistical crime data analysis
The following Statistical crime data analysis
uses data sourced from the NSW Bureau of
Crime Statistics and Research (BOCSAR) and
corroborated in discussion with the 3 NSW
Police Area Commands located within
Blacktown City.
Statistical data and crime trends are analysed
for each offence identified by Police Area
Commands as being of operational
significance.
Crime statistics and trends have been sourced
and analysed for the most recent 5-year period
available, to March 2017.
The table on the following pages shows:
• the number of offences over the subject
period
• 5-year crime trend
• our Local Government Area ranking over
the subject period
• rate per 100,000 of population in 2016.
In line with broader NSW trends, most of the
subject offences have been stable or trending
down over the 5-year period, with the
exception of ‘Assault – domestic violence’.
Situational crime prevention
Councils are most effective at implementing
situational crime prevention activities (NSW
Department of Justice, 2014, p 3).
Research by the Australian Institute of
Criminology (2012) supports conclusions
reported by the NSW Department of Justice
(2014, p 3-4) that:
• efficiently and effectively designed,
managed and implemented programs are
more likely to be successful than those
that are not
• programs that have an employed a
program officer to oversee the program
are more likely to be successful than those
that do not
• programs that aimed to reduce theft
crimes such as break enter and steal,
steal from dwelling and steal from a retail
store were most consistently successful
• there was no evidence of community arts
programs having successfully achieved a
reduction in crime. (This particular finding
is not supported by the experience of
Blacktown City, where community art
programs involving electricity boxes
eliminated graffiti at these locations).
• programs targeted at families and parents
have generally been unsuccessful.
• no significant relationships were found
between awareness raising strategies and
changes in levels of crime reporting. (AIC,
2012; NSW Department of Justice, 2014)
The Action Plan contained in this document
combines these conclusions with the
application of the situational crime prevention
tool outlined in the following table.
Blacktown City Crime Prevention Plan 2017 30
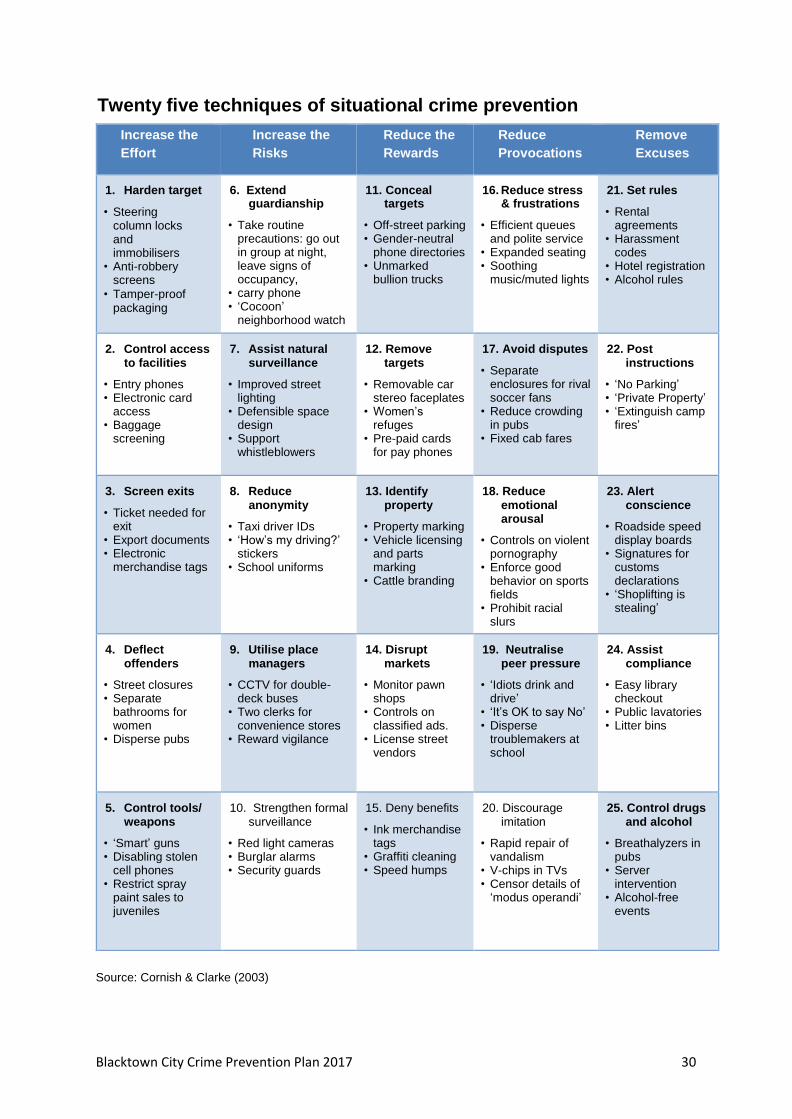
Twenty five techniques of situational crime prevention
Increase the
Effort
Increase the
Risks
Reduce the
Rewards
Reduce
Provocations
Remove
Excuses
1. Harden target
• Steering column locks and immobilisers
• Anti-robbery screens
• Tamper-proof packaging
6. Extend guardianship
• Take routine precautions: go out in group at night, leave signs of occupancy,
• carry phone • ‘Cocoon’
neighborhood watch
11. Conceal targets
• Off-street parking • Gender-neutral
phone directories • Unmarked
bullion trucks
16. Reduce stress & frustrations
• Efficient queues and polite service
• Expanded seating • Soothing
music/muted lights
21. Set rules
• Rental agreements
• Harassment codes
• Hotel registration • Alcohol rules
2. Control access to facilities
• Entry phones • Electronic card
access • Baggage
screening
7. Assist natural surveillance
• Improved street lighting
• Defensible space design
• Support whistleblowers
12. Remove targets
• Removable car stereo faceplates
• Women’s refuges
• Pre-paid cards for pay phones
17. Avoid disputes
• Separate enclosures for rival soccer fans
• Reduce crowding in pubs
• Fixed cab fares
22. Post instructions
• ‘No Parking’ • ‘Private Property’ • ‘Extinguish camp
fires’
3. Screen exits
• Ticket needed for exit
• Export documents • Electronic
merchandise tags
8. Reduce anonymity
• Taxi driver IDs • ‘How’s my driving?’
stickers • School uniforms
13. Identify property
• Property marking • Vehicle licensing
and parts marking
• Cattle branding
18. Reduce emotional arousal
• Controls on violent pornography
• Enforce good behavior on sports fields
• Prohibit racial slurs
23. Alert conscience
• Roadside speed display boards
• Signatures for customs declarations
• ‘Shoplifting is stealing’
4. Deflect offenders
• Street closures • Separate
bathrooms for women
• Disperse pubs
9. Utilise place managers
• CCTV for double-deck buses
• Two clerks for convenience stores
• Reward vigilance
14. Disrupt markets
• Monitor pawn shops
• Controls on classified ads.
• License street vendors
19. Neutralise peer pressure
• ‘Idiots drink and drive’
• ‘It’s OK to say No’ • Disperse
troublemakers at school
24. Assist compliance
• Easy library checkout
• Public lavatories • Litter bins
5. Control tools/ weapons
• ‘Smart’ guns • Disabling stolen
cell phones • Restrict spray
paint sales to juveniles
10. Strengthen formal surveillance
• Red light cameras • Burglar alarms • Security guards
15. Deny benefits
• Ink merchandise tags
• Graffiti cleaning • Speed humps
20. Discourage imitation
• Rapid repair of vandalism
• V-chips in TVs • Censor details of
‘modus operandi’
25. Control drugs and alcohol
• Breathalyzers in pubs
• Server intervention
• Alcohol-free events
Source: Cornish & Clarke (2003)

Blacktown City Crime Prevention Plan 2017 31
Effectiveness of place-based interventions
In light of the community’s feedback, place-
based interventions must take into
consideration community perception of their
personal, social and environmental safety.
The actions identified in the Action Plan (page
9 above) factor the varying effectiveness of
interventions in reducing fear of crime on the
one hand and the reality of crime on the other.
Studies by Lorenc et al and Eck & Guerette on
the effectiveness of specific situational crime
solutions are reflected in the following
diagram.
0
50
10078
56 60
0 0
50
69
94 93 92 89
6759
55
Effectiveness of place-based interventions ...
… in reducing fear of crime (%)
… in reducing actual crime (%)
Source: Lorenc et al (2013); Eck & Guerette (2012)
Blacktown City Crime Prevention Plan 2017 32
Using crime statistics
The NSW Bureau of Crime Statistics and
Research provide cautionary notes on the use
of its crime statistics. (NSW Bureau of Crime
Statistics and Research, 2017)
Recorded crime statistics for some offence
categories do not accurately reflect the actual
level of crime in the community. This is
because the number of incidents recorded
may be affected by extraneous factors which
are not easily measured. In particular:
• public willingness to report crime
• shifts in Policing policy
• high visitor populations compared to
residential populations.
Due to such extraneous factors, in many
instances it is simply impossible to state with
any assurance why a particular crime trend
has appeared or disappeared.
What are crime statistics? NSW Bureau of Crime Statistics and Research
crime data consists of criminal incidents
reported to, or detected by, Police and
recorded on the NSW Police Force's
Computerised Operational Policing System
(COPS). While this system is used for record-
keeping for all Police operations, not just for
criminal matters, NSW Bureau of Crime
Statistics and Research only reports on
criminal incidents.
NSW Bureau of Crime Statistics and Research
crime statistics therefore do not capture crimes
that are not recorded on the NSW Police
Force's Computerised Operational Policing
System.
The Australian Bureau of Statistics conducts
regular crime and victim surveys which attempt
to capture a snapshot of both reported and
unreported crimes.
Calculation of crime trends
In general, NSW Bureau of Crime Statistics
and Research relies upon the Kendall Rank
Order Correlation statistical test (or Kendall's
tau-b) to determine whether a series is
trending upwards, downwards or is stable
(p<.05).
The statistical test is applied to the monthly
data over the specified period. Where a
significant trend is found, the average annual
percentage change over the period is reported.
If any of the 12-monthly totals in the series
have a value of less than 20, a trend test is not
conducted.
Within the Bureau of Crime Statistics and
Research’s Crime Mapping Tool, trend tests
are calculated on monthly rates per 100,000
population (rather than on the number of
incidents/victims/ offenders as is done within
annual and quarterly crime reports). This
allows for adjustment for changes in levels of
residential populations for specific geographic
locations over time.
Blacktown City Crime Prevention Plan 2017 33
Blacktown City
Crime Prevention Plan
2017-2021
Crime data
Blacktown City Crime Prevention Plan 2017 34
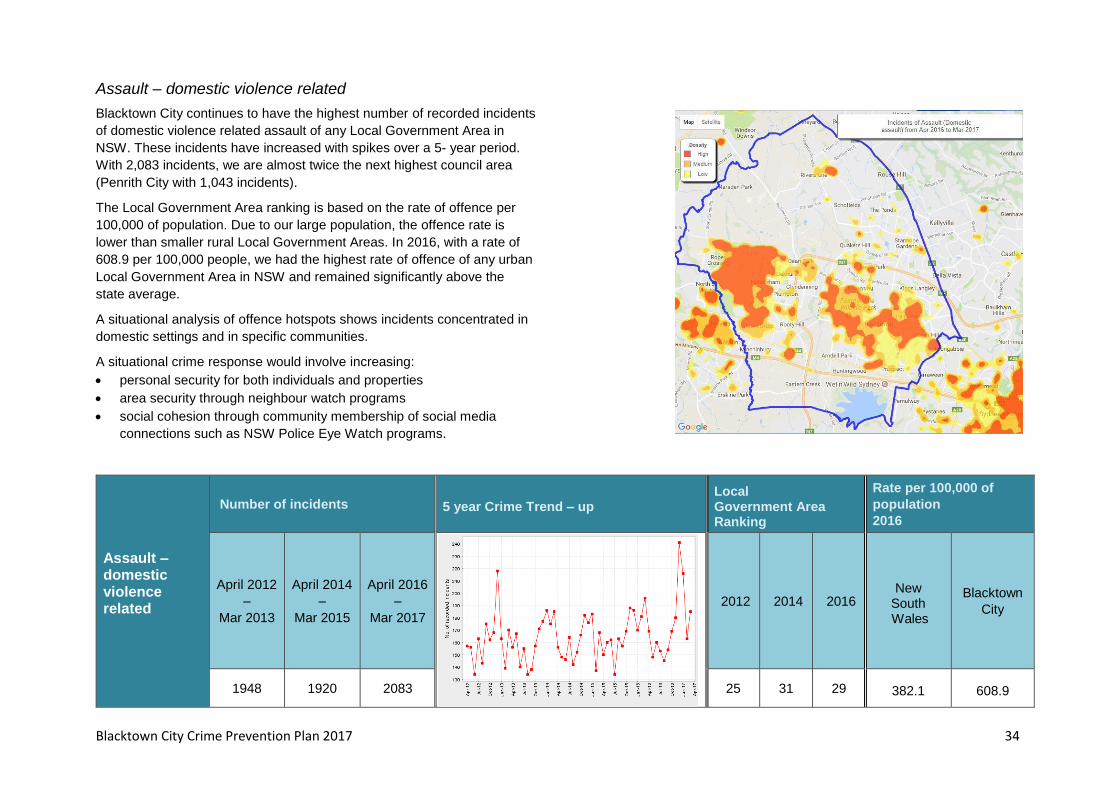
Assault – domestic violence related
Blacktown City continues to have the highest number of recorded incidents
of domestic violence related assault of any Local Government Area in
NSW. These incidents have increased with spikes over a 5- year period.
With 2,083 incidents, we are almost twice the next highest council area
(Penrith City with 1,043 incidents).
The Local Government Area ranking is based on the rate of offence per
100,000 of population. Due to our large population, the offence rate is
lower than smaller rural Local Government Areas. In 2016, with a rate of
608.9 per 100,000 people, we had the highest rate of offence of any urban
Local Government Area in NSW and remained significantly above the
state average.
A situational analysis of offence hotspots shows incidents concentrated in
domestic settings and in specific communities.
A situational crime response would involve increasing:
• personal security for both individuals and properties
• area security through neighbour watch programs
• social cohesion through community membership of social media
connections such as NSW Police Eye Watch programs.
Assault – domestic violence related
Number of incidents 5 year Crime Trend – up Local Government Area Ranking
Rate per 100,000 of
population
2016
April 2012
–
Mar 2013
April 2014
–
Mar 2015
April 2016
–
Mar 2017
2012 2014 2016 New
South Wales
Blacktown
City
1948 1920 2083 25 31 29 382.1 608.9

Blacktown City Crime Prevention Plan 2017 35
Assault – non-domestic violence related
The number of recorded incidents has remained relatively stable over a 5-
year period while the NSW average has dropped. This has resulted in the
Local Government Area ranking worsening. The rate of incidents per
100,000 of population in 2016 remains markedly above the state average.
A situational analysis using hotspot data demonstrates a concentration of
incidents around major shopping centres, transport hubs and licensed
premises.
A situational crime response would involve increasing:
• security for both individuals and properties
• hotspot security through the use of active surveillance systems such
as CCTV
• area security through the application of Crime Prevention Through
Environmental Design principles.
Assault – non-domestic violence related
Number of incidents 5 year Crime Trend – stable Local Government Area Ranking
Rate per 100,000 of
population
2016
April 2012
–
Mar 2013
April 2014
–
Mar 2015
April 2016
–
Mar 2017
2012 2014 2016 New
South Wales
Blacktown
City
1718 1577 1574 55 46 48 415.8 462.7
Blacktown City Crime Prevention Plan 2017 36
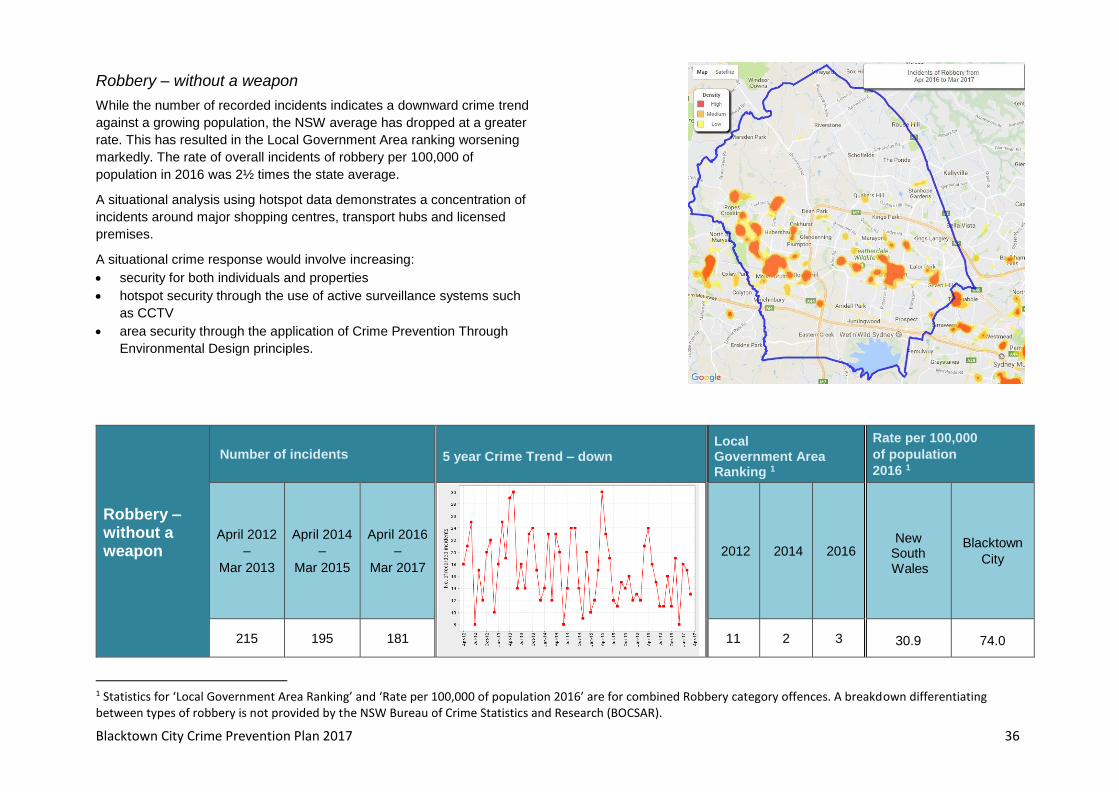
Robbery – without a weapon
While the number of recorded incidents indicates a downward crime trend
against a growing population, the NSW average has dropped at a greater
rate. This has resulted in the Local Government Area ranking worsening
markedly. The rate of overall incidents of robbery per 100,000 of
population in 2016 was 2½ times the state average.
A situational analysis using hotspot data demonstrates a concentration of
incidents around major shopping centres, transport hubs and licensed
premises.
A situational crime response would involve increasing:
• security for both individuals and properties
• hotspot security through the use of active surveillance systems such
as CCTV
• area security through the application of Crime Prevention Through
Environmental Design principles.
Robbery – without a weapon
Number of incidents 5 year Crime Trend – down Local Government Area Ranking 1
Rate per 100,000
of population
2016 1
April 2012
–
Mar 2013
April 2014
–
Mar 2015
April 2016
–
Mar 2017
2012 2014 2016 New
South Wales
Blacktown
City
215 195 181 11 2 3 30.9 74.0
1 Statistics for ‘Local Government Area Ranking’ and ‘Rate per 100,000 of population 2016’ are for combined Robbery category offences. A breakdown differentiating between types of robbery is not provided by the NSW Bureau of Crime Statistics and Research (BOCSAR).
Blacktown City Crime Prevention Plan 2017 37
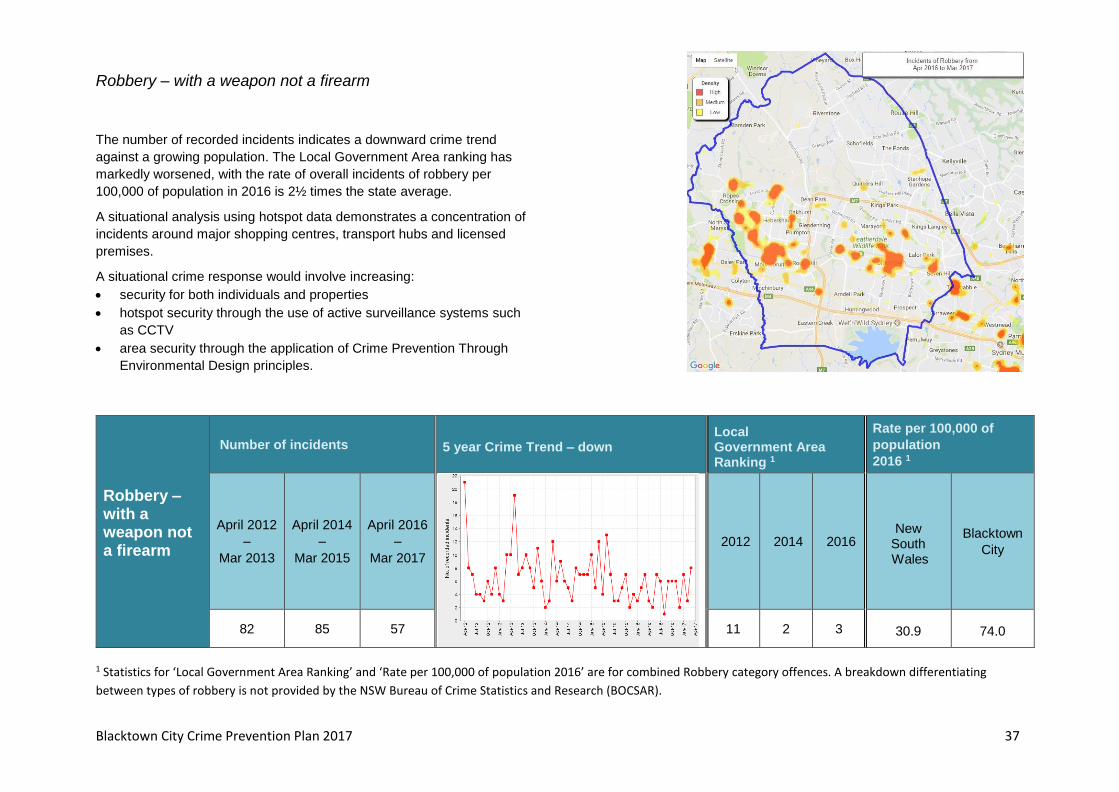
Robbery – with a weapon not a firearm
The number of recorded incidents indicates a downward crime trend
against a growing population. The Local Government Area ranking has
markedly worsened, with the rate of overall incidents of robbery per
100,000 of population in 2016 is 2½ times the state average.
A situational analysis using hotspot data demonstrates a concentration of
incidents around major shopping centres, transport hubs and licensed
premises.
A situational crime response would involve increasing:
• security for both individuals and properties
• hotspot security through the use of active surveillance systems such
as CCTV
• area security through the application of Crime Prevention Through
Environmental Design principles.
Robbery – with a weapon not a firearm
Number of incidents 5 year Crime Trend – down Local Government Area Ranking 1
Rate per 100,000 of
population
2016 1
April 2012
–
Mar 2013
April 2014
–
Mar 2015
April 2016
–
Mar 2017
2012 2014 2016 New
South Wales
Blacktown
City
82 85 57 11 2 3 30.9 74.0
1 Statistics for ‘Local Government Area Ranking’ and ‘Rate per 100,000 of population 2016’ are for combined Robbery category offences. A breakdown differentiating
between types of robbery is not provided by the NSW Bureau of Crime Statistics and Research (BOCSAR).
Blacktown City Crime Prevention Plan 2017 38
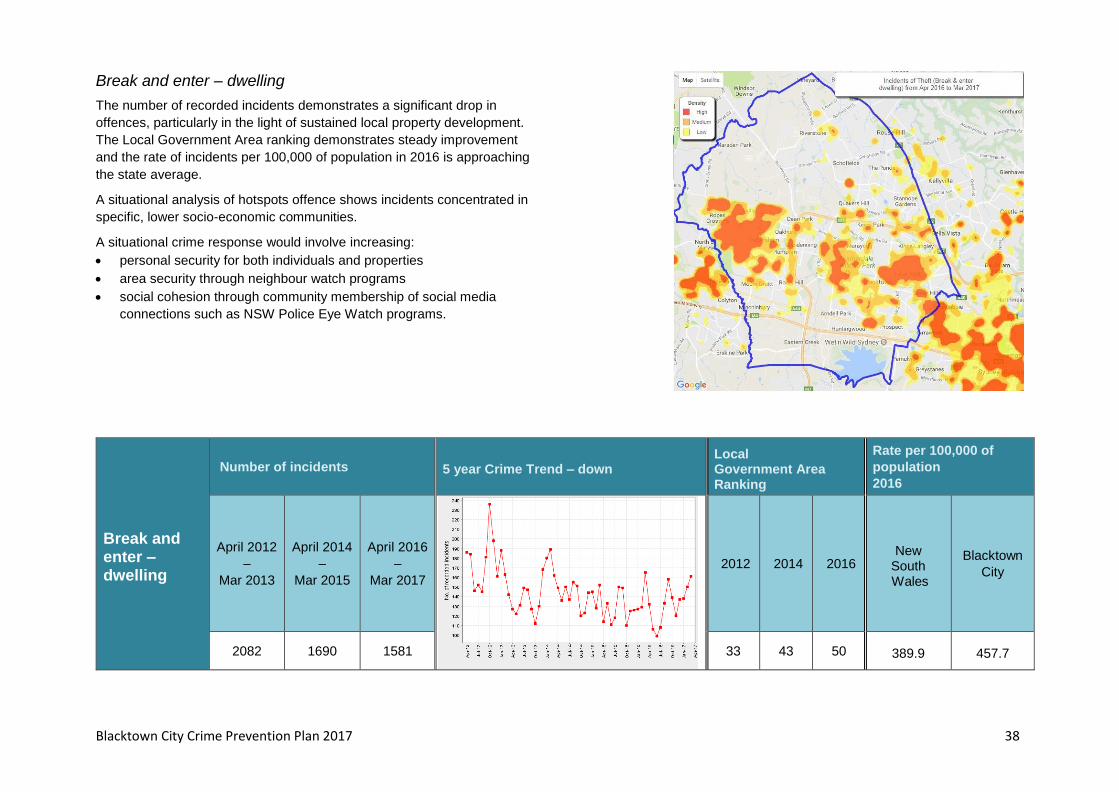
Break and enter – dwelling
The number of recorded incidents demonstrates a significant drop in
offences, particularly in the light of sustained local property development.
The Local Government Area ranking demonstrates steady improvement
and the rate of incidents per 100,000 of population in 2016 is approaching
the state average.
A situational analysis of hotspots offence shows incidents concentrated in
specific, lower socio-economic communities.
A situational crime response would involve increasing:
• personal security for both individuals and properties
• area security through neighbour watch programs
• social cohesion through community membership of social media
connections such as NSW Police Eye Watch programs.
Break and enter – dwelling
Number of incidents 5 year Crime Trend – down Local Government Area Ranking
Rate per 100,000 of
population
2016
April 2012
–
Mar 2013
April 2014
–
Mar 2015
April 2016
–
Mar 2017
2012 2014 2016 New
South Wales
Blacktown
City
2082 1690 1581 33 43 50 389.9 457.7

Blacktown City Crime Prevention Plan 2017 39
Break and enter – non-dwelling
The number of recorded incidents demonstrates a downward trend, with
the rate of incidents per 100,000 of population in 2016 well below the state
average. The Local Government Area ranking has remained stable over
the subject period.
A situational analysis using hotspot data demonstrates a concentration of
incidents around specific commercial/industrial locations.
A situational crime response would involve increasing:
• hotspot security through the use of active surveillance systems such
as CCTV
• area security through the application of Crime Prevention Through
Environmental Design principles.
Break and enter – non-dwelling
Number of incidents 5 year Crime Trend – down Local Government Area Ranking
Rate per 100,000 of
population
2016
April 2012
–
Mar 2013
April 2014
–
Mar 2015
April 2016
–
Mar 2017
2012 2014 2016 New
South Wales
Blacktown
City
400 463 335 111 91 100 153.6 108.4
Blacktown City Crime Prevention Plan 2017 40
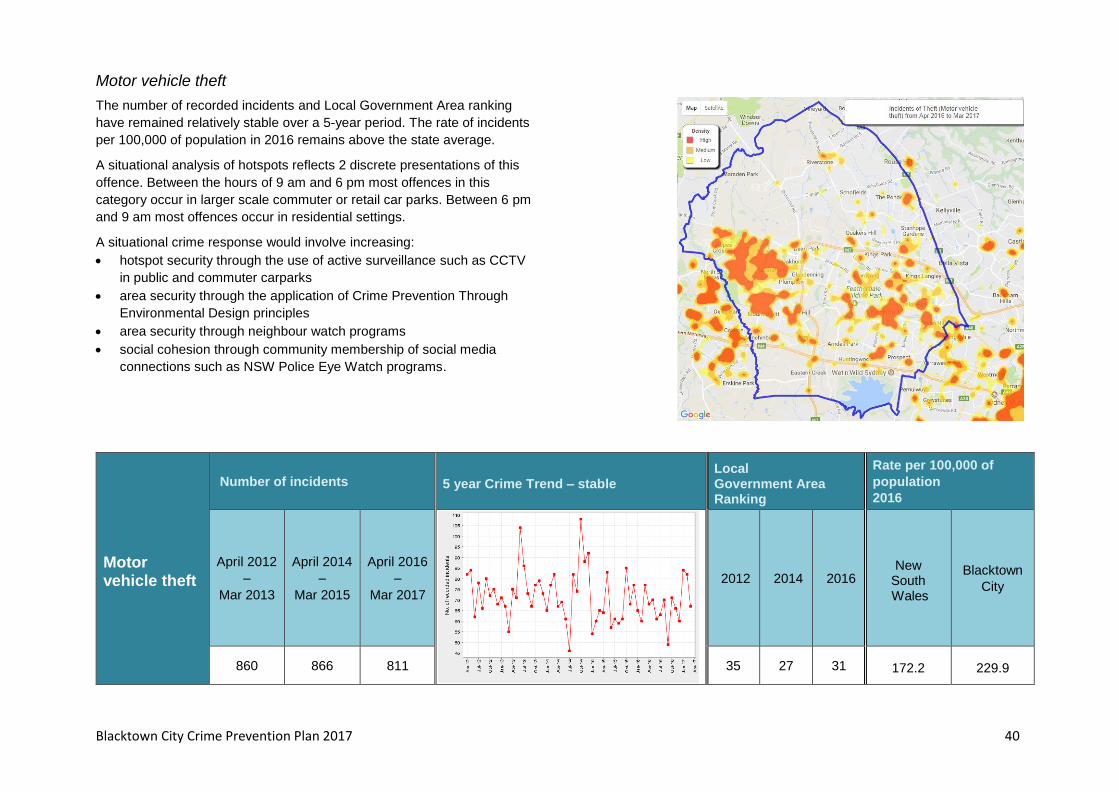
Motor vehicle theft
The number of recorded incidents and Local Government Area ranking
have remained relatively stable over a 5-year period. The rate of incidents
per 100,000 of population in 2016 remains above the state average.
A situational analysis of hotspots reflects 2 discrete presentations of this
offence. Between the hours of 9 am and 6 pm most offences in this
category occur in larger scale commuter or retail car parks. Between 6 pm
and 9 am most offences occur in residential settings.
A situational crime response would involve increasing:
• hotspot security through the use of active surveillance such as CCTV
in public and commuter carparks
• area security through the application of Crime Prevention Through
Environmental Design principles
• area security through neighbour watch programs
• social cohesion through community membership of social media
connections such as NSW Police Eye Watch programs.
Motor vehicle theft
Number of incidents 5 year Crime Trend – stable Local Government Area Ranking
Rate per 100,000 of
population
2016
April 2012
–
Mar 2013
April 2014
–
Mar 2015
April 2016
–
Mar 2017
2012 2014 2016 New
South Wales
Blacktown
City
860 866 811 35 27 31 172.2 229.9
Blacktown City Crime Prevention Plan 2017 41
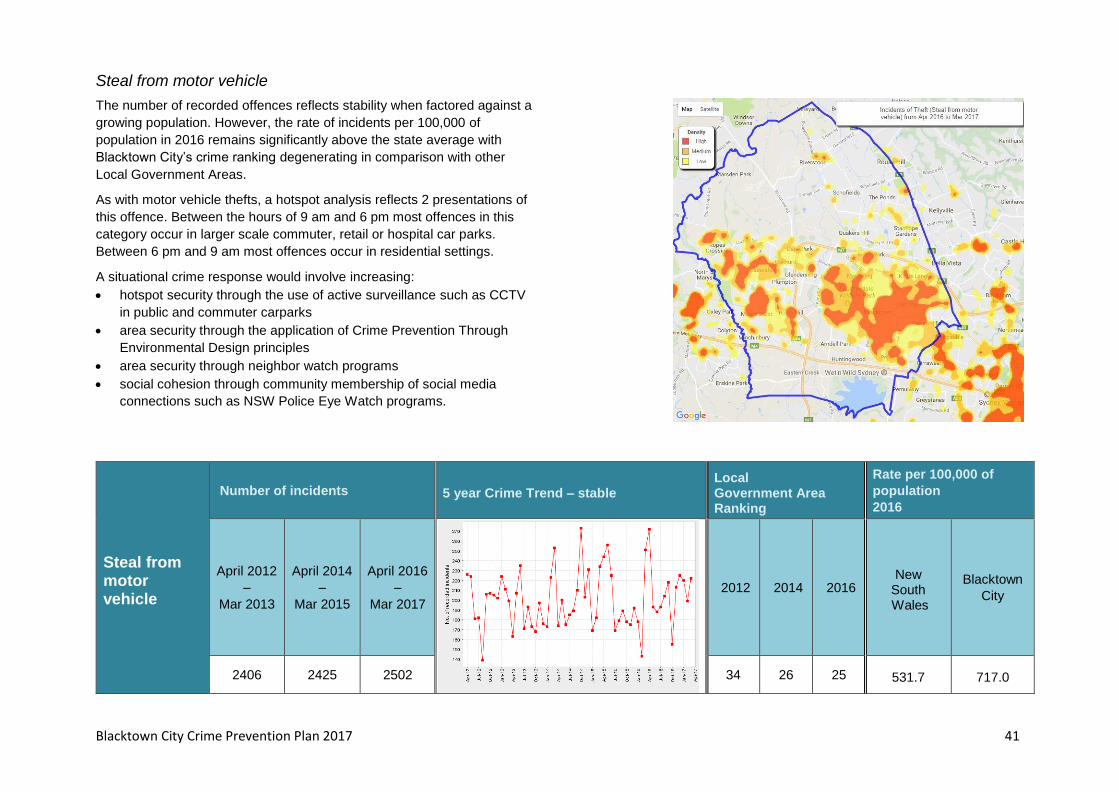
Steal from motor vehicle
The number of recorded offences reflects stability when factored against a
growing population. However, the rate of incidents per 100,000 of
population in 2016 remains significantly above the state average with
Blacktown City’s crime ranking degenerating in comparison with other
Local Government Areas.
As with motor vehicle thefts, a hotspot analysis reflects 2 presentations of
this offence. Between the hours of 9 am and 6 pm most offences in this
category occur in larger scale commuter, retail or hospital car parks.
Between 6 pm and 9 am most offences occur in residential settings.
A situational crime response would involve increasing:
• hotspot security through the use of active surveillance such as CCTV
in public and commuter carparks
• area security through the application of Crime Prevention Through
Environmental Design principles
• area security through neighbor watch programs
• social cohesion through community membership of social media
connections such as NSW Police Eye Watch programs.
Steal from motor vehicle
Number of incidents 5 year Crime Trend – stable Local Government Area Ranking
Rate per 100,000 of
population
2016
April 2012
–
Mar 2013
April 2014
–
Mar 2015
April 2016
–
Mar 2017
2012 2014 2016 New
South Wales
Blacktown
City
2406 2425 2502 34 26 25 531.7 717.0
Blacktown City Crime Prevention Plan 2017 42
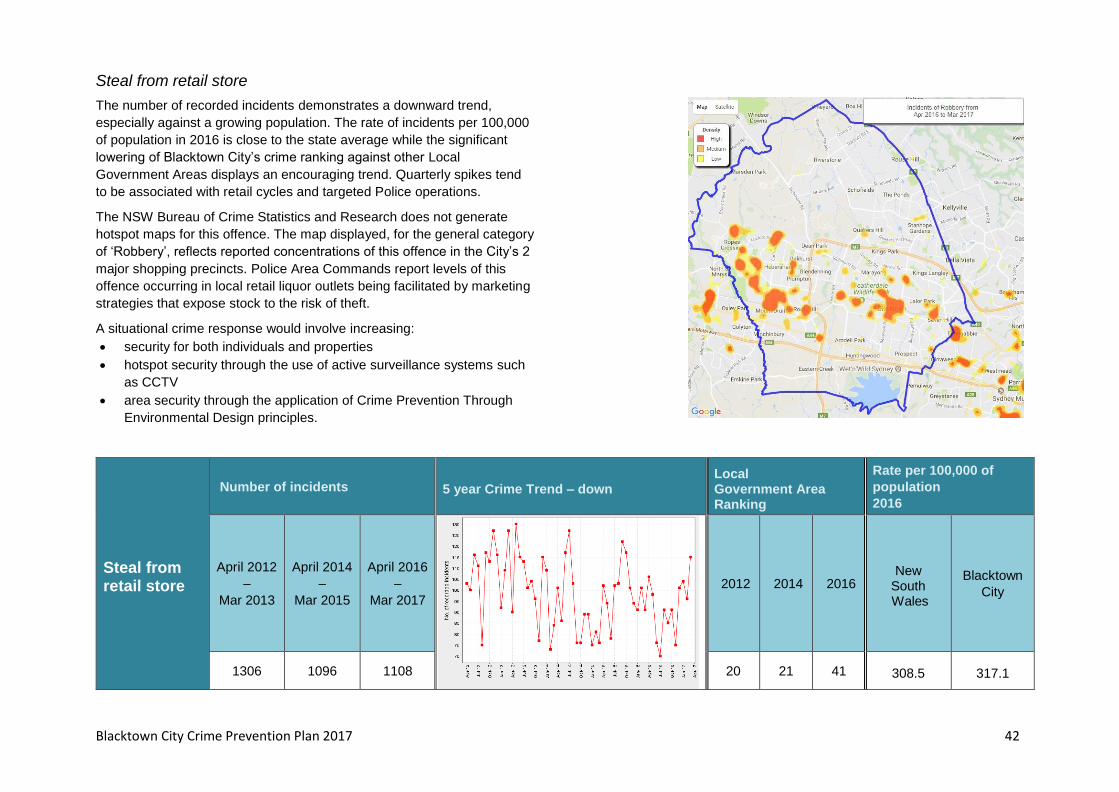
Steal from retail store
The number of recorded incidents demonstrates a downward trend,
especially against a growing population. The rate of incidents per 100,000
of population in 2016 is close to the state average while the significant
lowering of Blacktown City’s crime ranking against other Local
Government Areas displays an encouraging trend. Quarterly spikes tend
to be associated with retail cycles and targeted Police operations.
The NSW Bureau of Crime Statistics and Research does not generate
hotspot maps for this offence. The map displayed, for the general category
of ‘Robbery’, reflects reported concentrations of this offence in the City’s 2
major shopping precincts. Police Area Commands report levels of this
offence occurring in local retail liquor outlets being facilitated by marketing
strategies that expose stock to the risk of theft.
A situational crime response would involve increasing:
• security for both individuals and properties
• hotspot security through the use of active surveillance systems such
as CCTV
• area security through the application of Crime Prevention Through
Environmental Design principles.
Steal from retail store
Number of incidents 5 year Crime Trend – down Local Government Area Ranking
Rate per 100,000 of
population
2016
April 2012
–
Mar 2013
April 2014
–
Mar 2015
April 2016
–
Mar 2017
2012 2014 2016 New
South Wales
Blacktown
City
1306 1096 1108 20 21 41 308.5 317.1
Blacktown City Crime Prevention Plan 2017 43
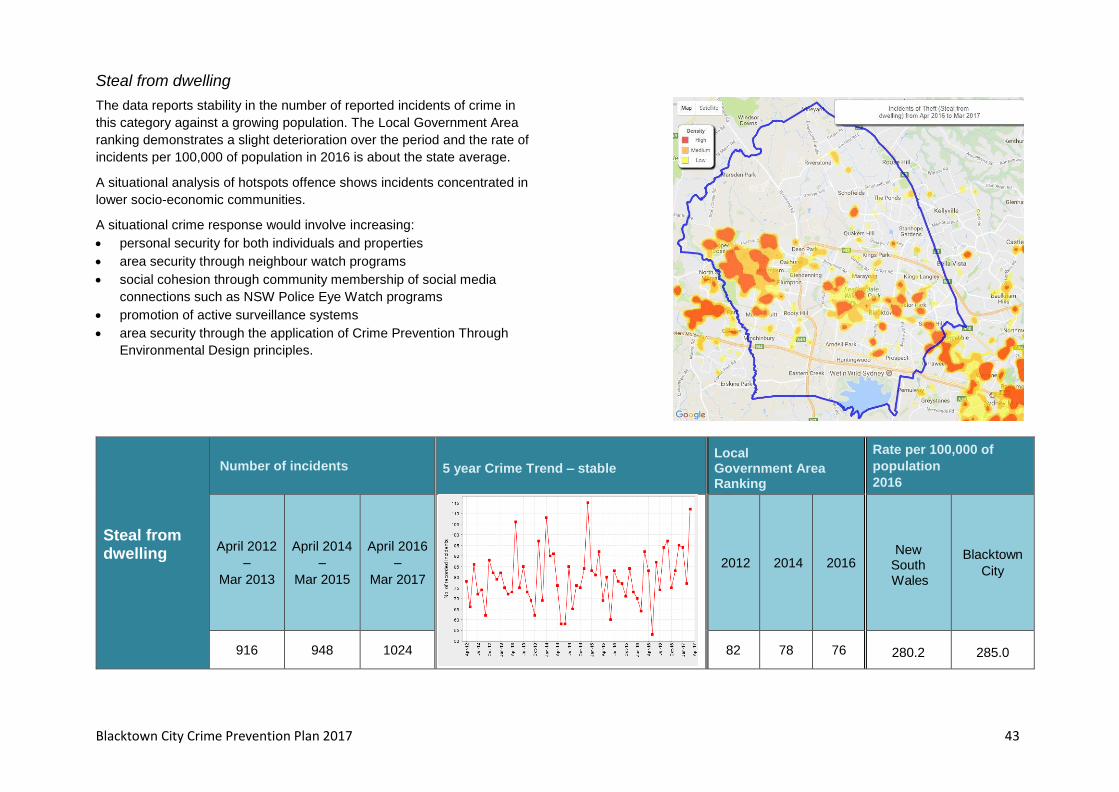
Steal from dwelling
The data reports stability in the number of reported incidents of crime in
this category against a growing population. The Local Government Area
ranking demonstrates a slight deterioration over the period and the rate of
incidents per 100,000 of population in 2016 is about the state average.
A situational analysis of hotspots offence shows incidents concentrated in
lower socio-economic communities.
A situational crime response would involve increasing:
• personal security for both individuals and properties
• area security through neighbour watch programs
• social cohesion through community membership of social media
connections such as NSW Police Eye Watch programs
• promotion of active surveillance systems
• area security through the application of Crime Prevention Through
Environmental Design principles.
Steal from dwelling
Number of incidents 5 year Crime Trend – stable Local Government Area Ranking
Rate per 100,000 of
population
2016
April 2012
–
Mar 2013
April 2014
–
Mar 2015
April 2016
–
Mar 2017
2012 2014 2016 New
South Wales
Blacktown
City
916 948 1024 82 78 76 280.2 285.0
Blacktown City Crime Prevention Plan 2017 44
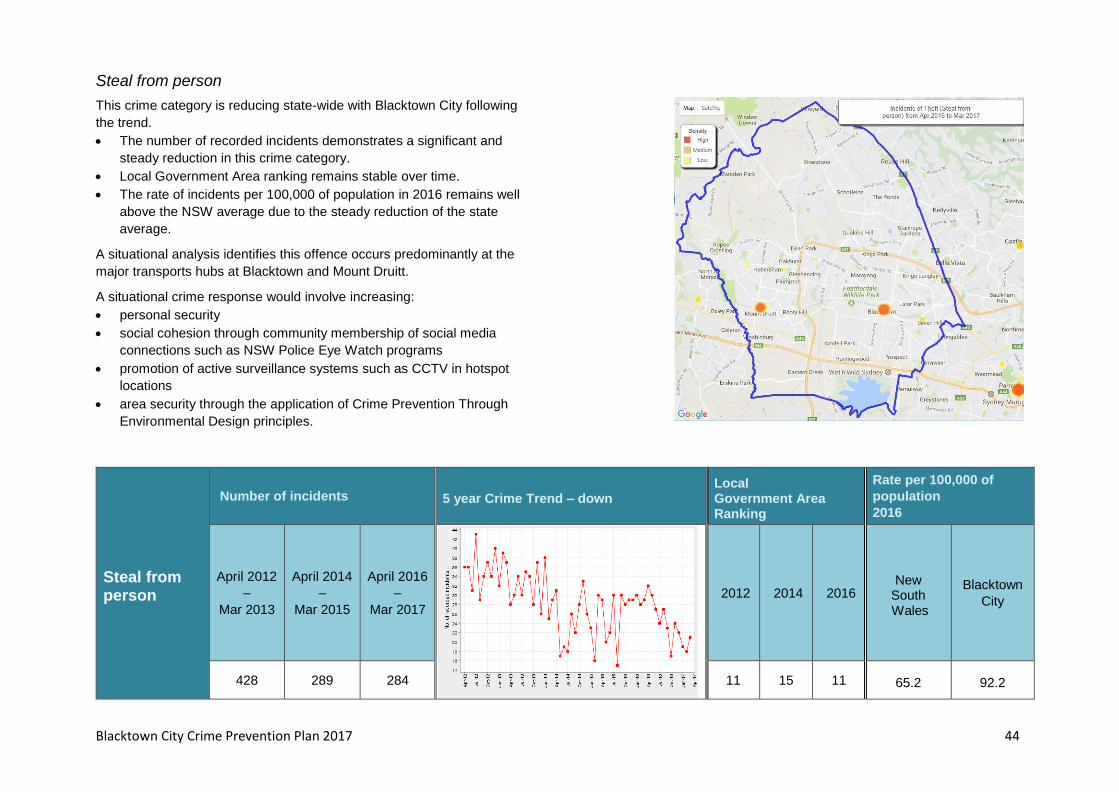
Steal from person
This crime category is reducing state-wide with Blacktown City following
the trend.
• The number of recorded incidents demonstrates a significant and
steady reduction in this crime category.
• Local Government Area ranking remains stable over time.
• The rate of incidents per 100,000 of population in 2016 remains well
above the NSW average due to the steady reduction of the state
average.
A situational analysis identifies this offence occurs predominantly at the
major transports hubs at Blacktown and Mount Druitt.
A situational crime response would involve increasing:
• personal security
• social cohesion through community membership of social media
connections such as NSW Police Eye Watch programs
• promotion of active surveillance systems such as CCTV in hotspot
locations
• area security through the application of Crime Prevention Through
Environmental Design principles.
Steal from person
Number of incidents 5 year Crime Trend – down Local Government Area Ranking
Rate per 100,000 of
population
2016
April 2012
–
Mar 2013
April 2014
–
Mar 2015
April 2016
–
Mar 2017
2012 2014 2016 New
South Wales
Blacktown
City
428 289 284 11 15 11 65.2 92.2
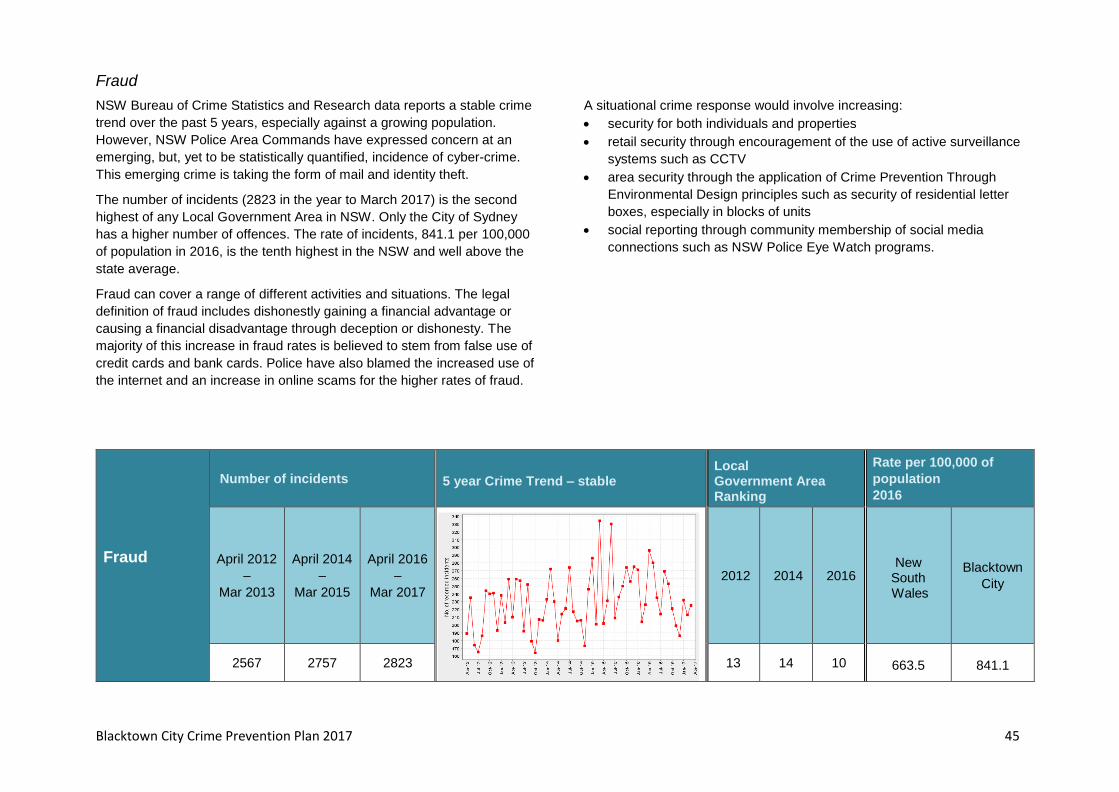
Blacktown City Crime Prevention Plan 2017 45
Fraud
NSW Bureau of Crime Statistics and Research data reports a stable crime
trend over the past 5 years, especially against a growing population.
However, NSW Police Area Commands have expressed concern at an
emerging, but, yet to be statistically quantified, incidence of cyber-crime.
This emerging crime is taking the form of mail and identity theft.
The number of incidents (2823 in the year to March 2017) is the second
highest of any Local Government Area in NSW. Only the City of Sydney
has a higher number of offences. The rate of incidents, 841.1 per 100,000
of population in 2016, is the tenth highest in the NSW and well above the
state average.
Fraud can cover a range of different activities and situations. The legal
definition of fraud includes dishonestly gaining a financial advantage or
causing a financial disadvantage through deception or dishonesty. The
majority of this increase in fraud rates is believed to stem from false use of
credit cards and bank cards. Police have also blamed the increased use of
the internet and an increase in online scams for the higher rates of fraud.
A situational crime response would involve increasing:
• security for both individuals and properties
• retail security through encouragement of the use of active surveillance
systems such as CCTV
• area security through the application of Crime Prevention Through
Environmental Design principles such as security of residential letter
boxes, especially in blocks of units
• social reporting through community membership of social media
connections such as NSW Police Eye Watch programs.
Fraud
Number of incidents 5 year Crime Trend – stable Local Government Area Ranking
Rate per 100,000 of
population
2016
April 2012
–
Mar 2013
April 2014
–
Mar 2015
April 2016
–
Mar 2017
2012 2014 2016 New
South Wales
Blacktown
City
2567 2757 2823 13 14 10 663.5 841.1

Blacktown City Crime Prevention Plan 2017 46
Malicious damage to property
The data indicates an encouraging downward crime trend with a steady
reduction in the number of recorded incidents. The City’s Local
Government Area ranking has improved and the rate of incidents per
100,000 of population in 2016 is approaching the state average.
The hotspot map identifies retail centres and residential areas with low
youth engagement rates as particularly vulnerable to this offence.
A situational crime response would involve increasing:
• security for both individuals and properties
• hotspot security through the use of active surveillance
• social cohesion through community membership of social media
connections such as NSW Police Eye Watch programs
• area security through Neighbourhood Watch programs
• area security through the application of Crime Prevention Through
Environmental Design principles.
Malicious damage to property
Number of incidents 5 year Crime Trend – down Local Government Area Ranking
Rate per 100,000 of
population
2016
April 2012
–
Mar 2013
April 2014
–
Mar 2015
April 2016
–
Mar 2017
2012 2104 2016 New
South Wales
Blacktown
City
4381 3567 3445 48 50 57 824.3 1004.6
Blacktown City Crime Prevention Plan 2017 47
Blacktown City
Crime Prevention Plan
2017-2021
References

Blacktown City Crime Prevention Plan 2017 48
Australian Bureau of Statistics. 2011. Australian and New Zealand standard offence classification. ABS cat. no. 1234.0. Canberra: ABS
Armitage R 2011b. The impact of the design and layout of car parking on crime and antisocial behaviour. University of Huddersfield. http://eprints.hud.ac.uk/13591/1/Briefing_Notes_-_Car_Parking_on_Crime_and_Anti-Social_Behaviour.pdf
Australian Institute of Criminology. 2009. What Australians think about crime and justice:
results from the 2007 Survey of Social Attitudes. AIC Reports Research and Public Policy
Series 101 Canberra: AIC http://www.aic.gov.au/publications/current%20series/rpp/100-
120/rpp101.html
Australian Institute of Criminology. 2010. Community safety in Australian Indigenous
communities: Service providers’ perceptions. AIC Reports Research and Public Policy
Series 110 Canberra: AIC http://www.aic.gov.au/publications/current%20series/rpp/100-
120/rpp110.html
Australian Institute of Criminology. 2012. National Crime Prevention Framework. Canberra:
AIC http://www.aic.gov.au/crime_community/crimeprevention/ncpf.aspx
Australian Institute of Criminology. 2014. Counting the costs of crime in Australia: A 2011
stimate. AIC Reports Research and Public Policy Series 1290 Canberra: AIC
http://www.aic.gov.au/publications/current%20series/rpp/100-120/rpp110.html
Australian Institute of Criminology. 2015a. Effective crime prevention interventions for
implementation by local government. AIC Reports Research and Public Policy Series 120
Canberra: AIC http://www.aic.gov.au/media_library/publications/rpp/120/rpp120.pdf
Australian Institute of Criminology. 2015b. Understanding the local government role in crime
prevention. Trends & issues in crime and criminal justice 505 Canberra: AIC
http://www.aic.gov.au/publications/current%20series/tandi/501-520/tandi505.html
Australian Institute of Criminology 2015c. Sexting among young people: Perceptions and
practices. Trends & issues in crime and criminal justice 508 Canberra: AIC
http://www.aic.gov.au/publications/current%20series/tandi/501-520/tandi508.html
Bankstown City Council. 2014. Community Safety and Crime Prevention Plan 2014-2017. Bankstown: Bankstowb City Council http://webdocs.bankstown.nsw.gov.au/api/publish?documentPath=aHR0cDovL2lzaGFyZS9zaXRlcy9TZXJ2aWNlcy9jcy9DUEQvU2FmZXR5L0NvbW11bml0eSBTYWZldHkgYW5kIENyaW1lIFByZXZlbnRpb24gUGxhbiAyMDE0IC0gMjAxNy9CYW5rc3Rvd24gQ29tbXVuaXR5IFNhZmV0eSBhbmQgQ3JpbWUgUHJldmVudGlvbiBQbGFuIDIwMTQgMjAxNyBGSU5BTC5wZGY=&title=Bankstown%20Community%20Safety%20and%20Crime%20Prevention%20Plan%202014%202017%20FINAL.pdf
Blacktown City Council. 2012. Blacktown City Social Plan 2012. Blacktown: Blacktown City Council.
Blacktown City Crime Prevention Plan 2017 49
Blacktown City Council. 2014. Crime Prevention Plan 2014-2017. Blacktown: Blacktown City Council.
Blacktown City Council. 2016. Blacktown City Social Profile 2016. Blacktown: Blacktown City Council. https://www.blacktown.nsw.gov.au/About-Council/Our-city/City-profile#Blacktown-City-Social-Profile-2016-3
Blacktown City Council. 2017a. Application for Pan Pacific Safe City accreditation. Blacktown: Blacktown City
Blacktown City Council. 2017b. Our Blacktown 2036: Our vision, our plan. Draft Community Strategic Plan. Blacktown: Blacktown City
City Of Canterbury Bankstown. 2016. Community Safety And Crime Prevention Plan 2016-2019. http://webdocs.bankstown.nsw.gov.au/api/publish?documentPath=aHR0cDovL2lzaGFyZS9zaXRlcy9TZXJ2aWNlcy9jcy9DUEQvU2FmZXR5L0NvbW11bml0eSBTYWZldHkgYW5kIENyaW1lIFByZXZlbnRpb24gUGxhbiAyMDE0IC0gMjAxNy9DYW50ZXJidXJ5IENvbW11bml0eSBTYWZldHkgYW5kIENyaW1lIFByZXZlbnRpb24gUGxhbiAyMDE2IC0gMjAxOS5wZGY=&title=Canterbury%20Community%20Safety%20and%20Crime%20Prevention%20Plan%202016%20-%202019.pdf
City of Melville 2017. Safer Melville Plan. http://www.melvillecity.com.au/newproxy/service/api/node/workspace/SpacesStore/3cc98742-4d3f-411b-899a-d422518e2e93/2017-2021-safer-melville-plan/content/2017-2021-safer-melville-plan?alf_ticket=TICKET_6f4d007e1f6dfb7135890238ad8fe4d8c057972d
City of Ryde. 2011. Crime Prevention Plan 2011-2014. http://www.ryde.nsw.gov.au/files/assets/public/publications/city-of-ryde-crime-prevention-plan.pdf
Clarke RV. 2002a. Shoplifting. Guide no. 11. Centre for Problem Oriented Policing. http://www.popcenter.org/problems/shoplifting/
Cornish DB & Clarke RV. 2003. Opportunities, precipitators and criminal decisions: A reply to Wortley’s critique of situational crime prevention, in Smith MJ & Cornish DB (eds), Theory for practice in situational crime prevention. Crime Prevention Studies no. 16. Monsey, NY: Criminal Justice Press: 41–96
Department of Transport. 2003. Graffiti and vandalism on and around public transport: Briefing paper. http://tna.europarchive.org/20100413151441/crimereduction.homeoffice.gov.uk/antisocialbehaviour/antisocialbehaviour23.htm
Fairfield City Council. 2013. Community Safety and Crime Prevention Plan 2013 - 2017. http://www.fairfieldcity.nsw.gov.au/download/downloads/id/821/community_safety_and_crime_prevention_plan_2013-2017.pdf
Grabosky P 1995. Burglary prevention. Trends & Issues in Crime and Criminal Justice no. 49. Canberra: Australian Institute of Criminology. (pdf 78.5kb)
Blacktown City Crime Prevention Plan 2017 50
Greater Sydney Commission. 2016. Draft West Central District Plan: Co-creating a Greater Sydney. https://gsc-public-1.s3.amazonaws.com/s3fs-public/dp_west_central_access_amends_2016_12_21.pdf?mfBNIh_hFdDan.pTC8xLBzYuhM6CQ9Qy
Johnson S, Bowers K, Gamman L, Mamerow L & Warne A. 2010. Theft of customer’s personal property in cafes and bars. Washington: US Department of Justice, Office of Community Oriented Policing Services. http://www.cops.usdoj.gov/files/RIC/Publications/e041027270-pop-theftpersprop_fin.pdf
Kishor, Sunita. 2005 The heavy burden of a silent scourge: domestic violence, Pan Am J
Public Health 17(2), 2005, p 77-78
Liverpool City Council. 2013. Community Safety and Crime Prevention Strategy 2013-2017. http://www.liverpool.nsw.gov.au/trim/documents?RecordNumber=242375.2013
Lorenc T., Petticrew M., Whitehead M., Neary D., Clayton S., Wright K., Thomson H.,
Cummins S., Sowden A., Renton A. 2013. Fear of crime and the environment: systematic
review of UK qualitative evidence. BMC Public Health. 13:496. doi: 10.1186/1471-2458-13-
496.
Morgan A & Louis E. 2009. Key issues in graffiti. Research in Practice no. 6. http://aic.gov.au/publications/current%20series/rip/1-10/06.html
National Audit Office. 2007. Theft from motor vehicles—identifying potential offenders: A good practice guide. London: NAO. http://www.popcenter.org/problems/parking_garage_theft/PDFs/NAO_identify.pdf
NSW Bureau of Crime Statistics and Research. 2012. NSW recorded crime statistics 2007—2011. Sydney: BOCSAR. http://www.bocsar.nsw.gov.au/lawlink/bocsar/ll_bocsar.nsf/vwFiles/NewSouthWales.xls/$file/NewSouthWales.xls
NSW Bureau of Crime Statistics and Research (NSW). 2017a. Crime Statistics. Sydney: BOCSAR. http://www.bocsar.nsw.gov.au/Pages/bocsar_crime_stats/bocsar_crime_stats.aspx
NSW Bureau of Crime Statistics and Research (NSW). 2017b. An introduction to using crime
statistics, Sydney: BOCSAR
http://www.bocsar.nsw.gov.au/Pages/bocsar_crime_stats/bocsar_explanatorynotes.aspx
NSW Department of Justice. 2014. Guidelines for developing a crime prevention strategy. Sydney: NSW Government. https://www.google.com.au/url?sa=t&rct=j&q=&esrc=s&source=web&cd=1&cad=rja&uact=8&ved=0ahUKEwj6o5eo3JbWAhUMTbwKHYHwCDwQFggoMAA&url=http%3A%2F%2Fwww.crimeprevention.nsw.gov.au%2FDocuments%2Fguidelines_for_developing_a_crime_prevention_stategy_nov2014.pdf&usg=AFQjCNEcEAZ1wsWJPqi811iKhmJqHXfdlA
Parramatta City Council. 2008. City Centre Crime Prevention Plan 2008-2013. Parramatta: Parramatta City Council.

Blacktown City Crime Prevention Plan 2017 51
Parramatta City Council. 2014. Parramatta Safety Plan 2014-2018. Parramatta: Parramatta City Council. http://old.parracity.nsw.gov.au/__data/assets/pdf_file/0007/103579/ParramttaSafetyPlan2014-2018.pdf
Varshney A & Fitzgerald J. 2008. The problem of steal from motor vehicle in New South Wales. Sydney: NSW Bureau of Crime Statistics and Research
Welsh, B., Farrington .D.P. 2012. The Oxford Handbook of Crime Prevention. New York,
New York: Oxford University Press.